Article

Experimental and Numerical Evaluation of Fish-School Protection Configurations for a Semi-Submersible Truss Aquaculture Platform Under Severe Regular Waves

1
School of Energy Science and Engineering, University of Science and Technology of China, Hefei 230026, China
2
Guangzhou Institute of Energy Conversion, Chinese Academy of Sciences, Guangzhou 510630, China
*
Author to whom correspondence should be addressed.
J. Mar. Sci. Eng. 2026, 14(18), 1684; https://doi.org/10.3390/jmse14181684
Submission received: 13 August 2026 / Revised: 31 August 2026 / Accepted: 1 September 2026 / Published: 10 September 2026
(This article belongs to the Special Issue Infrastructure for Offshore Aquaculture Farms)

Abstract

Fish–net contact is a practical concern for exposed offshore aquaculture platforms during severe waves, yet it is seldom assessed together with platform hydrodynamics and mooring response. This study compares two protection strategies for a semi-submersible truss aquaculture platform: add-on flow-guiding structures fitted with hoods and side baffles, and a deepened-netting configuration. Tests on a 1:50 physical model under severe regular waves measured fish-school-boundary displacement, platform surge, heave and pitch, and mooring-line tension. The maximum horizontal displacement of the upwave school boundary served as an engineering proxy for the school’s tendency to approach the netting. Frequency-domain ANSYS-AQWA calculations were also used to compare wave excitation, added mass, and radiation damping. The flow-guiding structures generally reduced school-boundary displacement, but they often increased surge and mooring demand, revealing a trade-off between reduced school-boundary approach and station keeping. Under the tested conditions, the deepened-netting configuration reduced school-boundary displacement, platform motion, and mooring tension. Its fish-school response cannot, however, be attributed to netting depth alone because culture volume increased while stocking density decreased. These results provide a joint assessment of fish-school response, platform motion, and mooring load for the proposed configurations. The findings are limited to the tested severe regular waves and require validation under irregular waves, combined waves and currents, and full-scale conditions.

1. Introduction

Coastal space is increasingly constrained, environmental requirements are tightening, and demand for aquatic products continues to rise. Marine aquaculture is consequently moving from sheltered nearshore waters into more exposed offshore settings. Offshore farms can offer larger culture volumes, stronger water exchange, higher environmental carrying capacity, and less competition with coastal activities [1,2,3,4]. Exposure to energetic waves and currents, however, places greater demands on structural integrity, station keeping, farm operations, and fish welfare [5,6]. In typhoon-prone waters, severe loads can affect platform motion and mooring forces as well as the hydrodynamic conditions inside the culture space. These changes may restrict swimming space and increase interaction with cage structures. When a school moves persistently toward the upwave netting, the remaining clearance decreases, and potential fish–net contact becomes more likely.
Hydrodynamic studies of offshore aquaculture systems have traditionally focused on the coupled responses of floating structures, netting, and mooring systems. Fredriksson et al. [7] combined physical experiments, numerical simulations, and field measurements to characterize the dynamics of an open-ocean fish-cage system, while Pang et al. [8] investigated the wave response of a semi-submersible vessel-shaped truss aquaculture platform. For netting systems, Lader and Fredheim [9] developed a numerical model for flexible net sheets subjected to waves and currents, and Kristiansen and Faltinsen [10] demonstrated the importance of net drag, deformation, and flow attenuation in determining global cage loads. Mooring-related studies have further examined cage dynamics under combined wave–current loading and the redistribution of system response after mooring-line failure [11,12]. For semi-submersible systems containing both large floating bodies and slender structural members, potential-flow or boundary-element methods are commonly combined with the Morison equation to represent wave diffraction, radiation, inertia, and viscous drag effects [13,14,15]. These studies have established an important basis for predicting platform motions, net loads, and mooring demand, but their primary emphasis has generally been on structural and station-keeping performance.
Recent work has improved predictions of the global hydrodynamic response of semi-submersible aquaculture platforms. Numerical studies have examined how wave period, platform draught, and mooring properties affect motion and mooring loads [16,17]. Physical model tests have quantified the effects of waves, currents, netting, and draught on vessel-shaped semi-submersible cages [18]. Other experimental and numerical studies show that draught, wave conditions, and net solidity can strongly influence heave, pitch, and the overall dynamic response [19], while separate investigations have considered internal flow attenuation and net-induced drag [20]. This work has strengthened analysis of the platform–net–mooring system, but the response of cultured fish is rarely included when structural modifications are assessed.
The biological responses of cultured fish under exposed conditions have received comparatively less attention in engineering studies. Fish distribution and swimming behavior within cages can be influenced by current velocity, wave-induced water motion, turbulence, temperature, dissolved oxygen, light, cage deformation, and available swimming space. Hvas et al. [21] reviewed the effects of strong currents and wave exposure on swimming capacity, behavior, and welfare in offshore salmon aquaculture and emphasized the importance of maintaining swimming control under energetic environmental conditions. Field observations by Johannesen et al. [22] showed that waves and currents can alter the spatial distribution of salmon and reduce the effectively available cage space. Szewczyk et al. [23] further demonstrated that wave exposure can interact with environmental and management stressors and thereby influence fish-welfare risk. More recent laboratory studies have examined fish responses to wave-related hydrodynamic disturbances. Athammer et al. [24] used fluctuating currents to reproduce wave-like exposure and evaluate the swimming tolerance of Atlantic salmon, while Barbier et al. [25] investigated behavioral, growth, welfare, and stress responses under chronic wave-induced turbulence. These findings indicate that structural safety alone is insufficient for evaluating exposed aquaculture systems and that the response of cultured fish to the surrounding hydrodynamic environment should also be considered.
Structural modification of the cage environment offers a potential means of reducing adverse hydrodynamic exposures. Shielding devices, flow-guiding components, alternative netting arrangements, and modified cage geometries have therefore received increasing attention. Liu et al. [26] demonstrated that a shielding device can create a locally sheltered region with reduced flow velocity inside an aquaculture cage. Hu et al. [27] showed that cage layout and netting characteristics can substantially modify internal and external flow fields. Wang et al. [28] evaluated a floating cage with hybrid side and bottom nets and demonstrated that net-system design affects cage deformation and hydrodynamic loading, while Ding et al. [29] showed that platform geometry alters the motions and hydrodynamic loads of a semi-submersible aquaculture platform. These studies demonstrate that structural design can be used to regulate the hydrodynamic environment experienced by cultured fish.
Efforts have also begun to relate such hydrodynamic modifications more directly to biological requirements. Liu et al. [30], for example, combined fish swimming–performance measurements with CFD-predicted flow fields to quantify suitable low-velocity regions created by a shielding device. Their results demonstrated that the effectiveness of a flow-control structure can be evaluated not only from the perspective of flow attenuation but also in relation to the swimming capability of cultured fish. At the same time, increasingly detailed numerical methods have been developed to describe porous-net effects, nonlinear interactions, turbulence, and coupled wave–structure–mooring responses in aquaculture systems [31]. These developments provide an important basis for designing protection-oriented structures; however, most such studies have focused on either the local hydrodynamic environment or the global structural response rather than directly assessing the corresponding response of a fish school together with the resulting platform and mooring loads.
Hydrodynamic protection and biological response are still usually assessed separately. Research on semi-submersible platforms has emphasized motion, net effects, structural loads, and mooring response [8,16,17,18,19,20,32]. Studies of shielding and flow control have focused mainly on flow attenuation, drag, cage deformation, or suitable low-velocity regions [26,27,30]. Fish-oriented work, meanwhile, has examined swimming capacity, spatial distribution, behavior, and welfare under waves, currents, and turbulence [21,22,23,24,25]. As a result, it remains unclear whether a structural change that keeps fish farther from the netting also improves overall hydrodynamic and station-keeping performance. The distinction matters because an added shield or guide may improve local conditions while increasing wave-facing area, platform motion, and mooring demand.
This study compares two protection strategies for a semi-submersible truss aquaculture platform. The first uses add-on flow-guiding structures with several hood and side-baffle combinations, while the second increases the netting depth and available cage space. Physical model tests under severe regular waves measured the horizontal displacement of the upwave fish-school boundary together with platform surge, heave, pitch, and mooring-line tension. The maximum boundary displacement was treated as an engineering indicator of the main school’s tendency to approach the upwave netting. Frequency-domain ANSYS-AQWA calculations of first-order wave excitation, added mass, and radiation damping were used to interpret differences in global hydrodynamic response. By evaluating fish-school movement, platform motion, and mooring demand together, the comparison reveals both the reduction in school-boundary approach and the associated engineering cost of each strategy.

2. Materials and Methods

2.1. Physical Model and Wave Flume

Physical model tests of the semi-submersible truss aquaculture platform were carried out in the wave flume of the Guangzhou Institute of Energy Conversion, Chinese Academy of Sciences. Idealized severe regular waves were used to compare platform motions, mooring loads, and passive fish-school displacements among the protection configurations.
The flume is 50 m long and 1.2 m wide, with a test water depth of 0.85 m. A piston-type wavemaker at one end generates regular waves, and an absorbing beach at the other end reduces reflections in the test section. The experiment followed Froude similarity [13,14] at a geometric scale of 1:50. The model was 1.788 m long, 0.640 m wide, and 0.360 m deep, with a test draft of 0.220 m. Its main structure was welded from 1 mm stainless-steel plate and incorporated internal spaces for ballast and inertia adjustment to reproduce the required mass distribution and draft.
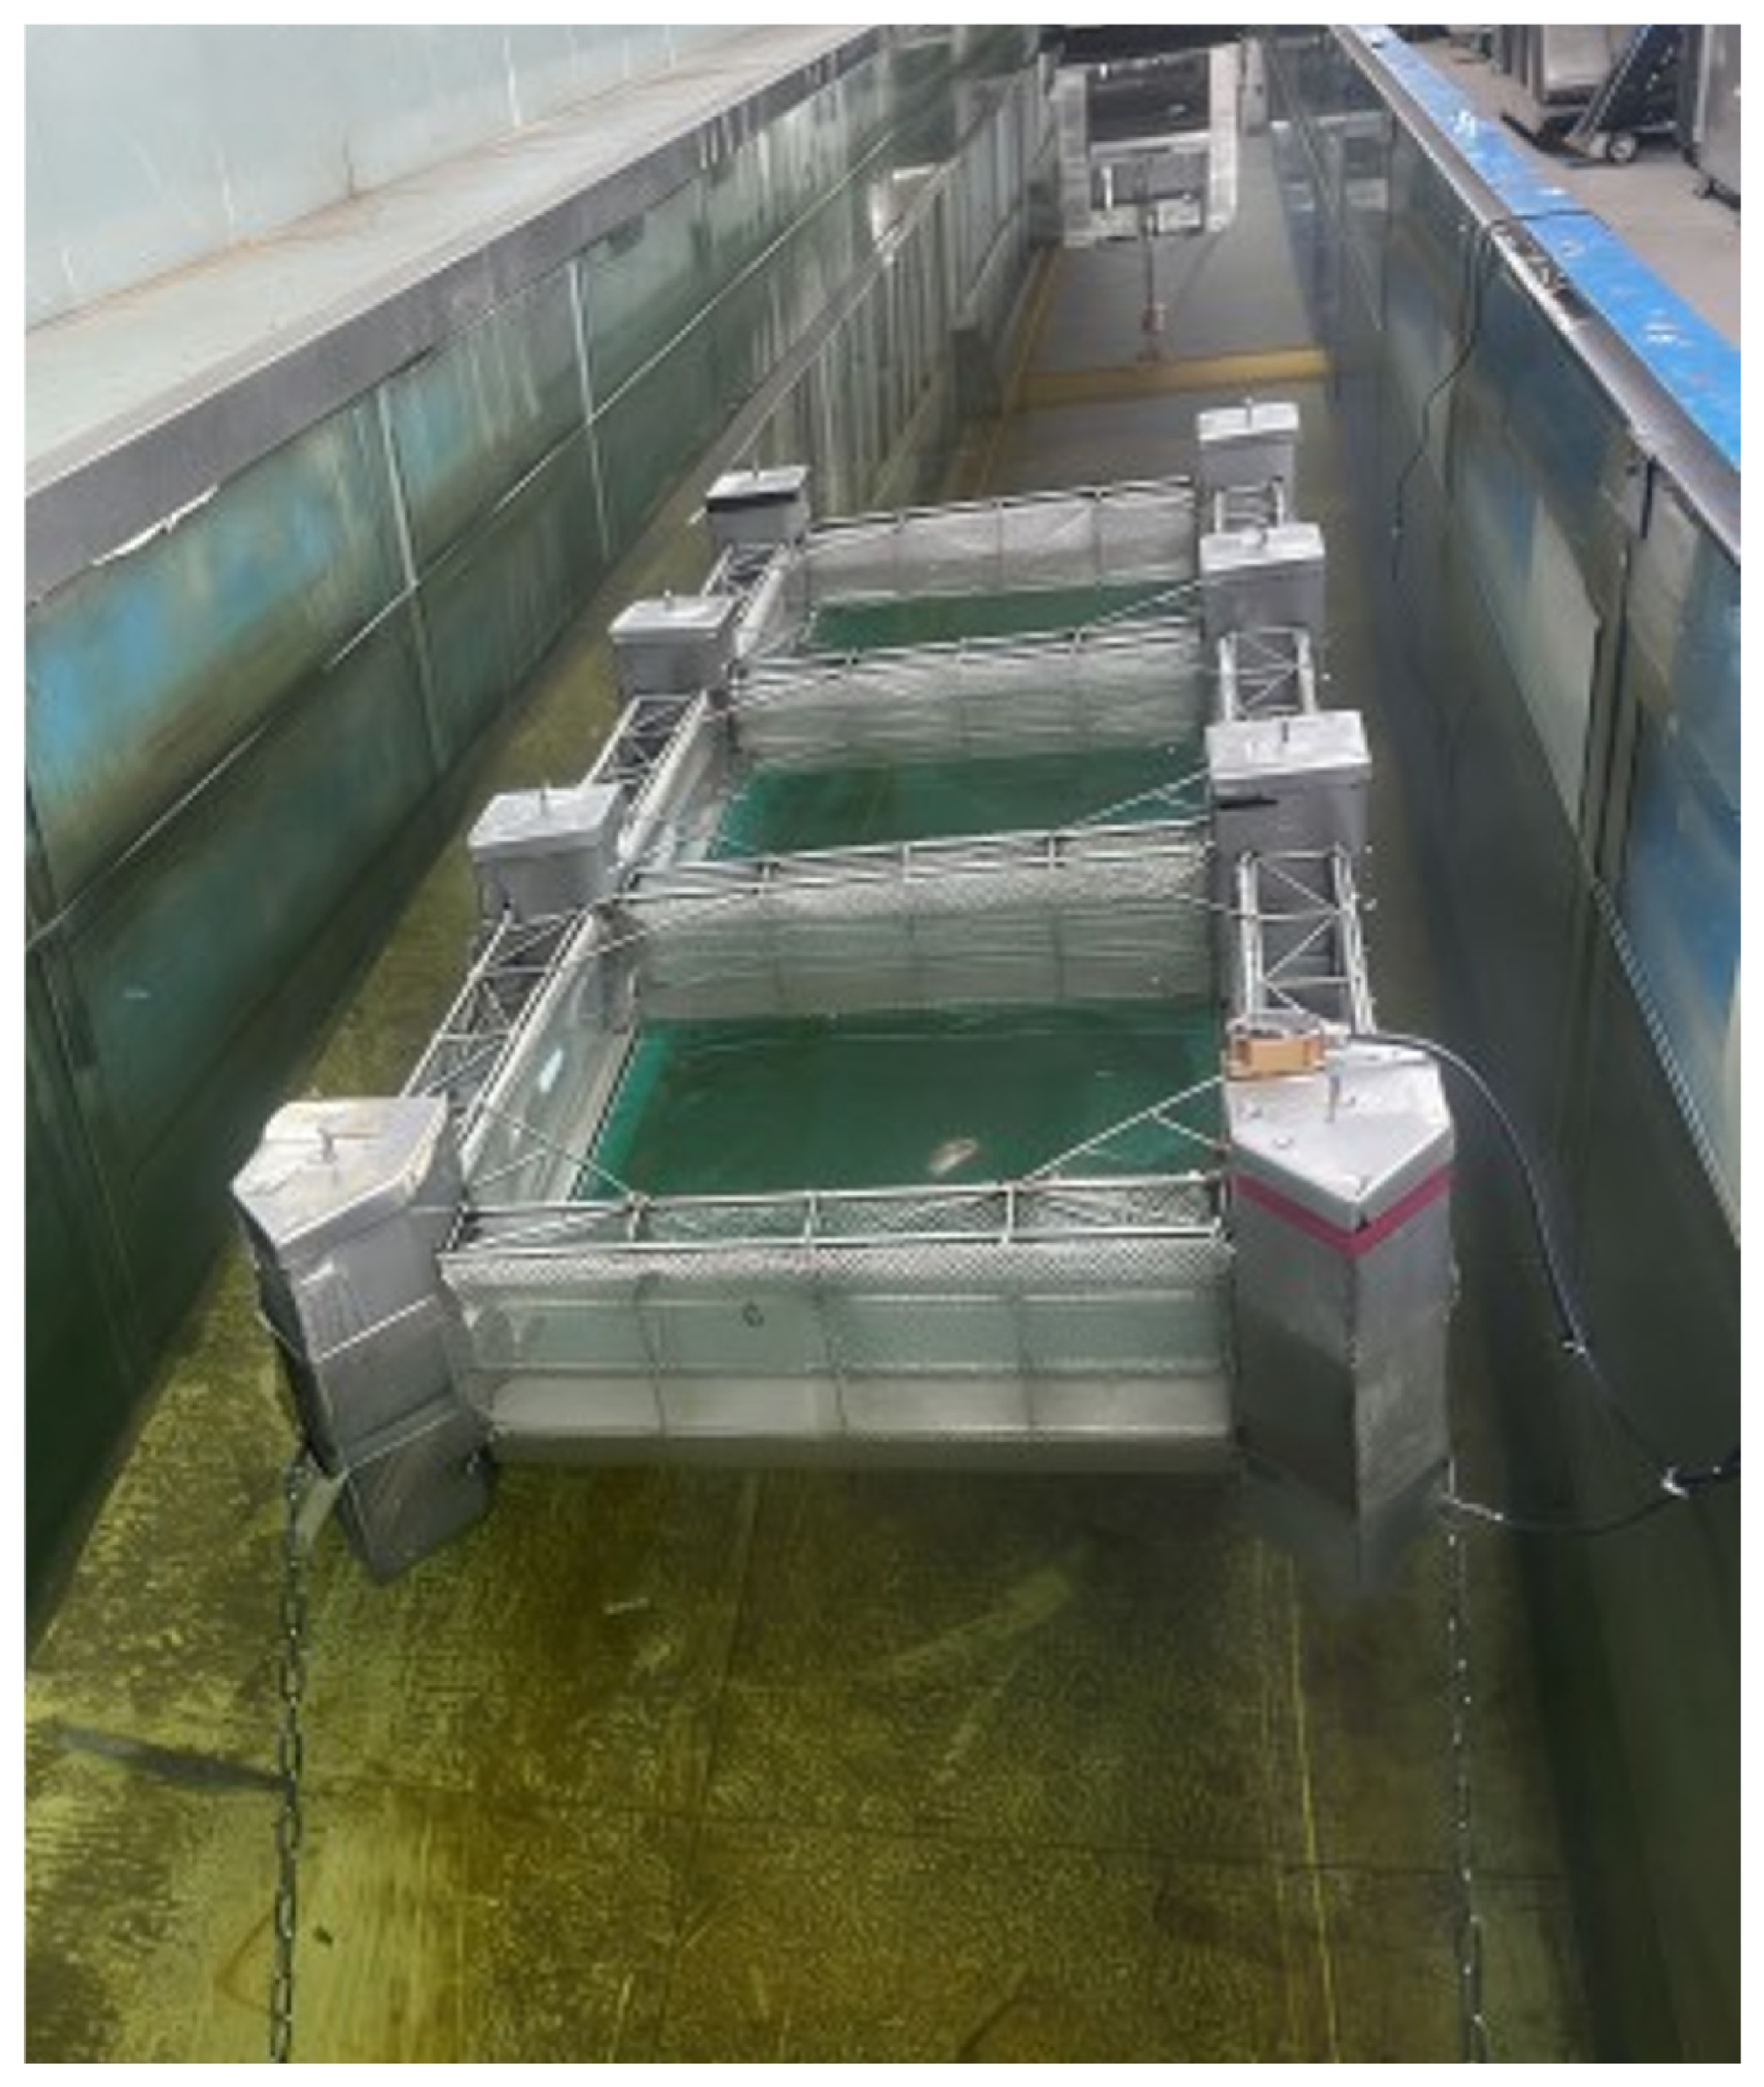
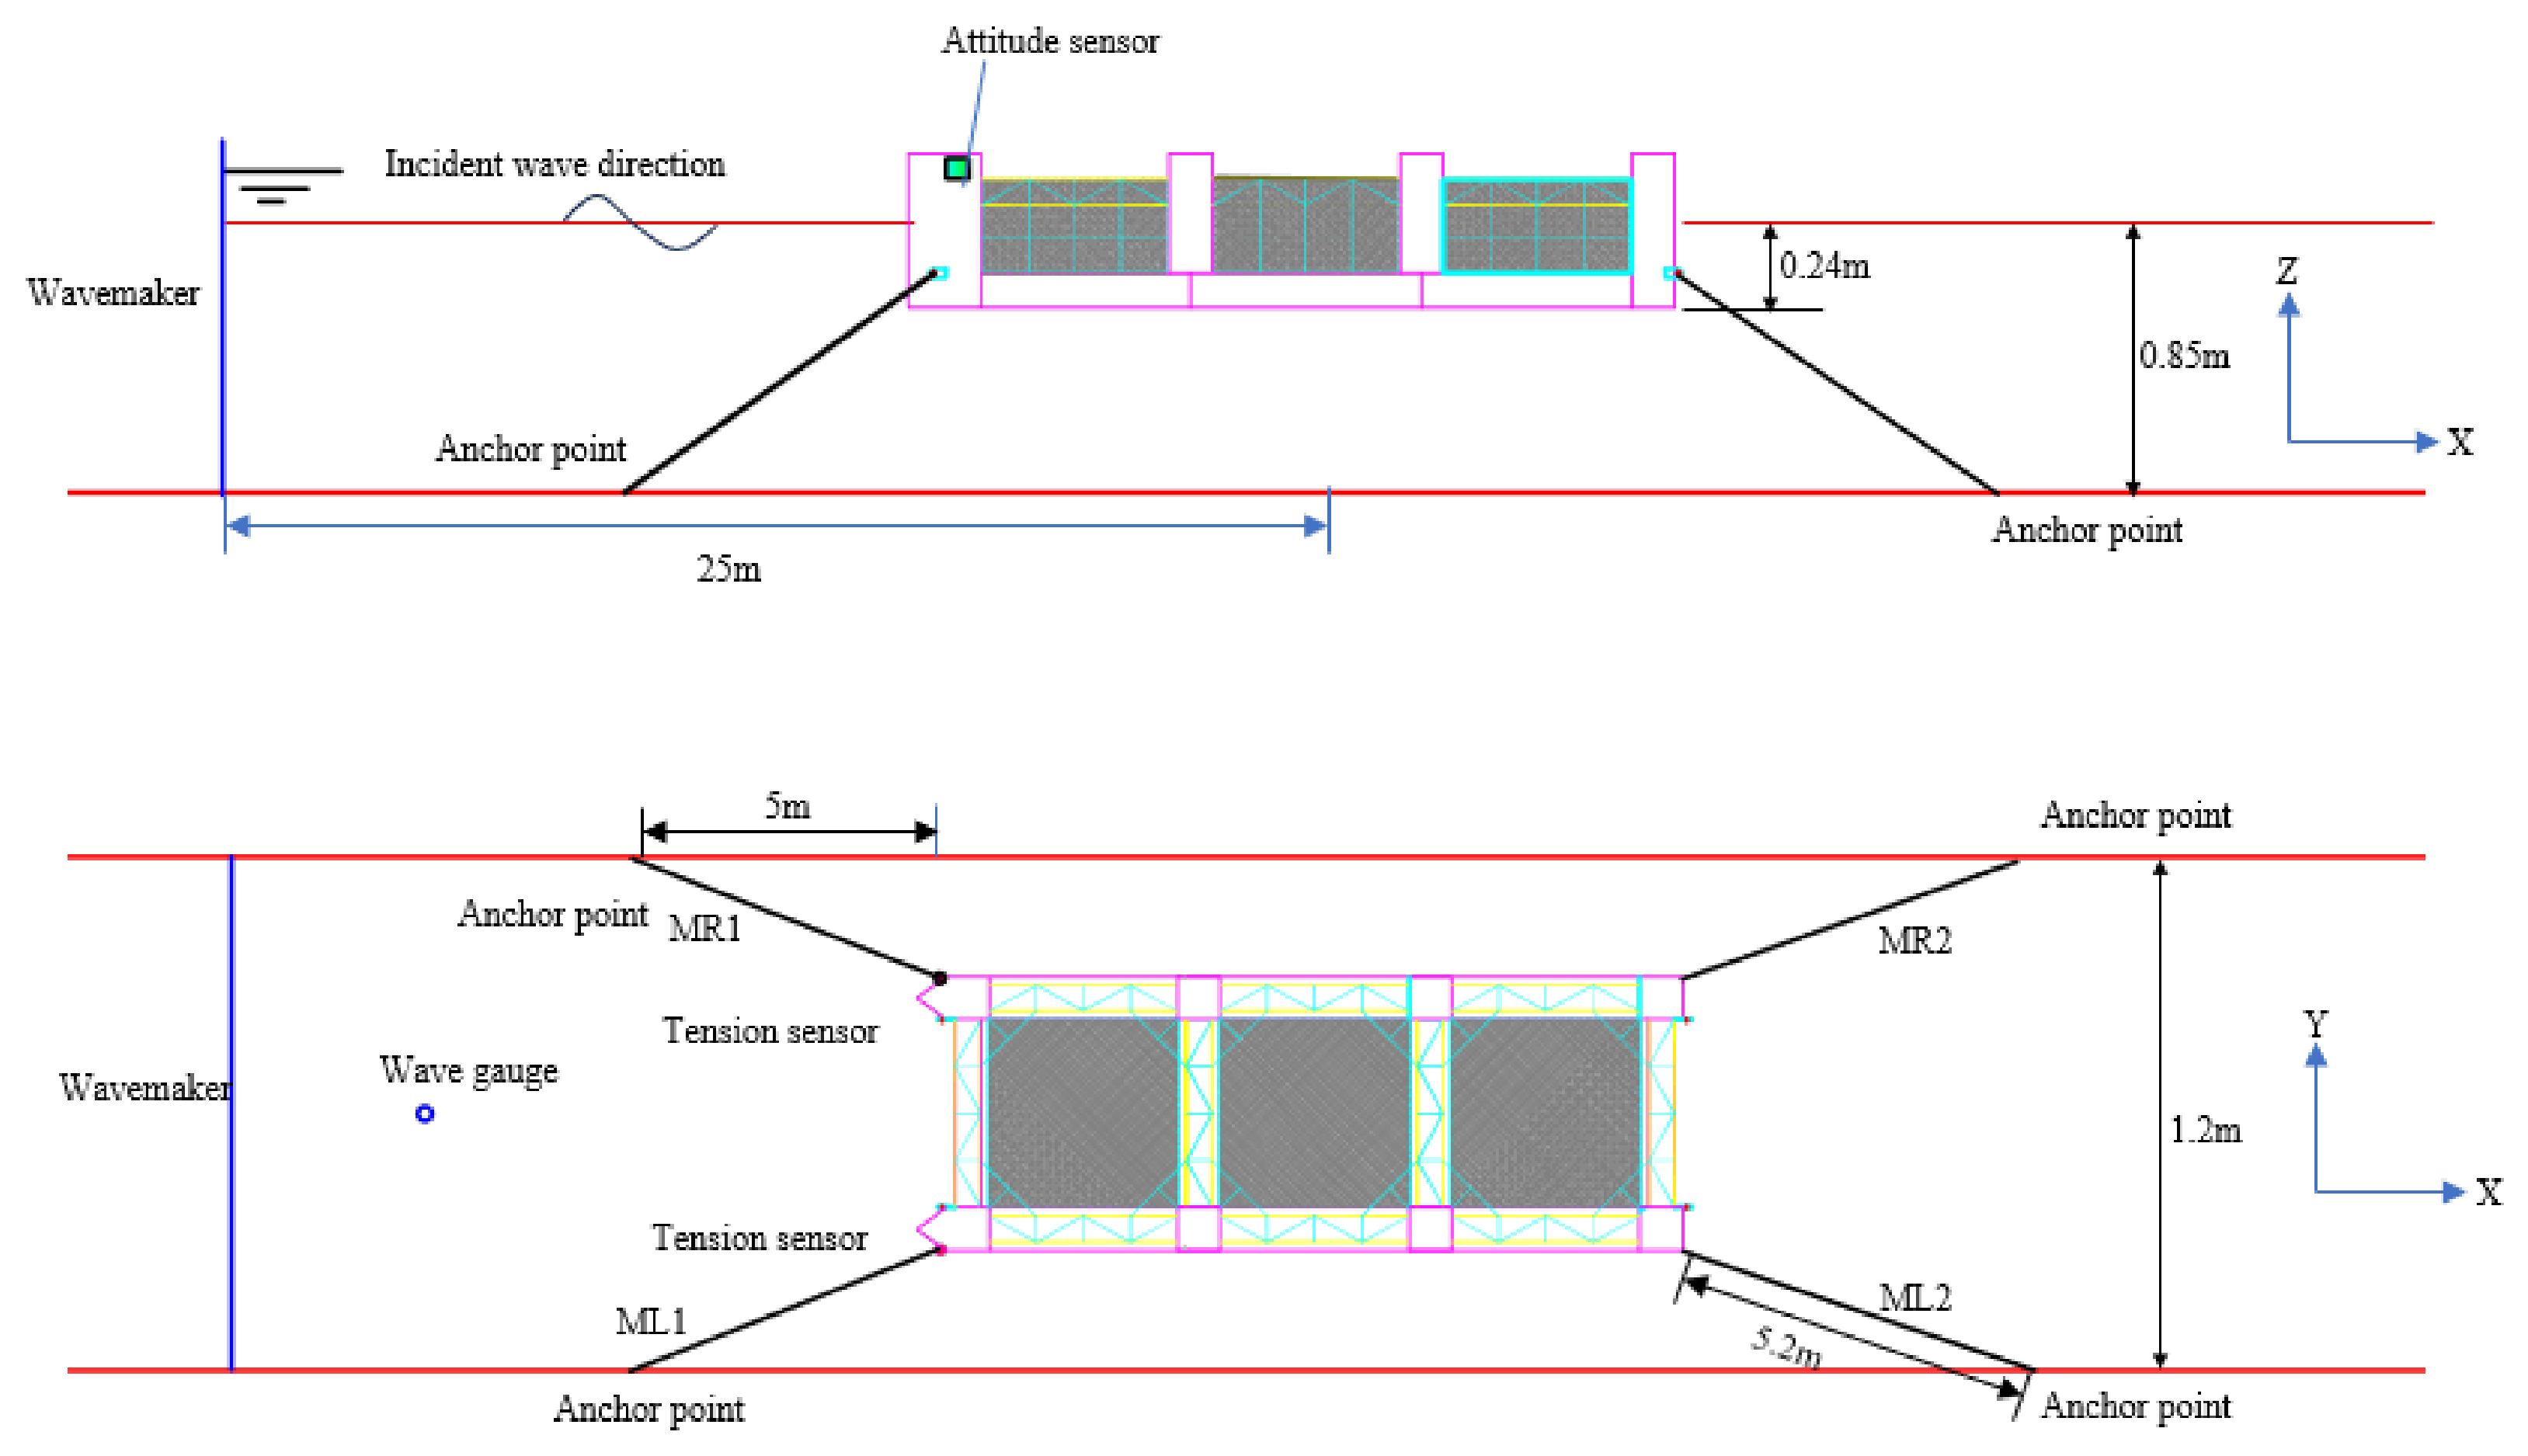
The model was centered laterally in a stable test section, 25 m from the wavemaker. A right-handed coordinate system was defined with the x-axis along the platform and the incident-wave direction, the z-axis positive upward, and the origin at the mean free-surface directly above the still-water center of gravity. Figure 1 and Figure 2 show the physical model and flume arrangement, respectively.

2.2. Cage System and Protection Configurations

The model comprised the platform structure, the netting system, and a four-point mooring system. Four catenary mooring lines connected the platform to fixed anchors on the flume floor. Relative to the incident-wave direction, the two upwave lines were denoted MR1 and ML1, and the two downwave lines were denoted MR2 and ML2.
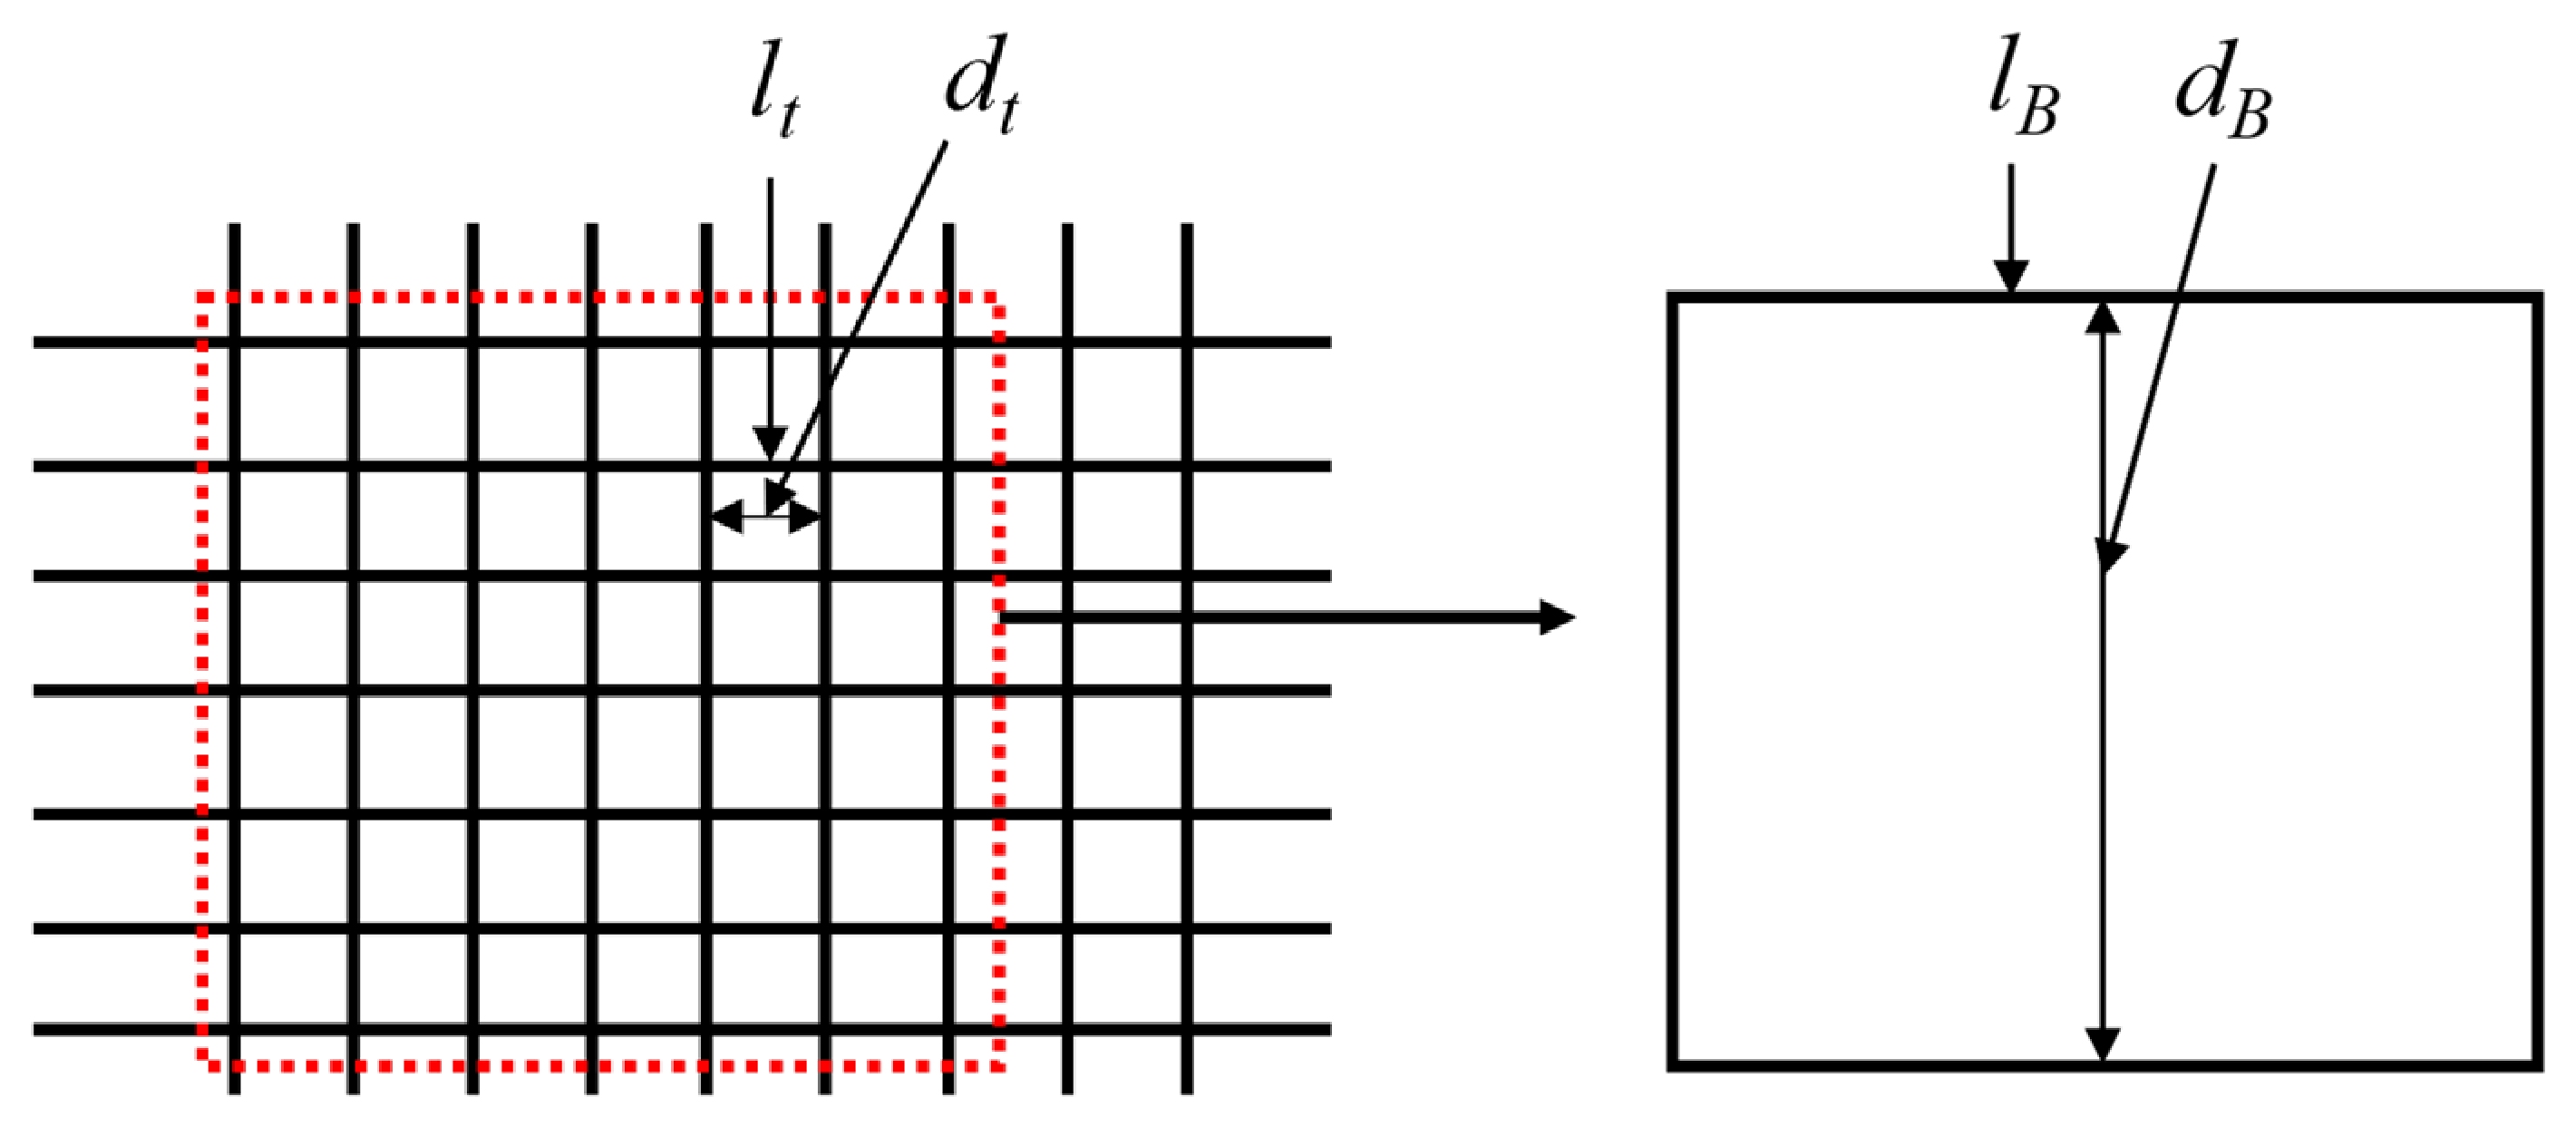
Manufacturing constraints prevented strict 1:50 geometric scaling of the prototype twine; therefore, netting solidity was used as the principal similarity parameter. The model netting had a twine diameter of 1.16 mm, a clear mesh opening of 5.36 mm, and a center-to-center twine spacing of approximately 6.52 mm. Solidity was calculated as follows:
S n   = 2 d t l t d t l t 2
where  d t is the twine diameter and l t is the center-to-center twine spacing. The calculated netting solidity was 0.32. This treatment keeps a projected-area ratio close to that of the prototype netting. The model tests are used for relative comparison among configurations and do not imply complete similarity in local net deformation or twine loading.
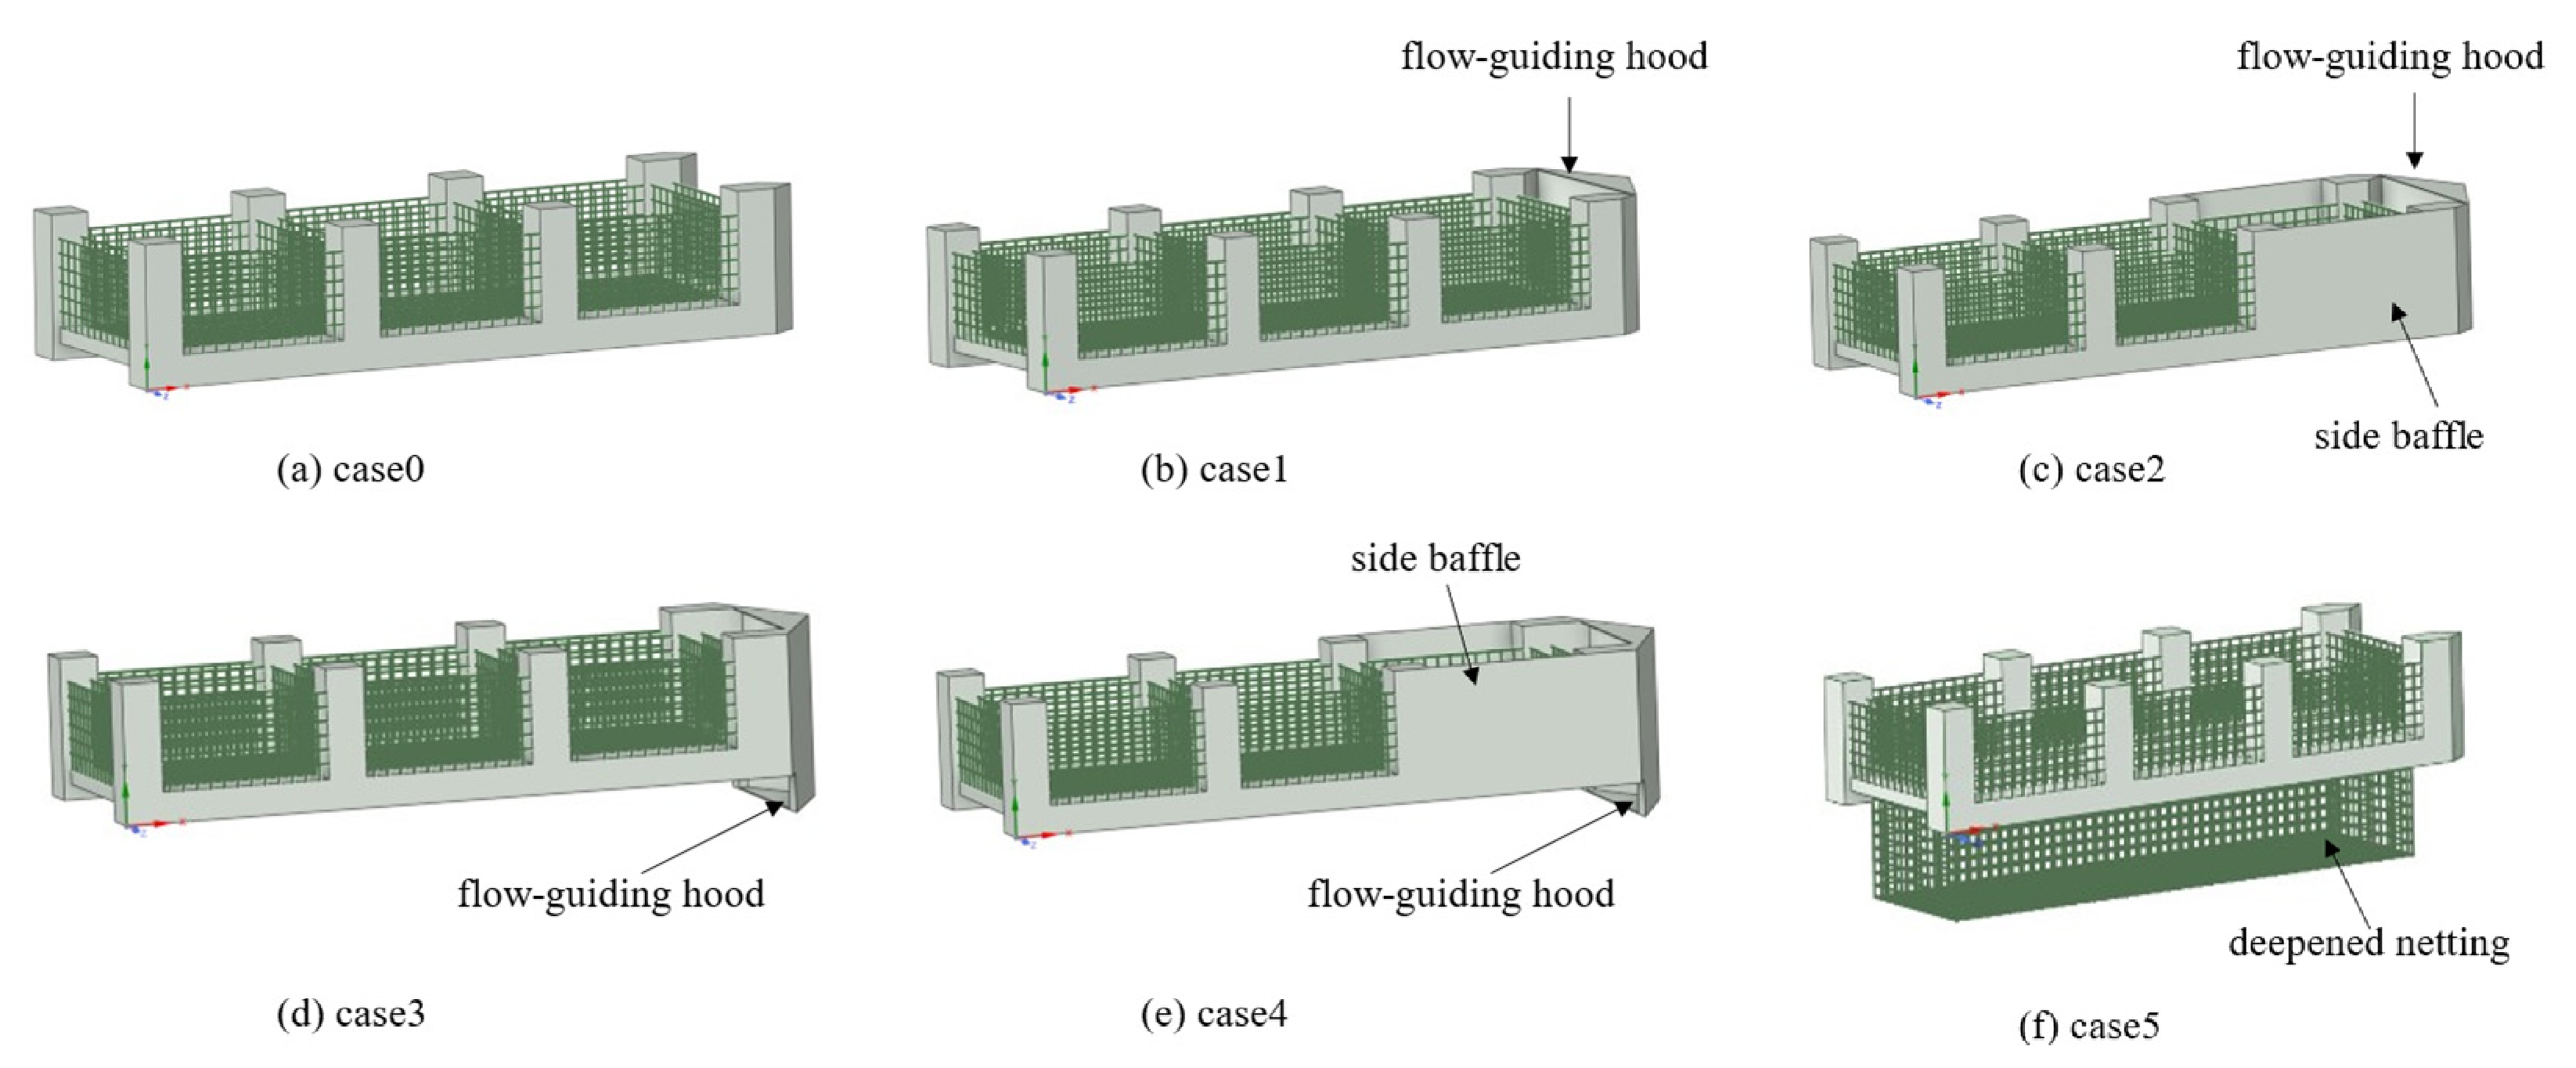
Case 0 was the unmodified platform, with no add-on protection and the baseline netting depth. Five modified configurations were evaluated. Case 1 used a standard-length flow-guiding hood without side baffles; case 2 used the same hood with side baffles; case 3 used an extended hood without side baffles; and case 4 combined the extended hood with side baffles. In terms of structural configuration, case 5 had no hood or side baffles and differed from case 0 by its increased netting depth. Cases 1 to 4 are hereafter termed add-on flow-guiding configurations, whereas case 5 represents a net-space modification; cases 0 to 5 are collectively referred to as protection configurations. The side baffles were mounted at both ends of the flow-guiding hood. Figure 3 shows the geometry and placement of cases 0–4, and Table 1 summarizes all six configurations.
The netting depth was 0.440 m in cases 0 to 4 and 0.680 m in case 5; therefore, case 5 added 0.240 m of vertical netting. Twine diameter, mesh dimensions, solidity, and all other platform parameters in case 5 were identical to those in case 0.

2.3. Wave Conditions

Wave conditions were derived by Froude scaling. The model wave height was 0.12 m, equivalent to 6 m at prototype scale, and model periods from 0.6 to 2.0 s corresponded to prototype periods from 4.24 to 14.14 s. These ranges represent severe conditions relevant to exposed offshore aquaculture. Unidirectional regular waves provided a controlled basis for comparing protection configurations: height, period, and direction could be prescribed independently and reproduced consistently, allowing period-dependent responses to be isolated at a fixed wave height.
The regular waves are idealized severe conditions, not a complete representation of an extreme sea state. The 6 m prototype value is the Froude-scaled height of the model wave and should not be read as a significant wave height, maximum wave height, or design condition. Real severe offshore seas, including typhoon conditions, are random, broadband, multidirectional, and nonstationary; they may also coincide with strong wind, current, and mixed wind–sea and swell. The results therefore show relative protection and hydrodynamic trends under controlled regular waves rather than ultimate platform safety during a typhoon. Engineering application will require site-specific tests and analyses for irregular waves, combined waves and currents, and extreme transient loads.

2.4. Measurement and Data Acquisition

The measurement system recorded platform motion, mooring load, and fish-school movement. An attitude sensor measured pitch with an angular accuracy of 0.001° and recorded translational accelerations in surge and heave with an accuracy of 0.001 g. Surge and heave displacement time series were obtained by filtering, baseline correction, and numerical integration of the corresponding acceleration signals. A load cell installed at the upwave fairlead measured mooring-line tension with an accuracy of 0.01 N. Platform motion and mooring load were sampled at 100 Hz.
Fish movement was recorded non-invasively with a fixed action camera outside the flume. Its field of view covered the principal observation area of the cage. Fish-school boundary positions were extracted from the videos after each test in order to obtain passive displacement under wave action. The image coordinates were converted to model-scale physical coordinates using the known cage boundaries and dimensions.

2.5. Fish-School Experiments and Passive-Displacement Metric

Quantitative analysis was restricted to the first cage on the right-hand side of the camera view. Each cage contained 150 live, hatchery-reared tilapia. Ten fish were sampled at random from the target cage before testing; their mean total length was 4.88 cm and mean body mass was 17.10 g. In cases 0 to 4, the effective water volume of the target cage was 440 mm × 220 mm × 440 mm (approximately 0.0426 m3). The total fish biomass was approximately 2.565 kg, giving a number density of approximately 3.52 × 10³ fish m−3 and a biomass density of approximately 60.22 kg m−3.
In case 5, the target cage measured 440 mm × 220 mm × 680 mm and contained approximately 0.0658 m3 of water. With the same 150 fish and total biomass of approximately 2.565 kg, number density was approximately 2.28 × 10³ fish m−3 and biomass density was 38.97 kg m−3. Compared with cases 0–4, case 5 increased water volume by 54.55% and reduced biomass density by 35.29%. The comparison therefore combines three changes: deeper netting, greater culture volume, and lower stocking density. Their individual effects on fish-school response cannot be separated with this experimental design.
Fish were acclimated in still water for 24 h before testing. During preliminary observation, the school remained broadly stable without sustained active swimming toward the waves. Each wave condition was tested once as an independent realization. Cycles within a test were repeated observations of the steady response, not independent experimental replicates. The first 30 s covered wave establishment and transient response; the 30 to 60 s interval represented the stable stage. Because active swimming cannot be removed completely from video records, individual trajectories were not tracked. Instead, the analysis measured the collective approach of the school toward the netting under platform motion and internal water disturbance. Fitting an equivalent boundary to the main-school envelope limited the influence of occasional movements by a few fish.
A fixed region of interest was defined inside the target cage. The video was decomposed frame by frame, and each image underwent grayscale conversion, background correction, and threshold segmentation to identify fish pixels. Morphological opening and closing reduced local noise from reflections, net twines, and shadows, after which adjacent fish contours were connected to form the main-school envelope. Spatially continuous portions of the school were retained, whereas a small number of isolated targets were excluded to limit the influence of occasional individual movement or image misclassification. The same segmentation parameters and envelope rules were applied to every frame and every case.
The image scale was calibrated against the known cage width. Let the 440 mm cage width correspond to L p pixels. The spatial conversion factor k is then:
k = 440 L p
where k is expressed in mm pixel−1.
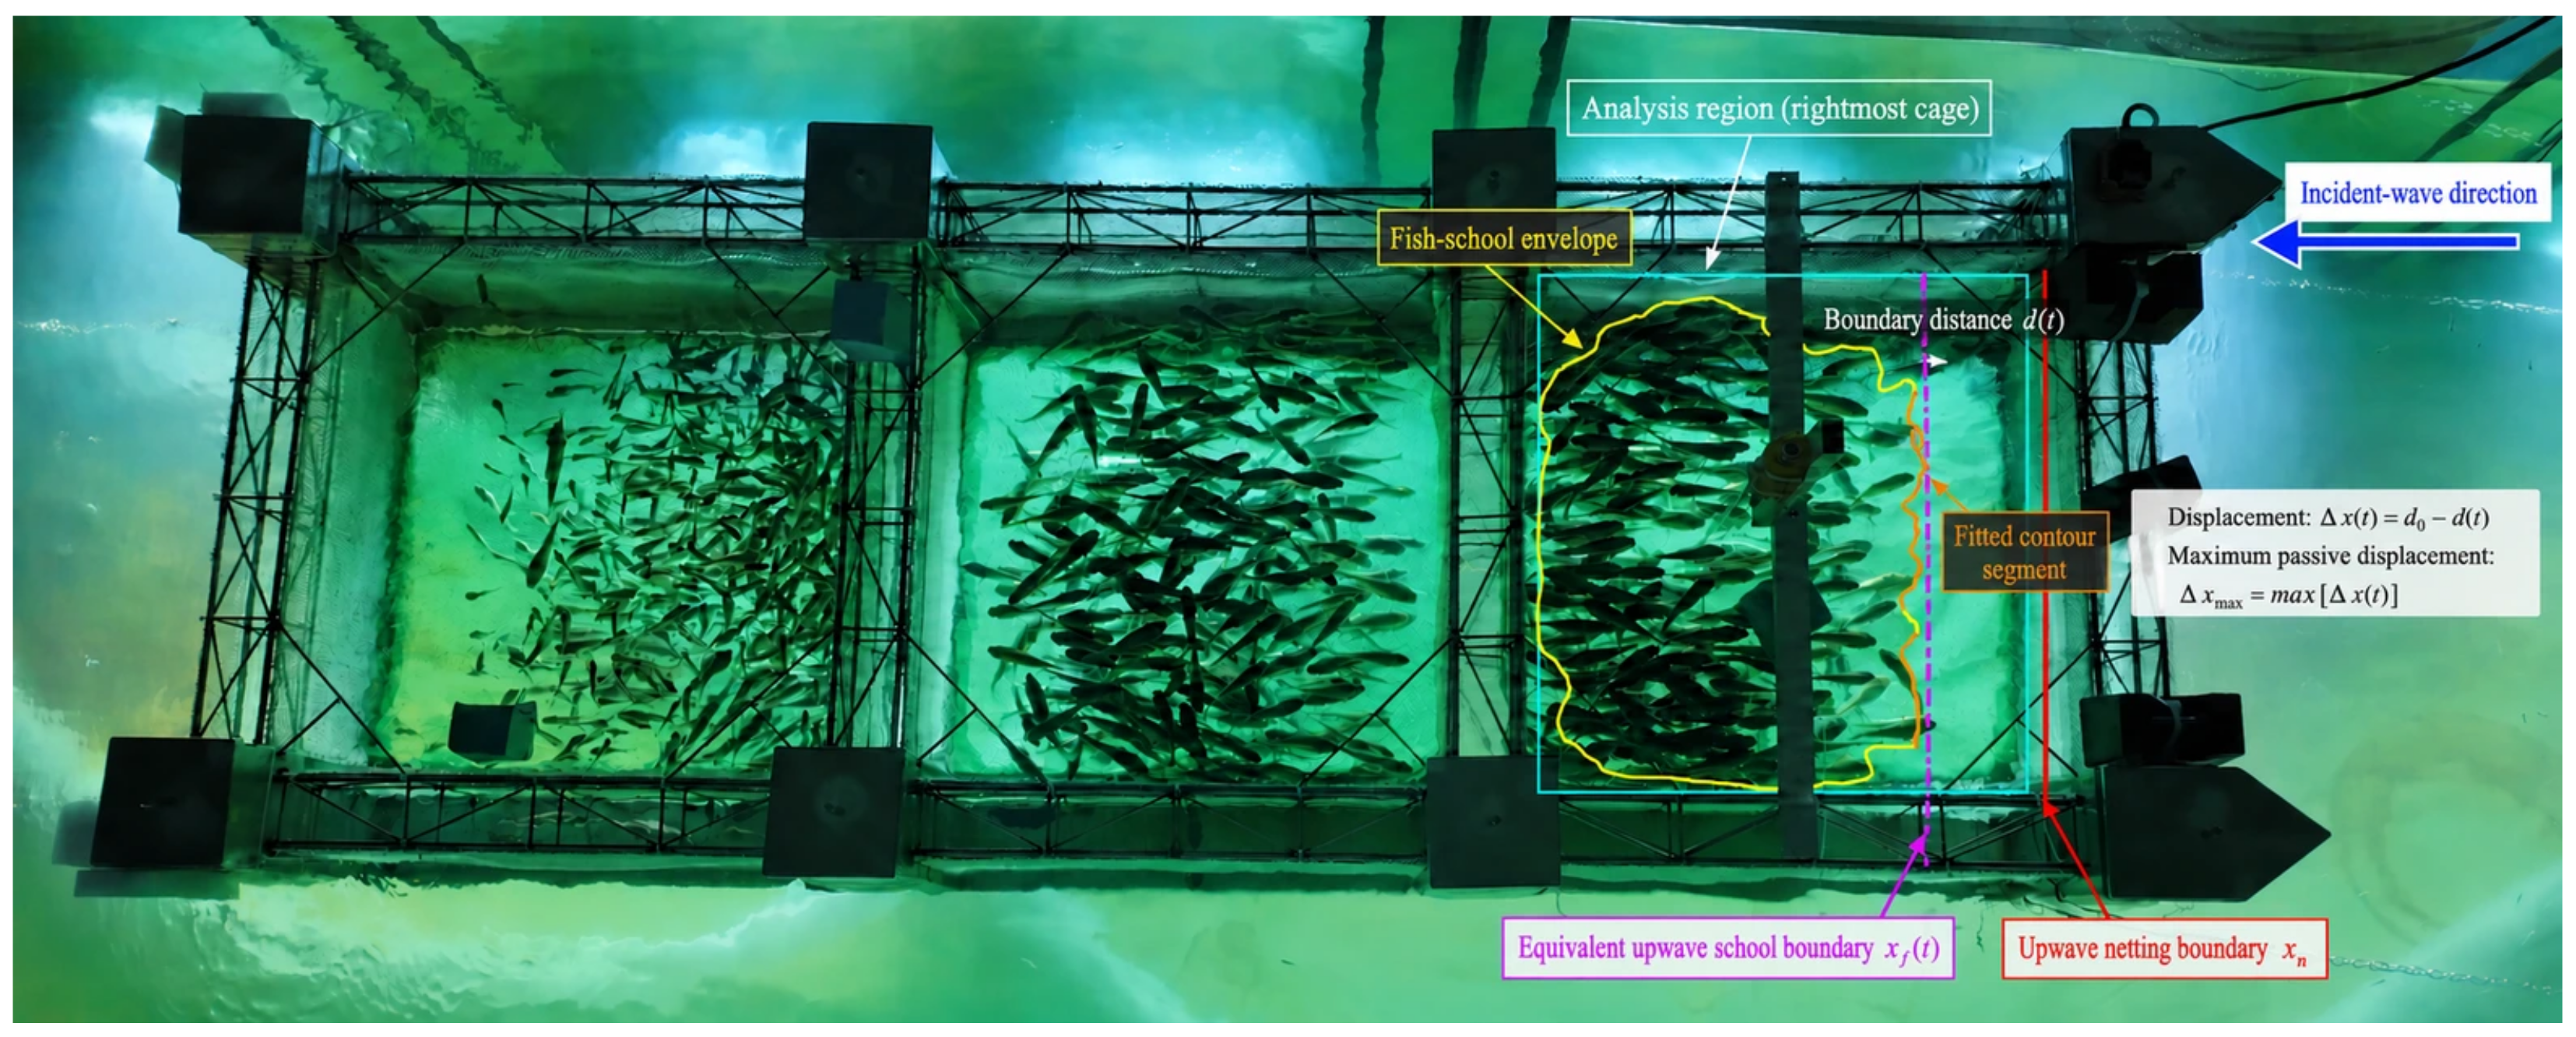
As shown in Figure 4, the upwave contour of the school envelope was irregular. Using its outermost point would make the metric sensitive to local protrusions and isolated peripheral fish. Therefore, a continuous, approximately vertical segment in the middle of the upwave contour was fitted instead. Boundary points between 20% and 80% of the envelope height were selected to avoid the curved upper and lower ends. The same relative-height interval was used at all times, for all wave conditions, and for every case.
Let the selected contour segment contain N boundary points, with the ith point located at x i ( t ) . A least-squares fit gave a near-vertical equivalent boundary with horizontal coordinate x f ( t ) :
x f ( t ) = 1 N i = 1 N x i ( t ) .
Let the horizontal coordinate of the upwave netting boundary be x n . The horizontal distance between the equivalent school boundary and the netting is:
d t = x n x f ( t ) .
Taking the boundary distance d 0 at the start of the stable stage as a reference, passive fish-school displacement is defined as:
Δ x ( t ) = d 0 d ( t ) .
To exclude wave establishment and short-term school adjustment, the 30 to 60 s interval was treated as the steady-state response stage. For each complete wave cycle within this interval, the maximum passive displacement was first extracted, and the cycle-wise maximum values were then averaged to obtain the representative displacement for that wave condition:
Δ x max = max t T j x ( t ) , j = 1 , 2 , , M
Δ x ¯ max = 1 M j = 1 M x max , j
where T j denotes the j th complete wave cycle within the steady-response interval, Δ x max , j is the maximum passive displacement during that cycle, and M is the number of complete wave cycles included in the analysis. The cycle-averaged maximum displacement, Δ x ¯ max , was used as the representative fish-school displacement for each wave condition. Because the wave cycles belong to the same experimental realization, they represent repeated observations within a single test rather than independent experimental replicates.
Because Δ x t is defined from the change in horizontal distance between the equivalent upwave school boundary and the netting, a larger Δ x max , j corresponds to a smaller minimum horizontal clearance between the main school and the upwave netting during the j th wave cycle. Accordingly, a larger Δ x ¯ max indicates a stronger overall tendency of the school to approach and become exposed to the upwave netting during the steady-response stage. On this physical basis, Δ x ¯ max is used here as an engineering proxy for potential fish–net contact exposure. However, it should not be interpreted as a directly measured statistical probability of contact because actual contact events were not counted. The metric also does not quantify contact severity, injury probability, physiological stress, or long-term welfare. It is intended primarily for relative comparison among the tested configurations. Fish dimensions and behavior cannot satisfy Froude similarity, so the tests represent relative movement trends of the model fish school rather than the dynamically similar behavior of a prototype.
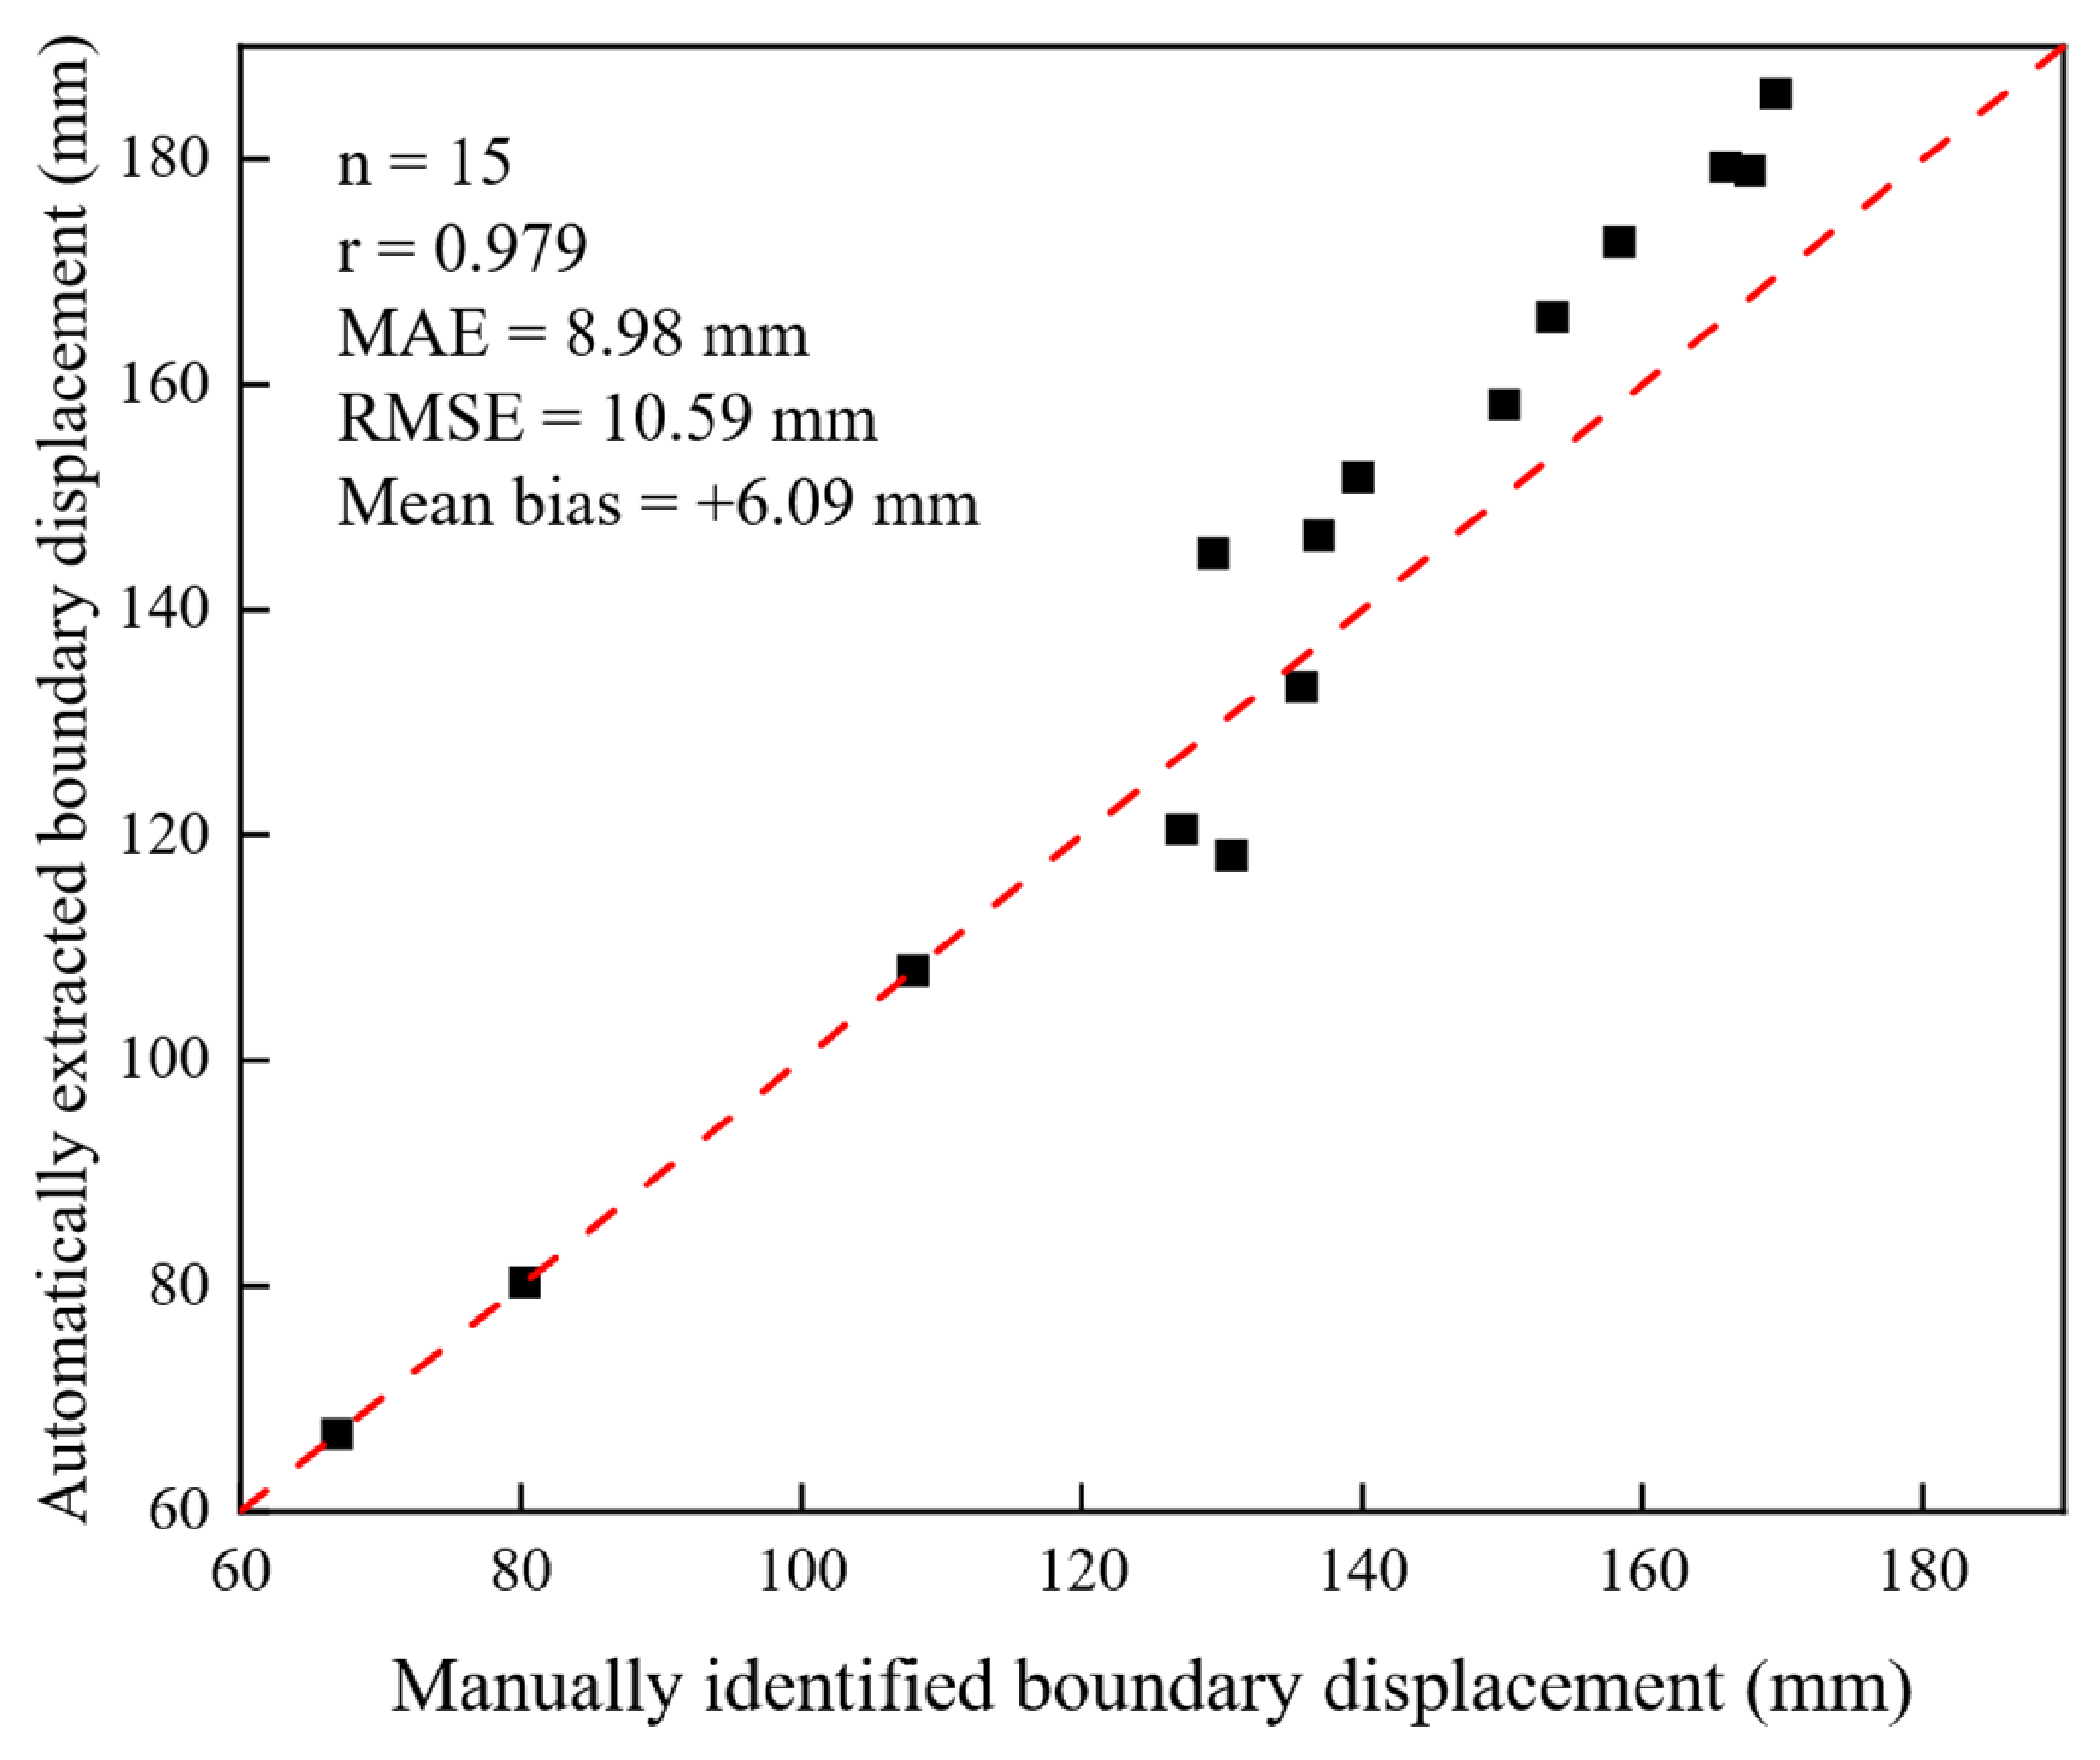
Uncertainty in the automated boundary extraction was assessed against manual measurements from 15 representative frames, one randomly selected at each tested period from 0.6 to 2.0 s (Figure 5). Relative to the manual measurements, the automated method had a mean absolute error (MAE) of 8.98 mm, a root-mean-square error (RMSE) of 10.59 mm, and a maximum absolute error of 16.28 mm. The Pearson correlation coefficient was 0.979, while the mean signed difference (automatic minus manual) was 6.09 mm, showing a modest positive bias. The method captured the overall variation in boundary displacement; however, small differences among configurations should be interpreted cautiously.

2.6. Numerical Hydrodynamic Model

A three-dimensional frequency-domain ANSYS-AQWA (Version 2024 R2, Ansys, Inc., Canonsburg, PA, USA) model was used with the same scale, geometry, and draft as the physical model. Calculations covered the frequency range corresponding to the experimental wave periods. The model was not intended to reproduce the measured finite-amplitude motions or mooring tensions directly. Instead, it compared first-order wave excitation, added mass, and radiation damping among configurations. These quantities provide hydrodynamic context for the measured differences in global response; fish-school displacement, platform motion, and mooring tension came from the physical tests.
The analysis used three-dimensional linear potential-flow theory, treating the fluid as inviscid, incompressible, and irrotational, and the incident waves as small-amplitude regular waves. Accordingly, the calculated hydrodynamic quantities represent first-order linear characteristics at the corresponding frequencies and do not include amplitude-dependent higher-order wave effects. Therefore, the experimental wave height was not used to represent a finite-amplitude wave in the frequency-domain hydrodynamic calculation.
The potential-flow formulation resolves first-order wave diffraction and radiation around the large wetted surfaces, but it does not explicitly capture viscous flow separation, vortex shedding, turbulence, or other rotational-flow phenomena. Viscous effects on the netting, truss members, and other slender components are represented only approximately through the drag term in the Morison formulation described below. In addition, the fluid is assumed to be homogeneous, and density stratification is not considered. Therefore, the present numerical model is intended primarily for comparative analysis of first-order global hydrodynamic responses rather than for resolving detailed local viscous, vortical, turbulent, or stratification-induced flow structures.
In the frequency domain, fluid motion is described by a velocity potential comprising incident, diffracted, and radiated components:
Φ = Re ϕ I + ϕ D + j = 1 6 ξ j ϕ j e i ω t
where Φ is the incident-wave potential, ϕ D is the diffraction potential, ϕ j is the radiation potential associated with unit oscillation in the jth degree of freedom, ξ j is the corresponding complex motion amplitude, and ω is the angular wave frequency. The potentials satisfy the Laplace equation together with the linear free-surface, seabed, wetted-body, and far-field radiation boundary conditions.
First-order wave excitation arises from the incident and diffracted waves and represents the linear load on the restrained platform. For the ith degree of freedom, it can be written as follows:
F i E = F i I + F i D
where F i I and F i D are the excitation components generated by the incident and diffracted potentials, respectively. This quantity therefore reflects changes in wave-facing area, diffraction, and load-transfer pathways.
Added mass and radiation damping are obtained from the radiation potentials generated by the oscillation of the platform. Added mass represents the additional inertia of the surrounding water accelerated with the structure, whereas radiation damping represents energy carried away by radiated waves. The radiation force is written as:
F i R = j = 1 6 ω 2 A i j ( ω ) i ω B i j ( ω ) ξ j
where A i j ( ω ) is the frequency-dependent added-mass matrix and B i j ( ω ) is the frequency-dependent radiation-damping matrix. Surge, heave, and pitch terms were extracted to compare added inertia and radiated-wave energy loss among the configurations.
The linear frequency-domain equation for platform motion is:
ω 2 ( M + A ( ω ) ) i ω B ( ω ) + C ξ = F E ( ω )
where M is the structural mass matrix, A ( ω ) is the added-mass matrix, B ( ω ) is the radiation-damping matrix, C is the hydrostatic restoring matrix, ξ is the complex six-degree-of-freedom response vector, and F E ( ω ) is the first-order wave-excitation vector. The platform response therefore depends on wave excitation together with added mass, radiation damping, hydrostatic restoring, and their coupling.
Large wetted surfaces, including the platform body, flow-guiding hoods, and side baffles, were modeled using diffraction and radiation panels. Netting, truss members, and other slender components were represented by Morison elements to account for inertia and viscous drag. The hydrodynamic force per unit length on a Morison element is:
f = ρ C M A m ( u ˙ x ¨ ) + 1 2 ρ C D D u x ˙ u x ˙
where ρ is fluid density, C M is the inertia coefficient, C D is the drag coefficient, A m is the characteristic cross-sectional area, D is the characteristic width or diameter, u and u ˙ are the local water-particle velocity and acceleration, and x ˙ and x ¨ are the member velocity and acceleration. This hybrid representation keeps the efficiency of the potential-flow solution while accounting for viscous loading on slender components.
To reduce the number of netting elements, the mesh was grouped. The original model twine diameter was 1.16 mm, the center-to-center spacing was approximately 6.52 mm, and the solidity was 0.32. For a basic panel measuring 440 mm × 220 mm, the equivalent element length l B was 36.67 mm, the net projected area represented by each equivalent beam A e q was 214 mm2, and the equivalent beam diameter d B was 7.53 mm. This corresponds approximately to a 6 × 6 mesh grouping, as shown in Figure 6.
Drag and inertia were preserved between the original mesh and the grouped representation.
C D B d B l B = C D p a n e l A e q
C M B = N C M t d t 2 d B 2
where C D p a n e l = 0.615 is the normal-incidence drag coefficient of the net panel, N = 5.62 is the effective grouping coefficient, C M t = 2.0 is the inertia coefficient of the original twine, and the resulting equivalent-beam coefficients are C D B = 0.48 and C M B = 0.27 .
Accordingly, when Equation (11) is applied to an equivalent netting beam, D = d B = 7.53   mm , A m = π d B 2 4 = 44.53   mm 2 , C D = C D B = 0.48 and C M = C M B = 0.27 .
The numerical model did not resolve large nonlinear net deformation, fish–flow–structure interaction, viscous separation, vortex shedding, turbulence, or density stratification. Netting was treated as a hydrodynamic component attached to the platform, and viscous loads on netting and other slender members were approximated with the Morison drag formulation. Fish-school displacement was determined only from the video analysis. The AQWA results were therefore used to compare first-order wave excitation, added mass, and radiation damping and to interpret the measured global motion and mooring response, not to reproduce detailed flow inside the cage.

3. Results

3.1. Fish-School Boundary Displacement and Potential Netting Exposure

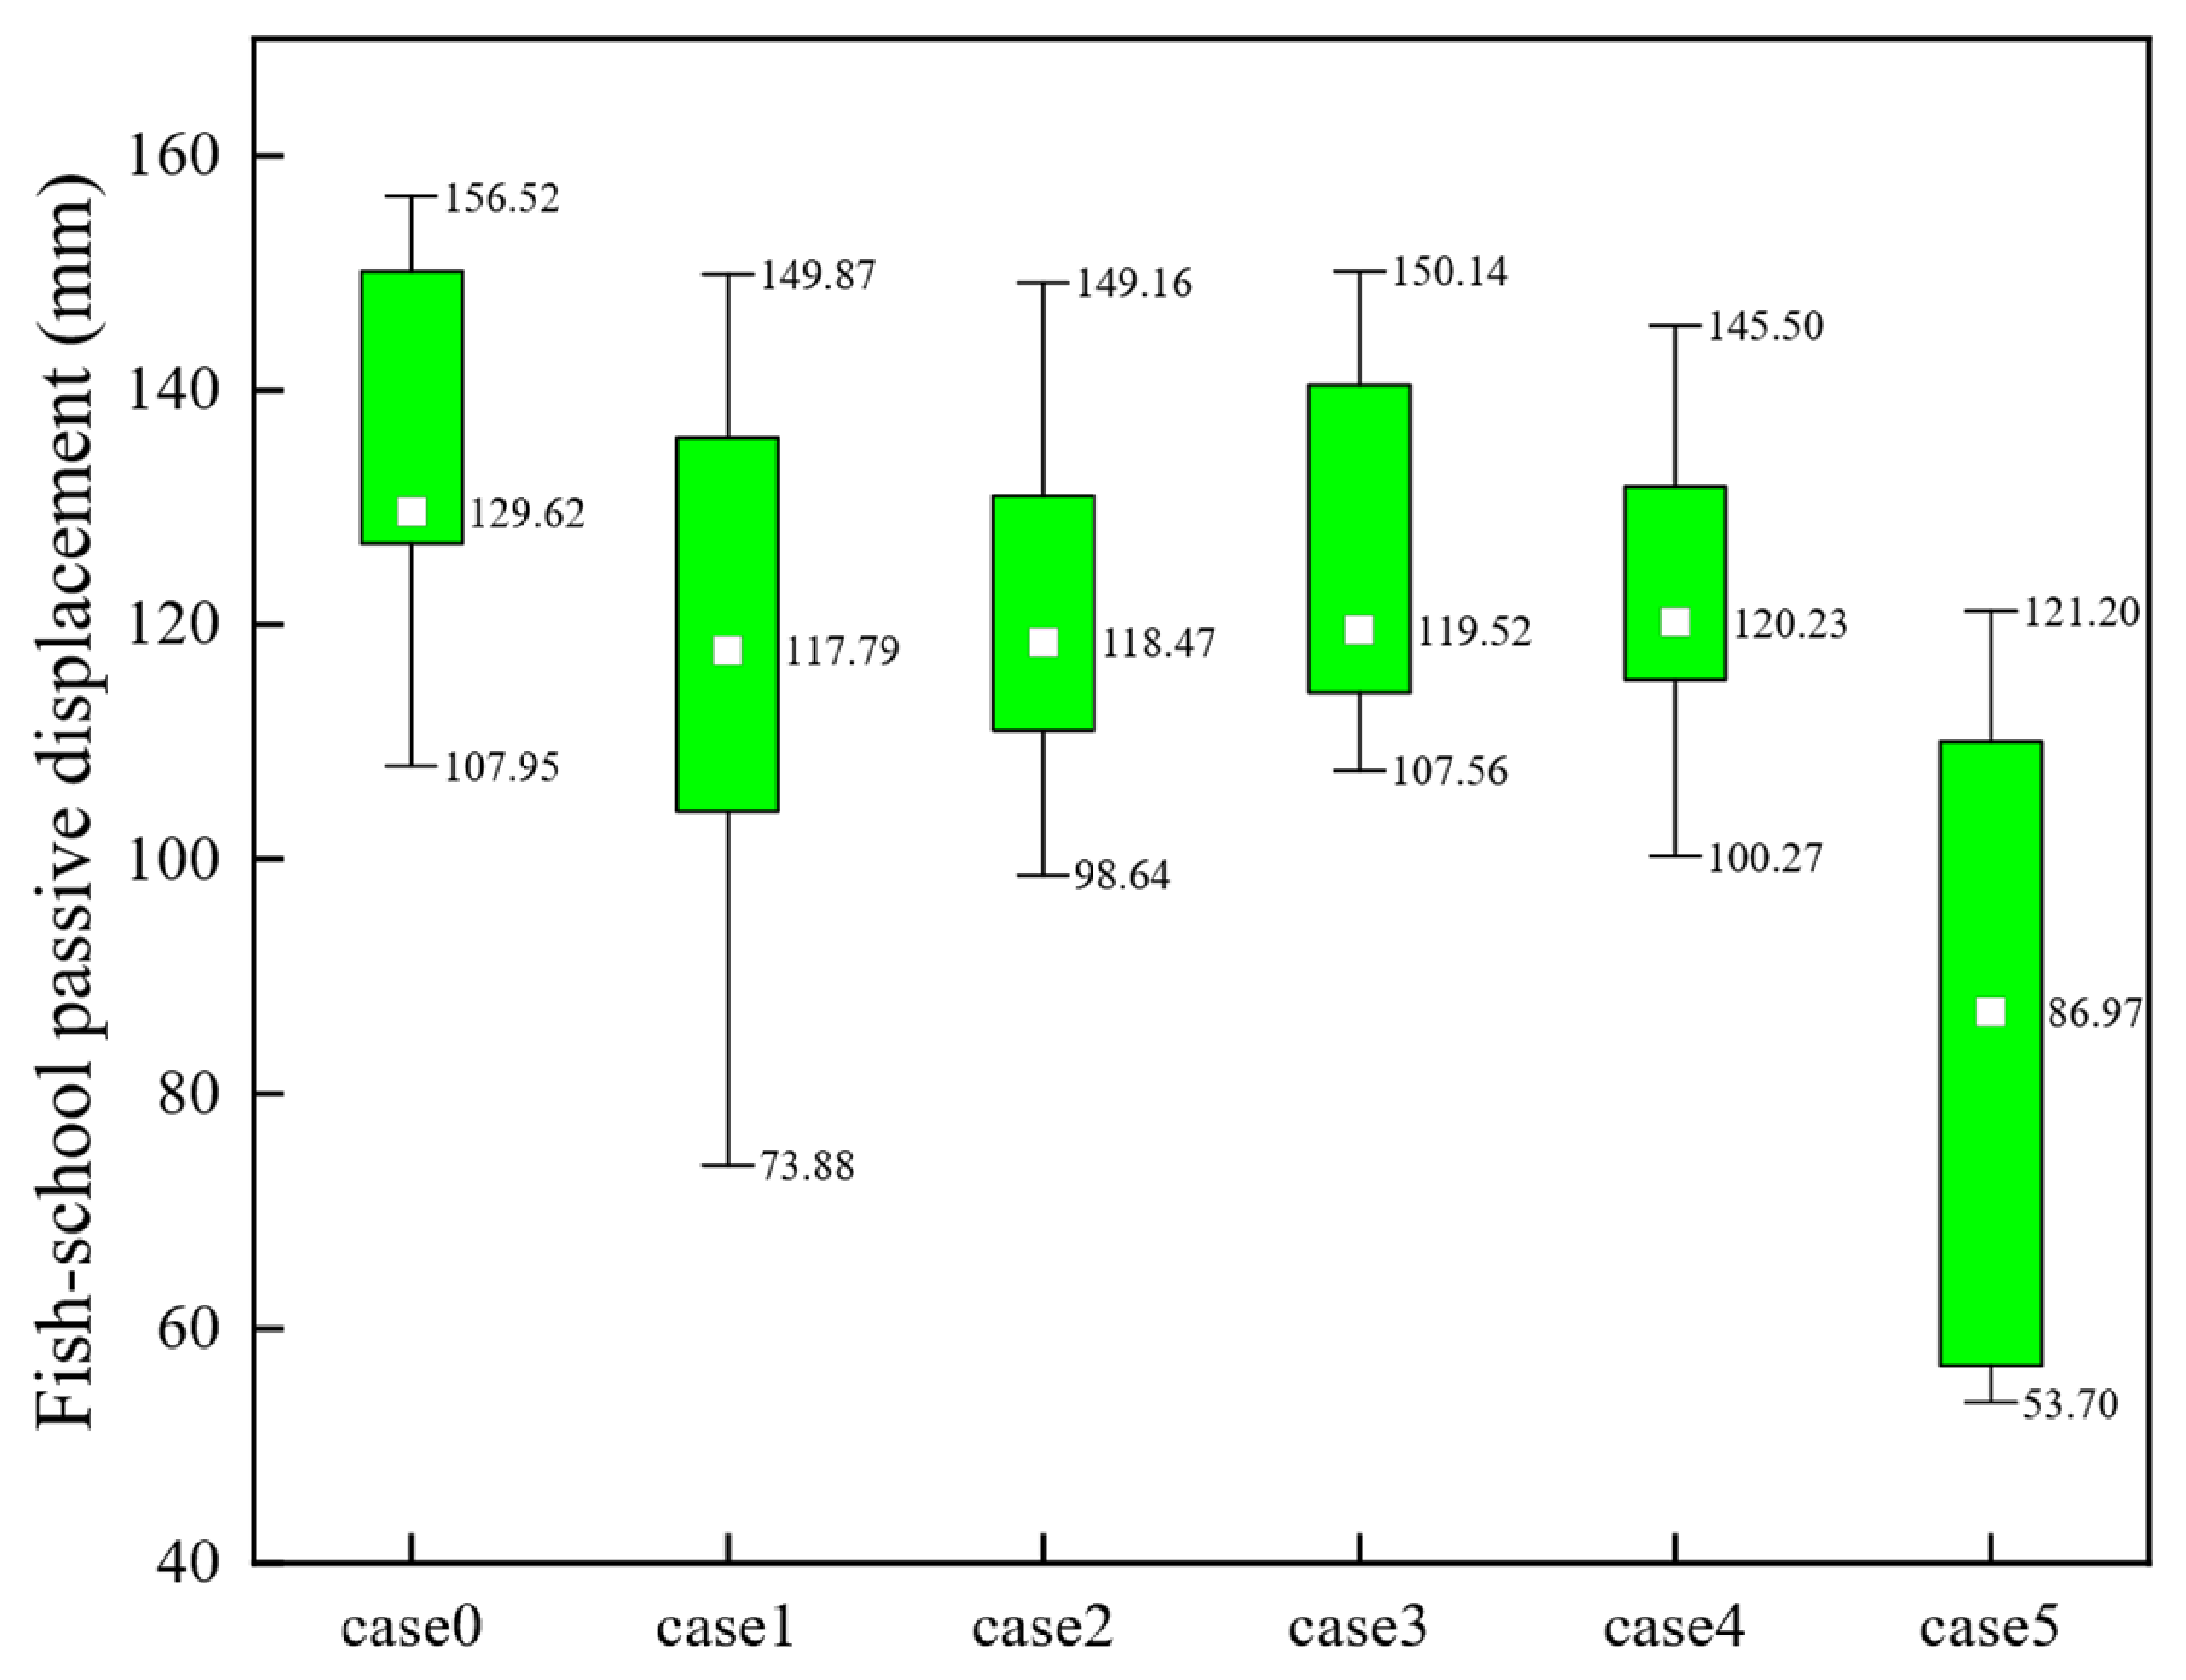
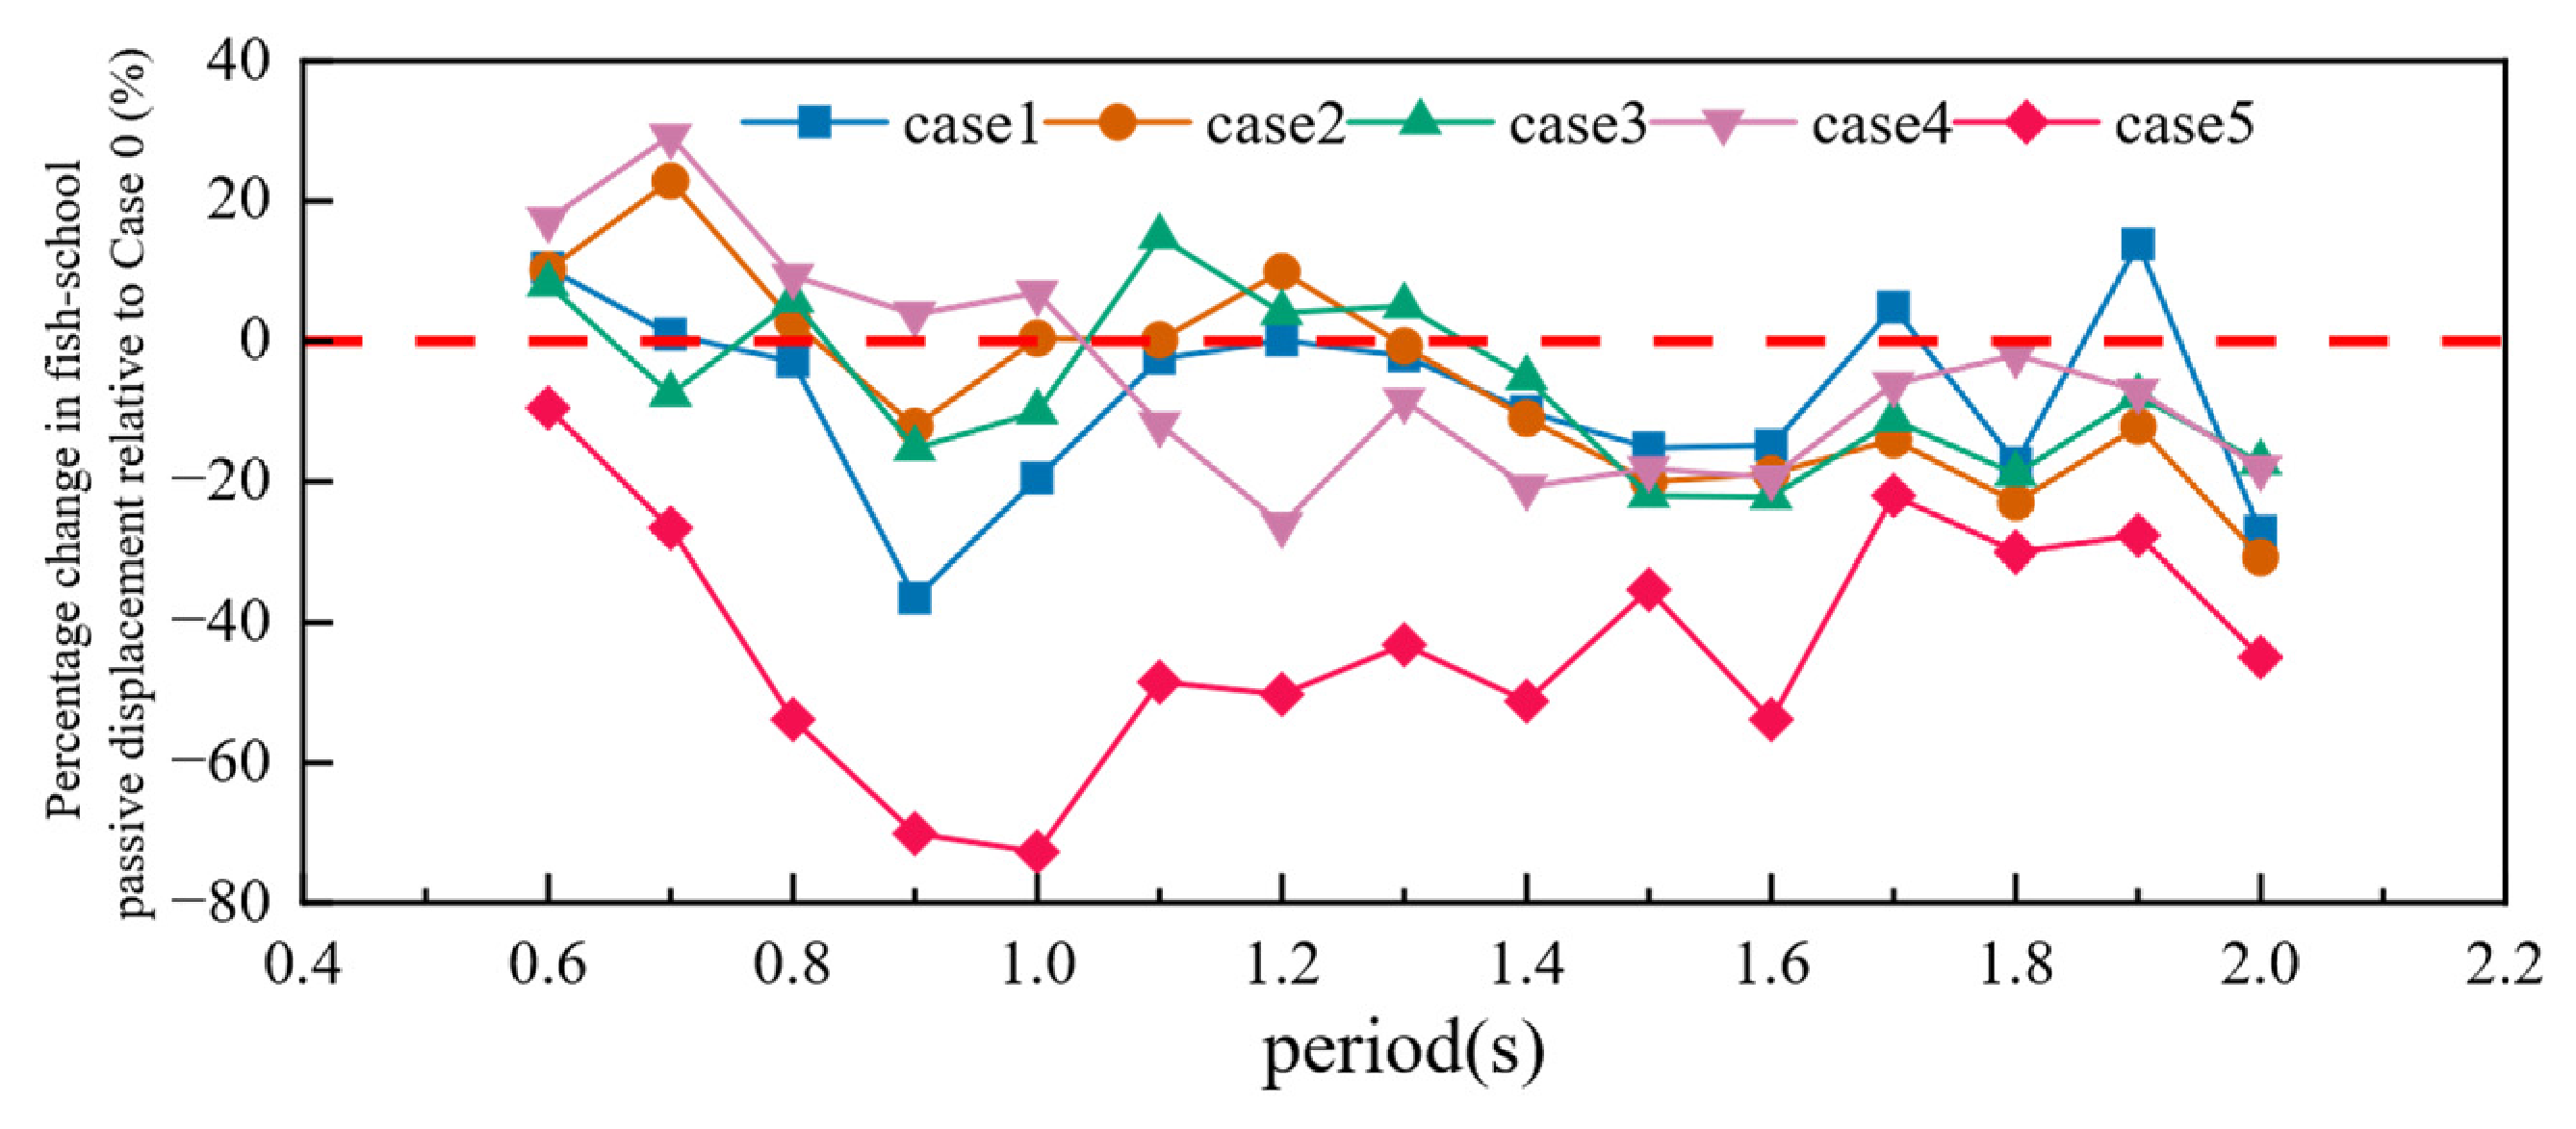
Maximum displacement of the equivalent upwave school boundary served as an engineering indicator of potential fish–net contact exposure. A larger value means less horizontal clearance between the main school and the upwave netting. Figure 7 gives the change in each modified case relative to case 0, with the red dashed line marking zero. Values below the line indicate reduced boundary displacement and, by this metric, lower netting exposure; values above it indicate an increase. Figure 8 summarizes the distributions across all tested periods.
The add-on flow-guiding configurations were strongly period-dependent (Figure 7). At a 0.6 s wave period, displacement in cases 1 to 4 exceeded that in case 0 by 8.13 to 17.37%. At 1.5–1.6 s, the same cases reduced displacement by 14.85–22.14%. Positive and negative changes alternated at the remaining periods, showing that the wave period and structural combination together controlled their performance. The case 5 configuration differed: it reduced displacement by 14.20 to 56.25% at every tested period.
The distributions in Figure 8 confirm this contrast. Mean passive displacement was 129.616 mm in case 0 and 117.790 to 120.228 mm in cases 1 to 4, representing a reduction of 7.24 to 9.12%; case 1 showed the lowest observed mean among the flow-guiding configurations in the present tests. Case 5 reduced the mean to 86.967 mm, 32.90% below case 0. The maximum was 156.521 mm in case 0 and 145.496 to 150.142 mm in cases 1 to 4, with case 4 showing the lowest observed maximum in that group. Case 5 further reduced the maximum to 121.200 mm, a decrease of 22.57%.
Case 5 had the lowest mean and maximum displacement and reduced displacement at every tested period. This response cannot be attributed to deeper netting alone because culture volume increased and stocking density decreased at the same time. Additional vertical space, altered internal hydrodynamics, and lower stocking density may all have contributed, but this experiment cannot separate their effects.
The manual validation also shows that small differences among the flow-guiding configurations fall close to the uncertainty of the image processing method. They should therefore not be treated as a definitive performance ranking.

3.2. Platform Motions

Platform motion affects structural safety and mooring demand, and also disturbs the water inside the cages. Figure 9, Figure 10, Figure 11, Figure 12, Figure 13 and Figure 14 compare the period-dependent and aggregate pitch, surge, and heave responses to determine how the flow-guiding structures and netting depth altered platform dynamics.
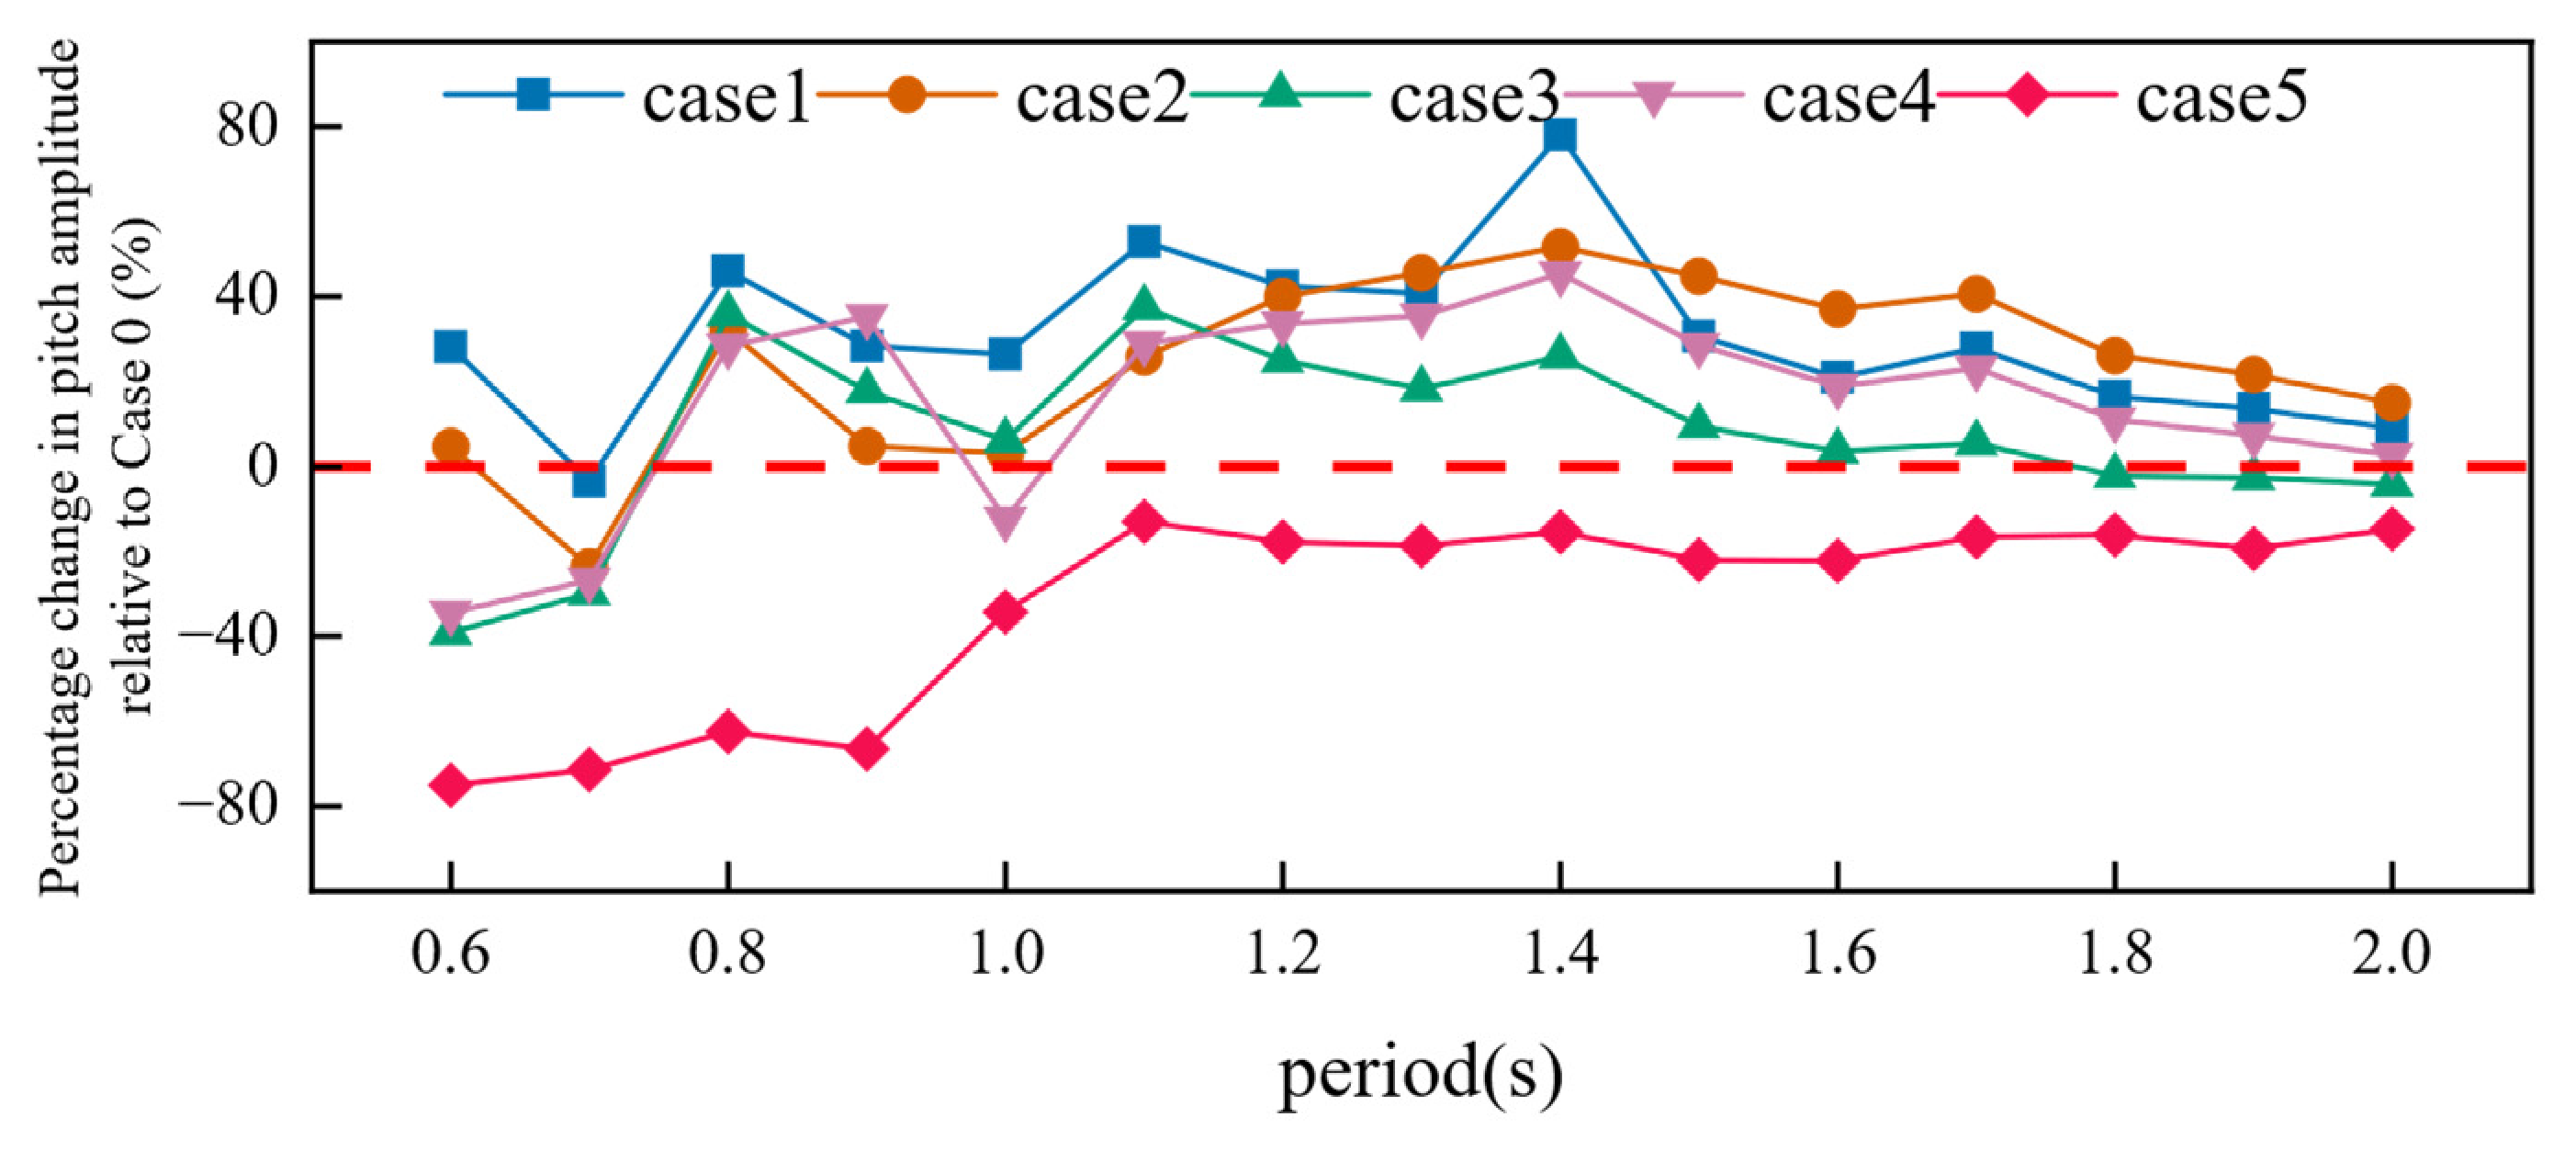
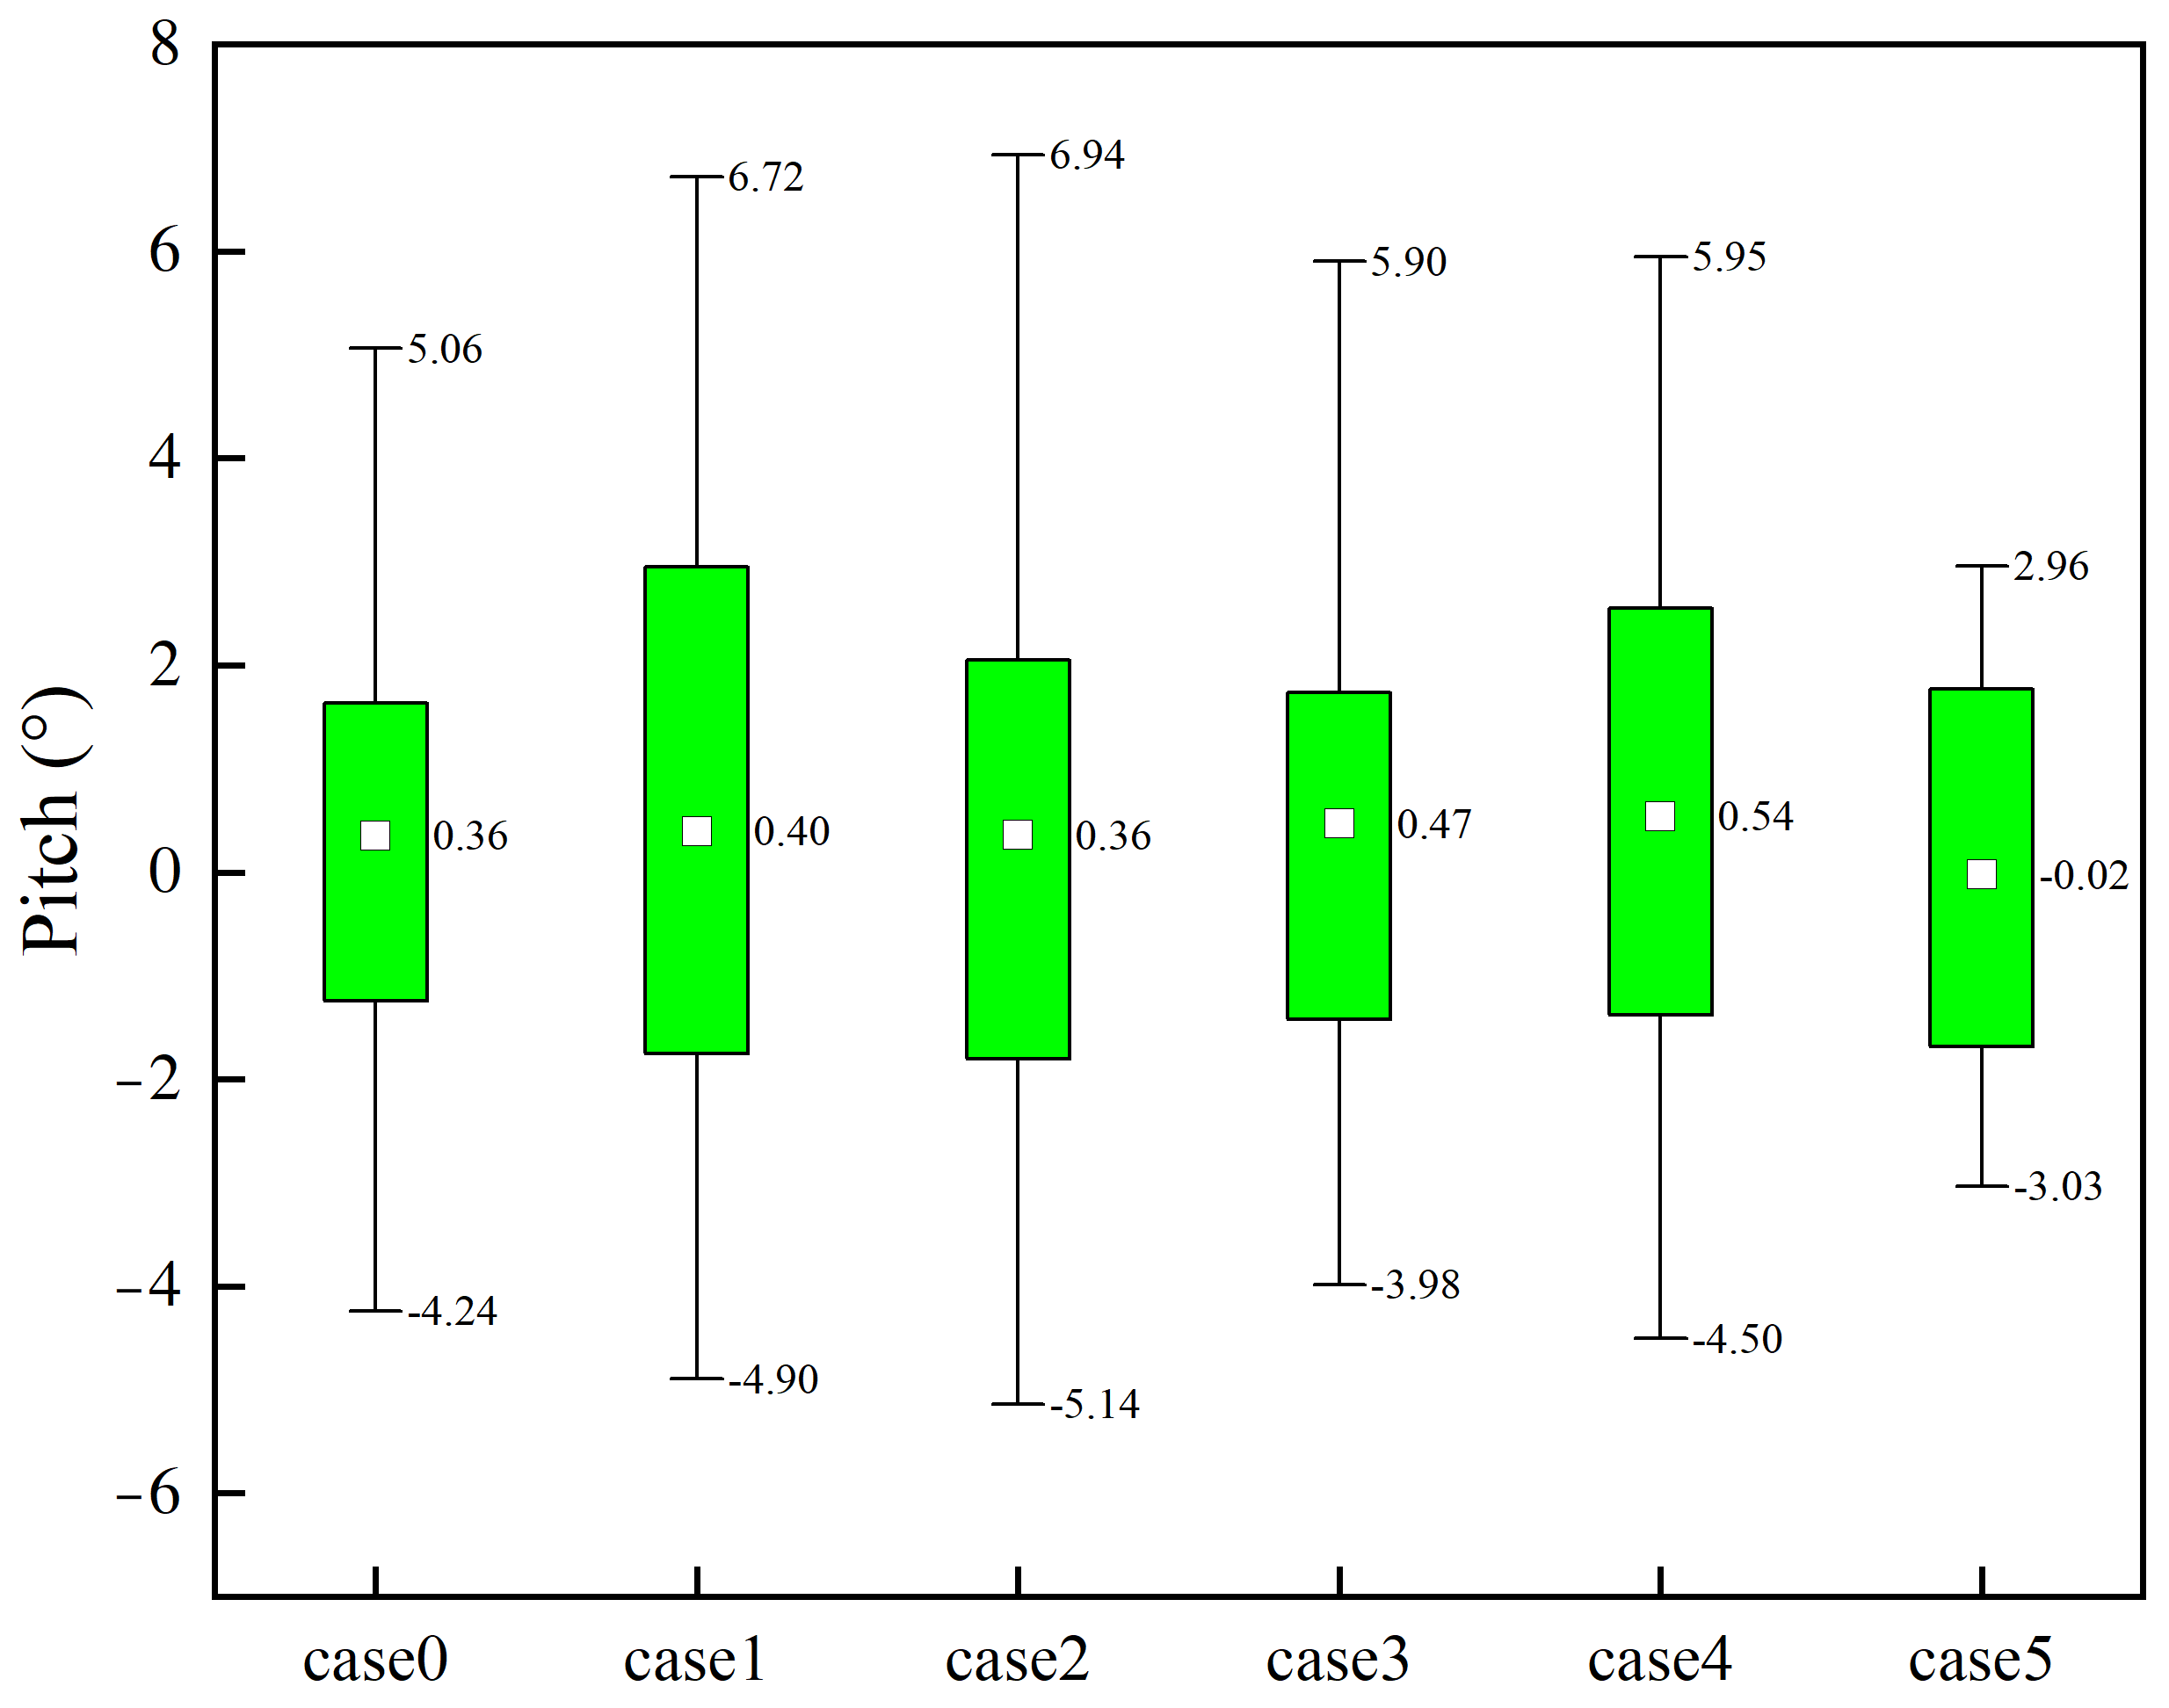
Pitch varied with the wave period in every configuration (Figure 9 and Figure 10). The mean pitch amplitude was 2.021° in case 0 and 2.160–2.599° in cases 1 to 4, an increase of 6.88–28.60%. The standard-length hoods in cases 1 and 2 produced means of 2.597° and 2.599°, respectively; the corresponding values for cases 3 and 4 were 2.160° and 2.366°. Maximum amplitudes in cases 1 to 4 ranged from 3.370° to 4.054°, and only case 3 remained below the case 0 maximum of 3.515°. Case 5 reduced the mean and maximum to 1.532° and 2.998°, 24.20% and 14.71% below case 0, respectively.
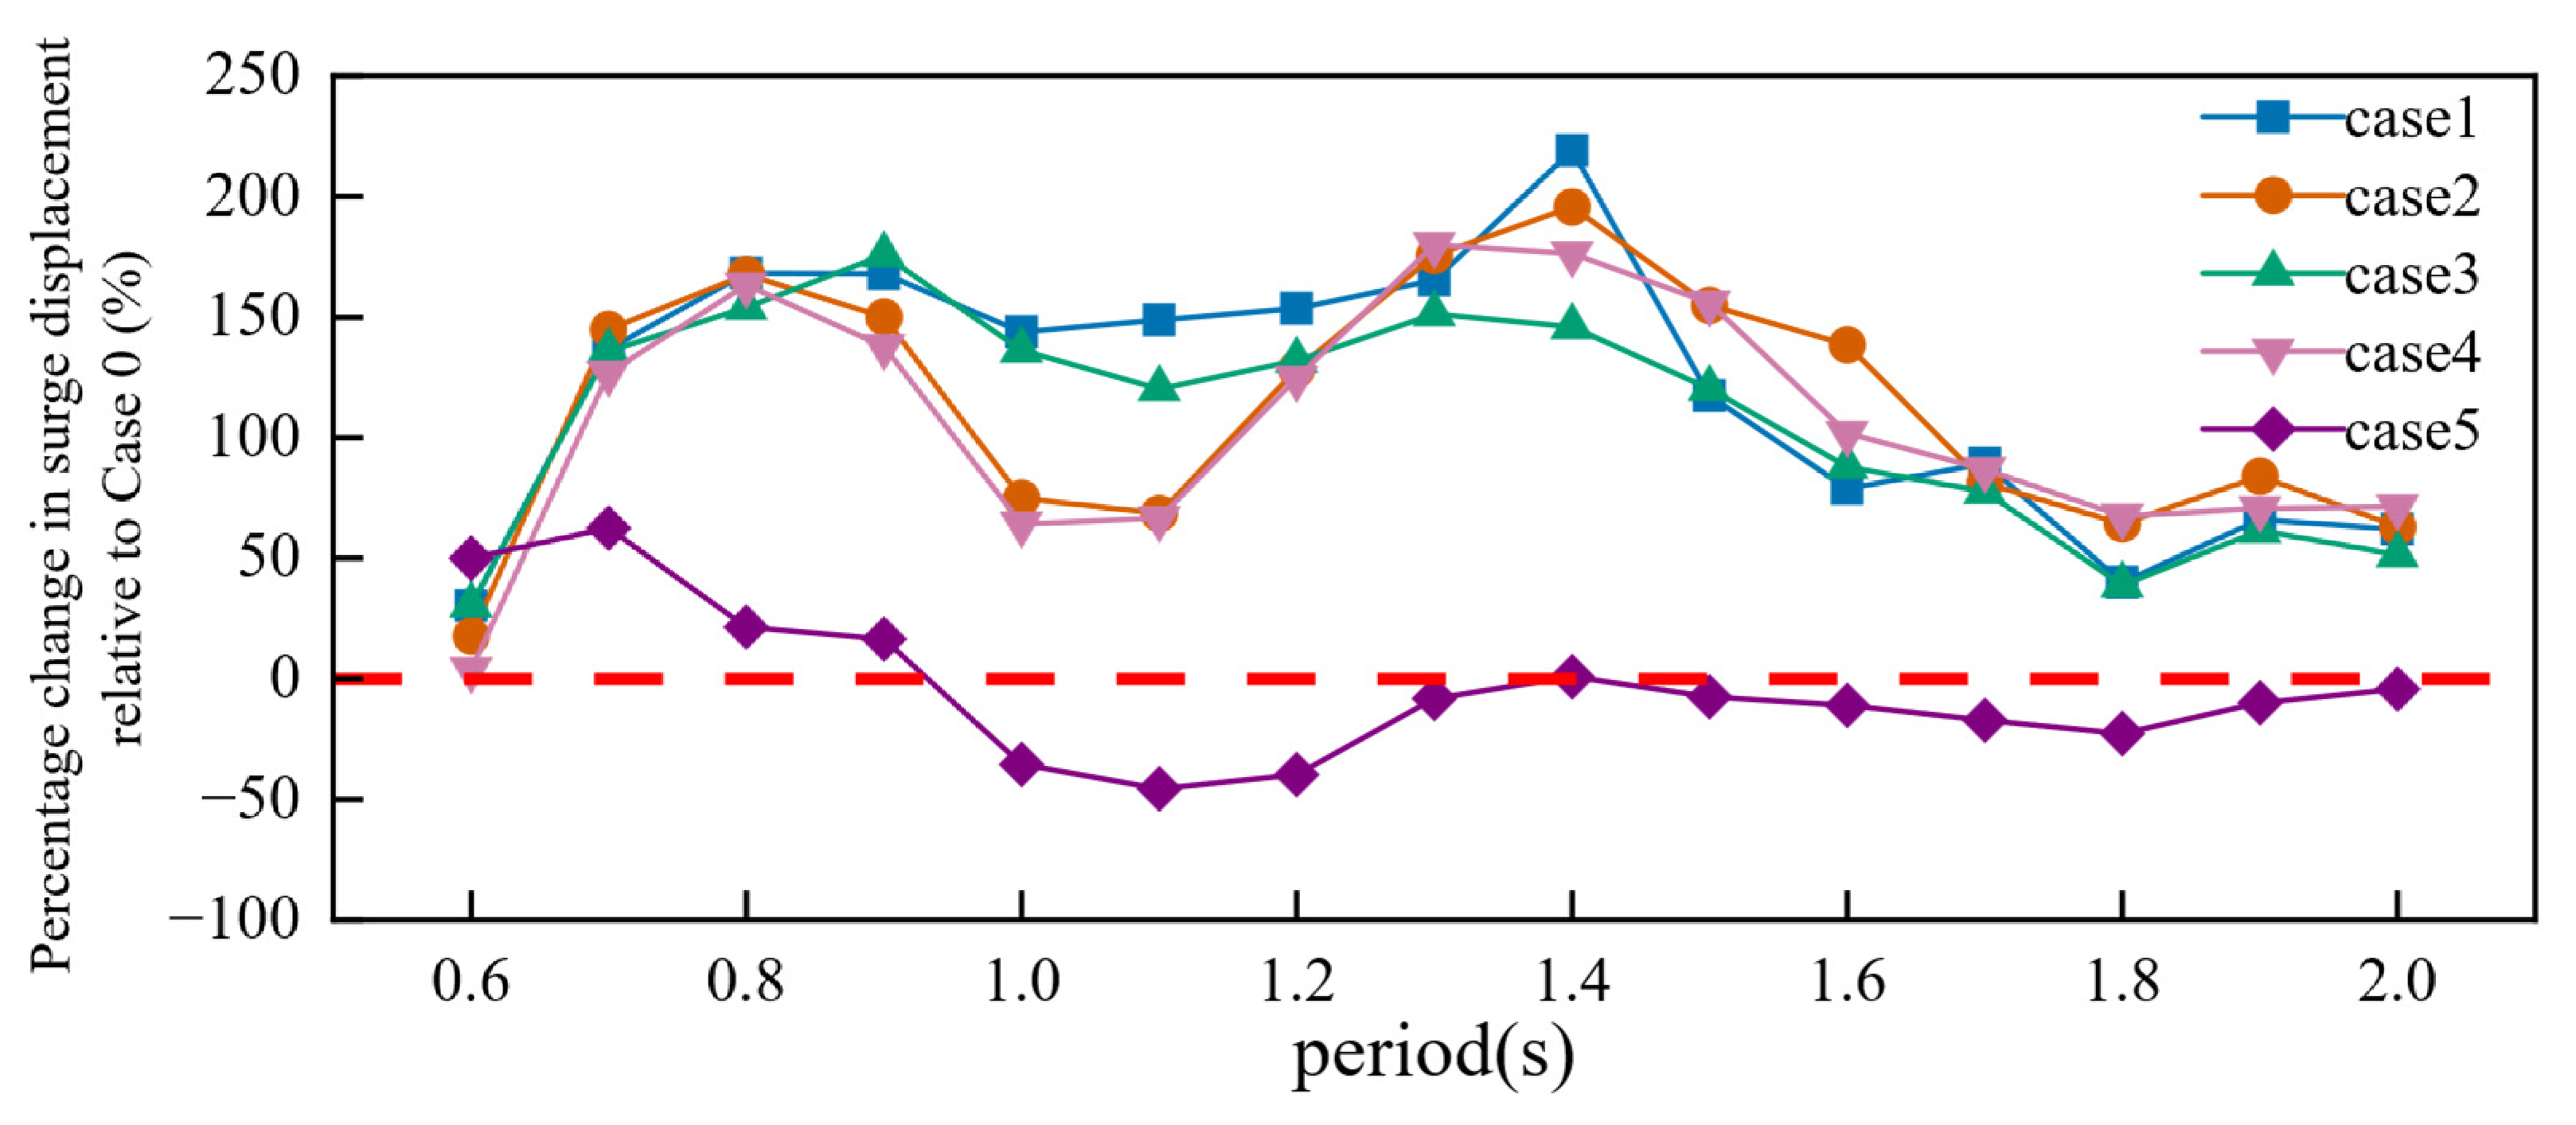
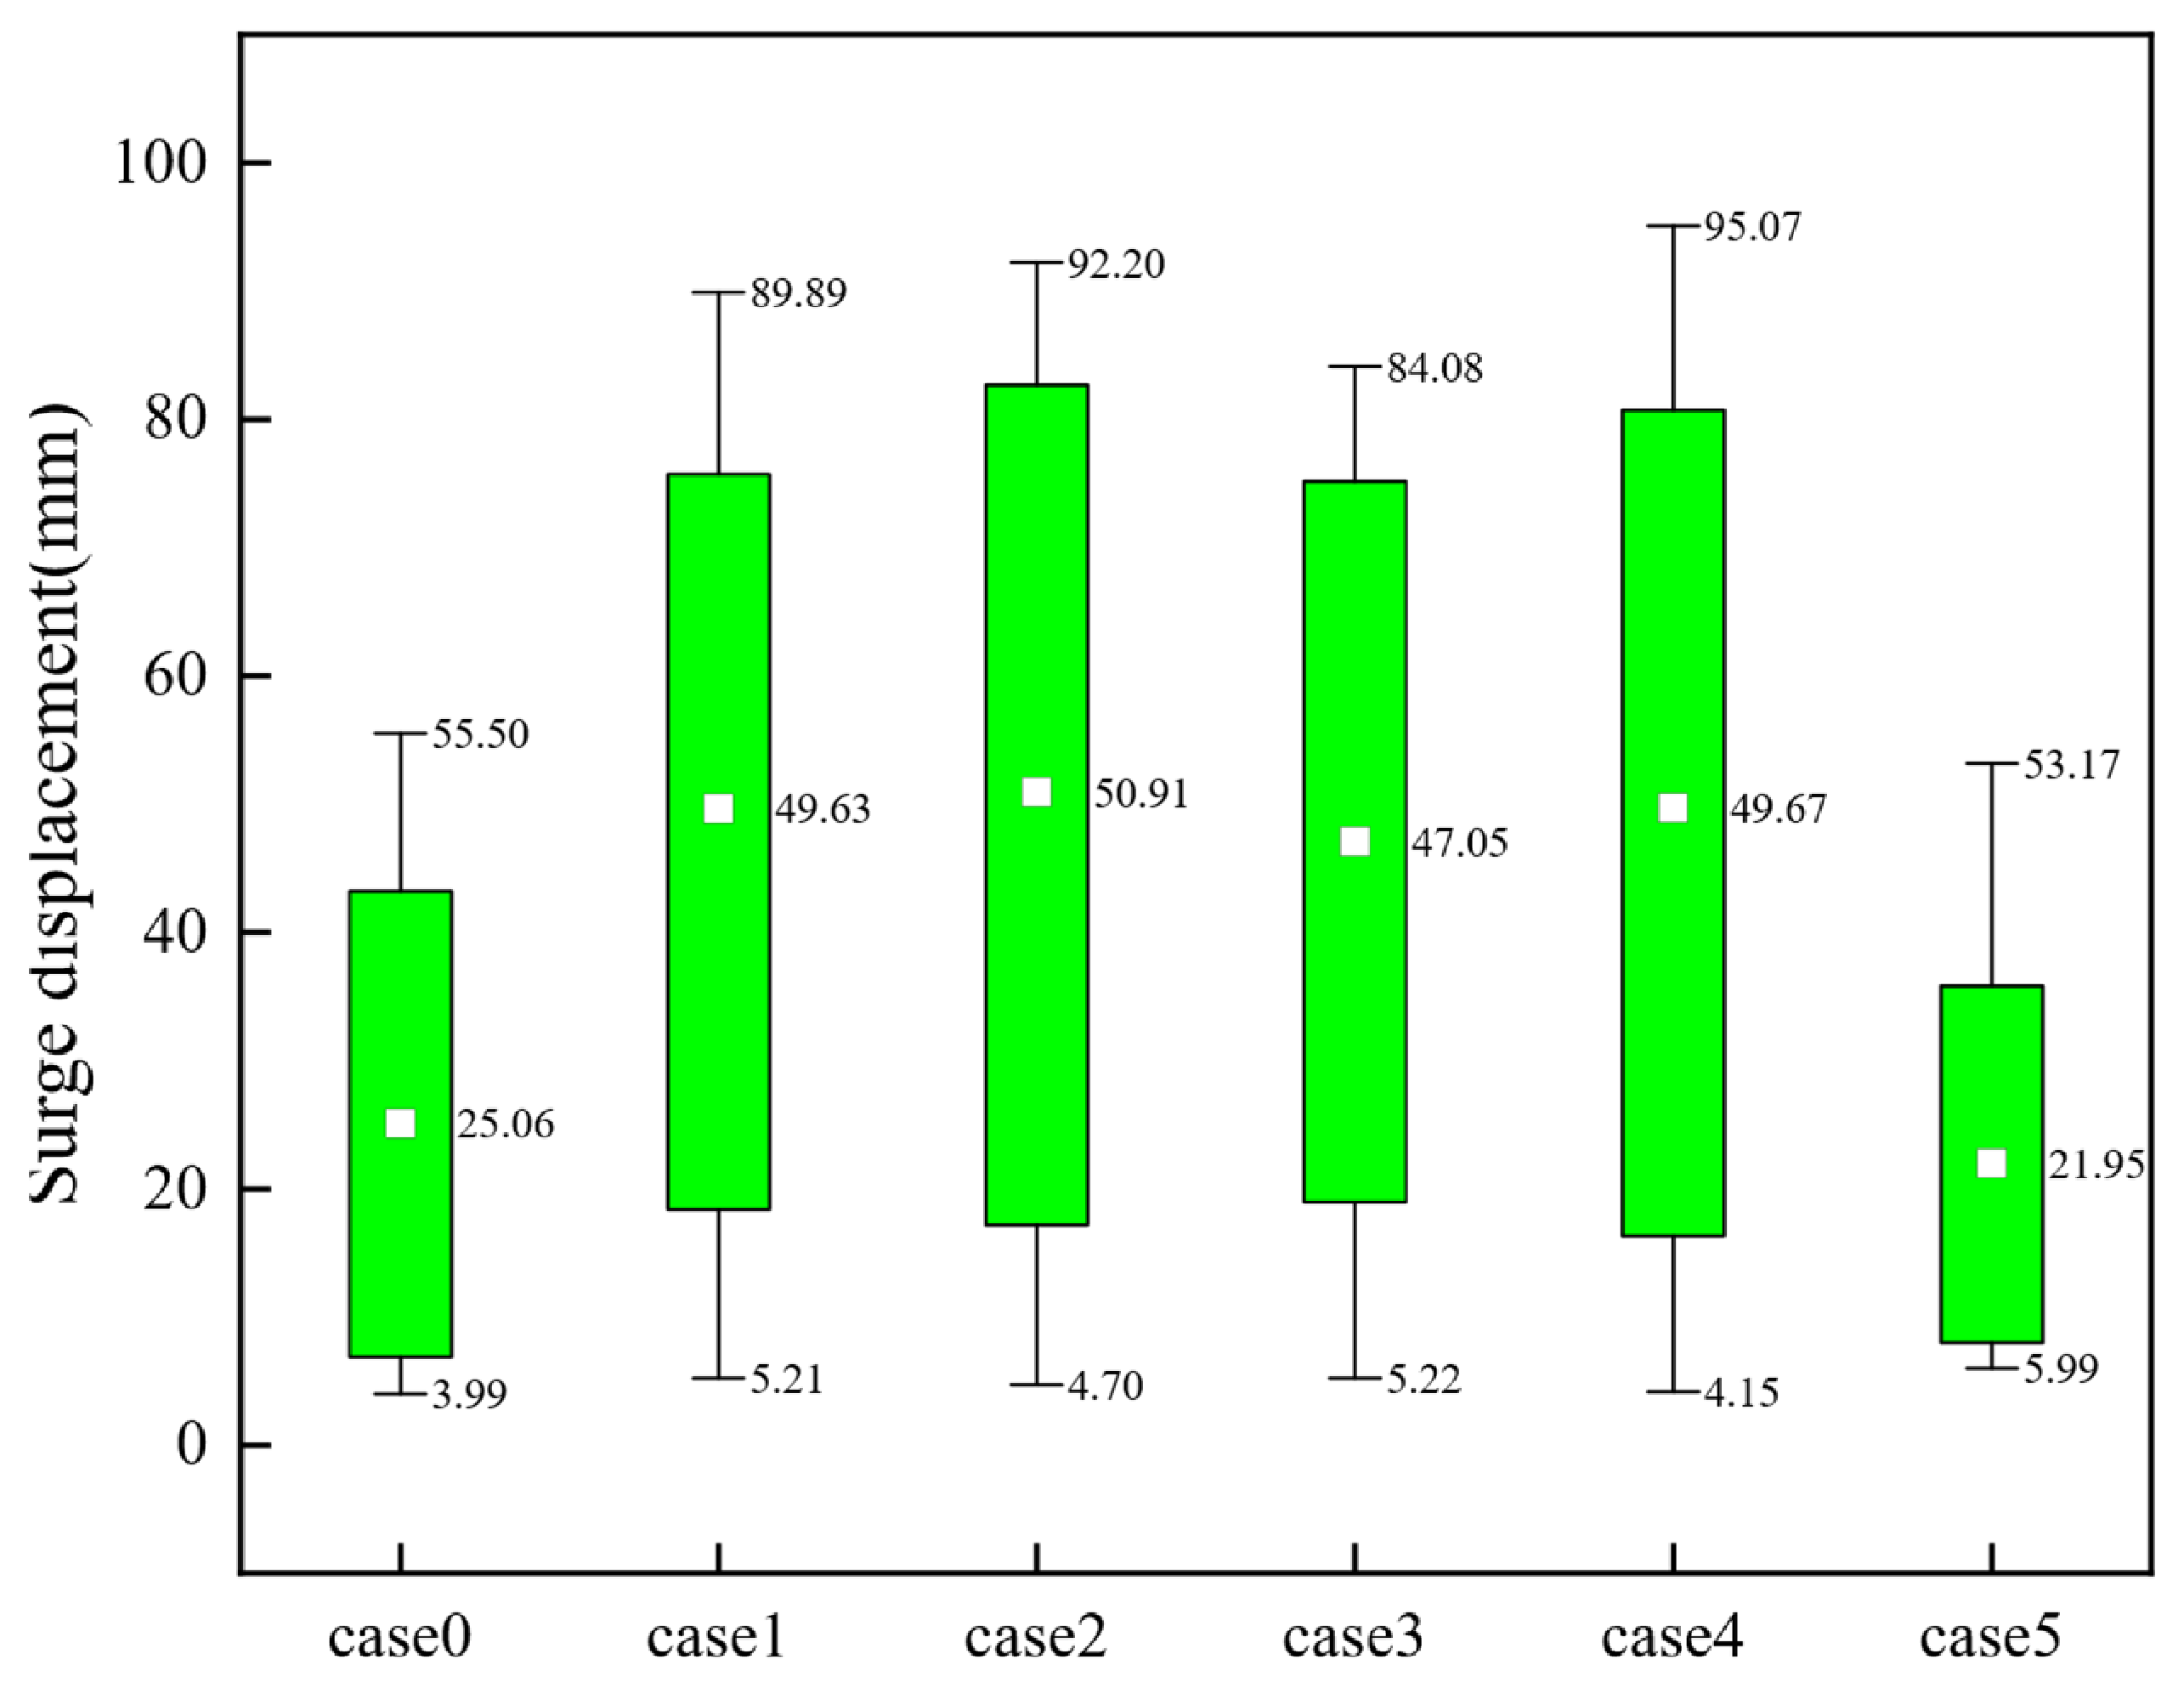
The flow-guiding configurations substantially increased surge (Figure 11 and Figure 12). Mean displacements of 47.048 to 50.906 mm in cases 1 to 4 were 87.71–103.10% above the 25.064 mm recorded for case 0. Their maxima were 84.078–95.071 mm, 51.49–71.30% above the case 0 maximum of 55.501 mm. Among the four flow-guiding configurations, case 3 showed the lowest observed mean and maximum surge values in the present tests, whereas case 4 showed the largest observed maximum. The increase is consistent with a larger wave-facing projected area and altered horizontal load transfer. Case 5 reduced the mean surge to 21.954 mm (12.41%) and the maximum to 53.170 mm (4.20%), which was a smaller improvement than that observed for pitch or heave.
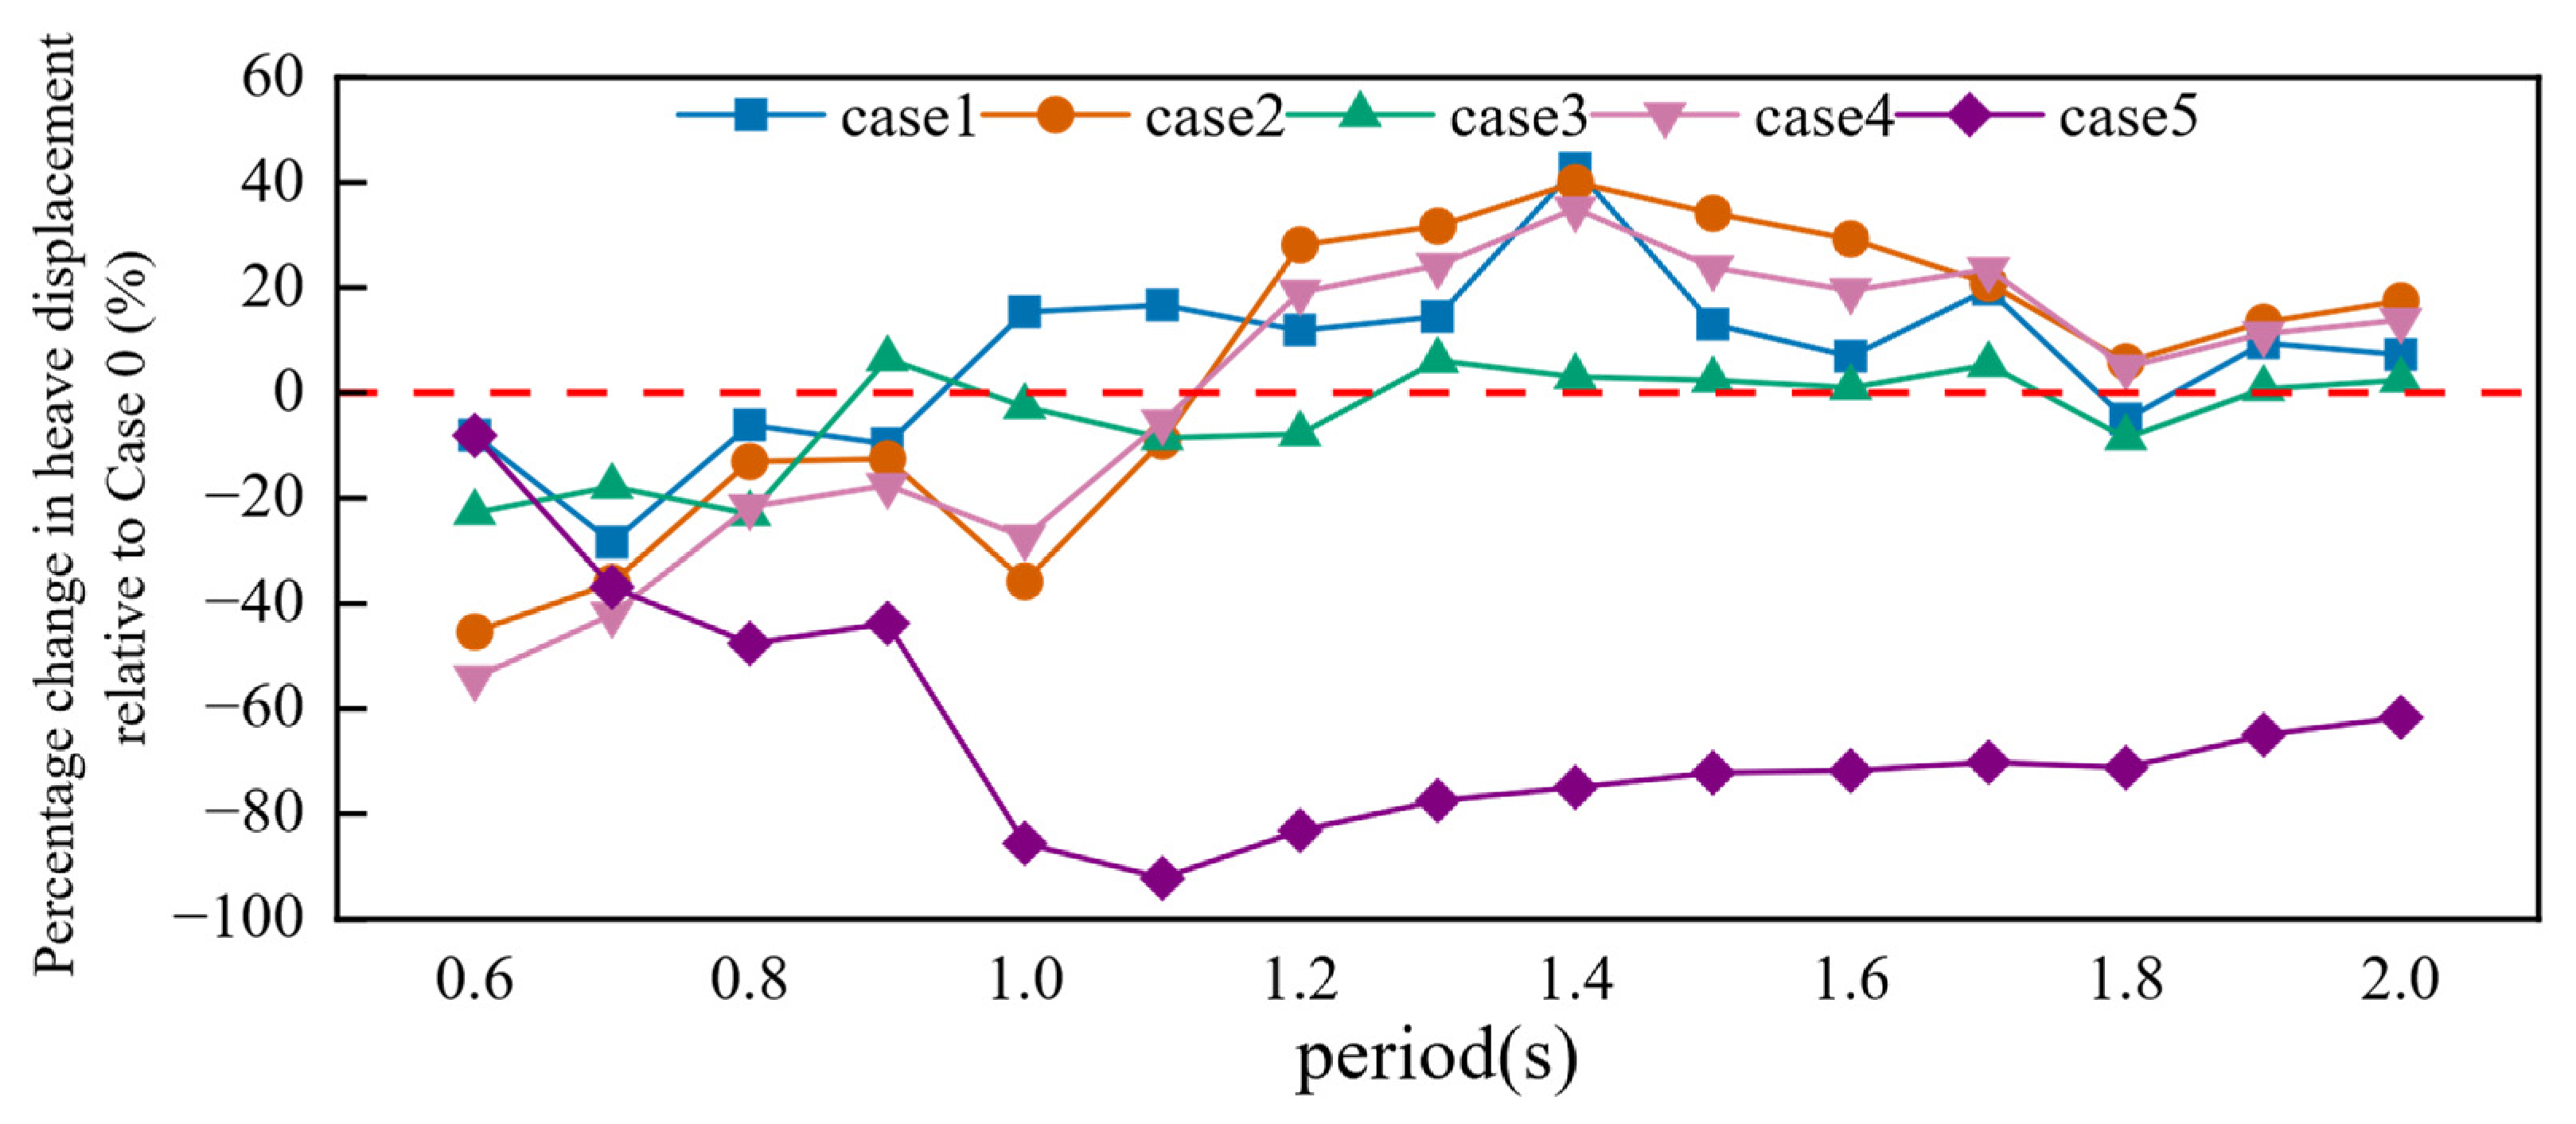
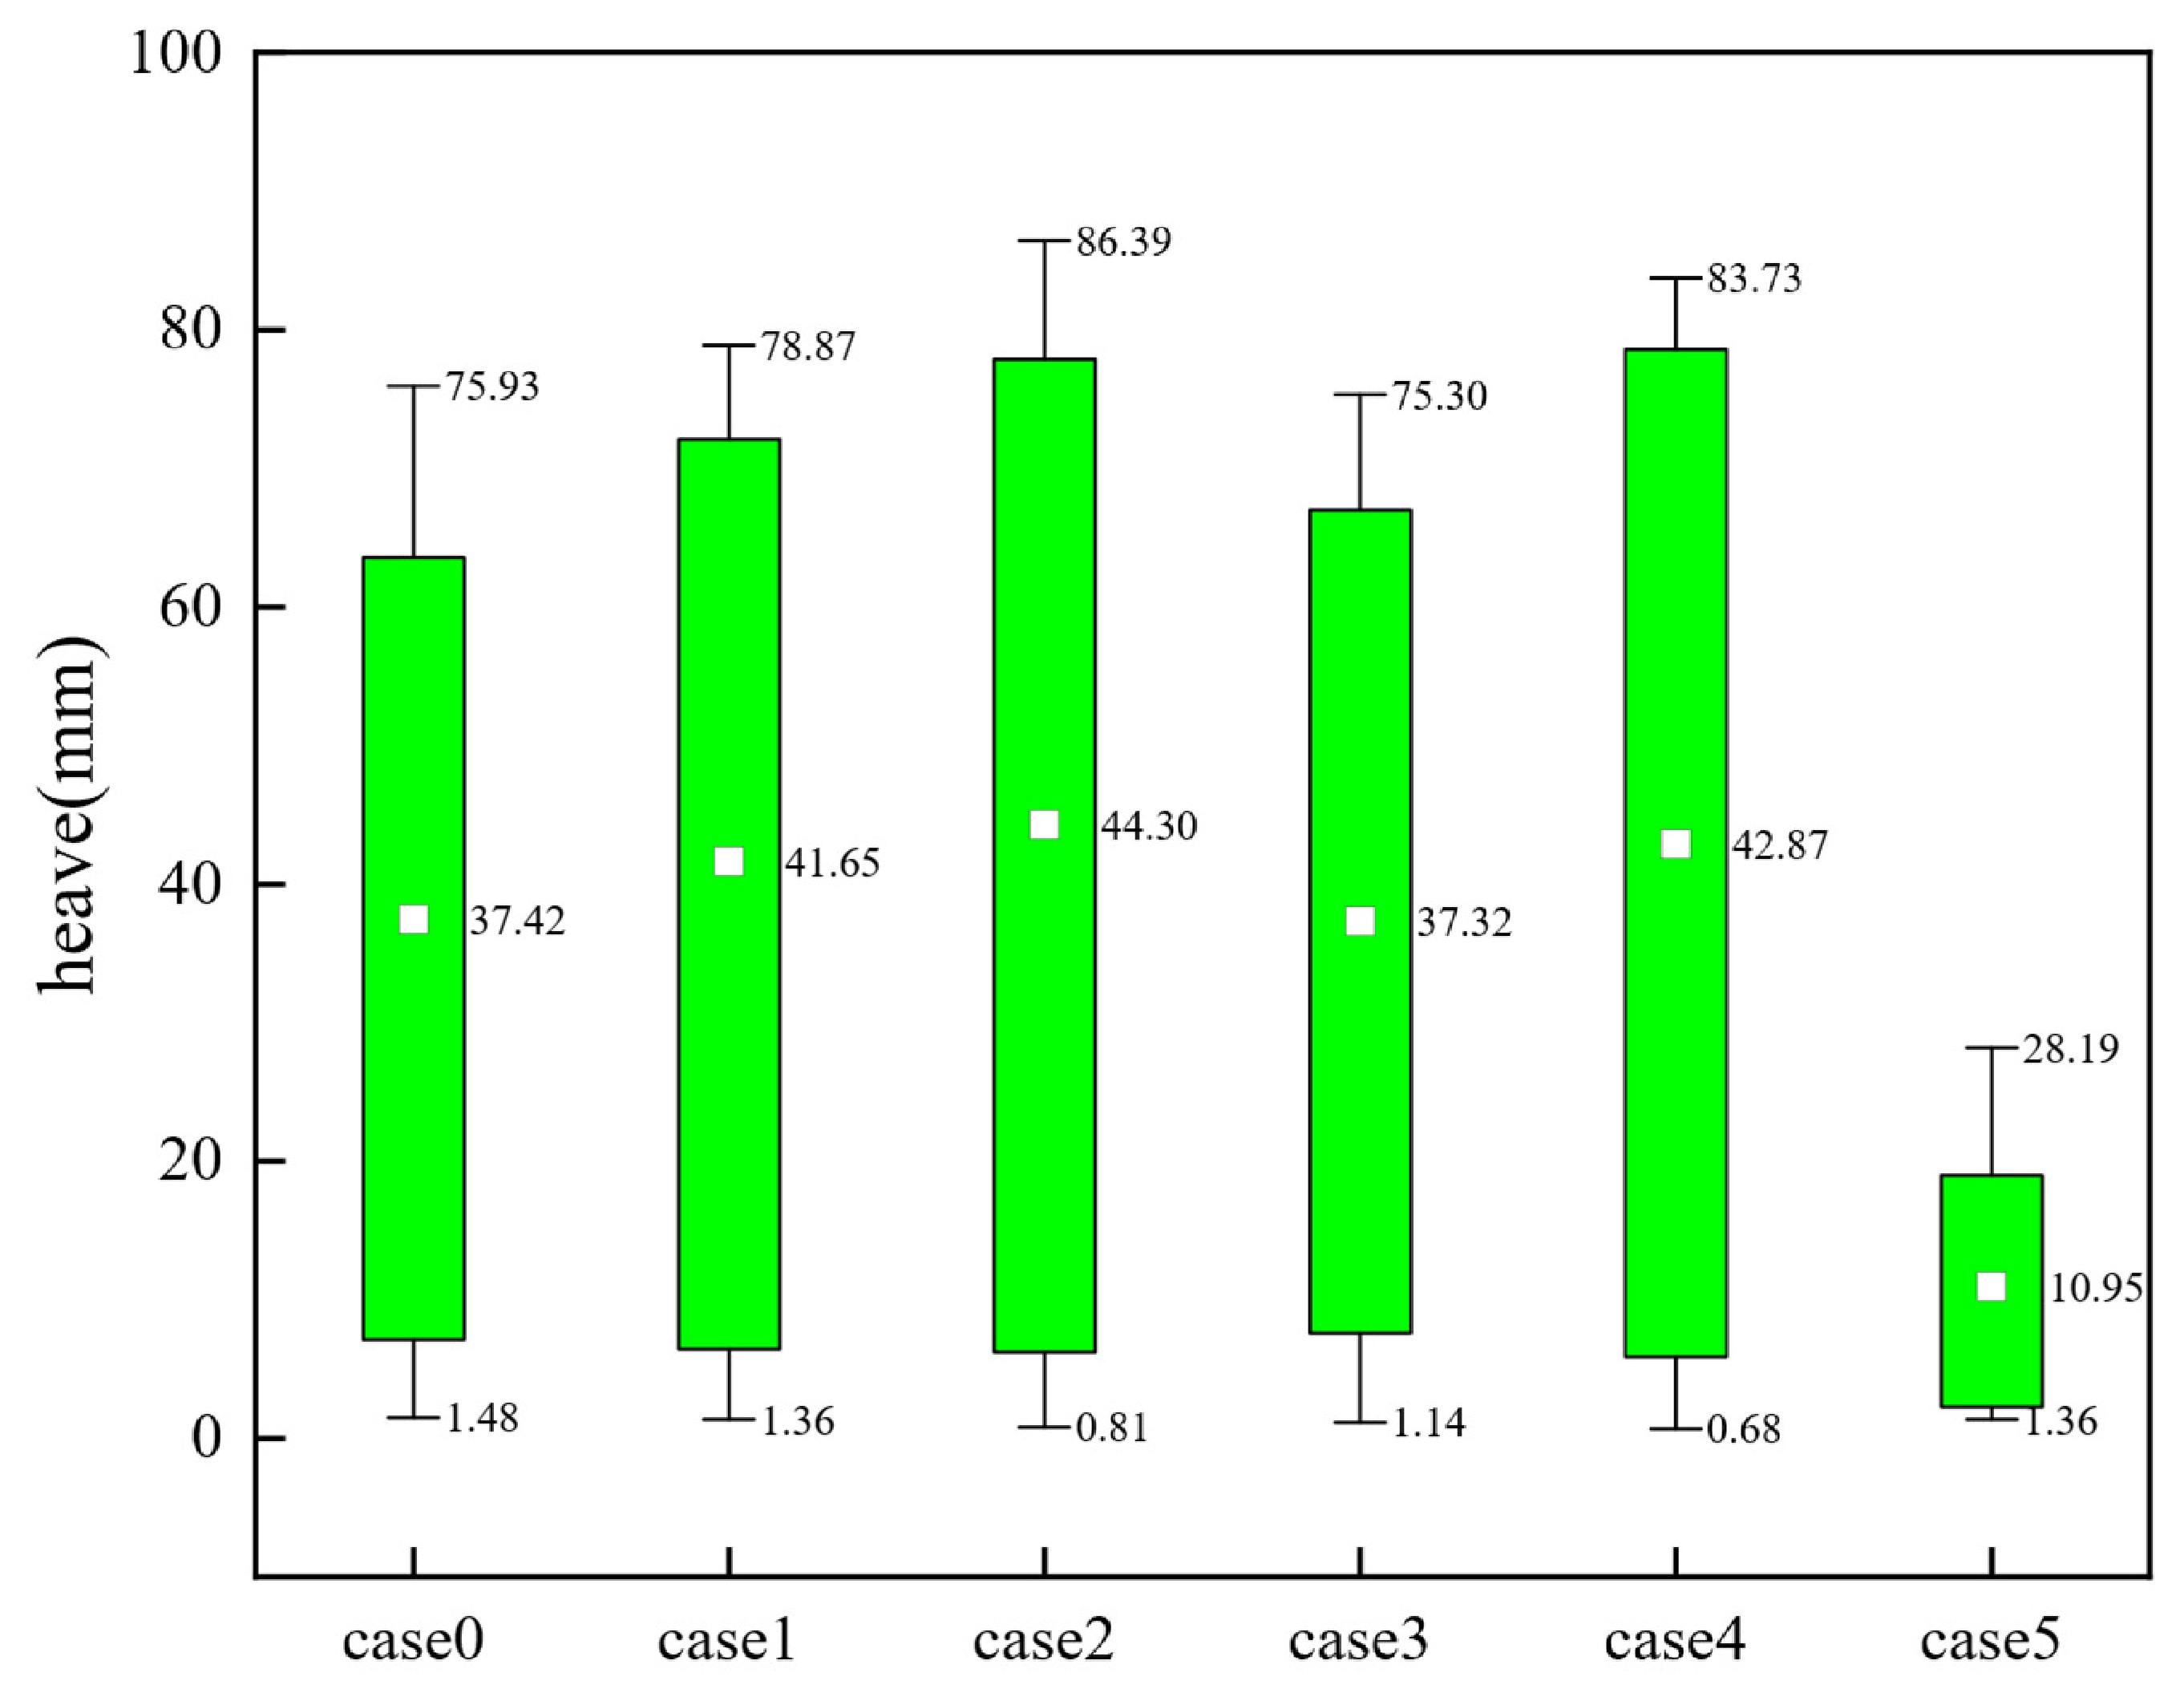
Heave showed the greatest improvement for case 5 (Figure 13 and Figure 14). Mean displacements in cases 1, 2, and 4 were 41.649 to 44.295 mm, 11.29 to 18.36% above the case 0 value of 37.425 mm; their maxima of 78.871 to 86.395 mm were 3.88 to 13.79% higher. Case 3 remained close to case 0, with a mean of 37.320 mm and a maximum of 75.304 mm. Case 5 reduced the mean to 10.949 mm and the maximum to 28.193 mm, decreases of 70.74% and 62.87%, respectively. The larger submerged netting area and changes in hydrodynamic damping and internal water motion may contribute to this response.
Cases 1 to 4 did not improve all three platform motions: surge increased consistently, and mean pitch and heave also rose in several configurations. Case 3 showed relatively lower overall motion within this group under the tested conditions. Case 5 alone reduced both the mean and maximum values of pitch, surge, and heave. The reduction was greatest for heave, followed by pitch and surge. Any engineering advantage must still be judged alongside mooring demand and the underlying hydrodynamic coefficients.

3.3. Mooring-Line Tension

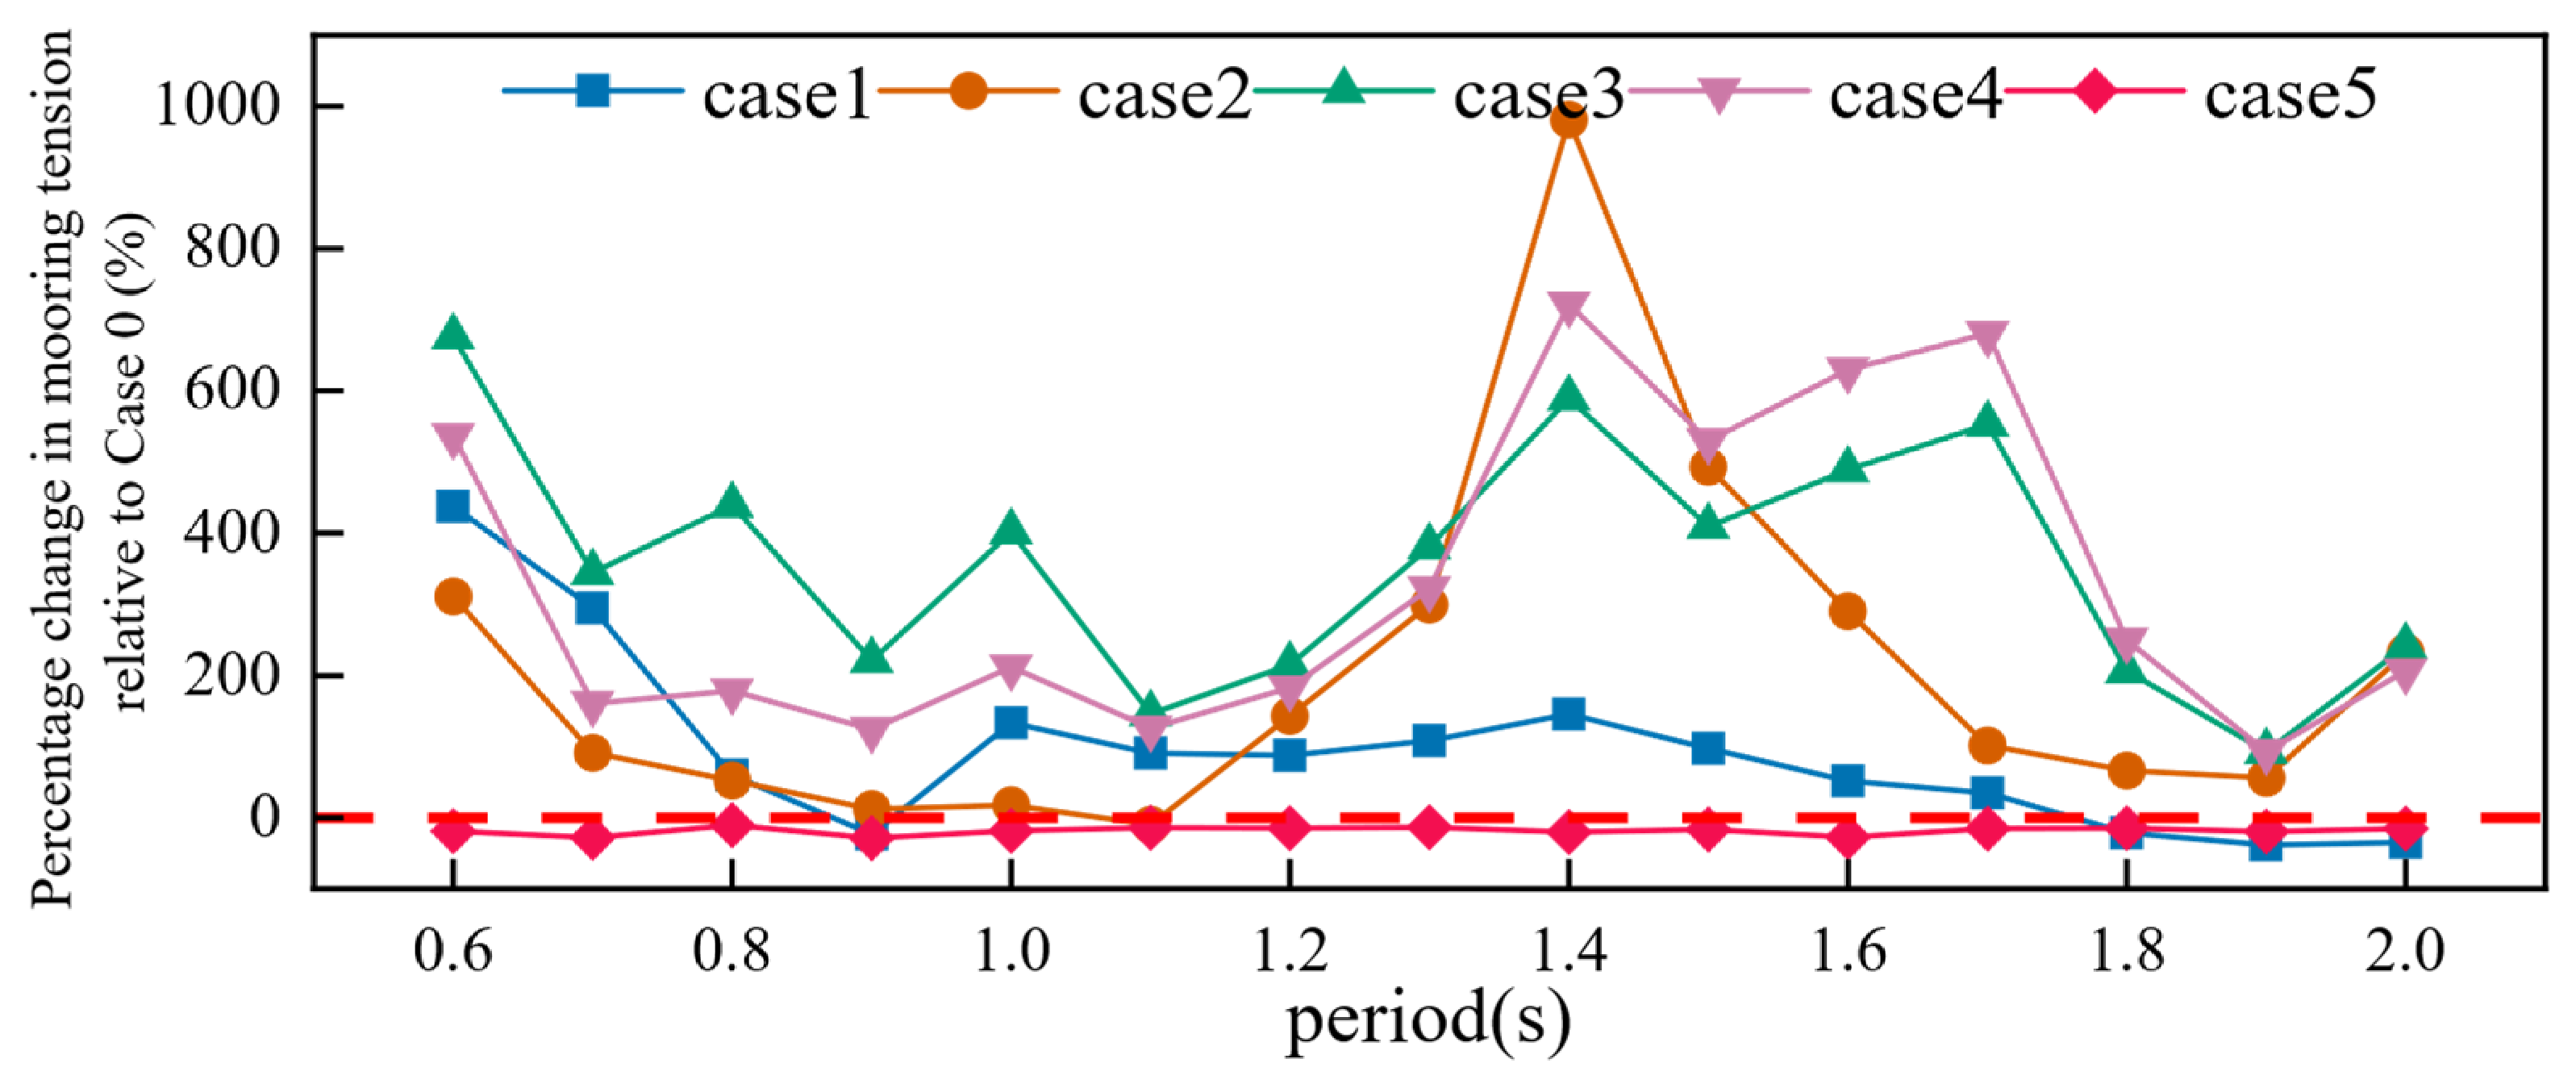
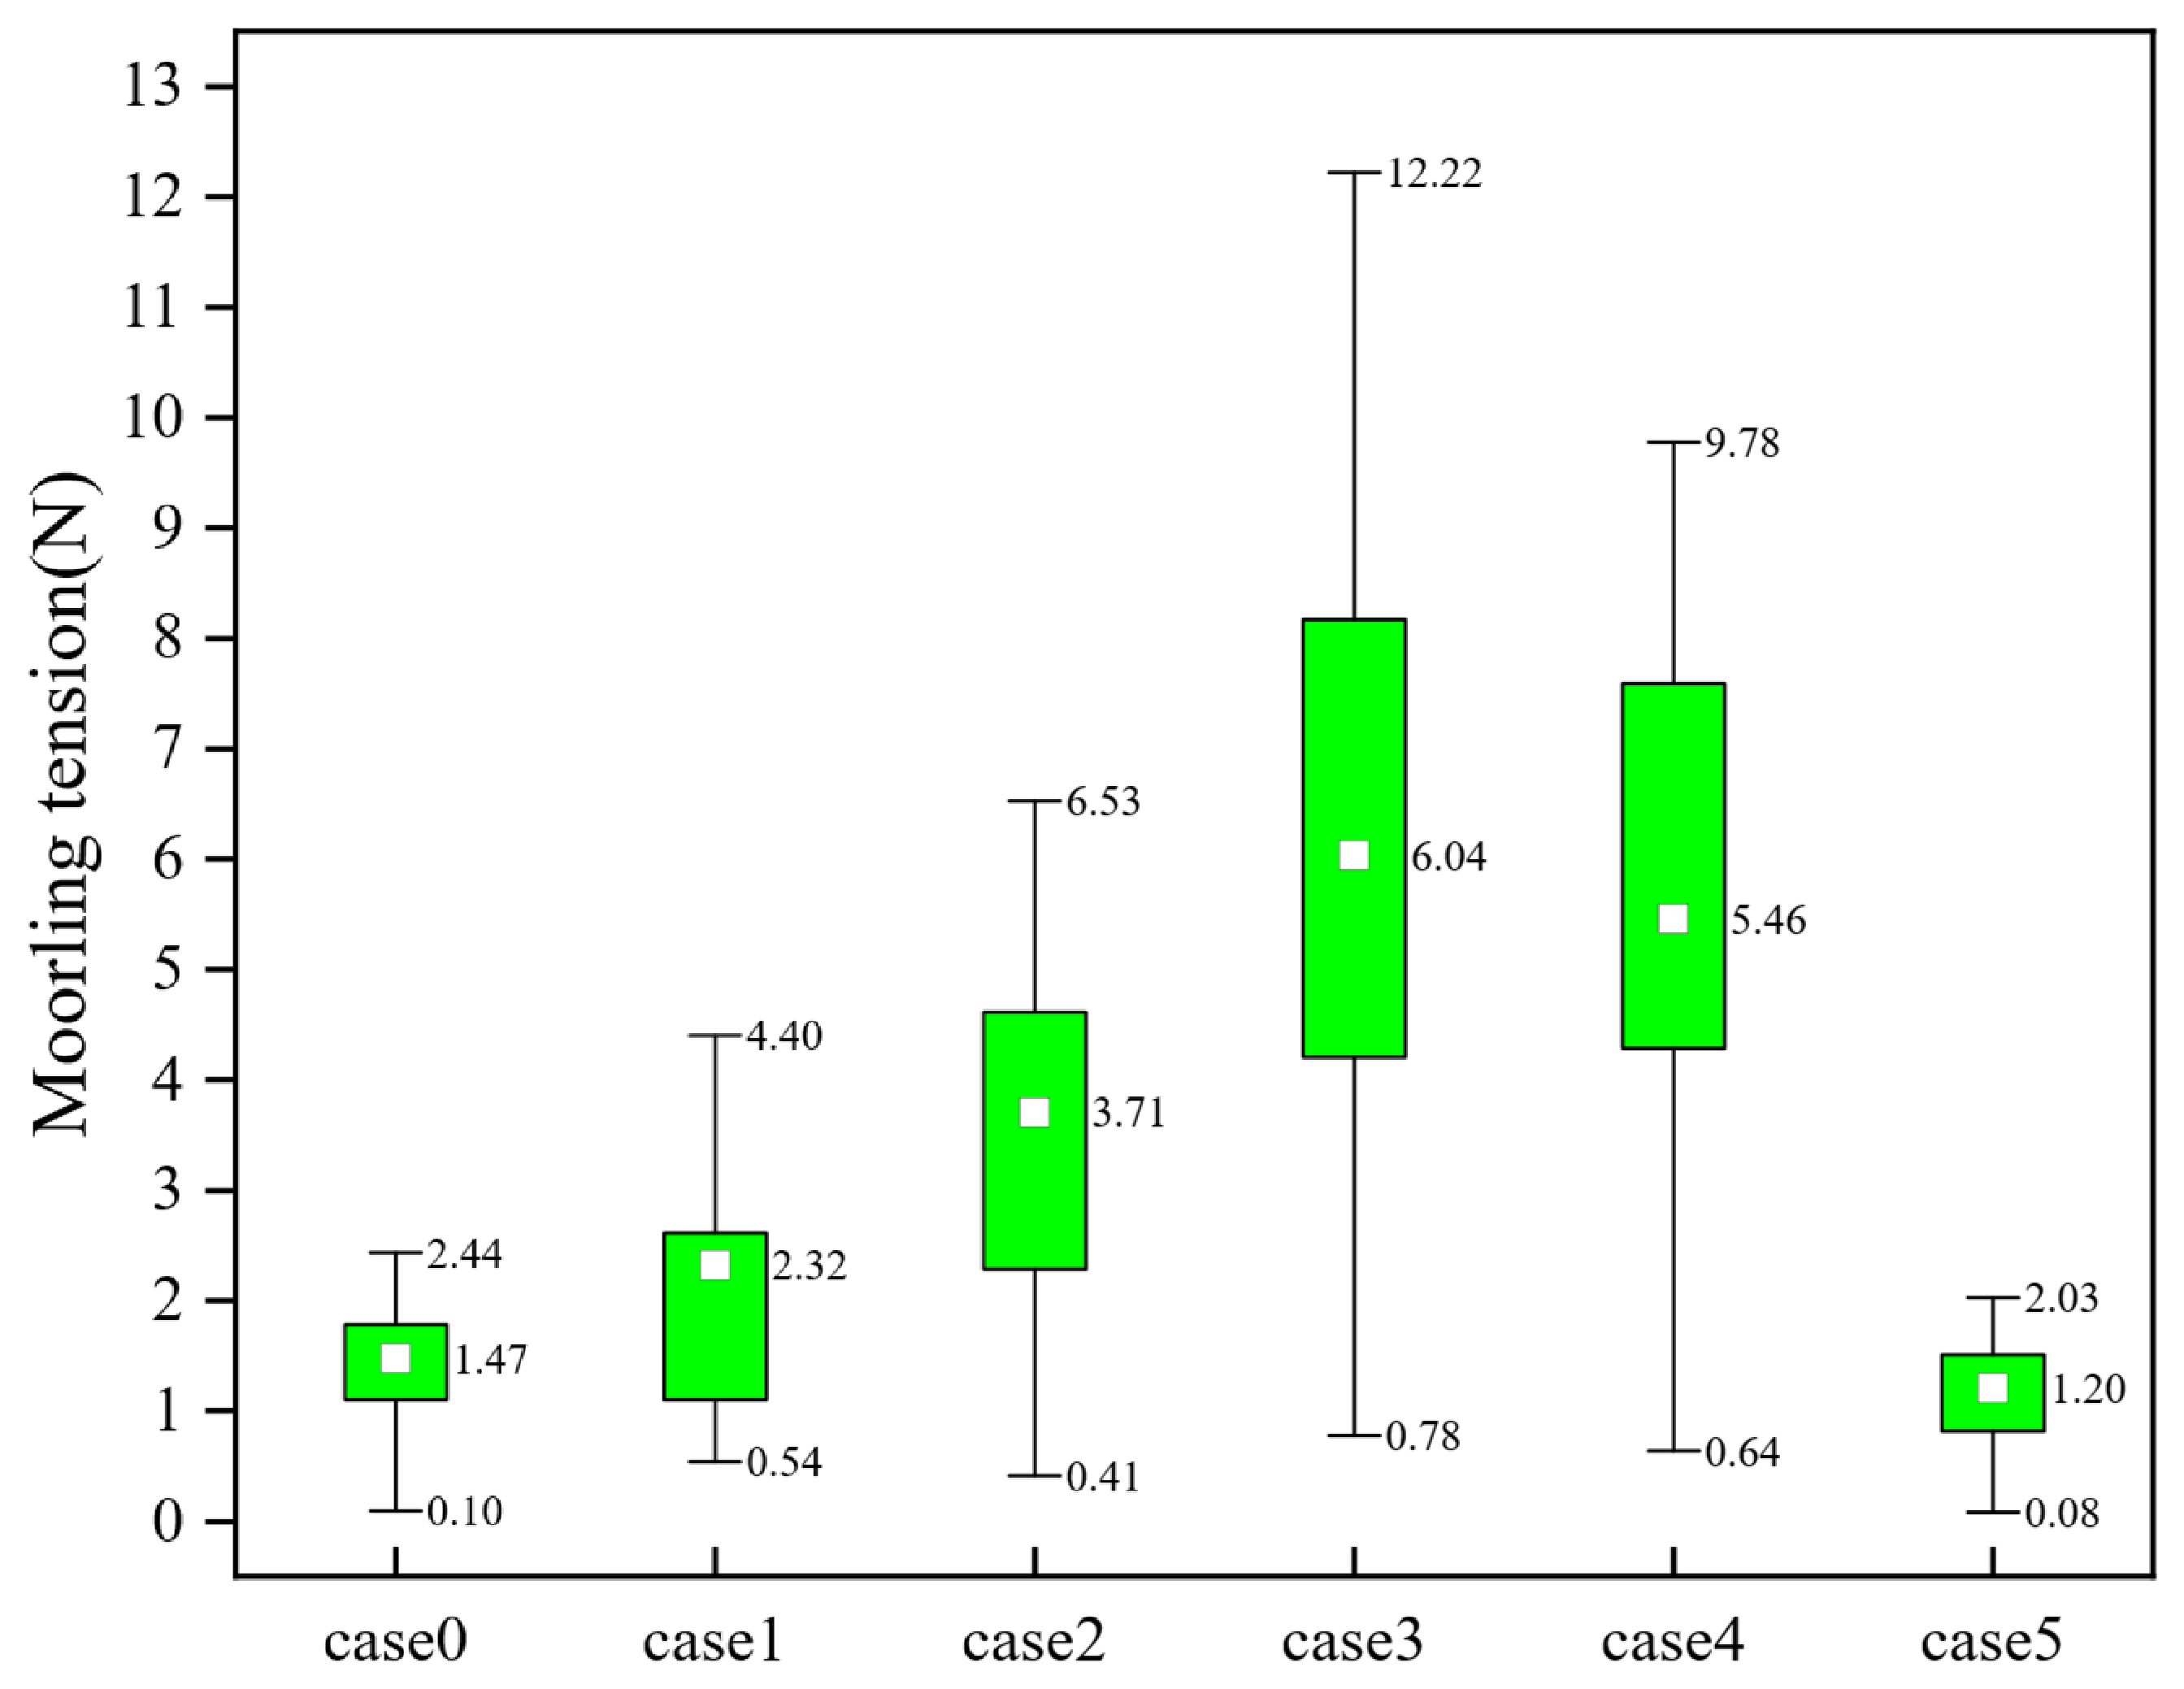
Mooring-line tension measures the load transferred from wave-induced platform motion and hydrodynamic forces to the station-keeping system. Figure 15 shows the percentage change in cases 1 to 5 relative to case 0, and Figure 16 summarizes the tension distributions across all tested periods.
The effect of cases 1 to 4 on mooring-line tension depended strongly on period (Figure 15). Case 1 reduced tension by 21.67–38.37% at periods of 0.9, 1.8, 1.9, and 2.0 s but increased it at the other periods. Case 2 produced a 9.51% reduction only at 1.1 s. Cases 3 and 4 increased tension throughout the tested range by 93.12–675.88% and 92.89–722.33%, respectively. Because the case 0 tension at 0.6 s was only 0.100 N, a small absolute difference produced a large percentage change at that period. Case 5 reduced tension by 10.35 to 28.63% at every period, with the largest reduction at 0.9 s.
Mean mooring-line tension was 1.472 N in case 0 (Figure 16). The means for cases 1 to 4 were 2.320, 3.706, 6.036, and 5.459 N, corresponding to increases of 57.67%, 151.79%, 310.16%, and 270.92%, with case 3 being the highest. The maximum for case 0 was 2.839 N at 0.9 s. Maxima in cases 1 to 4 ranged from 5.692 to 12.219 N, 100.48 to 330.41% above case 0, and again peaked in case 3. Increased wave-facing area, altered load transfer, and the larger platform motions observed in some configurations probably contributed to this penalty. Case 5 showed the lowest observed mean and maximum values, 1.202 and 2.026 N, representing reductions of 18.36% and 28.63%. It was the only configuration that reduced tension at every period.

3.4. Numerical Hydrodynamic Characteristics

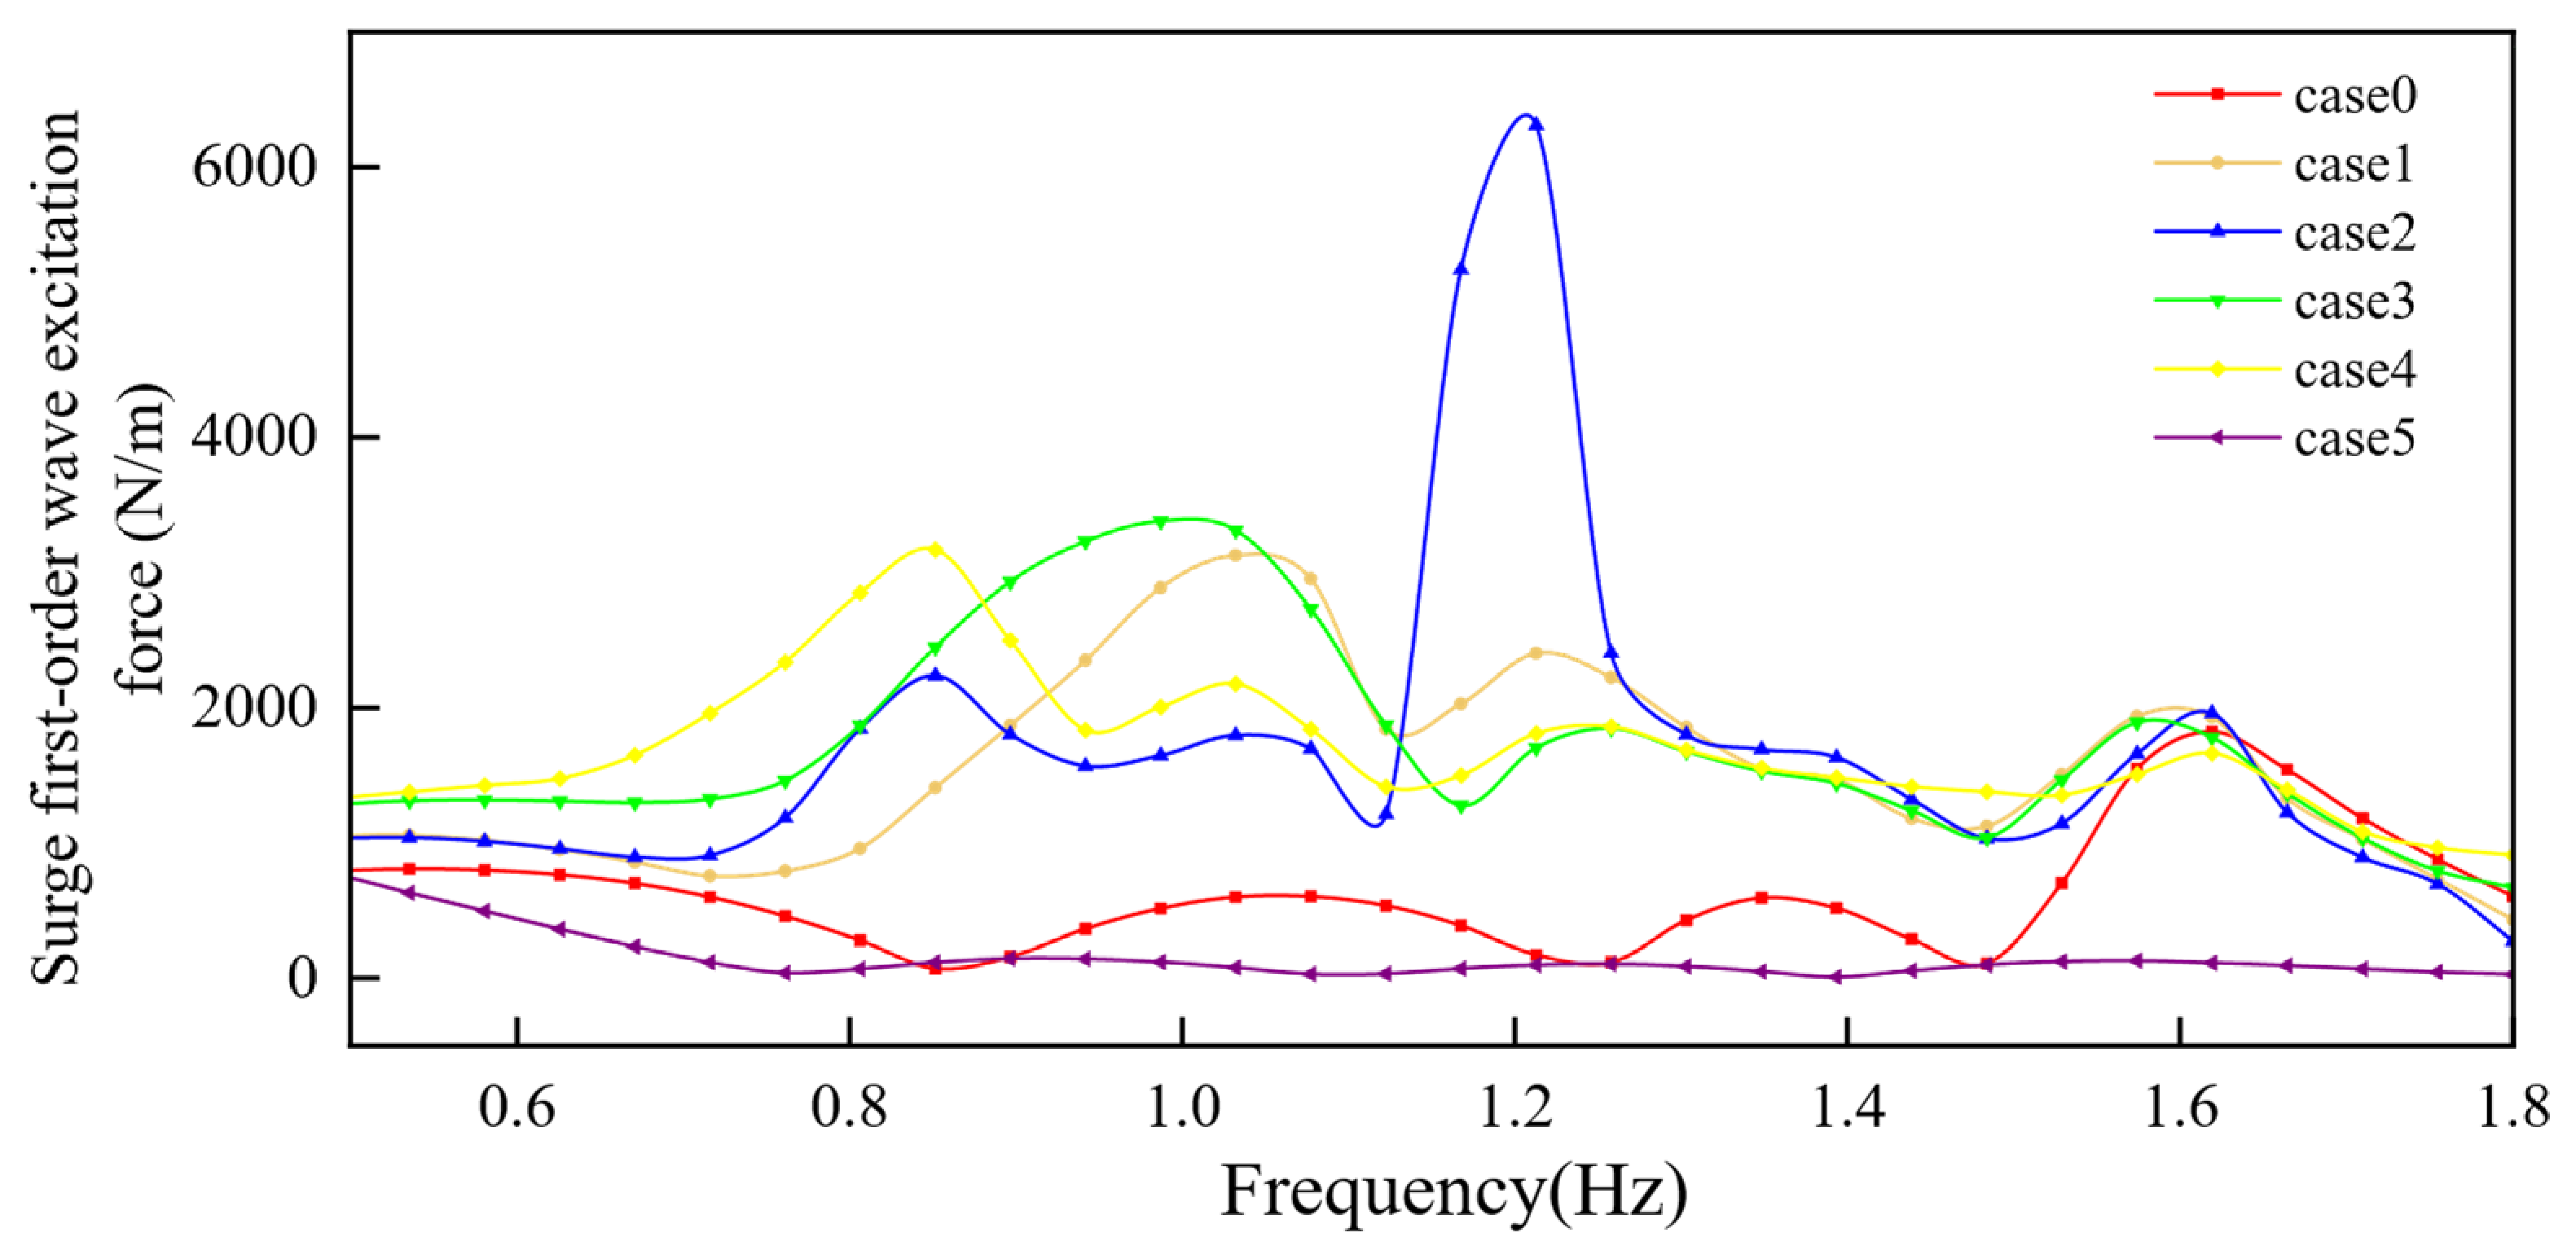
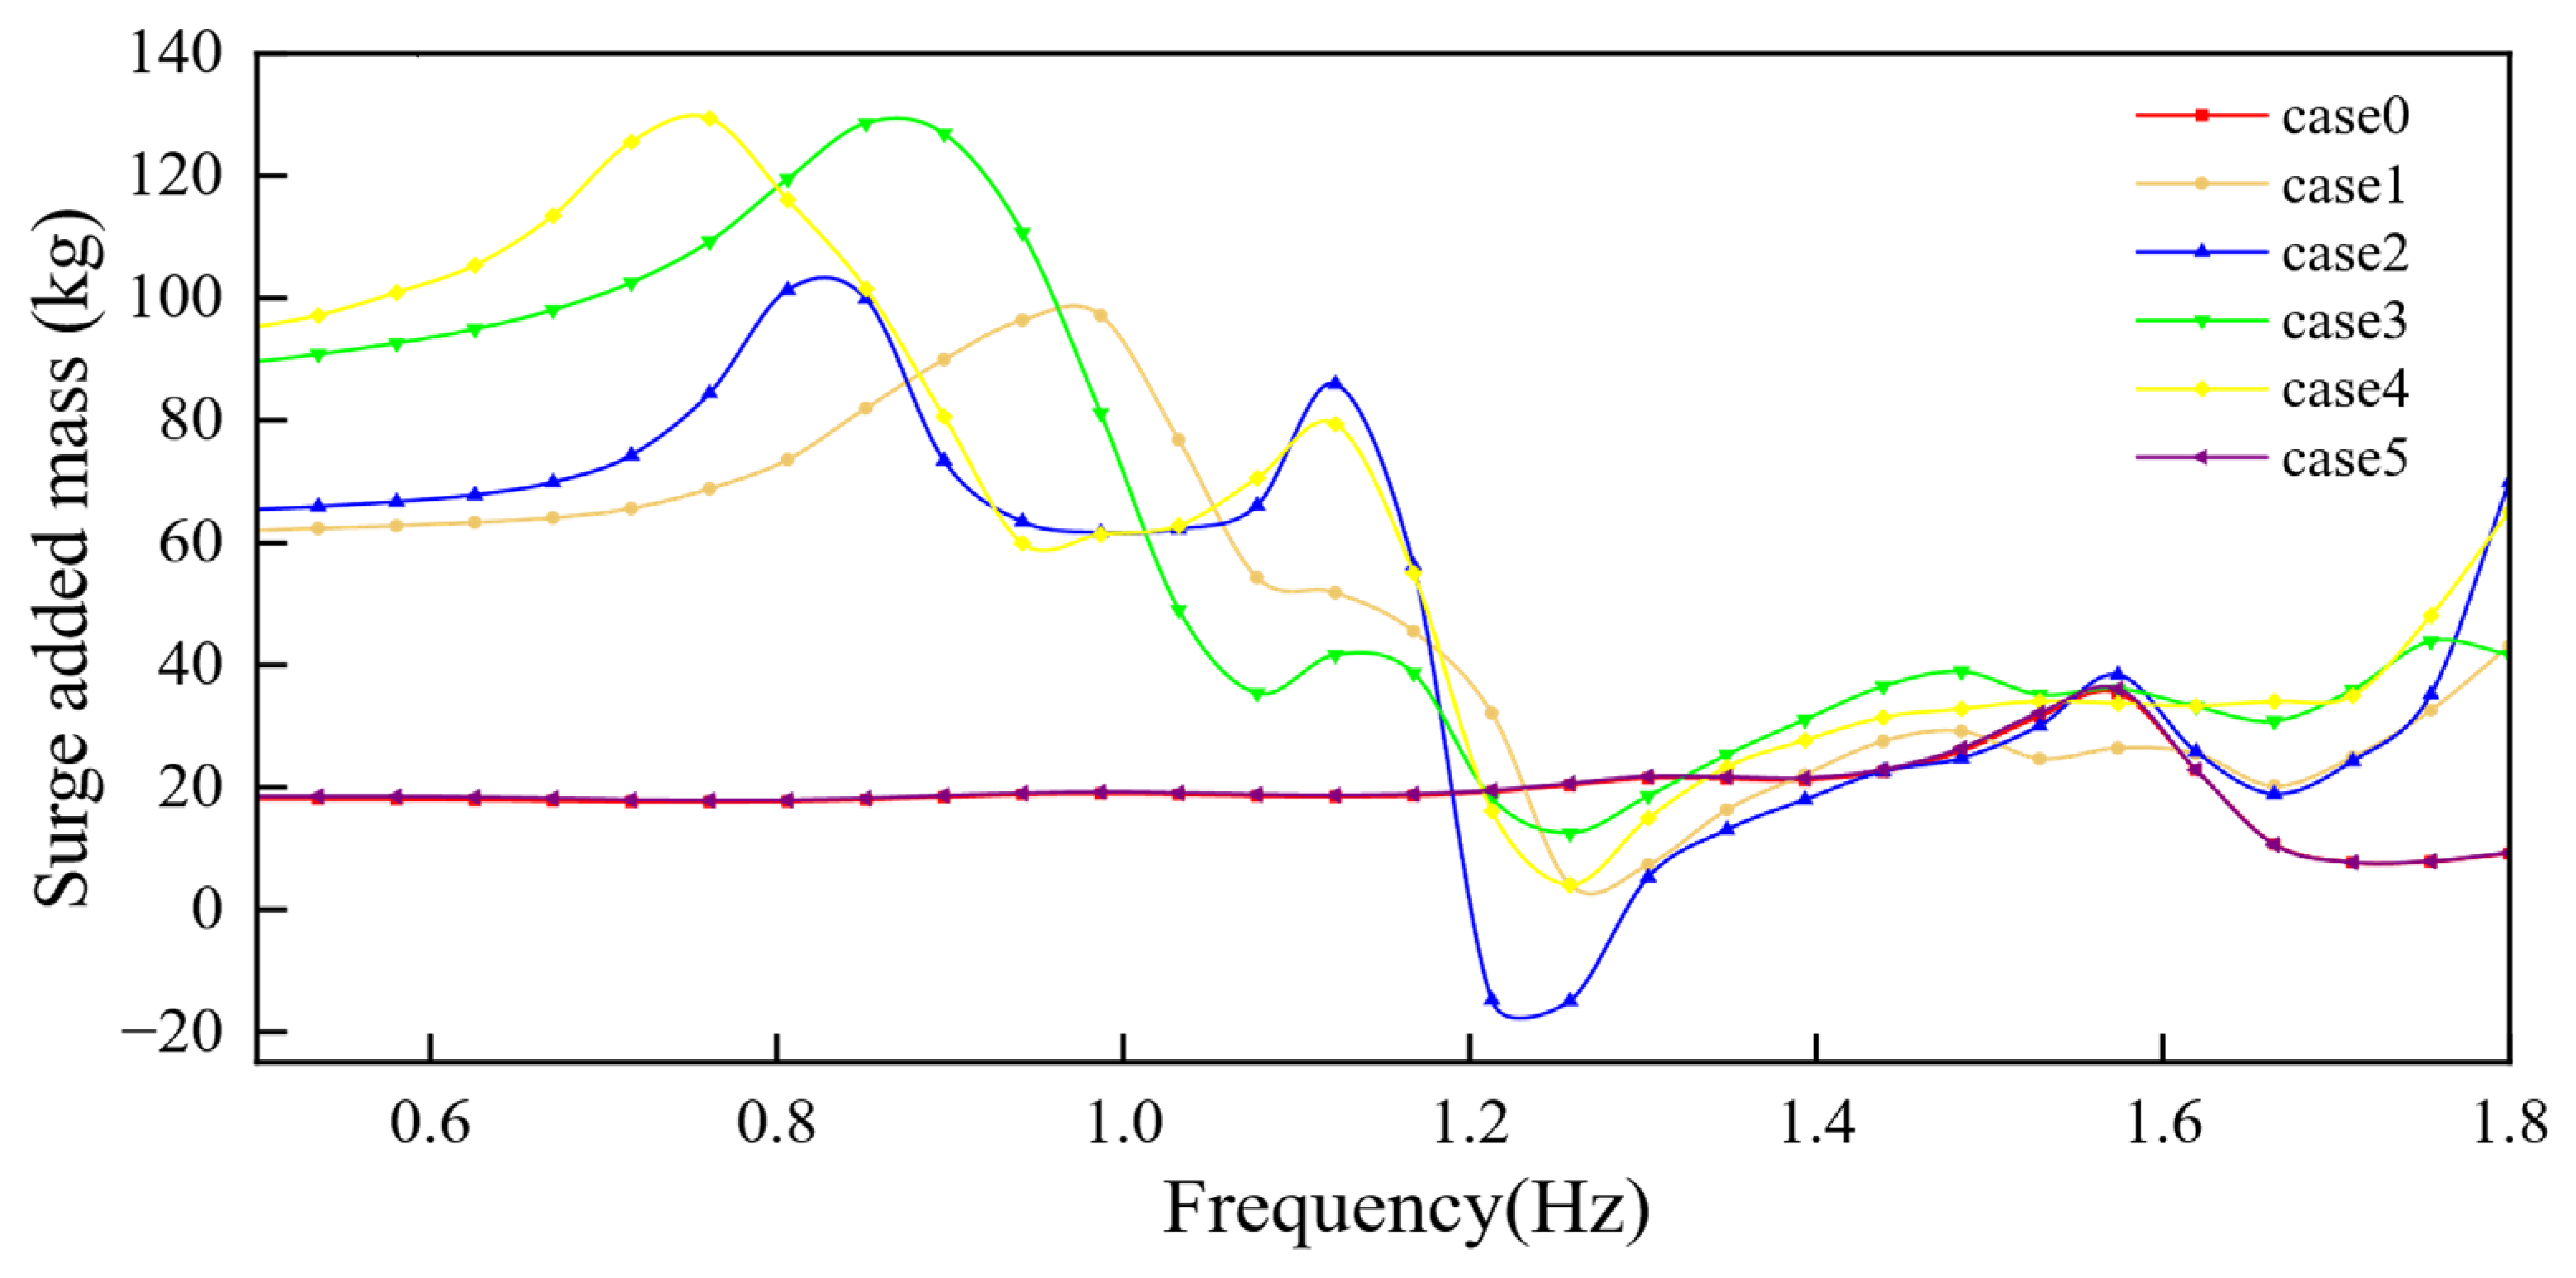
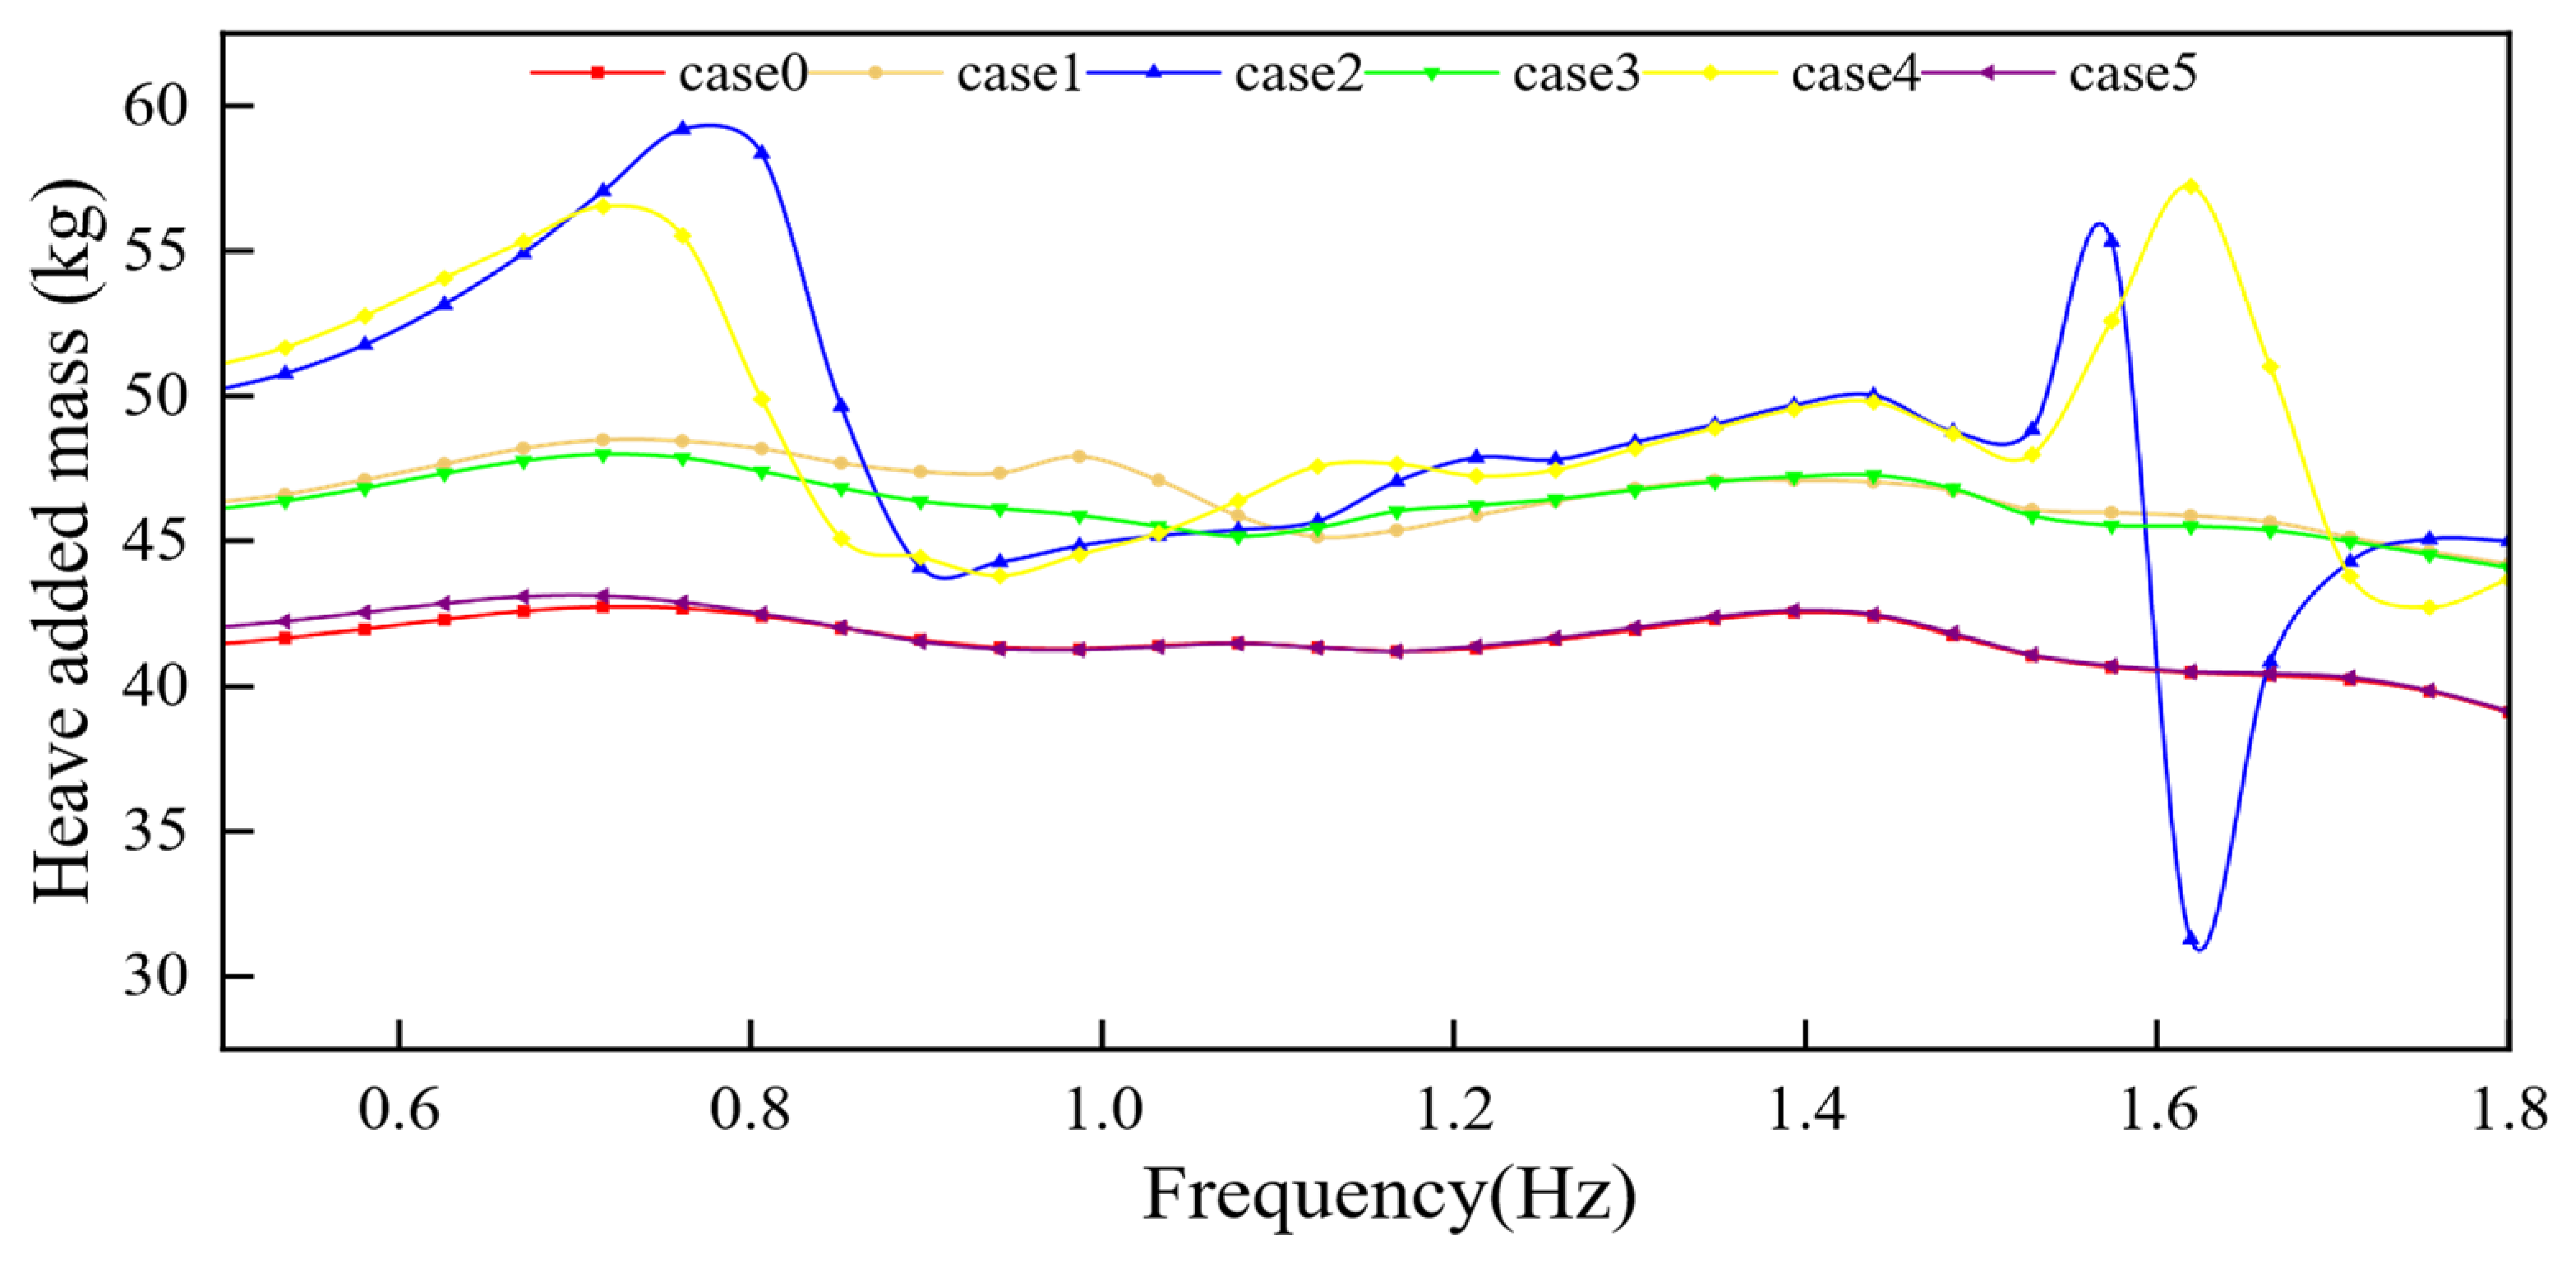
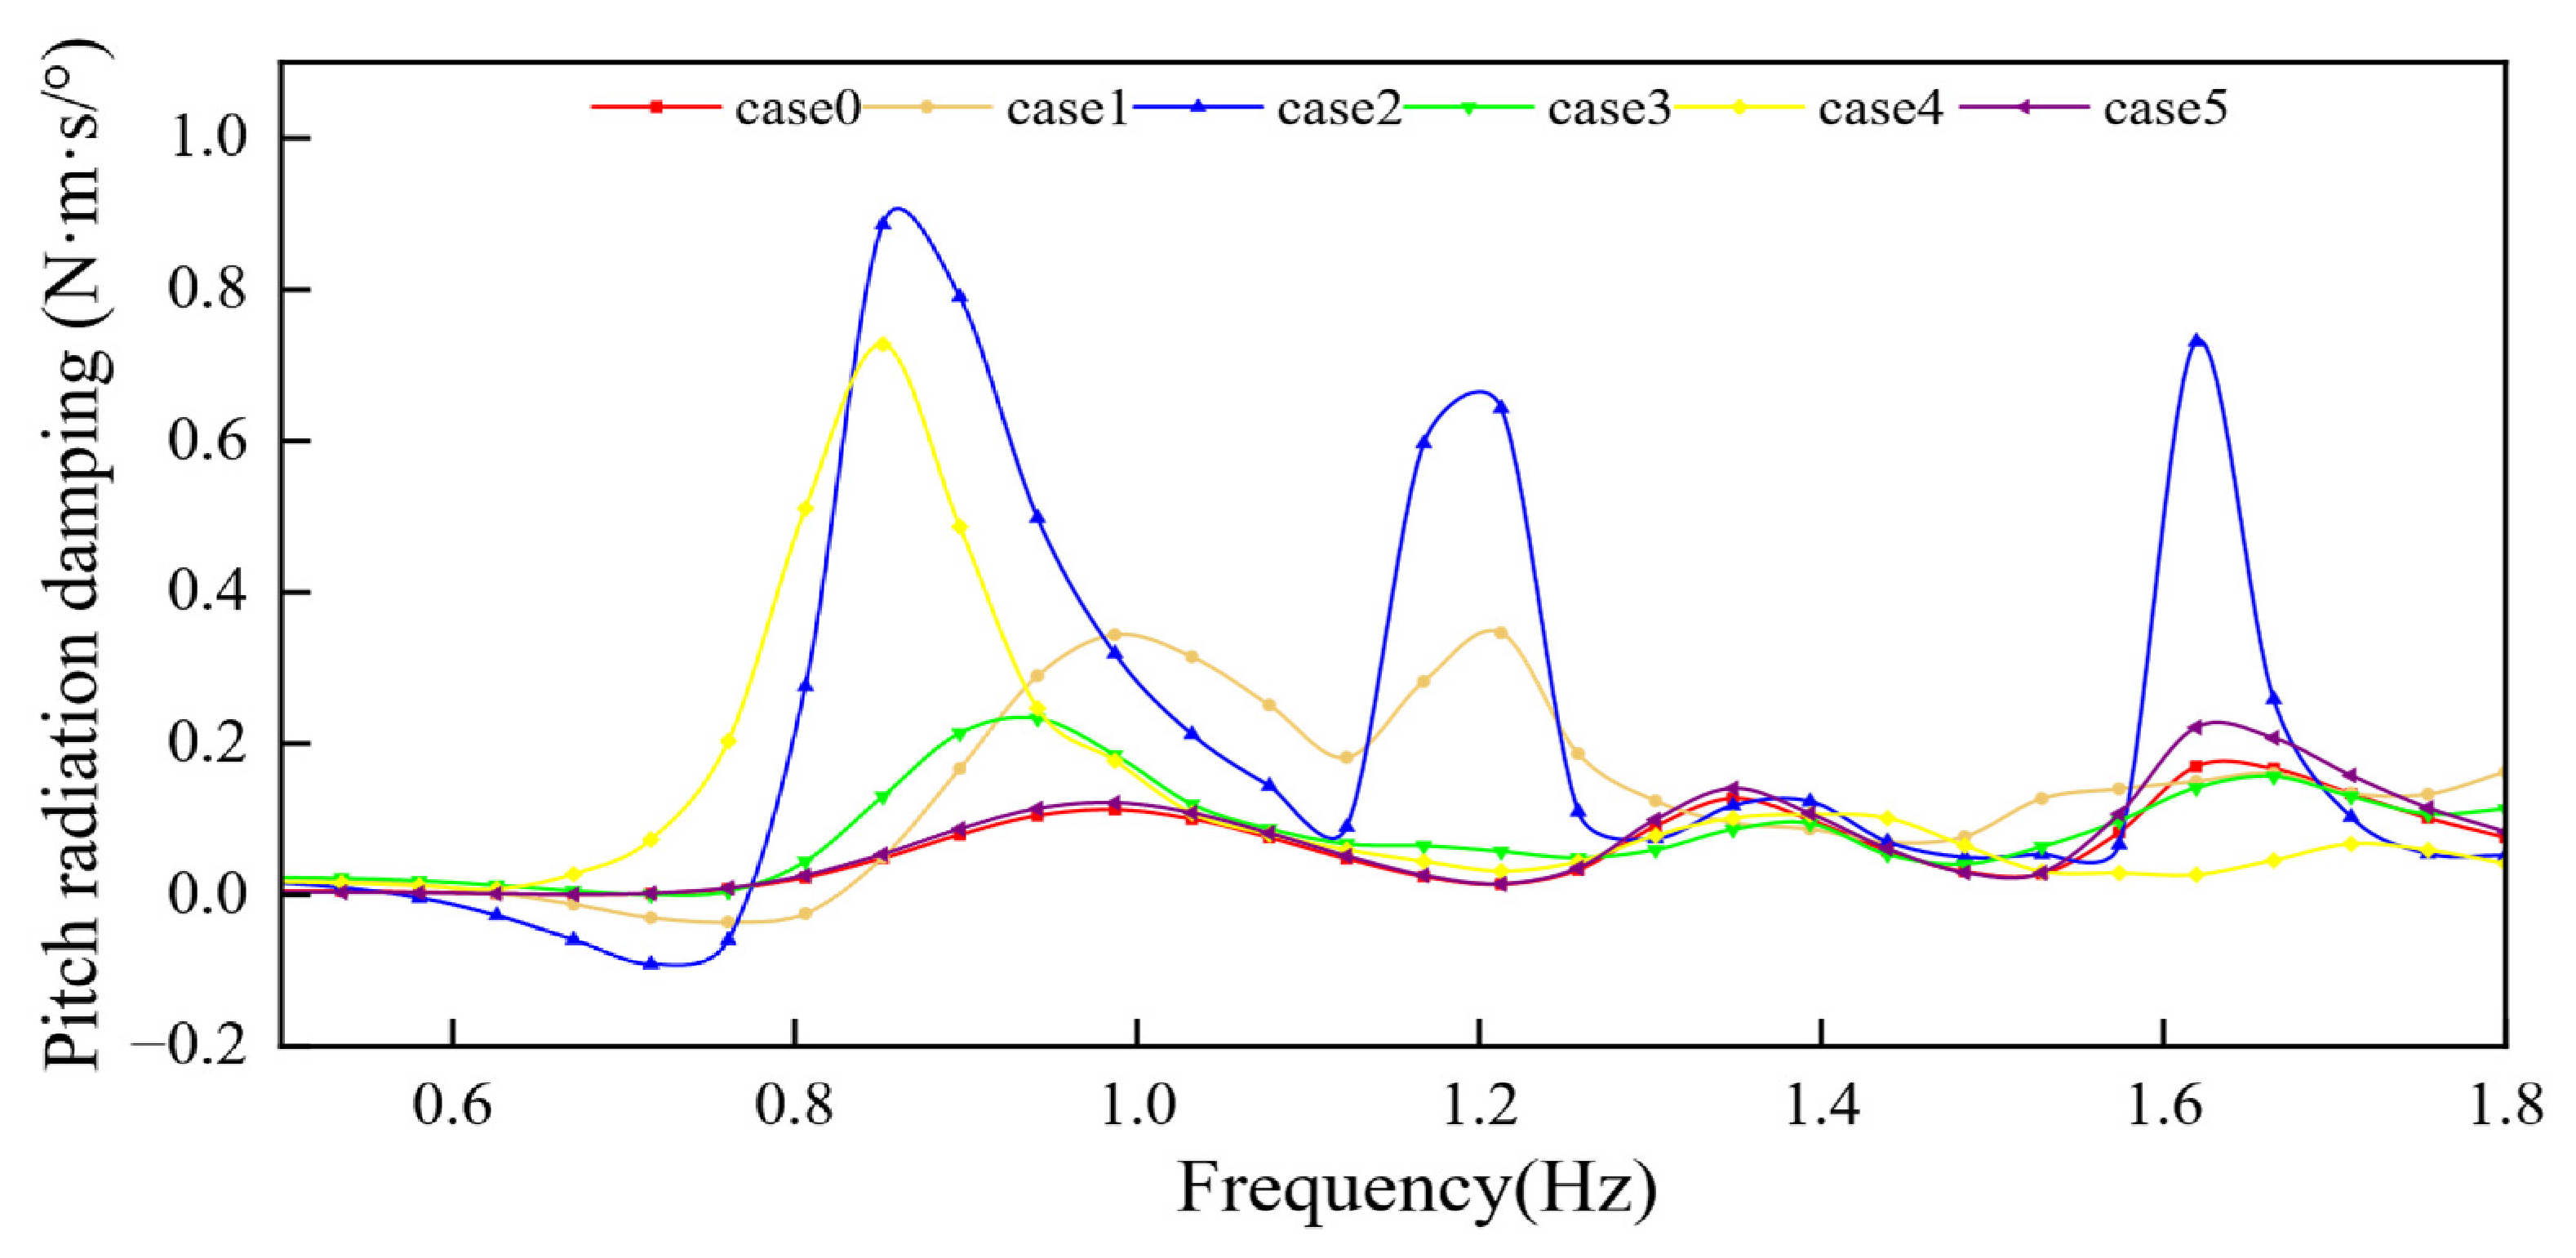
Frequency-domain AQWA calculations supplied first-order wave excitation, added mass, and radiation damping to interpret the measured motion and mooring response. Figure 17, Figure 18, Figure 19, Figure 20, Figure 21, Figure 22, Figure 23, Figure 24 and Figure 25 show the surge, pitch, and heave quantities over the frequency range common to all six configurations. The calculations were used for hydrodynamic interpretation and did not predict fish movement.

3.4.1. First-Order Wave Excitation

First-order excitation is the linear load generated by incident and diffracted waves on a restrained platform. Flow-guiding hoods and side baffles alter wave-facing area, wetted-surface distribution, and diffraction, whereas bigger netting changes the wetted net area and vertical distribution of load. Surge and heave excitation forces, as well as the pitch excitation moment, were compared to distinguish these two protection strategies.
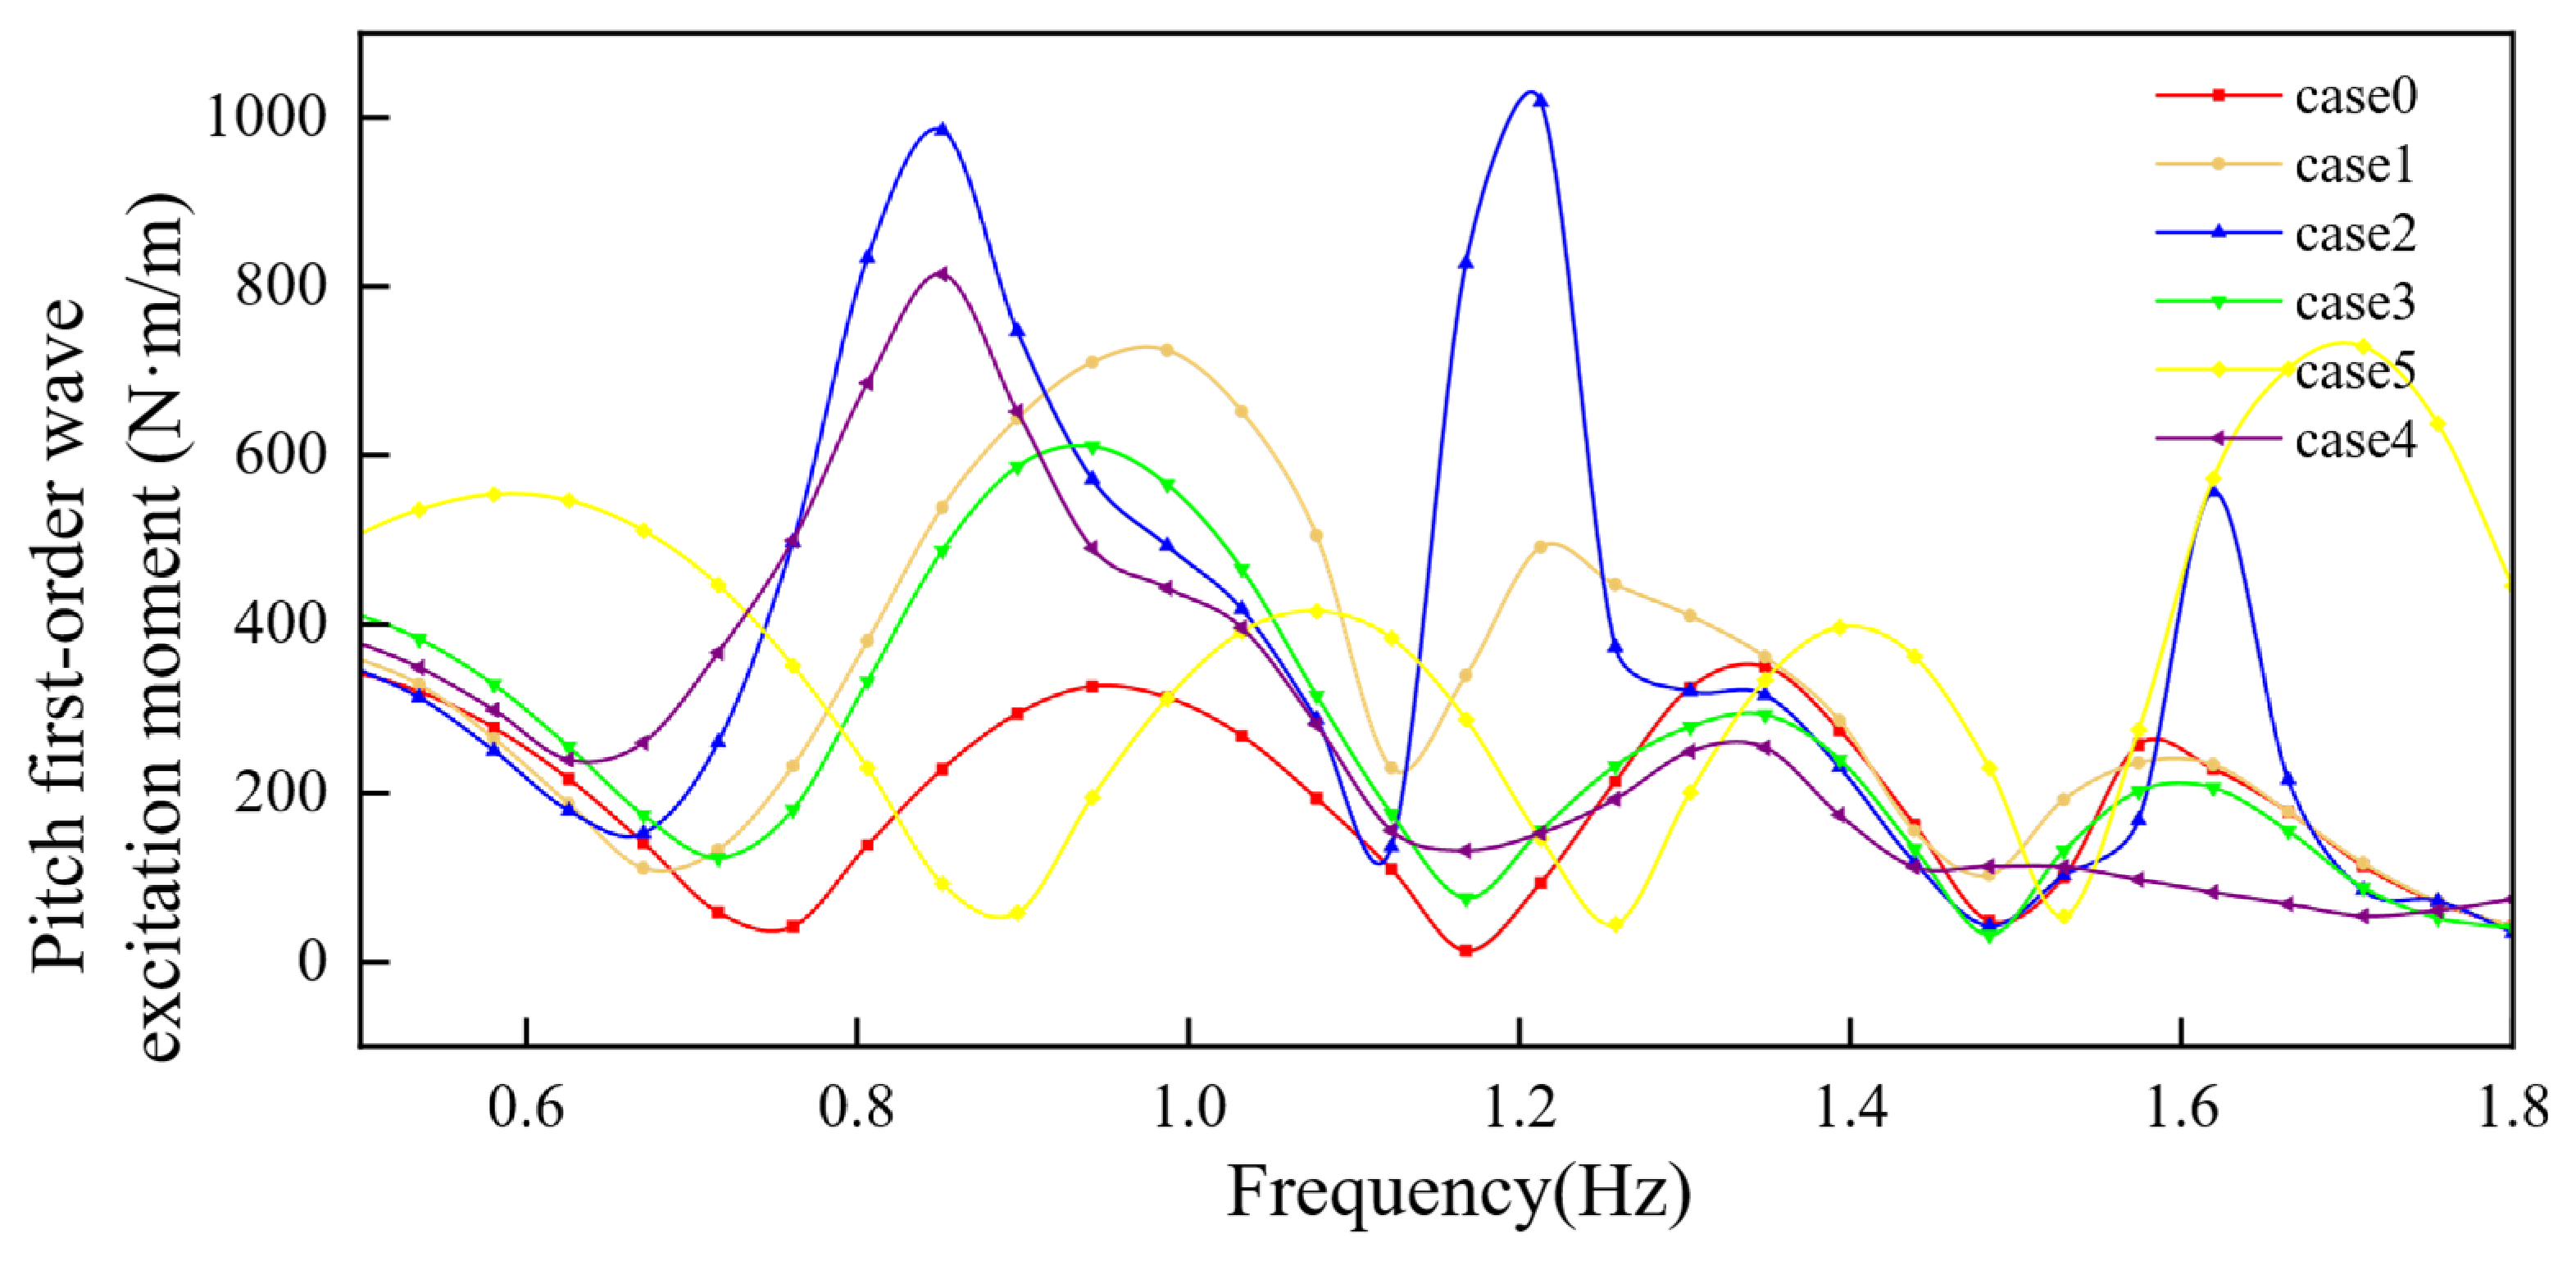
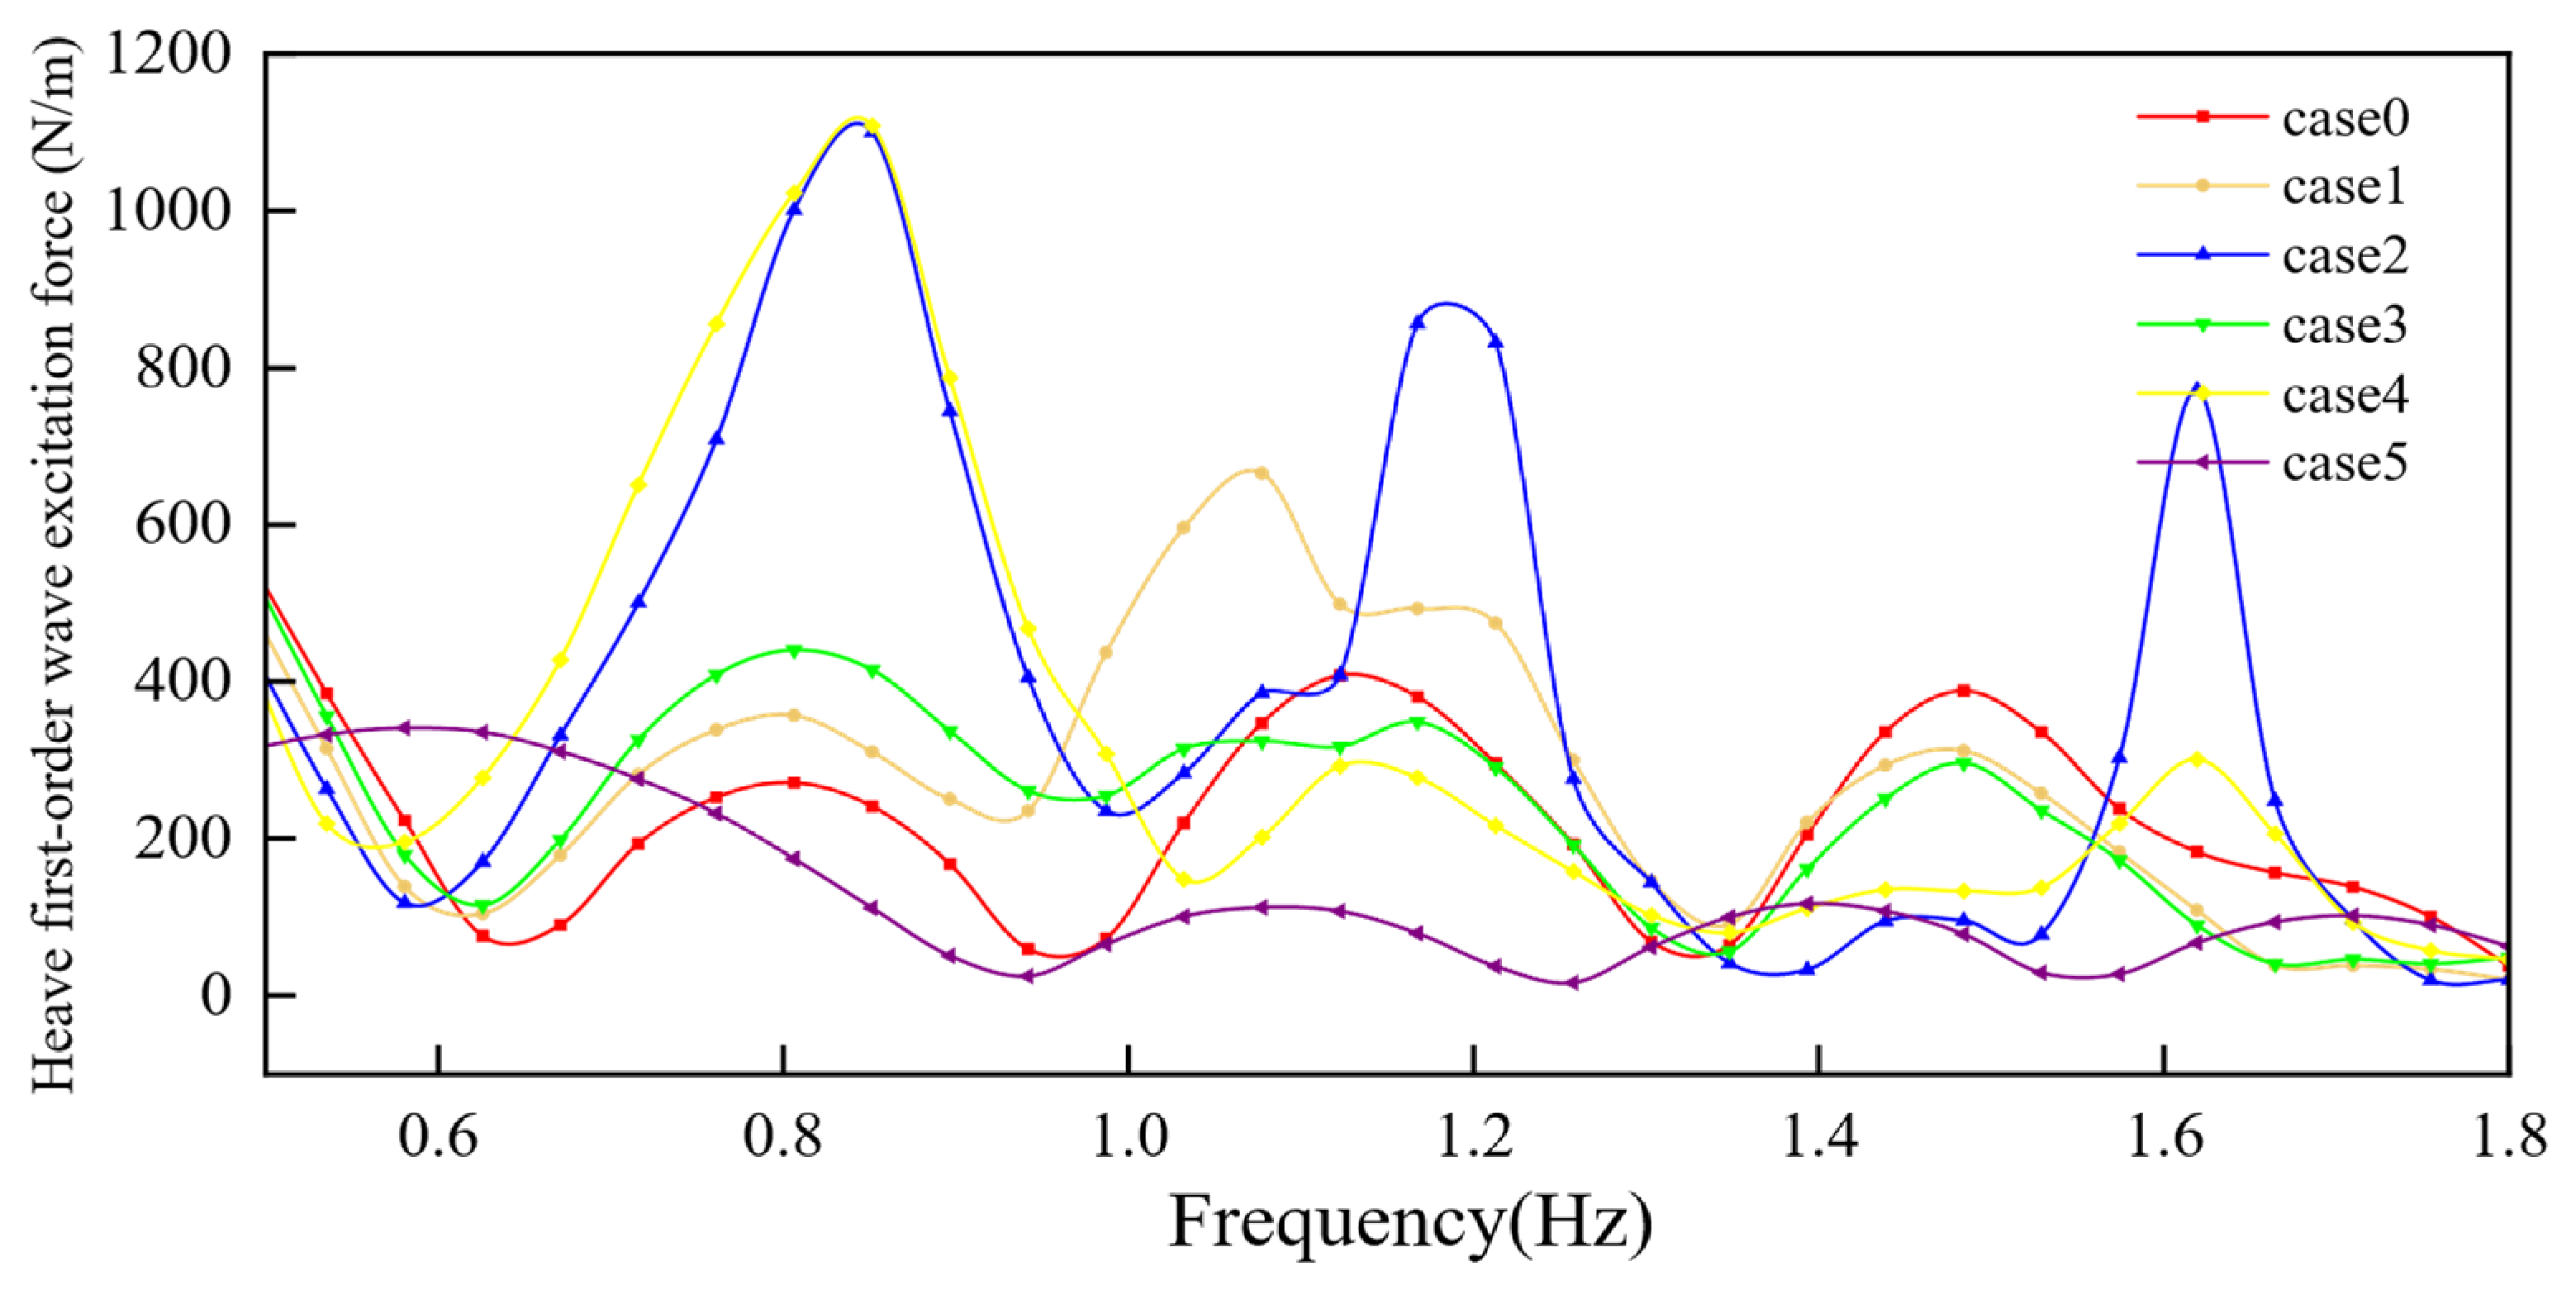
Figure 17, Figure 18 and Figure 19 show the first-order surge and heave excitation forces and pitch excitation moment. All configurations exhibited frequency-dependent, non-monotonic trends, and a given modification did not affect the translational loads and the pitch moment in the same way.
Mean and peak surge excitation in case 0 were 628.704 and 1823.047 N m−1, with the peak at 1.61935 Hz. The configurations in cases 1 to 4 increased the means to 1580.052–1726.989 N m−1 and the peaks to 3126.357–6308.156 N m−1, so the hoods and baffles substantially modified wave loading in the platform’s longitudinal direction. Case 5 reduced the mean to 211.811 N m−1 and the peak to 1013.399 N m−1, decreases of 66.31% and 44.41% relative to case 0. Its peak occurred at 0.40000 Hz, and its excitation remained below the other configurations through most of the intermediate- and high-frequency range.
The mean and peak heave excitation in case 0 were 272.371 and 893.368 N m−1. The configurations in cases 1 to 4 produced means of 238.451 to 367.252 N m−1 and peaks of 548.135 to 1108.736 N m−1, showing strong frequency dependence. Case 5 yielded the lowest mean and peak, 145.067 and 340.998 N m−1, corresponding to reductions of 46.74% and 61.83% relative to case 0.
Pitch followed a different pattern. The mean and peak excitation moments in case 0 were 211.682 and 360.185 N m m−1. Case 5 increased these values to 356.000 and 728.339 N m m−1, rises of 68.18% and 102.21%, and its peak occurred at 1.70968 Hz. Its mean was similar to those of cases 1 and 2; its peak was below the 1018.654 N m m−1 recorded for case 2 but above those for cases 0 and 3. Deeper netting therefore reduced surge and heave excitation but not pitch excitation. Platform response must consequently be interpreted together with added inertia, radiation damping, hydrostatic restoring, and mooring restraint.

3.4.2. Added Mass

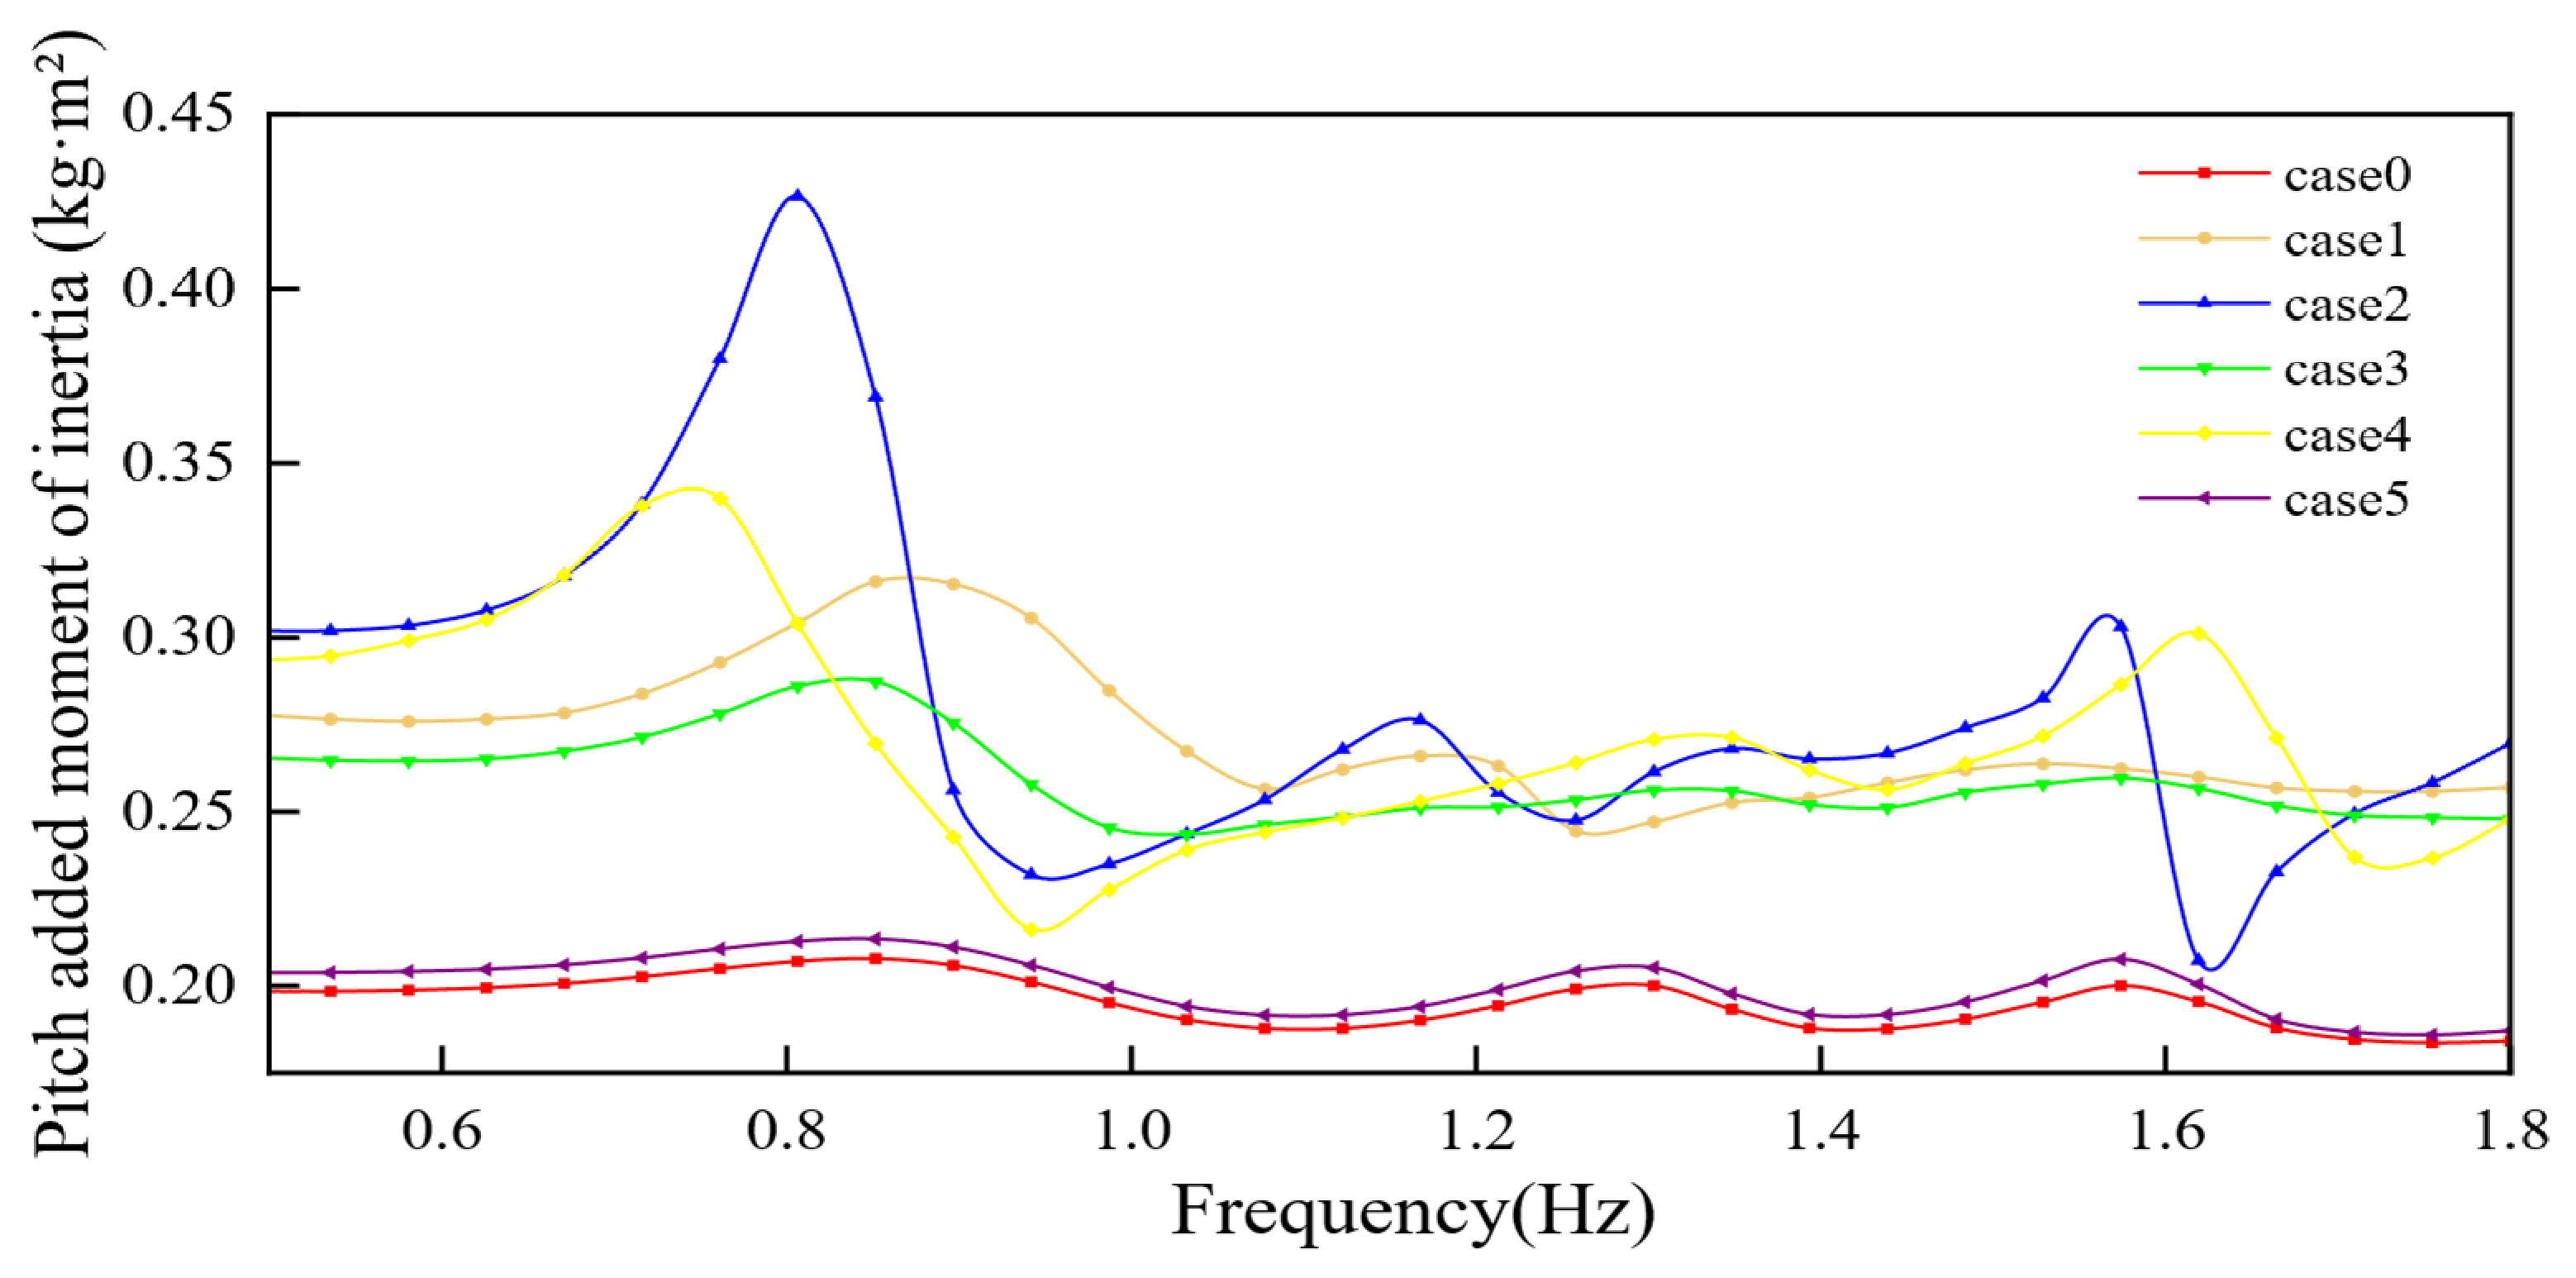
Figure 20, Figure 21 and Figure 22 show the surge added mass, pitch added moment of inertia, and heave added mass. The configurations in cases 1 to 4 substantially altered the added-inertia terms, whereas the curves for case 5 remained close to those for case 0.
Mean and peak surge added mass in case 0 were 19.568 and 35.385 kg. The configurations in cases 1 to 4 increased the means to 48.689–62.907 kg and the peaks to 97.167–129.361 kg. Case 2 exhibited a local negative value of −14.928 kg at 1.16774 Hz, which means the sign of this term changed with frequency. The mean and peak for case 5 were 19.882 and 36.110 kg, only 1.60% and 2.05% above case 0.
For heave, the mean and peak added masses in case 0 were 41.614 and 42.727 kg. The configurations in cases 1 to 4 produced means of 46.282 to 49.007 kg and peaks of 47.990 to 59.189 kg. Case 5 remained close to the baseline, with a mean of 41.793 kg and a peak of 43.105 kg, increases of only 0.43% and 0.88%.
The mean and peak pitch added moments of inertia in case 0 were 0.196 and 0.208 kg m2. The configurations in cases 1 to 4 increased the means to 0.259–0.282 kg m2 and the peaks to 0.287–0.426 kg m2; case 2 reached the largest value at 0.71613 Hz. Case 5 yielded 0.201 and 0.213 kg m2, only 2.47% and 2.73% above case 0. Compared with the flow-guiding configurations, deeper netting therefore caused little change in the three added-inertia terms.

3.4.3. Radiation Damping

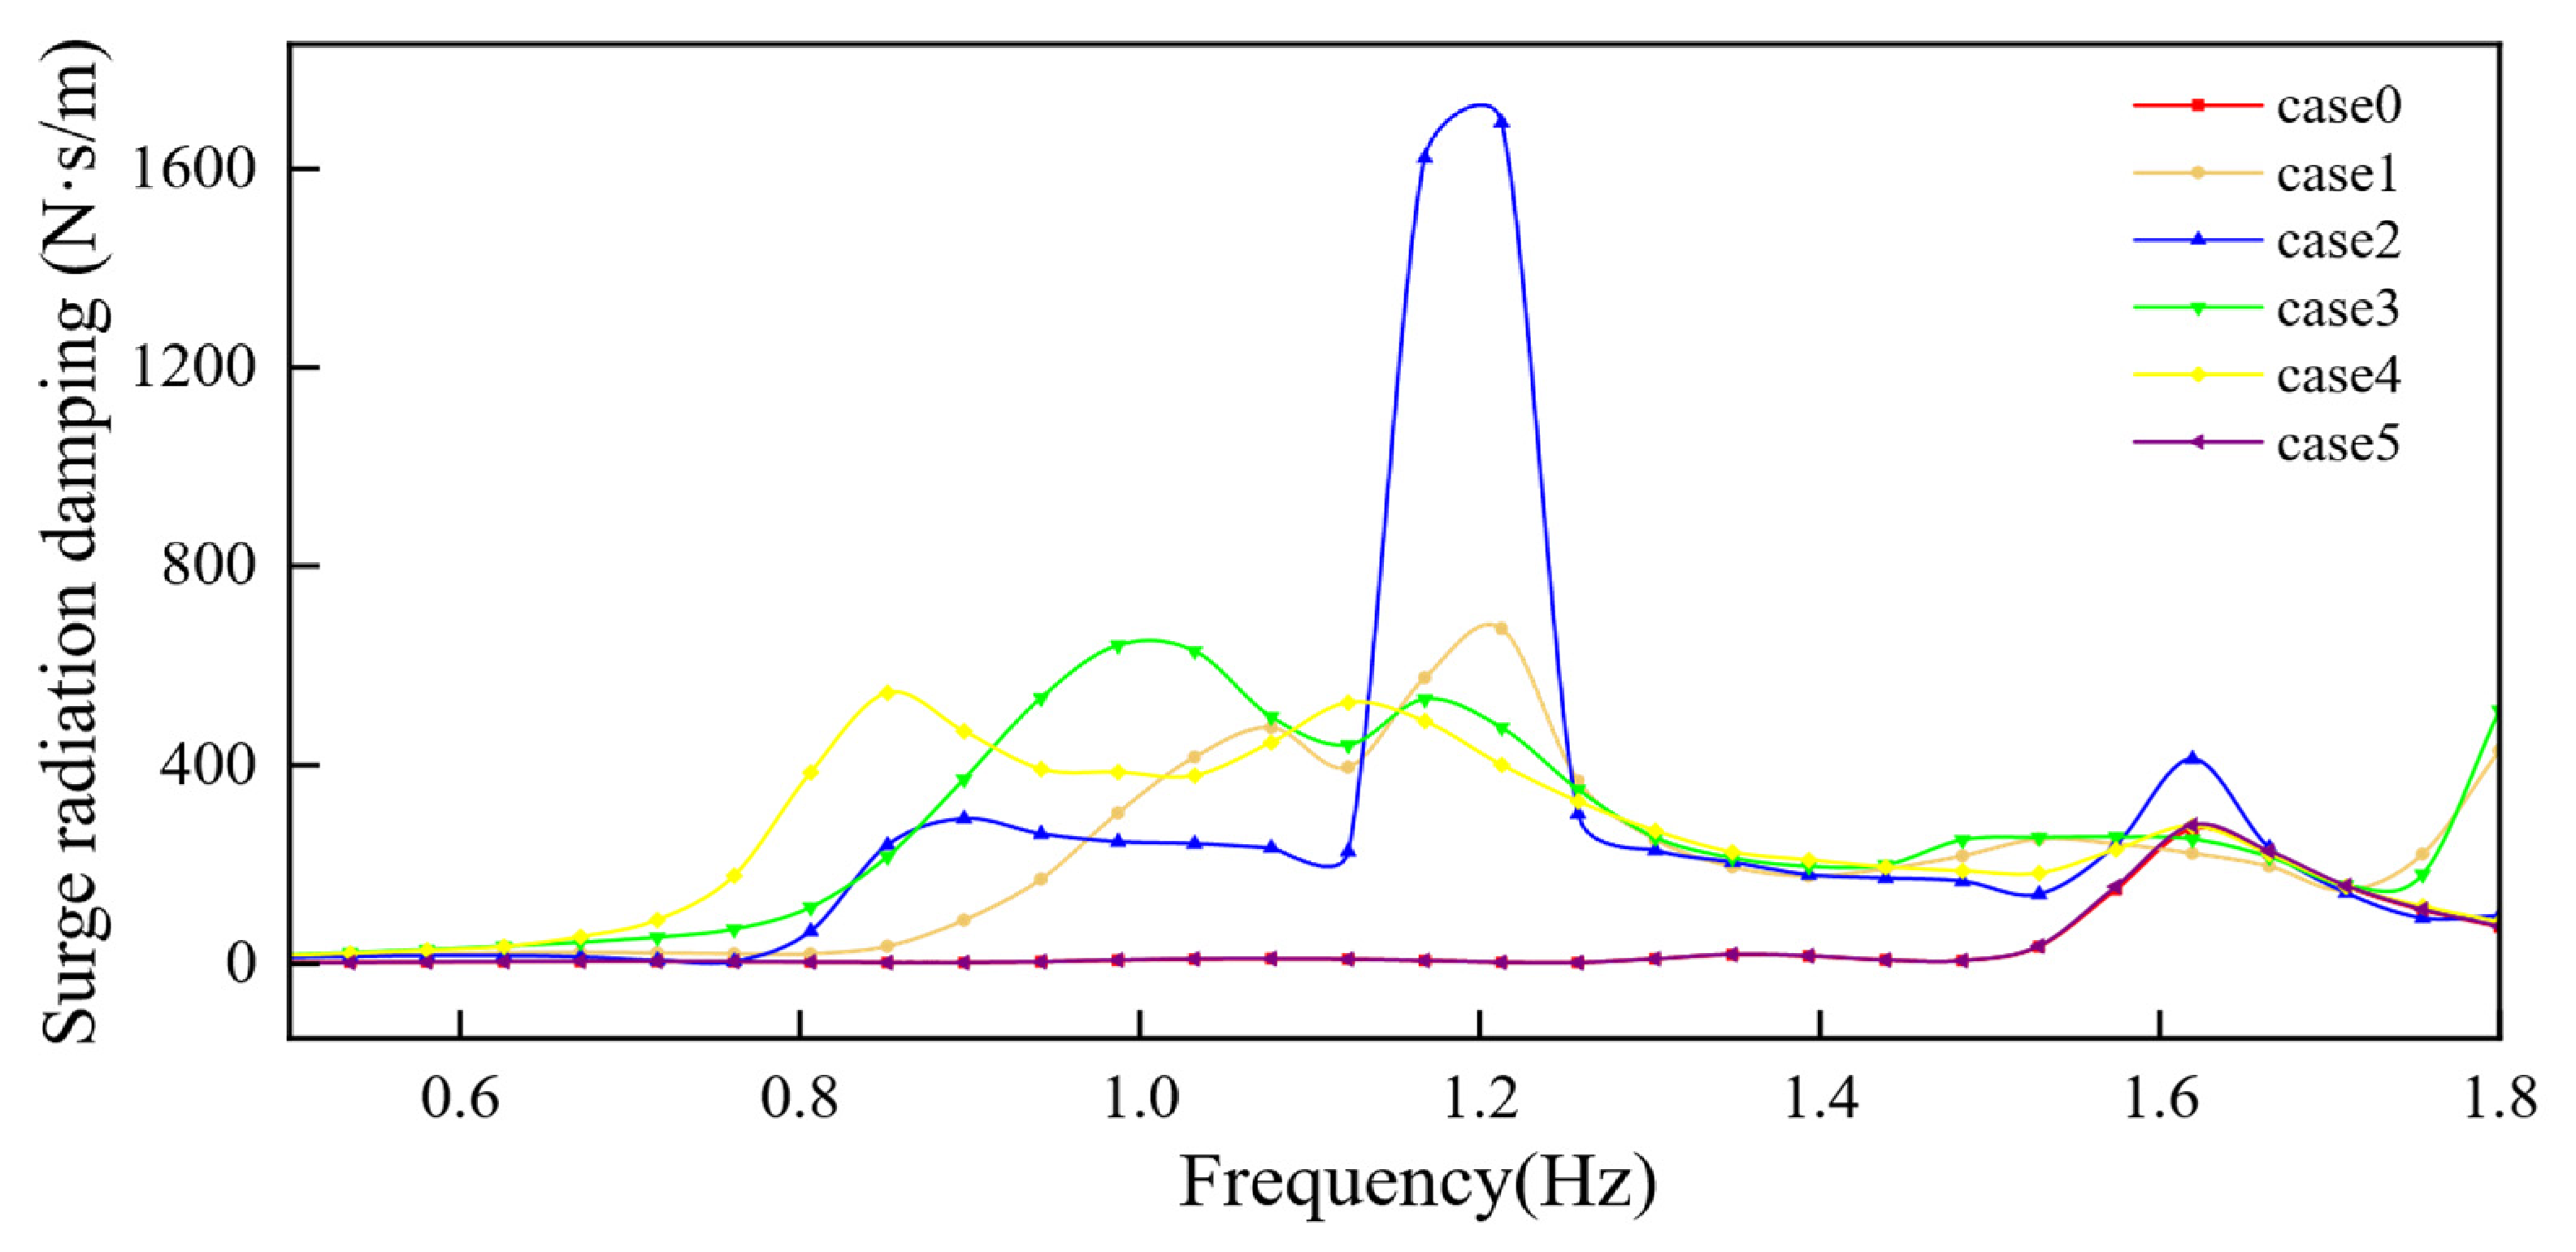
Radiation damping quantifies the energy lost as waves radiate from an oscillating platform and is a central term in the frequency-domain response. Surge, pitch, and heave radiation damping were compared to determine how the two protection strategies alter this energy-loss mechanism.
Mean and peak surge radiation damping in case 0 were 32.648 and 271.204 N s m−1. The configurations in cases 1 to 4 produced means of 191.899 to 266.845 N s m−1 and peaks of 545.312 to 1692.369 N s m−1; case 2 produced the largest peak at 1.12258 Hz. Case 5 yielded 33.463 and 278.797 N s m−1, only 2.50% and 2.80% above case 0. Both case 0 and case 5 peaked at 1.61935 Hz.
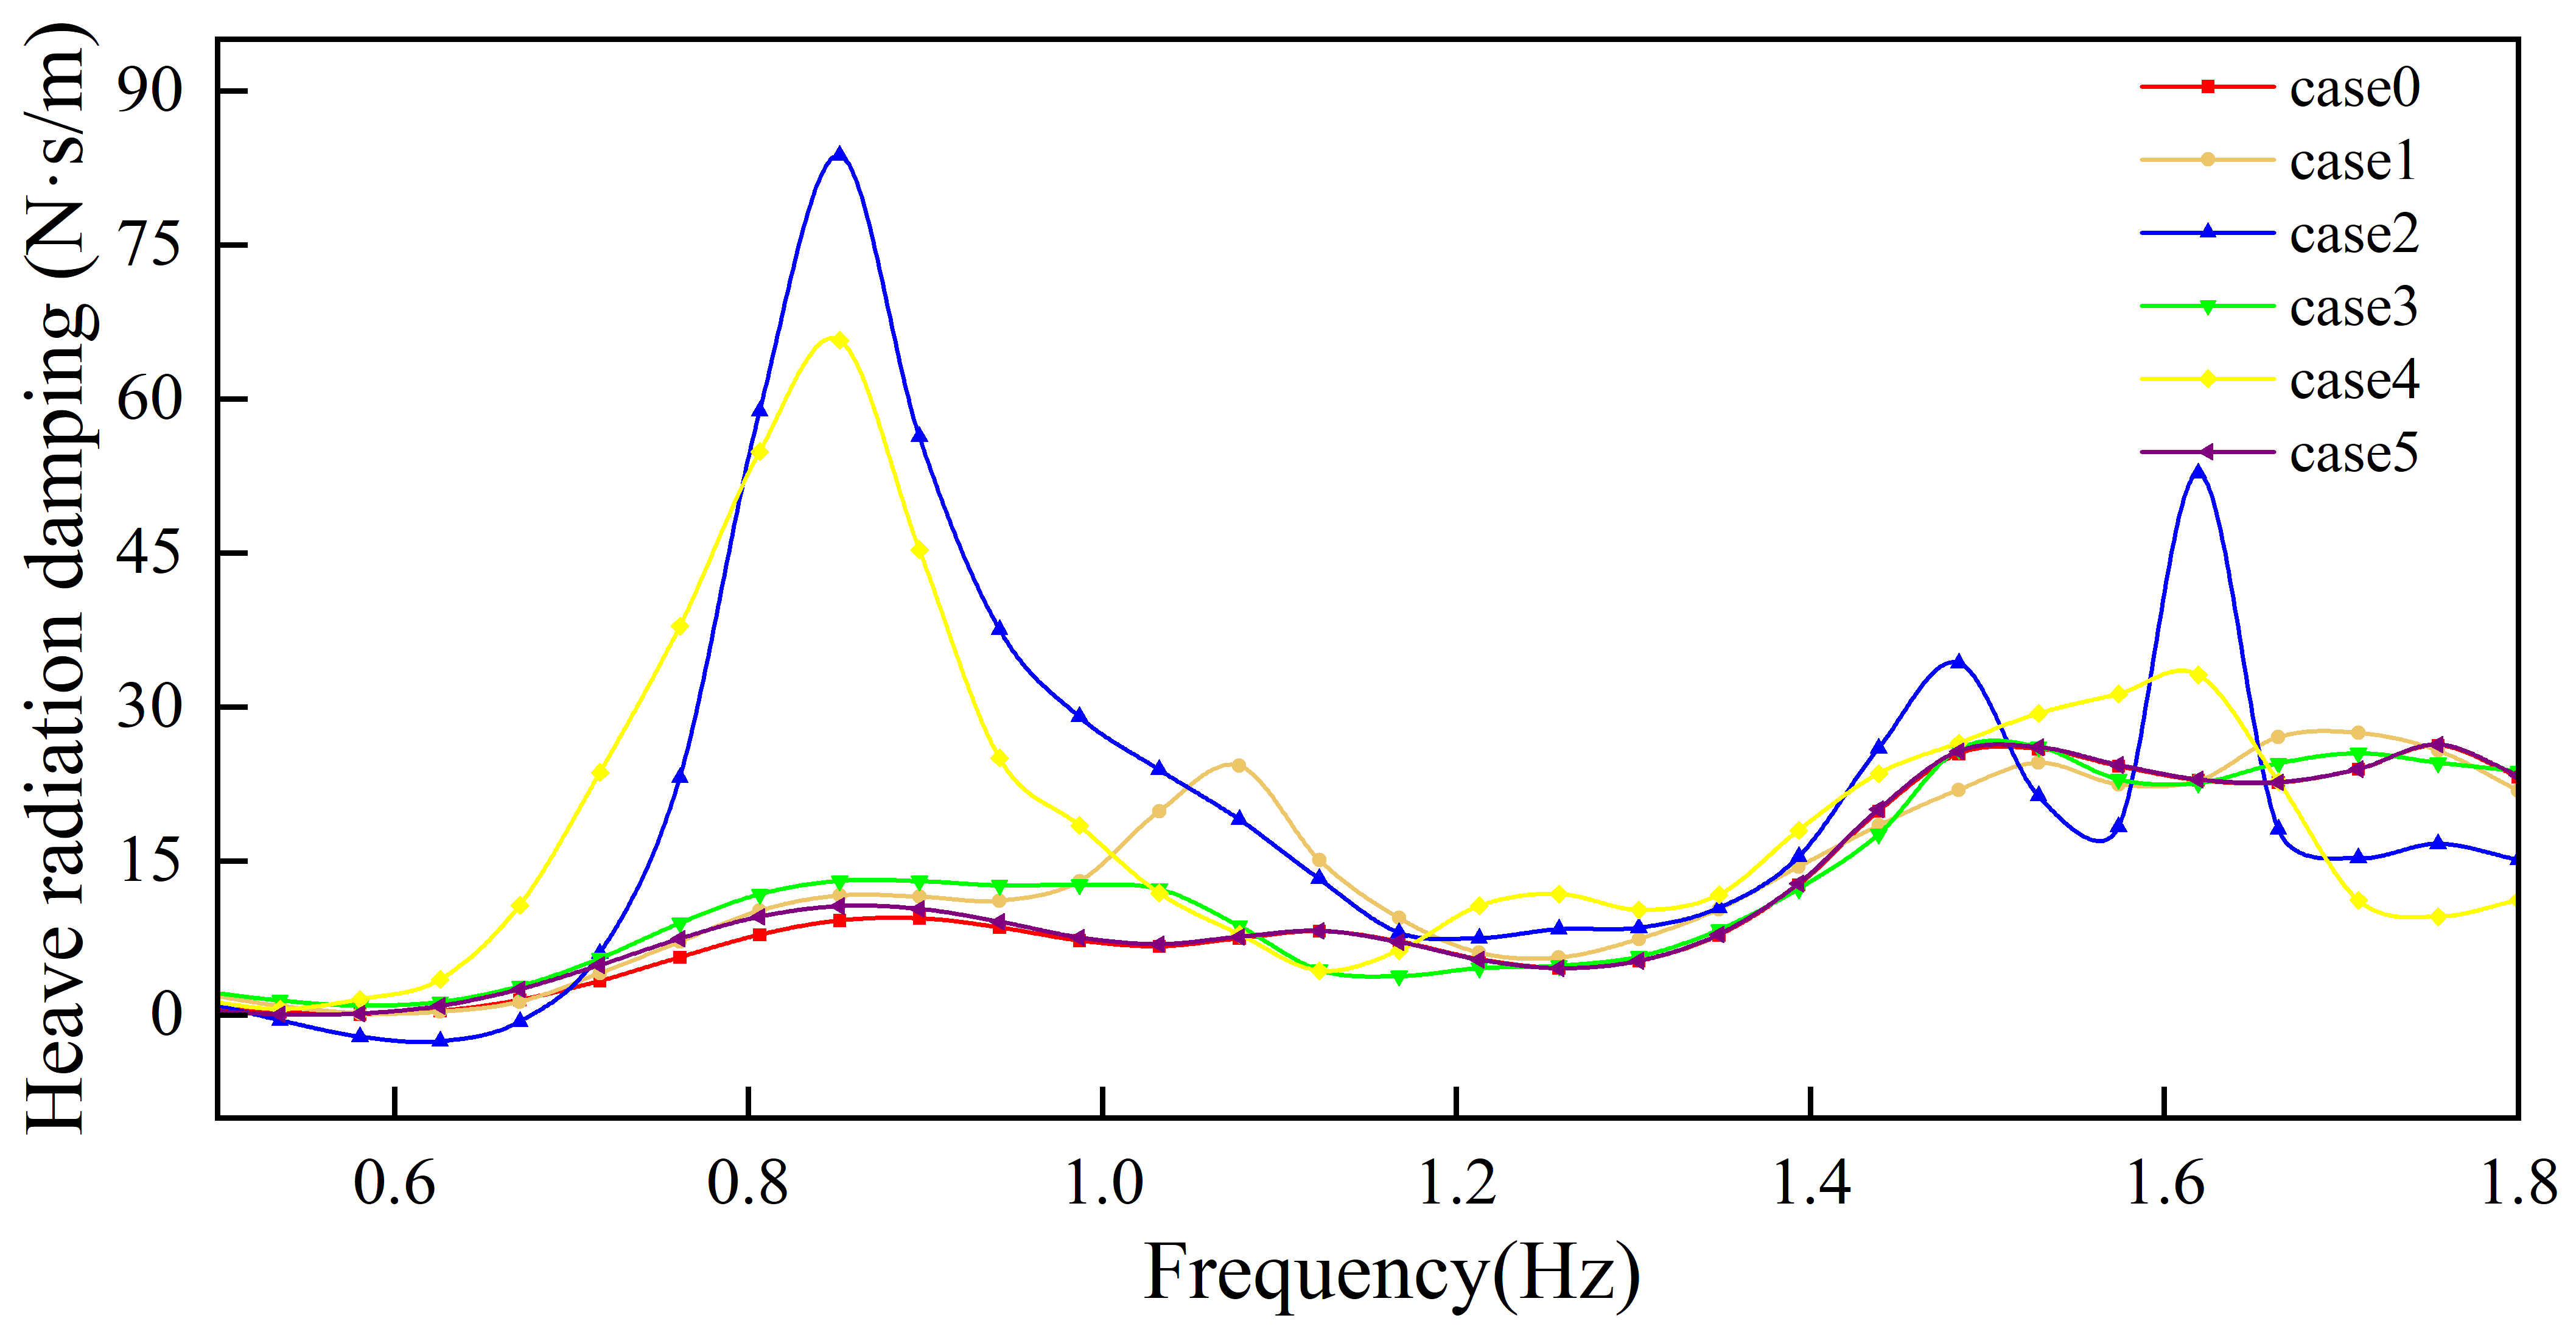
The mean and peak heave radiation damping in case 0 were 9.589 and 25.933 N s m−1. The configurations in cases 1 to 4 produced means of 11.937–20.736 N s m−1 and peaks of 26.086–83.674 N s m−1. Case 5 again remained near the baseline, with a mean of 9.893 N s m−1 and a peak of 26.070 N s m−1, increases of 3.17% and 0.53%.
For pitch, the mean and peak for case 0 were 0.056 and 0.169 N m s deg−1. The configurations in cases 1 to 4 produced means of 0.083 to 0.203 N m s deg−1 and peaks of 0.233–0.886 N m s deg−1. Case 5 increased the mean to 0.063 and the peak to 0.221 N m s deg−1, 13.37% and 30.49% above case 0, but these values remained below the principal peaks for cases 1, 2, and 4.
Case 5 did not reduce all hydrodynamic quantities. Added inertia and radiation damping remained close to case 0; surge and heave excitation fell markedly, while the pitch excitation moment increased. The measured reductions in motion and mooring tension thus do not follow from a uniform decrease in all coefficients. They probably reflect load distribution, coupling among degrees of freedom, and the frequency response of the structure–mooring system.

4. Discussion

4.1. Fish-School Boundary Displacement as a Proxy for Potential Netting Exposure

The proposed metric is based on the horizontal clearance between the main fish school and the upwave netting. Because displacement is measured from the initial school-to-net distance, a larger maximum means less remaining clearance and greater exposure to the netting. The fitted upwave boundary describes the part of the main school nearest the netting more directly than a centroid measure. Actual contact events were not recorded; therefore, the metric is an engineering proxy for exposure rather than a measured probability of contact, contact severity, or injury.
The configurations in cases 1 to 4 reduced mean school-boundary displacement by 7.24 to 9.12% relative to case 0, but the direction of the changes switched with wave period. The observed reduction in school-boundary displacement was therefore period-dependent. Case 4 produced the lowest maximum among the four flow-guiding configurations, 7.04% below case 0; this advantage is limited to peak boundary displacement over the tested period range and does not establish superiority at every period or for every response metric. The manual validation of the video-based extraction yielded an MAE of 8.98 mm, an RMSE of 10.59 mm, and a Pearson correlation coefficient of 0.979. These results support the use of the automated method for identifying configuration- and period-dependent response trends. Nevertheless, because the extraction error remains comparable to some of the smaller differences among the flow-guiding configurations, those small differences should still be interpreted cautiously rather than as establishing a definitive ranking among cases 1 to 4.
Within the tested conditions, case 5 showed reduced school-boundary displacement at every investigated wave period and exhibited the lowest mean and maximum values among the tested configurations. However, this response should be interpreted as the combined outcome of the case 5 experimental condition rather than as an isolated effect of increased netting depth. In addition to the greater netting depth, case 5 provided a 54.55% larger culture volume and a 35.29% lower biomass density than cases 0 to 4. These changes may affect available swimming space and fish-school spatial distribution, and the present experiment cannot distinguish their contributions from those of netting depth. Moreover, the observed reduction refers specifically to horizontally projected school-boundary approach and does not demonstrate a corresponding quantitative reduction in actual fish–net contact frequency or injury probability.

4.2. Hydrodynamic Effects of the Two Protection Strategies

A smaller school-boundary displacement did not necessarily accompany smaller platform motions. Cases 1 to 4 generally increased surge and, to varying degrees, pitch, heave, and mooring tension, even though their overall boundary displacements were lower. Reduced global motion alone therefore cannot explain the fish-school response.
The AQWA calculations help explain these trends. Hoods and baffles changed first-order wave excitation, added mass, and radiation damping by altering the wave-facing area, wetted-surface distribution, and diffraction; the largest differences occurred in surge-related terms. This pattern is consistent with the larger surge and mooring tensions measured in the tests. The calculations are comparative and should not be read as direct predictions of motion amplitude. Local sheltering or redistribution of wave-induced flow may contribute to the observed reduction in boundary displacement; however, because the internal flow field was not measured, this interpretation remains hypothetical.
The reduced platform motions and mooring-line tension measured for case 5 are qualitatively consistent with these changes in first-order hydrodynamic characteristics. However, the experimental response cannot be attributed directly to any single hydrodynamic coefficient and likely reflects the combined effects of load distribution, coupling among multiple degrees of freedom, and the overall frequency response of the platform-mooring system. For the fish-school response, the additional vertical space and possible changes in local hydrodynamics may contribute to the reduced boundary displacement. However, because culture volume and stocking density also changed simultaneously in case 5, the contribution of increased netting depth to the fish-school response cannot be isolated from the present experiment.

4.3. Trade-Off Between Fish-School Response and Mooring Safety

The two strategies involved different engineering trade-offs. Cases 1 to 4 lowered overall boundary displacement but generally increased surge and mooring tension. Case 4 showed the lowest observed peak boundary displacement in this group under the tested conditions, although its mooring load remained well above that of case 0; case 3 produced the largest mean and maximum tensions. Flow-guiding performance must therefore be assessed together with platform motion and mooring capacity.
Within the tested range, case 5 reduced boundary displacement, pitch, surge, heave, and mooring tension relative to case 0. Mean and maximum tension fell by 18.36% and 28.63%, respectively, without the large station-keeping penalty observed for the add-on flow guides. The fish-school response cannot be attributed solely to deeper netting because culture volume and stocking density also changed. The tests also did not cover material demand, installation and maintenance, net deformation, biofouling, current loads, or farm operations. Case 5 should therefore not yet be regarded as an optimal full-scale design.
Engineering selection should use a multi-objective framework. A design with hoods and baffles must balance reduced school-boundary displacement against additional wave excitation, platform motion, and the mooring safety margin. A deeper-netting design requires separate checks of net strength, volume retention, response under combined waves and currents, and life-cycle operation and maintenance. The present results suggest that case 5 warrants further repeated and full-scale validation, while case 4 showed the lowest observed peak boundary displacement among the four flow-guiding configurations under the tested conditions.
At a 1:50 Froude scale, the model-to-prototype force ratio is 1:125,000. The largest measured model tension, 12.219 N, corresponds to an equivalent prototype tension of approximately 1.527 MN. To provide an engineering-scale reference, this value was compared with the breaking test loads specified by the American Bureau of Shipping (ABS) for a 76 mm chafing chain: approximately 4.884 MN for Grade R3 and 6.001 MN for Grade R4 [33]. The maximum prototype-equivalent tension obtained in the present tests is therefore about 31% of the representative Grade R3 breaking load. This comparison suggests that the measured load level is not obviously incompatible with the capacity range of a comparable offshore chain. However, it should not be interpreted as a formal safety assessment or as the capacity of the actual mooring system, because the chain grade, minimum breaking load, pretension, fatigue and corrosion allowances, anchor capacity, and code-required safety factors are unavailable. The substantially increased tensions observed for the flow-guiding configurations should therefore still be regarded as an important station-keeping penalty requiring dedicated full-scale mooring verification.
Fish-protection components should be designed as part of the coupled platform–cage–mooring system. The flow guides show that a smaller boundary displacement can coincide with much larger surge and mooring demand, with consequences for fairlead loads, anchors, fatigue, and the operating envelope. Deepened netting changes cage space without adding wave-facing appendages, but its value must still be assessed against current drag, net deformation, structural support, bottom clearance, biofouling, inspection, cleaning, and costs. These results are best used for preliminary screening before full-scale structural, mooring, operational, and economic assessment.

4.4. Limitations and Future Work

Several limitations constrain the interpretation of the present results.
First, only regular head waves were tested; irregular waves, directionally spread waves, oblique waves, and combined wave–current conditions were not represented. The observed configuration-dependent responses should therefore be interpreted within the tested severe regular-wave conditions rather than extrapolated directly to full-scale extreme sea states.
Second, each wave condition was represented by only one independent experimental realization. Although the representative response for each condition was obtained by averaging the cycle-wise maxima over the steady-response interval, these wave cycles are repeated observations within the same test and do not constitute independent experimental replicates. Consequently, between-run repeatability, replicate-based experimental uncertainty, and statistical significance cannot be established from the present dataset. The reported differences among configurations should therefore be interpreted as observed response trends under the tested conditions rather than as statistically established performance differences.
Third, the maximum displacement of the upwave school boundary serves as an engineering proxy for potential netting exposure rather than as a direct measurement of fish–net contact probability. Manual validation using 15 representative frames yielded an MAE of 8.98 mm, an RMSE of 10.59 mm, and a maximum absolute error of 16.28 mm for the automated boundary extraction. The manually and automatically obtained values were strongly correlated ( r = 0.979 ), indicating that the automated procedure captured the overall response trend. However, the extraction uncertainty remains relevant when interpreting relatively small differences among the individual flow-guiding configurations. In addition, the present video-based metric describes only the horizontally projected school-boundary response and cannot resolve three-dimensional redistribution of the fish school, particularly vertical movement in the deeper cage.
Fourth, retaining 150 fish in case 5 resulted in a lower stocking density due to the increased cage volume. The comparison between case 5 and the baseline configuration therefore includes the combined effects of increased netting depth, increased available culture volume, and reduced stocking density, and these effects cannot be separated using the present dataset.
Fifth, the internal cage flow field was not directly measured. Therefore, interpretations involving local sheltering, redistribution of wave-induced flow, or changes in the internal hydrodynamic environment remain hypotheses inferred from the measured global responses, rather than directly verified flow mechanisms.
Finally, the frequency-domain AQWA model is based primarily on linear potential-flow theory and does not explicitly resolve viscous separation, vortex shedding, turbulence, density stratification, large nonlinear net deformation, transient mooring dynamics, or fish–flow–structure interaction. Viscous effects on netting and slender members are represented only approximately by the Morison formulation. Accordingly, the numerical results are used primarily for comparative interpretation of first-order wave excitation, added mass, and radiation damping among the configurations and should not be regarded as direct quantitative predictions of the finite-amplitude experimental motions or mooring-line tensions.
Future work should use independent repeated tests to quantify repeatability and uncertainty. Irregular and oblique waves, combined waves and currents, and multiple netting depths should also be examined. Local velocity measurements or particle image velocimetry could resolve the cage flow field, while three-dimensional tracking and direct records of fish–net contact could test the boundary-displacement metric. Experiments that vary netting depth, cage volume, and stocking density independently are needed to separate their effects. Numerical models should include flexible netting, nonlinear mooring response, and time-domain wave–current loading before prototype-scale assessments of structural safety, mooring performance, farm operation, and life-cycle cost.

5. Conclusions

Physical model tests and frequency-domain ANSYS-AQWA calculations were used to compare the baseline (case 0), four add-on flow-guiding configurations (cases 1 to 4), and a deepened-netting configuration (case 5). Maximum displacement of the upwave school boundary served as an engineering proxy for potential netting exposure. The main findings are:
(1)
The configurations in cases 1 to 4 generally reduced school-boundary displacement, but the effect depended on the wave period; case 4 reduced the maximum by 7.04% relative to case 0. These configurations nevertheless increased surge and did not improve all three platform motions simultaneously. The case 5 configuration reduced displacement at every tested period, lowering the mean and maximum by 32.90% and 22.57%, and reduced pitch, surge, and heave; mean and maximum heave fell by 70.74% and 62.87%.
(2)
The configurations in cases 1 to 4 generally increased mooring-line tension, with case 3 producing the largest mean and maximum. The case 5 configuration reduced tension at every period, lowering the mean and maximum by 18.36% and 28.63%. Its surge and heave excitation decreased substantially, while added mass and radiation damping remained close to case 0 and pitch excitation increased. Its combined response therefore reflects load distribution, coupling among degrees of freedom, and the structure–mooring system.
(3)
Of the tested configurations, case 5 showed the most favorable observed combined response in horizontal school-boundary displacement, platform motion, and mooring tension. The fish-school response cannot be attributed to deeper netting alone because netting depth, culture volume, and stocking density changed together. Each wave condition was also tested only once, so the differences are observed trends rather than statistically significant advantages. Repeated controlled tests are needed before an engineering optimum can be identified.

Author Contributions

Conceptualization, S.S.; methodology, W.C., R.Z. and H.L.; software, W.C. and R.Z.; validation, W.C., R.Z., S.Y., H.L. and X.R.; formal analysis, W.C. and X.R.; investigation, W.C. and H.L.; resources, S.S.; data curation, W.C. and X.R.; writing—original draft preparation, W.C. and S.Y.; writing—review and editing, W.C., S.S., R.Z., S.Y., H.L. and X.R.; visualization, W.C.; supervision, S.S.; project administration, S.S.; funding acquisition, S.S. All authors have read and agreed to the published version of the manuscript.

Funding

This research was funded by the National Key R&D Program of China (Grant No. 2022YFD2401200) and the Guangxi Science and Technology Project (Grant Nos. Guike AA24263015 and Guike 2024AA06014).

Data Availability Statement

The data presented in this study are available upon reasonable request from the corresponding author.

Conflicts of Interest

The authors declare no conflicts of interest.

References

  1. FAO. The State of World Fisheries and Aquaculture 2024: Blue Transformation in Action; Food and Agriculture Organization of the United Nations: Rome, Italy, 2024. [Google Scholar] [CrossRef] [Scilit]
  2. Froehlich, H.E.; Smith, A.; Gentry, R.R.; Halpern, B.S. Offshore aquaculture: I know it when I see it. Front. Mar. Sci. 2017, 4, 154. [Google Scholar] [CrossRef] [Scilit]
  3. Gentry, R.R.; Froehlich, H.E.; Grimm, D.; Kareiva, P.; Parke, M.; Rust, M.; Gaines, S.D.; Halpern, B.S. Mapping the global potential for marine aquaculture. Nat. Ecol. Evol. 2017, 1, 1317–1324. [Google Scholar] [CrossRef] [Scilit] [PubMed]
  4. Buck, B.H.; Langan, R. (Eds.) Aquaculture Perspective of Multi-Use Sites in the Open Ocean: The Untapped Potential for Marine Resources in the Anthropocene; Springer: Cham, Switzerland, 2017. [Google Scholar] [CrossRef] [Scilit]
  5. Holmer, M. Environmental issues of fish farming in offshore waters: Perspectives, concerns and research needs. Aquac. Environ. Interact. 2010, 1, 57–70. [Google Scholar] [CrossRef] [Scilit]
  6. Bjelland, H.V.; Folkedal, O.; Føre, H.M.; Grøtli, E.I.; Holmen, I.M.; Lona, E.; Slette, H.T.; Størkersen, K.V.; Thorvaldsen, T. Exposed aquaculture operations: Strategies for safety and fish welfare. Rev. Aquac. 2025, 17, e12964. [Google Scholar] [CrossRef] [Scilit]
  7. Fredriksson, D.W.; Swift, M.R.; Irish, J.D.; Tsukrov, I.; Celikkol, B. Fish cage and mooring system dynamics using physical and numerical models with field measurements. Aquac. Eng. 2003, 27, 117–146. [Google Scholar] [CrossRef] [Scilit]
  8. Pang, G.; Zhang, S.; Liu, H.; Zhu, S.; Yuan, T.; Li, G.; Han, X.; Huang, X. Hydrodynamic response analysis for a new semi-submersible vessel-shaped fish farm platform based on numerical simulation. Front. Mar. Sci. 2023, 10, 1135757. [Google Scholar] [CrossRef] [Scilit]
  9. Lader, P.F.; Fredheim, A. Dynamic properties of a flexible net sheet in waves and current: A numerical approach. Aquac. Eng. 2006, 35, 228–238. [Google Scholar] [CrossRef] [Scilit]
  10. Kristiansen, T.; Faltinsen, O.M. Modelling of current loads on aquaculture net cages. J. Fluids Struct. 2012, 34, 218–235. [Google Scholar] [CrossRef] [Scilit]
  11. Fredriksson, D.W.; Swift, M.R.; Eroshkin, O.; Tsukrov, I.; Irish, J.D.; Celikkol, B. Moored fish cage dynamics in waves and currents. IEEE J. Ocean. Eng. 2005, 30, 28–36. [Google Scholar] [CrossRef] [Scilit]
  12. Tang, H.J.; Yang, R.Y.; Yao, H.C. Experimental and numerical study on the hydrodynamic behaviors of mooring line failure on a net cage in irregular waves and currents. Front. Mar. Sci. 2023, 10, 1122855. [Google Scholar] [CrossRef] [Scilit]
  13. Faltinsen, O.M. Sea Loads on Ships and Offshore Structures; Cambridge University Press: Cambridge, UK, 1990. [Google Scholar]
  14. Newman, J.N. Marine Hydrodynamics; MIT Press: Cambridge, MA, USA, 1977. [Google Scholar]
  15. Morison, J.R.; O’Brien, M.P.; Johnson, J.W.; Schaaf, S.A. The force exerted by surface waves on piles. J. Pet. Technol. 1950, 2, 149–154. [Google Scholar] [CrossRef] [Scilit]
  16. Liu, H.F.; Liu, Y. Numerical investigation on the dynamic response of the semi-submersible aquaculture platform in regular waves. Ocean Eng. 2024, 294, 116718. [Google Scholar] [CrossRef] [Scilit]
  17. Liu, H.F.; Zhao, T.H.; Liu, Y. Investigation on dynamic performance of semi-submersible aquaculture platform in two mooring forms. Ocean Eng. 2024, 297, 117092. [Google Scholar] [CrossRef] [Scilit]
  18. Li, G.; Li, X.; Xie, Y.; Zhao, C.; Peng, X. Experimental study on hydrodynamic performance of the semi-submersible vessel-shaped fish cage. Aquac. Eng. 2024, 107, 102482. [Google Scholar] [CrossRef] [Scilit]
  19. Miao, Y.J.; Ding, J.; Tian, C.; Chen, X.J.; Fan, Y.L. Experimental and numerical study of a semi-submersible offshore fish farm under waves. Ocean Eng. 2021, 225, 108794. [Google Scholar] [CrossRef] [Scilit]
  20. Liu, H.F.; Bi, C.W.; Xu, Z.; Zhao, Y.P. Hydrodynamic assessment of a semi-submersible aquaculture platform in uniform fluid environment. Ocean Eng. 2021, 237, 109656. [Google Scholar] [CrossRef] [Scilit]
  21. Hvas, M.; Folkedal, O.; Oppedal, F. Fish welfare in offshore salmon aquaculture. Rev. Aquac. 2021, 13, 836–852. [Google Scholar] [CrossRef] [Scilit]
  22. Johannesen, Á.; Patursson, Ø.; Kristmundsson, J.; Dam, S.P.; Mulelid, M.; Klebert, P. Waves and currents decrease the available space in a salmon cage. PLoS ONE 2022, 17, e0263850. [Google Scholar] [CrossRef] [Scilit] [PubMed]
  23. Szewczyk, T.M.; Morro, B.; Díaz-Gil, C.; Gillibrand, P.A.; Hardwick, J.P.; Davidson, K.; Aleynik, D.; Rey Planellas, S. Interactive effects of multiple stressors with significant wave height exposure on farmed Atlantic salmon (Salmo salar) welfare along an inshore–offshore gradient. Aquaculture 2024, 579, 740184. [Google Scholar] [CrossRef] [Scilit]
  24. Athammer, R.R.; Oppedal, F.; Hvas, M. Tolerance to fluctuating currents in farmed Atlantic salmon: A novel method to simulate offshore wave effects in the laboratory. Aquac. Environ. Interact. 2024, 16, 103–114. [Google Scholar] [CrossRef] [Scilit]
  25. Barbier, E.; Oppedal, F.; Hvas, M. Atlantic salmon in chronic turbulence: Effects on growth, behaviour, welfare, and stress. Aquaculture 2024, 582, 740550. [Google Scholar] [CrossRef] [Scilit]
  26. Liu, H.F.; Bi, C.W.; Xu, Z.; Zhao, Y.P. Numerical study on the flow environment for a novel design of net cage with a shielding device. Ocean Eng. 2022, 243, 110345. [Google Scholar] [CrossRef] [Scilit]
  27. Hu, Y.; Zhao, H.; Shi, W.; Bi, C.; Li, X. Numerical Study on Internal and External Flow Fields of the UHMWPE Cage. J. Mar. Sci. Eng. 2023, 11, 1881. [Google Scholar] [CrossRef] [Scilit]
  28. Wang, Z.; Niu, S.; Cui, C.; Gu, T.; Hu, F.; Feng, D.; Qu, X. Evaluation of a novel design of floating net cage with hybrid side and bottom nets in current. Appl. Ocean Res. 2025, 158, 104563. [Google Scholar] [CrossRef] [Scilit]
  29. Ding, W.W.; Jiang, J.Q.; Yue, W.Z.; Li, Y.Z.; Wang, W.S.; Sheng, S.W.; Chen, M. Numerical study on hydrodynamic performance of a new semi-submersible aquaculture platform. Appl. Sci. 2023, 13, 12652. [Google Scholar] [CrossRef] [Scilit]
  30. Liu, H.F.; Liu, Y.; Gui, F.; Sun, H.; Zhao, Y.P. Quantitative evaluation on the suitable flow region inside the shielding device of submersible aquaculture facility. Ocean Eng. 2023, 267, 113270. [Google Scholar] [CrossRef] [Scilit]
  31. Zhang, B.; Fu, Y.; Wang, H.; Wang, X. A novel wave-moored porous structure interaction framework for assessment of hydrodynamic behavior of aquaculture platforms. Ocean Eng. 2025, 330, 121238. [Google Scholar] [CrossRef] [Scilit]
  32. Jin, J.; Su, B.; Dou, R.; Luan, C.; Li, L.; Nygaard, I.; Fonseca, N.; Gao, Z. Numerical modelling of hydrodynamic responses of Ocean Farm 1 in waves and current and validation against model test measurements. Mar. Struct. 2021, 78, 103017. [Google Scholar] [CrossRef] [Scilit]
  33. American Bureau of Shipping (ABS). Requirements for the Certification of Offshore Mooring Chain; ABS: Houston, TX, USA, 2025. [Google Scholar]
Figure 1. Physical model of the semi-submersible truss aquaculture platform.
Jmse 14 01684 g001
Figure 2. Experimental arrangement and mooring layout within the wave flume.
Jmse 14 01684 g002
Figure 3. Structural layouts of case 0, the four add-on flow-guiding configurations (cases 1 to 4), and the deepened-netting configuration (case5).
Jmse 14 01684 g003
Figure 4. Extraction of the fish-school envelope, equivalent upwave boundary, and passive displacement.
Jmse 14 01684 g004
Figure 5. Comparison between manually identified and automatically extracted fish-school-boundary displacements for 15 representative validation frames selected from the tested wave-period conditions. These frames were used as representative samples for manual validation of the image-processing procedure and do not constitute an independent validation data set. The dashed line represents perfect agreement (y = x).
Jmse 14 01684 g005
Figure 6. Schematic of the grouped-mesh representation.
Jmse 14 01684 g006
Figure 7. Percentage change in the maximum fish-school passive displacement relative to case 0.
Jmse 14 01684 g007
Figure 8. Distribution of the maximum fish-school passive displacement.
Jmse 14 01684 g008
Figure 9. Percentage change in pitch amplitude relative to case 0.
Jmse 14 01684 g009
Figure 10. Distribution of pitch amplitudes.
Jmse 14 01684 g010
Figure 11. Percentage change in surge displacement relative to case 0.
Jmse 14 01684 g011
Figure 12. Distribution of surge displacements.
Jmse 14 01684 g012
Figure 13. Percentage change in heave displacement relative to case 0.
Jmse 14 01684 g013
Figure 14. Distribution of heave displacements.
Jmse 14 01684 g014
Figure 15. Percentage change in mooring-line tension relative to case 0.
Jmse 14 01684 g015
Figure 16. Distribution of mooring-line tension.
Jmse 14 01684 g016
Figure 17. First-order surge excitation force.
Jmse 14 01684 g017
Figure 18. First-order pitch excitation moment.
Jmse 14 01684 g018
Figure 19. First-order heave excitation force.
Jmse 14 01684 g019
Figure 20. Surge added mass.
Jmse 14 01684 g020
Figure 21. Pitch added moment of inertia.
Jmse 14 01684 g021
Figure 22. Heave added mass.
Jmse 14 01684 g022
Figure 23. Surge radiation damping.
Jmse 14 01684 g023
Figure 24. Pitch radiation damping.
Jmse 14 01684 g024
Figure 25. Heave radiation damping.
Jmse 14 01684 g025
Table 1. Structural and physical parameters of the six configurations.
ConfigurationCenter of Gravity, COG
(x, y, z)/m
Moments of Inertia
(Ixx, Iyy, Izz)/kg m2
Flow-Guiding Hood Length/mmSide-Baffle
Dimensions/mm
Additional Netting Depth/mm
case 0(0.88, 0.32, 0.12)(10.55, 63.31, 70.84)---
case 1(0.98, 0.31, 0.13)(10.41, 76.73, 83.87)360--
case 2(1.02, 0.31, 0.14)(10.69, 79.65, 86.84)360260 × 440-
case 3(1.05, 0.31, 0.12)(10.33, 79.18, 86.29)460--
case 4(1.04, 0.31, 0.13)(10.61, 81.84, 89.00)460260 × 440-
case 5(0.88, 0.32, 0.12)(10.55, 63.31, 70.84)--240
Disclaimer/Publisher’s Note: The statements, opinions and data contained in all publications are solely those of the individual author(s) and contributor(s) and not of MDPI and/or the editor(s). MDPI and/or the editor(s) disclaim responsibility for any injury to people or property resulting from any ideas, methods, instructions or products referred to in the content.