1. Introduction
International shipping underpins global production and trade but faces the combined pressures of increasing transport demand, long vessel service lives, and progressively more stringent decarbonization requirements. The Fourth IMO GHG Study 2020 established an important baseline for accounting for emissions from international shipping, while the 2023 IMO Strategy on Reduction of GHG Emissions from Ships set a direction toward net-zero GHG emissions by or around mid-century and introduced indicative checkpoints for 2030 and 2040 [
1,
2]. In parallel with the development of alternative fuels, propulsion systems, and energy-saving hull technologies, digital technologies offer a practicable means of improving the operational efficiency of the existing fleet, reducing avoidable sailing and port waiting, and strengthening coordination among vessels, ports, and logistics networks.
Artificial intelligence provides analytical and decision-support capabilities that can link maritime data acquisition with operational intervention. Shipboard sensors, main-engine records, Automatic Identification System (AIS) data, meteorological and sea-state observations, voyage plans, port-operation records, and market information constitute a heterogeneous data environment. Machine learning, deep learning, reinforcement learning, and intelligent optimization have been applied to fuel-consumption and emissions prediction, condition monitoring, predictive maintenance, speed and route optimization, hybrid-energy management, and vessel-arrival and berth coordination [
3,
4,
5]. The potential contribution of AI therefore extends beyond predictive accuracy to the integration of data acquisition, state estimation, operational decision-making, execution, and feedback.
Nevertheless, improvements in algorithmic performance should not be interpreted as direct evidence of real-world emissions reduction. Low prediction error within a single dataset or for a single vessel may not be reproducible across vessel classes, operating regions, seasons, and operating regimes. Similarly, fuel savings obtained through local speed or route optimization may be offset by schedule disruption, anchorage waiting, empty repositioning, or upstream fuel emissions. Data fusion, multi-vessel testing, transfer learning, digital twins, and federated learning have been investigated as responses to data heterogeneity, privacy constraints, and cross-context transfer [
6,
7,
8,
9,
10]. However, where baselines, system boundaries, and uncertainty reporting remain inconsistent, model error, scenario-based fuel savings, measured operational changes, and verified GHG reductions represent distinct levels of evidence.
Existing reviews provide a substantial basis for understanding maritime digitalization and emissions-reduction technologies, although their scope and analytical scale differ. Bai et al. [
11] reviewed vessel-emission reduction pathways encompassing green power, digital intelligence, and emissions control. Xiao et al. [
12] examined the applications, opportunities, and challenges of digital technologies in shipping decarbonization through bibliometric and thematic analyses. Zou et al. [
13] extended this perspective to maritime Internet technologies, automated port infrastructure, and institutional governance. Durlik et al. [
4] synthesized AI applications in fuel management, maintenance, routing, energy systems, and ports, whereas Spandonidis et al. [
14] emphasized cross-vessel generalizability, scenario variation, model robustness, and regulatory integration. Collectively, these studies identify technologies, thematic hotspots, and application domains, but rarely examine knowledge-producing actors, collaboration structures, thematic evolution, and changes in application scope within a single analytical framework.
Related reviews indicate a comparable degree of fragmentation. Bibliometric research on green shipping and reviews of big-data applications to port-service vessels identify machine learning, energy-efficiency management, port digitalization, and institutional constraints as interrelated domains [
15,
16]. Reviews of vessel energy-consumption and pollutant-emission prediction, fuel- and power-prediction models, and green intelligent shipping further suggest a shift from isolated comparisons of predictive accuracy toward cross-vessel generalization, decision integration, and deployment requirements, although evaluation criteria remain heterogeneous [
17,
18,
19]. From a sustainable-shipping management perspective, AI is more appropriately conceptualized as an enabling capability embedded in operational processes than as an independent emissions-reduction technology detached from equipment, fuel, organizational, and regulatory constraints [
20]. A structured comparison of six closely related reviews and one recent perspective [
4,
11,
12,
13,
14,
20,
21] is provided in
Section 4.1, where it bridges the empirical results and the interpretive synthesis.
Four research gaps can therefore be identified. First, the literature is distributed across maritime engineering, transportation, energy, logistics, and intelligent-computing communities, and the associated knowledge-production structure has not been characterized comprehensively. Second, existing science maps identify prominent themes but rarely integrate keyword clusters, timelines, citation bursts, highly cited studies, and document-level evidence to explain changes in the underlying research problems. Third, most reviews classify applications by algorithm or use case without specifying the mechanisms through which predictive performance may be converted into additional system-level emissions reduction. Fourth, no common analytical structure clearly distinguishes model accuracy, operationally feasible recommendations, adopted interventions, retained network-level benefits, and auditable carbon outcomes. In the absence of these distinctions, thematic prominence and citation impact may be interpreted incorrectly as evidence of technological maturity or verified decarbonization.
Representative empirical studies further delineate these evidentiary boundaries. The integration of voyage reports, AIS observations, shipboard sensor measurements, and weather data can introduce temporal-alignment errors, missingness, and measurement uncertainty [
22,
23]. Explainable fuel-consumption models, hybrid physics-machine-learning approaches, and multiscale time-series models address feature attribution, physical consistency, and temporal dependence, respectively [
24,
25,
26]. Near-real-time carbon accounting and federated learning additionally demonstrate that auditability, data privacy, statistical heterogeneity, and communication conditions affect deployment [
27,
28]. These studies inform the interpretation of bibliometric patterns but do not provide a common basis for pooling effect sizes. Accordingly, publication counts, network positions, and keyword prominence are not treated as proxies for validated emissions-reduction performance.
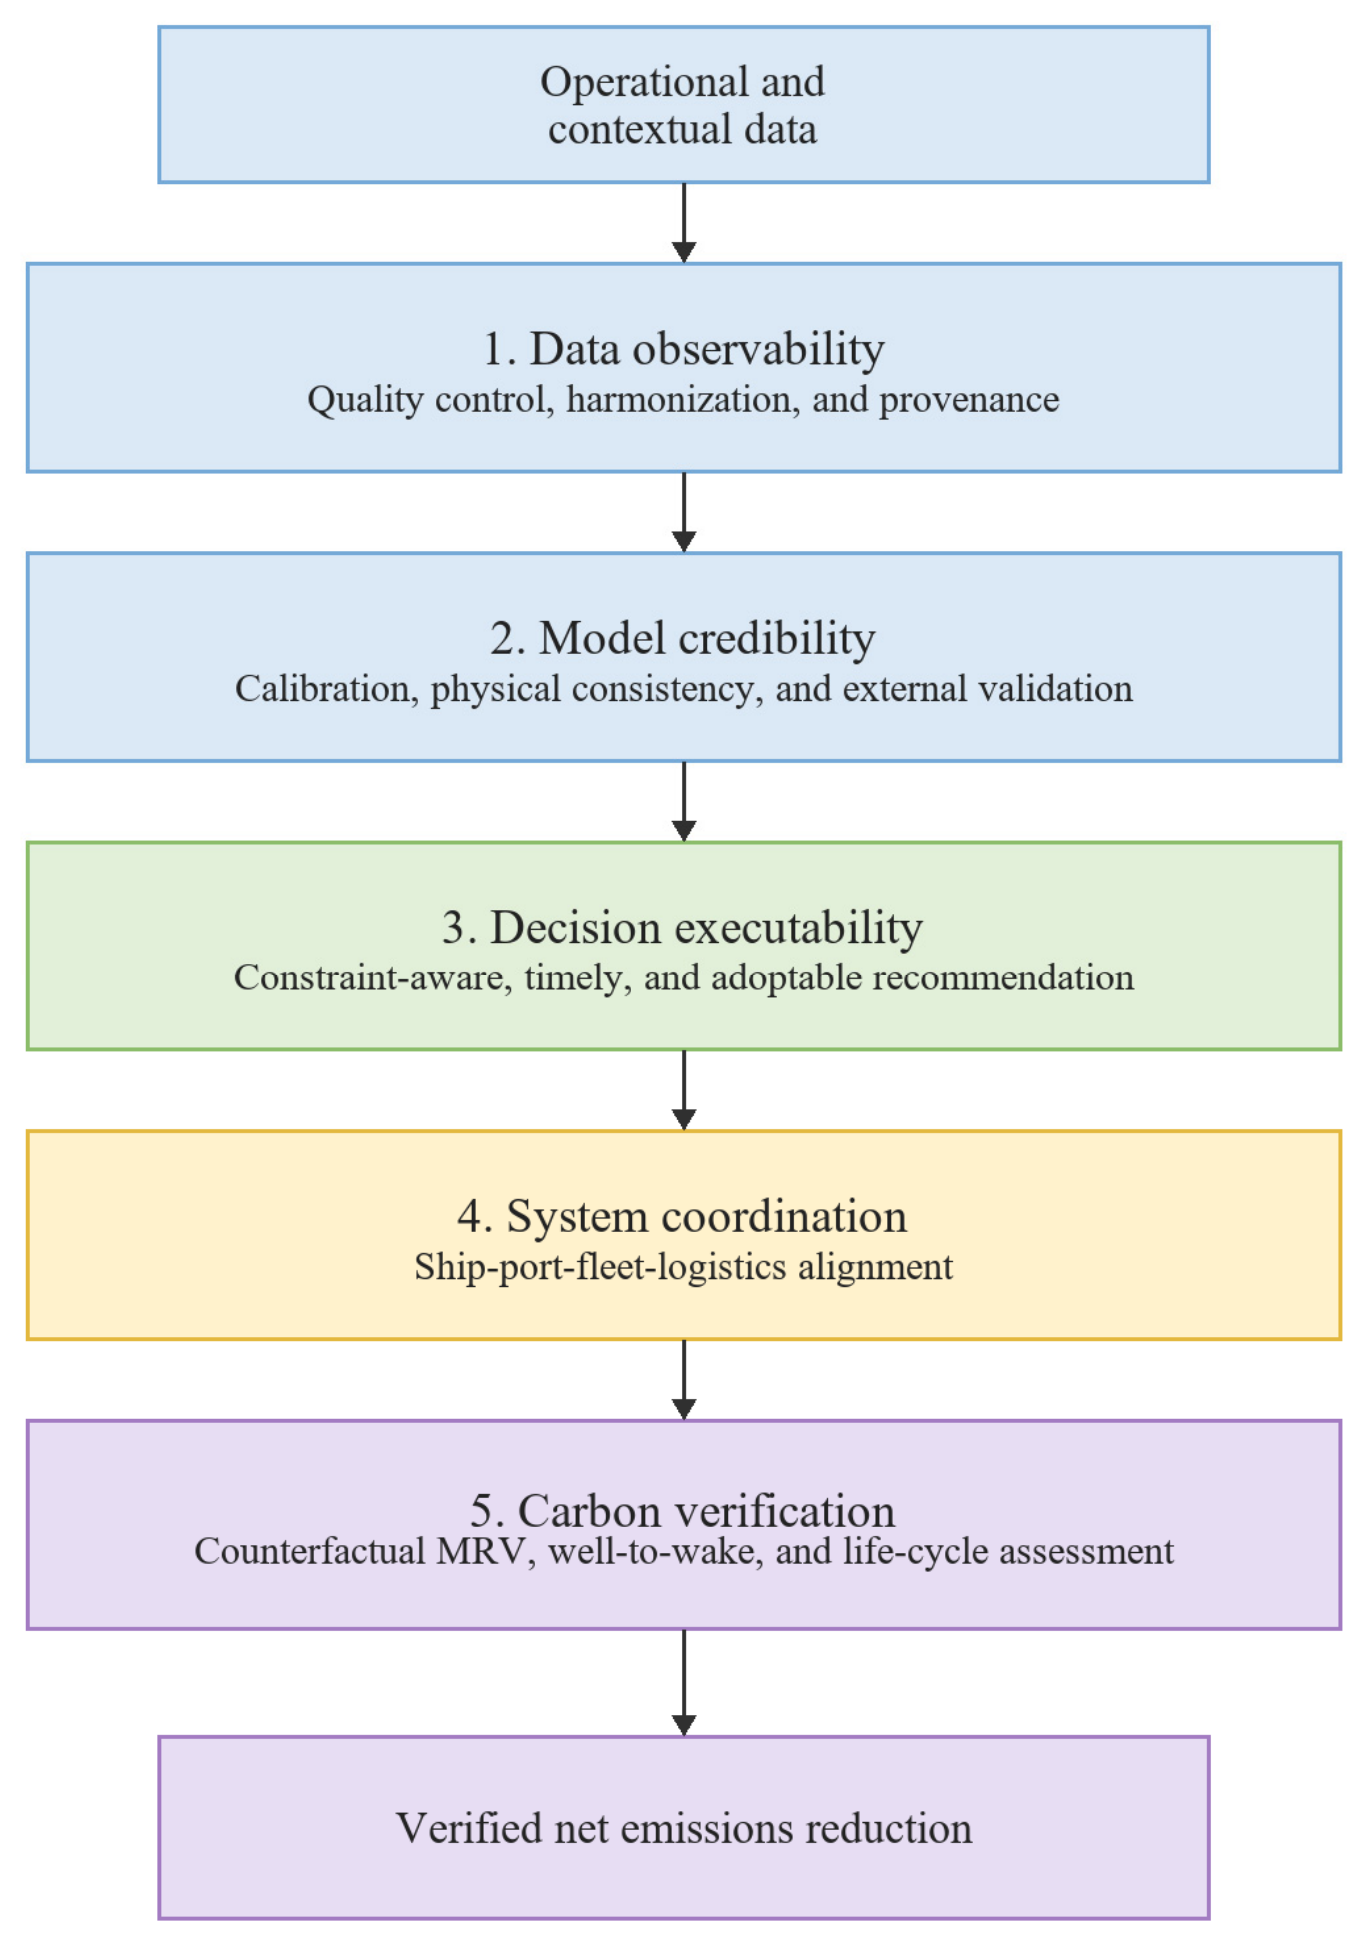
To address these gaps, the review integrates four empirical perspectives with an interpretive conversion perspective. Publication and collaboration analyses characterize knowledge production; keyword-network and temporal analyses identify thematic structure and evolution; highly cited studies reveal influential and reusable problem formulations; and auxiliary document-level coding assesses changes in the scale of research problems. The conversion perspective evaluates whether relevant maritime states are adequately observed, whether models remain credible beyond their development samples, whether recommendations are operationally executable, whether benefits are retained through coordination among vessels, ports, fleets, and logistics networks, and whether the resulting carbon effect is additional and auditable. These stages constitute the AI-to-Carbon Value Chain developed in
Section 4.
Accordingly, the relevant unit of analysis is the socio-technical intervention through which an algorithm may affect maritime operations and carbon outcomes, rather than the algorithm in isolation. The review includes studies in which AI methods have a substantive relationship with low-carbon shipping objectives, including prediction, diagnosis, optimization, control, digital twins, and multi-source data applications. It neither assumes the universal superiority of a particular algorithm nor aggregates fuel-saving estimates derived from incommensurable baselines and system boundaries. AI is also not treated as a substitute for alternative fuels, propulsion systems, or energy-saving hardware. The analysis instead examines the conditions under which carbon value may be generated, attenuated, displaced, or rendered unverifiable as information is translated into operational action.
Differences in decision targets further motivate the analysis. Reviews of vessel trajectories and weather routing emphasize the joint consideration of safety, voyage time, and energy-consumption constraints, whereas reviews of integrated optimization extend the analytical boundary to vessels, ports, and transport networks [
29,
30]. Reviews of port-area emissions monitoring, resilient energy management, maritime microgrids, and shipboard renewable-energy systems indicate that AI applications have expanded from propulsion and energy-consumption prediction to monitoring, scheduling, and coordinated multi-energy control [
31,
32,
33]. By contrast, reviews of sustainable ship design and maritime artificial neural networks remain focused primarily on the classification of methods and applications, with less attention to external validation and measured emissions reductions under operational conditions [
34,
35]. These differences provide the immediate basis for the research questions.
On the basis of the identified gaps and analytical boundaries, the review addresses four interrelated research questions:
RQ1: What patterns and changes are evident in the publication output, leading journals, institutions, authors, countries, and collaboration networks of research on the AI-enabled low-carbon transition in shipping from 2016 to 2026?
RQ2: What core themes and knowledge clusters have formed in this field, what constitutes its high-impact intellectual base, and how have its stage-specific research frontiers evolved?
RQ3: How has the application focus evolved along the pathway from data and prediction to constrained decisions, ship-port-fleet coordination, and verifiable low-carbon outcomes?
RQ4: When does AI add value to emissions reduction in shipping? More specifically, under what data, model, operational, organizational, and carbon-accounting conditions can AI generate additional and persistent emissions reductions, and what research agenda follows from those conditions?
This review makes three principal contributions. First, it maps the knowledge-production landscape, thematic structure, temporal evolution, and influential intellectual base of 479 publications drawn from the Web of Science Core Collection and Scopus while explicitly accounting for duplicate removal, partial-year observation, citation lag, full-counting procedures, and query spillover. Second, bibliometric mapping is supplemented with non-exclusive document-level thematic coding and full-text synthesis of six representative reviews and one perspective [
4,
11,
12,
13,
14,
20,
21], thereby distinguishing changes in scholarly attention from evidence of practical effectiveness. Third, to answer RQ4, the review organizes the conditions and evidence gaps identified in the literature through an evidence-informed AI-to-Carbon Value Chain synthesis comprising data observability, model credibility, decision executability, system coordination, and carbon verification. The associated propositions are offered as hypotheses for prospective testing, not as validated claims about intervention effects.
2. Data Collection and Methodology
2.1. Data Collection and Information Retrieval
Reporting was guided by the PRISMA 2020 statement [
36], adapted to the systematic bibliometric review and nested full-text synthesis.
This study adopted a bibliometric review design integrating descriptive analysis and science mapping. Records were retrieved from the Web of Science Core Collection (WoSCC) and Scopus, and the final searches and exports were completed on 23 August 2026. The search framework combined AI technologies, low-carbon shipping objectives, and maritime application contexts to characterize research output, knowledge-producing actors, collaboration networks, thematic structure, and the evolution of research fronts.
The search query comprised three concept sets corresponding to technology, low-carbon objectives, and maritime applications. The technology set covered artificial intelligence and its principal methodological branches; the objective set covered low-carbon development, emissions reduction, energy efficiency, and green shipping; and the application set restricted the context to maritime transport, vessels, fleets, ports, and shipping logistics. The three sets were combined with the Boolean operator AND, while synonyms within each set were combined with OR. This structure was intended to reduce dependence on individual terms and to require simultaneous technological, decarbonization, and maritime relevance.
Records entered the main bibliometric corpus (
Table 1) when they (1) were retrieved by the three-concept database query; (2) were classified as an Article or Review; (3) were published between 1 January 2016 and 23 August 2026; and (4) were in English after cross-database deduplication. No record was excluded from the 479-record main corpus through a post hoc topical judgment. Separately, the domain-validation sensitivity analysis required simultaneous evidence of (i) an AI or data-driven method, (ii) a maritime-shipping or port context, and (iii) a low-carbon, energy-efficiency, fuel-consumption, or emissions objective in the title and abstract, with author-keyword evidence additionally permitted by the broader rule. This distinction preserves the prespecified main maps while allowing the influence of peripheral query matches to be assessed transparently.
The AI-related term set included machine learning, deep learning, neural network, reinforcement learning, data mining, predictive analytics, intelligent optimization, and digital twin, thereby covering major methodological categories such as conventional machine learning, deep neural networks, intelligent optimization, and digital simulation. The low-carbon shipping term set included green shipping, sustainable shipping, maritime decarbonization, ship emission, CO2 emission, energy efficiency, and fuel consumption, reflecting multiple levels of research content from emission outcomes to energy-efficiency processes.
The maritime-transport context set included the search terms maritime transport*, shipping industr*, ocean shipping, waterborne transport*, shipping logistics, maritime logistics, green port*, and smart port*, which helped prevent the results from being overly weighted toward research on general transportation or energy systems. The NEAR/3 proximity operator linked ship*, vessel*, or fleet* with context terms including maritime, ocean*, navigat*, route*, cargo, and container, thereby strengthening their semantic association and improving the focus and interpretability of the literature screening.
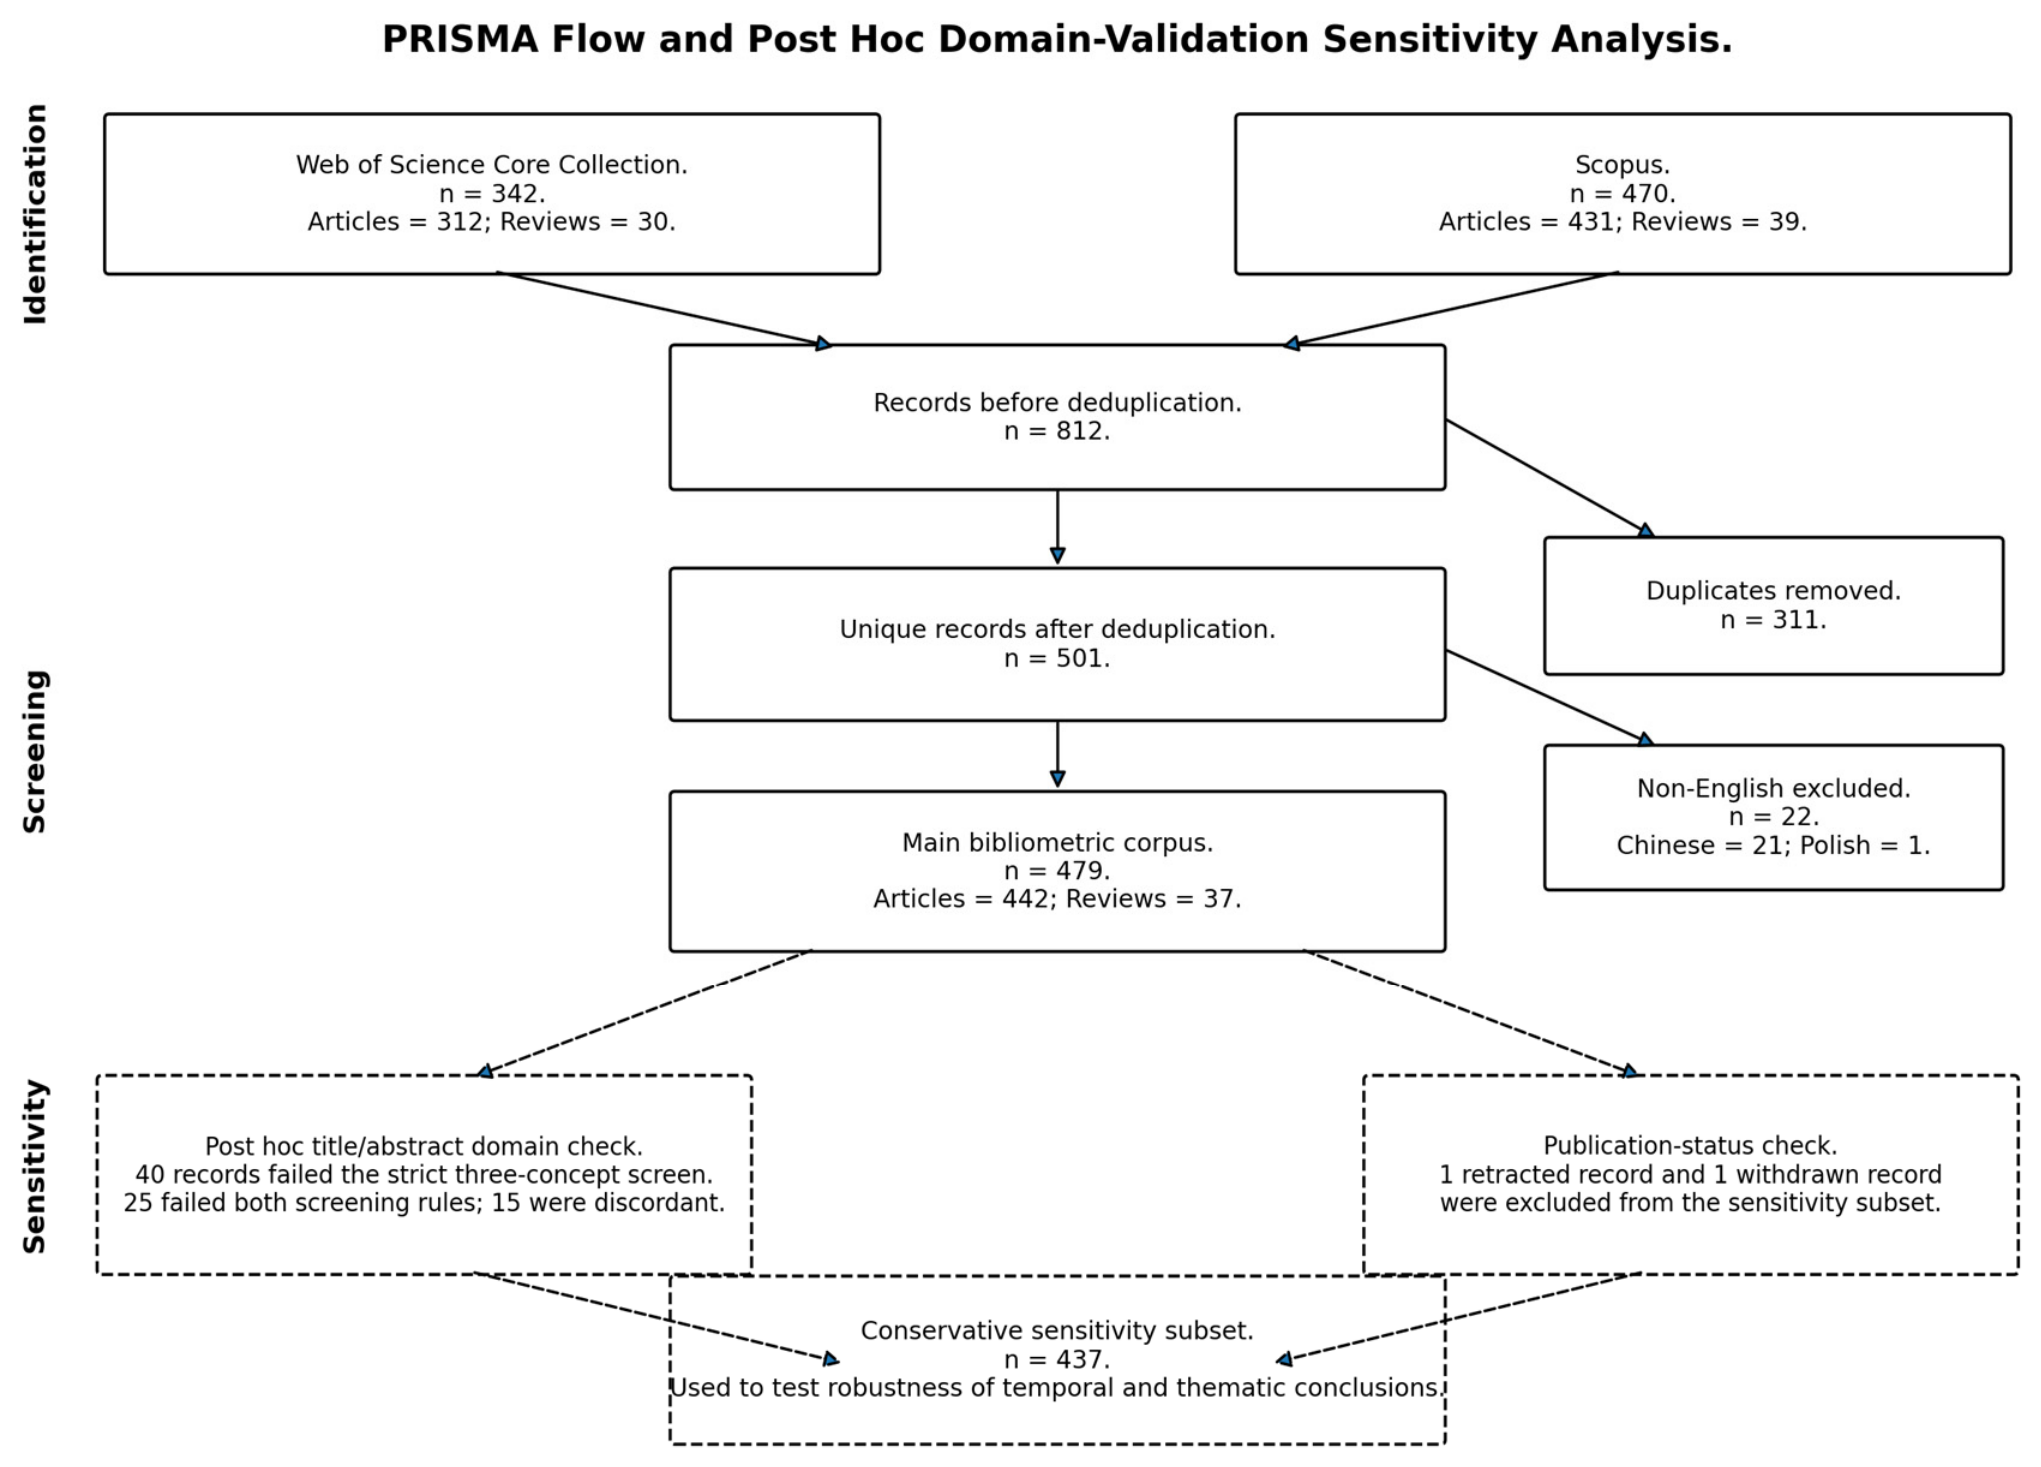
The initial searches returned 812 records, comprising 342 records from WoSCC and 470 from Scopus. After cross-database deduplication, 311 duplicate records were removed, yielding 501 unique records. A subsequent language filter excluded 22 non-English records, resulting in a final bibliometric sample of 479 English-language articles and reviews. The final sample was used to analyze annual publication output, countries and regions, institutions, journals, authors, keywords, collaboration networks, and highly cited publications; this sequence of counts is consistent with
Figure 1. See
Supplementary Tables S1 and S2.
The reduction from 812 initially retrieved records to the final 479 included publications should not, by itself, be interpreted as evidence of thematic precision. The principal reduction arose from duplicate removal between WoSCC and Scopus, followed by the prespecified restriction to English-language records. Articles and reviews were retained to focus the analysis on peer-reviewed original research and synthesis, and the study period captured developments from early data-driven modeling to deep learning, federated learning, energy management, and digital twins. The screening sequence was reported in accordance with the transparency principles of PRISMA 2020 [
36]. Because the 2026 dataset ended on 23 August, observations for that year were treated as partial and were not compared inferentially with complete years.
The language restriction was imposed to maintain comparability across merged bibliographic and citation fields. Topical rules were applied only in the post hoc domain-validation sensitivity analysis and did not determine membership in the 479-record main corpus. The design necessarily excluded non-English publications, conference papers, and some industry reports from the main sample.
2.2. Bibliometric Analysis and Science Mapping
Following identification of the final sample, bibliometric analysis and science mapping were undertaken to address RQ1 and RQ2. Microsoft Excel 2021 was used to verify annual and cumulative publication counts and ranking data. R version 4.3.1 with bibliometrix version 4.1.3 was used to calculate descriptive statistics for journals, authors, institutions, countries or regions, and citation indicators [
37]. VOSviewer version 1.6.20 and CiteSpace 6.4.R1 Advanced were used to construct collaboration and co-occurrence networks and to perform keyword clustering, timeline analysis, and burst detection.
Descriptive indicators comprised publication output, total citations, mean citations per publication, and annual distribution. Relational indicators comprised total link strength (TLS), collaboration links, and keyword co-occurrence, while temporal indicators included mean publication year, time-sliced author-network structure, keyword timelines, and burst strength. Publication output was used to characterize the scale of knowledge production, whereas citation indicators were interpreted as measures of scholarly visibility within the observation window rather than as direct measures of research quality, technological maturity, or emissions-reduction effectiveness. Cross-year comparisons were descriptive because 2026 was incomplete and recent publications were subject to citation lag.
Full counting was applied to countries or regions, institutions, and authors; consequently, a publication involving multiple entities contributed one count to each participating node. The sum of node-level publication counts could therefore exceed 479 and represents participation intensity rather than mutually exclusive shares. Mean citations per publication and TLS were interpreted as indicators of citation visibility and network connectivity, respectively, and were not used to infer causal differences in research quality. Fractional counting was not adopted because the review sought to represent visible participation and collaboration connectivity rather than proportional ownership of output.
VOSviewer was used to construct co-authorship networks for countries or regions, institutions, and authors, together with a journal citation network and a keyword co-occurrence network [
38]. Full counting was retained throughout. For the cumulative exports, the minimum display thresholds recovered from the node files were four publications for authors, four publications for institutions, two publications for countries or regions, three publications for source journals, and five occurrences for keywords; the corresponding networks contained 38, 44, 45, 32, and 49 nodes, respectively. Following the logic of explicit period-specific collaboration-network reconstruction used by Hu et al. [
39], additional author co-authorship networks were reconstructed for 2016–2022, 2023–2024, 2025, and 2026 using a minimum threshold of two documents per author; the four panels contained 24, 60, 38, and 53 nodes, respectively. Network, temporal-overlay, density, and time-sliced visualizations were used to represent structural relationships, temporal distributions, and areas of concentrated activity. In the revised manuscript, temporal change is represented by time-sliced author networks and by corresponding journal, institution, country or region, and keyword overlay maps.
Node size represented publication output or occurrence frequency, while links and TLS represented the strength of collaboration, co-occurrence, or citation relationships. Color denoted network clusters or mean temporal attributes. Thresholding was applied only to improve graphical legibility; low-frequency nodes omitted from the visualizations remained part of the 479-record main corpus. No global VOSviewer thesaurus file was applied to the displayed maps after database conversion, so some source-journal and geographic label variants inherited from WoSCC and Scopus remained visible as separate nodes. These variants were retained rather than harmonized retrospectively because doing so would change the exported network structure after analysis.
The three visualization modes served complementary purposes. Network visualization identified prominent nodes and inter-cluster relationships; overlay visualization indicated the relative recency of nodes; and density visualization showed areas of high occurrence and connectivity. These visualizations were used to characterize knowledge structure and thematic evolution. Node size, spatial position, and color were not interpreted as direct evidence of technological effectiveness.
CiteSpace was used for keyword clustering, timeline analysis, and burst detection [
40]. The nominal time span was 2000–2026 with one-year slices; because the sampled literature began in 2016, the effective observation period was 2016–2026. Keywords were selected as the node type, and the g-index was applied with k = 25. The archived project outputs support these settings, but they do not provide a sufficiently reliable record of a named pruning preset; accordingly, no retrospective Pathfinder or sliced-network pruning setting is claimed in this revision. Cluster labels were checked against constituent keywords, representative publications, and temporal distributions, and the keyword timeline complements the VOSviewer overlay maps as the principal temporal analysis of stage-specific topic evolution.
Keyword clustering identified thematic units with similar co-occurrence profiles; timeline analysis traced the emergence and persistence of themes; and burst detection identified terms exhibiting rapid, period-specific increases. Automatically generated cluster labels were checked against constituent keywords, representative publications, and temporal distributions to avoid relying exclusively on algorithmic labels.
Network modularity (Q) and the mean silhouette coefficient (S) were used to assess separation between clusters and consistency within clusters, respectively. These statistics informed the interpretation of themes including fuel consumption, deep learning, sustainable shipping, federated learning, and wind-assisted propulsion. Thematic prominence, network position, and citation impact were not treated as evidence of technological maturity or operational emissions reduction; these evidentiary distinctions are examined in
Section 4.
2.3. Auxiliary Thematic Coding and Framework Synthesis
To relate the science maps to changes in research design, auxiliary document-level coding was applied to the title, author keywords, Keywords Plus, and abstract fields of all 479 records. Eight non-exclusive signal categories were specified: prediction and estimation; operational optimization and control; ship-port-network coordination; digital infrastructure; carbon accounting and governance; privacy, security, and data collaboration; generalization, explanation, and uncertainty; and deployment and external validation. Categories were operationalized through explicit term families and used for descriptive purposes. A record could be assigned to multiple categories, and term occurrence was not interpreted as evidence of model quality, deployment maturity, or emissions-reduction effectiveness. Coding rules were developed from explicit term families, refined through iterative author discussion on ambiguous abstracts, and then applied consistently across the full corpus. Consistency checks were performed by cross-checking uncertain assignments among the authors responsible for data curation and validation (X.L., S.Q., C.W., and M.Y.), with remaining disagreements resolved by consensus before category frequencies were finalized. Because the coding is a descriptive, non-exclusive signal audit rather than a psychometric instrument, formal inter-rater reliability coefficients were not treated as a primary validity claim; the procedure is reported to support transparency, and residual ambiguity is acknowledged as a methodological limitation in
Section 5.1.
The eight non-exclusive categories were used to organize document-level signals across the full corpus. Temporal evolution was interpreted from annual output, the time-sliced author networks, temporal-overlay maps, the keyword timeline, and burst analysis rather than from an unreported period-by-category frequency comparison. Because observations for 2026 ended on 23 August, the most recent interval was treated as partial. Full texts of six representative reviews and one perspective [
4,
11,
12,
13,
14,
20,
21] were subsequently examined to compare application taxonomies, conceptual frameworks, reported limitations, and future agendas across ship-emission technologies, digital decarbonization, AI-enabled shipping, intelligent maritime infrastructure, and smart-port governance. The framework presented in
Section 4 was developed from patterns supported jointly by bibliometric, document-level, and full-text evidence.
To improve the transparency of the AICV evidence matrix, a separate post hoc record-level evidence audit was conducted across all 479 records. Five non-exclusive evidence categories corresponding to data observability, model credibility, decision executability, system coordination, and carbon verification were operationalized using predefined term families, stage-specific semantic rules, and a maritime-context condition. Coding was applied only to the title, author keywords, Keywords Plus, and abstract fields; publication year was used only to examine the temporal distribution of system-coordination signals, and DOI and UT were retained only for record tracking. A record could contribute to more than one AICV stage. Positive classification indicated the explicit presence of a stage-related bibliographic evidence signal and was not interpreted as proof of successful deployment, study quality, causal effectiveness, or verified emissions reduction. The cited-reference field was excluded to prevent concepts appearing only in referenced literature from being attributed to the focal record. The matched term families and field-level evidence snippets were retained in the accompanying record-level audit workbook, and stage-specific counts and percentages are reported in the manuscript.
A conservative relevance audit was conducted because broad combinations of technology, sustainability, and maritime terms can retrieve peripheral records in which references to containers, fleets, transport, or marine environments do not represent a substantive AI-shipping-decarbonization relationship. To quantify this issue without retrospectively altering the prespecified maps, a post hoc domain-validation sensitivity analysis was added. Two independently deterministic screening rules were applied to the title and abstract fields, with the broader rule also allowing author-keyword evidence. Both rules required simultaneous evidence of (i) an AI or data-driven method, (ii) a maritime-shipping or port context, and (iii) a low-carbon, energy-efficiency, fuel-consumption, or emissions objective. The two rules agreed on 96.87% of the 479 records, with Cohen’s kappa = 0.753. A total of 25 records failed both rules, and 15 were discordant, so 40 records were classified as peripheral or marginal under the strict title-abstract screen.
2.4. PRISMA-Specific Reporting Clarifications
Dataset curation was undertaken by X.L. and S.Q., and validation was undertaken by C.W., M.Y., and S.Q., as stated in the author-contribution statement. These activities were collaborative rather than a prospectively specified, duplicate-independent screening and extraction process. No automation tool made prospective eligibility decisions for the 479-record main corpus. The deterministic domain-validation rules described in
Section 2.5 were applied only as a post hoc sensitivity analysis and did not remove records from the main bibliometric maps; the separate post hoc AICV evidence audit described in
Section 2.3 quantified bibliographic evidence signals without making eligibility decisions or validating the AICV as a measurement scale. No study investigators were contacted.
Data collection used the bibliographic fields required for the analyses, including title, abstract, author keywords, Keywords Plus, authorship, affiliation, source, citation, document type, language, and publication year. Scopus records were converted to a WoS-compatible tagged format prior to merging so that a harmonized dataset could be processed in the same analytical workflow. Missing or unclear bibliographic values were not imputed. All 479 records contributed to the descriptive, science-mapping, and document-level coding analyses.
Six representative reviews and one perspective [
4,
11,
12,
13,
14,
20,
21] were purposively selected from the 479-publication corpus as a nested full-text subset for comparing application taxonomies, conceptual frameworks, limitations, and future agendas. They did not constitute a separate eligibility sample. No full-text report was excluded after this purposive selection, and the remaining 472 publications were retained in the bibliometric corpus.
No outcome-level effect measure was prespecified, and no effect sizes were pooled. Accordingly, no meta-analysis, statistical-heterogeneity investigation, or effect-size sensitivity analysis was undertaken. Because the review addresses knowledge production and thematic structure rather than comparative intervention effects, no formal study-level risk-of-bias tool, missing-results/reporting-bias assessment, or GRADE/CERQual certainty assessment was applied. These omissions restrict causal and outcome-level inference and are treated as review limitations.
The initial 812 records were reduced by duplicate removal (n = 311) and language screening (n = 22), yielding the prespecified 479-record English-language bibliometric corpus. No topical records were removed from the main network analyses after those maps had been generated. For sensitivity analysis, the strict title-abstract rule retained 439 records. A publication-status check identified one retracted article and one withdrawn article within this strict set; both were excluded from the sensitivity subset, yielding n = 437. The revised PRISMA diagram therefore distinguishes the 479-record main bibliometric corpus from the 437-record conservative sensitivity subset rather than presenting the latter as a replacement corpus.
This review was not prospectively registered; no formal protocol was prepared or published, and no registration or protocol amendments therefore occurred.
2.5. Post Hoc Domain-Validation, Coding-Robustness, and Emerging-Term Checks
The conservative sensitivity subset was used only to test the stability of headline conclusions. Relative to the full 479-record corpus, the share of publications from 2022 to 2025 changed only from 57.83% to 58.81%, and the share from 2023 through the partial year 2026 changed from 79.75% to 81.92%. The leading source-journal structure was also stable: Ocean Engineering remained first (65 records in the sensitivity subset), followed by Journal of Marine Science and Engineering (46), while Transportation Research Part E, Energy, and other core outlets remained prominent. Likewise, machine learning remained the leading author keyword (96 occurrences), followed by artificial intelligence (26), energy efficiency (24), deep learning (23), and decarbonization (19). These comparisons indicate that the main temporal and thematic conclusions are not driven by the records flagged as peripheral or marginal.
Robustness of the eight non-exclusive auxiliary coding categories was assessed with two independently specified term-family lexicons applied to the same bibliographic fields. Mean agreement across the eight categories was 90.0%, with a mean Cohen’s kappa of 0.756; category-specific agreement ranged from 72.2% to 97.1% and kappa values from 0.482 to 0.893. The lower agreement for carbon-accounting and governance signals reflected the difference between a narrow accounting lexicon and a broader decarbonization-policy lexicon. This deterministic robustness check supports the directional use of the coding categories but is not presented as a substitute for duplicate-independent human coding.
An emerging-AI term-coverage audit was also conducted within the retrieved 479-record corpus. AutoML appeared in one record, graph neural network/GNN terminology in five records, and large language model/LLM terminology in two records; graph attention network/GAT, knowledge distillation, foundation model, and generative-AI terminology were not identified in the retrieved corpus. These findings show that broad parent concepts such as machine learning and deep learning already captured some newer subfamilies, but this within-corpus audit cannot estimate how many additional records an independently rerun expanded database query might retrieve.
3. Bibliometric Results
3.1. Annual Publication Trends
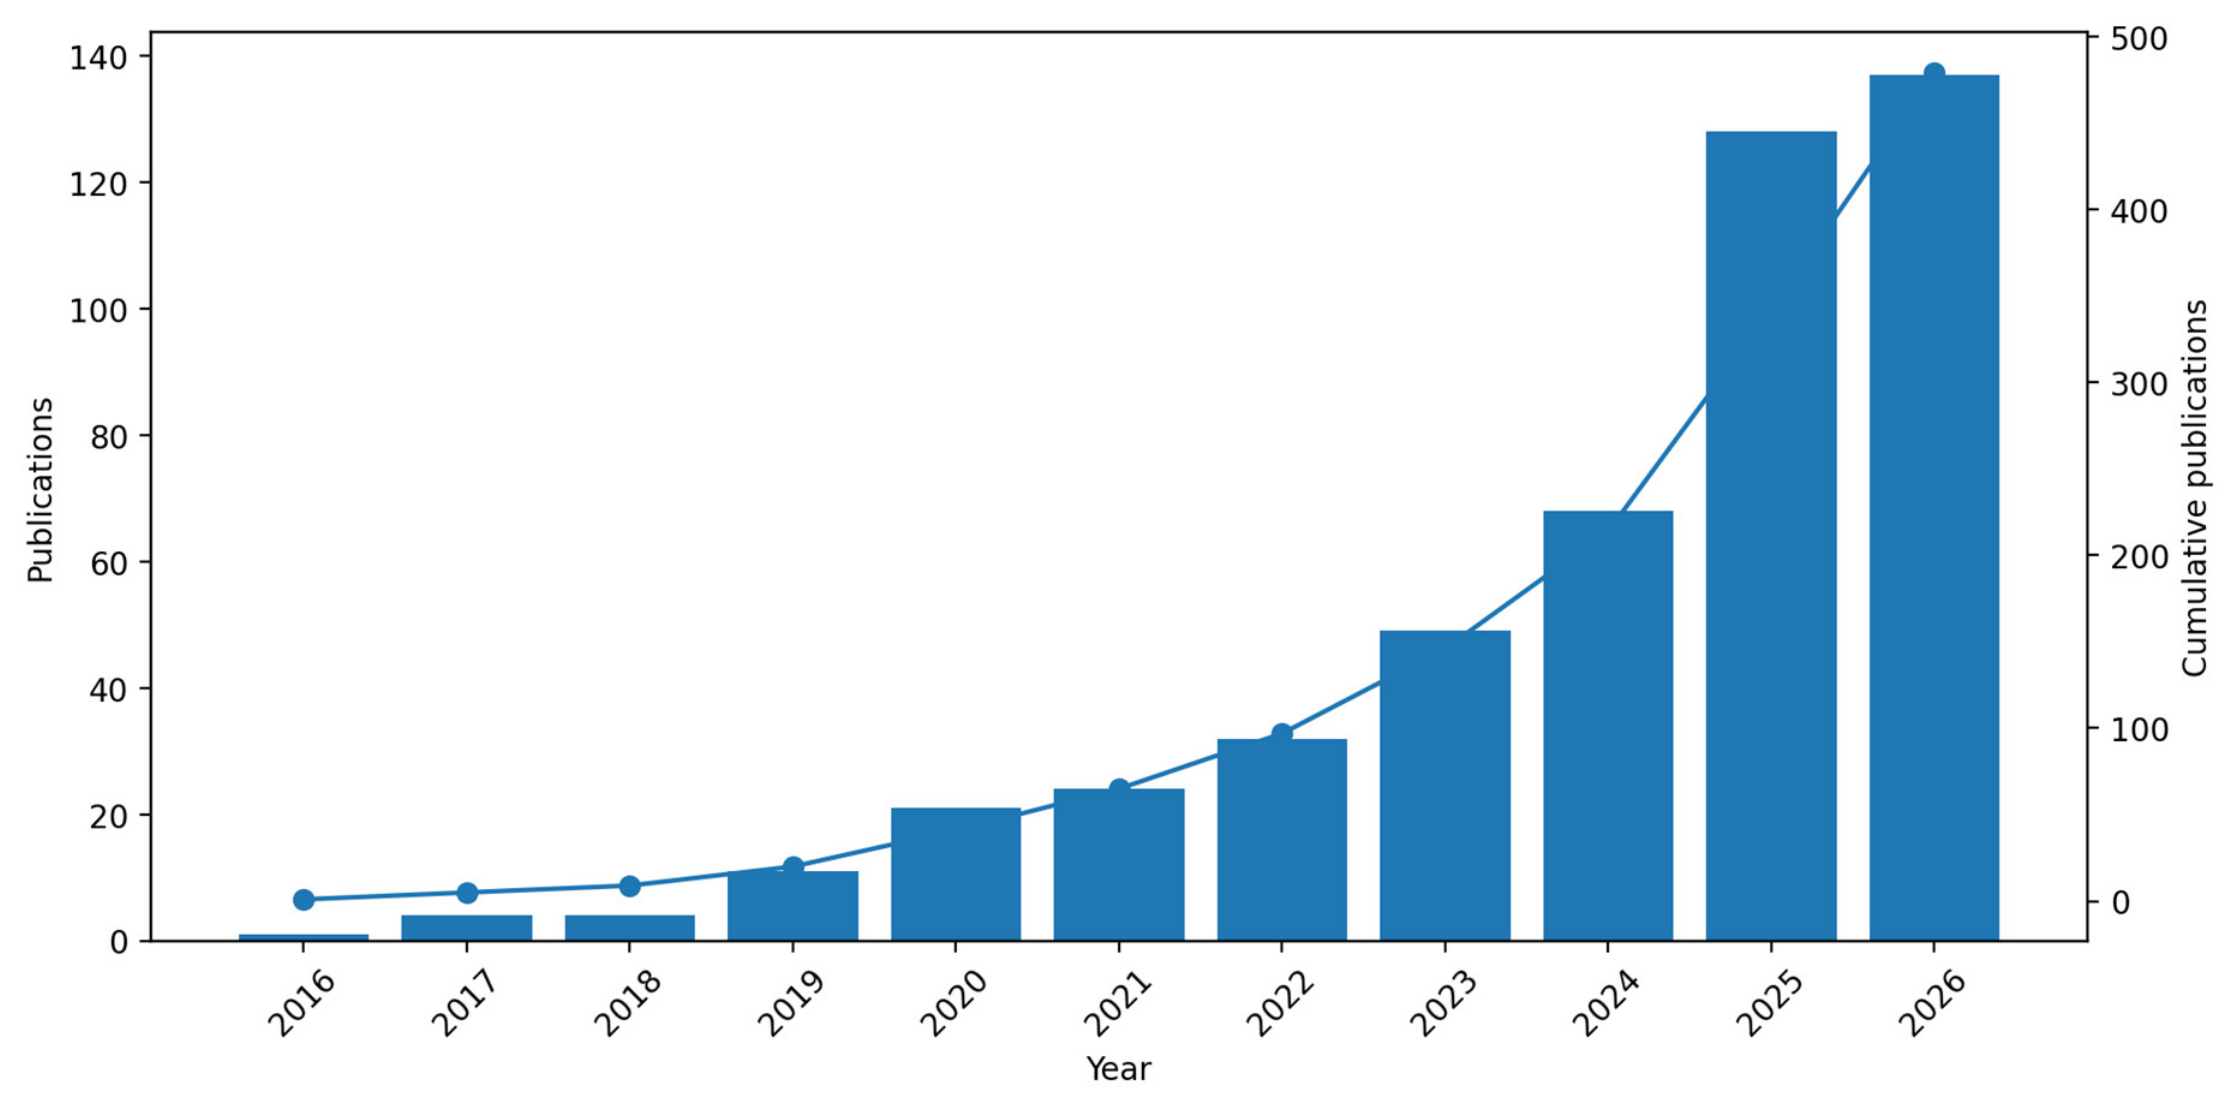
Annual and cumulative publication counts (
Figure 2 and
Table 2) indicate pronounced growth in research on AI-enabled low-carbon shipping between 2016 and 2026. Only 1 publication appeared in 2016, followed by 4 publications in both 2017 and 2018 and 11 in 2019, yielding a cumulative total of 20 publications by the end of 2019. This pattern indicates that the field remained nascent during its initial stage, with only scattered studies linking AI methods to shipping decarbonization and operational efficiency.
Publication activity remained limited during the initial period, indicating that an interdisciplinary research community at the intersection of AI and low-carbon shipping had not yet become established by 2016. Early studies generally comprised discrete methodological investigations focused on ship-fuel-consumption estimation, speed adjustment, or the optimization of local operating parameters. The restricted availability of operational data, together with the combined effects of weather, sea state, vessel loading, and route conditions on energy use and emissions, constrained sample size, model generalizability, and the range of application contexts.
Although publication output remained limited during 2018–2019, the observed increase coincided with growing recognition that conventional empirical models and individual statistical techniques were insufficient to represent the nonlinear energy-consumption patterns of complex shipping systems. The expanding availability of Automatic Identification System (AIS), ship-monitoring, and port-operational data provided a broader empirical basis for AI applications and preceded the subsequent expansion of the field.
Publication output increased steadily after 2020. The sample included 21 publications in 2020, 24 in 2021, and 32 in 2022, bringing cumulative output to 97. Annual output then rose to 49 publications in 2023 and 68 in 2024, before reaching 128 in 2025, the highest level among complete years. By 23 August 2026, 137 publications had already been indexed, indicating that the field had entered a phase of rapid expansion.
The acceleration after 2020 coincided with two related developments in the research and policy environment. First, intensifying scholarly and regulatory attention to GHG mitigation, vessel energy efficiency, and green-port development placed decarbonization more prominently on the maritime research agenda. Second, the wider methodological diffusion of machine learning, deep learning, reinforcement learning, and digital twins across transport and energy research provided tools that could be adapted to maritime applications. Together, these developments were associated with a transition from dispersed investigations to sustained growth in scholarly output. This interpretation concerns the timing of publication activity and should not be read as direct evidence of industrial AI deployment or verified operational uptake; bibliometric expansion is consistent with, but does not demonstrate, technology adoption in commercial fleets or ports.
The sharp increase during 2025 and the already substantial 2026 partial-year count indicate that the topic has moved beyond an exploratory niche toward a broadly recognized interdisciplinary research area. The recent surge also suggests that many studies remain method-oriented and that the empirical evidence base will likely continue to diversify in terms of vessel type, data source, operational scenario, and decarbonization target.
Cumulative output reached 65 publications during 2016–2021, whereas 277 publications appeared during the complete years 2022–2025, accounting for 57.83% of the dataset. If the partial year 2026 is included, 414 publications were published during 2022–2026, representing 86.43% of the sample. The expansion of the field was therefore concentrated in the most recent years.
The strong concentration of publications after 2022 underscores the recency of the evidence base. Much of the literature consequently remains focused on model development, scenario-based validation, and methodological comparison rather than on long-term operational deployment and verified carbon outcomes.
The recent acceleration in publication output is consistent with a phase of conceptual consolidation and methodological selection. The literature variously frames low-carbon transition in terms of fuel savings, emissions mitigation, energy efficiency, green ports, and decarbonization strategies. This diversity broadens the analytical landscape but also creates a need for integrative synthesis and consistent evaluation. Bibliometric analysis provides a means of positioning these dispersed research strands within a common analytical structure.
The temporal distribution of publications is also consistent with an expansion in the scale of AI applications examined in the literature. Whereas early studies predominantly evaluated predictive accuracy, recent work has increasingly addressed data fusion, real-time decision support, multi-actor coordination, and low-carbon performance assessment. This development positions AI, in scholarly discourse, less as a stand-alone analytical technique and more as an operational decision-support capability. However, these thematic shifts describe changes in research framing rather than measured industrial deployment; any prospective contribution from fuel-consumption reduction to transport-system resilience, coordinated allocation of port and shipping resources, or green-governance objectives remains contingent on field evidence that lies beyond publication counts.
The post hoc conservative sensitivity subset (n = 437) reproduced the same growth pattern. It contained 257 publications from 2022 to 2025 (58.81%) and 358 from 2023 through the partial year 2026 (81.92%), compared with 57.83% and 79.75%, respectively, in the main corpus. The leading keywords and source journals also remained stable, indicating that the observed acceleration and thematic structure were not artifacts of the 40 records flagged by the strict relevance screen or the two records carrying retraction/withdrawal status flags.
3.2. Source Journal Analysis
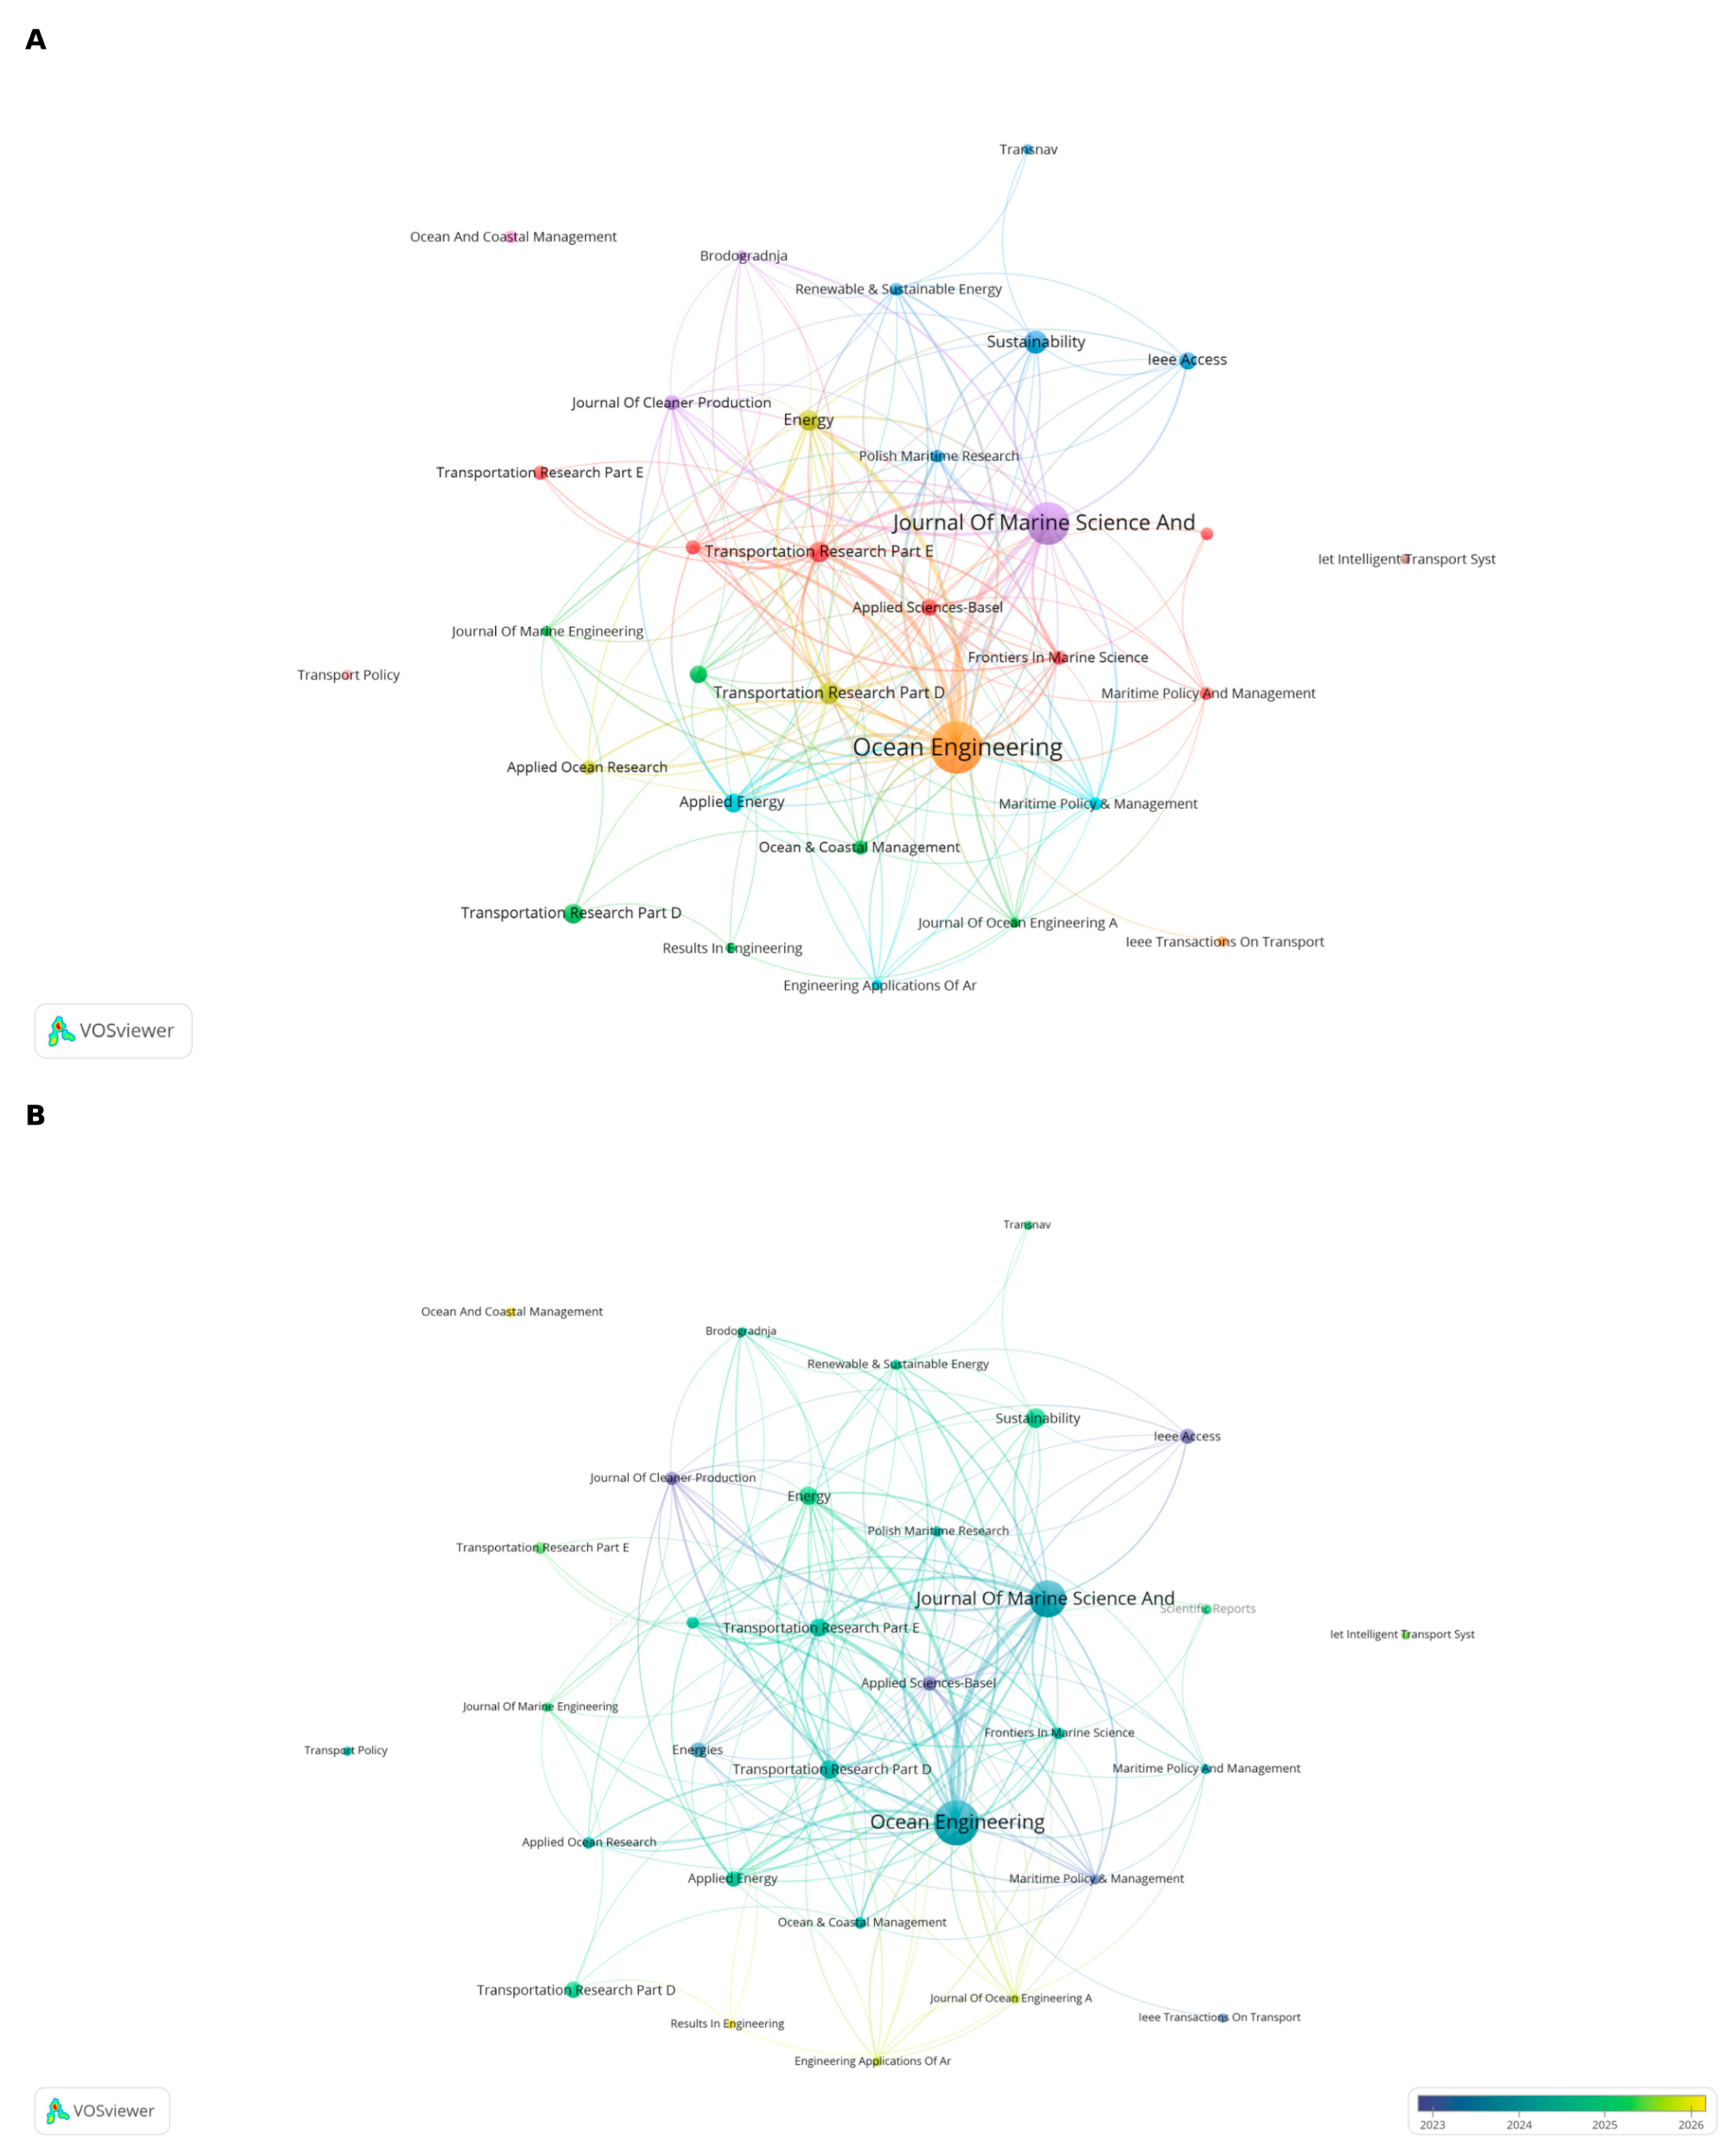
Source-journal statistics and the citation network (
Figure 3;
Table 3) indicate that the literature was disseminated primarily through journals in ocean engineering, marine science, transport and the environment, logistics management, and energy. Ocean Engineering ranked first with 68 publications, 2072 citations, and a total link strength (TLS) of 232, followed by Journal of Marine Science and Engineering with 46 publications, 804 citations, and a TLS of 171. The two unmerged export labels for Transportation Research Part D: Transport and Environment together account for 22 publications and 476 citations (21.64 citations per publication), which would place the journal third by output after title harmonization.
Table 3 retains the two source-title variants so that the tabulated rows remain aligned with the archived network export.
Publication activity was concentrated in maritime-engineering and marine-science journals. Ocean Engineering and Journal of Marine Science and Engineering together accounted for 114 publications, or 23.80% of the corpus, confirming the centrality of maritime engineering and applied marine systems in this field. At the same time, the appearance of transport, logistics, and energy journals among the leading outlets reflects the interdisciplinary diffusion of AI-enabled shipping-decarbonization research.
Ocean Engineering also recorded the highest citation count and network connectivity, indicating both a large publication contribution and a highly connected position within the journal citation structure. The two unmerged Transportation Research Part D title variants separately averaged 32.75 and 8.30 citations per publication; their combined descriptive average was 21.64 (476/22). Because TLS is attached to separate network nodes, it cannot be retrospectively combined without rebuilding the source-journal network. Transportation Research Part E-Logistics and Transportation Review averaged 40.73 citations per publication, and Energy averaged 25.09, demonstrating that high citation visibility was not confined to the largest outlets.
The source-journal map also reveals that the same journal was imported under two Transportation Research Part D title variants, which remain separate nodes in the archived network visualization. Even with this formatting effect, the overall outlet structure clearly situates the field at the intersection of maritime engineering, transport systems, environmental assessment, and energy management. The temporal overlay visualization in
Figure 3B further indicates that several central journals, including Ocean Engineering, Journal of Marine Science and Engineering, Transportation Research Part E, Applied Sciences-Basel, and Energy, remained active into the most recent years of the dataset, suggesting continuing consolidation of the field within a stable interdisciplinary outlet structure.
The representation of transport and energy journals among the most productive outlets demonstrates the interdisciplinary diffusion of AI-enabled shipping-decarbonization research. Transportation Research Part D places comparatively greater emphasis on transport-related environmental impacts, emissions-mitigation policy, and sustainability assessment, whereas Transportation Research Part E focuses more strongly on logistics systems, transport organization, and supply-chain decision-making. Their participation indicates that the analytical boundary has expanded from vessel-level energy savings to transport networks, ship-port coordination, and logistics-chain emissions.
The inclusion of Energy and Applied Energy among the leading outlets situates low-carbon shipping research within broader debates on energy efficiency, alternative fuels, energy management, and emissions control. Broad-scope engineering journals, including Sustainability, IEEE Access, and Applied Sciences, further extend the disciplinary reach of the topic. The resulting outlet structure spans maritime engineering, transport and the environment, energy systems, and intelligent computing.
Within the journal-network structure, Ocean Engineering and Journal of Marine Science and Engineering occupy highly connected core positions and serve as principal publication venues at the interface between shipping engineering and AI applications. Transportation Research Part D, Transportation Research Part E, Energy, and Applied Energy provide stronger links to topics involving low-carbon policy, energy efficiency, transport decision-making, and supply-chain emissions reduction. This distribution indicates that the field has developed an interdisciplinary publication structure centered on maritime-engineering journals and supported jointly by transport-environment and energy journals.
Cross-links between core maritime journals and outlets in transport and the environment, energy, and logistics management demonstrate the multidimensional structure of the field. An exclusively maritime-engineering interpretation may overlook the effects of policy constraints, supply-chain organization, and energy-system conditions on low-carbon vessel operations. Conversely, transport-environment or energy perspectives alone may understate the constraints imposed on model validity by vessel physics, variable sea states, and operational rules. The journal network therefore reflects the inherently interdisciplinary character of the research problem.
Connections among the journals also suggest complementary knowledge flows. Maritime-engineering journals provide the basis for interpreting vessel operations and engineering implementation; transport-environment journals introduce policy and system-assessment perspectives; and energy journals extend the analysis of fuel use, energy-efficiency management, and alternative-energy integration. These exchanges support the adaptation of AI methods to increasingly complex low-carbon shipping contexts.
This outlet structure has corresponding implications for research design. Studies directed toward maritime-engineering audiences should establish the relationship between model behavior and the physical and operational mechanisms of vessels, whereas transport- and energy-oriented studies should specify low-carbon outcomes, policy relevance, and system-level implications. Explicitly embedding AI models within operational shipping processes is likely to improve their relevance across disciplinary communities.
3.3. Collaboration Network Analysis
3.3.1. Author Collaboration Analysis
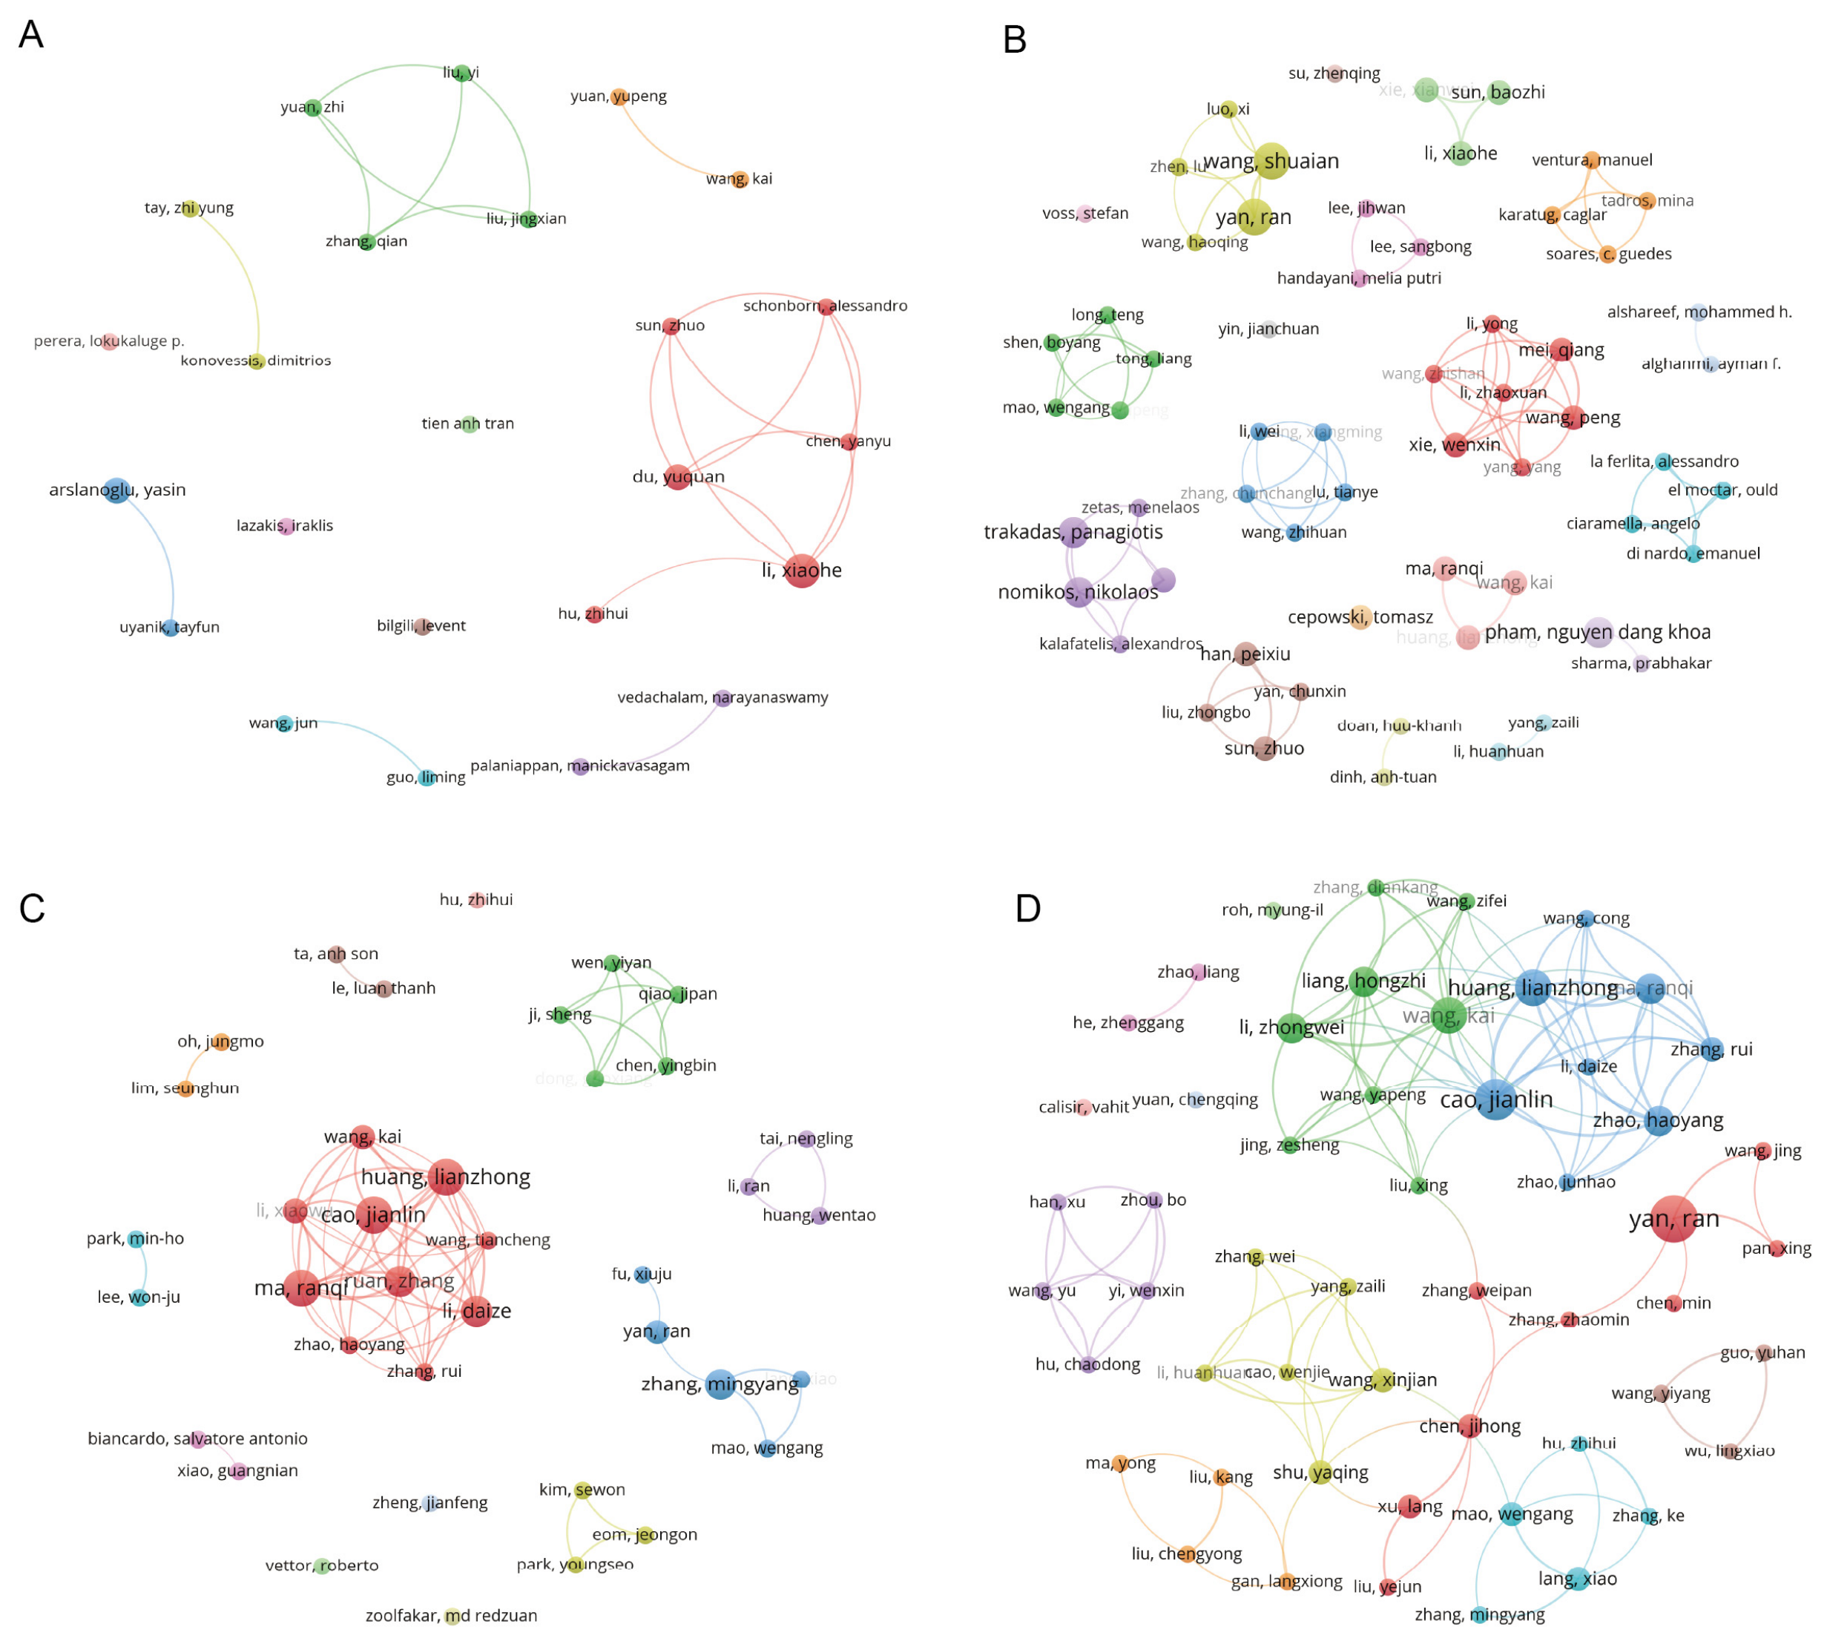
Author productivity statistics and the time-sliced collaboration networks (
Figure 4;
Table 4) identify a set of sustained contributors embedded in a changing team structure. In the cumulative corpus, Yan, Ran ranked first with 16 publications and 509 citations, followed by Huang, Lianzhong with 14 publications, Wang, Kai with 13, Ma, Ranqi with 12, and Cao, Jianlin with 11. The cumulative evidence therefore reflects several active and partially interconnected research teams rather than a field organized around a single author core.
Productivity, citation visibility, and collaboration connectivity captured distinct dimensions of contribution. Wang, Shuaian published 7 articles and received 486 citations, yielding the highest mean citation count among the 10 leading authors (69.43 citations per publication), while Li, Xiaohe averaged 44.29. By contrast, the highest cumulative TLS values were recorded by Huang, Lianzhong (66), Ma, Ranqi (60), Cao, Jianlin (56), and Wang, Kai (49), indicating sustained participation in collaborative research programs. These indicators describe scholarly activity and network position and are not interpreted as direct measures of research quality or technological effectiveness.
Following the period-specific structural-comparison approach exemplified by Hu et al. [
39],
Figure 4 separates the co-authorship network into four publication periods and applies the same minimum display threshold of two documents per author in each panel. Because the periods differ in duration and 2026 is incomplete, absolute node, link, TLS, and density values are compared descriptively rather than treated as standardized growth rates. Panel-specific metrics were calculated within each time slice and should not be added to the cumulative TLS values reported in
Table 4.
During 2016–2022 (
Figure 4A), the thresholded network contained 24 authors, of whom 20 were connected, forming 11 clusters with 22 unique co-authorship links and a combined TLS of 86. Collaboration was organized mainly through small, weakly connected teams, and four displayed authors were isolated. Li, Xiaohe was the most connected author in this period (5 links; TLS = 9; 4 documents), while the Du, Yuquan-Li, Xiaohe group and the Liu, Yi-Liu, Jingxian-Yuan, Zhi-Zhang, Qian group represented the most visible early team structures.
The 2023–2024 network (
Figure 4B) expanded to 60 authors, 56 connected nodes, 19 clusters, 90 links, and a combined TLS of 372. Although the number of links increased, network density declined from 0.080 in 2016–2022 to 0.051 because author entry outpaced the formation of cross-team ties. Yan, Ran and Wang, Shuaian each published 5 documents, whereas Mei, Qiang, Wang, Peng, and Xie, Wenxin recorded the highest connectivity (6 links; TLS = 14). The period therefore marks broad team proliferation rather than immediate consolidation into a single component.
A more consolidated pattern emerged in 2025 (
Figure 4C). The network comprised 38 authors, 34 connected nodes, 13 clusters, 69 links, and a combined TLS of 312; its density rose to 0.098 despite the one-year observation window. Cao, Jianlin, Huang, Lianzhong, and Ma, Ranqi jointly formed the dominant collaborative core, each contributing 5 documents, 9 links, and a TLS of 30. Li, Daize and Ruan, Zhang also occupied highly connected positions (9 links; TLS = 25), while several smaller teams remained detached from the central cluster.
The partial-year 2026 network (
Figure 4D) broadened while retaining this core. It contained 53 authors, 50 connected nodes, 12 clusters, 124 links, and a combined TLS of 440, with an average of 4.68 links per displayed author compared with 1.83 in 2016–2022. Cao, Jianlin was the most connected author (15 links; TLS = 34; 6 documents), followed by Wang, Kai (14 links; TLS = 27; 5 documents) and Huang, Lianzhong (12 links; TLS = 28; 5 documents). Yan, Ran remained the most productive node with 7 documents but recorded fewer links (4; TLS = 6), further illustrating that output and connectivity are not interchangeable.
Continuity between the two most recent panels was substantial: 12 authors appeared in both the 2025 and 2026 networks, including Cao, Jianlin, Huang, Lianzhong, Ma, Ranqi, Mao, Wengang, Wang, Kai, Yan, Ran, Zhang, Mingyang, Zhang, Rui, and Zhao, Haoyang. Wang, Kai was the only author represented in all four time slices. This pattern indicates that recent expansion occurred through both the persistence of established teams and the entry of new contributors.
Across the four periods, the author network evolved from small, application-specific teams to rapid team proliferation and then to a denser core with multiple surrounding groups. The configuration is consistent with the multidisciplinary requirements of AI-enabled low-carbon shipping research, in which algorithm development, vessel-operation interpretation, data preparation, scenario design, and validation draw on distinct expertise. Nevertheless, the continued presence of multiple clusters and isolated nodes shows that collaboration remains organized around several specialized teams rather than a fully integrated field-wide network.
3.3.2. Institution Collaboration Analysis
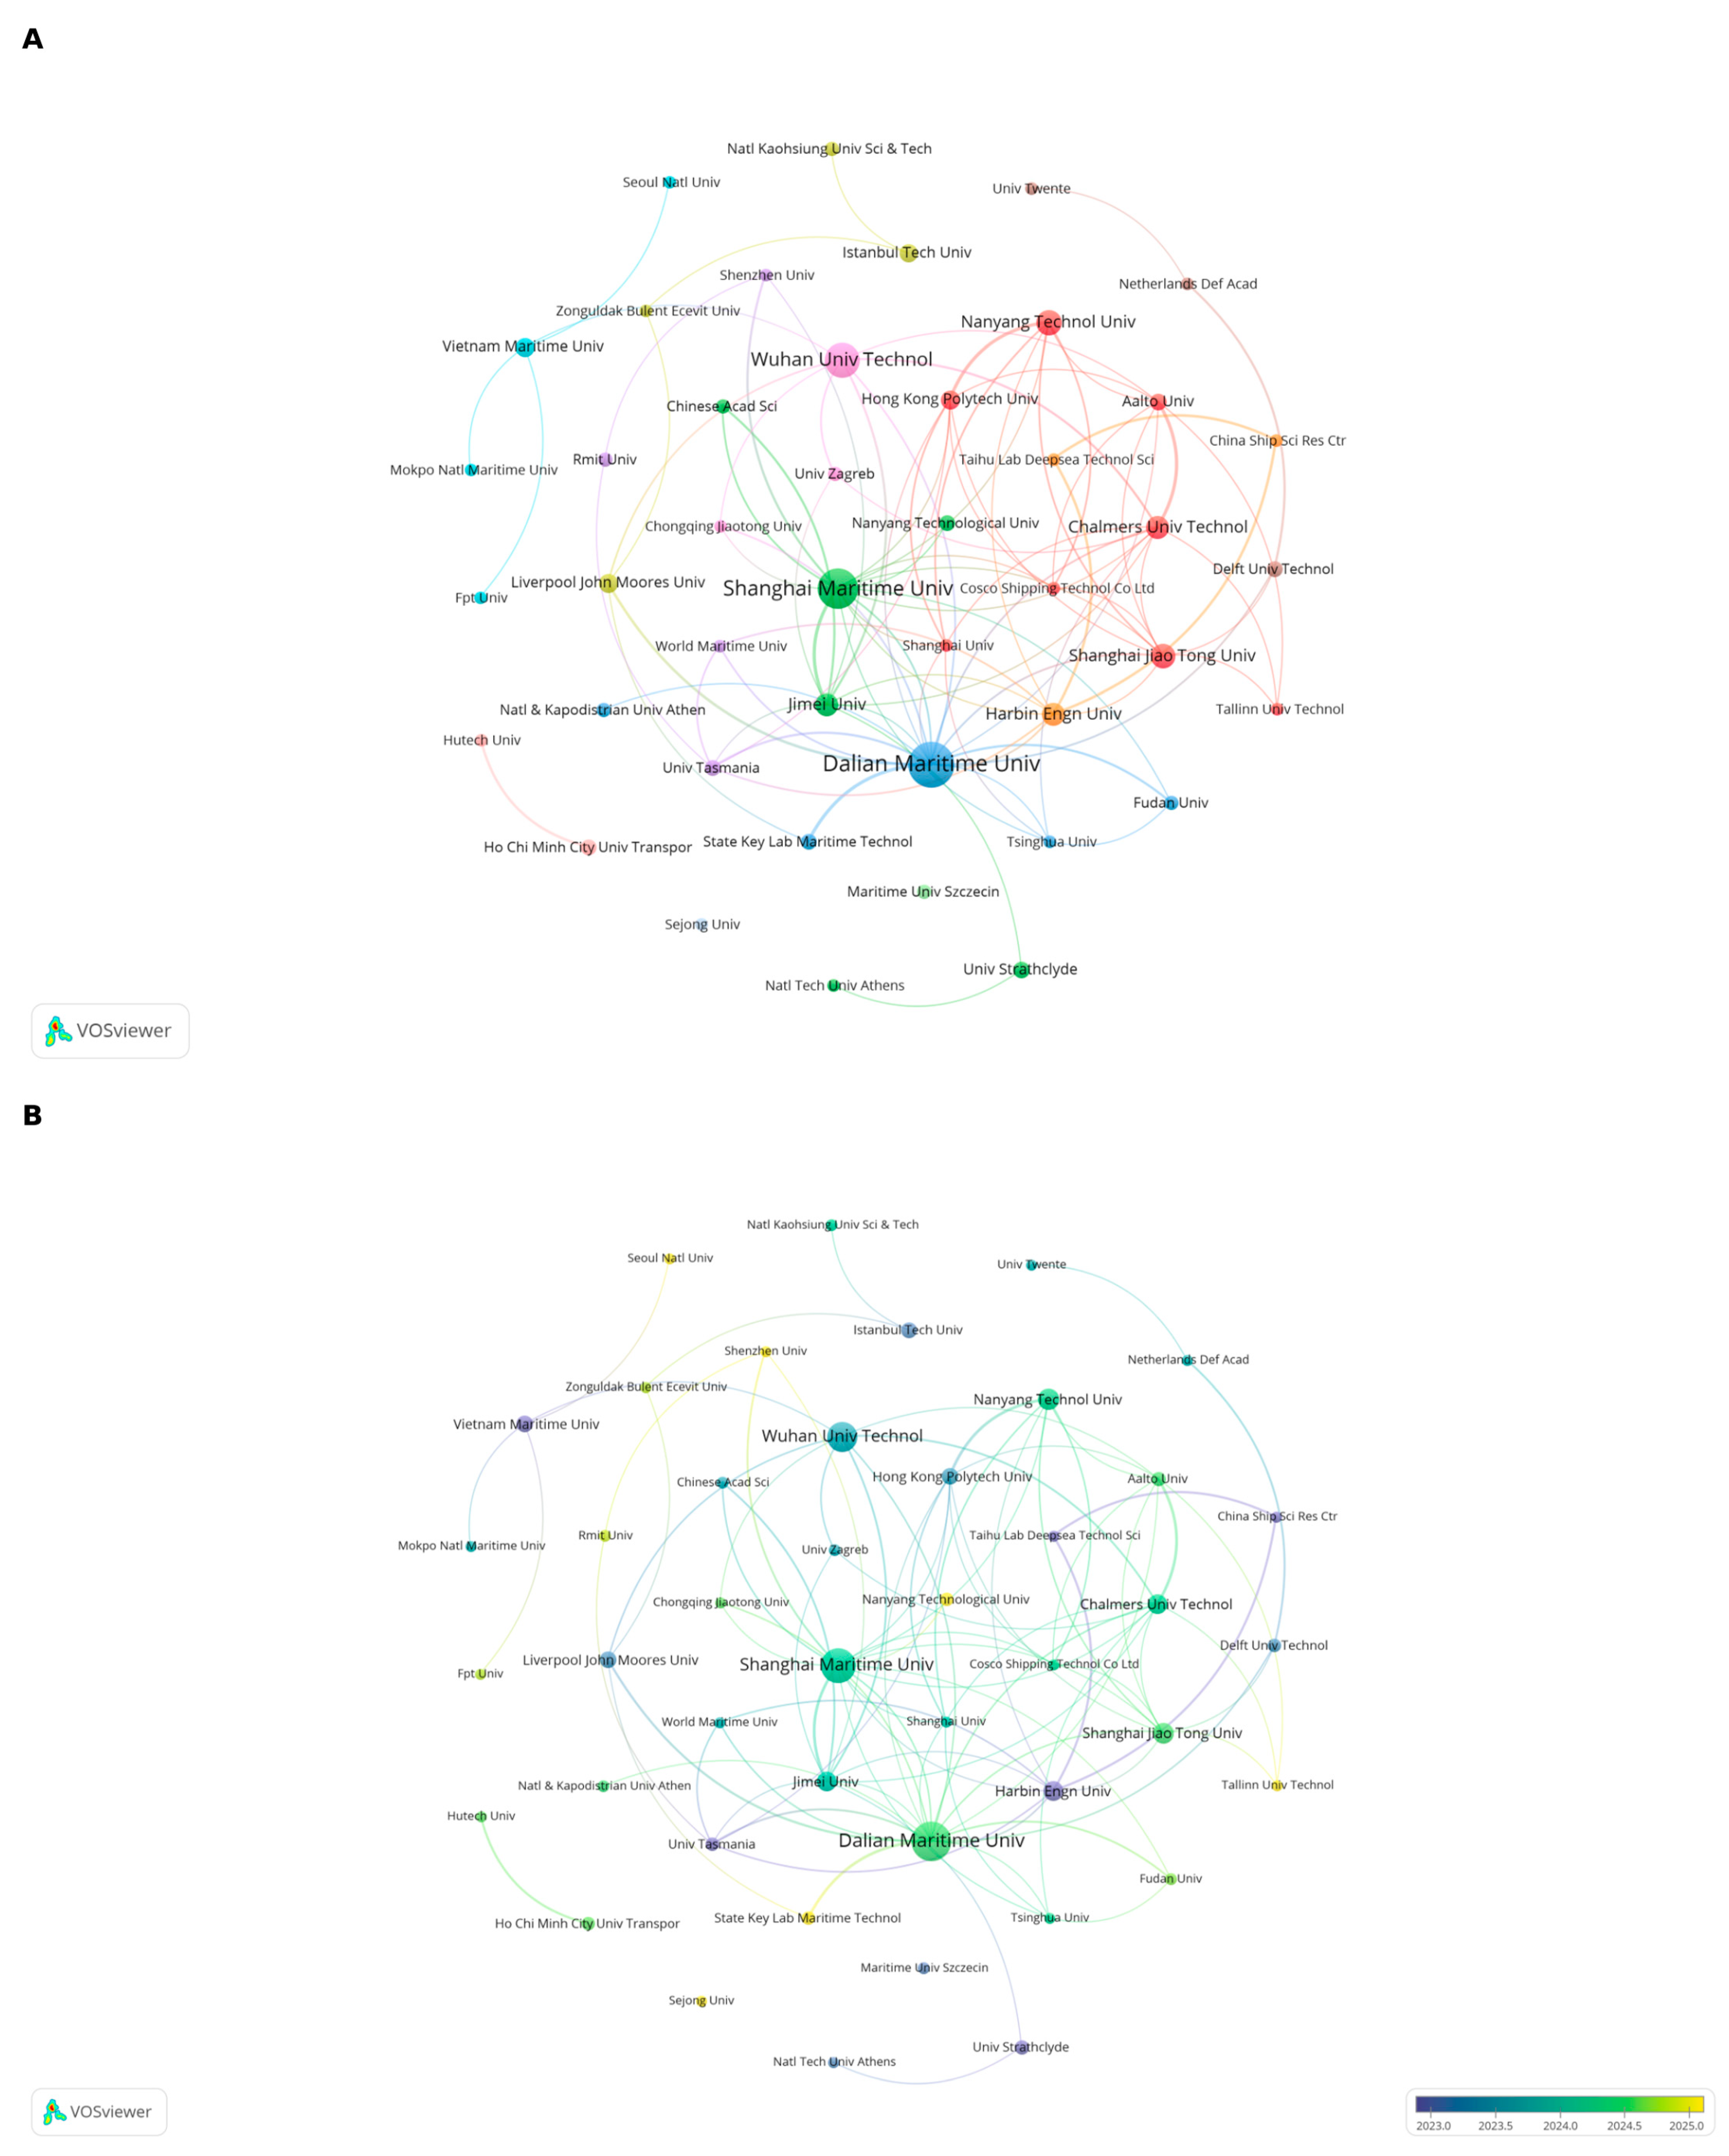
Institutional productivity statistics and the collaboration network (
Figure 5;
Table 5) show that activity was concentrated in maritime universities, transport-engineering institutions, and research-intensive technical universities. Dalian Maritime University ranked first with 49 publications, 1060 citations, a mean of 21.63 citations per publication, and a TLS of 38. Shanghai Maritime University ranked second with 38 publications, followed by Wuhan University of Technology with 29. These institutions formed the principal Chinese research cluster in maritime and transport engineering.
The concentration of leading institutions reflects the specialized knowledge required for research on low-carbon shipping. In addition to AI expertise, this field requires detailed knowledge of vessel structures, main-engine operating conditions, sea-state effects, port operations, and shipping organization. Maritime universities and transport-engineering institutions are consequently well positioned to sustain research through access to data, domain-specific modeling capabilities, and engineering expertise. The positions of Dalian Maritime University, Shanghai Maritime University, and Wuhan University of Technology reflect the established capacity of China’s maritime education and research system in this interdisciplinary domain.
Dalian Maritime University combined high publication output with substantial citation visibility and network connectivity. Shanghai Maritime University and Wuhan University of Technology also made major contributions through their respective strengths in shipping management, port logistics, naval architecture, and transportation research. Sustained participation by these institutions provides a basis for extending AI research from general algorithm development to engineering applications grounded in operational shipping problems.
The broader institutional distribution included Nanyang Technological University with 15 publications, Shanghai Jiao Tong University with 14, and Chalmers University of Technology, Harbin Engineering University, and Jimei University with 13 each. The Hong Kong Polytechnic University and Liverpool John Moores University each contributed 9 publications but exhibited strong citation visibility, with 534 and 322 citations, respectively.
Participation by institutions in multiple countries and regions broadened the geographic coverage of the network. Nanyang Technological University, The Hong Kong Polytechnic University, Liverpool John Moores University, and Chalmers University of Technology bring established expertise in maritime safety, shipping management, green transport, and vessel energy efficiency. The Hong Kong Polytechnic University recorded 59.33 citations per publication despite a comparatively small publication contribution, indicating high citation visibility; this metric does not independently establish research quality.
Institution-level differences further confirm that publication volume and citation visibility capture distinct dimensions of scholarly activity. Several institutions achieved substantial visibility through a comparatively small number of highly cited studies. Within this field, widely cited publications frequently combine methodological innovation with clearly specified shipping decisions, which may facilitate their reuse and extension in subsequent research.
The institutional collaboration network comprised several interconnected clusters. Chinese maritime universities occupied central positions, consistent with their contributions to vessel-energy-consumption modeling, route optimization, port-operational efficiency, and emissions control. Nanyang Technological University, Chalmers University of Technology, Liverpool John Moores University, and other institutions were associated more strongly with international shipping, maritime safety, and energy-efficiency research. This configuration is consistent with an extension from discrete technical applications toward cross-regional shipping-system optimization. Nevertheless, the most productive institutions remained concentrated in a limited number of maritime and transport-engineering platforms.
The multi-cluster institutional network reflects a team- and platform-based organization of research. Individual clusters appear to be associated with vessel-energy-consumption prediction, route and speed optimization, low-carbon port operations, maritime safety, and intelligent decision-making. Such specialization facilitates cumulative knowledge development within application domains but may also sustain differences in data standards, model assumptions, and evaluation metrics across clusters.
Transnational and multicenter collaboration remained comparatively limited. Because shipping operations span regions, ports, and fleets, evidence synthesis and model benchmarking would benefit from wider institutional cooperation. The temporal overlay visualization in
Figure 5B shows that Dalian Maritime University, Shanghai Maritime University, Wuhan University of Technology, Nanyang Technological University, and Chalmers University of Technology remained active in the later years of the dataset, indicating that these institutions not only contributed large publication volumes but also continued to shape recent research development.
3.3.3. Country Collaboration Analysis
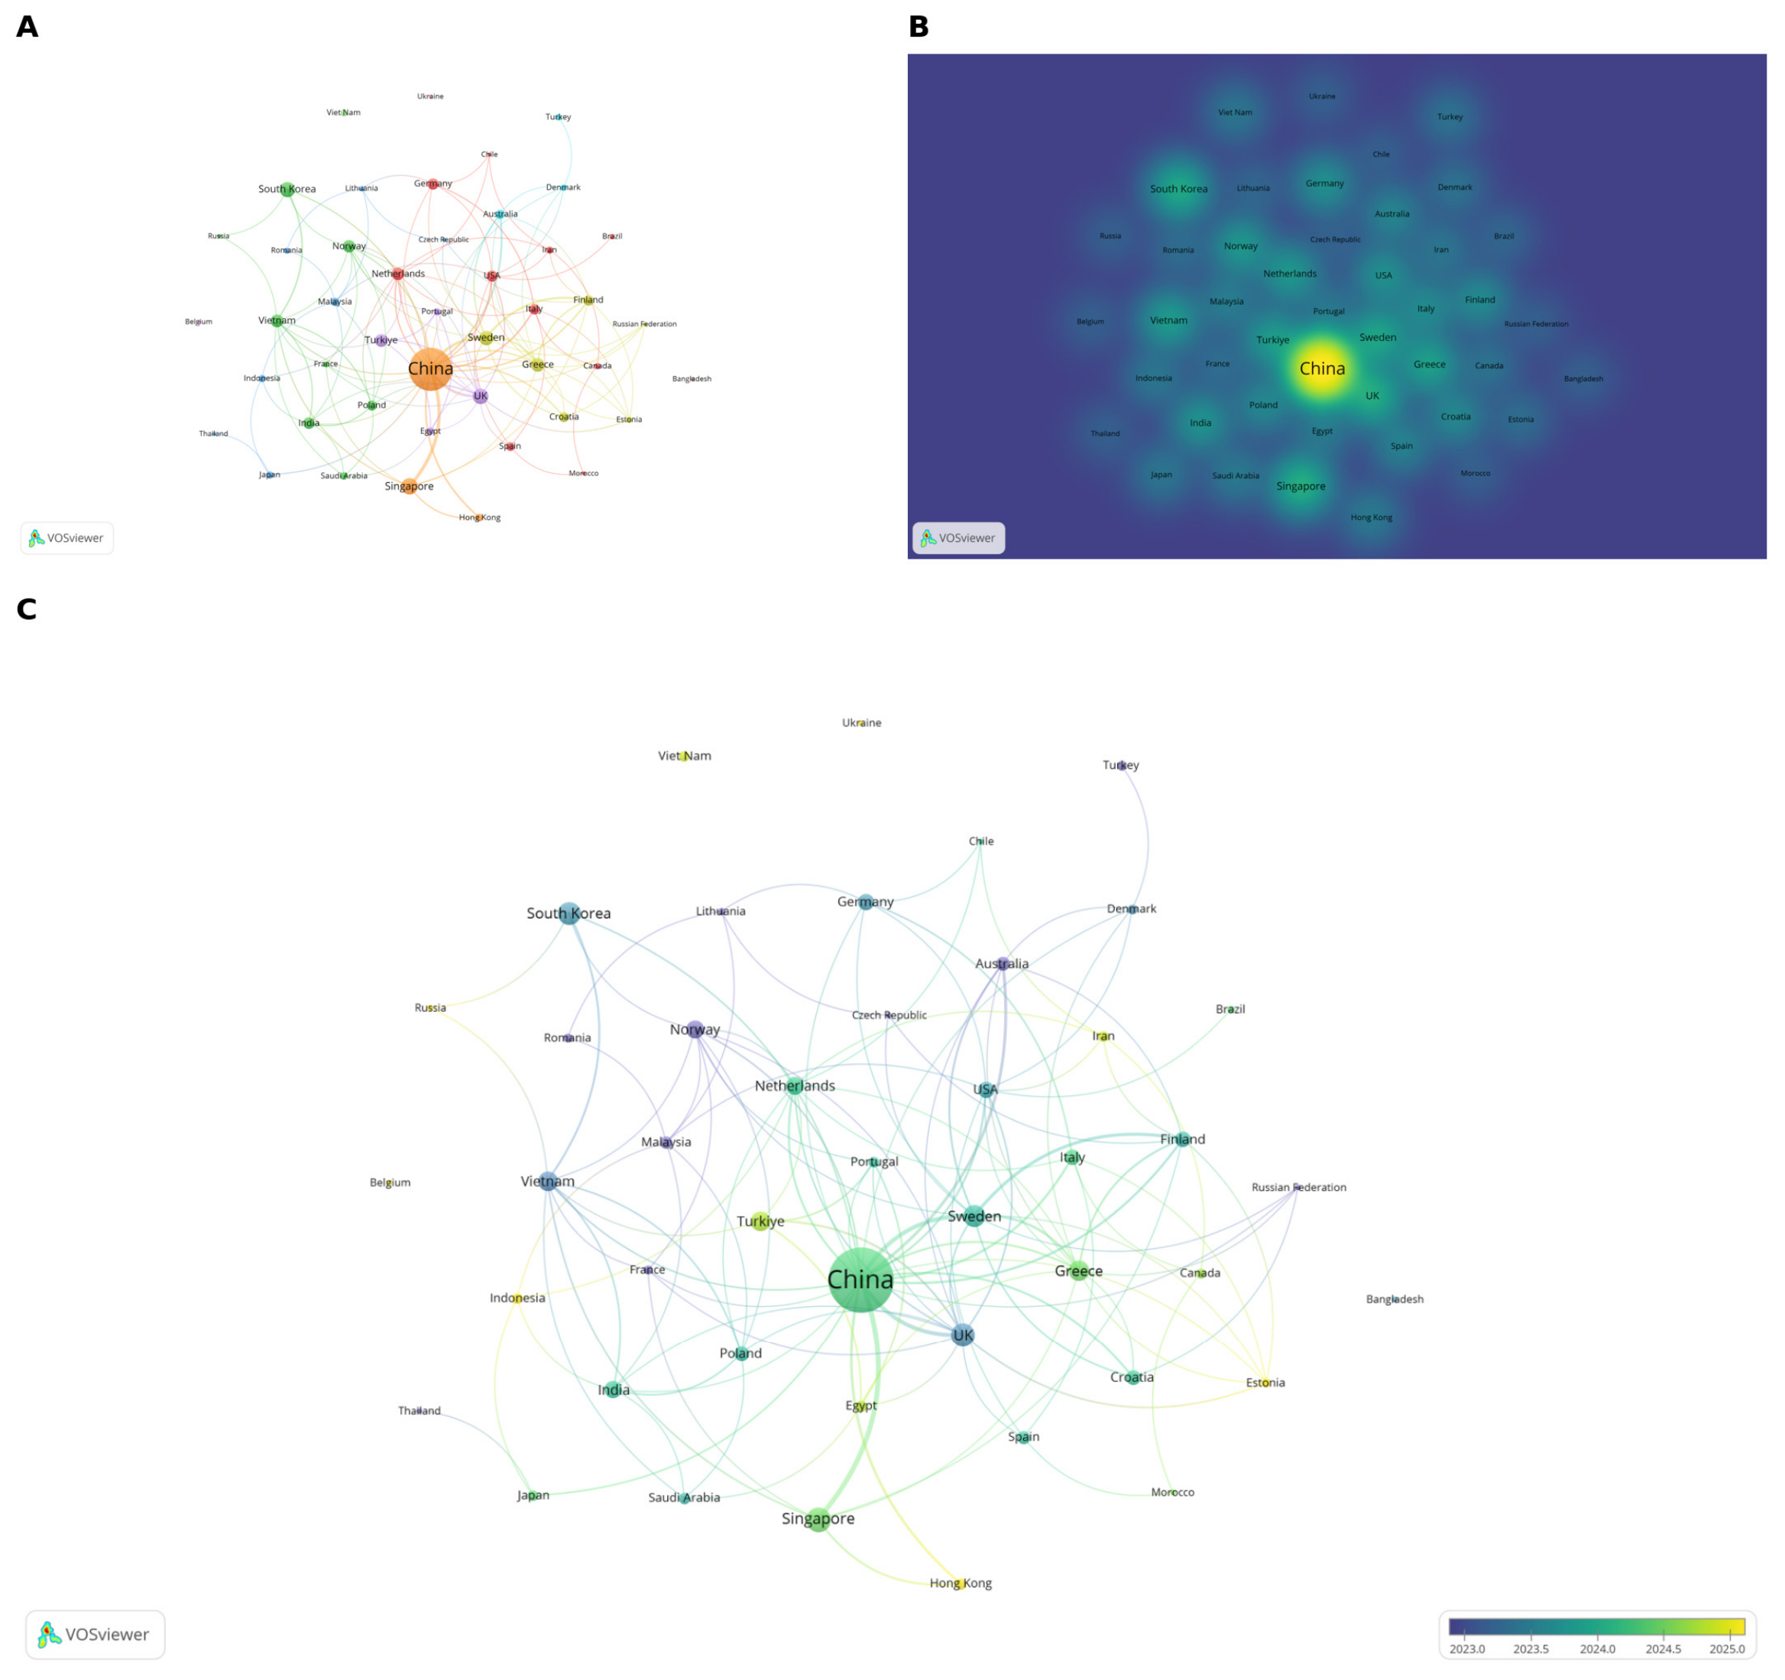
Country-level statistics and the collaboration network (
Figure 6;
Table 6) identify China as the largest contributor, with 208 publications, 3975 citations, and a TLS of 86. Singapore contributed 30 publications; the UK, 28; South Korea, 26; Sweden, 24; Greece, 21; Türkiye and Vietnam, 19 each; and the Netherlands and Norway, 17 each. The geographic distribution was therefore centered on East Asia but included substantial participation from Europe and Southeast Asia.
The geographic distribution broadly corresponds to the structure of the global shipping industry and maritime research capacity. China accounted for the largest national contribution to the dataset and occupied the highest-density region in the country map. This concentration may reflect both the scale of Chinese maritime research capacity and the strategic importance of intelligent shipping and port decarbonization within China’s transport agenda.
Contributions from South Korea, Singapore, the United Kingdom, Vietnam, Greece, and Sweden demonstrate that the field extends beyond a single geographic region. South Korea and Singapore combine substantial port and shipping sectors with demand for intelligent maritime technologies, whereas the United Kingdom, Sweden, Germany, and the Netherlands have established research programs in green-transport policy, maritime safety, energy efficiency, and sustainable logistics. The resulting distribution is characterized by a large East Asian contribution together with active participation from Europe and Southeast Asia.
Average citation rates did not correspond directly to national publication volume. Among the leading contributors, Norway averaged 50.76 citations per publication, the UK averaged 33.46, and Sweden averaged 30.04, indicating comparatively high citation visibility despite lower output than China. These values suggest that influential work was produced in multiple regional research systems rather than being concentrated exclusively in the most productive country.
Average citation rates did not correspond directly to national publication volume. The comparatively high values for the United Kingdom, the Netherlands, and Sweden indicate substantial citation visibility despite lower output, although the metric cannot determine whether this visibility arose from methodological novelty, theoretical framing, or application relevance. China’s lower mean citation rate relative to several European countries, despite its much larger publication contribution, further illustrates the need to distinguish output scale from citation visibility. Future research would benefit from greater methodological rigor, international collaboration, data accessibility, and cross-context validation.
TLS reflects the degree of collaborative connectivity among countries. China, Sweden, the UK, and Singapore had comparatively high TLS values, indicating that they functioned as major linking countries within the international collaboration network. The network and density visualizations jointly placed China at the collaborative core, with Sweden, the UK, Singapore, South Korea, and Vietnam forming an important surrounding group.
The country collaboration network and density visualization placed China at the network core and within the highest-density region. Singapore, the United Kingdom, Sweden, South Korea, Vietnam, Germany, and other countries maintained links of varying strength with this core. This configuration is broadly consistent with the distribution of port activity, shipping capacity, and maritime research specialization. Although an international collaboration network is evident, intercontinental links remain concentrated among a limited set of countries. Cross-regional data sharing and research partnerships involving shipping regions, port clusters, and fleet operators therefore remain important for the development of transferable evidence.
The observed core-periphery structure indicates that the international collaboration network remains only partially developed. China’s high-density position reflects its substantial contribution to both publication output and collaboration. However, concentration within a limited group of countries and institutions may constrain the external validity of models across sea areas, vessel classes, and port-governance systems. Future studies should therefore place greater emphasis on data collaboration across continents, routes, and operating organizations.
Broader international collaboration could facilitate the harmonization of evaluation metrics. Existing studies report heterogeneous outcomes, including fuel consumption, emissions per unit of transport work, total voyage emissions, operating costs, and schedule reliability, which limits direct comparison. Common data standards and evaluation frameworks developed through transnational research networks would improve transparency, comparability, and policy relevance.
Shipping decarbonization constitutes a transnational governance problem that cannot be represented adequately through evidence from a single country. More geographically distributed collaboration would improve external validity and facilitate comparisons across vessel classes, regulatory regimes, and port systems. The temporal overlay visualization in
Figure 6C indicates that China remained central while several surrounding contributors, including Singapore, Türkiye, Greece, and Finland, were also associated with relatively recent activity, suggesting a continuing broadening of the international research network rather than a purely static geographic pattern.
3.4. Keyword Co-Occurrence and Cluster Analysis
Keyword-frequency statistics (
Table 7) identify machine learning, artificial intelligence, energy efficiency, deep learning, decarbonization, fuel consumption, fuel-consumption prediction, artificial neural network, maritime transport, and ship energy efficiency as the principal themes. Machine learning ranked first with 102 occurrences and a TLS of 128. Artificial intelligence occurred 31 times, energy efficiency 28 times, and deep learning 23 times, confirming the dominance of data-driven methods and energy-oriented application targets.
Keyword frequencies reveal two interdependent thematic cores. The methodological core comprises machine learning, artificial intelligence, deep learning, reinforcement learning, and artificial neural networks. The application core comprises energy efficiency, vessel energy efficiency, fuel-consumption prediction, fuel consumption, and decarbonization. Their co-occurrence characterizes the field as an interdisciplinary domain in which methodological development is coupled with explicitly maritime and low-carbon objectives.
With 102 occurrences and the highest TLS, machine learning formed the most established methodological component of the sampled literature. Its continued prevalence relative to deep learning and reinforcement learning may reflect comparatively moderate data requirements, greater interpretability, and practical tractability in engineering applications such as fuel-consumption prediction and energy-efficiency assessment. In recent publications, artificial intelligence increasingly functions as an umbrella term encompassing machine learning, intelligent optimization, digital twins, and automated decision-making.
3.4.1. Keyword Co-Occurrence Analysis
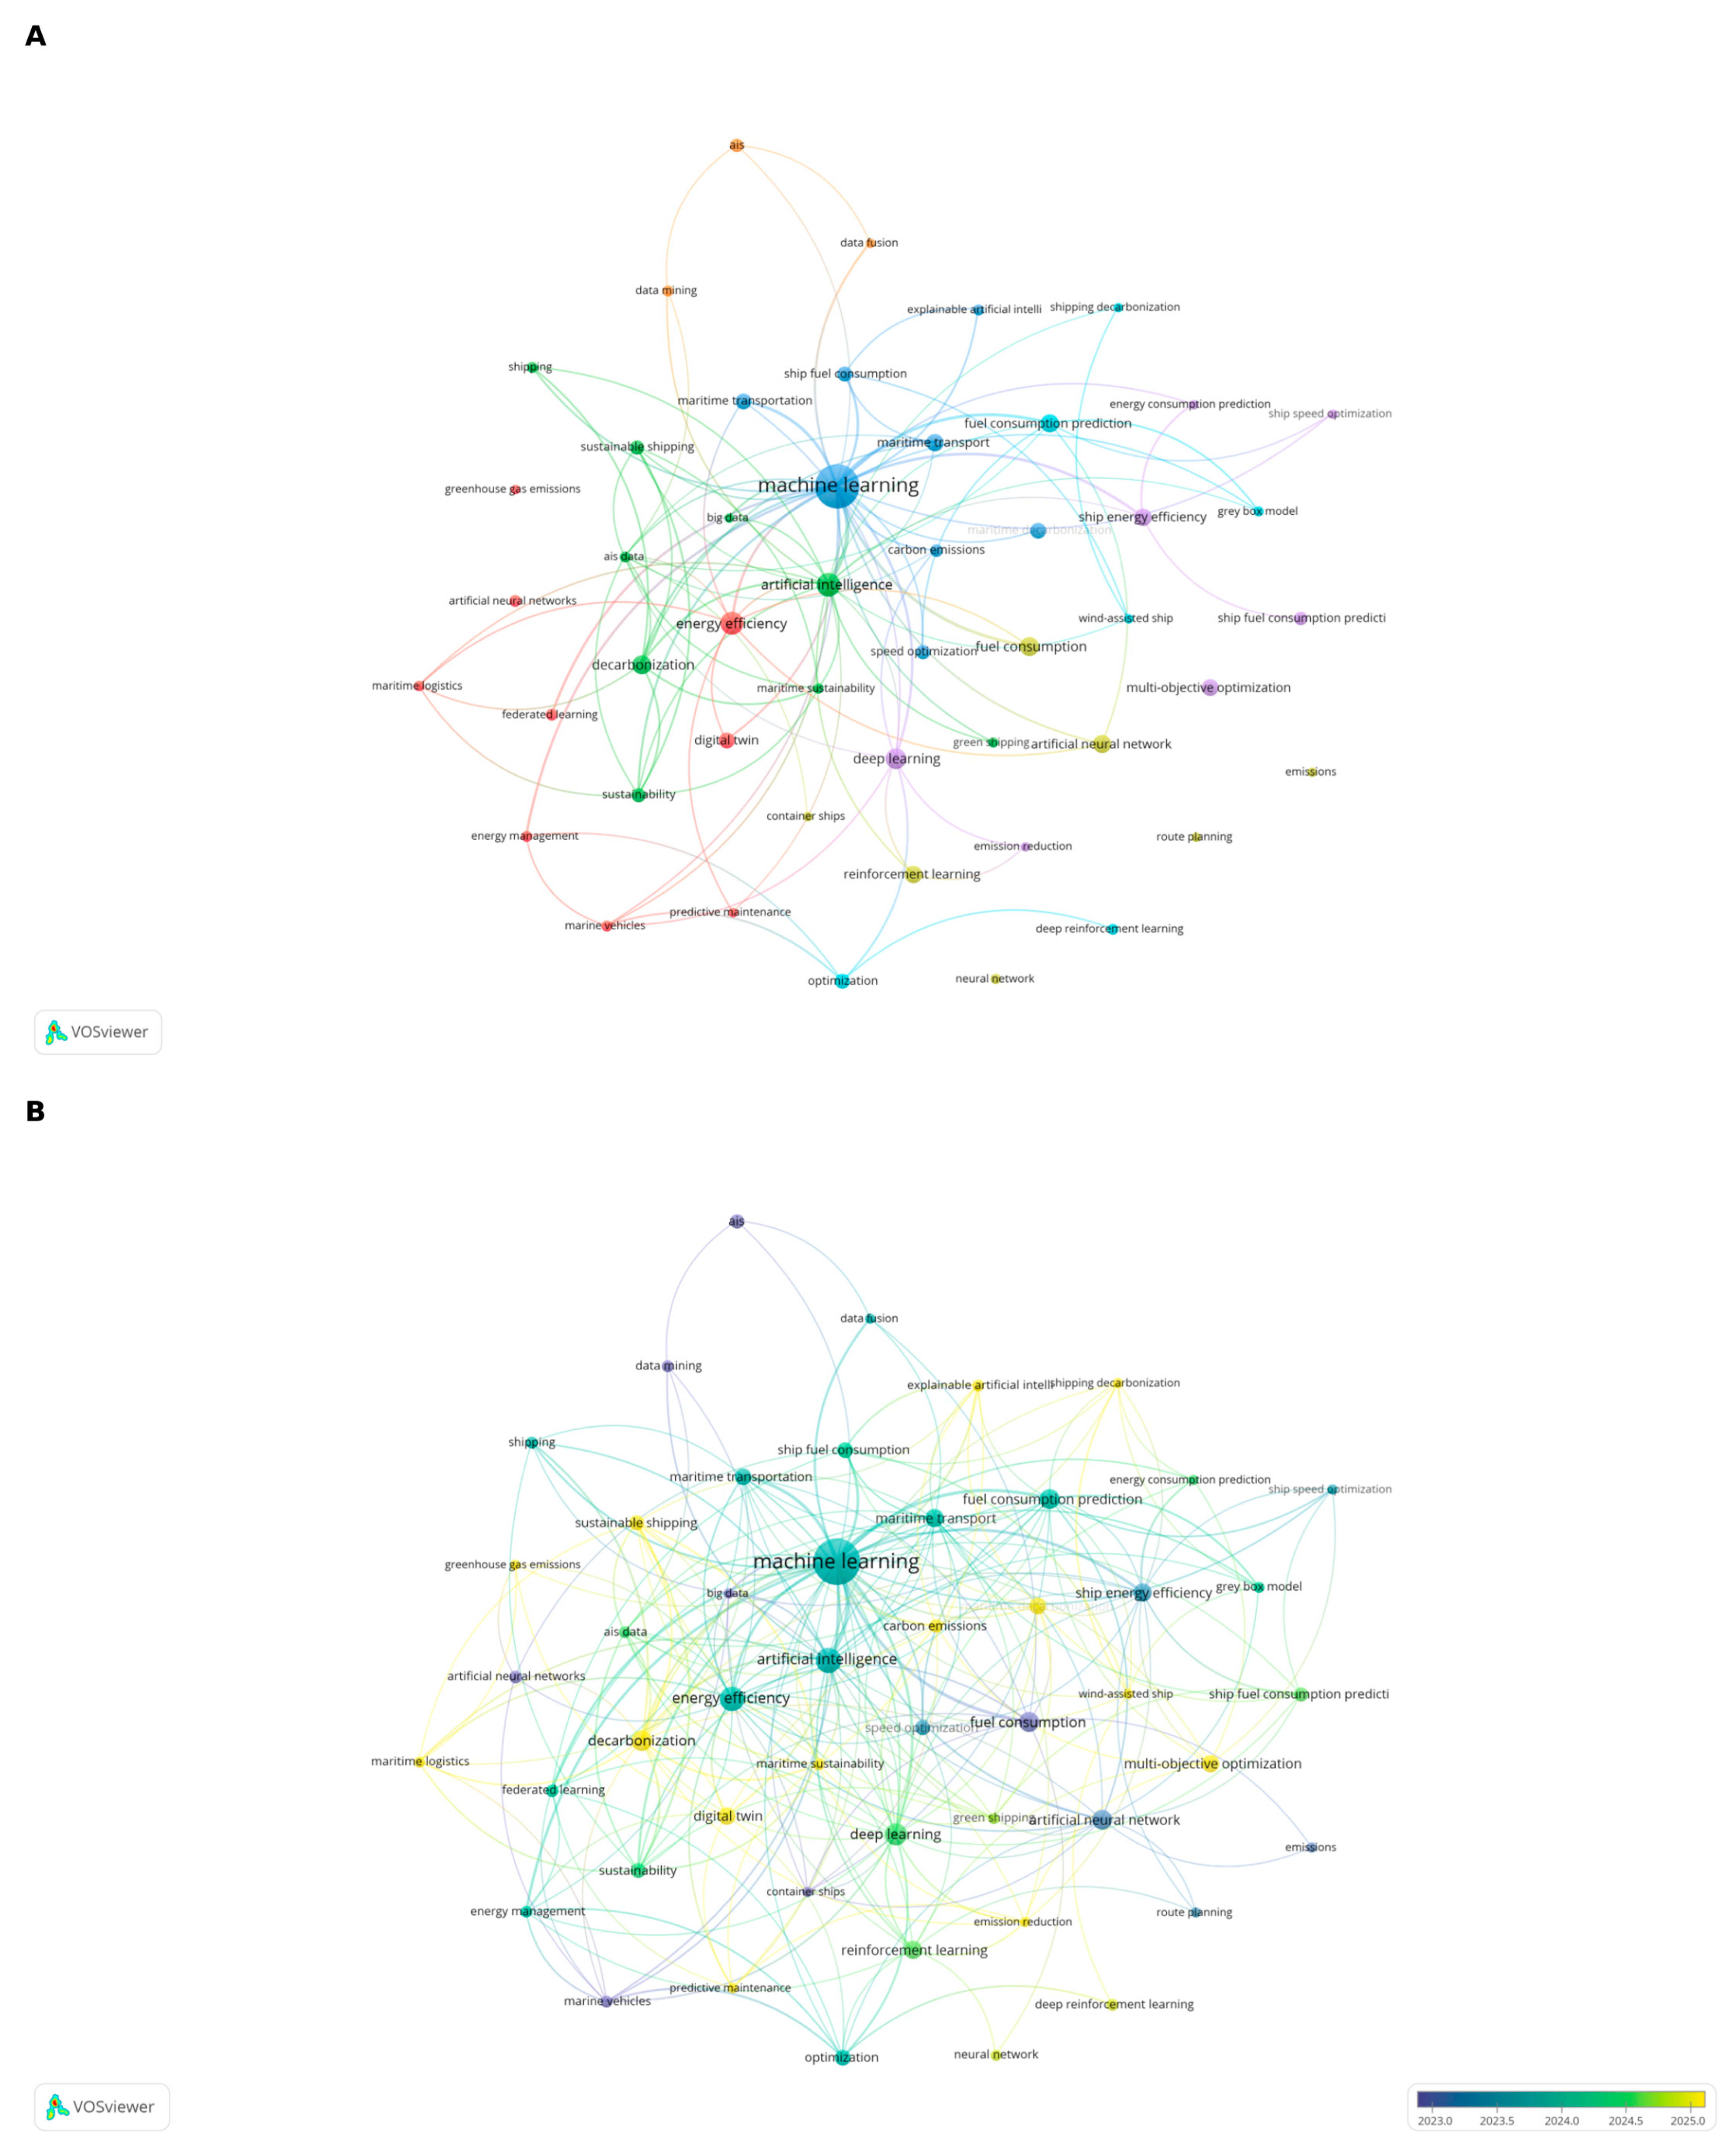
The keyword co-occurrence network (
Figure 7) was centered on machine learning, with links to maritime transport, fuel-consumption prediction, ship energy efficiency, artificial intelligence, deep learning, reinforcement learning, and decarbonization. Fuel consumption occurred 19 times and fuel-consumption prediction 18 times, while ship energy efficiency and maritime transport each occurred 16 times. This distribution is consistent with a field that remains grounded in ship-level energy and emission problems while increasingly extending toward broader decarbonization and optimization agendas.
The central position of machine learning in the co-occurrence network confirms the predominance of data-driven modeling. In low-carbon shipping applications, machine-learning models can represent nonlinear associations among speed, draught, loading condition, wind and wave conditions, route characteristics, and main-engine operating states. The strong co-occurrence of machine learning with fuel-consumption prediction and vessel energy efficiency is therefore consistent with the engineering structure of the problem.
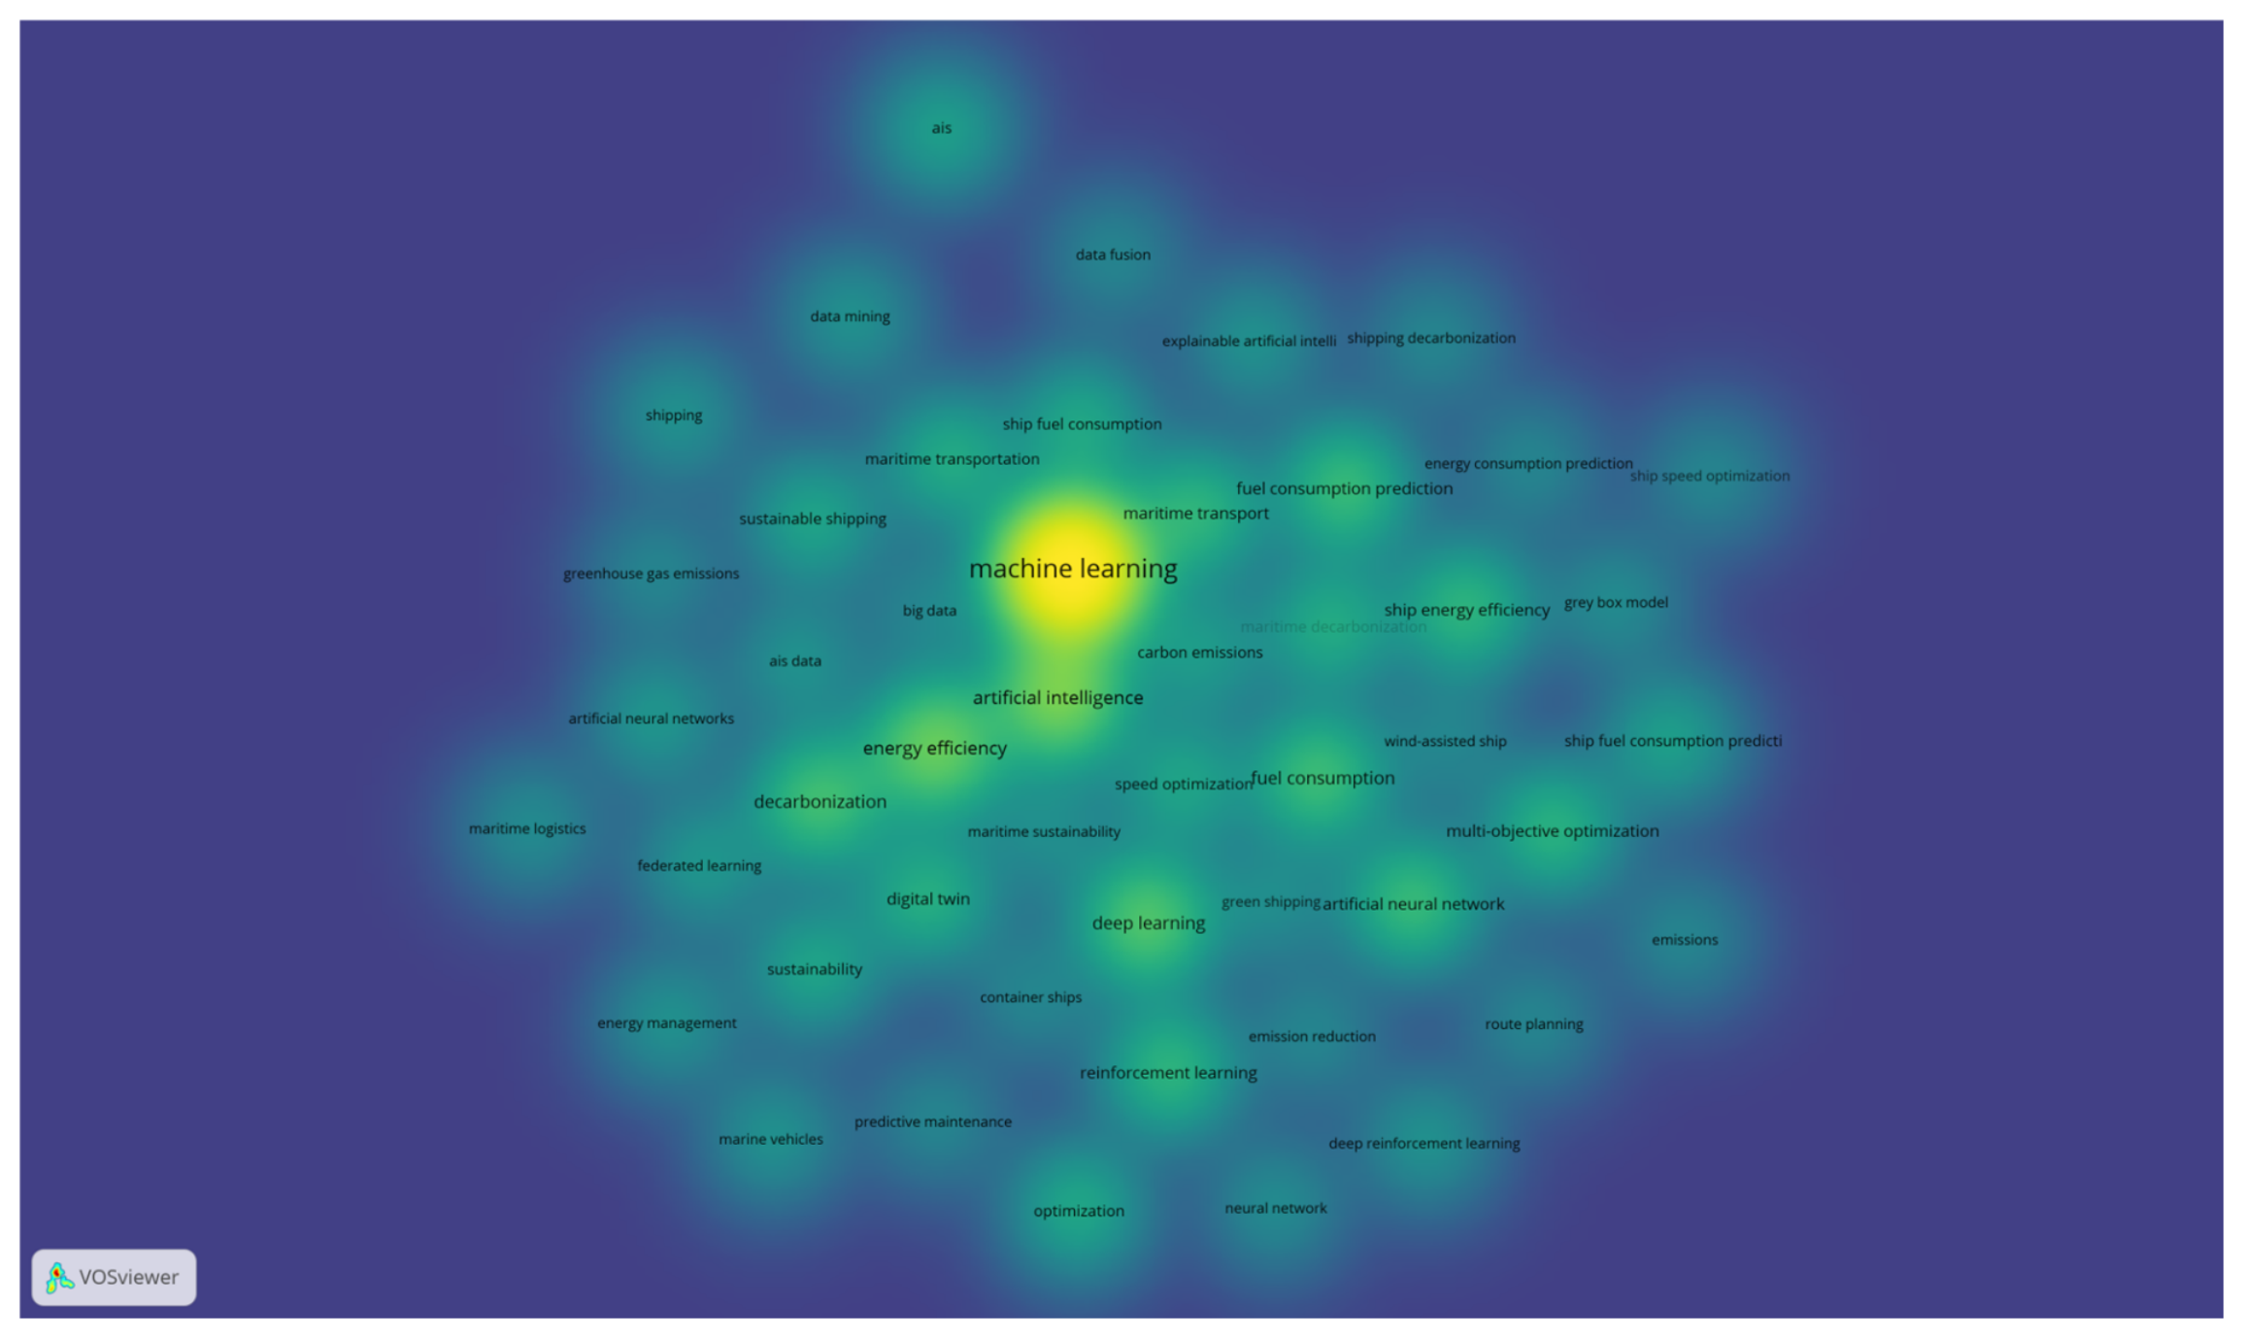
The more recent mean publication years of deep learning, reinforcement learning, decarbonization, federated learning, and related terms in the temporal overlay visualization (
Figure 7B), together with the keyword density visualization (
Figure 8), indicate a shift toward computationally advanced, system-oriented, and governance-relevant topics. By contrast, terms such as AIS, data mining, and fuel consumption reflect the earlier methodological and application foundations of the field. The overlay therefore complements the co-occurrence network by showing that emerging themes are building upon, rather than replacing, the established core centered on machine learning and maritime energy efficiency.
The keyword density visualization identified machine learning, fuel consumption, energy efficiency, deep learning, and artificial intelligence as the most concentrated thematic region. Adjacent terms included AIS, AIS data, digital twin, route planning, carbon emissions, energy management, sustainable shipping, and maritime decarbonization. This pattern situates AI within an integrated research context encompassing operational data, vessel control, energy-efficiency metrics, carbon accounting, and green logistics.
The concentration around machine learning and fuel consumption confirms that fuel-consumption prediction remains a principal application of AI in low-carbon shipping. This emphasis is methodologically consequential because fuel use affects both operating costs and GHG emissions. Reliable energy-consumption estimates also provide the analytical basis for speed optimization, route planning, and the evaluation of emissions-mitigation measures.
The occurrence of AIS data, trim optimization, speed optimization, wind-assisted ship, and sustainable maritime logistics indicates expansion across four dimensions: data sources, operational control, energy-saving technologies, and logistics systems. AIS data support vessel-behavior identification and route analysis; trim and speed optimization address vessel-level efficiency; wind-assisted propulsion represents an emerging energy-saving technology; and sustainable maritime logistics extends the analytical boundary to the transport chain. Collectively, these themes reflect a progression from localized energy savings toward system-level optimization.
3.4.2. Keyword Cluster Analysis
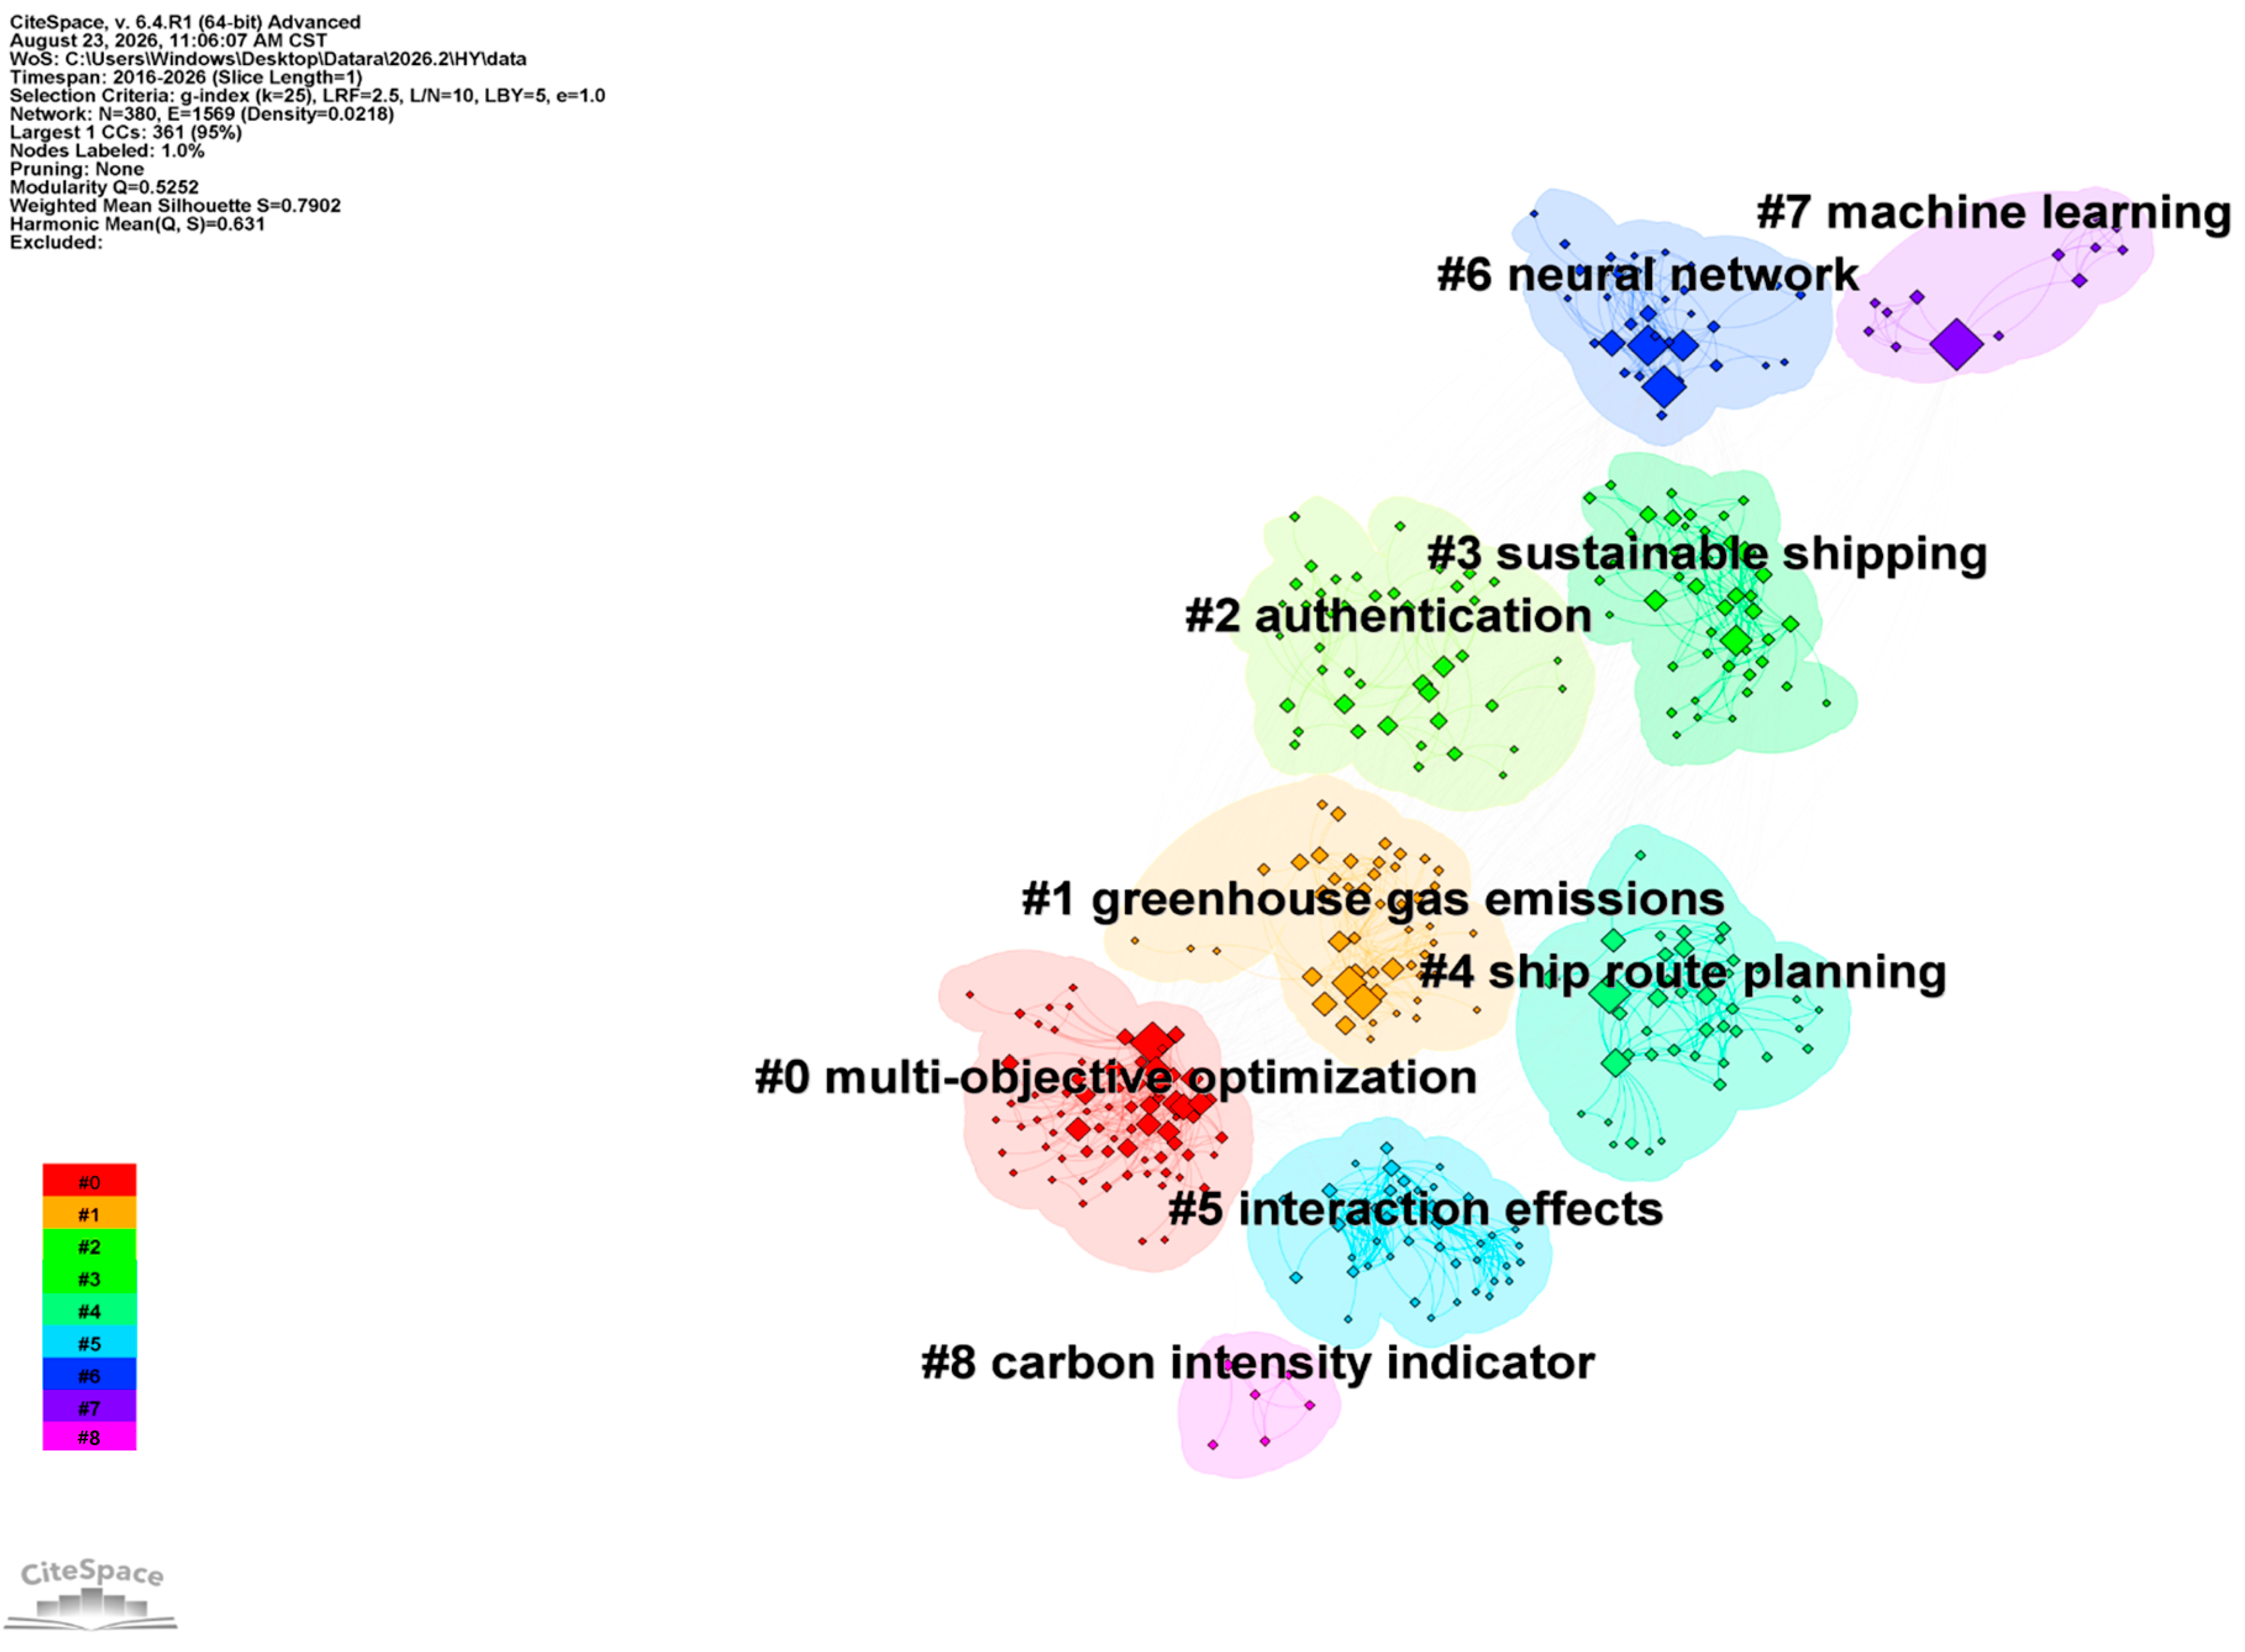
CiteSpace keyword clustering yielded a network modularity Q of 0.5252 and a mean silhouette score (S) of 0.7902, indicating a reasonably clear cluster structure and good within-cluster consistency. The major clusters were #0 multi-objective optimization, #1 greenhouse gas emissions, #3 sustainable shipping, #4 ship route planning, #6 neural network, #7 machine learning, and #8 carbon intensity indicator, together with smaller clusters labeled #2 authentication and #5 interaction effects. Overall, the cluster structure shows that the field links algorithmic methods with operational routing, emissions assessment, and system-level sustainability concerns.
The modularity value (Q = 0.5252) indicates thematic separation with discernible cluster boundaries, while the mean silhouette coefficient (S = 0.7902) indicates satisfactory internal consistency. These metrics provide a sound basis for interpreting the keyword clusters as coherent, although partially overlapping, research domains.
The cluster labels operate at three analytical levels: methods, engineering applications, and environmental objectives. Machine learning, neural networks, and multi-objective optimization represent methodological clusters; ship route planning and interaction effects represent applied operational scenarios; and greenhouse gas emissions, sustainable shipping, and carbon intensity indicators represent broader low-carbon objectives and assessment orientations.
At the application level, multi-objective optimization and ship route planning show that AI research is increasingly evaluated not only by predictive accuracy but also by the ability to balance fuel use, voyage time, safety, operating cost, and emissions under practical constraints. This shift is consistent with the broader move from estimation tasks to decision support and operational optimization.
The prominence of greenhouse gas emissions and carbon intensity indicators confirms that the literature is paying growing attention to measurable carbon outcomes rather than to energy efficiency alone. In this sense, the cluster structure suggests a transition from purely technical optimization toward research that is more explicitly aligned with decarbonization policy and emissions accounting.
The smaller cluster labeled authentication should be interpreted cautiously, yet it highlights a meaningful emerging concern with trusted data exchange, cybersecurity, and the credibility of distributed maritime information systems. These issues are directly relevant when AI models depend on shared operational data across ships, ports, and logistics actors.
The cluster map (
Figure 9) indicates that the field is no longer organized solely around stand-alone prediction tasks. Instead, it increasingly combines optimization methods, route and system applications, and auditable environmental objectives.
3.4.3. Keyword Timeline and Burst Detection
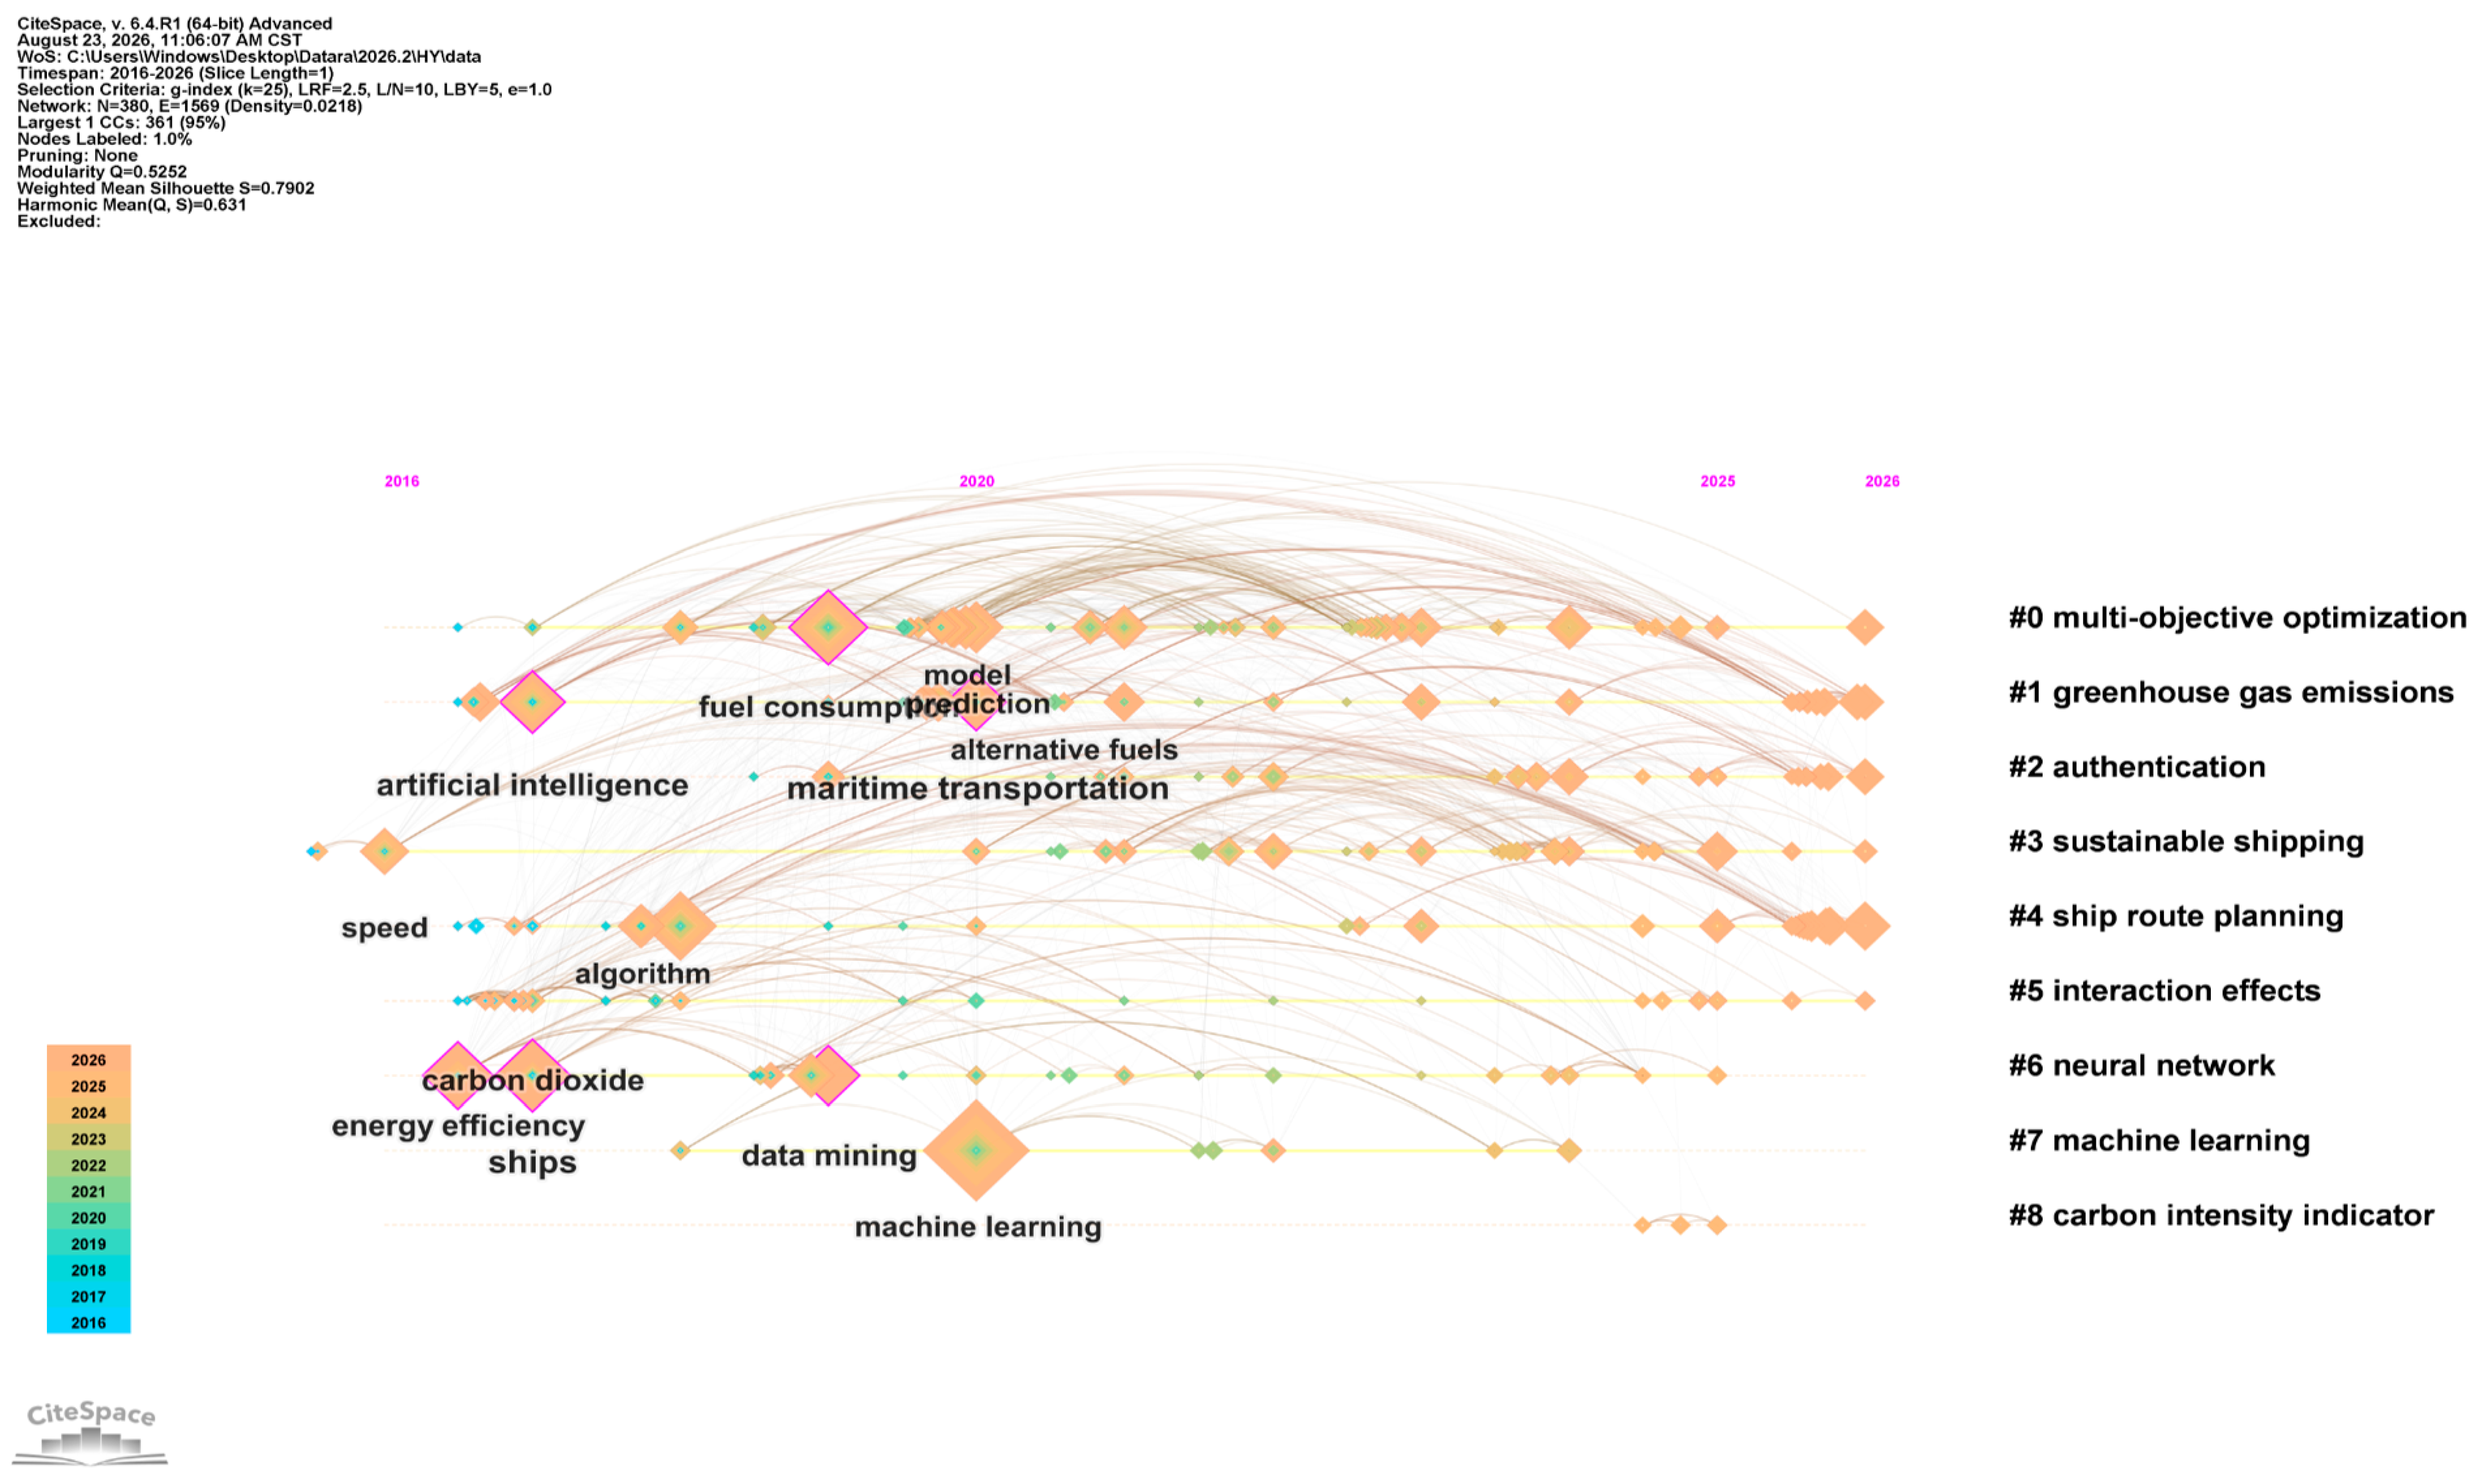
Figure 10 shows the staged evolution of research themes. From 2016 to 2020, nodes such as artificial intelligence, carbon dioxide, speed, ships, algorithm, data mining, and fuel-consumption prediction appeared early, indicating a first phase focused on basic modeling, efficiency diagnostics, and the representation of shipping emissions. From 2020 to 2023, model, maritime transportation, maritime transport, alternative fuels, and fuel-consumption prediction became more prominent, showing increased attention to operational data, modeling frameworks, and shipping-system applications.
The timeline indicates cumulative thematic development rather than the simple replacement of earlier topics. Early attention to speed, ships, carbon dioxide, and fuel-consumption prediction established the basis for later work on route planning, system optimization, and decarbonization assessment. More recent activity around greenhouse gas emissions, sustainable shipping, neural networks, and carbon intensity indicators suggests a field that is broadening from ship-level technical optimization toward wider system and policy relevance.
This progression corresponds to a shift from the observation of vessel behavior toward the optimization and governance of maritime systems. Early studies primarily characterized operating states and predicted fuel consumption, whereas later work more often integrated environmental indicators, alternative fuels, and system-level decision criteria.
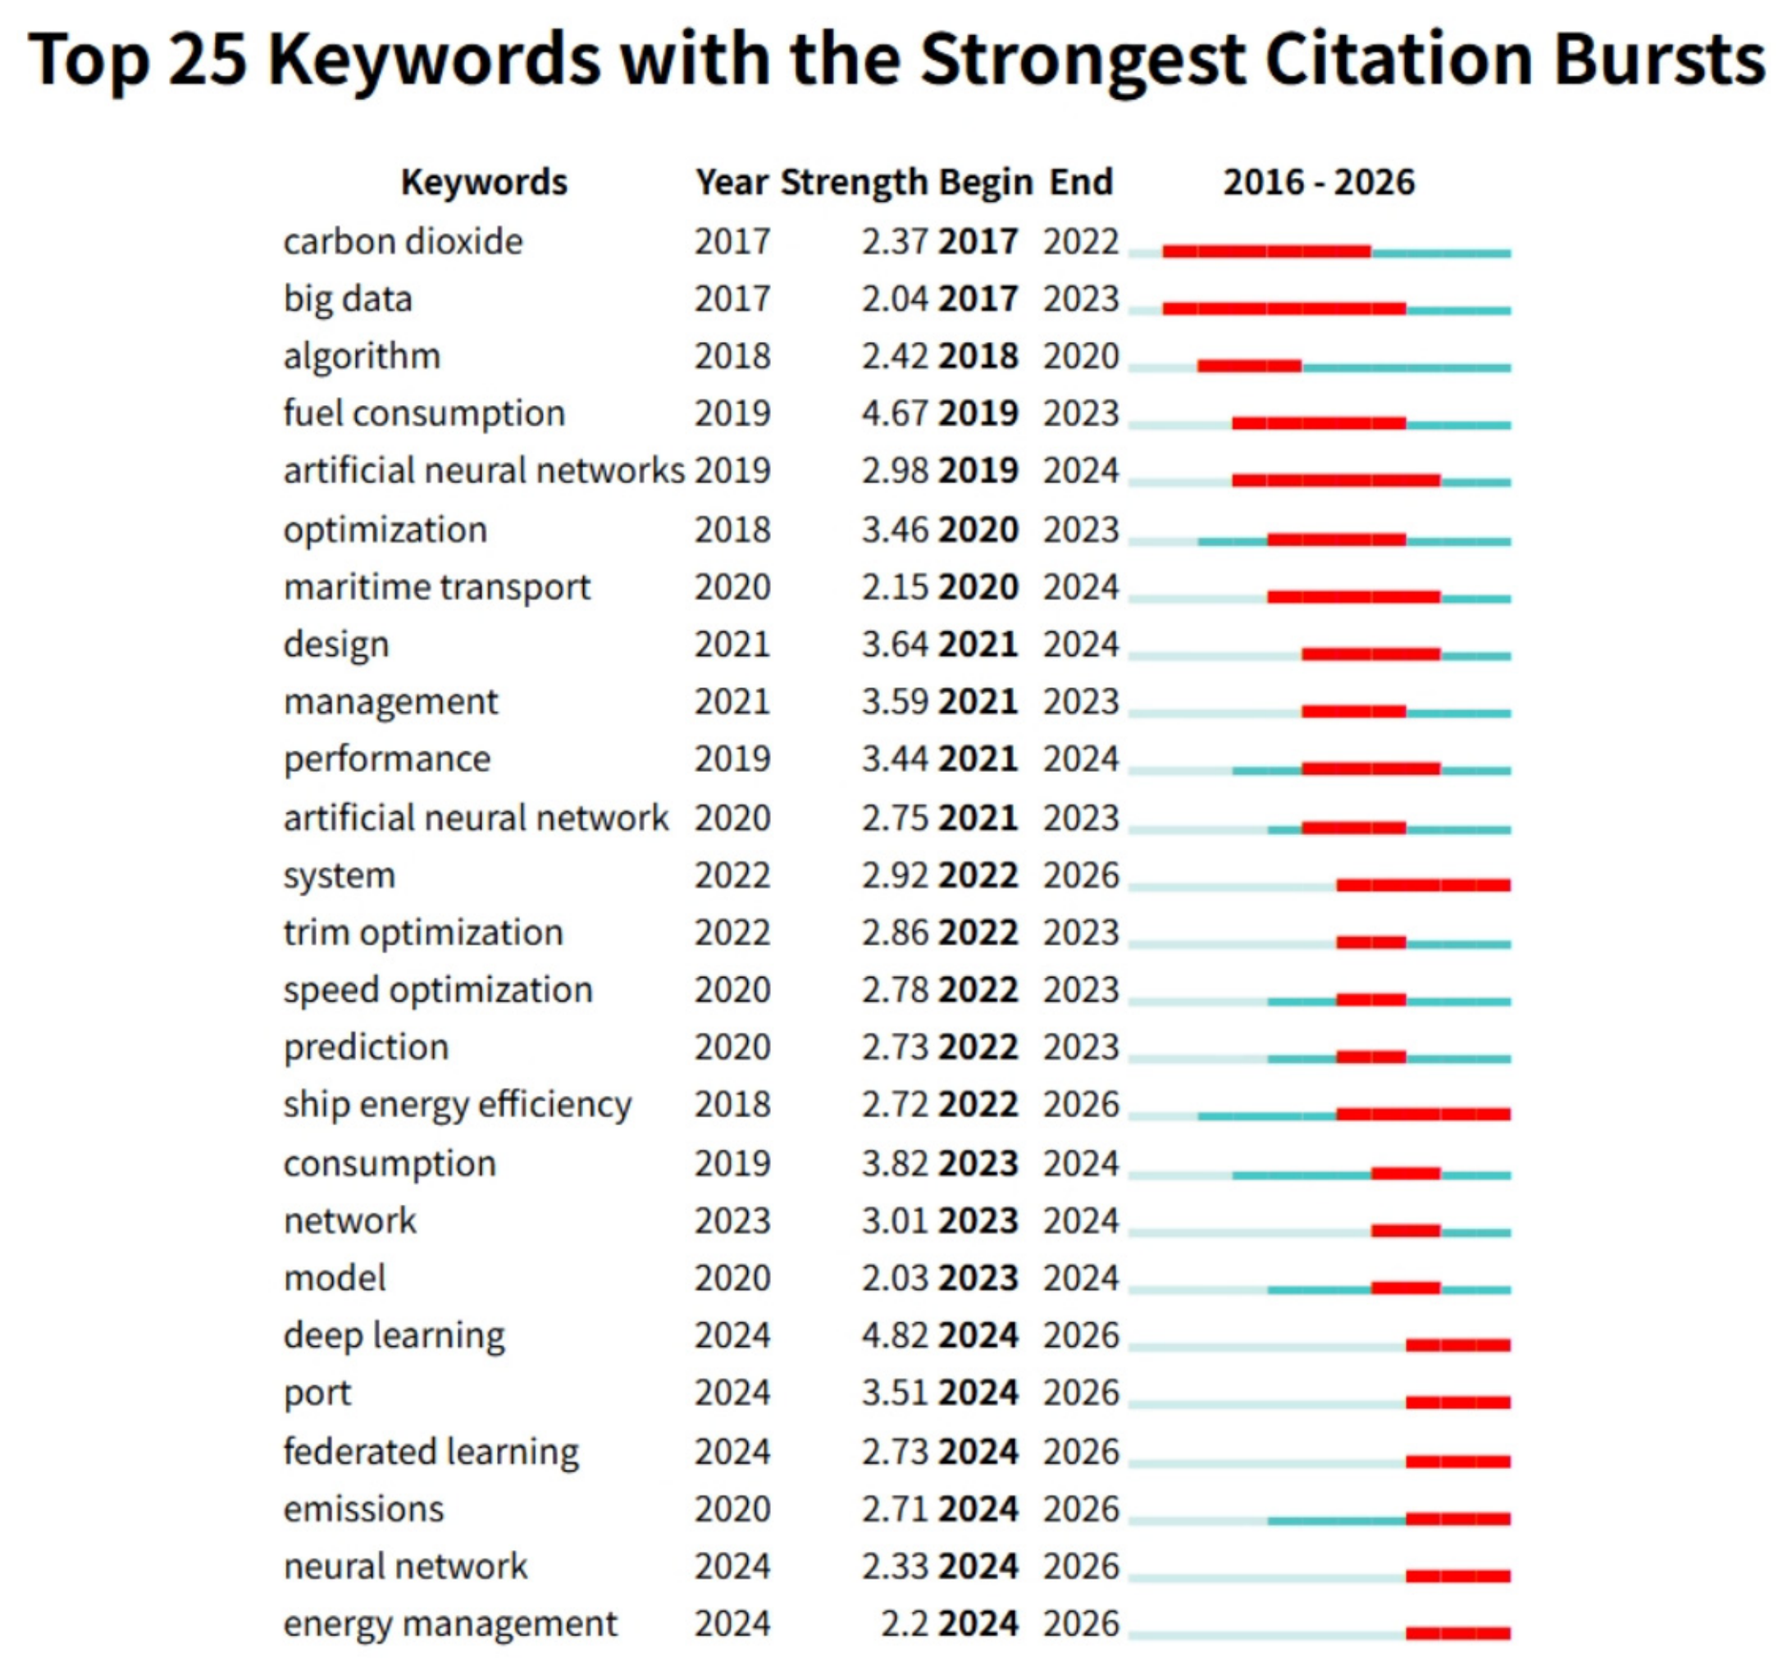
Figure 11 identifies carbon dioxide, big data, algorithm, fuel consumption, artificial neural networks, optimization, maritime transport, design, management, and performance as important earlier burst terms. Fuel consumption exhibited the strongest burst among the earlier themes, with a strength of 4.67 during 2019–2023. These early bursts indicate sustained attention to energy-use prediction, algorithmic development, and operational-performance improvement.
The most recent burst terms were system, ship energy efficiency, deep learning, port, federated learning, emissions, neural network, and energy management, all of which remained active through 2026. Deep learning showed the strongest recent burst (strength = 4.82), followed by port (3.51) and system (2.92). This pattern indicates that the frontier is shifting toward more advanced learning architectures, port-related coordination, privacy-preserving data collaboration, and integrated energy-management problems.
Burst analysis therefore suggests that the field has progressed from isolated algorithmic applications toward a broader agenda combining ship efficiency, port operations, emissions governance, and collaborative data infrastructures. Keyword frequencies, clusters, and bursts therefore characterize publication patterns and scholarly attention; they do not, by themselves, establish practical importance, industrial maturity, or the realized contribution of a technology to emissions reduction.
3.5. Analysis of Highly Cited Publications
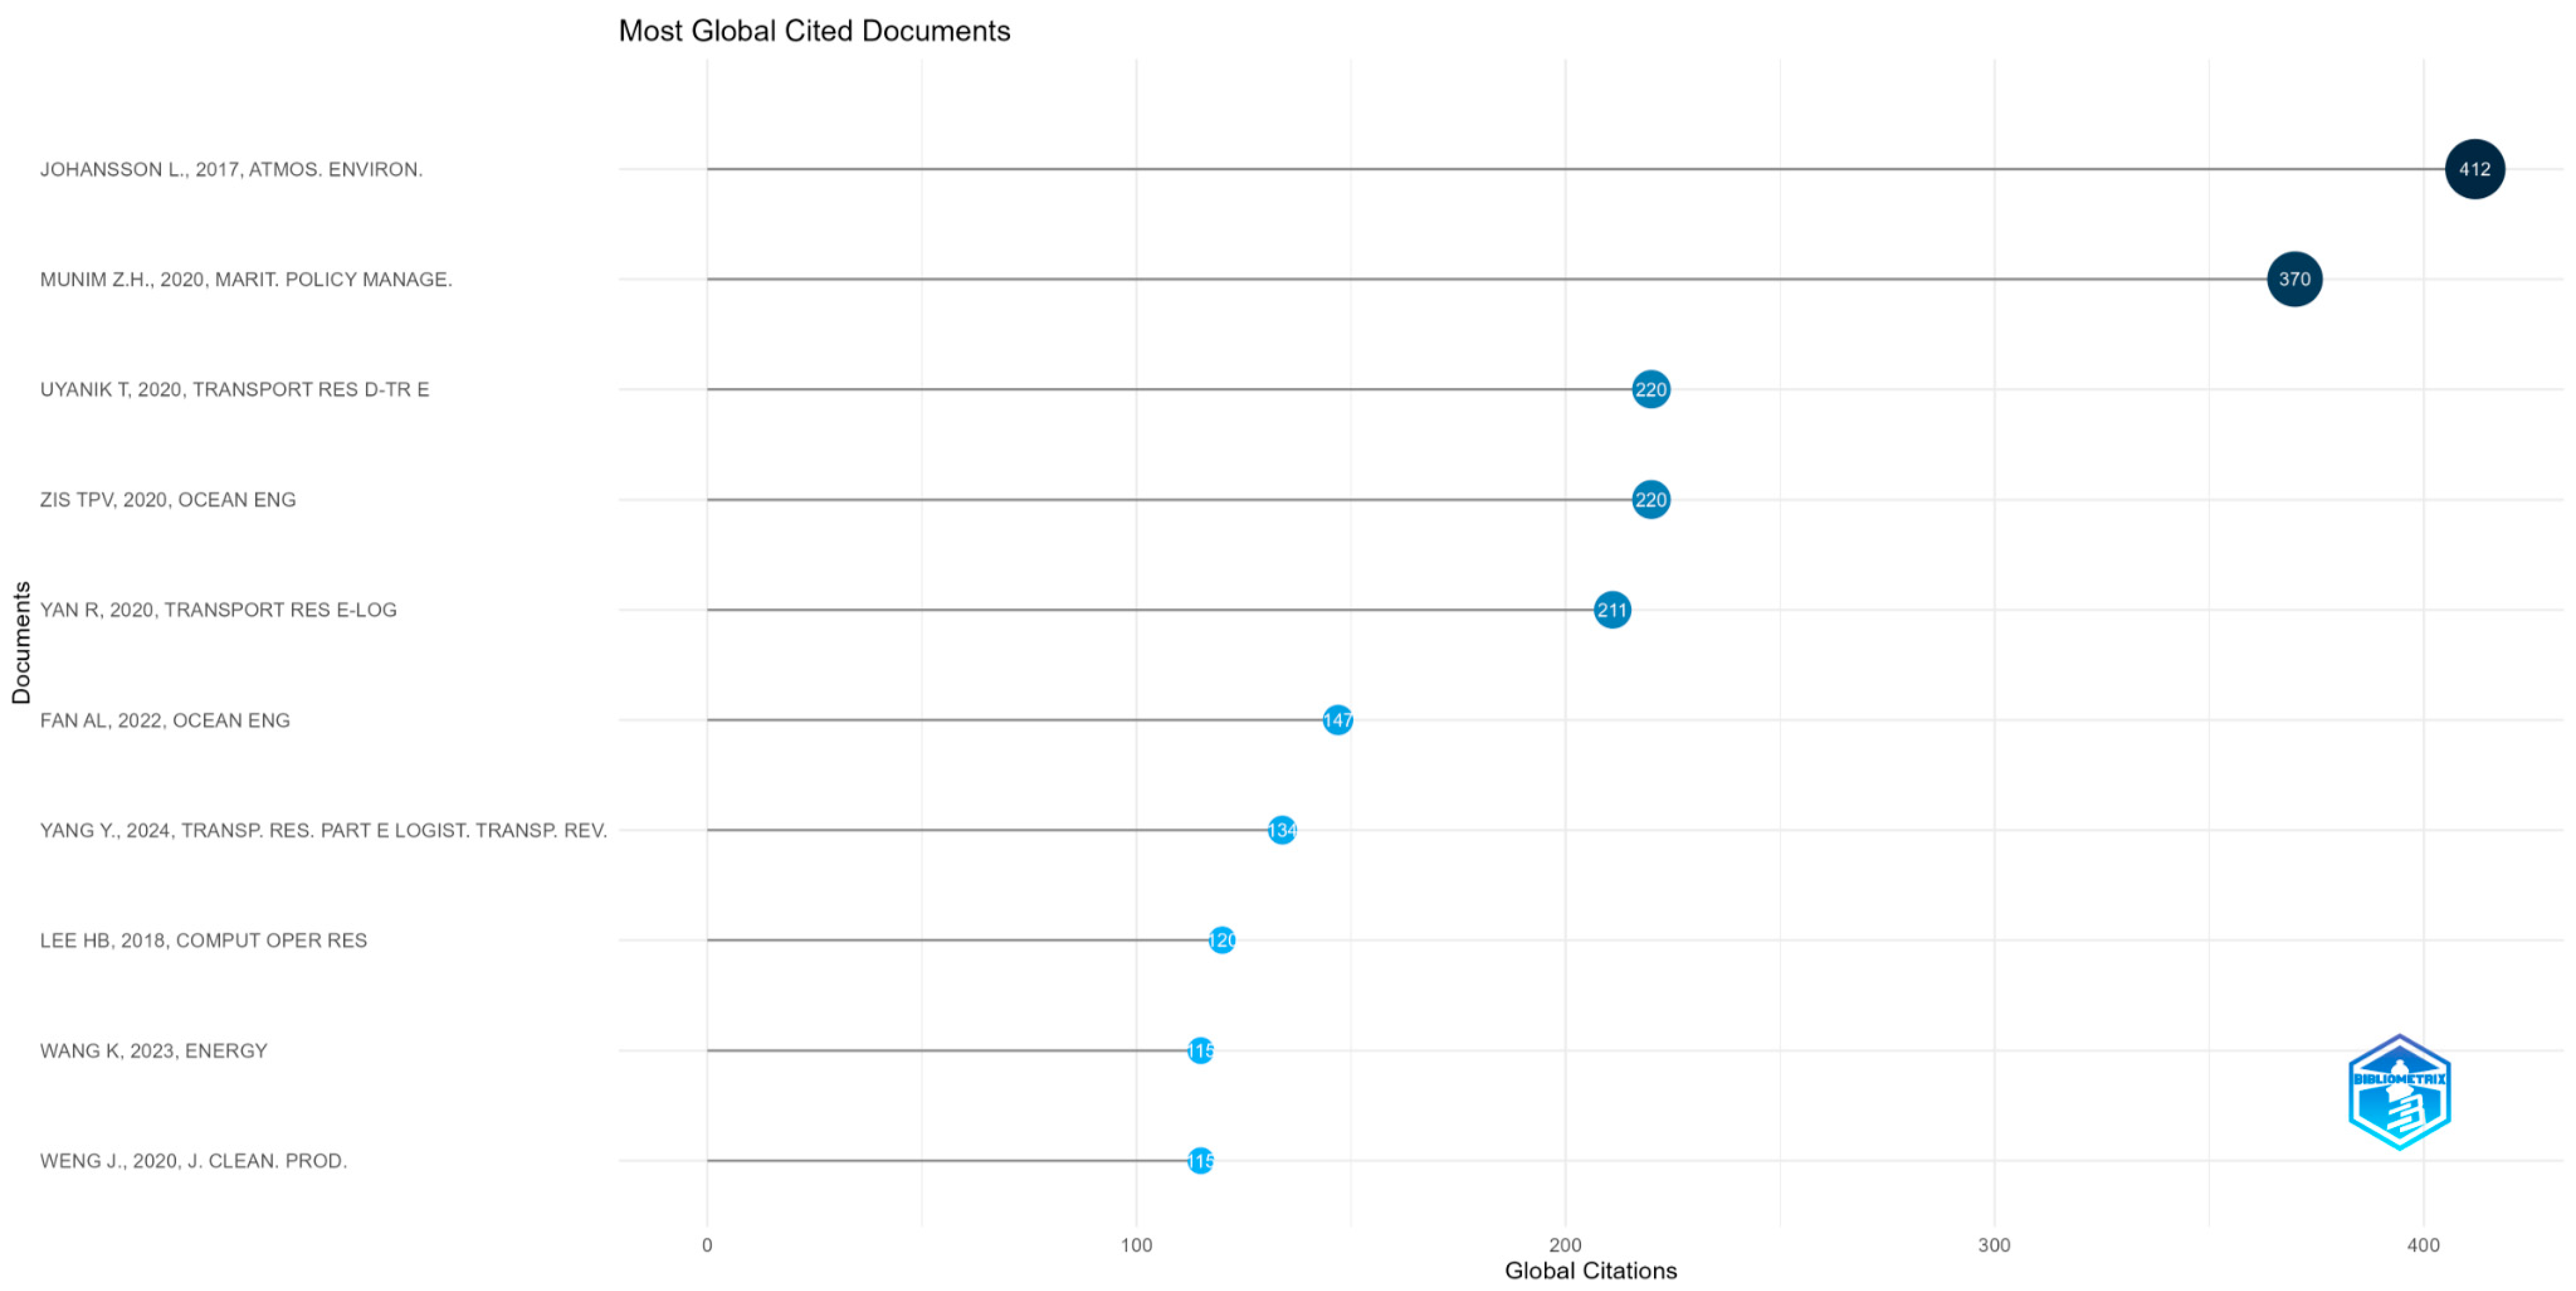
Statistics on highly cited publications based on global citation counts (
Table 8;
Figure 12) show that the field’s highly cited literature is concentrated from 2017 onward and was published mainly in journals covering atmospheric science, maritime policy, transportation, ocean engineering, energy, and cleaner production. Johansson et al. [
41] ranked first with 412 citations, followed by Munim et al. [
42] with 370 citations. Uyanık et al. [
43] and Zis et al. [
44] each received 220 citations, while Yan et al. [
45] received 211. These influential papers demonstrate that the intellectual base of the field combines shipping-emissions assessment, bibliometric synthesis, fuel-consumption prediction, and route or speed decision support.
The temporal concentration of highly cited publications from 2020 onward indicates that the field’s intellectual base is comparatively recent. In contrast to mature disciplines, whose foundational literature is distributed over longer periods, influential work on AI-enabled low-carbon shipping emerged alongside the wider diffusion of machine-learning methods in the scholarly literature and increasing research attention to green shipping. This pattern is consistent with a field whose theoretical structure remains under development and whose highly cited studies primarily provide methodological exemplars, data-modeling strategies, and extensions to new application contexts.
The citation profiles of the leading papers indicate the influence of research on global emissions inventories, AI and big-data reviews of the maritime industry, ship fuel-consumption prediction, weather routing, and vessel speed decision support. Ocean Engineering and the Transportation Research series remained especially visible sources of influential research, but highly cited work also appeared in Atmospheric Environment, Maritime Policy and Management, Energy, and the Journal of Cleaner Production.
The 10 most highly cited publications addressed emissions inventory, bibliometric synthesis, fuel-consumption prediction, vessel-energy-efficiency optimization, speed and route decisions, AIS-based maritime analytics, and ship energy-use prediction. Several of these studies combined reusable modeling workflows with clearly specified operational decisions, which helps explain their continued citation visibility across maritime, transport, and energy research.
Highly cited studies commonly integrate AI or optimization methods with clearly specified shipping decisions. Fuel-consumption prediction, vessel-energy-efficiency optimization, speed and route selection, and emissions management each have identifiable application boundaries and quantifiable outcomes, facilitating comparison and extension in subsequent research. By contrast, algorithmic studies that do not specify operational constraints may be less readily integrated into the cumulative literature of this application-oriented field. More specifically, Yan et al. [
45] combined a transparent two-stage prediction-and-reduction workflow with a clearly defined dry-bulk operating context, which made the procedure transferable to later fuel-saving studies. Uyanık et al. [
43] and related early machine-learning fuel models offered reproducible feature sets and evaluation metrics that subsequent papers could reuse as baselines. Zis et al. [
44] provided an organizing taxonomy for weather routing that subsequent optimization work could cite as a shared problem map, while Fan et al. [
3] synthesized fuel-consumption modeling practices and thereby lowered the entry cost for comparative model development. In each case, influence appears to stem less from citation accumulation alone than from reusable problem formulations, transferable pipelines, and explicit links between methods and operational decisions—features that distinguish these studies from otherwise competent but less citable case-specific applications.
The citation patterns further suggest that influence often arises from reusable problem formulations rather than from a single case-specific result. Studies that specify variables, model workflows, and evaluation metrics enable subsequent researchers to compare and extend their methods across datasets and contexts. Standardized reporting of research design is therefore important alongside the presentation of model performance.
Several recent publications also achieved high normalized citation scores over comparatively short observation periods. Yang et al. [
46] and Wang et al. [
47], for example, ranked among the most highly normalized contributions, indicating that the research frontier continues to evolve rapidly even as the broader citation base expands.
Table 8.
Highly cited publications.
Table 8.
Highly cited publications.
| Rank | Paper | DOI | Total Citations | TC per Year | Normalized TC |
|---|
| 1 | JOHANSSON, 2017, ATMOS. ENVIRON. [41] | 10.1016/j.atmosenv.2017.08.042 | 412 | 41.2 | 3.13 |
| 2 | MUNIM, 2020, MARIT. POLICY MANAGE. [42] | 10.1080/03088839.2020.1788731 | 370 | 52.86 | 4.08 |
| 3 | UYANIK, 2020, TRANSPORT RES D-TR E [43] | 10.1016/j.trd.2020.102389 | 220 | 31.43 | 2.43 |
| 4 | ZIS, 2020, OCEAN ENG [44] | 10.1016/j.oceaneng.2020.107697 | 220 | 31.43 | 2.43 |
| 5 | YAN, 2020, TRANSPORT RES E-LOG [45] | 10.1016/j.tre.2020.101930 | 211 | 30.14 | 2.33 |
| 6 | FAN, 2022, OCEAN ENG [3] | 10.1016/j.oceaneng.2022.112405 | 147 | 29.4 | 3.54 |
| 7 | YANG, 2024, TRANSP. RES. PART E LOGIST. TRANSP. REV. [46] | 10.1016/j.tre.2024.103426 | 134 | 44.67 | 5.47 |
| 8 | LEE, 2018, COMPUT OPER RES [48] | 10.1016/j.cor.2017.06.005 | 120 | 13.33 | 2.24 |
| 9 | WANG, 2023, ENERGY [47] | 10.1016/j.energy.2023.128910 | 115 | 28.75 | 4.02 |
| 10 | WENG, 2020, J. CLEAN. PROD. [49] | 10.1016/j.jclepro.2019.119297 | 115 | 16.43 | 1.27 |
Taken together, the annual-output, research-actor, source-journal, keyword, and citation analyses address RQ1 by demonstrating rapid publication growth after 2022, a substantial contribution from East Asian maritime institutions, and a multi-cluster collaboration network. The 277 publications issued during the complete years 2022–2025 represented 57.83% of the sample, and the partial year 2026 already contributed a further 137 records. Because the 2026 data extend only through 23 August, they are not directly comparable with complete years.
The knowledge structure addressed by RQ2 has a stable core comprising machine learning, fuel consumption, and energy efficiency, while extending toward deep learning, reinforcement learning, federated learning, speed optimization, trim optimization, green shipping, and sustainable maritime logistics. Keyword clustering, timeline analysis, burst detection, and highly cited publications provide complementary support for this interpretation of thematic evolution. These indicators should be interpreted as maps of research activity rather than rankings of technological readiness or operational impact.
These results characterize research activity and knowledge structure, but they do not independently demonstrate reproducible real-world emissions reduction. Throughout the remainder of the manuscript, bibliometric observations are therefore treated as evidence of scholarly attention and problem framing, whereas claims about operational effectiveness or verified carbon outcomes are reserved for settings in which field measurement, credible counterfactuals, and accounting boundaries are available.
Section 4 therefore combines the bibliometric results, auxiliary thematic coding, and representative full texts to identify the change in problem structure, develop an evidence-informed AI-to-Carbon Value Chain conceptual synthesis, derive four evidence-informed conceptual propositions, locate breaks in the current evidence chain, and specify implications for research, industry, and policy. This integrated interpretation provides the basis for the limitations and future agenda in
Section 5.
5. Limitations and Future Research
5.1. Limitations of the Evidence Base and This Review
This review is limited first by its bibliographic scope. Although the sample was expanded to include both the Web of Science Core Collection and Scopus, it remained restricted to English-language articles and reviews. Conference papers, standards, class rules, industry trials, incident reports, patents, commercial data, and non-English research may contain deployment evidence that is weakly represented in academic databases. Scopus improves coverage of engineering-oriented outlets, but IEEE Xplore and other specialized engineering databases were not searched independently. A within-corpus term-coverage audit found AutoML in one record, graph neural network/GNN terminology in five, and large language model/LLM terminology in two, whereas graph attention networks, knowledge distillation, foundation models, and generative-AI terms were not detected. Because the databases were not rerun with these additional terms, possible retrieval gains from an expanded query remain an acknowledged limitation. The exact executed Scopus syntax was not retained, which also limits full search reproducibility. The 2026 records cover only the period through 23 August, and citation indicators for recent publications are affected by citation lag.
Second, broad search terms create a precision-recall trade-off. The post hoc domain-validation sensitivity analysis quantified this spillover: 40 of 479 records failed the strict title-abstract three-concept screen, including 25 that failed both independently specified rules and 15 discordant cases. The main bibliometric maps were not retrospectively rebuilt because they were generated from the prespecified 479-record corpus, but a conservative 437-record sensitivity subset, after removal of one retracted and one withdrawn record, reproduced the principal temporal, journal, and keyword patterns. This provides an explicit robustness check while remaining transparent that duplicate-independent human title-and-abstract screening was not performed.
Third, the auxiliary coding was rule-based and non-exclusive. It identifies the presence of thematic signals, not the quality, centrality, or causal contribution of those themes within each study. A two-lexicon robustness check yielded mean agreement of 90.0% and mean Cohen’s kappa of 0.756 across the eight categories, but formal duplicate-independent human coding was not undertaken. The six reviews and one perspective [
4,
11,
12,
13,
14,
20,
21] were selected to span major review perspectives, not to constitute an exhaustive systematic full-text sample. The AICV is therefore an evidence-informed conceptual synthesis that should be tested and refined through prospective empirical research rather than treated as a validated measurement scale.
The AICV evidence counts were derived from title-, keyword-, and abstract-level signals rather than full-text appraisal of all 479 publications. They therefore quantify the visibility of stage-related evidence in the bibliographic corpus rather than the maturity, quality, or successful implementation of each AICV stage. In particular, the absence of an explicit signal in the indexed fields does not necessarily imply absence of the corresponding evidence in the full text. The deterministic evidence-signal audit did not involve duplicate-independent human coding and does not validate the AICV as a causal framework or measurement scale.
Fourth, network robustness was not tested under fractional counting. The author network was reconstructed for four subperiods, but the intervals were unequal in duration, and the 2026 interval was incomplete. Node eligibility, links, TLS, density, and cluster assignments were calculated separately within each slice, so their absolute values are not directly additive or equivalent to standardized longitudinal network estimates; conclusions about temporal network change therefore remain descriptive. The 437-record sensitivity analysis tested headline temporal, source-journal, and keyword patterns, not the stability of every network edge, node ranking, or cluster assignment.
Finally, bibliometric and narrative evidence cannot pool heterogeneous prediction errors or emissions-reduction percentages. Differences in vessel type, route, weather, fuel, loading, baseline, functional unit, system boundary, and validation design make a universal effect size inappropriate. Publication output, network centrality, citation visibility, and term frequency describe knowledge production; they do not establish causal or net carbon impact.
Fifth, the absence of duplicate-independent human screening, a formal study-level risk-of-bias assessment, a reporting-bias assessment, certainty grading, and duplicate-independent human coding with formal inter-rater reliability testing means that this review should not be interpreted as an intervention-effect systematic review. These procedures cannot be reconstructed reliably without a new study-level appraisal of the full corpus. The present synthesis is accordingly strongest as a structured interpretation of a merged bibliometric evidence base.
5.2. Future Research Agenda: From Isolated Accuracy to Verified System Decarbonization
5.2.1. Build Carbon-Ready Data Commons and External Benchmarks
Future datasets should be designed around the decisions and accounting claims they are expected to support. A carbon-ready benchmark should combine synchronized vessel, engine, voyage, loading, weather, sea-state, port-event, and energy-source data; document sensor provenance and calibration; distinguish missingness from true zero activity; and attach uncertainty to measured and derived variables. Common definitions are needed for voyage segments, operational phases, waiting, maneuvering, fuel types, emission factors, cargo work, and functional units.
Benchmark governance should permit out-of-time, leave-one-vessel-out, cross-fleet, cross-region, and cross-port tests without forcing commercial data into a single repository. Federated evaluation, trusted research environments, synthetic-data stress tests, and standardized data cards can balance reproducibility with confidentiality [
9,
28,
56,
57]. Leaderboards should rank calibration, robustness, inference cost, and failure detection alongside point accuracy, and should retain negative or null results to reduce publication bias.
5.2.2. Move from Associative Prediction to Physically and Causally Credible Models
Predictive accuracy does not identify what will happen after an operator changes speed, route, trim, maintenance, or energy dispatch. Future work should combine physical constraints, causal inference, and machine learning to distinguish stable mechanisms from correlations created by historical operating policies. Hybrid models should enforce feasible resistance, propulsion, engine-load, battery, and sea-state relationships while allowing data-driven components to learn residual structure [
25,
62,
110,
111,
112].
Uncertainty should be propagated from sensing through prediction and optimization to carbon accounting. Studies should report calibrated prediction intervals, scenario coverage, out-of-distribution alarms, sensitivity to emission factors, and the conditions under which recommendations are withdrawn. Digital twins can support counterfactual testing, but their structural and parameter uncertainty must be validated against held-out voyages rather than inferred from apparent simulation fidelity [
8,
55].
5.2.3. Design Human-in-the-Loop Closed-Loop Trials
A priority for empirical research is to document the transition from recommendation to action. Studies should use a staged evidence ladder: historical replay, out-of-time and cross-vessel testing, digital-twin simulation, hardware-in-the-loop testing, shadow-mode deployment, controlled onboard or port pilots, and longitudinal fleet evaluation. Each stage should record latency, recommendation availability, acceptance, overrides, safety-triggered exits, operator workload, model updates, and measured operational outcomes [
7,
76].
Human factors should be modeled as part of the intervention rather than residual noise. Research should compare explanation formats, confidence displays, alarm thresholds, and allocation of control between crew, shore centers, and autonomous systems. A lower-accuracy model that is understood and appropriately used may outperform an opaque model whose outputs are either disregarded or relied upon inappropriately. Prospective protocols should therefore specify human override authority, competency requirements, and post-incident learning.
5.2.4. Optimize Ship-Port-Fleet-Logistics Systems and Test for Rebound
Future optimization should couple voyage speed and routing with berth availability, terminal capacity, cargo connections, fleet schedules, shore power, and energy prices. Multi-agent and robust optimization can represent decentralized actors, but technical coordination must be paired with mechanism design: the allocation of data-sharing obligations, schedule-adjustment responsibilities, delay risks, and verified savings. Just-in-Time arrival should be evaluated over complete services and congestion states, not only on an isolated voyage [
53,
54].
Every system study should test whether local gains survive broader boundaries. Relevant outcomes include additional vessels needed to maintain frequency, cargo diversion, anchorage and terminal emissions, empty repositioning, upstream electricity or fuel production, and the energy used for sensing, communications, training, and inference. Scenario analysis should identify the point at which a local AI benefit is neutralized or reversed, making the scale-dependent rebound proposition empirically testable.
5.2.5. Integrate Carbon Verification, Data Governance, and Cybersecurity
Carbon claims should be designed before deployment. Studies should preregister the baseline, counterfactual method, functional unit, boundary, emission factors, uncertainty treatment, and rules for additionality and double counting. Operational fuel and CO
2 metrics should be reported separately from CO
2e, well-to-wake, and life-cycle outcomes. Near-real-time accounting can support operational feedback, but independent reconciliation and auditable data lineage are needed before it supports incentives or compliance [
27,
55,
85].
Privacy-preserving collaboration should be evaluated as a governed operational system. Federated-learning studies should report statistical heterogeneity, communication energy, dropouts, secure aggregation, poisoning resistance, model and data versioning, and responsibility for erroneous recommendations [
9,
28,
56,
57,
95,
96]. Model cards, incident registers, change logs, and independent red-team testing should accompany deployment in safety-critical maritime settings.
5.2.6. Create Cumulative, Comparable, and Living Evidence
The field would benefit from reporting standards that locate each study within the AICV and its associated evidence ladder. At a minimum, reports should specify data provenance, intended users, the operational decision, constraints, external-validation design, adoption pathway, system boundary, carbon metric, uncertainty, cybersecurity controls, and evidence tier. Shared protocols would enable comparisons among studies with equivalent designs and would distinguish simulation, test-bench, and verified field evidence.
A living evidence infrastructure could periodically update bibliometric maps, screened full-text coding, datasets, and deployment evidence as regulations, fuels, vessel systems, and AI methods evolve. Cross-case studies could then test the AICV propositions, including whether weak conversion stages predict deployment failure, whether broader system boundaries change the sign of an intervention, whether AI-hardware complementarity improves asset utilization, and whether governance capacity explains sustained adoption. Such an infrastructure would advance the field from descriptive assessments of technological potential toward cumulative theory and falsifiable evidence.
6. Conclusions
This review analyzed a 479-record WoSCC-Scopus corpus through bibliometric analysis, science mapping, auxiliary document-level coding, and representative full-text synthesis. In a conservative post hoc subset of 437 records, the principal temporal, source-journal, and leading-keyword patterns were similar to those of the main corpus; this check did not test the stability of every network edge, cluster, or conceptual inference. The field expanded rapidly after 2022 and remains anchored in fuel, power, emissions, and energy-efficiency prediction. In the separate post hoc AICV audit, explicit bibliographic signals were identified for data observability in 195/479 records (40.7%), model credibility in 123/479 (25.7%), decision executability in 186/479 (38.8%), system coordination in 21/479 (4.4%), and carbon verification in 58/479 (12.1%). This non-monotonic distribution describes evidence visibility rather than implementation maturity. The keyword timeline, time-sliced author networks, temporal-overlay maps, and representative recent studies further indicate growing attention to optimization and control, ship-port-network coordination, model transfer and uncertainty, carbon accounting, privacy, security, and governance.
An organizing answer to RQ4 is that claims of AI-enabled emissions reduction should be assessed across five linked evidentiary transitions: data must make the relevant maritime state observable; models must remain credible under intended conditions; recommendations must be executable; local benefits must be retained through system coordination; and carbon outcomes must be additional and auditable. The AICV names these transitions and organizes the associated evidence gaps; it does not establish that they occur causally in operational settings. AI can contribute to decarbonization only when evidence supports the relevant conversions across technical, organizational, and accounting boundaries.
Four evidence-informed conceptual propositions follow. Verified impact is bounded by the weakest conversion link; local benefits can diminish or reverse as the system boundary expands; AI complements rather than replaces fuels, propulsion, and energy-saving hardware; and governance is an internal capability that shapes data access, trust, action, and verification. These propositions reconcile the field’s strong predictive evidence with its weaker deployment and auditing evidence, but they remain interpretive propositions requiring prospective empirical testing rather than validated intervention claims.
Future research should build carbon-ready multi-source benchmarks, combine physical and causal knowledge with calibrated learning, conduct human-in-the-loop closed-loop trials, coordinate ship-port-fleet-logistics decisions, integrate well-to-wake verification with privacy and cybersecurity, and report evidence through a common maturity ladder. A central research question is therefore the conditions, beneficiaries, and system boundaries under which an AI-enabled intervention produces persistent net carbon value.
These conclusions should be interpreted in light of the two-database, English-language sample; partial-year coverage for 2026; citation lag; peripheral query matches; non-exclusive thematic coding; the absence of duplicate-independent human screening and duplicate-independent human coding with formal inter-rater reliability testing; and the absence of an effect-size meta-analysis. These limitations further indicate that claims of AI-enabled maritime decarbonization should be supported by transparent data, credible counterfactuals, system-aware evaluation, and auditable carbon accounting rather than by publication growth, keyword prominence, or algorithmic accuracy alone.