Article

The Effects of Seawater on the Durability of Planks in Withstanding Ram Attacks: Experimental Archaeology


1
Department of Maritime Civilizations, School of Archaeology and Maritime Cultures, University of Haifa, Haifa 3103301, Israel
2
Leon Recanati Institute for Maritime Studies, University of Haifa, Haifa 3103301, Israel
3
The Laboratory of Archaeobotany and Ancient Environments, Institute of Archaeology, and the Steinhardt Museum of Natural History, Tel Aviv University, Tel Aviv 6997801, Israel
4
Archaeobotanical Laboratory, Archaeological Research Department, Israel Antiquities Authority, Jerusalem 9100402, Israel
*
Author to whom correspondence should be addressed.
J. Mar. Sci. Eng. 2026, 14(17), 1655; https://doi.org/10.3390/jmse14171655
Submission received: 6 August 2026 / Revised: 27 August 2026 / Accepted: 31 August 2026 / Published: 6 September 2026
(This article belongs to the Section Ocean Engineering)

Abstract

The present paper constitutes the second phase of a three-phase research project and focuses on the experimental determination of the Modulus of Elasticity (MoE), a fundamental material property. It builds on a previous study published in 2024, which developed an analytical model for estimating the minimum velocity required for an ancient warship to inflict significant damage on an opposing vessel through ramming. The MoE, together with several other parameters, plays a critical role in determining the ability of hull planks to withstand the forces generated during such attacks. For wood, MoE is influenced by species, moisture content, and growth conditions. However, published MoE values are typically obtained under controlled moisture conditions and do not represent seawater-saturated wood, which is directly relevant to submerged ship planks. To address this gap, the MoE of cedar (Cedrus libani), fir (Abies alba), and pine (Pinus spp.), was experimentally determined using three-point bending tests after one week of immersion in East Mediterranean seawater. The resulting MoE values provide representative mechanical properties for the analytical model developed in this study. Incorporating the experimentally determined MoE values into the analytical model of one trireme ramming another yields an estimated minimum impact velocity range of about 1.0–1.2 m/s, required for a ram to cause a catastrophic fracture of a single seawater-soaked plank.

1. Introduction

The present paper is the second phase of our three-phase analytical and experimental research program. It builds on our first paper, published in 2025 [1], which presented an analytical model for estimating the minimum velocity required for an attacking ancient warship to inflict significant damage (as defined in [1]) on an opposing vessel using its ram.
The study focuses on obtaining more accurate experimental data on the material properties of hull planks under conditions that closely approximate those encountered during ancient naval warfare, including the use of historically relevant wood species and seawater-soaked specimens. This data is intended to refine the analytical model and improve the accuracy of its predictions.

1.1. Naval Battles

In Antiquity, between 800 and 30 BCE, major naval battles took place in the Mediterranean. Three such examples are well documented: (a) Salamis (480 BCE), in which the Athenian fleet, led by Themistocles, routed the Persian fleet of King Xerxes, who watched the battle from his throne on the beach [2] (pp. 89–91), [3] (p. 17); (b) the Aegadian Islands, which was the final confrontation between Rome and Carthage of the First Punic War (241 BCE), decisively won by the Romans [4] (p. 92); and (c) Actium (31 BCE) between the fleets of Octavianus Caesar and the combined fleets of Marcus Antonius and Queen Cleopatra of Egypt, the final battle of the Roman Republic [2] (p. 208); [5] (pp. 164–165), leading to the dictatorship of the winner, Octavianus (Augustus). Many other naval battles were fought throughout the Mediterranean, damaging or destroying warships by their principal offensive weapon—the ram [6] (p. 76).
Archaeological evidence provides direct insight into the design, function, and tactical role of this weapon. The second century BCE Athlit ram recovered in 1980 off the coast of Athlit (Israel), and currently displayed at the National Maritime Museum in Haifa, Israel [6] (p. 17), [7,8] (p. 61), is the largest example of an ancient naval ram discovered to date. Further underwater surveys conducted since 2008 around the Aegadian Islands (off the western coast of Sicily), the site of the decisive Roman–Carthaginian encounter, have yielded 26 bronze rams (of which the data of only 11 have been published to date; see [4], several displaying clear traces of impact deformation.
Constructed as a bronze sheathing over a wooden core formed by extensions of the keel, wales and bow planking, the ram was located below the waterline and engineered to breach and penetrate the hull of an opposing vessel. Such impacts were aimed at causing severe structural damage, leading to the ship’s incapacitation by flooding, shearing off oars, or by secondary injuries of the crew through the shock of collision [6] (p. 38).
Together with historical literature and iconographic representations on pottery, wall paintings, and coins, these finds substantiate the interpretation that ramming was the principal offensive tactic in ancient Mediterranean naval warfare, offering tangible evidence of the technological sophistication and tactical intent of ancient shipbuilders and commanders.

1.2. Beaching

Ancient literary sources—including Pliny the Elder (Natural History 35.35) and Xenophon (Hellenica 1.5)—indicate that ancient warships, particularly triremes, were not typically left at anchor; instead, beaching was a standard and routine practice. Herodotus recorded that Xerxes’ fleet, composed largely of triremes, halted at Zone (north of the Aegean Sea, in modern Thrace, Greece) to beach and “dry out” their vessels [9] (p. 827). Ship sheds have been discovered in Carthage (modern Tunis), Marseilles, Rome, Syracuse, Zea in Piraeus, Greece, and many other Greek islands and ancient harbors [10].
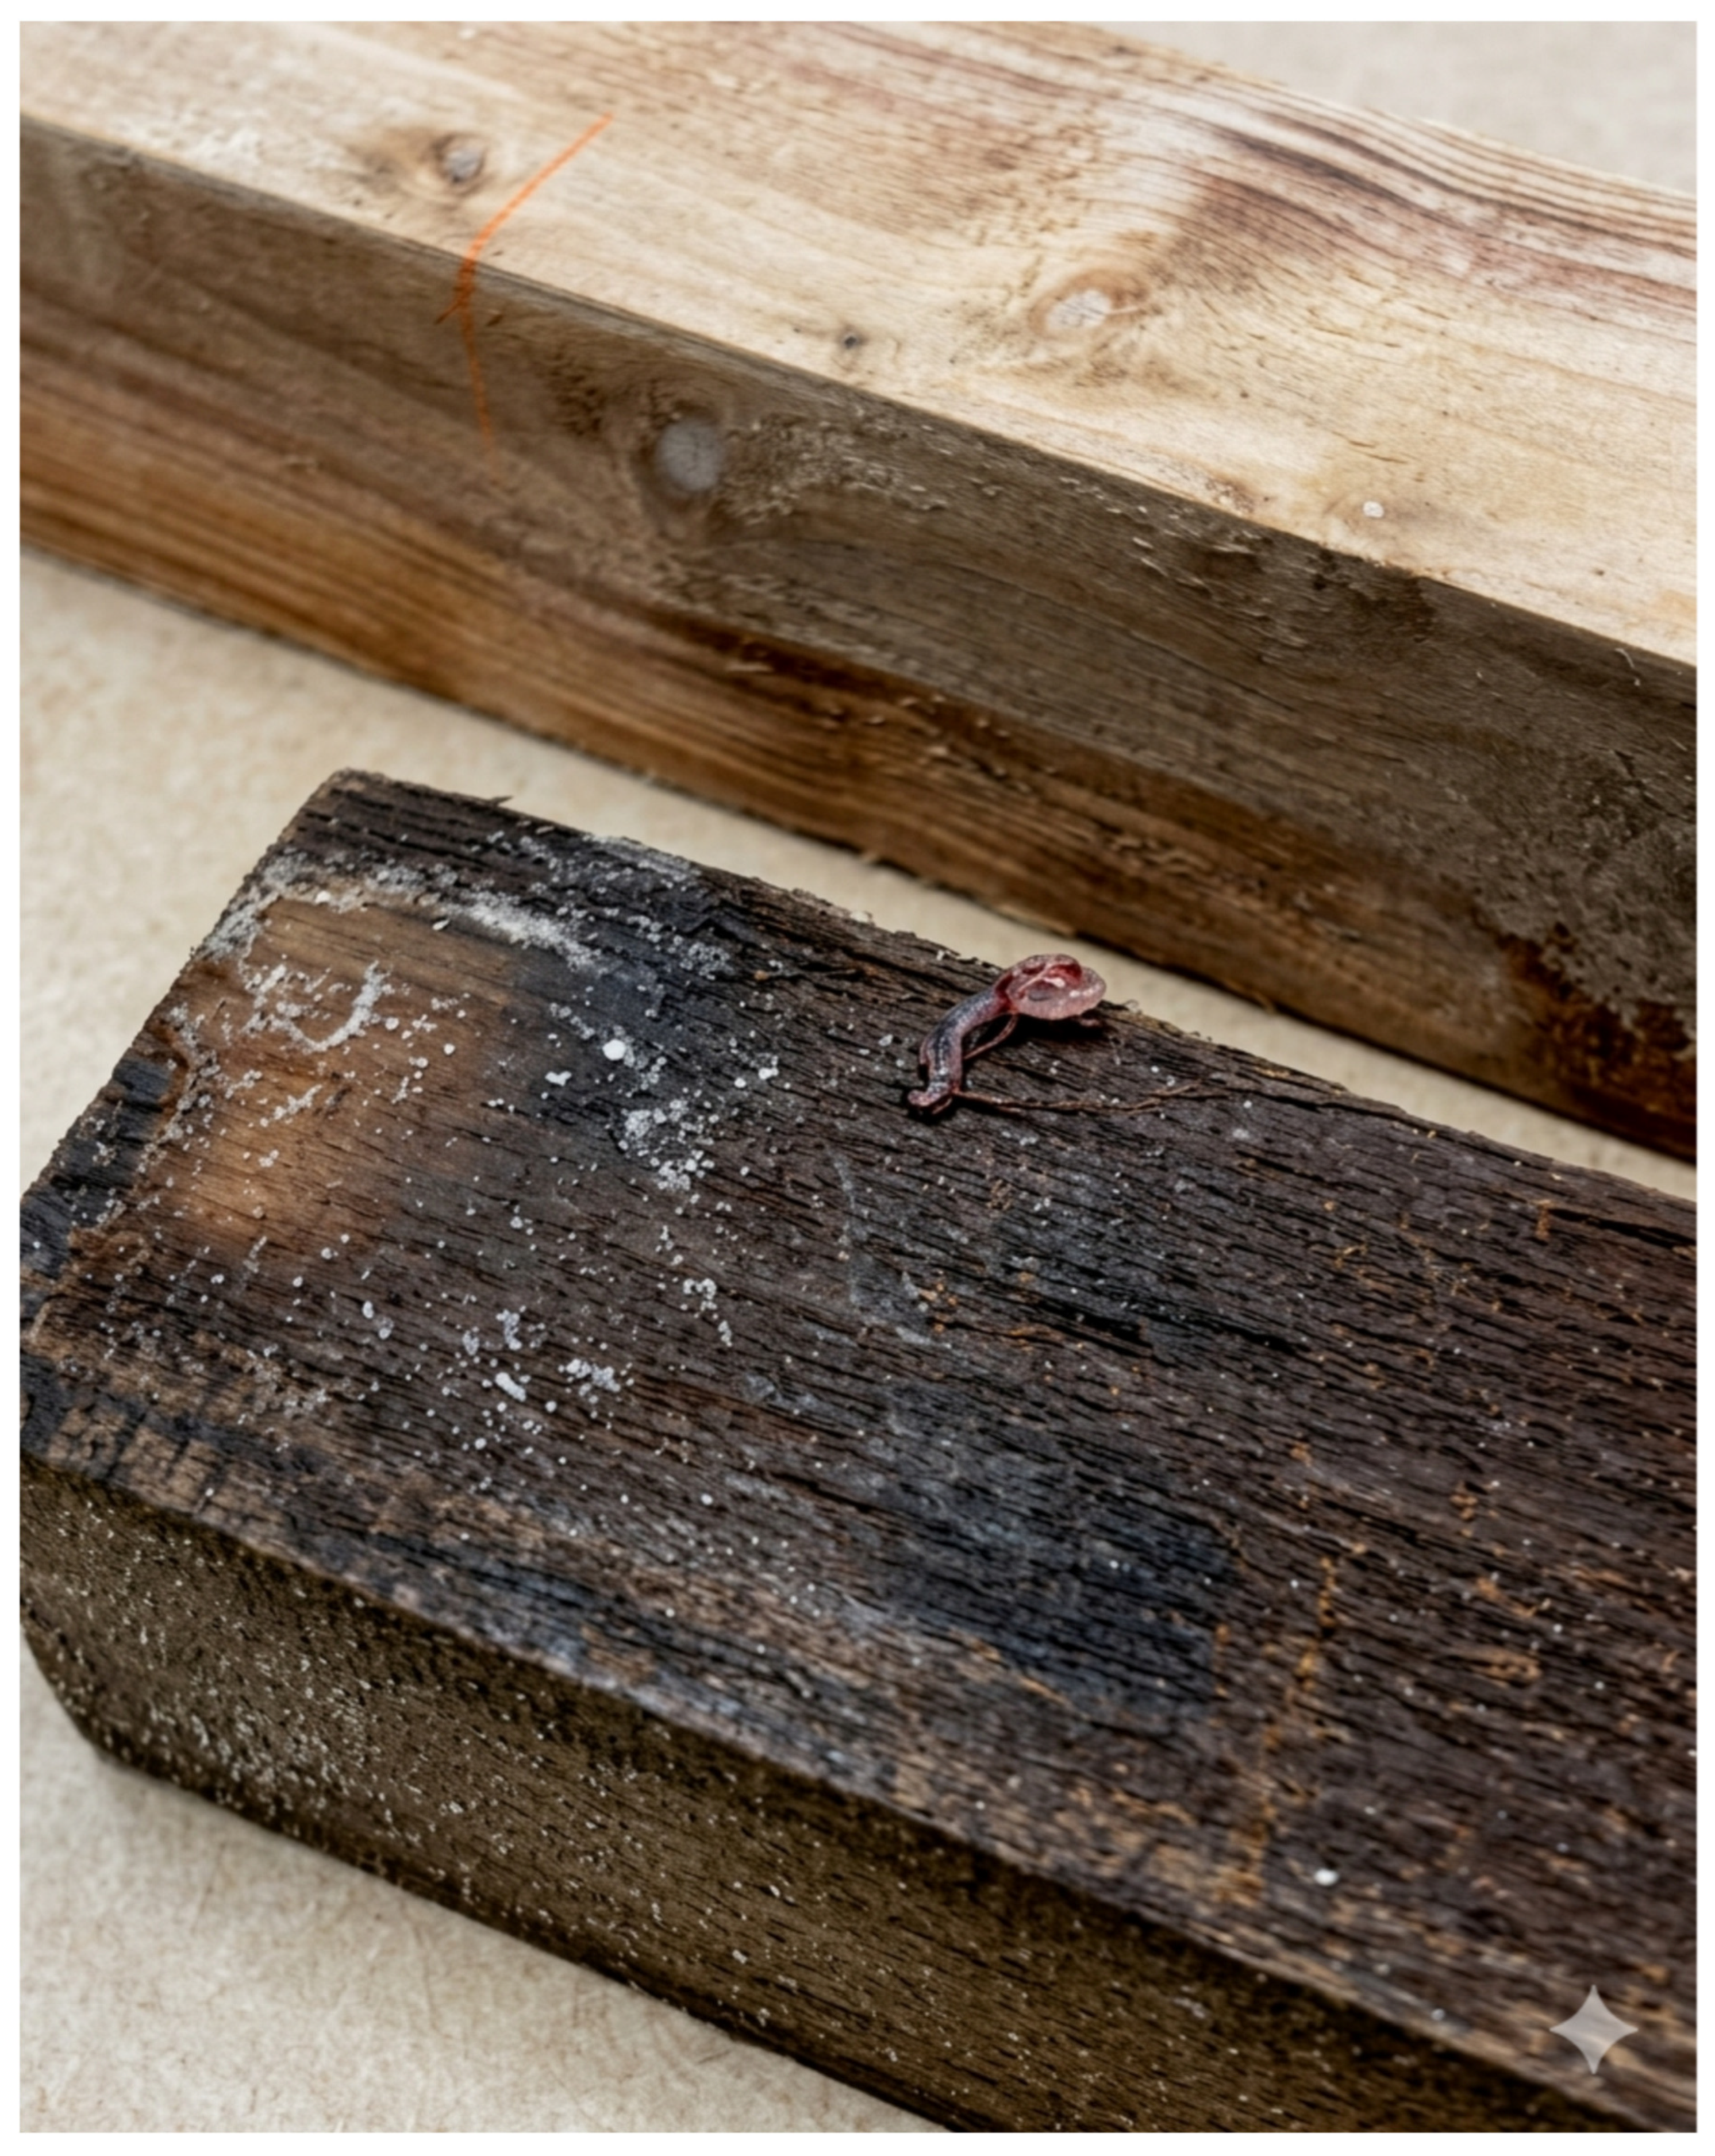
The advantages of the light construction of triremes, in addition to speed and maneuverability, included easy beaching. Beaching reduced hull fouling caused by marine growth such as barnacles and algae [11] (p. 205), and also provided opportunity for the repair, cleaning, and drying of hull timbers, and reduced biological degradation such as by shipworm (Teredo navalis) which can appear in timber after only one week of seawater exposure (Figure 1).
Following Theophrastus (5.7.2) regarding the selection of timber species for ship construction, Casson [12] (p. 226; p. 250) emphasized that warships, when not in active service, were routinely drawn up on beaches or covered slipways. Evidence from experimental archaeology, particularly trials conducted with the Olympias [13] (pp. 134–141), confirmed that a crew of approximately 140 men could successfully beach a vessel using wooden rollers. Morrison and Coates [14] further noted that the light hull construction and shallow draft of triremes were critical design features enabling beaching and regular hauling up into ship sheds.

1.3. First-Principles-Process Infrastructure

In Itzhack et al. [1], a quantitative framework based on engineering principles and the energy balance concept in physics was developed to estimate the minimum velocity required for an attacking ship’s ram to inflict structural damage on a targeted trireme. The model applied a first approach principle, integrating the constructional characteristics of the attacked ship and evaluating its capacity to withstand the impact of a designated ‘ram head’ length to derive the estimated velocity required to damage the attacked ship.
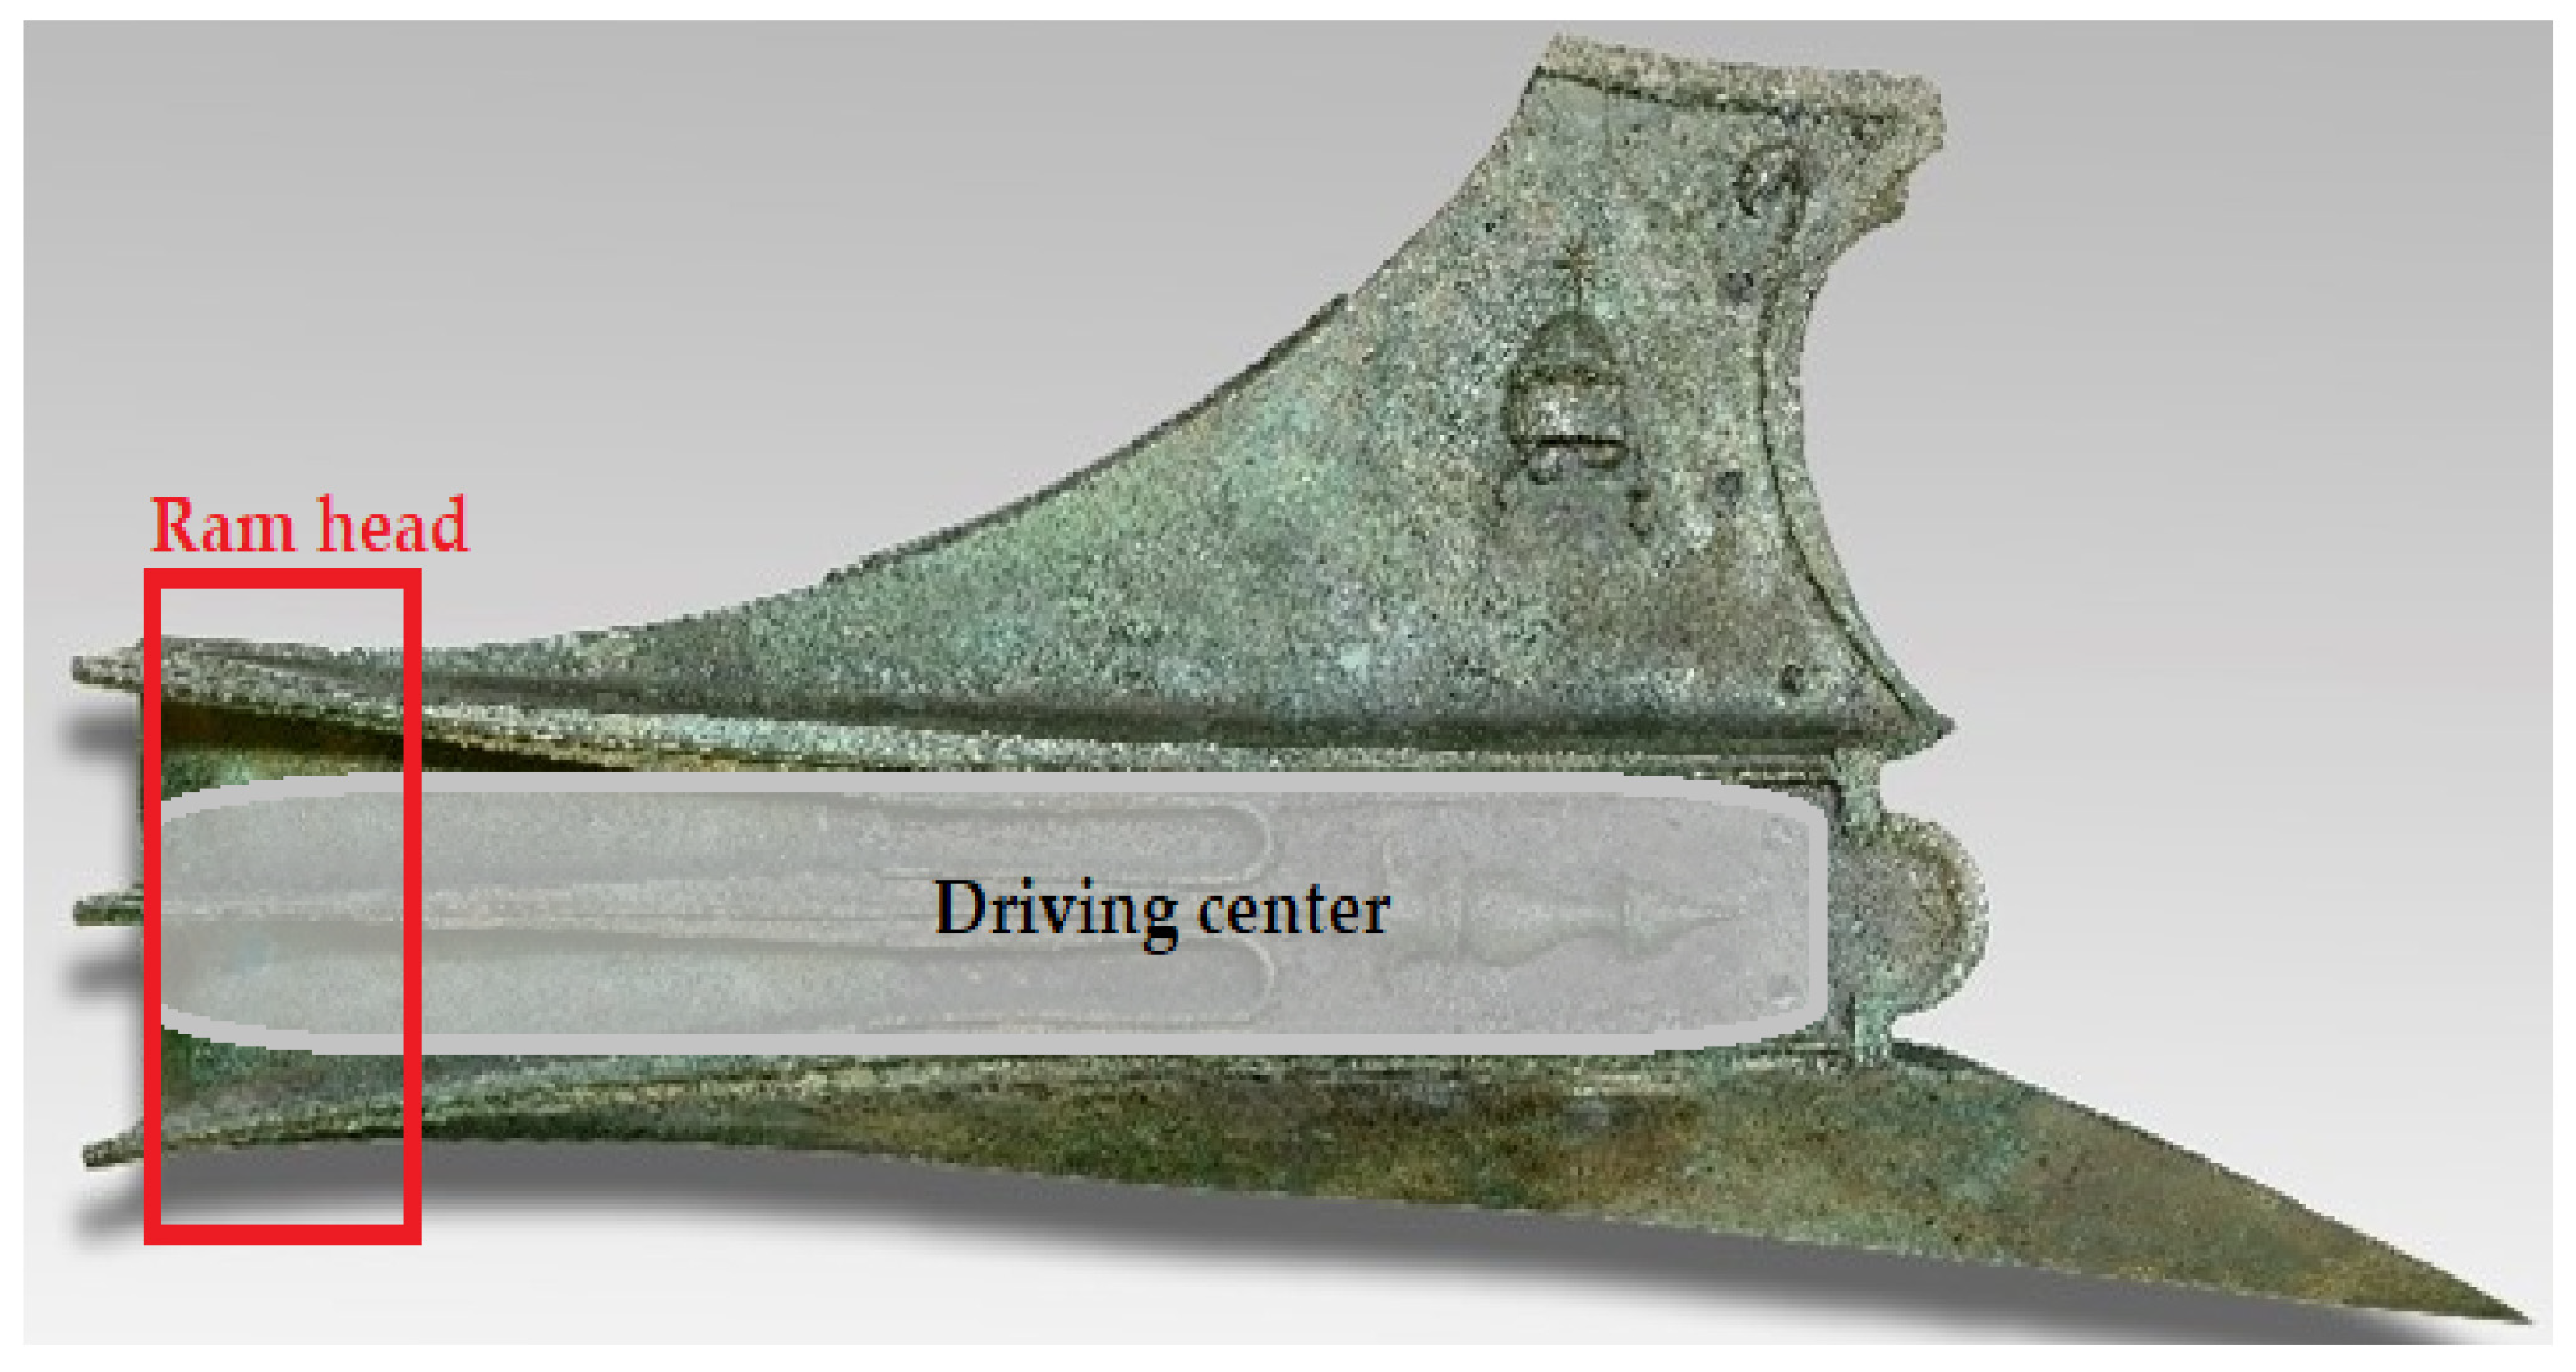
Itzhack et al. [1] (p. 8) defined the ‘ram head’ as the penetration depth to which an attacking warship drives its ram into the hull of an opposing ship before coming to a complete stop following the dissipation of its kinetic energy. Nominally measured from the foremost tip of the structure, the ram head constitutes a highly linear section comprising approximately 20% of the total driving-center length (Figure 2). The driving-center lengths of the Egadi rams (Rams 1–7) are 58.8, 66.3, 74.4, 83.4, 59.5, 85.9, and 69.0 cm, respectively [4] (Table 1), giving an average length of 71.0 cm. Accordingly, the mean ram-head length is estimated at approximately 14.2 cm. Owing to its disproportionately large size, the Athlit ram, with a driving-center length of 170.0 cm [6] (p. 12), was excluded from this statistical calculation.
The analytical formulation was based on the assumption that the ramming process is similar to the three-point bending test (see below). This expresses the relationship between impact velocity and flexural displacement of the hull plank as a linear equation υ(y) = α·y where y denotes the flexural displacement of a target ship’s hull plank under impact, and α is a coefficient incorporating parameters related to the ship’s geometry, mass, and material properties, as well as the extent of plank deformation resulting from the ram’s strike. υ is the velocity of attacking warship. In this formulation, the impact velocity is directly proportional to the degree of plank flexure.
Expanding on this relationship, the full equation of the model, is given in Equation (1):
v ( y ) = K · M o E · I r · m 2 · y ,
where
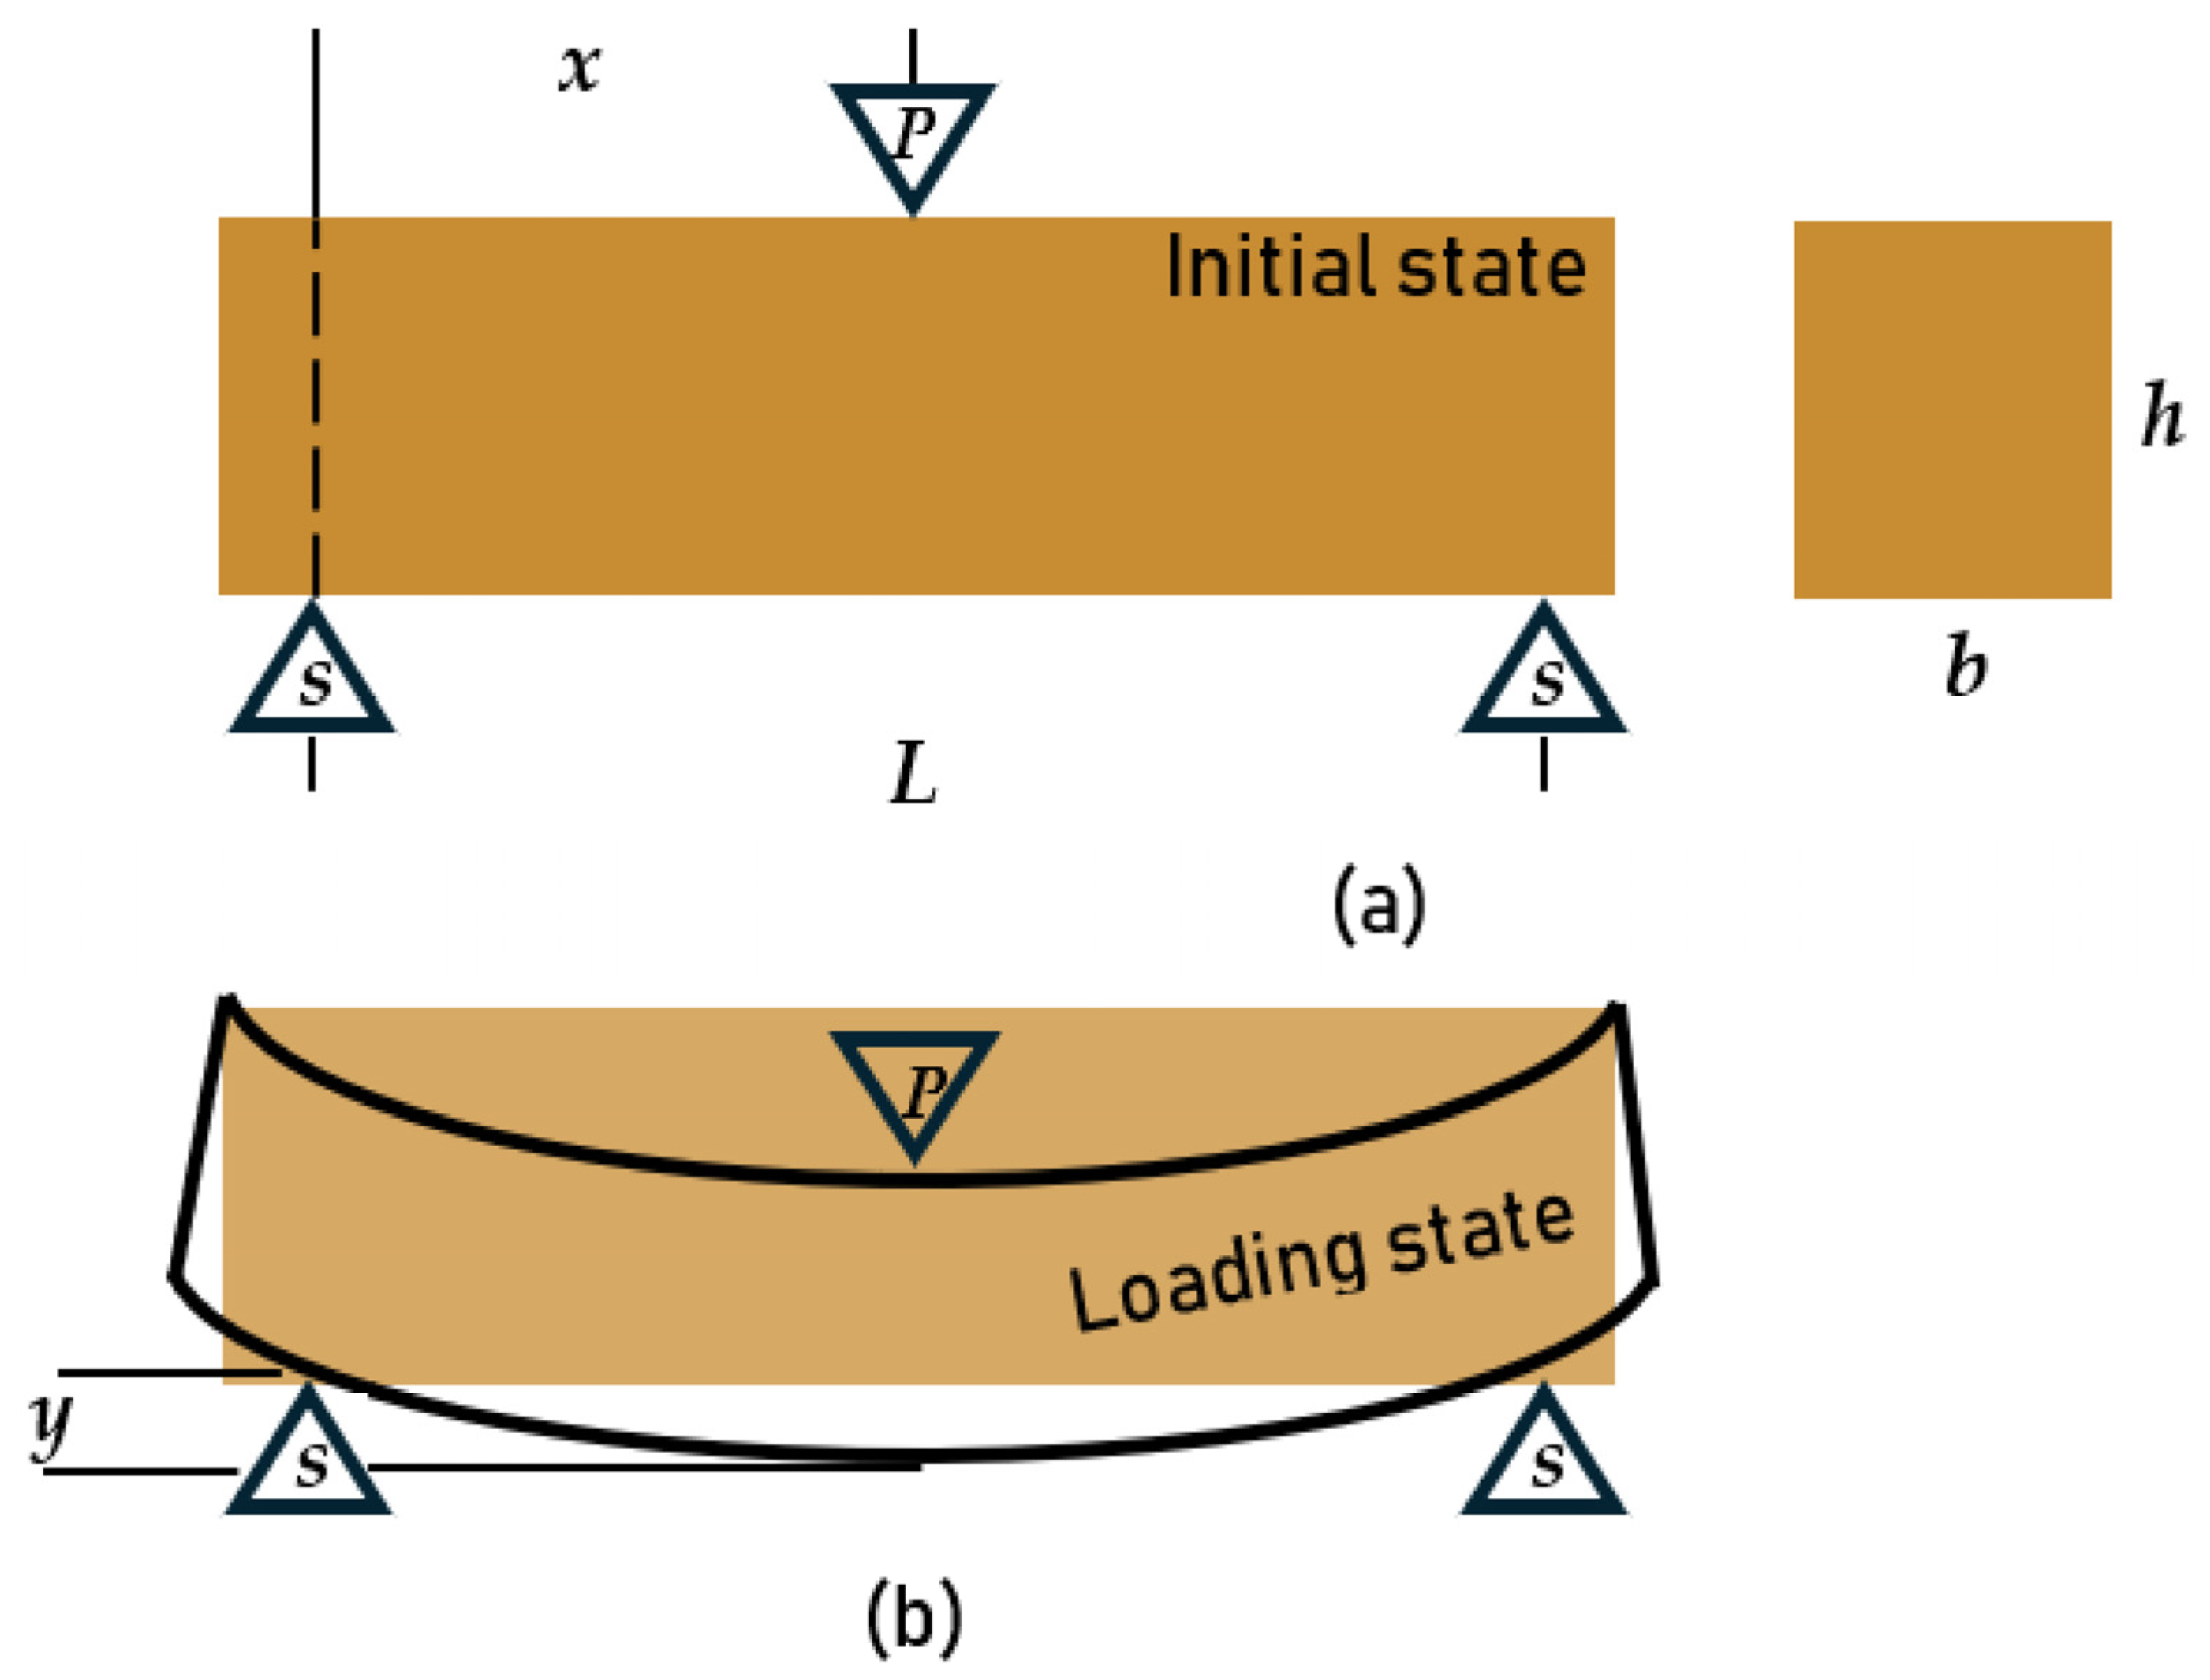
  • K = 0 y 1 P ( y ) · d y ( p 1 · y 1 2 ) (K > 1), where (y1, P1) is the point of maximum load (see Figure 3). Empirical coefficient of the areas below curve [dimensionless];
  • MoE—Modulus of Elasticity [N/m2];
  • I = 1 12 · b · h 3 , where b, h (see Figure 4a)—cross-section moment of inertia [m4];
  • r = 2 · L x 2 · x 3 3 · L + 2 · x 2 , where L, x (see Figure 4a)—loading geometry [m3];
  • m—attacking ship mass [kg];
  • y—deflection under load [m];
  • v ( y ) —velocity of attacking warship [m/s].
Equation (1) was derived from first principles and subsequently simplified to a linear form. The resulting expression provides a first-order approximation in which the relevant physical properties of the system are consolidated into a single square-root coefficient. Dimensional analysis confirms that the equation yields the correct units of velocity: meter per second—m/s.
A 14.2 cm (0.142 meter) displacement, corresponding to the ‘ram head’ dimensions, was adopted as the criterion for structural damage. This displacement is substantially greater than the bending capacity of a 75 cm-long plank, as demonstrated in the experimental procedure section, and therefore represents a reasonable threshold for identifying structural damage.
Substituting this displacement, along with parameters derived from archaeological and experimental data of ancient ship remains (plank dimensions, frame spacing, impact point between the frames, plank wood type [MoE], attacking ship mass), produced an estimated impact velocity range of 1.0–1.2 m/s. This range reflects the variability in material and geometrical properties inferred from excavated shipwrecks and reconstructed hull components. In this analysis several secondary factors were not considered:
(a)
The attacked ship was considered stationary throughout the impact.
(b)
Non-perpendicular attack on the side of a ship.
(c)
The effect of the ram fins was not taken into account.
(d)
The effect of the sealing materials was not considered, given the negligible thickness of the applied layer [15] (p. 662).
(e)
Neglecting energies such as noise (of breaking wood) and heat generated by the impact.

1.4. MoE—Material Property

The material property examined in this study is the Modulus of Elasticity (MoE), which characterizes a material’s ability to resist deformation under applied stress. In elastic materials, deformations induced by low stress are fully recoverable once the load is removed.
The MoE of wood can vary considerably, even within a single species, primarily due to variations in moisture content. Increased moisture typically causes a substantial reduction in stiffness and strength, with reductions of up to 20% reported under saturated conditions [16] (chapter 5). Guntekin and Aydin [17] further demonstrated this effect in Turkish pine (Pinus brutia), showing that the MoE decreases by approximately 50% as the moisture content rises from 0% to 28%.

1.5. Wood Species for Shipbuilding in Antiquity

The timber species used in ancient shipbuilding were selected for their combination of practical and mechanical properties that offered the workability required for shaping complex hull forms and provided adequate strength and elasticity to withstand both hydrostatic pressures and the mechanical stresses of navigation and warfare.
In Enquiry into Plants (5.7.1, 5.7.3), Theophrastus provided a detailed account of timbers used in ship construction, noting:
“[…] silver fir, fir, and Syrian cedar are, generally speaking, useful for shipbuilding; for triremes and long ships are made of silver fir because of its lightness, and merchant ships of fir because it does not decay […] The people of Syria and Phoenicia use Syrian cedar, since they cannot obtain much fir either; while the people of Cyprus use Aleppo pine […] For triremes some make such parts of Aleppo pine because of its lightness” [18].
The Ma‘agan Mikhael ship, dated to the end of the fifth century BCE, was constructed primarily of pine, with oak tenons employed in the joinery [19,20]. Similarly, the Kyrenia shipwreck, dated to the late third century BCE, similarly featured pine hull planking and framing, with oak tenons [21] (p. 87).
Although no wreck of a warship from Antiquity has yet been discovered, archaeological evidence aligns closely with these ancient accounts and confirms which timber species were the primary construction material for warships. The Athlit Ram contained cedar (Cedrus), elm (Ulmus), pine (Pinus), and oak (Quercus) components [6] (p. 17).
Together, these literary and archaeological sources demonstrate a consistent pattern of timber selection in ancient Mediterranean shipbuilding—combining lightweight, buoyant woods such as cedar, pine or fir for hull construction with dense, durable species like oak for structural reinforcement and joinery. As will be shown below, the type of wood comprising the hull, and particularly its MoE, played a major part in the vulnerability of the hull to the attacking ram.

2. Materials and Methods

Because wood is a standardized engineering material [16], comprehensive datasets for MoE exist for various species under specified conditions, typically classified as ‘dry’ or ‘green’. However, in the context of ancient warships, the hull planks impacted by the ram were positioned below the waterline for considerable periods and thus would have been saturated with seawater. Such extreme moisture conditions and their effect on the physical and mechanical properties of wood are rarely represented in existing technical literature, with the few available studies addressing this topic considering conditions with salinity levels well below those encountered in the Mediterranean seawater (e.g., [22,23]). Besides the other negative effects of prolonged seawater saturation (such as the above-listed hull fouling due to marine life, along with the overall reduction in a ship’s maneuverability), the MoE would also have been affected, directly impacting the general efficiency of the primary function of these military vessels in their ability to inflict or withstand blows. However, the degree to which the MoE of specific woods would have been impacted by seawater saturation remains a blind spot in our understanding of these ancient ships, necessitating experimental determination.
To address this gap, the present study determined the MoE of seawater-saturated planks of cedar, fir, and pine—species commonly identified in east Mediterranean shipwrecks. These empirically determined MoE values were subsequently incorporated into the trireme impact model to estimate the minimum velocity required for failure [1].

2.1. Wood Species

The scope of testing was limited to species historically used for hull planking—the structural component most directly affected by ramming impacts. According to Casson [12] (p. 212), cedar (Cedrus libani), fir (Abies alba), and pine (Pinus spp.) were the preferred woods for plank construction; therefore, these species were selected for examination in the present study. For each wood species, a beam measuring 5 × 20 cm in cross-section and 5 m in length was procured from a commercial timber supplier. Additionally, a small number of tree branches identified by the property owner as Cedar of Lebanon (Cedrus libani), were obtained during the removal of obstructing branches.
Given the historical importance of Cedar of Lebanon in the Eastern Mediterranean region and its extensive use in ancient shipbuilding, it was considered appropriate to include it the present study. Unlike the pine and fir specimens, which were obtained from a reputable certified supplier to ensure accurate species identification, the provenance of the cedar branches required independent verification. Accordingly, the wood was examined microscopically at the Laboratory of Archaeobotany and Ancient Environments at the Steinhardt Museum of Natural History, Tel Aviv University, to confirm wood type. Identification took place on the basis of the observed three-dimensional ligneous cell structure across three observational planes (transverse, tangential and radial) using a ZEISS SteREO Discovery.V20 (Carl Zeiss Microscopy GmbH, Jena, Germany) optical microscope at magnifications of up to 360×, as well as a Nikon Eclipse E100 (Nikon Corporation, Tokyo, Japan) light microscope at magnifications of up 100× used for examining thin-sections cut from the wood samples. Identification followed Richter et al. [24], and examined samples were compared to the wood and charcoal reference collection of the southern Levant of the laboratory, published wood anatomy atlases (e.g., [25,26,27,28,29], and the InsideWood online wood anatomy database [30,31,32,33]). Cedar of Lebanon is distinguished by the presence of traumatic resin canals along the ring boundary, scalloped pits in tori of earlywood tracheids, and rays often taller than 30 cells. Cedar of Lebanon has a wood basic density—defined as the ratio of oven-dried (at 40 °C) mass to green/fresh volume—of 0.45 g/cm3 [29] (p. 67), making it a low to medium basic density (e.g., [33]) similar to the other softwoods (pine and fir) considered in this research (e.g., [29,34,35]).

2.2. ‘Three–Point Bending Test’

Testing for the determination of the modulus of elasticity (MoE) is a well-established procedure. According to international standards such as ASTM D143 [36], DIN 52186 (1978) [37], ISO 13061-4:2014 [38], and BS 373:1957 [39]), the accepted laboratory method is the ‘Three-Point Bending Test’. In this procedure, the mid-span deflection (y in Figure 4b) of a simple supported beam (S in Figure 4a) is measured as the applied load (P in Figure 4a) is gradually increased within the region of proportionality between load and deflection.
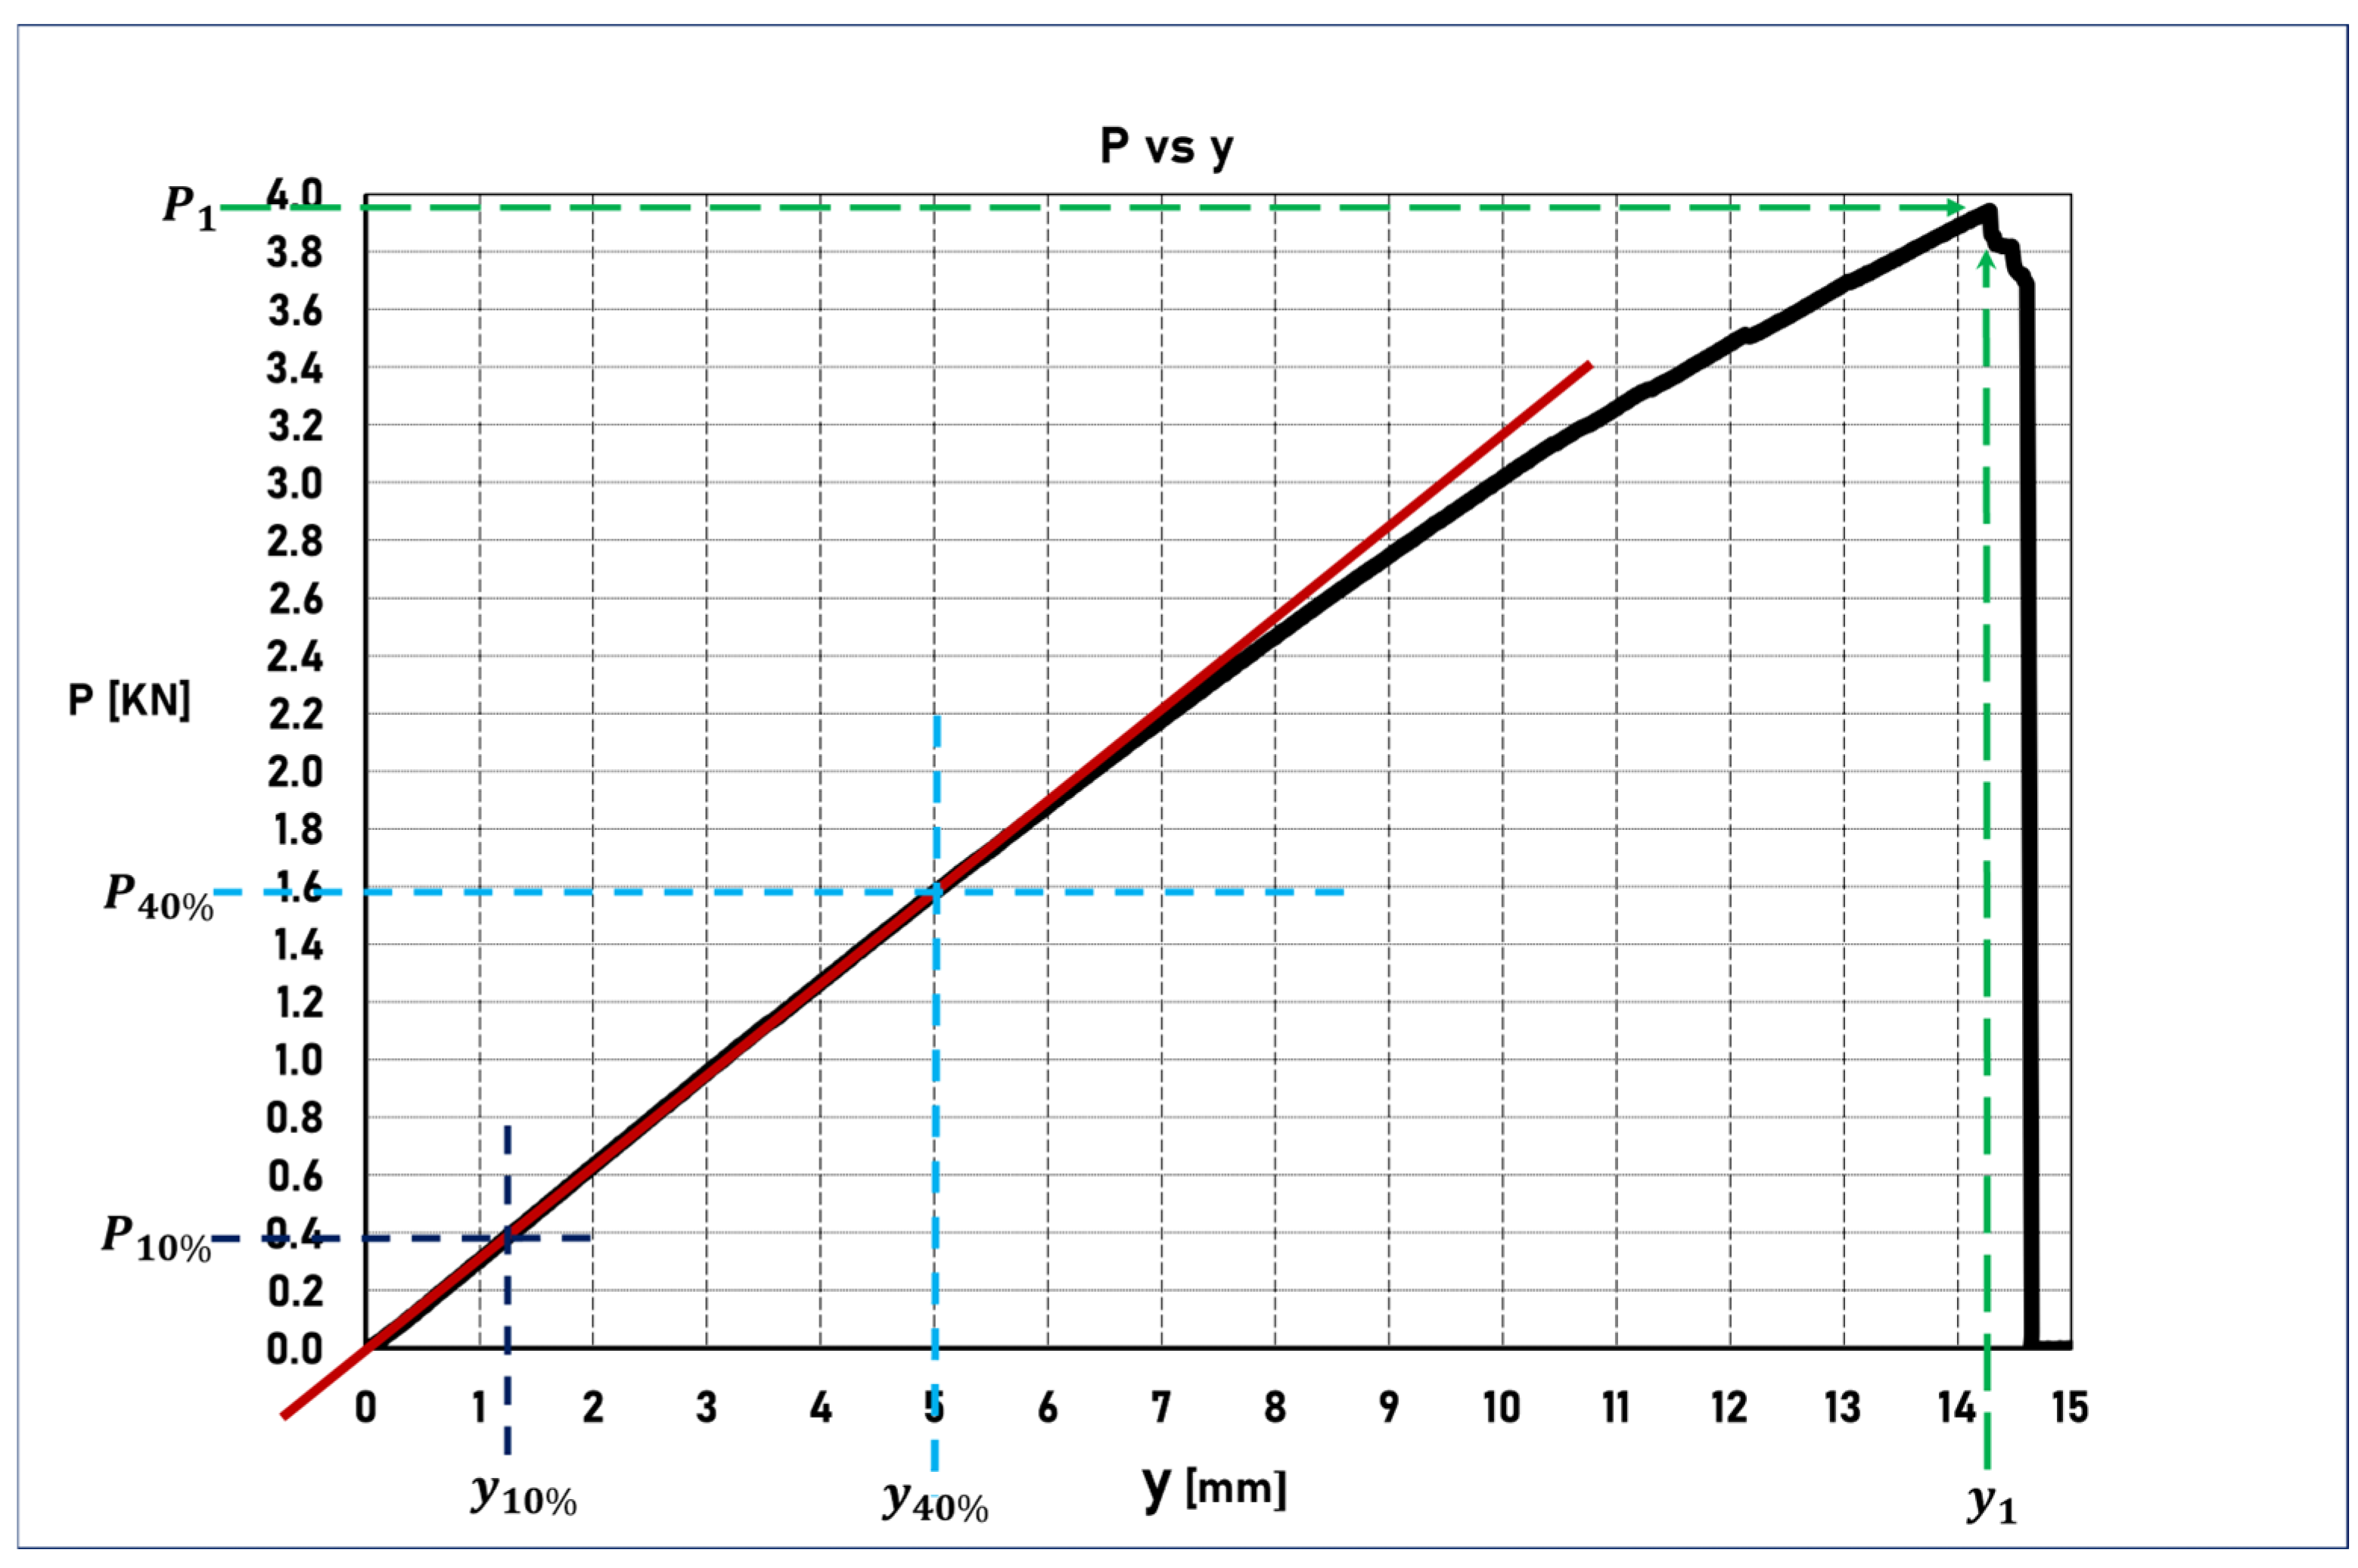
The test produces a curve showing the relationship between applied load and the resulting deflection at the specimen’s midpoint. Figure 3 presents a typical load–deflection curve for a wooden beam. The thick black line illustrates the measured outcome of a three-point bending test, while the red line highlights the region of proportionality between load and deflection.
Identifying the precise limits of the proportional region is not straightforward. A commonly applied method defines this region by selecting two points on the curve corresponding to 10% and 40% of the maximum (denoted P10% and P40%), and their respective deflections (y10% and y40%) [40] (p. 242). In Figure 3, the green dashed line corresponds to maximum load (y1, P1), the blue dashed line corresponds to (y40%, P40%), while the black dashed line corresponds to (y10%, P10%).
Loading the beam up to 40% of its maximum capacity does not cause structural damage; upon unloading, the beam returns to its original form, confirming that elastic behavior is maintained within this range.
The MoE is then calculated using the following equation, Equation (2) [40]:
MoE = L 3 ( P 40 % P 10 % ) 4 b h 3 ( y 40 % y 10 % )
where
  • L—span between supports [mm];
  • P40%, P10%—loads at 40% and 10% of maximum force [N];
  • b—width of the sample cross-section [mm];
  • h—height of the sample cross-section [mm];
  • y40%, y10%—deflections corresponding to P40% and P10% [mm];
  • MoE—[N/mm2].
The experimental data obtained from these tests were subsequently used to validate and refine the analytical model described earlier.

2.3. Natural Seawater Preconditioning

Although immersion in an aquarium containing distilled water with sea salt adjusted to the appropriate salinity could have been used to simulate eastern Mediterranean seawater (e.g., [23]), the wood samples (described below) were instead immersed for one week in natural eastern Mediterranean seawater. This approach was adopted to ensure that the experimental conditions closely reflected the actual marine environment, thereby maximizing the relevance and validity of the results.
The one-week immersion period was selected based on two considerations: first, it reflects a plausible operational scenario: prior to battle, warships such as triremes were typically beached and kept dry; once launched, they remained at sea and could sustain ramming impacts within a comparable timeframe; second, a one-week immersion period was considered sufficient to bring the wood samples to an approximately saturated, high-moisture state, thereby representing the moisture conditions experienced by hull planks located below the waterline during combat.

2.4. Experiment Procedure

For each wood species, cedar, pine, fir, and cedar of Lebanon, a series of three-point bending tests were conducted according to ASTM D143 standards [36], using the following protocol.
  • Sample preparation: Twelve specimens were prepared from each species, except for the cedar of Lebanon, for which only four specimens were available due to limited raw material. Each timber was cut along the radial grain direction, as closely as possible to the standard specimen dimensions: length L = 800   mm , height h = 50   mm , and width b = 50   mm , with minor adjustments dictated by available material.
  • Identification and labeling: Samples were labeled as follows: Pine (P1–P12), Fir (F1–F12), Cedar (C1–C12), and Cedar of Lebanon (CL1–CL4).
  • Initial measurements: Specimen dimensions ( L , b , h ) and weight were recorded prior to conditioning.
  • Drying process: To standardize the initial conditions, all specimens were conditioned for six months in a climate-controlled room maintained at 40 °C and 30% relative humidity (RH). This facility is one of several environmental rooms at the National Building Research Institute, each maintained under controlled temperature and relative humidity conditions. A climate-controlled room was used instead of a drying oven due to the large number of specimens, enabling all samples to be conditioned simultaneously under identical environmental conditions.
  • Post-drying measurements: Specimens were re-measured for dimensions ( L , b , h ) and weight after the conditioning period.
  • Experimental group (seawater exposure): Eight specimens from each species (numbers 1–8) were bundled and immersed in eastern Mediterranean seawater, with assistance from the Haifa School of Education and Marine Sports, to simulate floating conditions. For cedar of Lebanon, three samples (CL1–CL3) were used.
  • Control group (dry storage): The remaining four specimens (numbers 9–12) were retained in dry storage. For cedar of Lebanon, one specimen (CL4) was designated as the control. Table 1 displays the number of specimens per wood species and experimental condition.
  • Seawater exposure duration: All experimental specimens were retrieved after seven days of immersion.
  • Third measurement: All specimens were measured again for dimensions ( L , b , h ), weight, and internal moisture percentage. The internal moisture content was evaluated using a digital moisture meter. Although this instrument provides limited precision, particularly near the lower and upper limits of its operating range, it is suitable for establishing a qualitative baseline of the material’s moisture condition. Accordingly, these measurements were used primarily to distinguish between the dry and wet states of the specimens rather than to quantify small variations in moisture content with high precision. Water uptake was determined after the experiment from the difference in specimen mass before and after immersion.
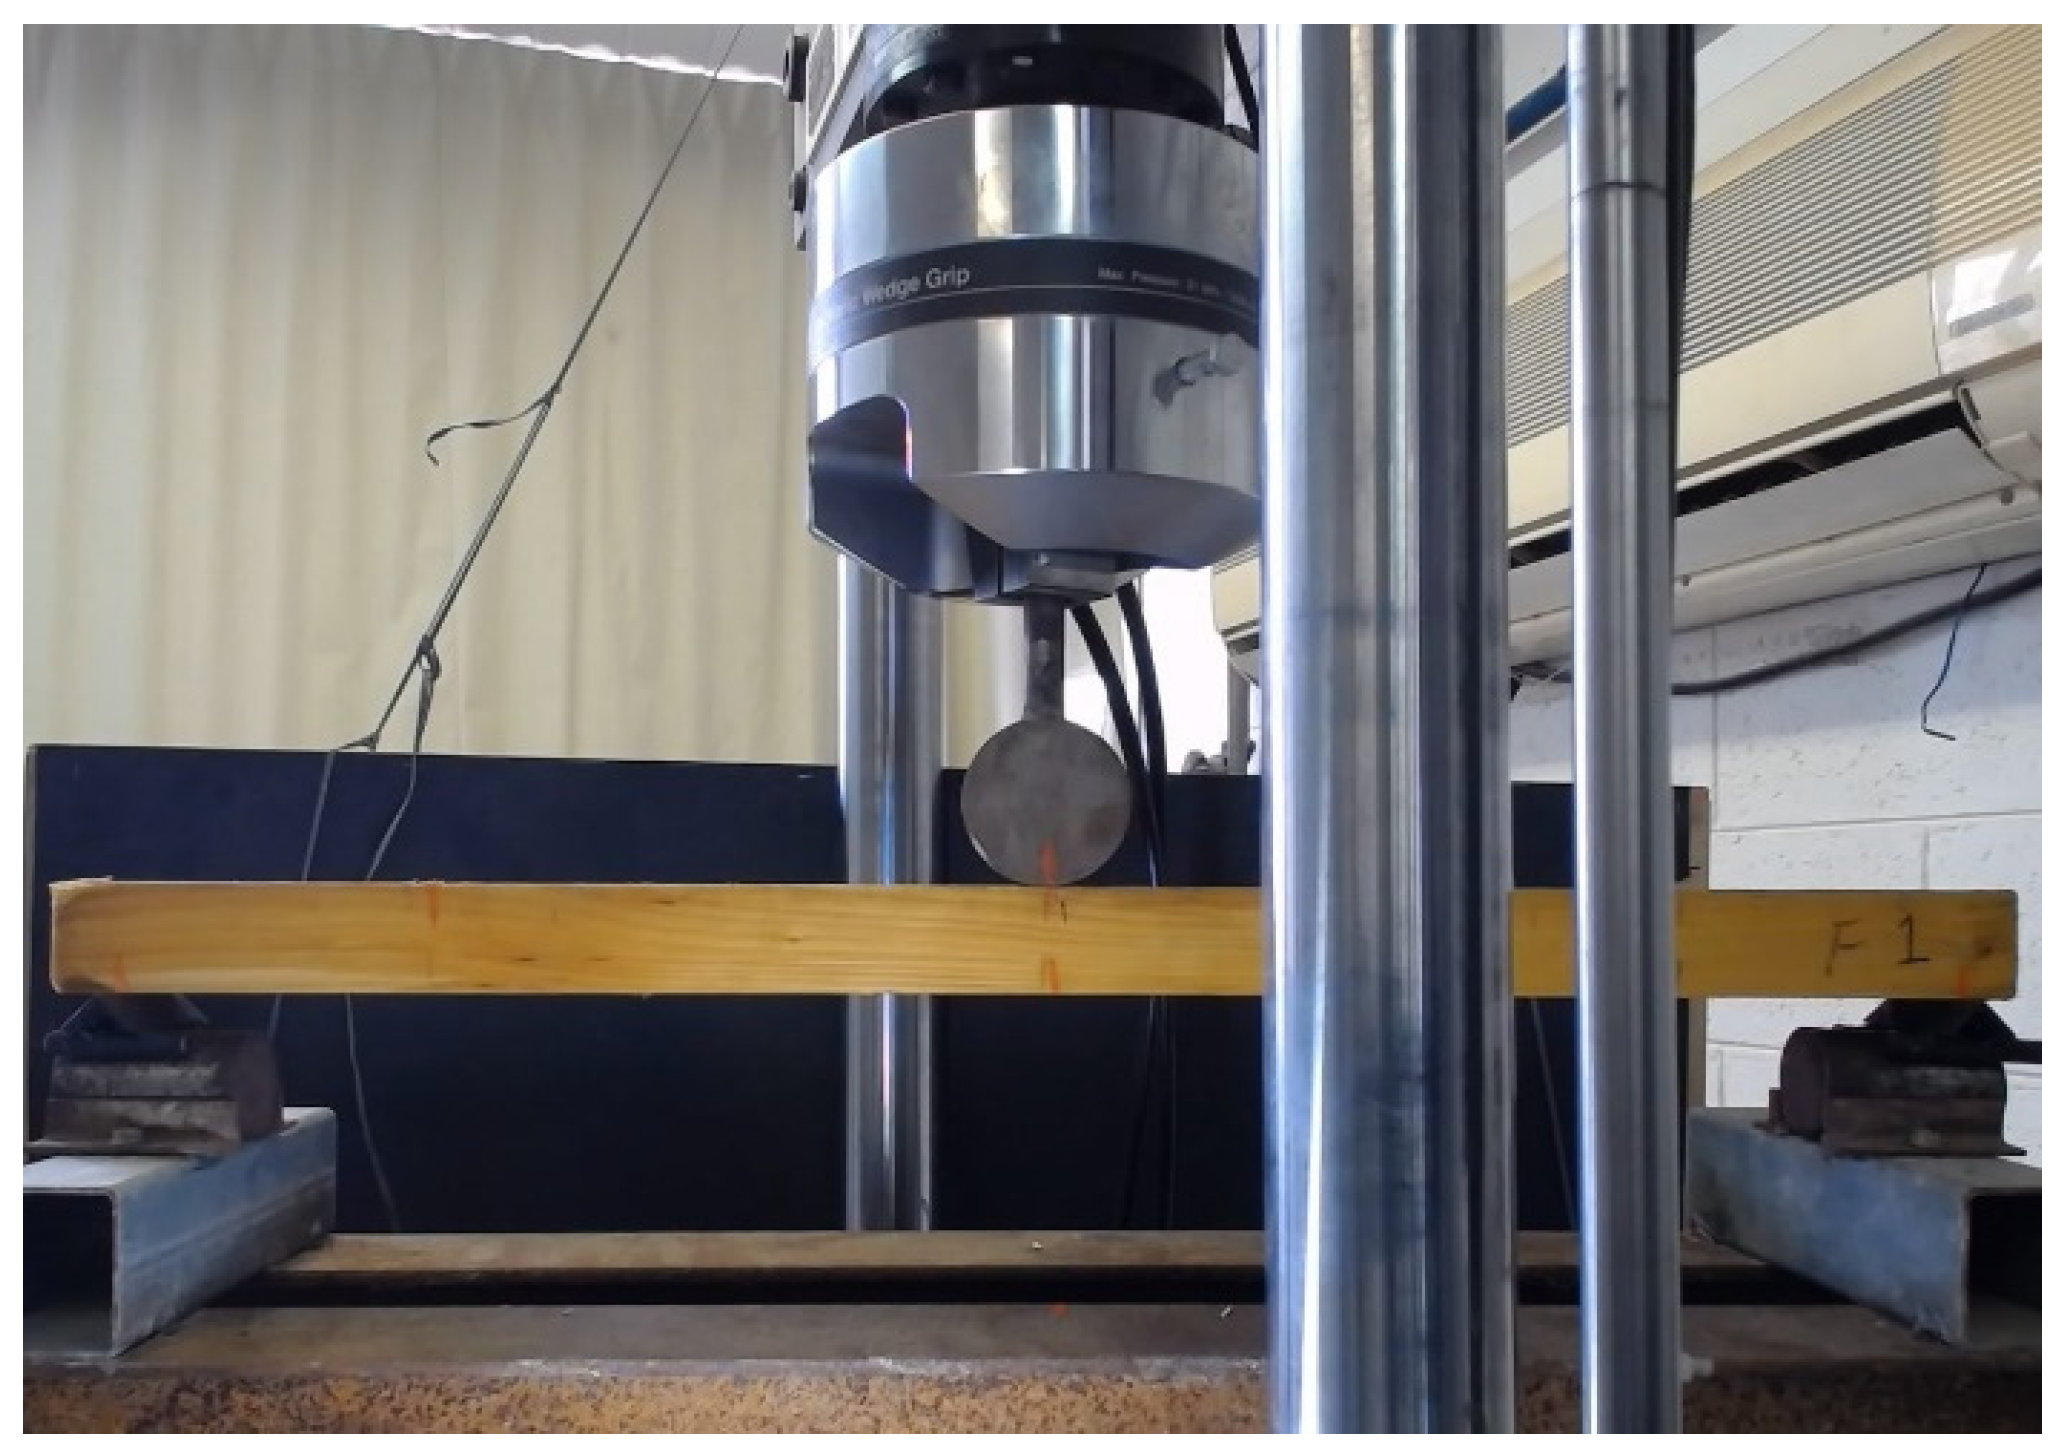
  • Mechanical testing: Specimens were transported to the National Building Research Institute laboratory for three-point bending tests (Figure 5), conducted on an MTS-810 universal testing machine (MTS Systems Corp., Eden Prairie, MN, USA) at a displacement rate of 2.5 mm/min. The support span was L = 750   mm .
  • Testing sequence: Wet specimens were tested first, following a species-multiplexed sequence (C1 → F1 → P1 → CL1 → C2 → F2 → P2 → CL2 → … → P12). This method ensured comparable moisture conditions for specimens sharing the same sequence number.
  • Data acquisition: During each test, load ( P ) and deflection ( y ) were recorded at five samples per second. Load–deflection curves (P–y) were plotted as shown in Figure 3.
  • MoE calculation: MoE for each specimen was determined using Equation (2).

3. Results

3.1. Dimensional and Weight Measurements

Each specimen was measured and weighed three times during the experimental procedure:
  • First measurement: immediately after preparation and before the drying stage.
  • Second measurement: after the drying period and before immersion in seawater.
  • Third measurement: after immersion (for wet samples) or storage (for dry controls) and immediately prior to mechanical testing.
During the third measurement, the moisture content of each specimen was measured in addition to its geometric dimensions and weight. The complete specimen-level dataset, including all dimensional and weight measurements, is provided in the Supplementary Materials. Tables S1–S4 are organized by wood species and present the dimensional, weight, and moisture measurements recorded at each stage of the experimental procedure for cedar, fir, pine, and cedar of Lebanon specimens, respectively.

3.2. Load–Deflection Data

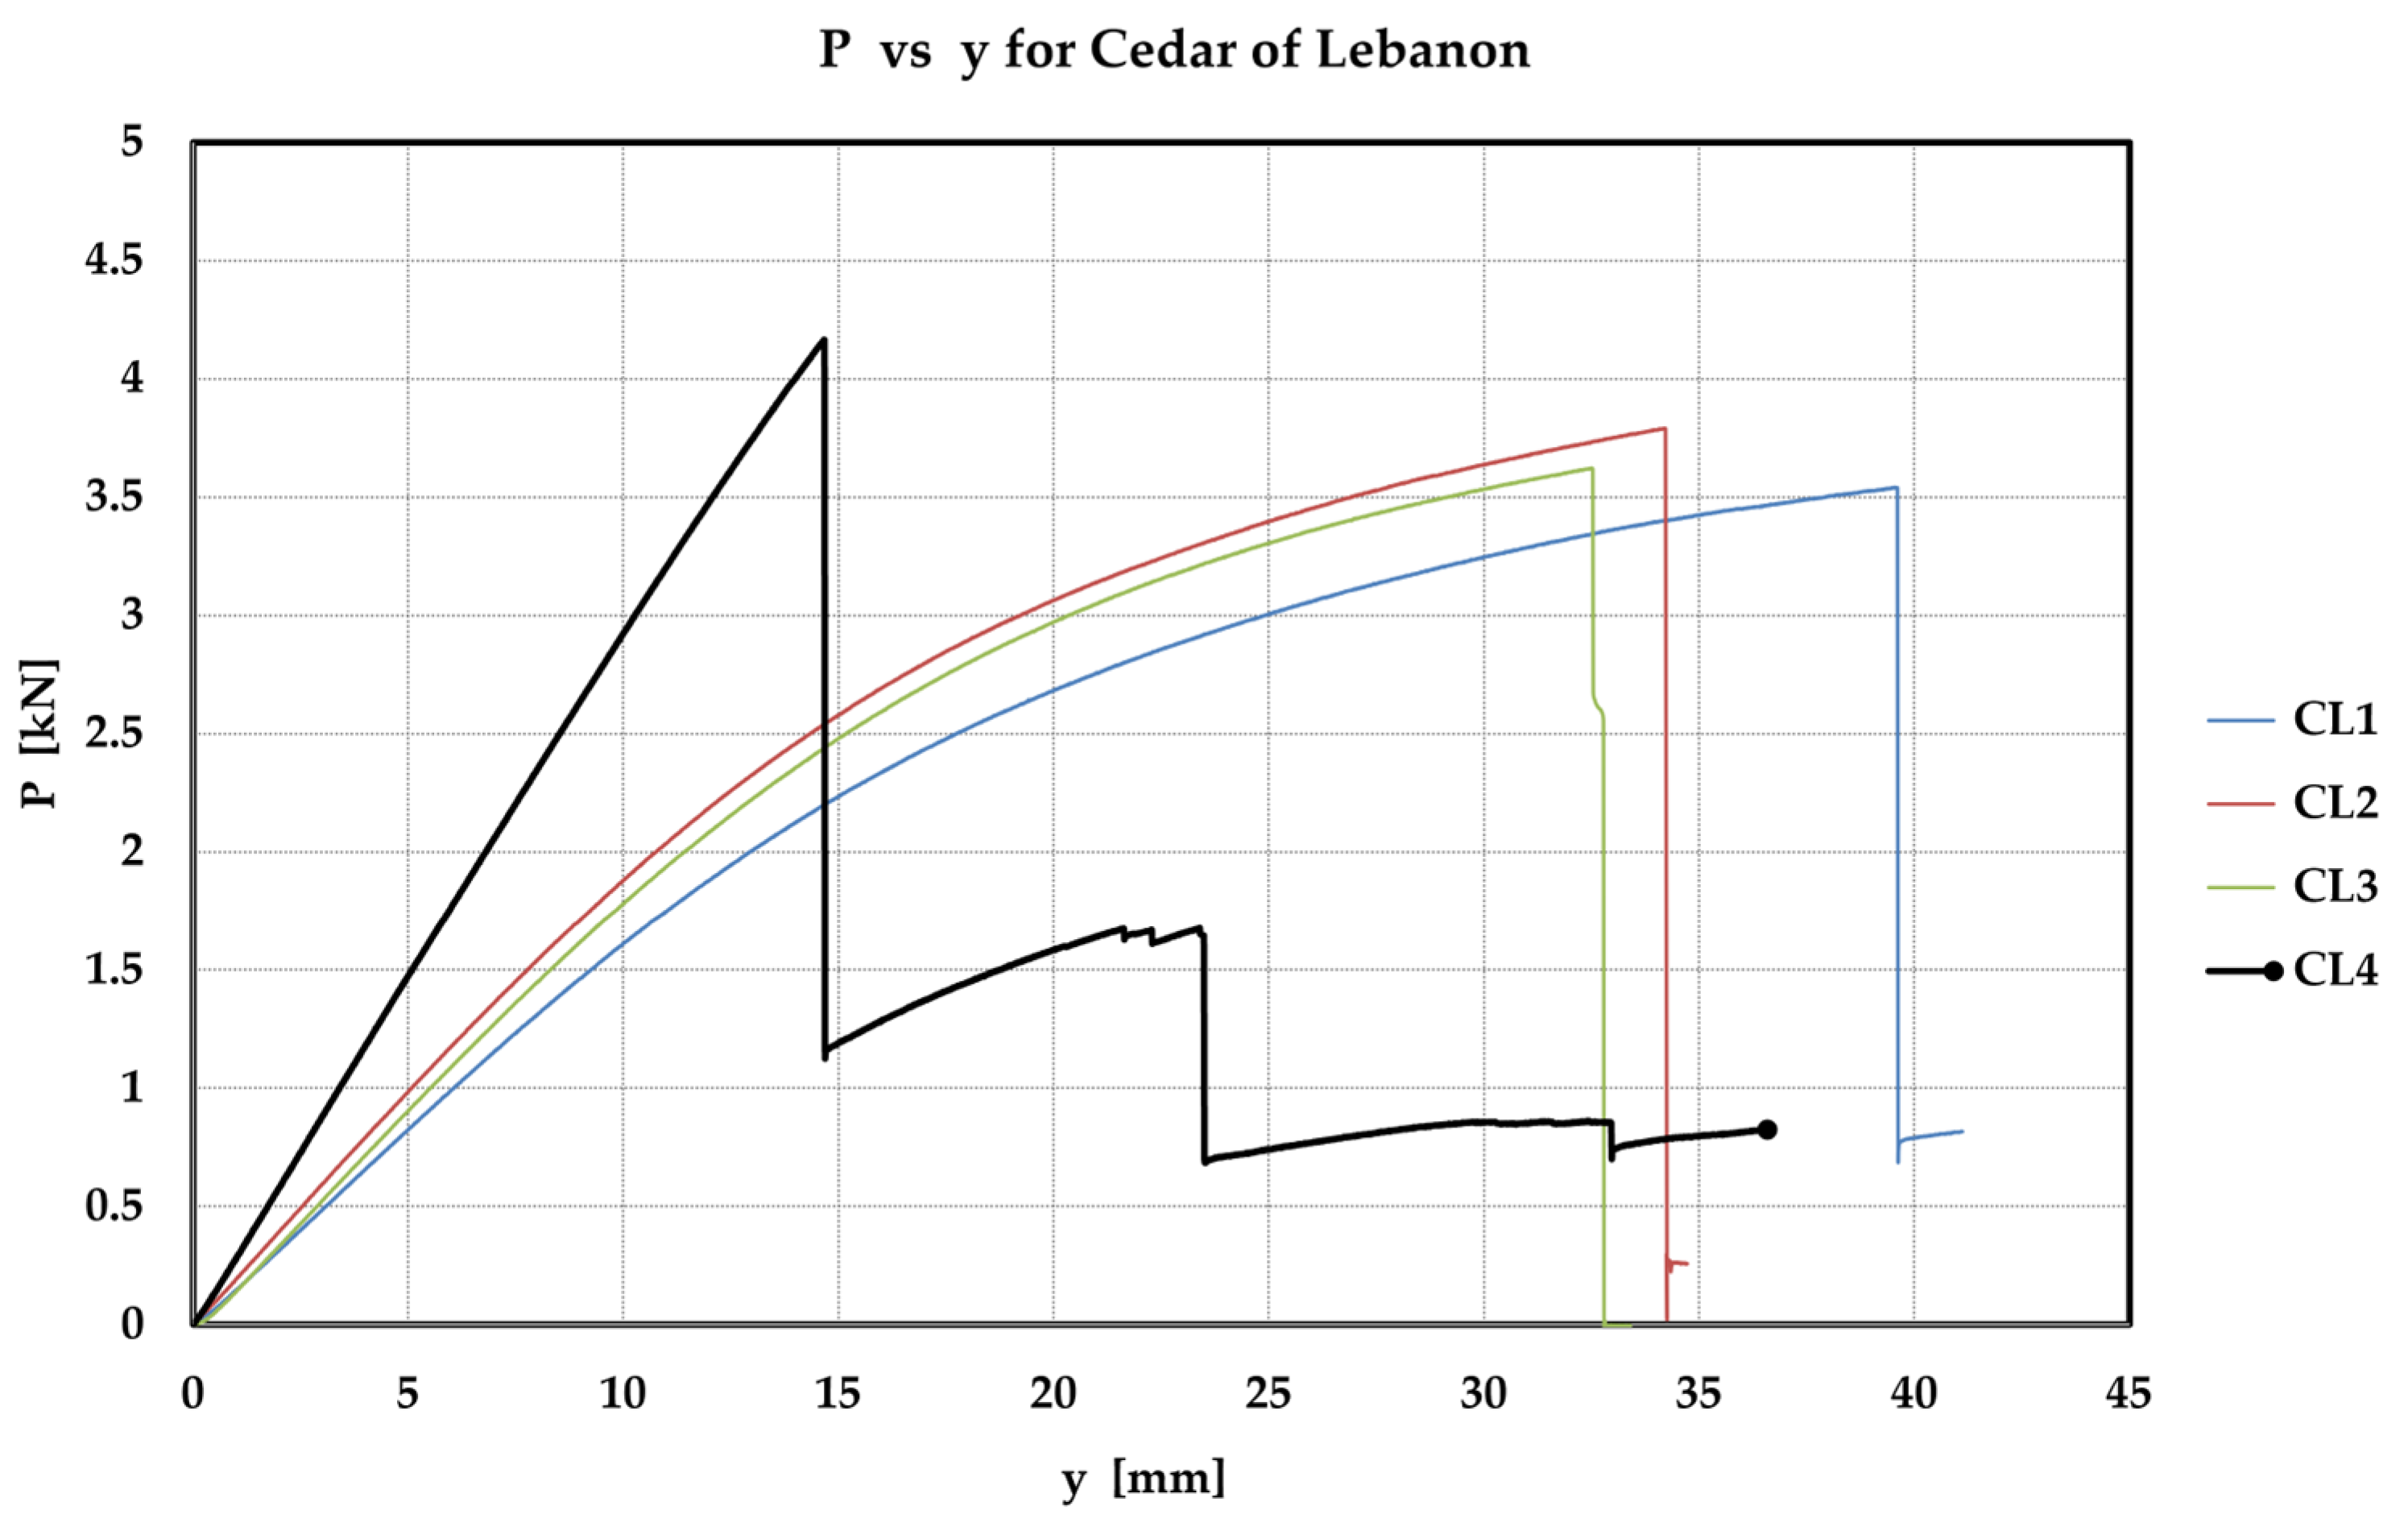
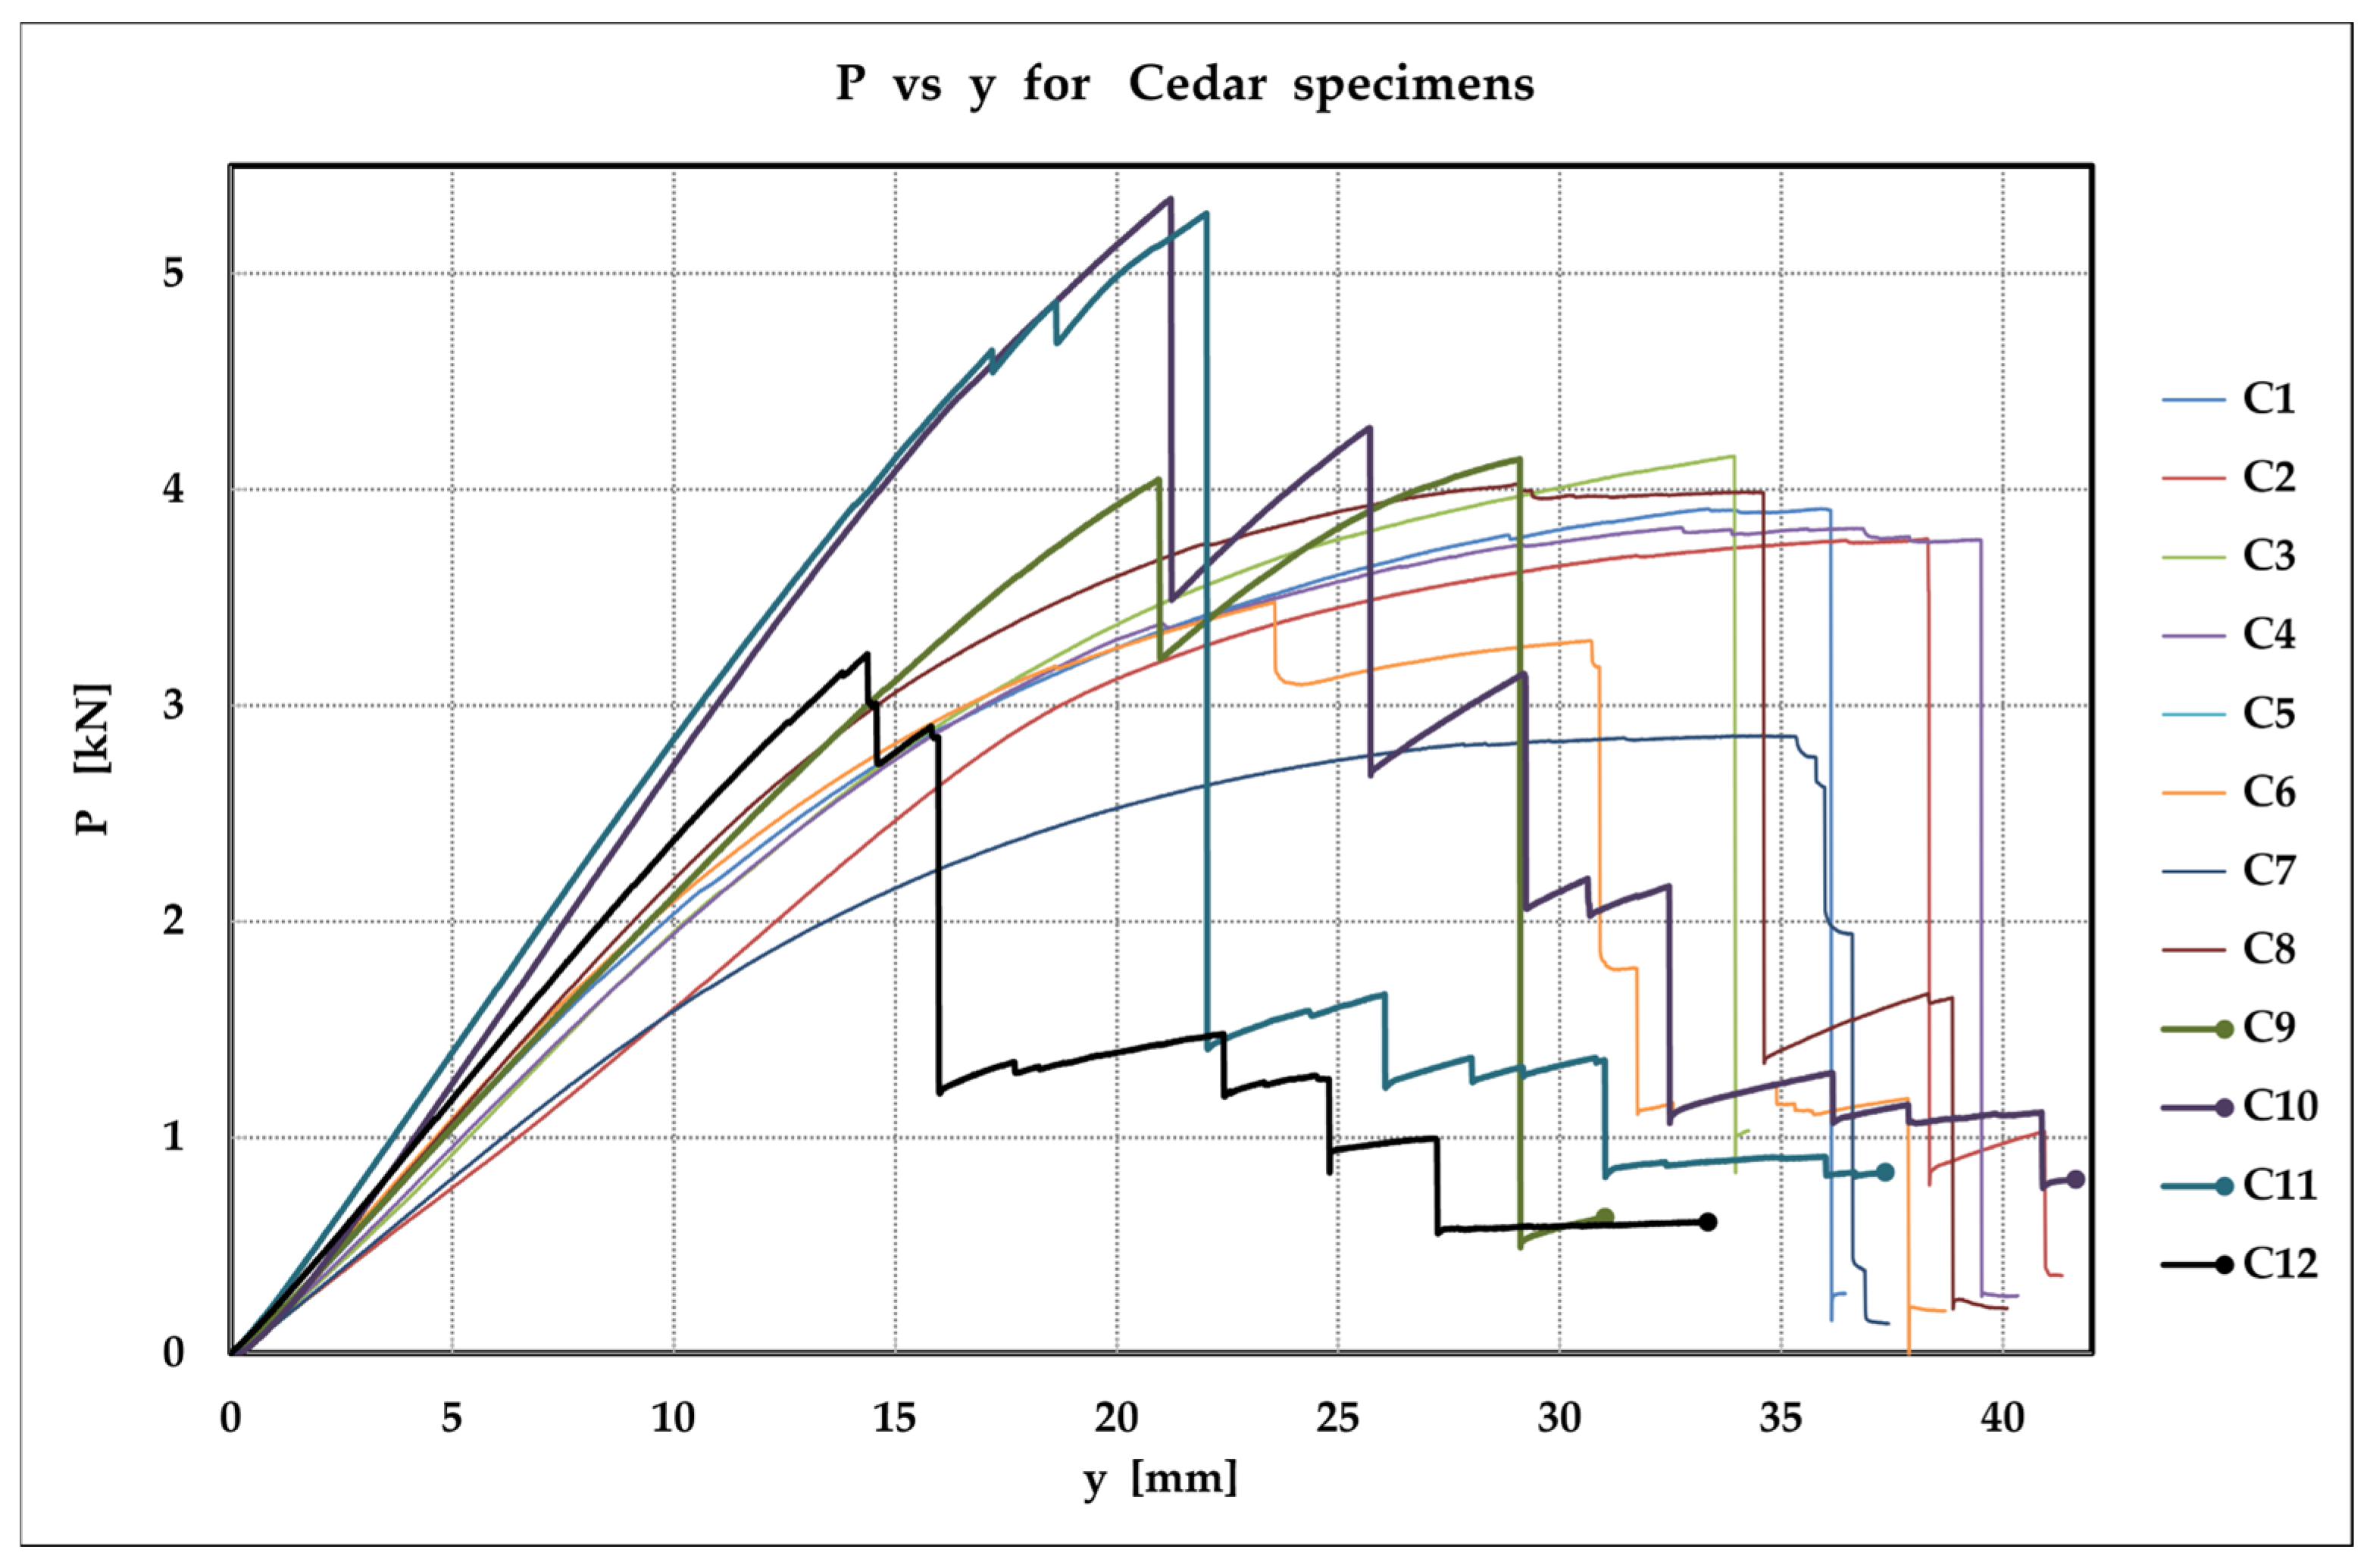
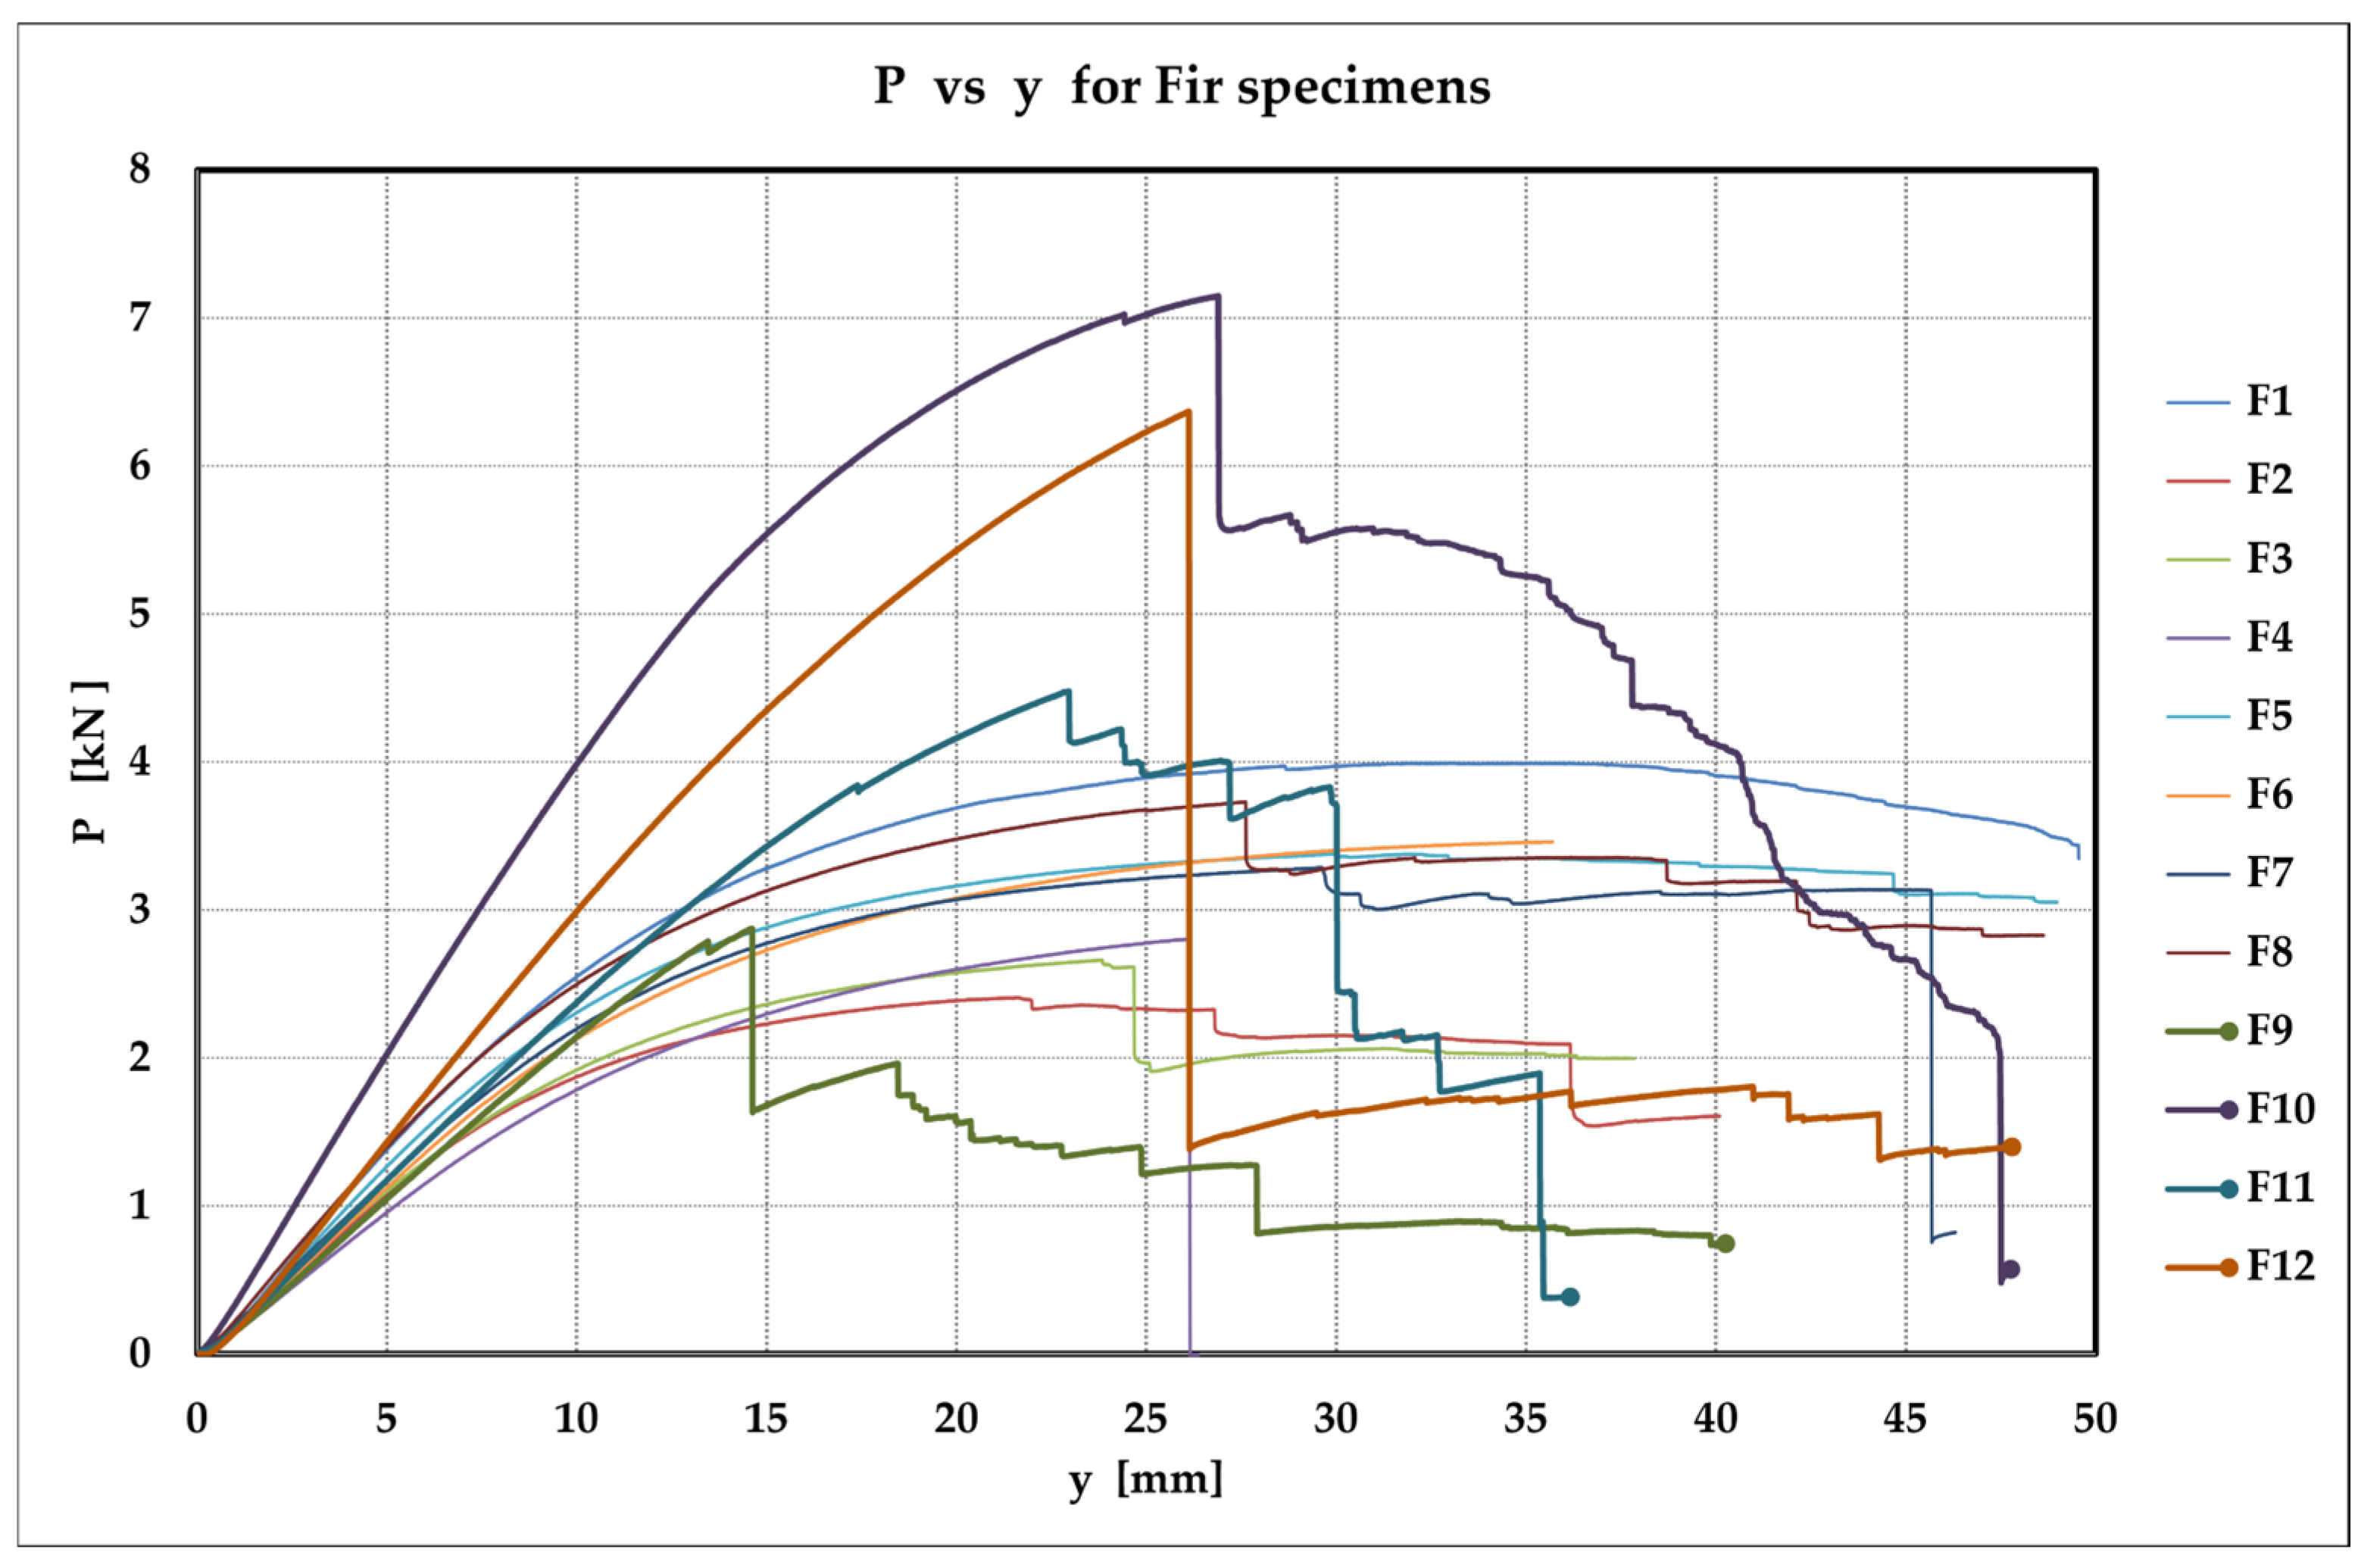
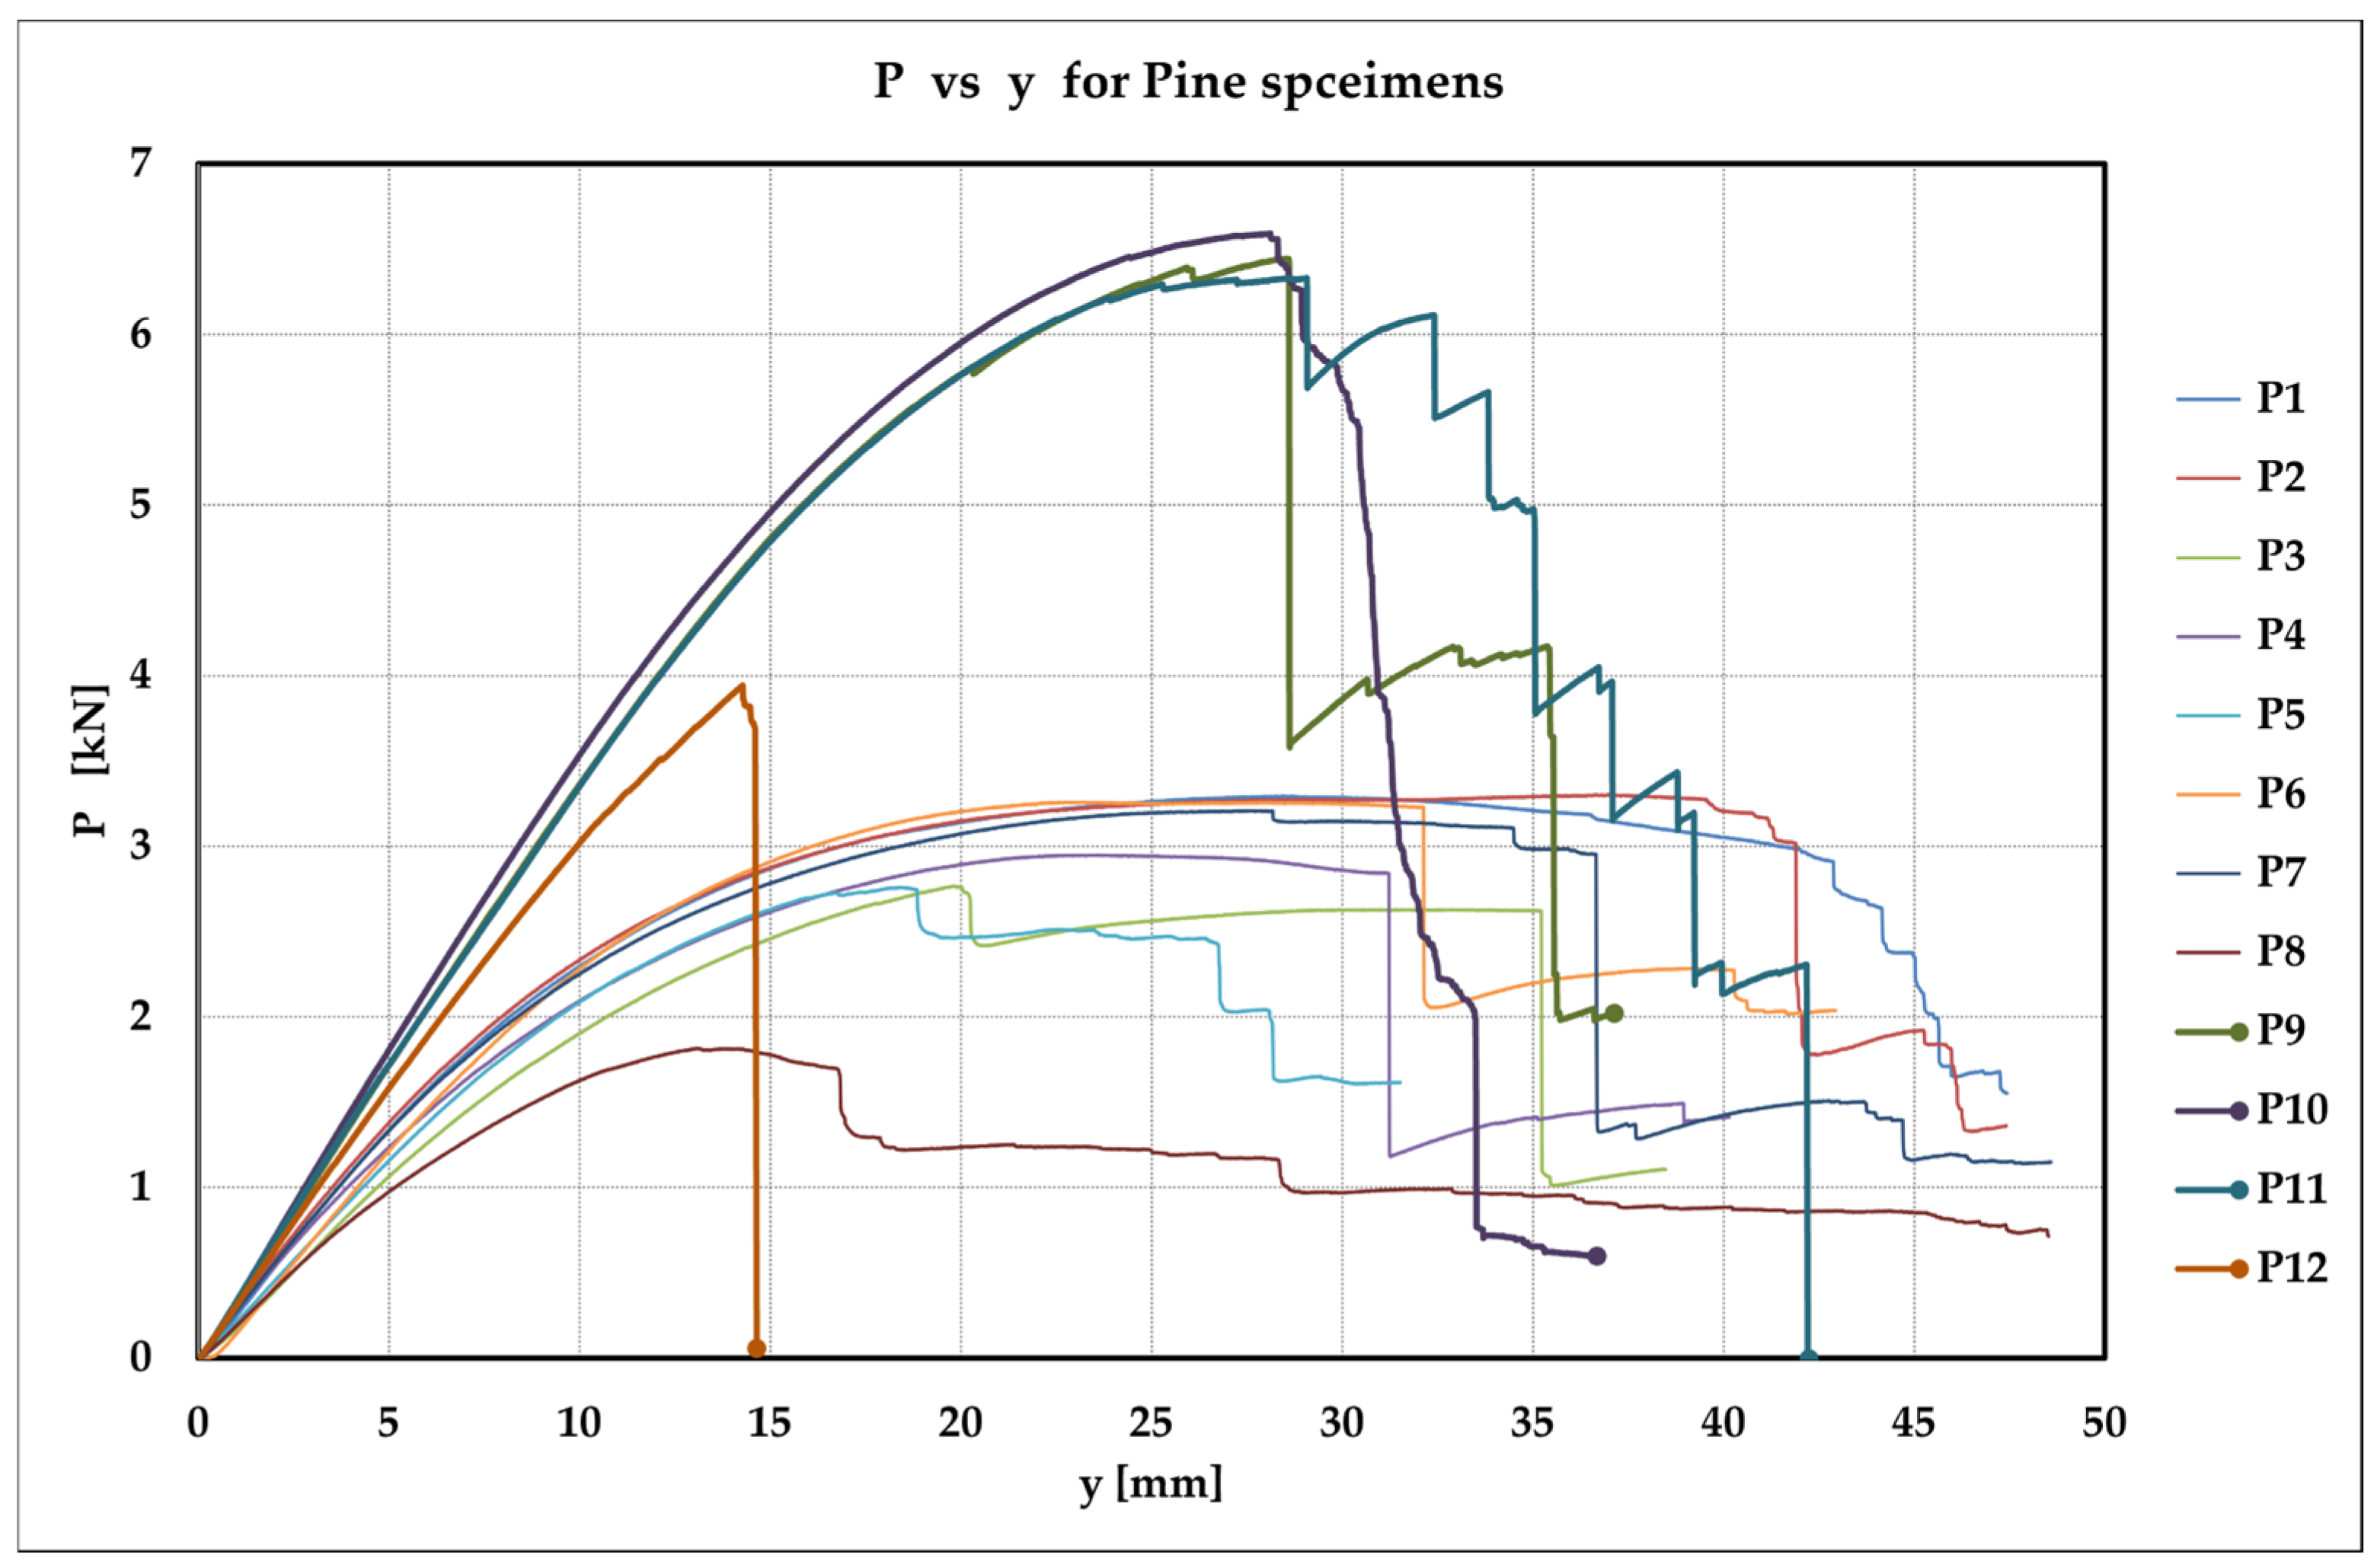
During mechanical testing, the MTS 810 universal testing machine (MTS Systems Corp., Eden Prairie, MN, USA) automatically generated an individual data file for each specimen. Each file comprised three data columns: (1) Time (s), (2) Deflection (mm), and (3) Applied Force (kN). Figure 6, Figure 7, Figure 8 and Figure 9 present the resulting load–deflection ( P vs. y ) curves for all wood species. For clarity, thin lines represent the results of wet specimens, and thicker lines, marked by a terminal dot, correspond to dry (control) specimens.

3.3. MoE Calculation

The MoE for each specimen was calculated using Equation (2), based on the geometric parameters of the beam (width b , height h ), the span length ( L = 750 mm ), and the recorded load–deflection data. For each specimen, the dimensions b and h were defined using the values obtained from the third measurement reported in Tables S1–S4 in Supplementary Materials. For each test, the parameters P40%, P10%, y40% and y10% were extracted from the load–deflection data using the following algorithm:
  • Identify the maximum load Pmax.
  • Compute P40% and P10% as 40% and 10% of Pmax, respectively.
  • Determine the corresponding deflection values y 40 % and y 10 %   from the dataset.
  • In cases where the exact values of P40% or P10% were not recorded, the nearest available data points were used.
The resulting parameters and MoE values for all specimens are summarized in the Supplementary Materials Tables S5–S8, categorized by species:
Linear regression analysis was performed using JMP Statistical Software (JMP student edition 19.1.3, SAS Institute Inc., Cary, NC, USA) to verify the linearity of the load–deflection relationship over the interval corresponding to 10–40% of the maximum load. Representative samples from each wood species (C1, F1, P1, and CL1) were analyzed between the points (y10%, P10%) and (y40%, P40%). The regression analysis demonstrated an excellent linear fit for all specimens: C1 (N = 540, R2 = 0.9994), P1 (N = 362, R2 = 0.9994), F1 (N = 487, R2 = 0.9993), and CL1 (N = 645, R2 = 0.9997). These results confirm the high linearity of the selected load–deflection interval, supporting its use for determining the modulus of elasticity (MoE).

4. Discussion

4.1. The Effect of Seawater on the Dimensions and Weight of Wood

The samples were placed in seawater after approximately six months of storage under controlled dry conditions. This prolonged drying period ensured that the initial moisture content was close to zero, as confirmed by moisture meter readings taken from the control samples that were not submerged in seawater. As can be seen in Tables S1–S4 (Supplementary Materials), values > 90% presents very high moisture content, and values < 10% presents very low moisture content.
Table 2 presents the average percentage changes in both volume and weight between the third and second measurement sessions. The weight changes [%] were calculated using Equation (3):
W e i g h t   c h a n g e   % = m w e t   m d r y   m d r y × 100 ,
where
  • m w e t —Weight in third measurement [gram];
  • m d r y —Weight in second measurement [gram];
  • W e i g h t   c h a n g e   % —Weight change [%].
Equation (3) is based on the conventional moisture content (MC) equation used in the oven-dry method. However, in the present study the procedure was applied in reverse: the specimens were first oven-dried under controlled conditions and then immersed in seawater to simulate the operational conditions of ancient ship planks. Consequently, the calculated weight changes primarily reflect water uptake rather than conventional moisture content.
Positive values indicate an increase in specimen weight, whereas negative values indicate a decrease. Changes smaller than 1% were considered negligible and are reported as no change (NC).
Guntekin and Aydin [17] investigated the effect of moisture content on the mechanical properties of Turkish red pine (Pinus brutia Ten.) by comparing four moisture conditions: oven-dried, standard, humid, and fiber saturation point (Table 1). The oven-dried condition corresponds to a moisture content (MC) of 0%, whereas the fiber saturation point corresponds to 28.0% MC. The moisture conditions examined in the present study are therefore consistent with the range investigated by Guntekin and Aydin.
To quantify the relationship between digital moisture meter (DMM) readings and water uptake, a simple linear regression analysis was performed using JMP statistical software. A strong positive correlation was observed (R2 = 0.947), indicating that approximately 95% of the variability in DMM readings was explained by water uptake. The regression slope was highly significant (p < 0.0001), confirming that DMM readings increased consistently with increasing water uptake. Although the lack-of-fit test was significant, indicating minor deviations from linearity, the high coefficient of determination demonstrates that the DMM provides a reliable estimate of water uptake over the investigated range.
For the dry specimens, exposure to seawater caused a measurable increase in both volume and weight across all species, indicating swelling due to moisture absorption. The slight reduction in longitudinal dimension observed in the wet state (1–2 mm over a length of approximately 800 mm) in a small number of samples (out of 27) falls within the expected range of experimental and measurement uncertainty.
Fir and pine exhibited similar expansion levels, while cedar showed the lowest volumetric change, suggesting greater dimensional stability. The apparent higher swelling of cedar of Lebanon may reflect its natural anatomical variability; however, the result should be interpreted with caution because of the limited number of specimens tested.

4.2. Effect of Seawater on the MoE

Although the primary objective of this study was to determine MoE values that are more representative for use in the developed analytical model, visual examination of the load–deflection curves (see Figure 6, Figure 7, Figure 8 and Figure 9) shows that dry samples consistently exhibit steeper slopes, corresponding to higher MoE values. Table 3 summarizes the descriptive statistics for the modulus of elasticity (MoE) of all investigated wood species under dry and wet conditions.
One-way analysis of variance (ANOVA) was performed using JMP statistical software to evaluate the effect of moisture condition (dry versus seawater-immersed) on the modulus of elasticity (MoE) of each wood species. For cedar, moisture condition had a significant effect on MoE (F(1,10) = 22.25, p = 0.0008), with dry specimens exhibiting significantly higher MoE values than seawater-immersed specimens. The fitted model explained 69.0% of the observed variability in MoE (R2 = 0.690; adjusted R2 = 0.659).
For pine, the effect of moisture condition was highly significant (F(1,10) = 96.78, p < 0.0001). Dry specimens exhibited significantly higher MoE values than seawater-immersed specimens, with an estimated mean difference of 3915 N/mm2 (95% CI: 3028.3–4801.7 N/mm2). The model explained 90.6% of the observed variability (R2 = 0.906; adjusted R2 = 0.897), and yielded a root mean square error (RMSE) of 649.9 N/mm2, with an overall mean MoE of 7816.8 N/mm2 across all pine specimens (n = 12).
For fir, moisture condition also had a significant effect on MoE (F(1,10) = 7.65, p = 0.020), although the proportion of explained variability was lower (R2 = 0.433; adjusted R2 = 0.377). The model yielded a RMSE of 1424.92 N/mm2, compared with an overall mean MoE of 6771.5 N/mm2. Inspection of Figure 6 indicates that the unusually high stiffness of specimen F10 under wet conditions contributed to the increased variability within this group.
For cedar of Lebanon, moisture condition significantly affected MoE (F(1,2) = 34.98, p = 0.027), with dry specimens exhibiting higher values than seawater-immersed specimens. The model explained 94.6% of the observed variability (R2 = 0.946; adjusted R2 = 0.919). The RMSE was 533.65 N/mm2, which was low relative to the overall mean MoE of 5055.75 N/mm2, indicating that the model provided a good fit to the experimental data. However, these results should be interpreted with caution because of the limited sample size (n = 4).
The percentage change in the MoE was calculated using Equation (4):
M o E % = M o E d r y M o E w e t M o E d r y × 100 ,
where
  • M o E d r y —MoE for dry condition [N/mm2];
  • M o E w e t —MoE for wet condition [N/mm2];
  • M o E   c h a n g e   % —MoE change from dry to wet [%].
The reduction in MoE following seawater saturation was 29% for fir, 38% for pine, 31% for cedar, and 47% for cedar of Lebanon. The result for cedar of Lebanon should be interpreted with caution because of the small sample size. Excluding this species, the results indicate a consistent reduction in MoE of approximately 30% following seawater saturation compared with the dry-state specimens. This reduction reflects a substantial decrease in wood stiffness, whereby a given applied load produces greater deflection.

4.3. Effect of Seawater on the Mechanical Behavior of Plank

Detailed examination of the experimental curves (Figure 6, Figure 7, Figure 8 and Figure 9) shows that seawater-saturated planks demonstrate increased ductility compared to their dry counterparts. Wet specimens deform more before failure, though their ultimate load-bearing capacity is significantly lower.
This finding suggests that prolonged exposure to seawater not only reduces stiffness, but also alters the overall fracture behavior, transitioning the material toward a more plastic response.

4.4. Estimation of Minimum Impact Velocity

The analytical model developed by Itzhack et al. [1] establishes a linear relationship between the velocity of an attacking trireme, v ( y ) , and the resulting deflection, y , of the impacted plank: v ( y ) = α y . The coefficient α is a function of the parameters K , M O E , I , r , and m , which together represent the structural and material properties determining a plank’s ability to withstand ramming forces. Table 4 lists the adopted values of these parameters and the calculated α coefficients for both dry and wet conditions.
As presented by Itzhack et al. [1] (p. 5), all model parameters were assigned representative values along with their associated uncertainties. Accordingly, the 95% confidence intervals reported in Table 3 were used to estimate the uncertainty associated with the MoE. The resulting tolerances were ±565 N/mm2 for fir, ±537 N/mm2 for pine, ±502 N/mm2 for cedar, and ±1325 N/mm2 for cedar of Lebanon. Due to the limited sample size of the cedar of Lebanon dataset (n = 4), this result was excluded from the general uncertainty assessment. Based on the remaining species, the uncertainty in MoE can reasonably be approximated as ±10% of the measured value.
To evaluate the model’s intrinsic sensitivity to material properties, the physical dimensions of the planks were assumed to be constant, with negligible variance. Although these geometric parameters may vary in practice due to seawater uptake, treating them as constants isolates the contribution of material-property variability to the overall uncertainty in the Minimum Impact Velocity function. Under this idealized framework, a 10% relative uncertainty in the MoE propagates to a 5% relative uncertainty in the predicted minimum velocity, owing to the model’s square-root dependence on MoE. This assumption therefore provides a highly constrained baseline, with a total system uncertainty of only 5%.
Table 4 presents the reference values for K , I , r , and M o E reported by Itzhack et al. [1] (Table 7), alongside the experimentally determined M o E values for different wood species under both dry and seawater-saturated conditions. As velocity is expressed in meters per second (m/s), unit conversions were applied: lengths were converted from millimeters to meters, and M o E values were converted from N/mm2 to kg/(m·s2) to maintain consistency in the calculations.
The parameter values reported by Itzhack et al. [1] (Table 7) were implemented in the model, namely: K = 1.3, I = 114 × 10−8 m4, r = 2717 × 10−6 m3 and m = 48,400 kg. These parameters were evaluated alongside the experimentally determined MoE values for the different wood species under both dry and seawater-saturated conditions.
To ensure dimensional consistency with velocity expressed in meters per second (m/s), all physical quantities were converted to standard SI units. Specifically, lengths were converted from millimeters to meters, and MoE values were converted from N/mm2 to N/m2 (Pa).
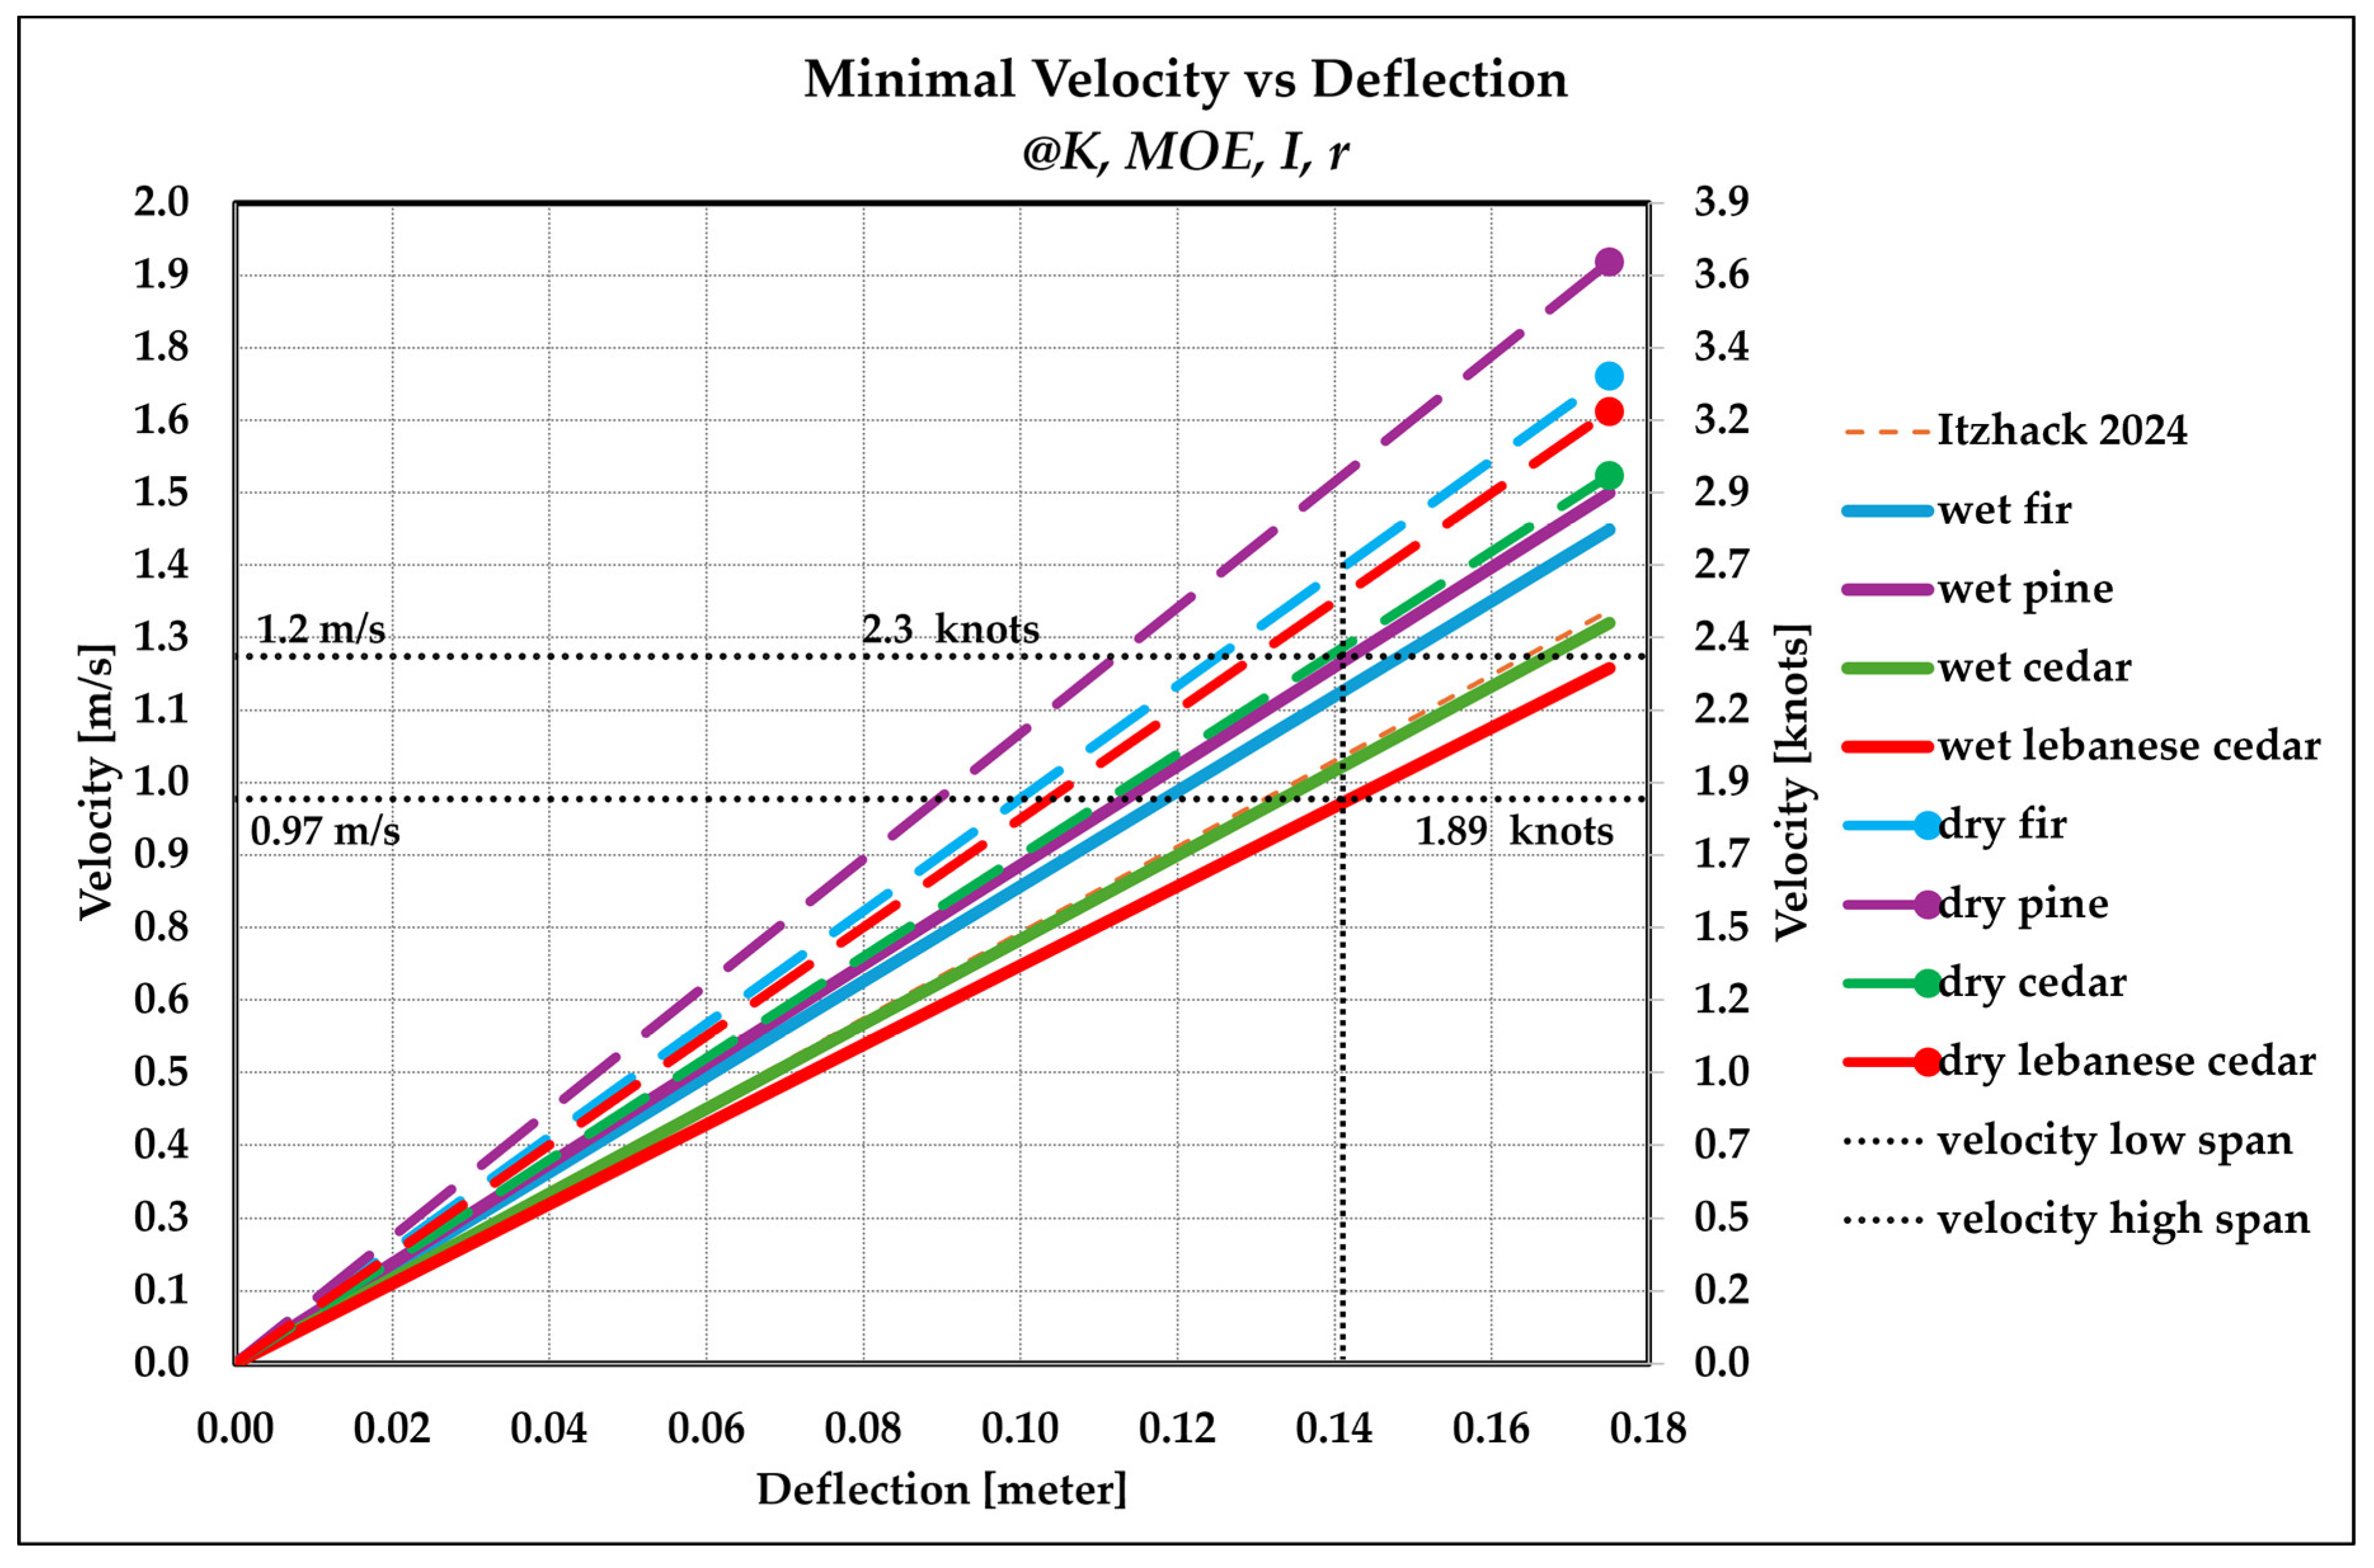
The nine resulting curves (Figure 10) illustrate the relationship between deflection and impact velocity for each wood species and condition. Each curve was calculated and plotted using the specific α values from Table 4. The dashed orange line represents the reference parameters reported by Itzhack et al. [1]. The vertical line at a deflection of 0.142 m corresponds to the threshold deflection required for significant damage, as defined by Itzhack et al. [1]. The calculated range of minimum impact velocities necessary to produce critical plank deformation in seawater-saturated conditions is about 1.0–1.2 m/s (1 m/s = 1.94 knots) (Figure 10). As with any estimated parameter, the uncertainty associated with the calculated values must be considered. This approach follows the recommendation of Itzhack et al. [1], as discussed earlier in this section.

4.5. Cedar of Lebanon

Cedar of Lebanon, native to the mountainous regions of Lebanon, Syria, and Turkey, was highly esteemed in Antiquity for its strength, durability, and resistance to decay. It is frequently mentioned in ancient texts, including Theophrastus’ Enquiry into Plants (Book 5.8) and several biblical passages (e.g., Exodus 25:5, 1 Kings 5:20, 1 Kings 6:15, Psalm 92:13, Ezekiel 31:4).
Due to limited material availability, only four specimens were tested (three wet, one dry). Although the small sample size precludes statistical generalization, the calculated MoE values were consistently higher than those of Cedrus atlantica (Atlas cedar), indicating superior mechanical performance. Despite the limited dataset, these results align with historical accounts that emphasize the exceptional quality of cedar of Lebanon for shipbuilding and architectural applications.

5. Conclusions

This experimental study refines the physical and mechanical characterization of timber species widely used in the eastern Mediterranean in antiquity. Planks of fir, pine, and cedar (excluding cedar of Lebanon due to the limited number of specimens) that were immersed in seawater exhibited marked increases in volume (8.5%, 8.8%, and 2.3%, respectively) and weight (due to seawater uptake- 28.6%, 29.0%, and 25.6%), whereas specimens maintained at 40 °C and 30% relative humidity showed slight volumetric shrinkage (−1.4%, −3.3%, and −0.6%) and negligible weight change (0.2%, 0.4%, and 0.2%).
Seawater immersion exhibited about a 30% reduction in the MoE, indicating a pronounced softening effect in which lower applied loads produced greater deflection. The resulting load–deflection behavior suggests that seawater-saturated planks would have altered the structural response of ancient warship hulls under impact compared with their dry-state counterparts, making them more flexible and less resistant to ramming forces.
Based on the measured mechanical properties and the analytical model employed, the minimum velocity required for an attacking trireme to ram a similarly constructed vessel and inflict disabling damage is estimated at 1.0–1.2 m/s, depending on the wood species, reflecting the variability of material properties incorporated into the analytical model. This range falls within the operational capabilities of the trireme.
In contrast, dry planks require higher impact velocities to reach comparable damage thresholds, consistent with their greater stiffness.

Supplementary Materials

The following supporting information can be downloaded at https://www.mdpi.com/article/10.3390/jmse14171655/s1, Table S1: Geometrical and physical properties of cedar specimens at each measurement stage; Table S2: Geometrical and physical properties of fir specimens at each measurement stage; Table S3: Geometrical and physical properties of pine specimens at each measurement stage; Table S4: Geometrical and physical properties of cedar of Lebanon specimens at each measurement stage; Table S5: MoE values for wet and dry—Cedar samples; Table S6: MoE values for wet and dry—Fir samples; Table S7: MoE values for wet and dry—Pine samples; Table S8: MoE values for wet and dry—Cedar of Lebanon samples.

Author Contributions

E.I.: Writing—review and editing, writing—original draft, methodology, conceptualization. D.C.: Writing—review and editing, writing—original draft, supervision, conceptualization. Y.M.-B.: Writing—review and editing, writing—original draft, supervision, methodology, conceptualization. M.C.: Writing—review and editing, writing—original draft, formal analysis. All authors have read and agreed to the published version of the manuscript.

Funding

This research received no external funding.

Data Availability Statement

The original contributions presented in this study are included in the article/Supplementary Materials. Further inquiries can be directed to the corresponding author.

Acknowledgments

This study was supported in part by a Sir Maurice Hatter Fellowship. The authors would like to thank the National Building Research Institute for their laboratory services; the Haifa School of Education and Marine Sports for their assistance; D. Langgut, Head of the Laboratory of Archaeobotany and Ancient Environments, for providing the research infrastructure for identifying the wood anatomy; Y. Borenstain, the Yaacov (Yak) Kahanov Laboratory for Ancient Ship Research, for his assistance, and the anonymous reviewers for their valuable comments and constructive suggestions, which have helped improve the quality and clarity of this manuscript.

Conflicts of Interest

The authors declare that they have no known competing financial interests or personal relationships that could have appeared to influence the work reported in this paper.

References

  1. Itzhack, E.; Cvikel, D.; Me-Bar, Y. Damaging a trireme by ramming: The kinetics. J. Archaeol. Sci. Rep. 2024, 57, 104678. [Google Scholar] [CrossRef] [Scilit]
  2. Casson, L. The Ancient Mariners: Seafarers and Sea Fighters of the Mediterranean in Ancient Times; Macmillan: New York, NY, USA, 1959. [Google Scholar]
  3. Murray, W.M. The Age of Titans: The Rise and Fall of the Great Hellenistic Navies; Oxford University Press: New York, NY, USA, 2012. [Google Scholar]
  4. Tusa, S.; Royal, J.G. The landscape of naval battle at the Egadi Islands (241 BC). J. Rom. Archaeol. 2012, 25, 7–48. [Google Scholar] [CrossRef] [Scilit]
  5. Morrison, J.S. Greek and Roman Oared Warships; Oxbow Books: Oxford, UK, 1996. [Google Scholar]
  6. Casson, L.; Steffy, J.R.; Linder, E. The Athlit Ram; Texas A&M University Press: College Station, TX, USA, 1991. [Google Scholar]
  7. Murray, W.M. The Provenience and Date: The Evidence of the Symbols. In The Athlit Ram; Casson, L., Steffy, J.R., Eds.; Texas A&M University Press: College Station, TX, USA, 1991; pp. 51–66. [Google Scholar]
  8. Steffy, J.R. Wooden Ship Building and the Interpretation of Shipwrecks; Texas A&M University Press: College Station, TX, USA, 1994. [Google Scholar]
  9. Hirschfeld, N. Appendix S: Trireme warfare in Herodotus. In The Landmark Herodotus: The Histories; Strassler, R.B., Ed.; Pantheon Books: New York, NY, USA, 2007; pp. 824–834. [Google Scholar]
  10. Hurst, H.; Blackman, D.J.; Lentini, M.C. Exceptions rather than the rule: The shipshed complexes of Carthage (mainly) and Athens. In Ricoveri per Navi Militari Nei Porti Del Mediterraneo Antico e Medievale; Edipuglia: Bari, Italy, 2010; pp. 27–36. [Google Scholar]
  11. Lipke, P. Triremes and Shipworm. In Trireme Olympias: The Final Report—Sea Trials 1992–4; Rankov, B., Ed.; Oxbow Books: Oxford, UK, 2012; pp. 203–206. [Google Scholar]
  12. Casson, L. Ships and Seamanship in the Ancient World; Johns Hopkins University Press: Baltimore, MD, USA, 1995. [Google Scholar]
  13. Coates, J. On slipping and launching triremes from the Piraeus shipsheds and from beaches. In Trireme Olympias: The Final Report—Sea Trials 1992–4; Rankov, B., Ed.; Oxbow Books: Oxford, UK, 2012; pp. 134–141. [Google Scholar]
  14. Morrison, J.S.; Coates, J.E.; Rankov, N.B. The Athenian Trireme; Cambridge University Press: Cambridge, UK, 2000. [Google Scholar]
  15. Colombini, M.P.; Giachi, G.; Modugno, F.; Pallecchi, P.; Ribechini, E. The characterization of paints and waterproofing materials from shipwrecks found at the archaeological site of the Etruscan and Roman harbour of Pisa (Italy). Archaeometry 2003, 45, 659–674. [Google Scholar] [CrossRef] [Scilit]
  16. United States Department of Agriculture; Forest Products Laboratory. Wood Handbook: Wood as an Engineering Material; General Technical Report FPL-GTR-120; USDA: Madison, WI, USA, 2010.
  17. Guntekin, E.; Aydin, T. Effects of moisture content on some mechanical properties of Turkish red pine (Pinus brutia Ten.). In Proceedings of the International Caucasian Forestry Symposium, Artvin, Turkey, 24–26 October 2013. [Google Scholar]
  18. Theophrastus. Enquiry Into Plants; Hort, A.F., Translator; William Heinemann: London, UK, 1916; Available online: https://topostext.org/work/242 (accessed on 15 October 2025).
  19. Kahanov, Y.; Linder, E. The Ma‘agan Mikhael Ship: The Recovery of a 2400-Year-Old Merchantman; Final Report Vol. I; Israel Exploration Society; University of Haifa: Jerusalem, Israel, 2003. [Google Scholar]
  20. Kahanov, Y.; Linder, E. The Ma‘agan Mikhael Ship: The Recovery of a 2400-Year-Old Merchantman; Final Report Vol. II; Israel Exploration Society; University of Haifa: Jerusalem, Israel, 2004. [Google Scholar]
  21. Steffy, J.R. The Kyrenia Ship: An Interim Report on Its Hull Construction. Am. J. Archaeol. 1985, 89, 71–101. [Google Scholar] [CrossRef] [Scilit]
  22. Candanedo, L.; Derome, D. Numerical simulation of water absorption in softwood. In Proceedings of the 9th International IBPSA Conference, Montréal, QC, Canada, 15–18 August 2005; pp. 15–18. [Google Scholar]
  23. Roman, K.; Grzegorzewska, E.; Leszczyński, M.; Pycka, S.; Barwicki, J.; Golisz, E.; Zatoń, P. Effect of seawater with average salinity on the moisture content, ash content and tensile strength of some coniferous wood. Materials 2023, 16, 2984. [Google Scholar] [CrossRef] [Scilit] [PubMed]
  24. Richter, H.G.; Grosser, D.; Heinz, I.; Gasson, P.E. IAWA List of Microscopic Features for Softwood Identification. IAWA J. 2004, 25, 1–70. [Google Scholar] [CrossRef] [Scilit]
  25. Fahn, A.; Werker, E.; Baas, P. Wood Anatomy and Identification of Trees and Shrubs from Israel and Adjacent Regions; Israel Academy of Sciences and Humanities: Jerusalem, Israel, 1986. [Google Scholar]
  26. Schweingruber, F.H. Anatomy of European Woods; Paul Haupt: Bern, Switzerland, 1990. [Google Scholar]
  27. Gale, R.; Cutler, D. Plants in Archaeology: Identification Manual of Vegetative Plant Materials Used in Europe and the Southern Mediterranean to c. 1500; Royal Botanic Gardens, Kew: Kew, UK, 2000. [Google Scholar]
  28. Akkemik, Ü.; Yaman, B. Wood Anatomy of Eastern Mediterranean Species; Verlag Kessel: Remagen-Oberwinter, Germany, 2012. [Google Scholar]
  29. Crivellaro, A.; Schweingruber, F.H. Atlas of Wood, Bark and Pith Anatomy of Eastern Mediterranean Trees and Shrubs; Springer: Berlin/Heidelberg, Germany, 2013. [Google Scholar]
  30. InsideWood. InsideWood Database. Available online: http://insidewood.lib.ncsu.edu/search (accessed on 15 February 2025).
  31. Wheeler, E.A. InsideWood—A web resource for hardwood anatomy. IAWA J. 2011, 32, 199–211. [Google Scholar] [CrossRef] [Scilit]
  32. Wheeler, E.A.; Gasson, P.E.; Baas, P. Using the InsideWood website: Potentials and pitfalls. IAWA J. 2020, 41, 412–462. [Google Scholar] [CrossRef] [Scilit]
  33. Barreiros, R.M.; Godinho, E.Z.; Pereira, L.C.; Dias, K.B.; Caneppele, F.D.L. Methods in determining basic density of wood. Wood Mater. Sci. Eng. 2024, 19, 918–919. [Google Scholar] [CrossRef] [Scilit]
  34. Bou Dagher-Kharrat, M.; Mariette, S.; Lefèvre, F.; Fady, B.; Grenier-de March, G.; Plomion, C.; Savouré, A. Geographical diversity and genetic relationships among Cedrus species estimated by AFLP. Tree Genet. Genomes 2006, 3, 275–285. [Google Scholar] [CrossRef] [Scilit]
  35. Hadinata, M.E.; Kozakiewicz, P. The density of silver fir (Abies alba Mill.) wood from diverse origins in a provenance trial in Rogów. Ann. Warsaw. Univ. Life Sci.—SGGW For. Wood Technol. 2025, 129, 43–53. [Google Scholar] [CrossRef] [Scilit]
  36. ASTM International. ASTM D143-12; Standard Test Methods for Small Clear Specimens of Timber. ASTM International: West Conshohocken, PA, USA, 2012.
  37. DIN Deutsches Institut für Normung. DIN 52186; Testing of Wood—Bending Test. DIN: Berlin, Germany, 1978.
  38. International Organization for Standardization. ISO 13061-4; Physical and Mechanical Properties of Wood—Test Methods for Small Clear Specimens—Part 4: Determination of Modulus of Elasticity in Bending. ISO: Geneva, Switzerland, 2014.
  39. British Standards Institution. BS 373; Methods of Testing Small Clear Specimens of Timber. BSI: London, UK, 1957.
  40. Baar, J.; Tippner, J.; Rademacher, P. Prediction of mechanical properties—Modulus of rupture and modulus of elasticity—Of five tropical species by nondestructive methods. Maderas Cienc. Tecnol. 2015, 17, 239–252. [Google Scholar] [CrossRef] [Scilit]
Figure 1. Shipworm (Teredo navalis) found in timber after one week’s immersion in the sea (Photo E. Itzhack. To refine the structural details and improve visual clarity, the image was processed using Nano Banana 2 AI to meet the quality standards for publication in an academic journal).
Jmse 14 01655 g001
Figure 2. Defining the position of the ‘ram head’ (red) on a the Athlit Ram. The driving center area is marked in grey. The Athlit ram. Courtesy of the National Maritime Museum, Haifa (Photograph: Studio Warhaftig Venezian Ltd.).
Jmse 14 01655 g002
Figure 3. Example of a load–deflection curve.
Jmse 14 01655 g003
Figure 4. Three-point bending test arrangement (E. Itzhack): (a) initial state; (b) loading state.
Jmse 14 01655 g004
Figure 5. Fir specimen (F1) during the three-point bending test (Photo E. Itzhack).
Jmse 14 01655 g005
Figure 6. Load–deflection curves for cedar specimens.
Jmse 14 01655 g006
Figure 7. Load–deflection curves for fir specimens.
Jmse 14 01655 g007
Figure 8. Load–deflection curves for pine specimens.
Jmse 14 01655 g008
Figure 9. Load–deflection curves for cedar of Lebanon specimens.
Jmse 14 01655 g009
Figure 10. Minimum velocity vs. deflection for the various values of the MoE listed in Table 4.
Jmse 14 01655 g010
Table 1. Number of specimens per wood species and experimental condition.
Wood SpeciesWet SamplesDry SamplesTotal Samples
Cedar8412
Fir8412
Pine8412
Cedar of Lebanon314
Total271340
Table 2. Average percentage change in sample volume and weight between the second and third measurements.
Wood SpeciesVolume Change %Weight Change %
Water Uptake %
WetDryWetDry
Fir8.5−1.428.6NC
Pine8.8−3.329.0NC
Cedar2.3NC25.6NC
Cedar of Lebanon10.3NC32.3NC
Table 3. Descriptive statistics of the modulus of elasticity (MoE) for all investigated wood species under each moisture condition, including sample size (N), mean, standard deviation (SD), standard error (SE), and 95% confidence intervals (all values in N/mm2).
MCNMeanStd DevStd Err MeanLower 95%Upper 95%
Firdry4838023881194458012,180
wet8596767623954026532
Pindry410,427665333936811,485
wet8651264322759747049
Cedardry4676892946452908246
wet8470360021242015205
Cedar of Lebanondry17789
wet3414553430828195470
Table 4. Calculated α coefficients.
VariationMoEα
[ k g m · s 2 ] K · M O E · I r · m 2
Itzhack et al. 2024
[1] (p. 6)
4950 × 1067.41
Wet fir5968 × 1068.21
Wet pine6512 × 1068.57
Wet cedar4704 × 1067.29
Wet cedar of Lebanon4145 × 1066.84
Dry fir8381 × 1069.72
Dry pine10,427 × 10610.85
Dry cedar6769 × 1068.74
Dry cedar of Lebanon7789 × 1069.37
Disclaimer/Publisher’s Note: The statements, opinions and data contained in all publications are solely those of the individual author(s) and contributor(s) and not of MDPI and/or the editor(s). MDPI and/or the editor(s) disclaim responsibility for any injury to people or property resulting from any ideas, methods, instructions or products referred to in the content.