1. Introduction
The continuous growth of the maritime industry, which accounts for approximately 90% of global trade volume, further underscores the importance of maritime transportation [
1]. However, as seaborne trade increases, the intensified utilization of coastal waters has led to a rise in maritime accidents, posing direct threats to human life and property at sea [
2]. In general, vessel operators plan safe navigation routes based on information about fixed obstacles in the navigational area to ensure the safe navigation of ships [
3]. Failure to plan a safe route can result in serious economic losses and environmental damage, including casualties, hull damage, waterway blockages, and marine pollution [
4]. Beyond reinforcement learning approaches, model predictive control has also been applied to enforce traffic-rule compliance in trajectory optimization for autonomous surface vessels [
5], reflecting a broader effort to embed regulatory and behavioral constraints directly into the control and planning layers of maritime autonomy.
Small vessels are particularly vulnerable to maritime accidents due to less stringent design standards, and international safety regulations are often insufficient or ambiguous depending on the country [
6]. Furthermore, since small vessels primarily navigate in narrow and complex coastal waterways, the avoidance of collision and grounding risks takes priority over fuel efficiency, making it critically important that the navigation route does not traverse land and that a clearance distance from obstacles is maintained [
7].
In recent years, numerous improvements to ship path planning algorithms have been proposed. These algorithms tend to focus on enhancing algorithm performance and expanding the scope of application [
8,
9,
10,
11,
12,
13]. Beyond safety-oriented objectives, recent studies have also extended maritime route planning toward environmental and efficiency considerations, such as spatiotemporal evaluation of carbon emissions along shipping routes [
14]. While improving algorithm performance and broadening applicability are important, path planning aimed at enhancing navigational safety must be considered a primary concern for vessel safety.
Among grid-based methods, the A* algorithm is widely adopted for coastal autonomous navigation due to its heuristic-based search structure that simultaneously satisfies completeness and optimality [
15,
16,
17,
18]. However, most existing A*-based approaches focus primarily on distance minimization and have limitations in sufficiently reflecting the spatial obstacle density and the kinematic constraints of vessels. As a result, generated paths may become excessively close to land boundaries or may include abrupt course changes that are difficult for actual vessels to track [
19].
To address these limitations, various studies have been conducted combining sampling-based search methods such as Rapidly exploring Random Trees (RRT) and Artificial Potential Fields (APF). The sampling-based RRT path search algorithm is characterized by probabilistic completeness, and this approach has the advantage of being able to explore complex paths without constructing an explicit spatial map. However, it has limitations in coastal waters with dense obstacles or narrow waterway where performance degrades and convergence speed is relatively slow [
20]. The Artificial Potential Field (APF) path search algorithm is widely used for its simplicity and convenience, but it is prone to becoming trapped in local minima in complex and confined areas [
21].
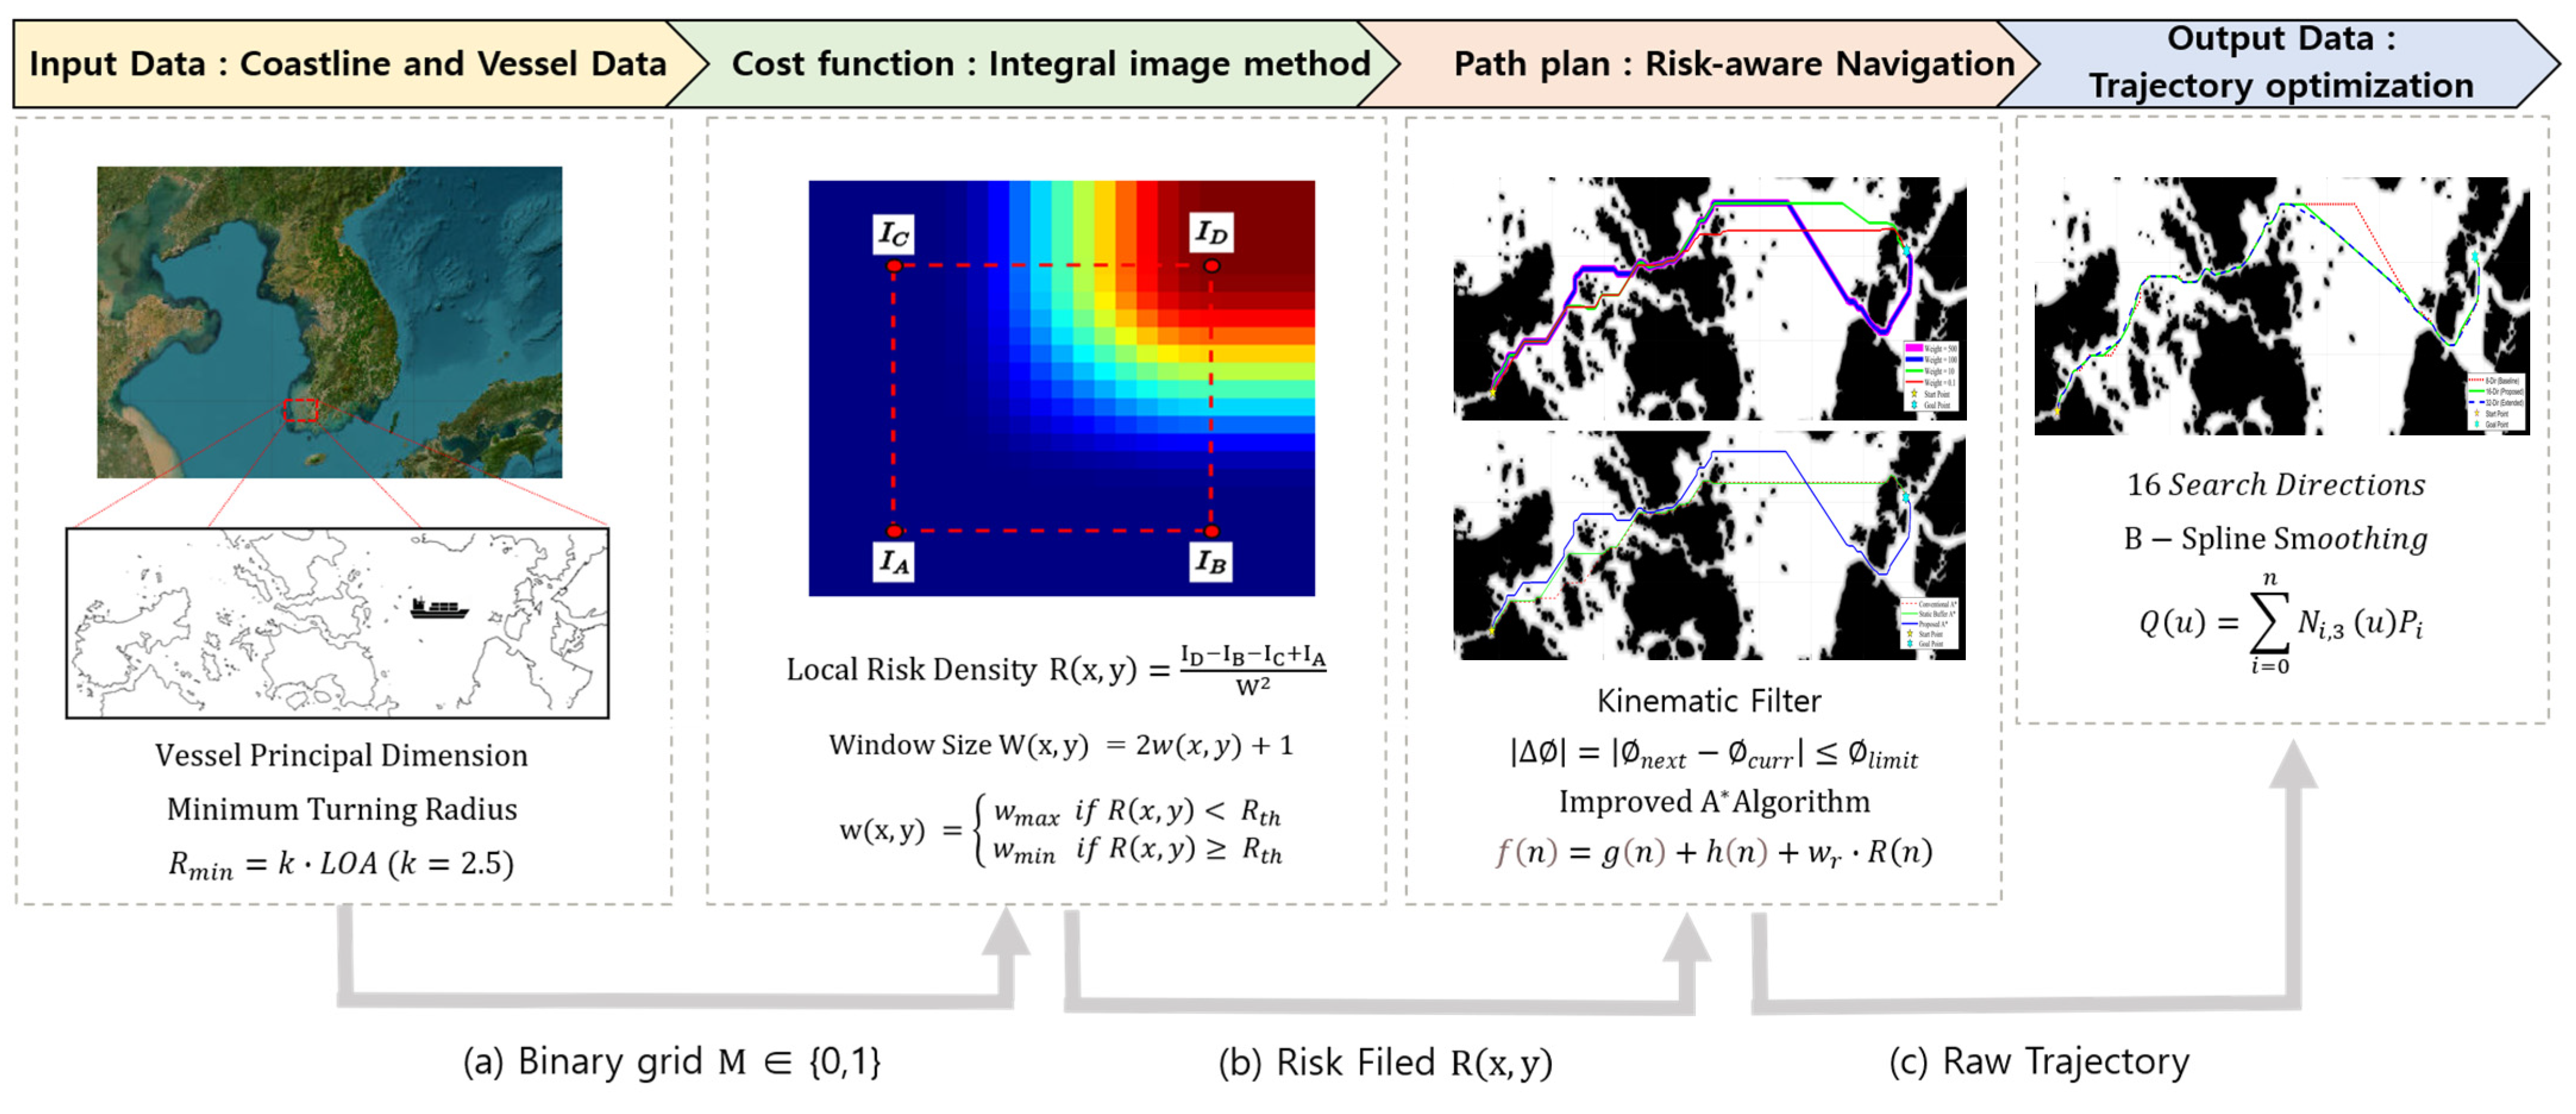
To address these problems, this study proposes a kinematic A* path planning framework utilizing an Integral Image-based Risk Field. The methodology workflow is shown in
Figure 1. The proposed method is designed to compute local obstacle density in constant time
O(1) through an integral image structure, maintaining computational efficiency even in high-resolution environments. In addition, turning performance and course change constraints of vessels are incorporated into the search process to account for ship maneuverability. Furthermore, the combination of 16-direction search expansion and cubic B-spline smoothing enhances the curvature continuity and trackability of the generated path.
The main contributions of this study are summarized as follows:
An O(1)-complexity local risk evaluation structure based on the integral image technique is proposed, enabling real-time risk computation in high-resolution grid environments.
A kinematic A* search framework is developed by integrating the vessel’s minimum turning radius and maximum course change angle constraints into the node expansion process.
An adaptive risk-based search strategy combined with cubic B-Spline smoothing is introduced to simultaneously improve navigational safety and path continuity in coastal waters.
The effectiveness of the proposed framework is validated through simulations in both the Mokpo–Sinan and Myeongnyang Strait coastal waters, demonstrating improved safety clearance and kinematic smoothness compared to conventional A* and static buffer-based methods.
The remainder of this paper is organized as follows.
Section 2 reviews the existing literature on path planning and safe route generation.
Section 3 describes the proposed integral image-based kinematic A* algorithm in detail.
Section 4 presents simulation results and comparative performance analysis in real coastal water.
Section 5 and
Section 6 provide discussion and conclusions, respectively.
2. Literature Review
Prior studies on maritime path planning can be broadly categorized into three directions: search efficiency improvement, risk-aware safety enhancement, and kinematic trackability. This section reviews representative work in each category and identifies the research gaps addressed by the proposed framework. Accordingly, recent studies have advanced toward integrating not only improved computational efficiency of existing path search algorithms, but also risk-aware safety and kinematic trackability.
Various A*-based improvements have been proposed in prior studies to enhance search efficiency and reduce path length. Guo et al. [
22] applied a Boustrophedon decomposition-based search strategy to reduce the search area and improve path efficiency. Liang et al. [
23] simplified the path by eliminating unnecessary waypoints through line-of-sight obstacle checking between the start and goal points. Cao et al. [
24] improved search efficiency through heuristic function enhancement and search direction optimization. More recently, data-driven path planning studies utilizing AIS data and real navigational information have also been conducted. Yang et al. [
11] proposed an enhanced A* algorithm combining graph partitioning techniques with AIS data, while Lee et al. [
10] developed a shortest path-generation method based on actual vessel operational data. Furthermore, Jeong et al. [
7] and Lee et al. [
15] improved path search efficiency in coastal waters using Quadtree-based spatial decomposition techniques. However, most of these studies focus primarily on search efficiency and distance optimization and have limitations in terms of ensuring adequate clearance distances and reflecting spatial risk distribution, both of which are essential requirements in actual coastal waters. To overcome the limitations of simple distance-based optimization, risk-aware route planning research has been actively conducted. This approach aims to generate safer routes by incorporating not only the distance from obstacles but also the risk level of the surrounding environment into the cost function.
Zhen et al. [
19] proposed an enhanced A* algorithm integrating ocean current, water depth, and the Convention on the International Regulations for Preventing Collisions at Sea (COLREGs), improving adaptability to real maritime environments. Liu et al. [
25] proposed the PE-A* algorithm utilizing position energy to improve obstacle avoidance performance, while Xie et al. [
26] applied multi-direction search in offshore wind farm environments to generate routes that safely navigate between turbines. Artificial Potential Field (APF)-based approaches have also been extensively studied. Li et al. [
1] combined APF with Ant Colony Optimization (ACO) to enhance collision avoidance performance, while Liu et al. [
12] and Rong et al. [
27] combined APF with the A* algorithm to simultaneously achieve obstacle avoidance and path smoothing. Malone et al. [
21] improved moving obstacle avoidance performance through a probabilistic potential field approach.
Risk-aware route planning research utilizing Reinforcement Learning has also been increasing. Xu et al. [
2] proposed a Deep Reinforcement Learning algorithm based on COLREGs, while Wang et al. [
4] improved the safety of ship path planning using a Soft Actor-Critic-based risk assessment model. However, most existing risk-aware approaches focus primarily on distance-based avoidance of individual obstacles, and studies that reflect the spatial obstacle density of the entire navigational area remain relatively limited. In particular, in high-resolution grid environments, local risk values must be computed repeatedly for each node, resulting in a rapid increase in computational cost. In coastal waters, computational complexity increases sharply as the number of search nodes grows, which becomes a major limiting factor for autonomous navigation system deployment. Zhang et al. [
28] reduced the search space through bidirectional search, while Wu et al. [
16] improved search efficiency in complex coastal waters using a recursive-based search structure.
RRT-based algorithms have also been studied to improve computational efficiency. Jang and Kim [
3] proposed an RRT*-based path search method utilizing designated navigation spaces, while Zhang et al. [
20] improved search performance through a Hybrid RRT algorithm with dynamic step sizes. However, most studies have focused on improving the efficiency of the search structure itself, while the issue of repetitive computational burden in the local risk calculation process has not been sufficiently addressed. In particular, sliding window-based risk computation methods generally have a computational complexity of O(W
2) with respect to the local window size W, which presents limitations in high-resolution environments [
29]. Since actual vessels are subject to kinematic constraints such as minimum turning radius, steering response time, and inertial characteristics, the trackability of generated paths is of critical importance. However, conventional grid-based search methods typically produce paths with abrupt course changes and staircase trajectories. To address this, various smoothing and multi-direction search studies have been conducted. Wang et al. [
30] mitigated the problem of abrupt course changes by employing a 16-direction search strategy combined with a buffer zone. Liang et al. [
31] performed COLREGs-compliant path planning by combining a 20-direction A* with an Improved Dynamic Window Approach (IDWA). Sun et al. [
32] enhanced curvature continuity by integrating Adaptive Heuristic JPS with B-spline-based optimization. He et al. [
33] proposed a dynamic collision avoidance A* algorithm utilizing a ship domain model for multi-vessel encounter scenarios, while Liu et al. [
34] improved path trackability by integrating a Dynamic Window Approach (DWA)-based dynamic avoidance method. Nevertheless, most studies rely on post-processing smoothing after path generation, and integrated frameworks that simultaneously consider risk and kinematic constraints from the search stage onward remain limited in the literature.
In summary, research on maritime path planning has evolved along three main directions: improving search efficiency, ensuring risk-aware safety, and enhancing kinematic trackability. However, the following limitations persist:
Existing risk-aware approaches are primarily designed around individual obstacle avoidance and do not sufficiently reflect the spatial obstacle density of the entire navigational area.
Local risk computation generally relies on iterative cumulative summation, resulting in a rapid increase in computational burden in high-resolution environments.
Path smoothing is predominantly performed as a post-processing step after the search phase, limiting the integration of kinematic constraints during the search stage itself.
To address these limitations, the proposed framework incorporates three corresponding design elements. First, the area-based integral image risk field (
Section 3.2) reflects the spatial obstacle density of the entire navigational area rather than distance to individual obstacles, directly addressing Limitation 1. Second, the
O(1) risk computation structure (
Section 3.2.2) resolves the computational burden identified in Limitation 2, replacing the
O(
W2) sliding-window summation used in prior sliding-window risk models. Third, kinematic constraints are directly embedded into the node expansion stage (
Section 3.4.2) rather than applied as post-processing smoothing, addressing Limitation 3.
To validate the performance of the proposed algorithm, comparative experiments are conducted against two representative existing methods in this study.
The first comparison method is the conventional A* algorithm, which follows the basic structure of heuristic-based shortest path search and does not incorporate risk or kinematic constraints, serving as the baseline method [
18]. This method has been reported to generate paths that become excessively close to land boundaries and produce abrupt course changes in coastal waters [
19] and was adopted as the baseline to support the motivation for improvement in this study.
The second comparison method is the Static Buffer-based A* algorithm, which applies a fixed dilation radius around obstacles to secure a clearance distance. This approach has been adopted in Jeong et al. [
7] and Wang et al. [
30] and offers the advantages of simple implementation and low computational cost. However, since the fixed binary obstacle expansion cannot reflect the spatial obstacle density gradient of the navigational area, it exhibits rigid behavior by remaining fixed along the safe contour boundary in narrow waterway sections and has the limitation of passively complying with constraints rather than actively avoiding the risk gradient of the terrain.
In this study, the conventional A* and the static buffer-based A* are selected as comparison methods, and the context-adaptive path generation performance of the proposed algorithm, which dynamically incorporates integral image-based risk density into the cost function, is validated. The limitations of prior studies analyzed above and the technical mechanisms of the comparison methods adopted in this study are comprehensively summarized and contrasted in
Table 1.
3. Methodology
3.1. Kinematic Modeling Based on Next-Generation Standard Vessel Design
To establish the physical validity of the path planning algorithm, the design specifications of the next-generation standard fishing vessel, as defined by the Ministry of Oceans and Fisheries (MOF) of the Republic of Korea [
35], were analyzed and used to quantify the kinematic constraints applied in this study. Unlike conventional approaches that treat a vessel as a simple point during path search, this study defines the Length Overall (LOA) and minimum turning radius
Rmin, corresponding to the Gross Tonnage (GT) class, as parameters and applies them as constraints in the algorithm.
The Korean next-generation standard fishing vessel design specifies unique hull dimensions depending on vessel type and Gross Tonnage, established under the MOF notification to standardize vessel construction while securing crew safety and welfare space. These specifications serve as fundamental parameters for calculating the physical occupancy space and minimum safe area of vessels, particularly for the 5- to 10-Gross Tonnage class vessels that constitute the primary category of coastal fishing operations.
To generate safe navigation routes, the minimum turning radius Rmin of the vessel was defined in accordance with the IMO standard maneuvering performance criteria (Resolution MSC.137(76)), as expressed in Equation (1).
In general, the IMO Resolution MSC.137(76) specifies an upper bound on tactical diameter (≤5 × LOA) to ensure vessel safety, rather than prescribing a fixed design coefficient, leaving the specific value of k to be determined according to vessel class and operational context. In this study, k = 2.5 was adopted as a conservative radius-equivalent value for the kinematic constraint parameter of the path planning algorithm. This choice reflects the fact that verified sea-trial maneuvering data, as required under MSC.137(76), are generally unavailable for small fishing vessels of this class, in contrast to larger commercial vessels for which such trials are routinely conducted. In the absence of vessel-specific empirical data, adopting a smaller k, which assumes near-optimal turning performance, risks generating paths whose curvature exceeds what the vessel can reliably achieve under real sea conditions such as wind, current, and loading variation. Conversely, a larger k value yields a wider Rmin and consequently a smaller course change angle, producing smoother but less agile paths, thereby providing a greater safety margin against this uncertainty. While a full sensitivity analysis of k is beyond the scope of this study, this trade-off is discussed qualitatively, and a quantitative sensitivity analysis using vessel-specific sea-trial data is identified as a direction for future work.
Regarding the applicability of MSC.137(76), adopted in 2002, to the Korean next-generation standard vessel design enacted in 2022, it should be noted that these two documents originate from distinct regulatory bodies with non-overlapping jurisdictions. MSC.137(76) is an international standard adopted by the Maritime Safety Committee of the International Maritime Organization, governing maneuvering performance criteria applicable to vessels globally, independent of hull material, propulsion technology, or vessel generation. In contrast, the next-generation standard fishing vessel design is a domestic notification issued by the MOF, governing the physical hull dimensions of vessels registered under Korean coastal fisheries regulations. Because these two documents regulate different aspects of vessel design under different regulatory authorities, IMO for maneuvering performance and MOF for physical hull specification, their joint use in this study reflects a complementary combination of an internationally recognized performance standard for maneuvering constraints (Rmin) and the applicable domestic design standard for hull dimensions (LOA). As MSC.137(76) remains the current IMO reference standard for tactical diameter, with no superseding resolution issued to date, its criteria remain applicable regardless of the vintage of the specific hull design under evaluation.
These kinematic constraints, together with the vessel principal dimensions, serve as the basis for determining the maximum allowable course change angle between adjacent nodes during the node expansion stage (
Section 3.4.2). This value is derived through the geometric relationship between the grid resolution and
Rmin, ensuring that the generated path maintains continuous curvature without discontinuous turns.
3.2. Grid Map Pre-Processing and Risk Modeling for Environment Analysis
3.2.1. Local Obstacle Density Modeling
To establish the environmental foundation for path planning, a binary occupancy grid map was constructed using national standard coastline data. Following boundary closure and interior region filling processes, a binary matrix was built in which obstacles are assigned a value of 1 and navigable areas are assigned a value of 0.
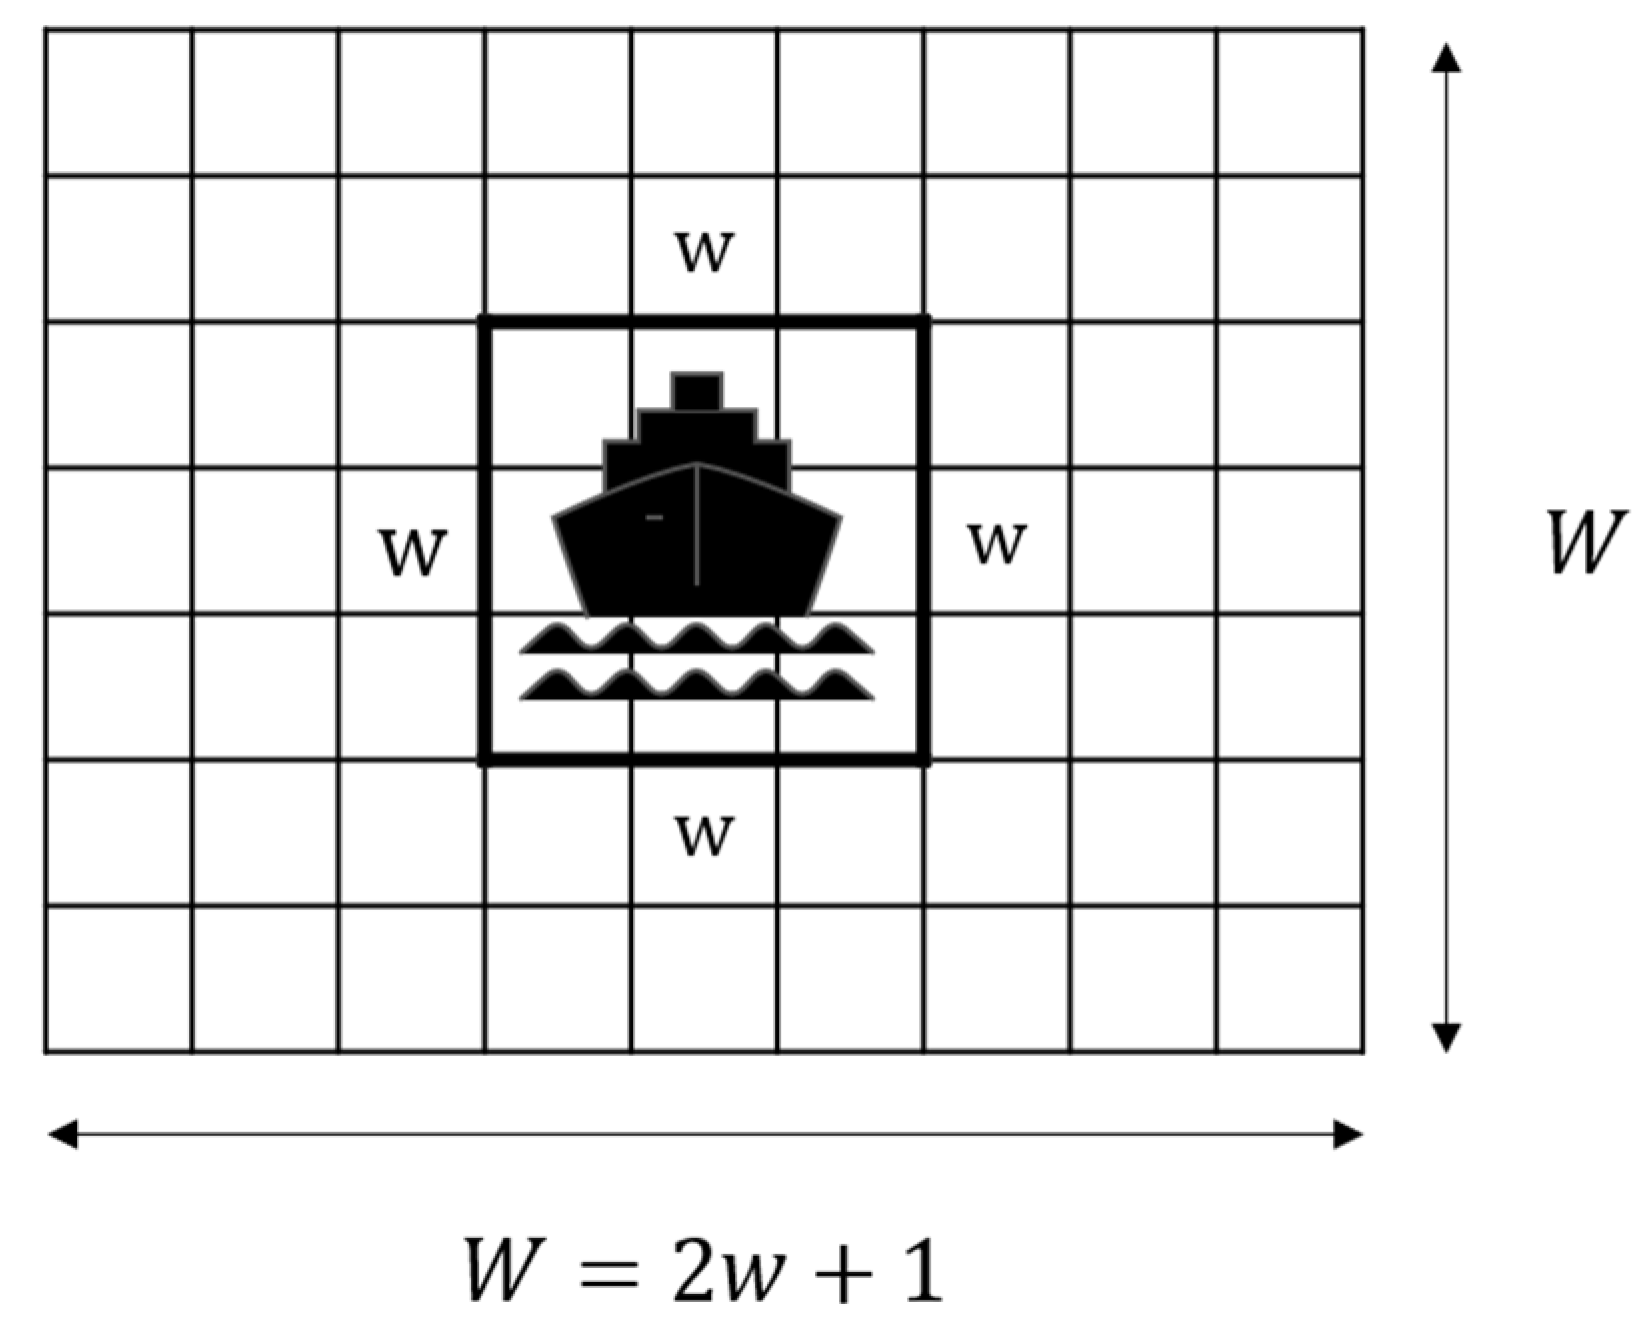
To ensure kinematic plausibility in coastal waters, the local obstacle density of the surrounding environment must be quantified and centered on the vessel’s position. For this purpose, a rectangular sliding window W is defined centered on a specific node n(x,y).
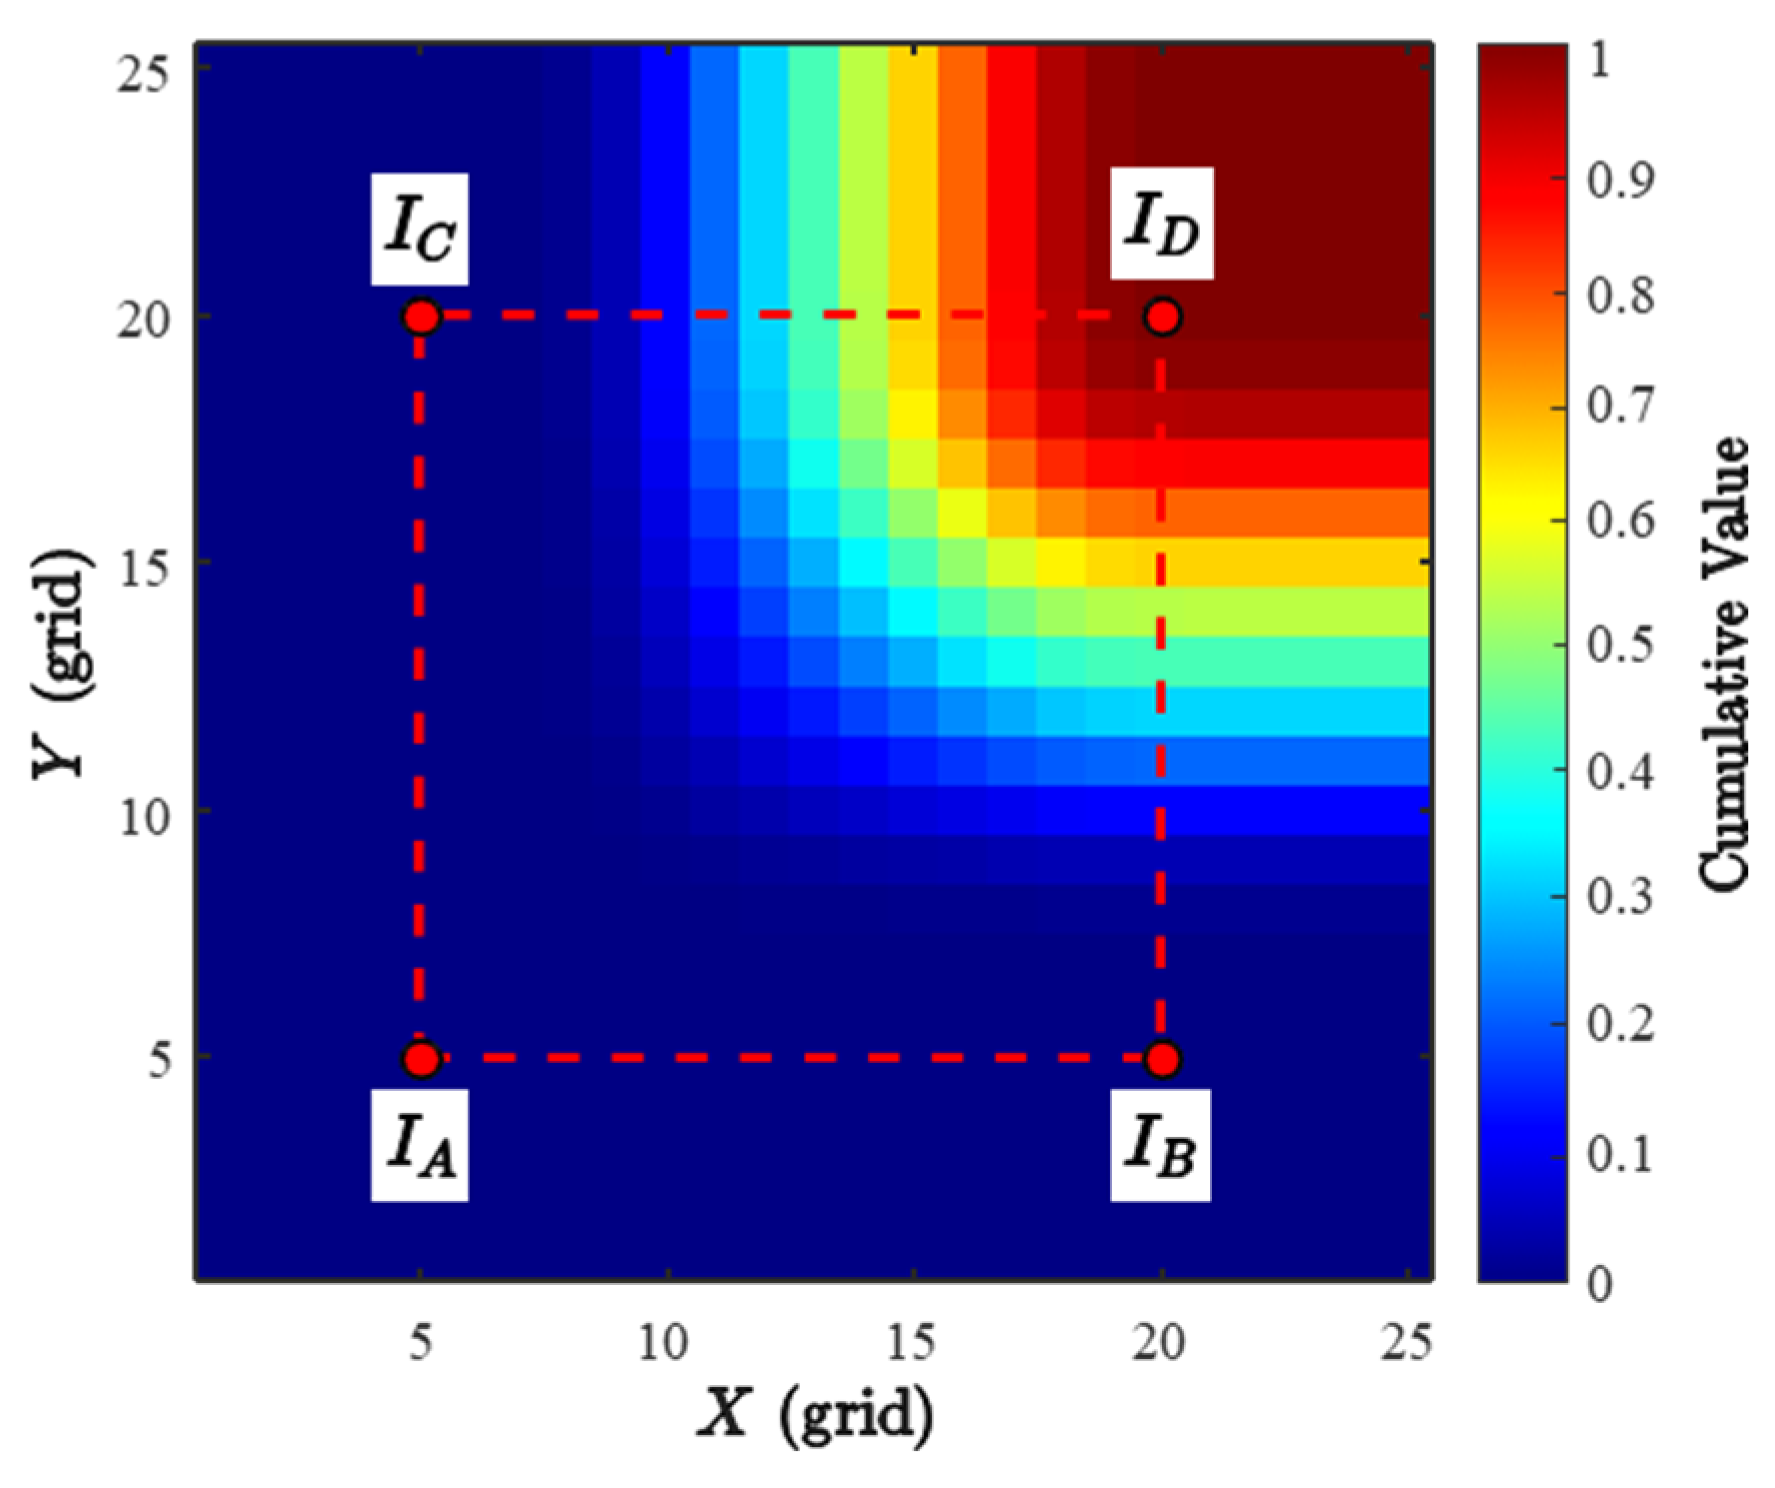
As shown in
Figure 2, the window is constructed by symmetrically extending w grid cells in each of the four directions (left, right, up, down) from the center node, where
w denotes the expansion parameter. Accordingly, the side length of the window, denoted
W, is expressed as shown in Equation (2), where the additional single cell accounts for the center node itself, ensuring a symmetrical search range centered on the node.
This symmetric construction ensures that the window remains centered on the node
n(
x,
y) regardless of the value of w, which is a necessary condition for the local obstacle density
D(
x,
y) to represent an unbiased measure of the surrounding environment. The local obstacle density
D(
x,
y), representing the obstacle occupancy ratio within the window area, is computed as shown in Equation (3).
is a binary variable representing the occupancy status of each grid cell, where 1 denotes an obstacle and 0 denotes a navigable area. The computed D(x,y) is a continuous value in the range [0, 1] that quantitatively represents the obstacle occupancy ratio within the window. However, the direct summation approach of Equation (3) has a computational complexity of O(W2) proportional to the window size W, which limits its applicability in high-resolution environments.
3.2.2. High-Efficiency Risk Modeling via Integral Image
To improve the computational efficiency of local obstacle density calculation in high-resolution environments, the integral image technique was applied [
36]. This two-stage formulation, in which an initially defined density metric is subsequently accelerated via an integral-image-based computation while preserving mathematical equivalence, is consistent with recent applications of integral images to local obstacle density estimation in grid-based path planning, such as the density-aware heuristic search framework proposed for indoor mobile robot navigation [
32].
Following the construction of the binary occupancy matrix
M(
x,
y), the integral image
I(
x,
y) is defined recursively as the cumulative sum of obstacle values from the map origin (1,1) to the coordinate (
x,
y), as expressed in Equation (4).
As shown in
Figure 3, the integral image constructs a cumulative summation map containing all obstacle information up to the current position (
x,
y).
Once
I is constructed, the obstacle sum
S within any rectangular window is derived from only the four corner values of the integral image. For the
W ×
W window centered on node
n(
x,
y), let (
x1,
y1) and (
x2,
y2) denote the lower-left and upper-right corners of the window, respectively, such that
x1 =
x −
w,
y1 =
y −
w,
x2 =
x +
w,
y2 =
y +
w. The obstacle sum
S is then obtained as expressed in Equation (5).
This expression follows the inclusion–exclusion principle applied to cumulative sums. I(x2,y2) accumulates all obstacles from the origin to the window’s upper-right corner, from which the region extending below the window and the region extending to the left of the window are subtracted. Because these two subtracted regions overlap beyond the window’s lower-left corner, this overlapping region is added back once. Although x and y do not appear explicitly on the right-hand side of Equation (5), they are embedded in the corner coordinates (x1,y1) and (x2,y2), both defined in terms of the center node (x,y) and the expansion parameter w.
Consequently, the computational complexity of obtaining
S(
x,
y) is fixed at constant time
O(1), independent of the window size. For notational brevity, the four corner values of the integral image are denoted as
IA =
I(
x1 – 1,
y1 − 1),
IB =
I(
x2,
y1 − 1),
IC =
I(
x1 – 1,
y2), and
ID =
I(
x2,
y2). The final risk index
R(
x,
y) is then obtained by normalizing
S(
x,
y) by the window area
W2, as expressed in Equation (6).
The index R(x,y) takes values in [0, 1], where values closer to 1 indicate higher surrounding obstacle density. This index is utilized as a parameter in the node cost function and serves as the basis for dynamically adjusting the safety margin. It should be noted that R(x,y) in Equation (6) and D(x,y) in Equation (3) represent the identical physical quantity, namely the obstacle occupancy ratio within the W × W window centered on node n(x,y), such that D(x,y) = R(x,y) for any given window. The two formulations differ only in computational strategy. D(x,y) evaluates this ratio through direct summation over the window (Equation (3)), incurring O(W2) computational complexity, whereas R(x,y) derives the mathematically equivalent quantity in O(1) time by exploiting the precomputed integral image I(x,y) and evaluating only the four corner values of the window (Equations (4) and (5)). R(x,y) is therefore adopted as the operationally deployed form throughout the remainder of this study due to its superior computational efficiency in high-resolution grid environments.
3.3. Adaptive Dual-Window Risk Field Strategy
An Adaptive Dual-Window strategy is proposed, which dynamically adjusts the search window size by utilizing the local risk index R(x,y) computed via the integral image as feedback. This strategy optimizes the balance between search efficiency and navigational safety by switching between two search modes according to the complexity of the navigational area.
Open Water Search Mode: In navigational areas with low obstacle density where the risk index R(x,y) is below the threshold , the window size is expanded to wmax to rapidly scan a wide area. This minimizes unnecessary local computations and promotes the generation of smooth paths that consider directional continuity of the vessel.
Constrained Water Search Mode: In narrow waterways or obstacle-dense areas where the risk index R(x,y) meets or exceeds the threshold Rth, the window size is reduced to wmin upon entering the terrain-dense zone to finely detect topographic changes around the vessel. The risk of grounding is minimized through precise computation of the vessel minimum turning radius and maximum course change angle constraints within narrow waterways.
The window size switching between the two modes is defined as expressed in Equation (7).
The threshold
Rth for the risk index
R was evaluated over the range [0.1, 1.0]. Lower threshold values resulted in performance similar to the conventional A* algorithm, while higher threshold values caused useful narrow waterway to be missed. In this study, a threshold value of 0.3 was adopted, and this selection has been demonstrated to be beneficial when integrated with curvature-aware tracking in prior studies [
32].
A binary switching structure, rather than a continuous function of R(x,y), was adopted for two reasons. First, it maintains computational predictability. The window size takes only one of two precomputed values at any given node, avoiding the need to repeatedly resize the integral-image query region across a continuous range, which would otherwise reintroduce a dependency between computational cost and local risk variation. Second, it prevents window-size oscillation near the threshold boundary. A continuous scaling function could cause the window size to fluctuate sharply in response to small changes in R(x,y) across adjacent nodes, introducing discontinuous cost gradients during node expansion and destabilizing path continuity. The binary structure instead ensures that each node is assigned one of two physically justified window sizes, corresponding to two distinct navigational regimes.
The window sizes
wmin and
wmax are directly linked to the vessel specifications defined in
Section 3.1. The minimum window size
wmin is set based on the vessel’s LOA, ensuring that the finer search resolution in constrained waters is scaled to the vessel’s own physical footprint. The maximum window size
wmax is defined in proportion to the minimum turning radius
Rmin, ensuring that the coarser search resolution in open water spans a distance consistent with the vessel’s maneuvering envelope. Both values are normalized by the grid resolution, denoted as
dcell, to convert physical distance into grid-cell units. This is expressed in Equation (8) as follows.
It should be noted that wmin defines the spatial resolution at which local obstacle density is evaluated in constrained waters, rather than directly prescribing a fixed safety clearance distance. Setting wmin equal to the vessel’s LOA, without an additional margin for beam or positioning uncertainty, ensures that density evaluation remains sensitive to obstacles at a spatial scale relevant to the vessel’s own footprint. The actual safety margin is not enforced by wmin as a hard constraint. Rather, it emerges from the risk-weighted cost function, in which R(x,y), computed using the window size w, is incorporated to penalize paths passing near high-density regions. As a result, the resulting paths maintain a substantially larger clearance distance than wmin itself.
Consequently, the dual-window strategy overcomes the limitations of fixed environmental analysis and provides a flexible decision-making framework that kinematically adapts to complex coastal waters, with both the switching threshold and the window sizes grounded in the vessel’s physical and maneuvering characteristics.
3.4. Kinematic A* Path Planning Algorithm
The proposed Kinematic A* algorithm is an effective path generation method that maintains the search efficiency of the conventional A* while integrating the physical turning characteristics of small coastal vessels with integral image-based spatial risk analysis. The key distinguishing features of this algorithm lie in the dynamic redefinition of the cost function and node expansion filtering based on kinematic constraints.
3.4.1. Cost Function with Integrated Risk Weight
While the cost function f(n) of the conventional A* algorithm considers only travel distance, this study incorporates the local obstacle density R(n) computed via the integral image as an additional navigational risk cost. The proposed cost function is as follows.
Although
g(
n) and
are measured in distance units while
R(
n) is a dimensionless index in [0, 1], the weight
wr functions as a dimensional scaling coefficient that converts the risk index into an equivalent distance-cost unit, following the general principle of weighted-sum scalarization commonly adopted in multi-objective A* formulations that combine distance and risk-based objectives, albeit with differing formulations of where and how the risk term is incorporated [
19]. This approach does not require
R(
n) to share the physical dimension of
g(
n) and
. Rather, it requires
wr to be calibrated such that the relative contribution of risk to the total cost reflects the intended safety-distance trade-off, which is empirically determined in
Section 4.2.
The g(n) is the cumulative travel distance from the start point, and h(n) is the heuristic function representing the Euclidean distance to the goal point. R(n) is the local risk index derived from Equation (6), and wr is the risk weight that adjusts the risk avoidance tendency according to the complexity of the surrounding environment and the vessel’s safety policy. The path generated through this formulation ensures a physical clearance distance from obstacles.
3.4.2. Kinematic Course Change Constraints and Node Expansion
To ensure the trackability of vessels at sea, kinematic constraints on the heading angle change are applied during the node expansion stage. The course change angle occurring when moving from the current node to the next candidate node must satisfy the condition expressed in Equation (10).
The
is the maximum allowable course change angle determined by the grid resolution and
Rmin. Specifically,
is geometrically derived from the requirement that the vessel’s turning trajectory between two adjacent grid nodes must not exceed its minimum turning radius
Rmin. Given a grid resolution
dcell, the straight-line distance d between two adjacent nodes corresponds to either
dcell for axis-aligned steps or
for diagonal steps. Treating this inter-node distance as the chord of an arc with radius
Rmin,
is obtained from the chord–radius relationship.
If a candidate node fails to satisfy this condition, it is considered a kinematically infeasible path and is removed from the open list through pruning. This filtering acts as a discrete, grid-level proxy constraint applied during node expansion, preventing excessively sharp heading changes from being admitted into the search space at the outset. However, satisfying at this stage constrains only the discrete node-to-node heading transitions of the raw search path and does not by itself guarantee that the final, B-spline-smoothed trajectory remains within the vessel’s minimum turning radius Rmin, since course change angle and physical turning radius are governed by distinct geometric quantities, the former depending only on heading deviation, and the latter jointly on heading deviation and the distance over which it occurs. Accordingly, the physical kinematic feasibility of the final trajectory is verified through direct curvature analysis of the smoothed path, rather than through the node-level constraint alone.
Regarding search direction resolution, the conventional 8-direction search has difficulty securing valid nodes that satisfy the kinematic threshold due to its coarse angular resolution of 45° per step. Accordingly, this study adopts a 16-direction search expansion that provides a finer angular resolution of approximately 22.5° per step. This functions as the engineering effective resolution that ensures compliance with kinematic constraints while maintaining search flexibility.
3.4.3. Algorithmic Framework and Optimization
The proposed algorithm is combined with the Adaptive Dual-Window Risk Field Strategy described in
Section 3.3, and computational efficiency is achieved through the following two mechanisms.
Computational Load Offset: While the 16-direction search increases node expansion cost compared to the 8-direction search, this is partially offset by the O(1) risk computation of the integral image.
Dynamic Search Resolution Control: Through the adaptive window, search speed is accelerated in low-obstacle-density waters, while precise 16-direction search is performed in complex waters, maintaining an effective balance between search success rate and route quality.
As a result, the Kinematic A* algorithm overcomes the limitations of conventional approaches that lack kinematic plausibility and supports a path planning solution applicable to real operational environments.
3.5. Path Smoothing and Geometric Optimization
The initial path derived by the Kinematic A* algorithm retains discontinuous curvature changes at waypoints due to the discrete nature of grid-based search. Such curvature discontinuities induce abrupt mechanical loads on the vessel’s steering system and exacerbate tracking errors. To address this, the extracted set of waypoints is defined as control points
Pi, and path smoothing using cubic B-spline is applied as expressed in Equation (12).
The Ni,3 is the cubic B-spline basis function. Since cubic B-spline mathematically guarantees C2 continuity over the entire curve, it mitigates abrupt changes in rate of change of acceleration during vessel course changes and reduces the mechanical load on the steering system. In this study, the local control property of cubic B-spline enables precise path correction in complex coastal waters while maintaining the stability of the overall track.
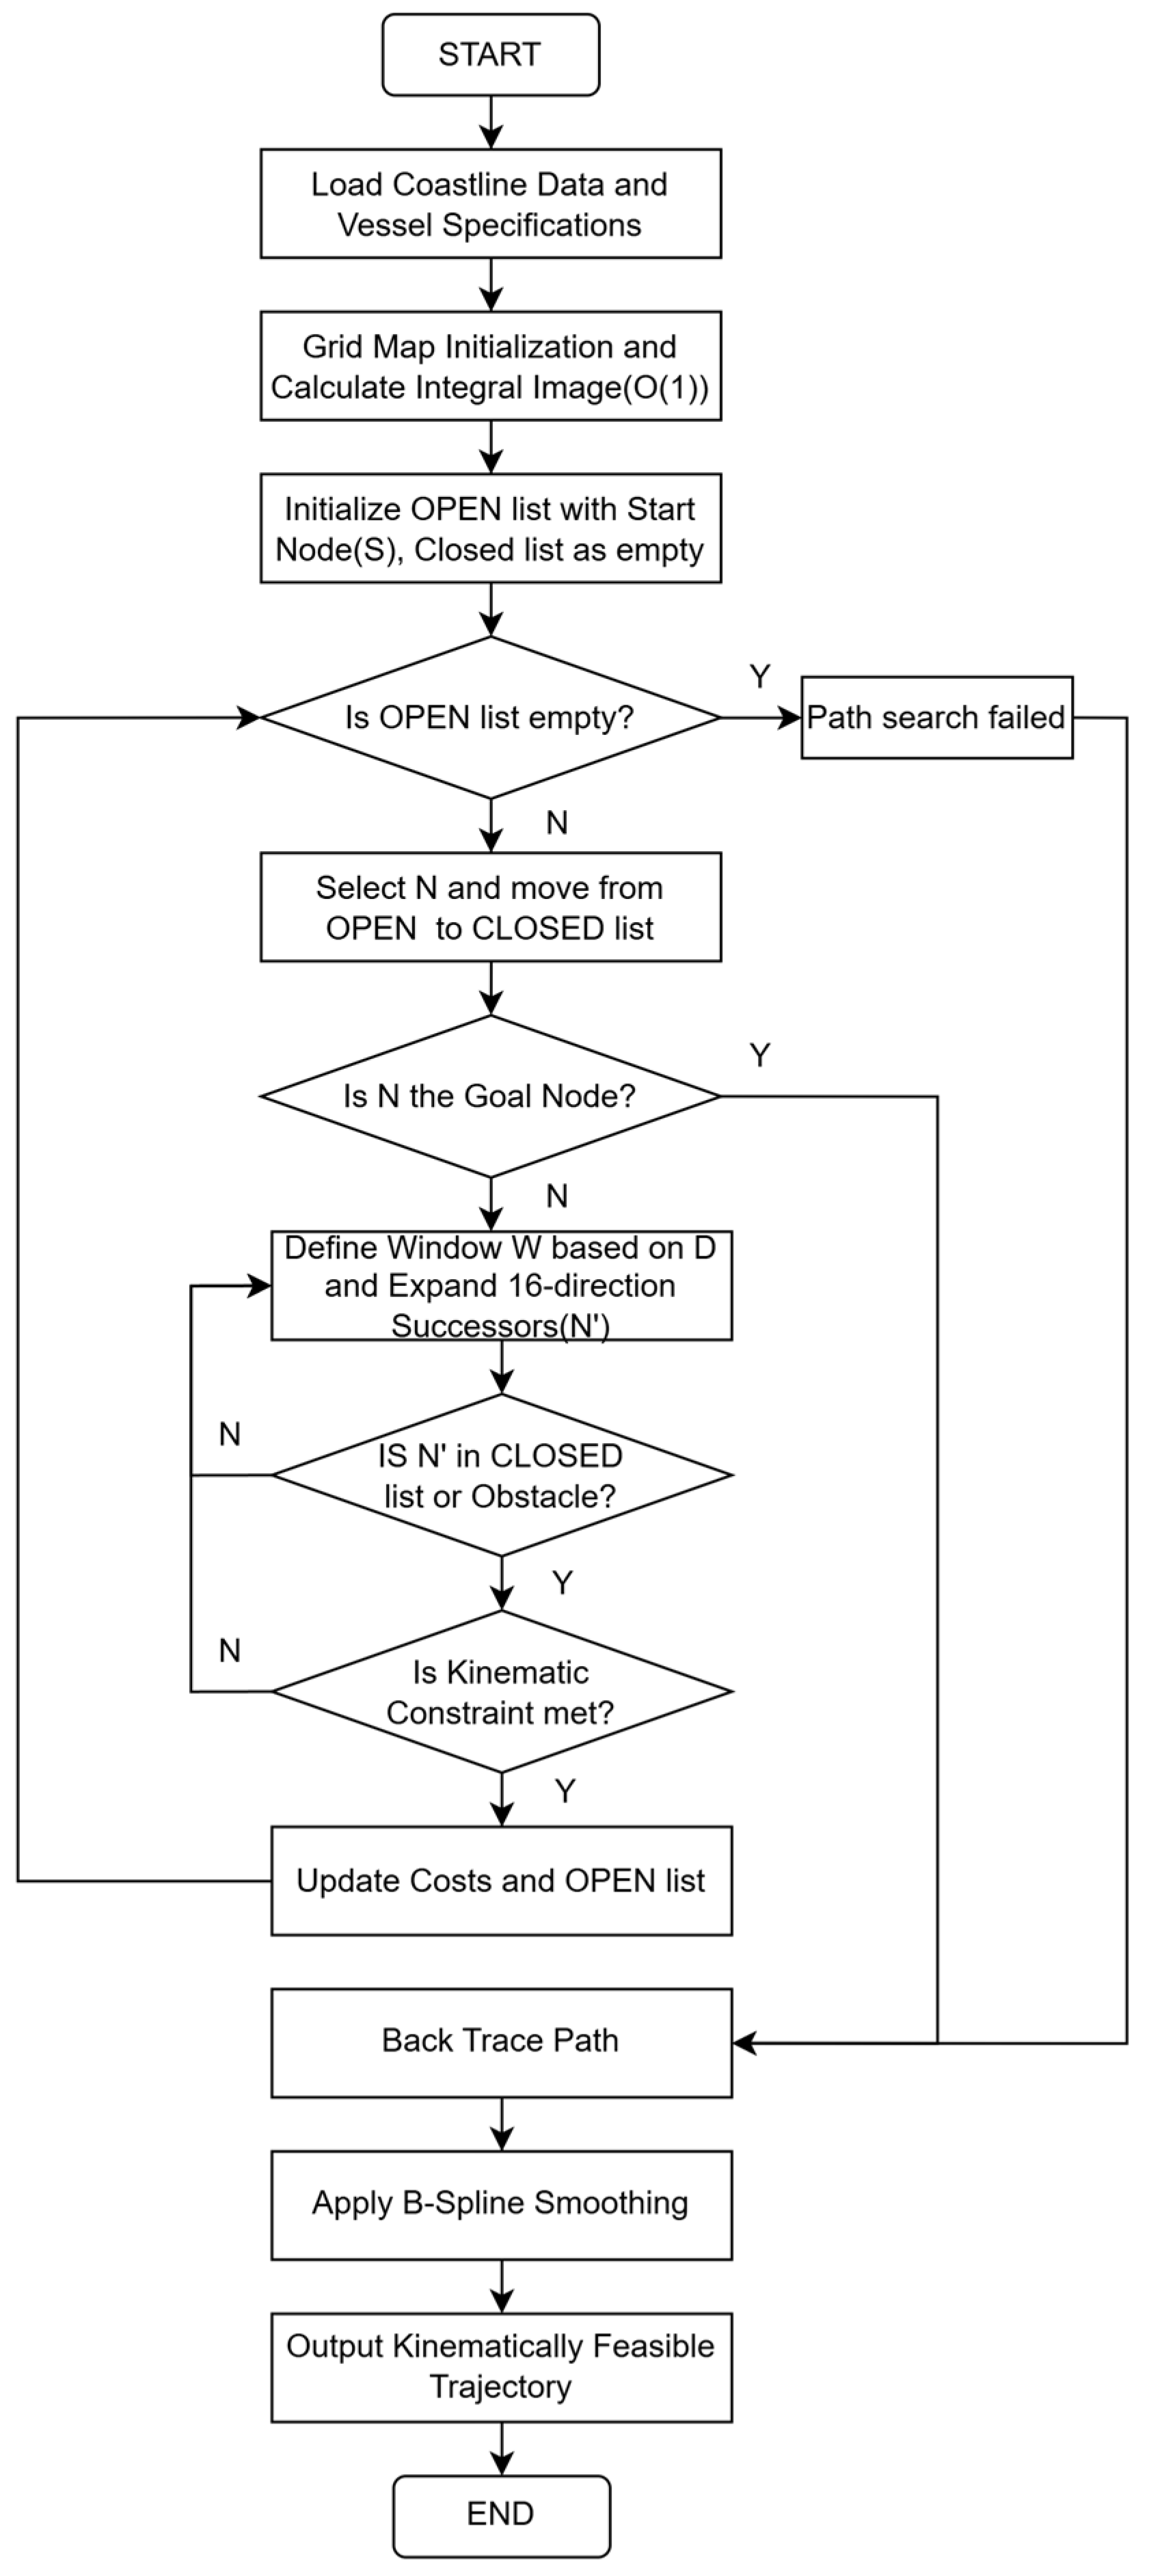
The proposed integrated framework generates the final navigation route through the unified process illustrated in
Figure 4. The system performs the Adaptive Dual-Window strategy based on the pre-computed integral image and verifies topographic validity and kinematic constraints during the node expansion stage. The discrete waypoints subsequently derived are then converted into the final track with guaranteed continuity through cubic B-spline smoothing.
4. Case Studies and Result Analysis
4.1. Simulation Environment and Data Configuration
To conduct comparative experiments for the proposed algorithm, a simulation environment was constructed using coastline data of waters near Mokpo–Sinan, Republic of Korea. This navigational area features complex topographic characteristics, including narrow waterways and densely distributed islands of varying sizes, providing a suitable environment for testing path planning algorithms for small coastal fishing vessels.
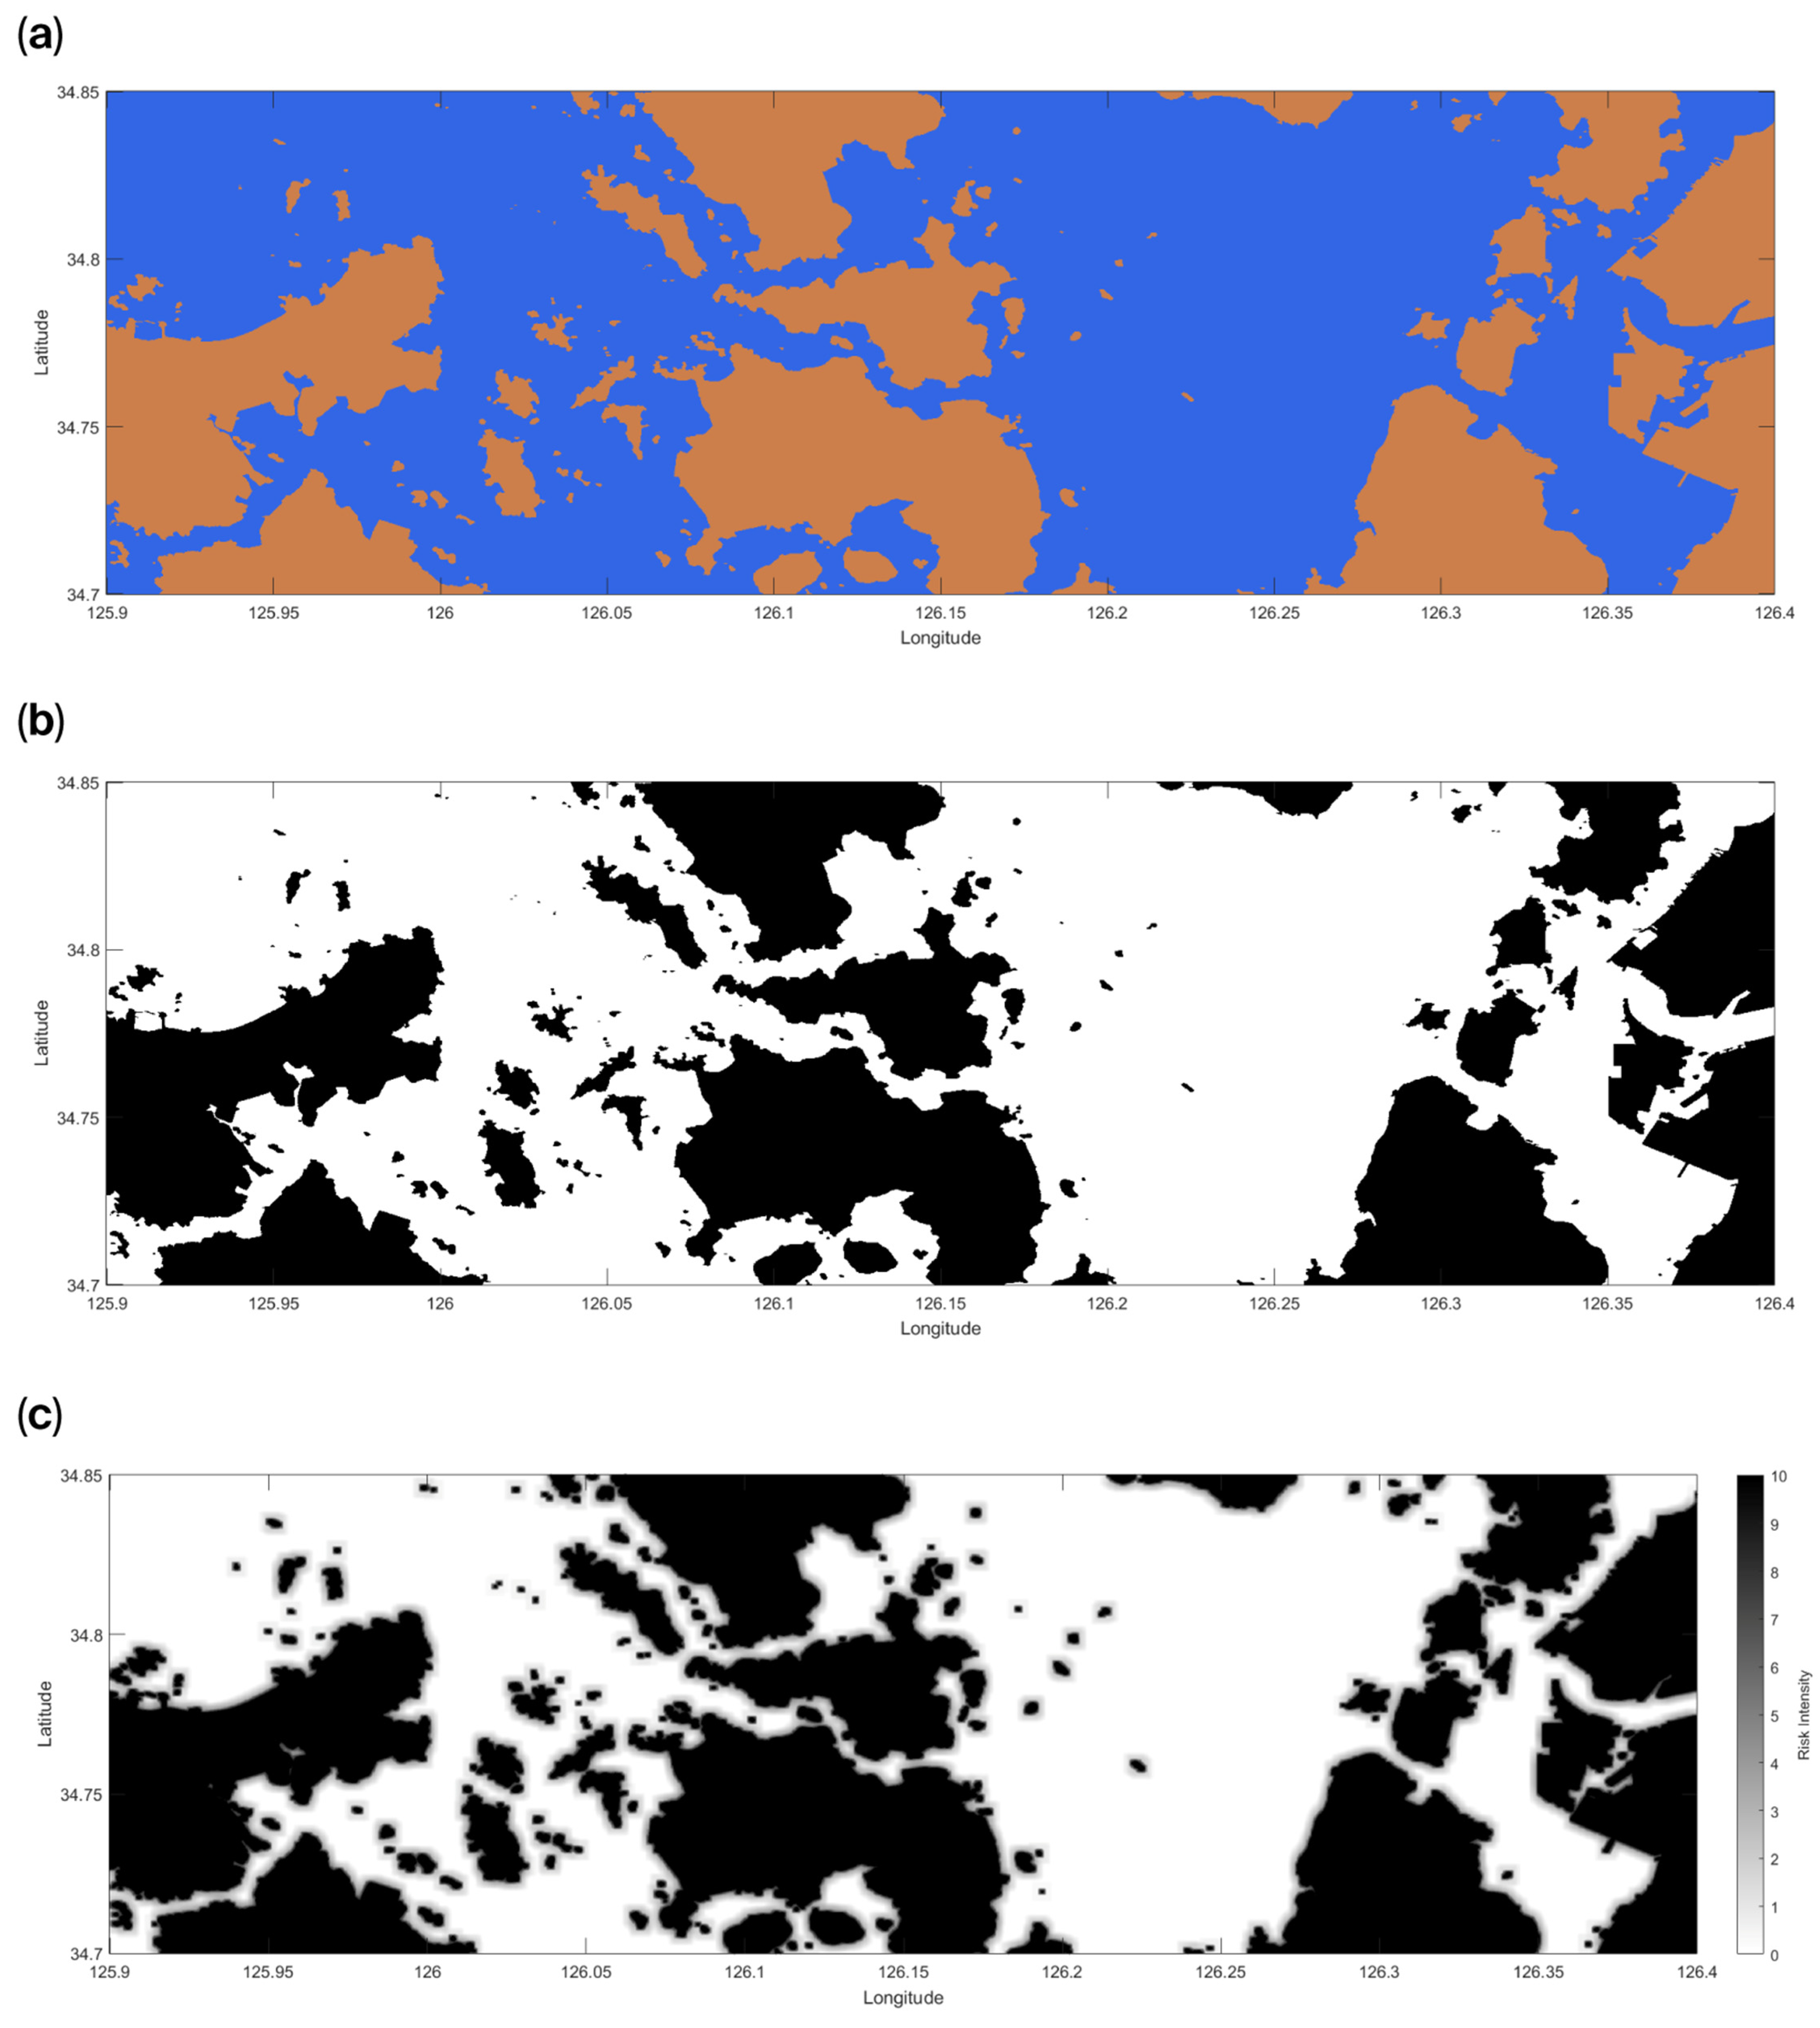
As shown in
Figure 5a, land and sea areas were delineated from the coastline data, and the map was then binarized as shown in
Figure 5b to generate an 832 × 2279 grid with a physical resolution of 20 m per grid cell. This resolution was selected based on the vessel’s minimum turning radius
Rmin, which is consistent with established practice in maritime grid-based path planning, where
Rmin is adopted as the criterion for grid size to reflect its maneuvering characteristics [
37]. At this resolution,
Rmin spans approximately 2.5 grid cells, allowing the kinematic course-change constraint (Equations (10) and (11)) to meaningfully resolve the vessel’s turning behavior. A coarser resolution would compress this constraint into too few cells to represent gradual curvature, while a substantially finer resolution would increase computational cost without a proportional benefit to kinematic fidelity.
Based on the generated binary occupancy grid map, an integral image map was constructed as shown in
Figure 5c. This serves as the foundational data for computing the risk density for each vessel specification at a computational complexity of
O(1). In terms of the actual computational cost associated with this construction, the one-time integral image construction (Equation (4)) required 0.0061 s, and the subsequent risk field precomputation across the entire grid required 0.0344 s, both measured separately from the A* search time.
All experiments were conducted on a system equipped with an Intel Core i7 CPU, Windows 11 Pro 64-bit operating system, NVIDIA GeForce RTX 4070 Laptop GPU, and MATLAB R2024a. The model vessel was selected from the next-generation standard fishing vessel designs, specifically a multi-purpose fishing vessel representing approximately 40% of registered coastal fisheries in Korea. The principal parameters are listed in
Table 2.
4.2. Weight Selection via Pareto Optimization
The risk weight
wr defined in Equation (9) is a key parameter that determines the balance between route safety and navigational economy. To derive the optimal
wr, a sensitivity analysis was conducted to quantitatively evaluate the system response to variations in the risk weight, and the Pareto optimal point was identified based on the trade-off between navigational distance and risk exposure.
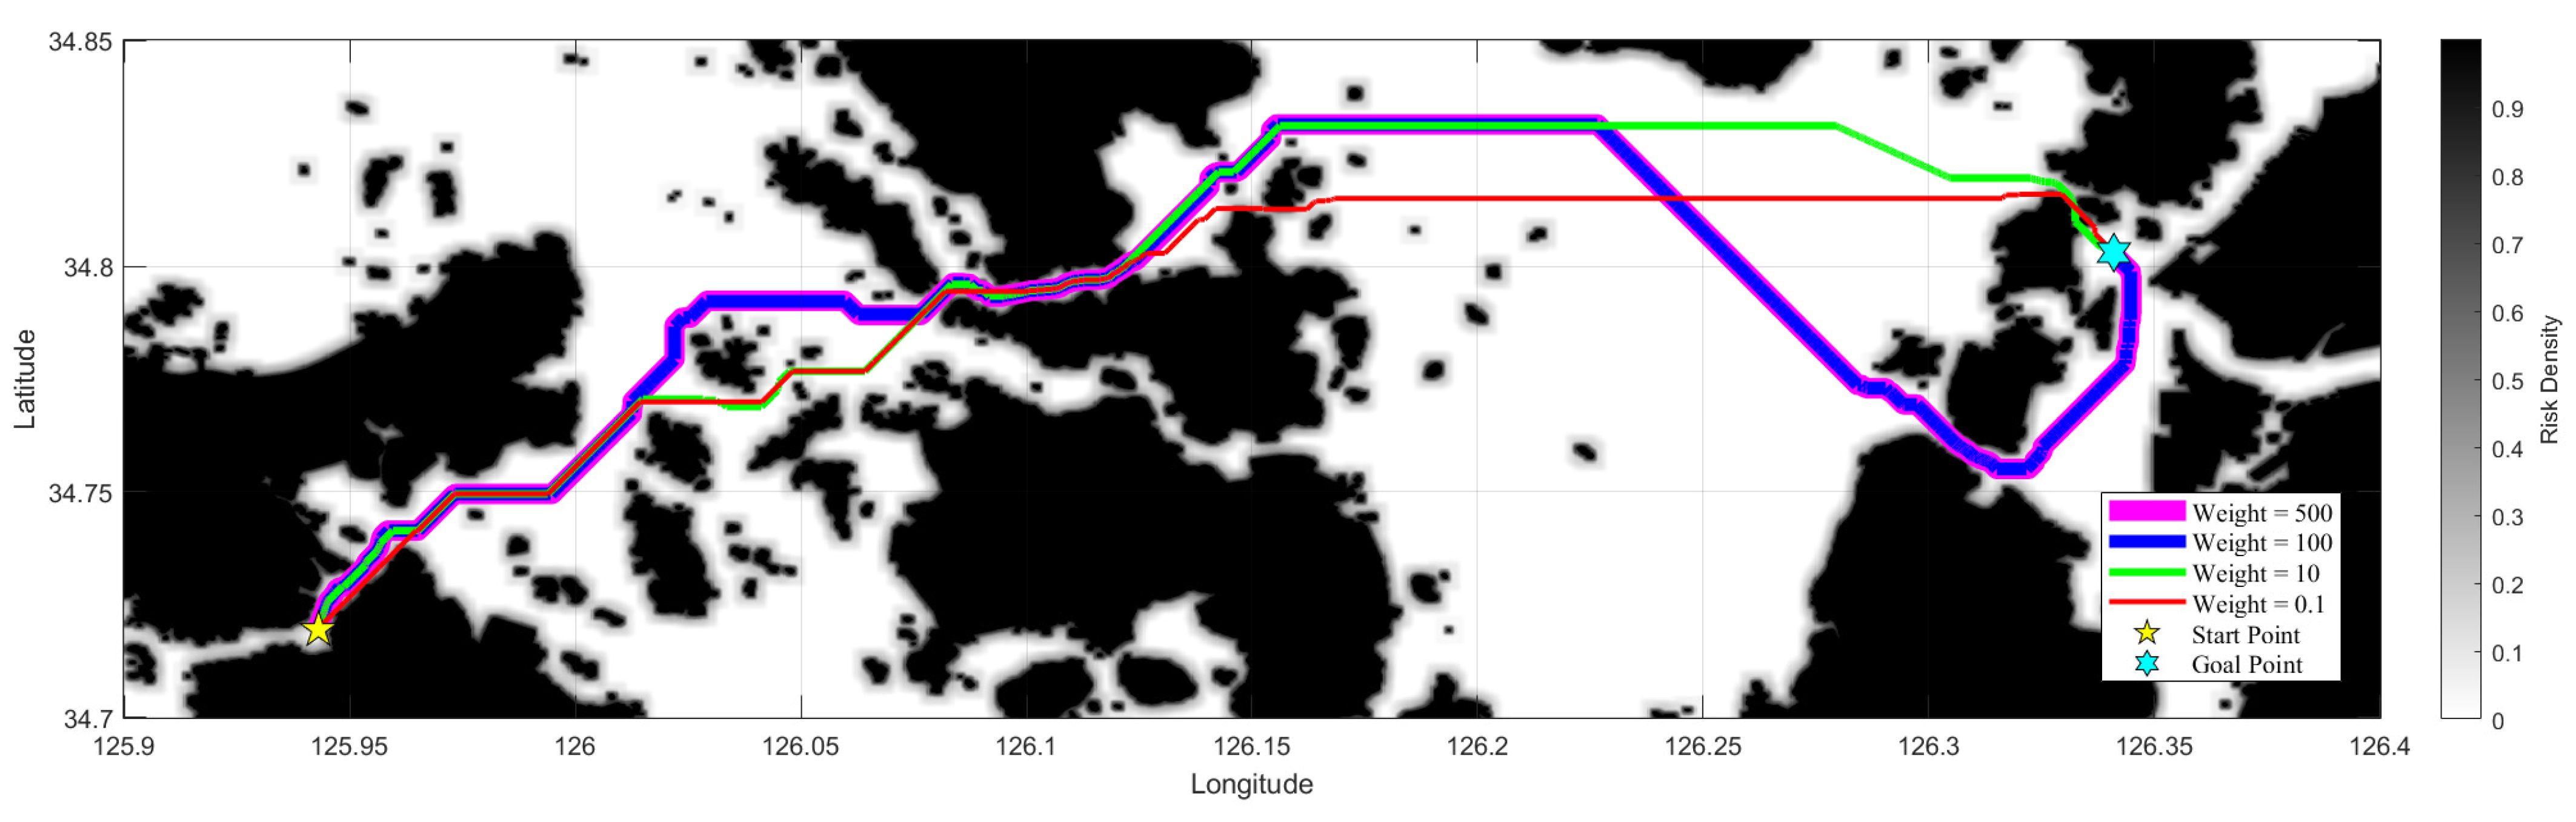
Figure 6 presents a comparison of the trajectories of four paths generated under different risk weights, with identical departure and arrival conditions.
From visual analysis, when
wr = 0.1 and 10, the distance cost to the goal point dominated over the risk penalty, resulting in shortest paths that adhered extremely closely to land boundaries. However, as the weight increased to
wr = 100, a clear trend was observed in which the path progressively experienced repulsion from topographic hazards and shifted away from land. In particular, the paths for
wr = 100 and 500 formed nearly identical trajectories over most segments, indicating that the safety margin achievable under the narrow waterway and topographic constraints of the navigational area had already reached its optimal value. To numerically verify the visually confirmed path variations, the key performance indicators extracted for each risk weight are summarized in
Table 3.
Quantitative analysis confirmed a typical trade-off relationship in which navigation distance increases, but the potential risk exposure to obstacles decreases sharply as the risk weight increases. When the weight increased from 0.1 to 100, the average risk index Ravg along the path improved by approximately 79%, from 0.8227 to 0.1724. However, with an excessive increase from 100 to 500, the improvement in risk exposure was only 0.4%, from 0.1724 to 0.1716, while the navigation distance extended by 0.8%, from 52.93 km to 53.35 km. Consequently, wr = 100, at which the efficiency of securing safety clearance distance is maximized, was selected as the Pareto optimal point and adopted as the standard risk weight for all subsequent comparative experiments.
To further verify the robustness of
wr = 100 as the Pareto optimal point, an additional sensitivity analysis was conducted at
wr = 50, 100, 150, and 200, while all other conditions were held identical to the original analysis. The key performance indicators extracted for each risk weight are summarized in
Table 4.
The results confirm that wr = 100 corresponds closely to the point at which the rate of risk improvement sharply declines. Increasing wr from 50 to 100 reduced the average risk index by 7.4% from 0.1861 to 0.1724 at a cost of only a 0.2% increase in navigation distance, whereas further increasing wr from 100 to 200 yielded only marginal additional risk reduction despite continued marginal increases in distance. This confirms wr = 100 as the point beyond which additional risk weighting no longer provides a proportionate safety benefit, consistent with, and providing finer-grained support for, the Pareto optimal point identified in the broader sensitivity analysis.
4.3. Comparative Analysis and Quantitative Results
In this section, comparative simulations were conducted under identical scenarios against existing path search models to demonstrate the superiority of the proposed model with the optimized risk weight applied.
Path 1 (conventional A*): A shortest-distance-oriented model that does not consider topographic risk.
Path 2 (Static Buffer Path): A model that applies a static boundary zone around obstacles.
Path 3 (Proposed Method): A context-adaptive path planning model that quantifies the risk density of the entire navigational area using the integral image technique and dynamically incorporates it into the cost function of the A* algorithm.
Simulations were conducted for identical departure and destination points within the navigational area, and the path generated by each algorithm was analyzed. The simulation results showed that each model exhibited different behavioral responses to topographic hazards, depending on the characteristics of its designed cost function and constraints. This implies that under unexpected external forces or vessel maneuvering errors in actual maritime environments, grounding accidents may occur, indicating that the theoretical shortest path fails to overcome its inherent limitations as a coastal navigation route.
Conventional A* (Path 1, red dashed line) optimized only the geometric shortest distance without any consideration of safety clearance distance, resulting in trajectories that adhered extremely closely to land boundaries when passing through island protrusions and narrow coastal waterways. This formed a minimum clearance distance of approximately 20 m, corresponding to the limit of the grid resolution, confirming that such a trajectory cannot guarantee vessel safety when leeway occurs due to tidal currents or rough seas during actual operations.
Static Buffer Path (Path 2, green solid line) reduced the grounding risk of Conventional A* by applying a static guard zone of 100 m. However, it exhibited rigid behavior, remaining fixed along the boundary of the binary obstacle expansion regardless of topographic complexity. In particular, abrupt deflections occurred along the safe contour boundary in sections where the waterway narrowed, demonstrating that the path passively complied with constraints rather than actively avoiding the risk gradient of the terrain. The 100 m Static buffer radius was selected based on the IMO maneuvering safety criterion introduced in
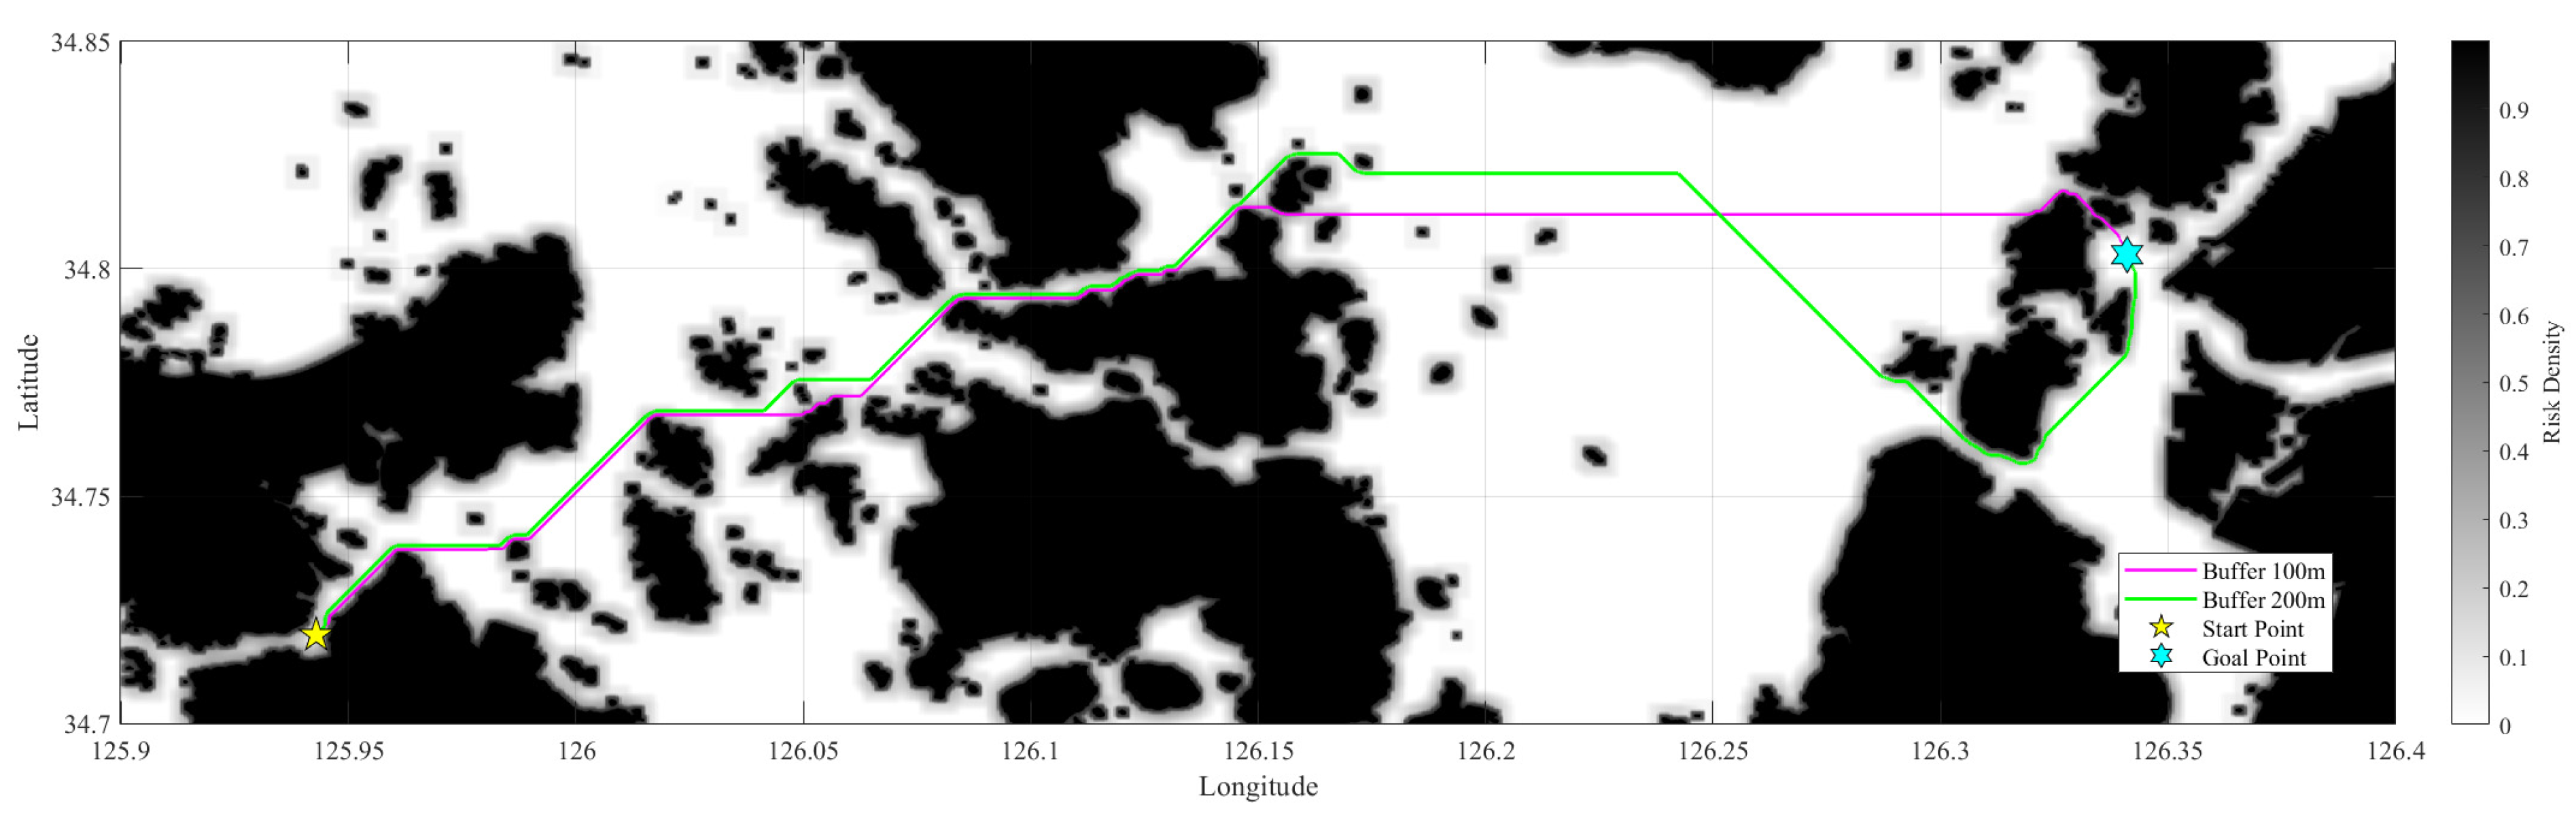
Section 3.1, where the tactical diameter limit of 5×LOA, 98.9 m for the 19.78 m model vessel, defines a standards-based minimum safety clearance for vessel maneuvering. To examine the sensitivity of this choice, the static buffer radius was additionally tested at 200 m and 300 m under the same departure and arrival conditions as shown
Table 5.
A radius of 200 m remained feasible, whereas 300 m resulted in complete search failure. As shown in
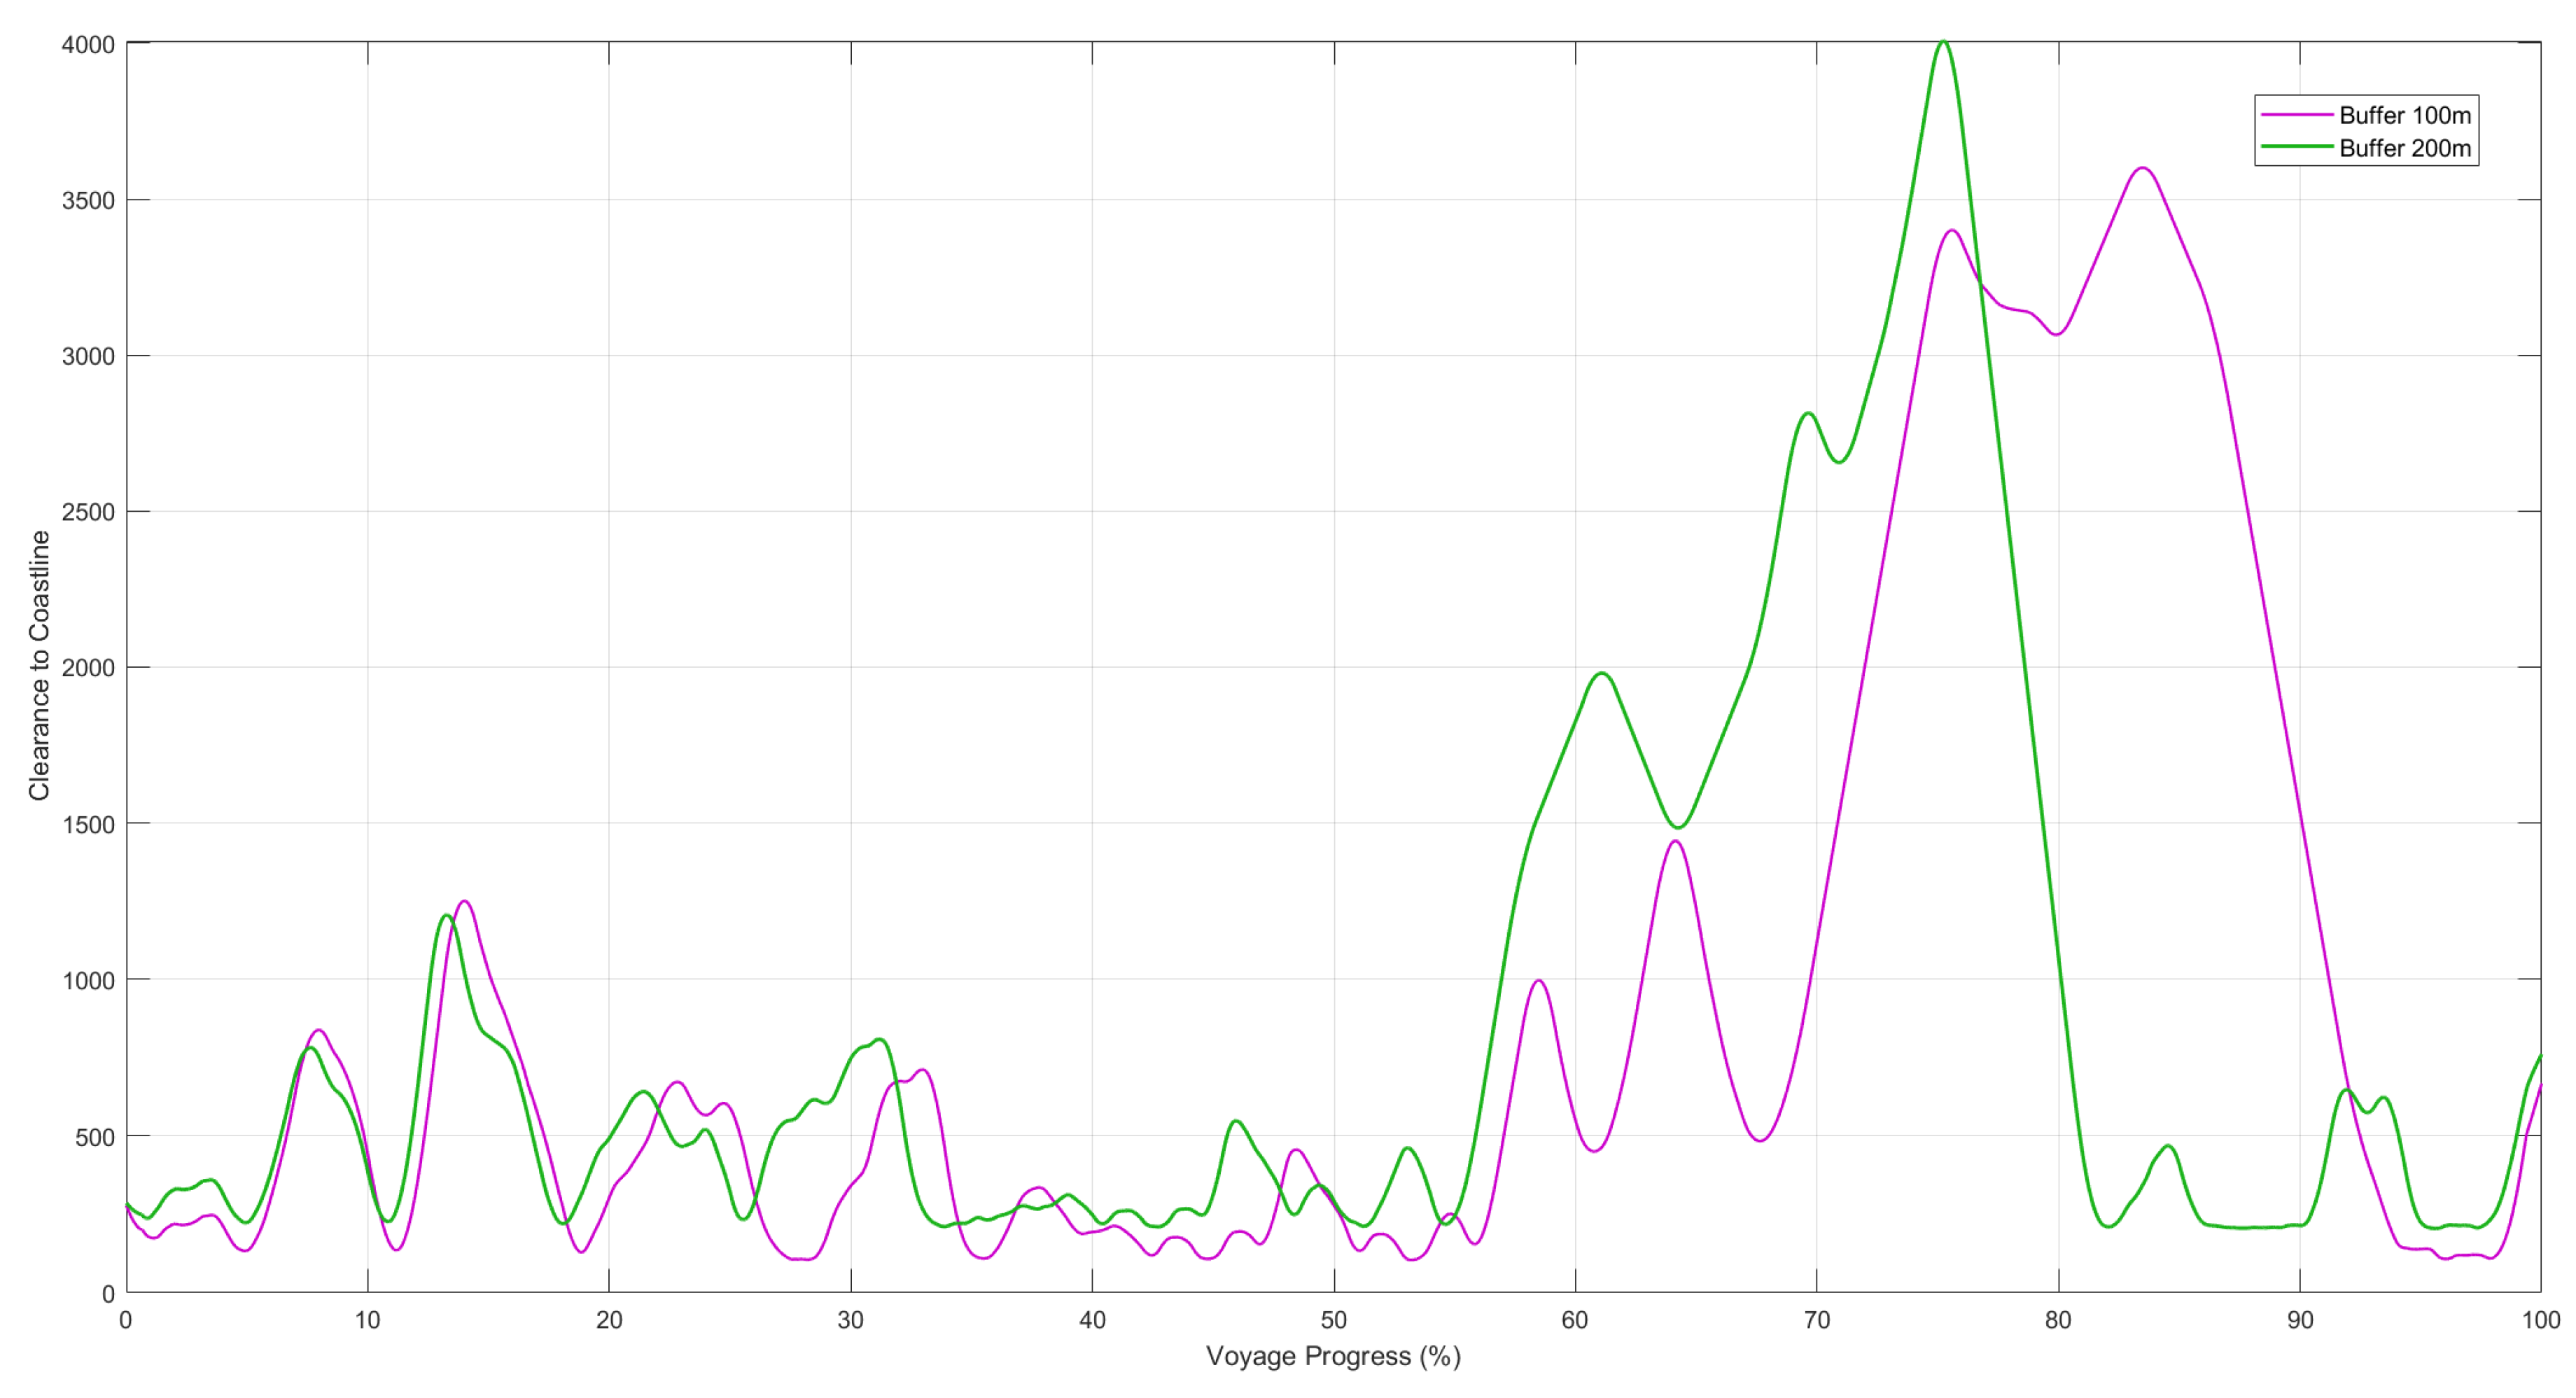
Figure 7, the 200 m buffer produces a markedly different trajectory within the longitude range of 126.15°E to 126.32°E, where the path deviates substantially southward to maintain clearance from a cluster of small islands before rejoining the 100 m trajectory near the destination.
Figure 8 illustrates the clearance distance to the nearest coastline as a function of voyage progress for both successfully planned routes under the 100 m and 200 m static buffer configurations.
This divergence increased the total path length from 42.55 km to 49.54 km, despite both buffer settings producing a feasible route. These results indicate that a 100 m static buffer is sufficient to generate a feasible route in this navigational area, though it is not the only viable radius. Doubling the buffer to 200 m still produced a feasible route but increased the path length by 16.4%, indicating that clearance beyond 100 m adds route cost without changing the feasibility outcome. The 100 m radius was therefore adopted as a representative baseline reflecting current regulatory practice, rather than as an arbitrarily tuned parameter.
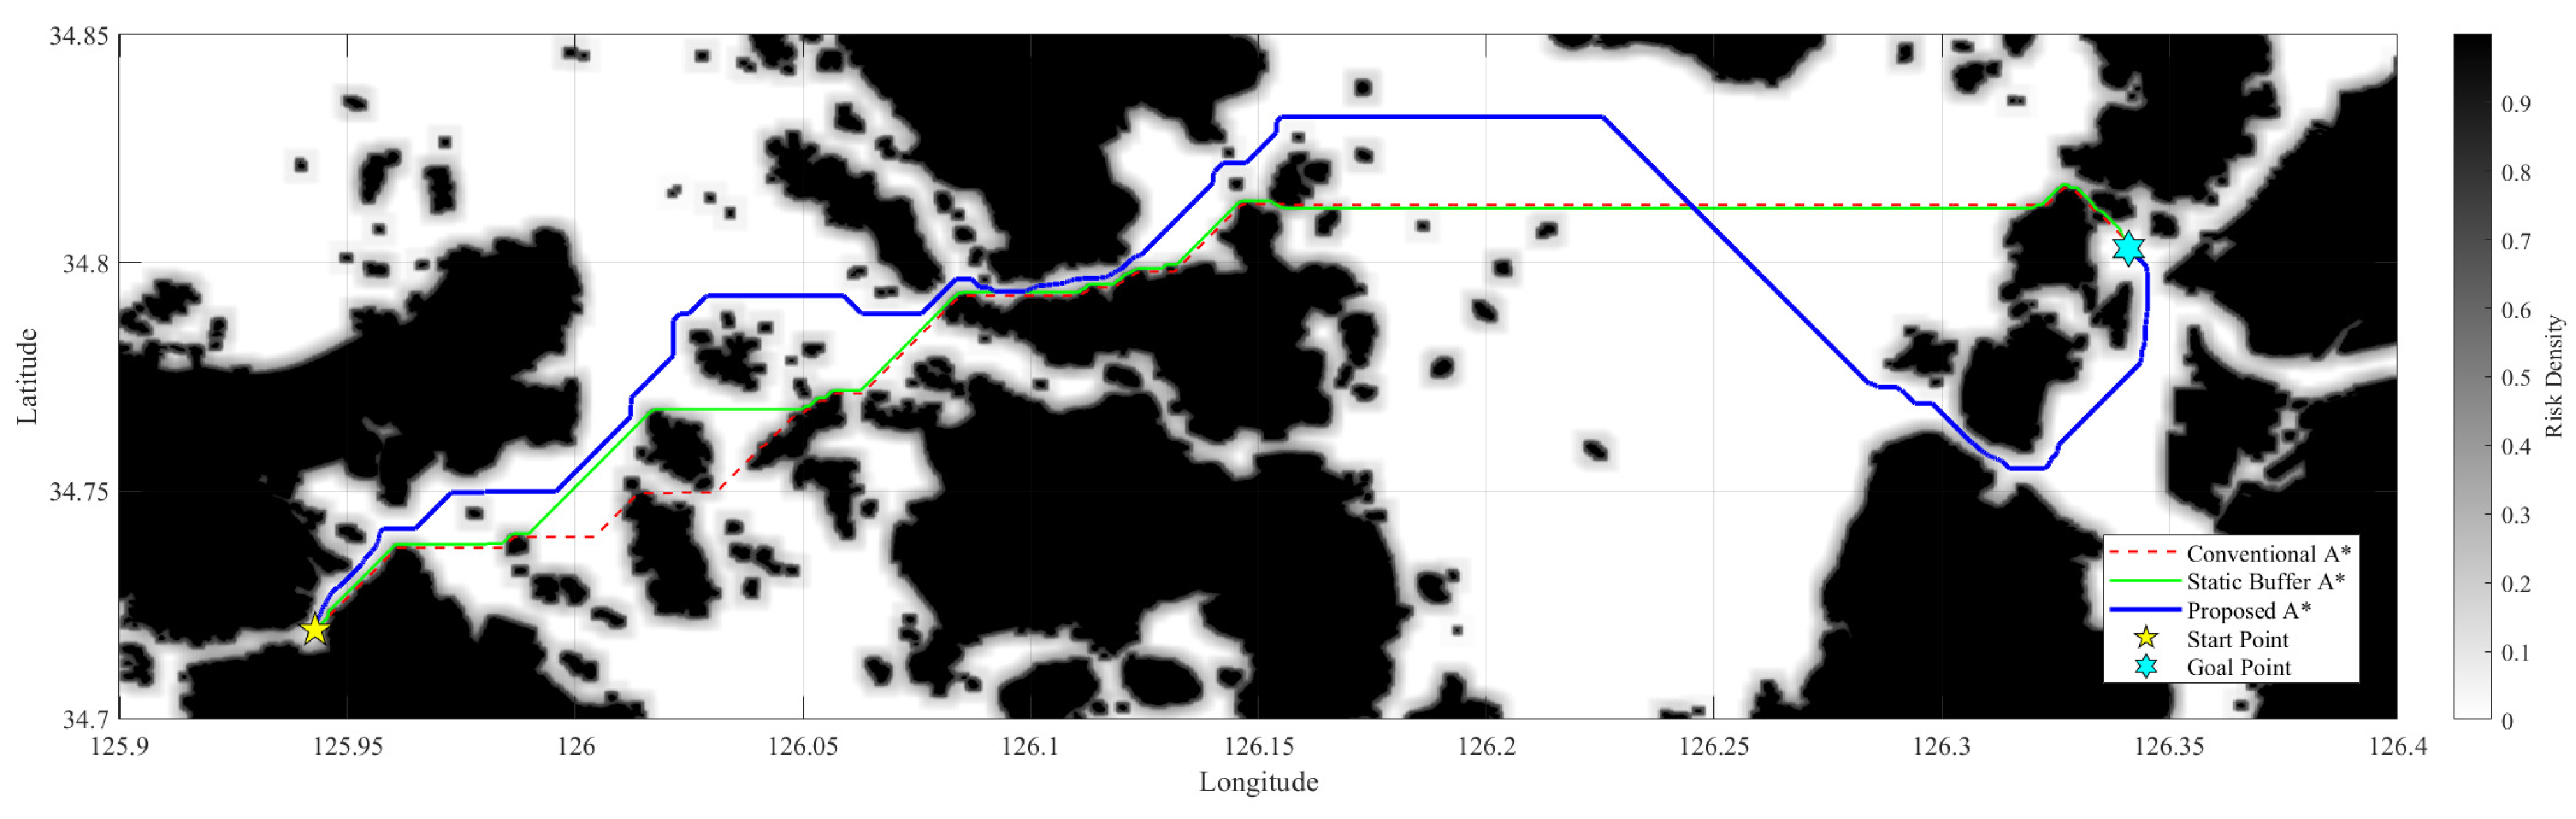
In contrast, the Proposed Method (Path 3, blue solid line) generated a spatially adaptive safety-aware route through the integral image-based risk field. The key distinguishing feature of this algorithm is that, beyond simple binary obstacle avoidance, the obstacle density gradient of the entire navigational area is analyzed to identify open-water safety corridors. As observed in
Figure 9, unlike Conventional A* and Static Buffer Path, which navigate close to the coast to minimize travel distance, the proposed model follows the trajectory at which cumulative risk energy is minimized. Even in environments where physical bathymetric data are unavailable, this effectively guides the route toward low-risk zones by securing sufficient clearance distance from the coastline. As a result, the proposed model maintains a relatively safer trajectory even in narrow waterway sections, securing a sufficient safety margin against unexpected environmental external forces while reflecting clearance distances from a navigational safety perspective.
To demonstrate the superiority of the proposed algorithm, a quantitative comparative analysis was performed across three path models. The comparison metrics included computation time, number of expanded nodes, path length, minimum clearance distance, and average clearance distance. The statistical data derived from the simulations are summarized in
Table 6.
Quantitative analysis showed that the proposed model achieved a minimum clearance distance of 238.32 m, representing an improvement of approximately 138.32% over the static buffer method, and an average clearance distance of 1038.3 m, representing an improvement of approximately 12.0% over the static buffer method. These safety gains, however, were accompanied by increased computational cost. The proposed model required 0.78 s of computation time, approximately 2.0 times longer than the conventional A* and static buffer A* methods, and it expanded approximately 2.0 times more nodes. The resulting path length also increased to 52.93 km, approximately 25% longer than the conventional A* and static buffer A*. This trade-off reflects the additional search density and area-based risk evaluation required to secure wider safety margins and indicates that the proposed method prioritizes navigational safety over raw computational efficiency or shortest-path optimality.
Nevertheless, the proposed algorithm improves overall path planning safety in complex maritime environments, generating routes appropriate for vessel navigation, and overcomes the local minimum problem and boundary-adjacent navigation problem that existing methods failed to resolve. The path secured through this risk model is subsequently refined into a geometrically optimized curve through the smoothing stage described in the following section.
4.4. Narrow-Channel Adaptability Test
To further evaluate the algorithm adaptability under a topographically extreme condition, an additional case study was conducted across the Myeongnyang Strait (Uldolmok), a narrow channel located between Jindo and the Haenam Peninsula. This strait represents one of the most constrained navigable passages along the southwestern coast of Korea and provides a rigorous test of the dual-window adaptive strategy described in
Section 3.3, as well as a direct comparison with the node-optimization-based approach of Liu et al. [
34].
A sensitivity sweep of the static buffer radius was conducted at four levels under identical departure and arrival conditions spanning the strait. As summarized in
Table 7, the static buffer method exhibited a sharp feasibility threshold consistent with the limitation discussed above. Buffer radii of 100 m and 120 m produced feasible routes with minimum clearances equal to the applied buffer values, whereas buffer radii of 140 m and 160 m resulted in complete search failure. In the failed cases, the algorithm was required to exhaustively expand the entire reachable region before terminating without a solution, resulting in approximately 2.5 times more node expansions and roughly twice the computation time compared with the successful cases.
This result quantitatively confirms that the static buffer method does not merely degrade in performance as the dilation radius increases but instead exhibits a hard feasibility boundary determined by the physical width of the strait. Once the buffer radius approaches half the channel width, the binary obstacle expansion eliminates all navigable grid cells along the strait, renderi ng the routing problem entirely infeasible irrespective of computational effort. Furthermore, failed trials incurred a higher computational cost than successful ones, since infeasibility could only be confirmed after the entire reachable search space had been exhausted.
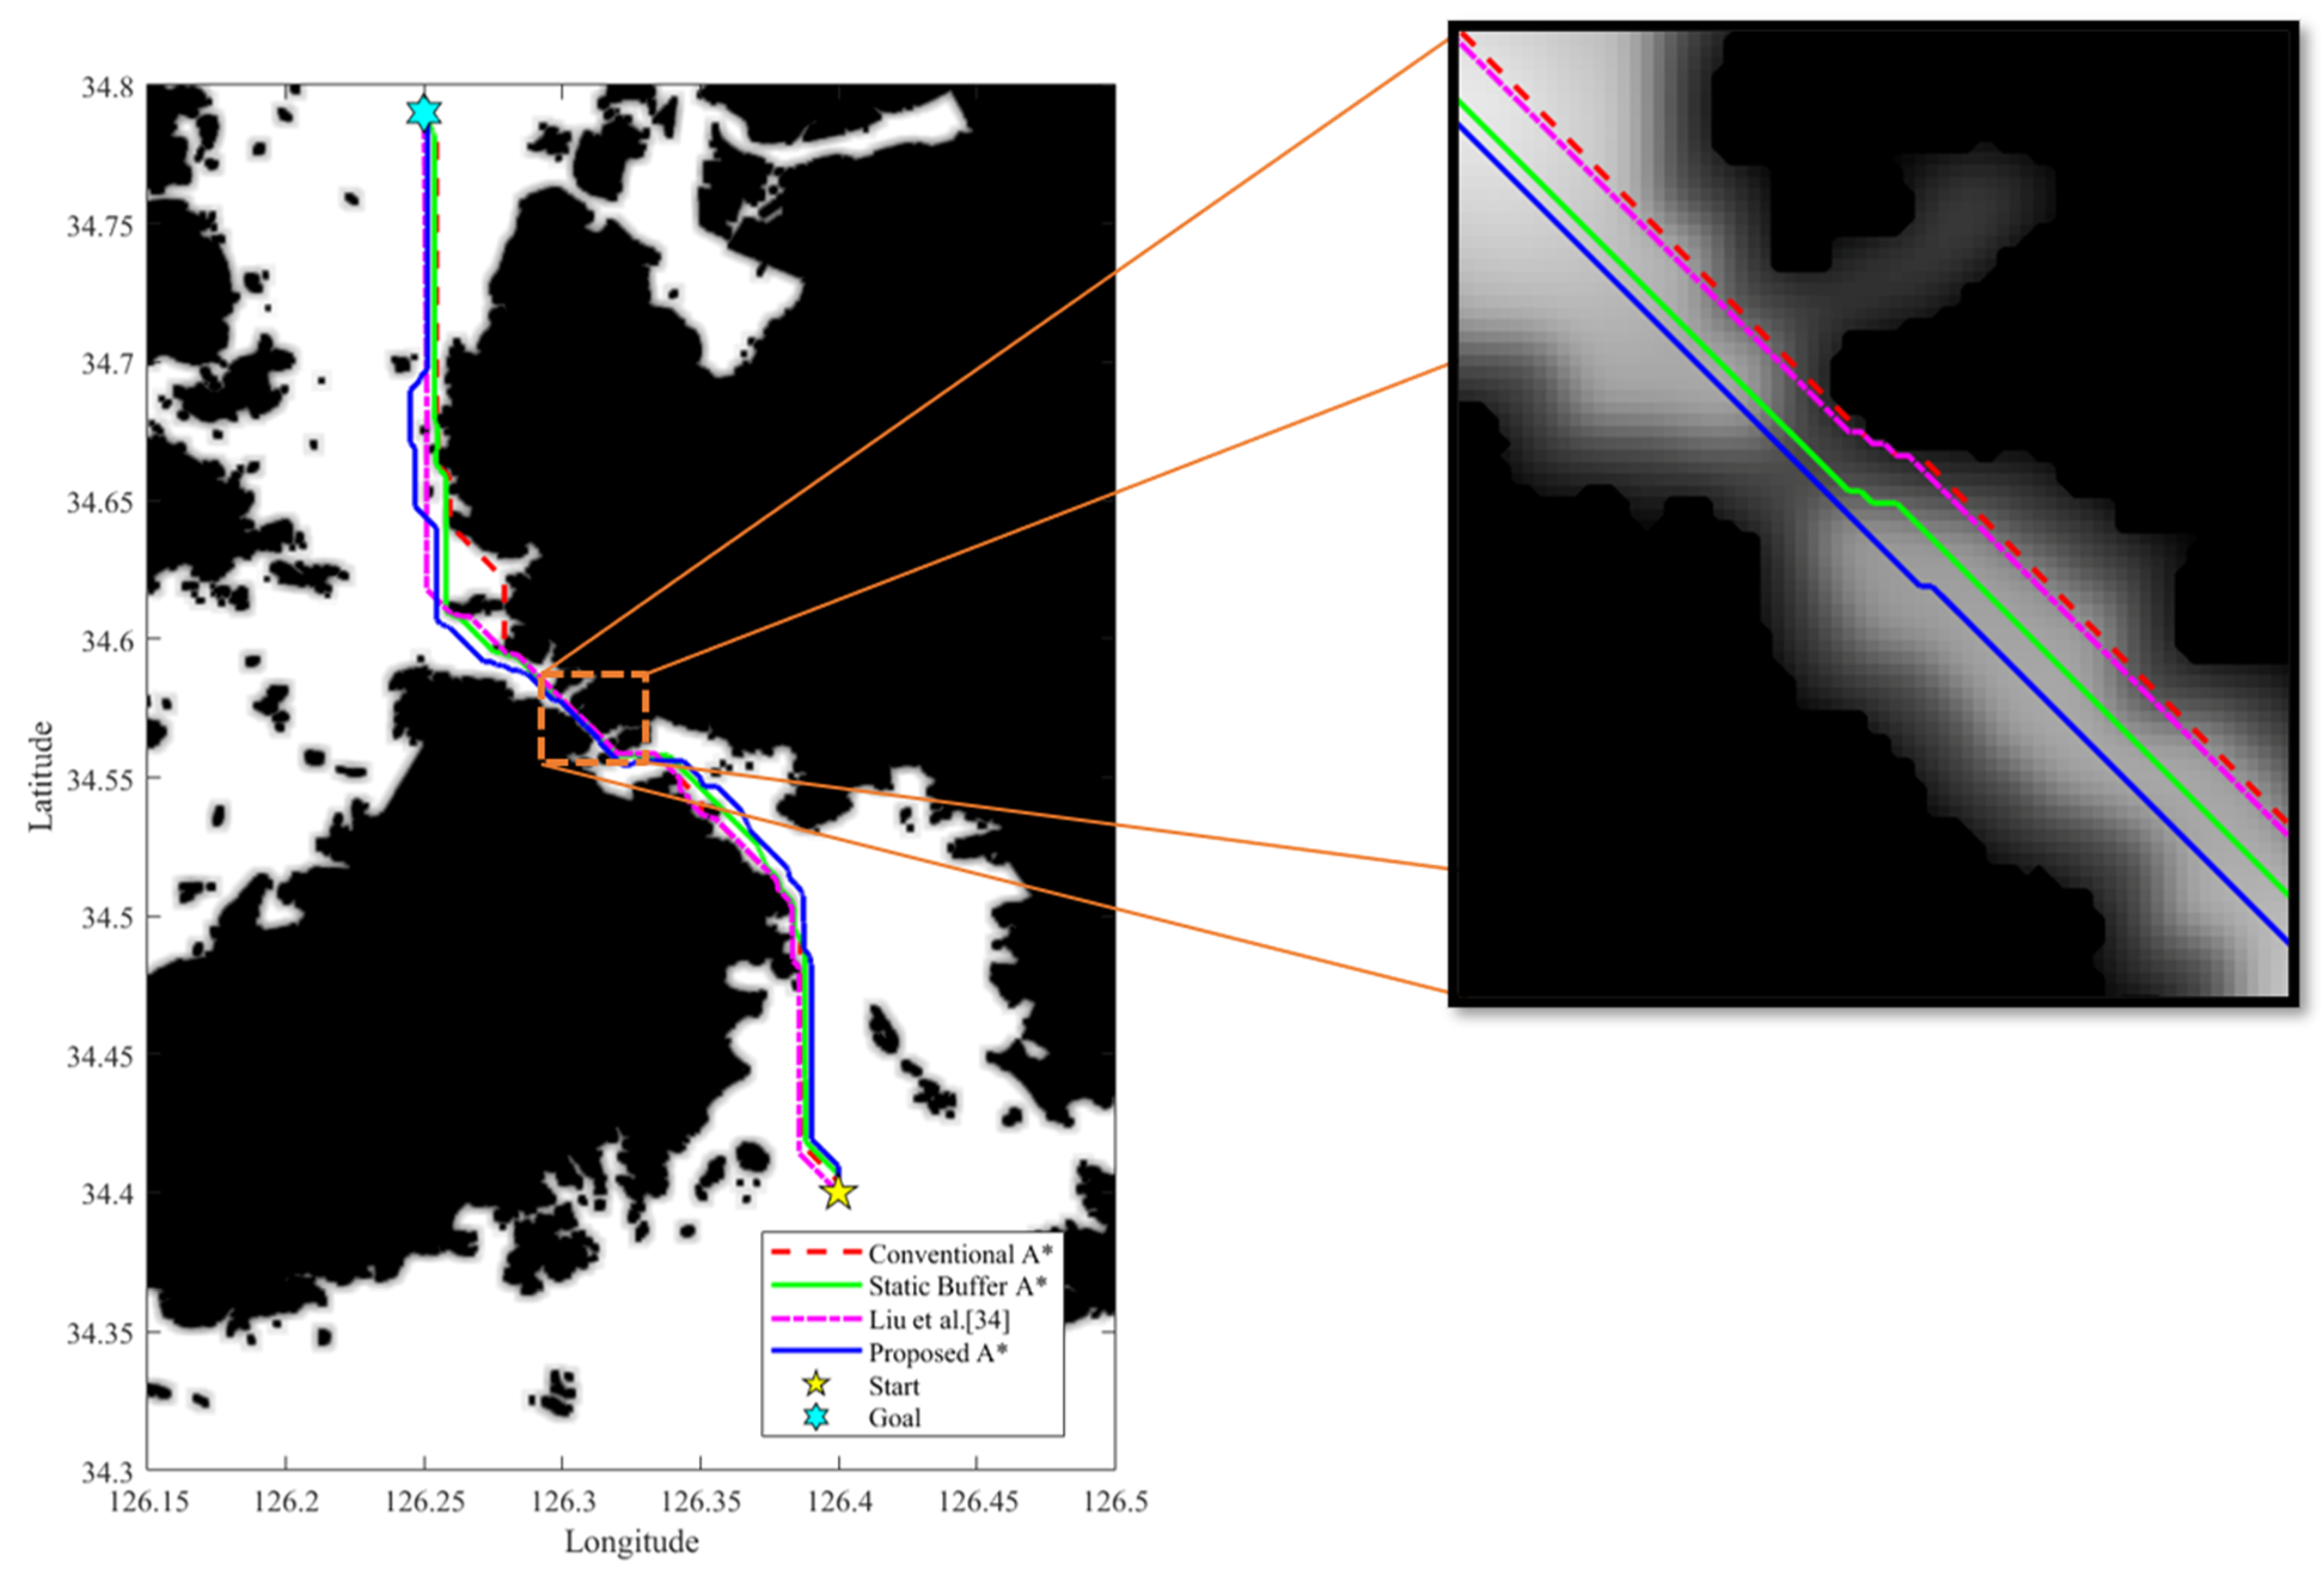
To benchmark the proposed framework against this rigid behavior, a four-way comparison was conducted under identical departure and arrival conditions spanning the strait, comprising the conventional A* algorithm, the static buffer method, the dangerous-node avoidance method with collinearity-based node optimization proposed by Liu et al. [
34], and the proposed integral image-based risk-weighted A*. The results are summarized in
Table 8 and illustrated in
Figure 10.
Table 8 presents the quantitative comparison of all four methods across the same channel, evaluated in terms of computation time, the number of expanded nodes, path distance, minimum clearance, and average clearance.
Among the four methods, the dangerous-node avoidance method of Liu et al. [
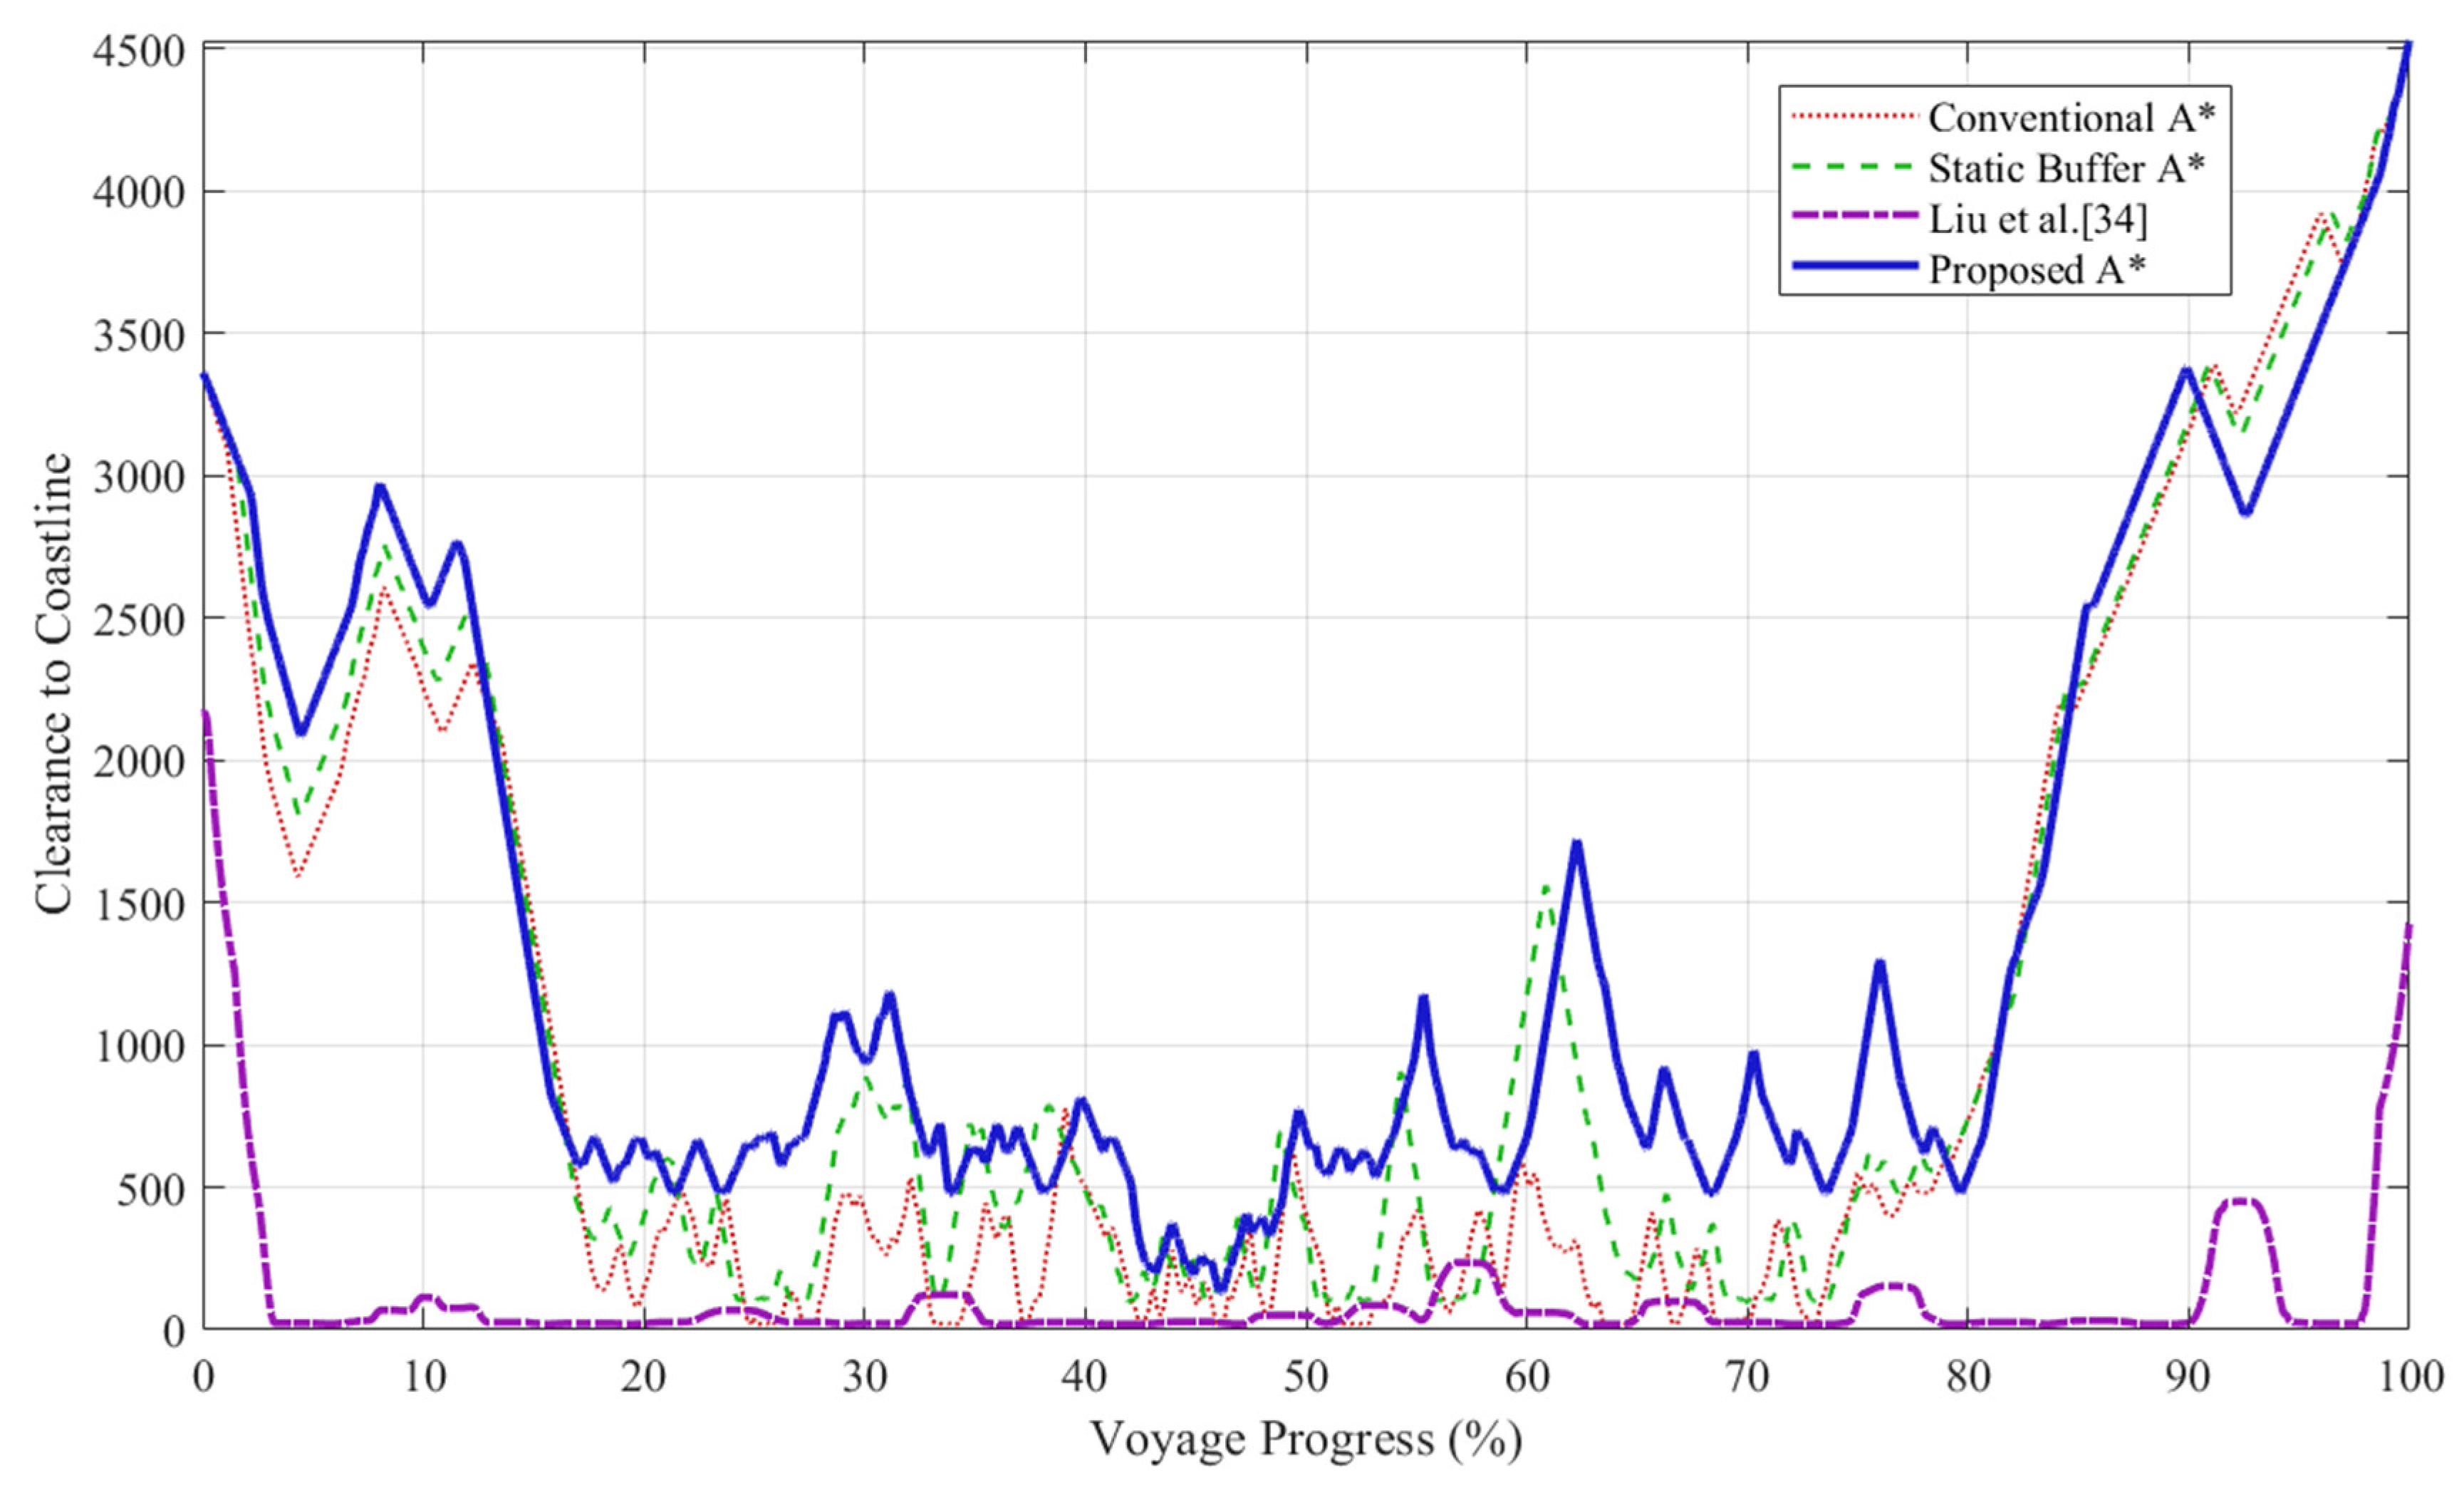
34] yielded a minimum clearance of only 20.0 m, comparable to the conventional A* baseline, indicating that a purely topological avoidance rule does not ensure a meaningful physical safety margin in an island-dense environment. In contrast, the proposed risk-weighted approach achieved the largest minimum clearance and average clearance, exceeding the static buffer method by 33.1% and 15.1%, respectively.
This improvement in safety came at a moderate computational cost. The proposed method required a computation time of 0.86 s and expanded 1,496,220 nodes, both higher than those of the conventional A* and static buffer methods, while the method of Liu et al. [
34], which expanded the fewest nodes, required the shortest computation time. Path distances remained comparable across all methods, indicating that the substantial gain in clearance was achieved with only a marginal increase in travel distance.
The conventional A* (red dashed) and Liu et al. [
34] (magenta dash-dot) methods closely follow the coastline through the narrowest section of the strait, whereas the proposed method (blue) and the static buffer method (green) maintain comparatively safety clearance despite both converging through the same navigational bottleneck.
Figure 11 presents a quantitative comparison of the coastline clearance distance as a function of voyage progress across the four route planning methods.
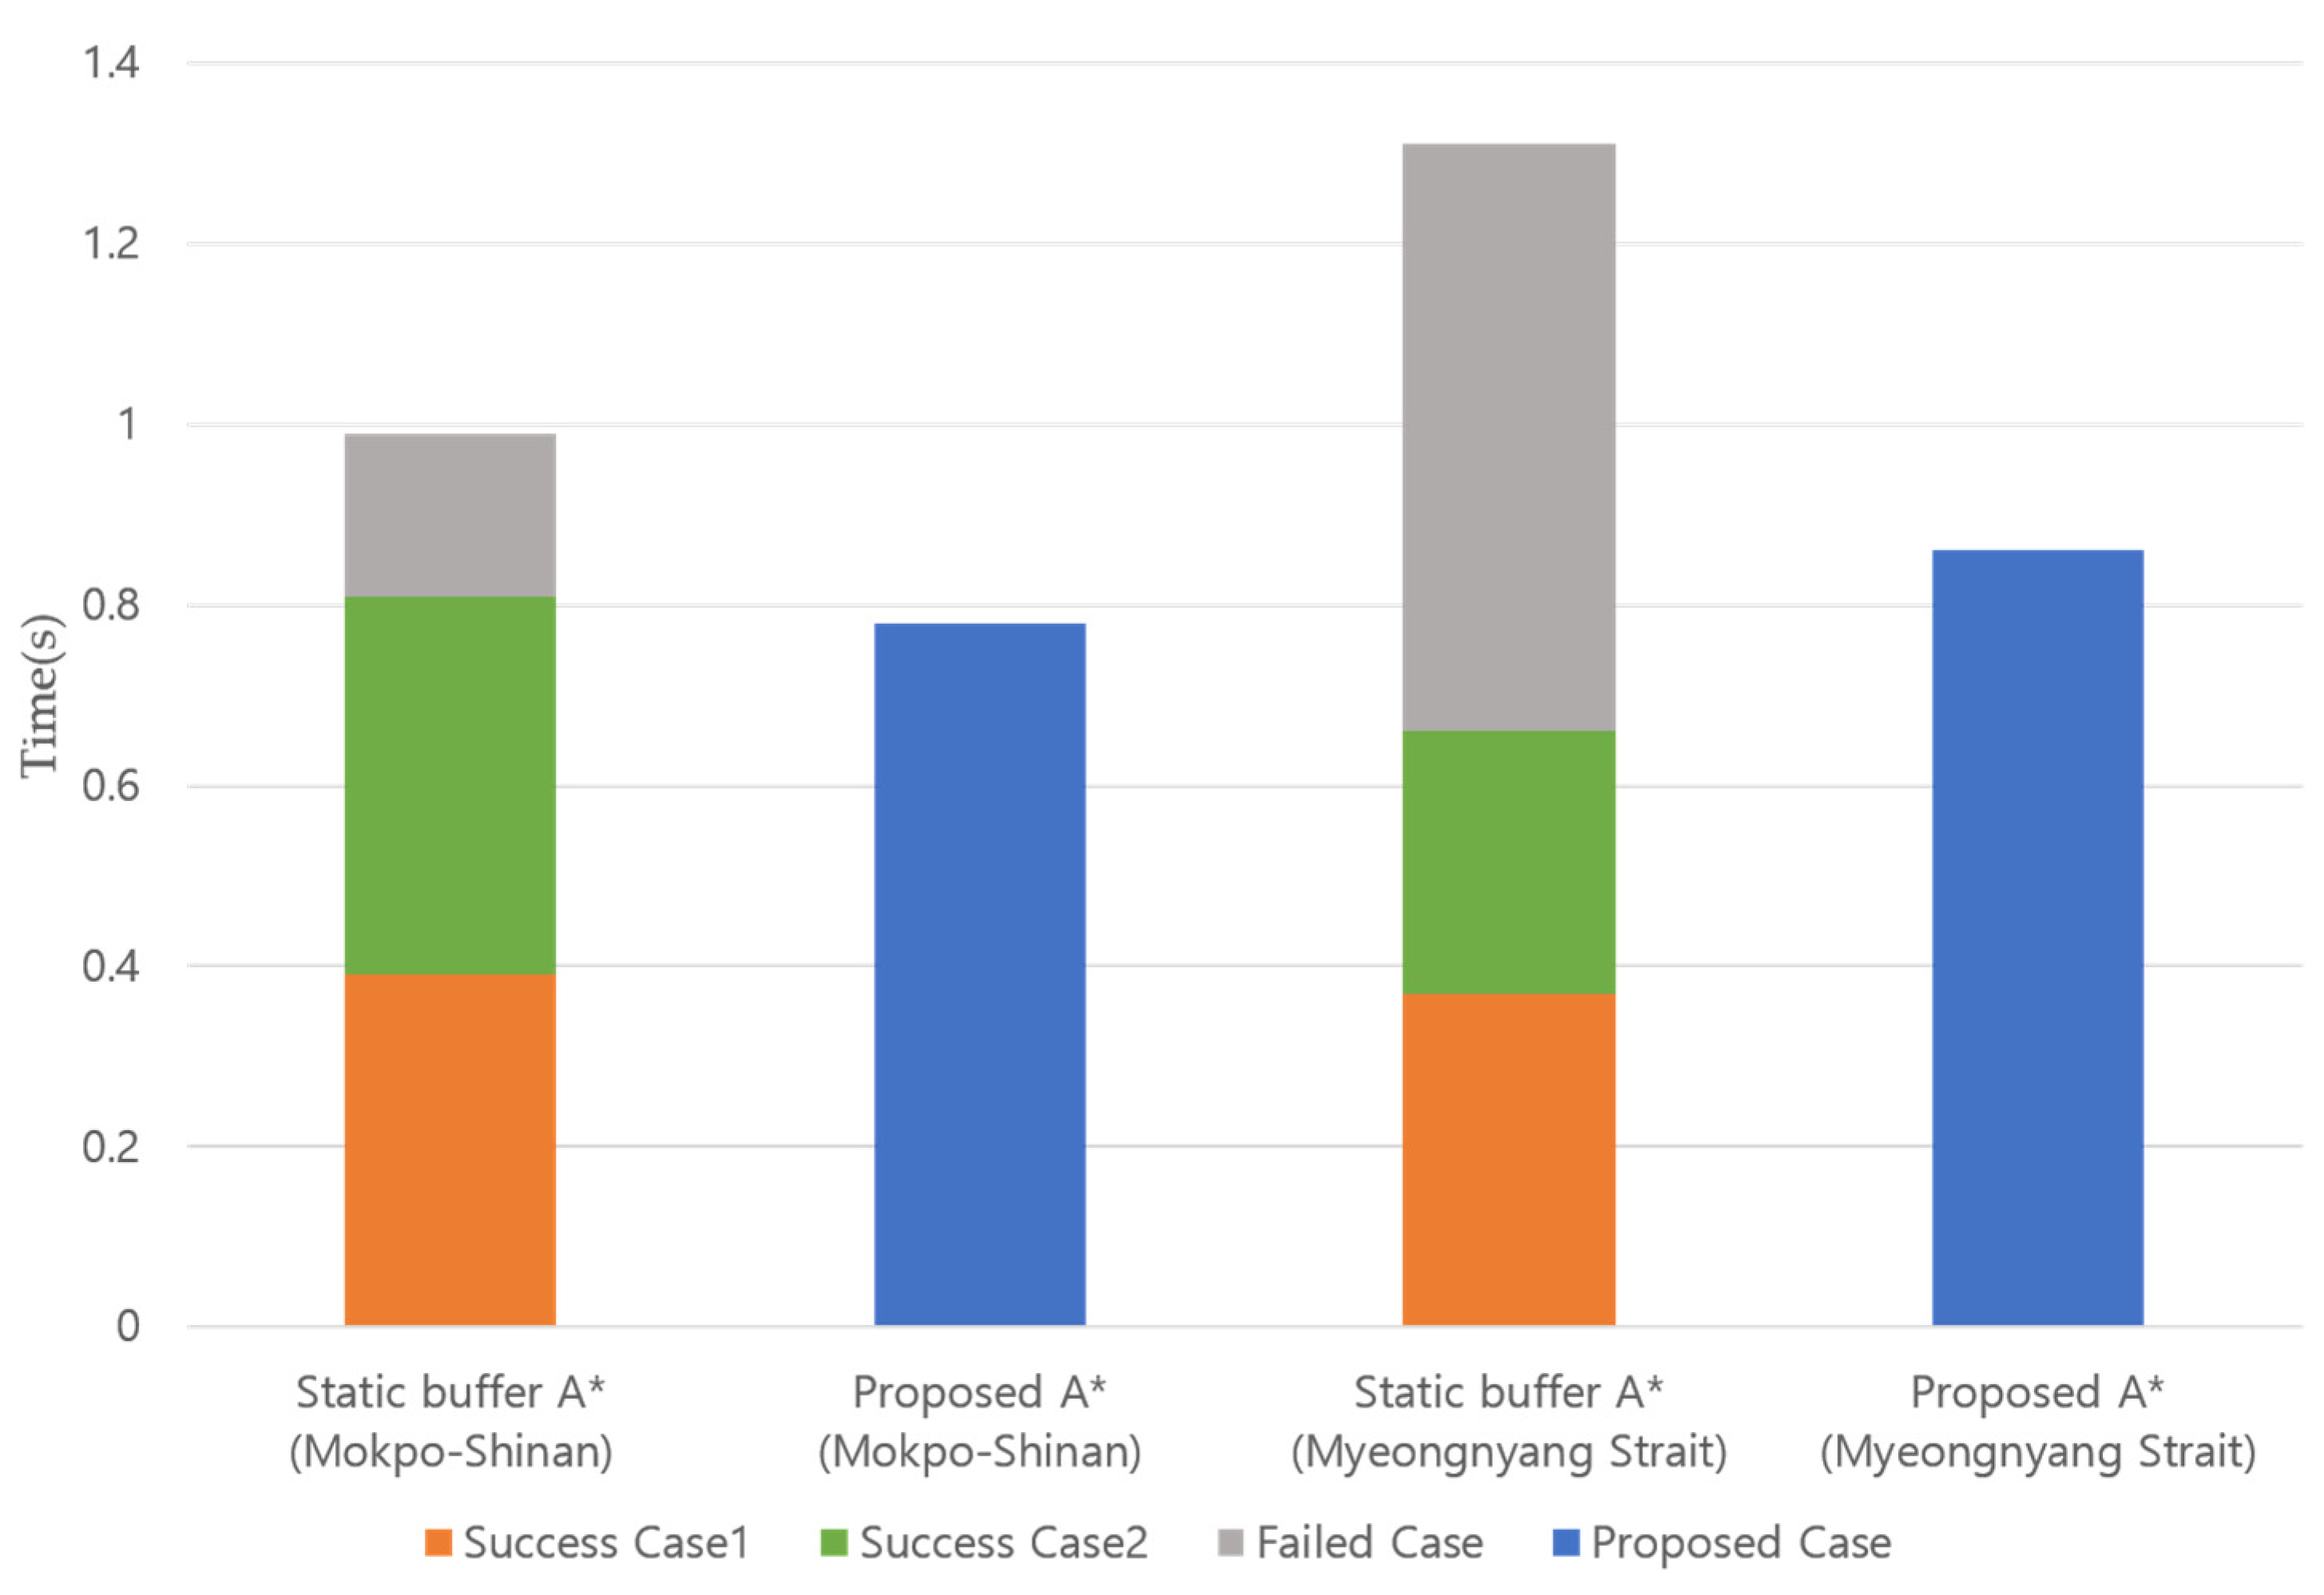
Unlike the proposed method, which operates without any predefined clearance parameter, the static buffer approach requires iterative parameter sweeps to identify a feasible radius. As shown in
Figure 12, when the cumulative computation time across all tested radii, including failed searches, is considered, the static buffer method incurred total planning costs of 0.99 s and 1.94 s for the Mokpo–Sinan and Myeongnyang Strait simulations, respectively, compared with 0.78 s and 0.86 s for the proposed single-pass framework. This disparity reflects not merely a difference in computational speed, but a fundamental distinction in operational self-containment. The proposed method generates a risk-aware route in a single planning pass without parameter re-tuning, rendering it inherently more suitable for deployment in coastal environments where real-time replanning may be required. In novel or poorly charted waters where an appropriate buffer radius cannot be determined a priori, this parameter-free formulation represents a meaningful operational advantage.
Beyond the parameter dependency of the static buffer method, the four-way comparison across the Myeongnyang Strait further revealed that risk-aware safety and topological path simplification are complementary rather than competing strategies. Although the method of Liu et al. [
34] achieved the shortest computation time and fewest node expansions, it yielded an average clearance of only 133.2 m compared with 1390.0 m for the proposed method, while path distances remained comparable across all four methods (49.40–51.35 km). These results indicate that topological efficiency and spatial risk awareness can be simultaneously pursued, and that their integration represents a promising direction for future refinement of the proposed framework.
4.5. Path Smoothing and Kinematic Plausibility Assessment
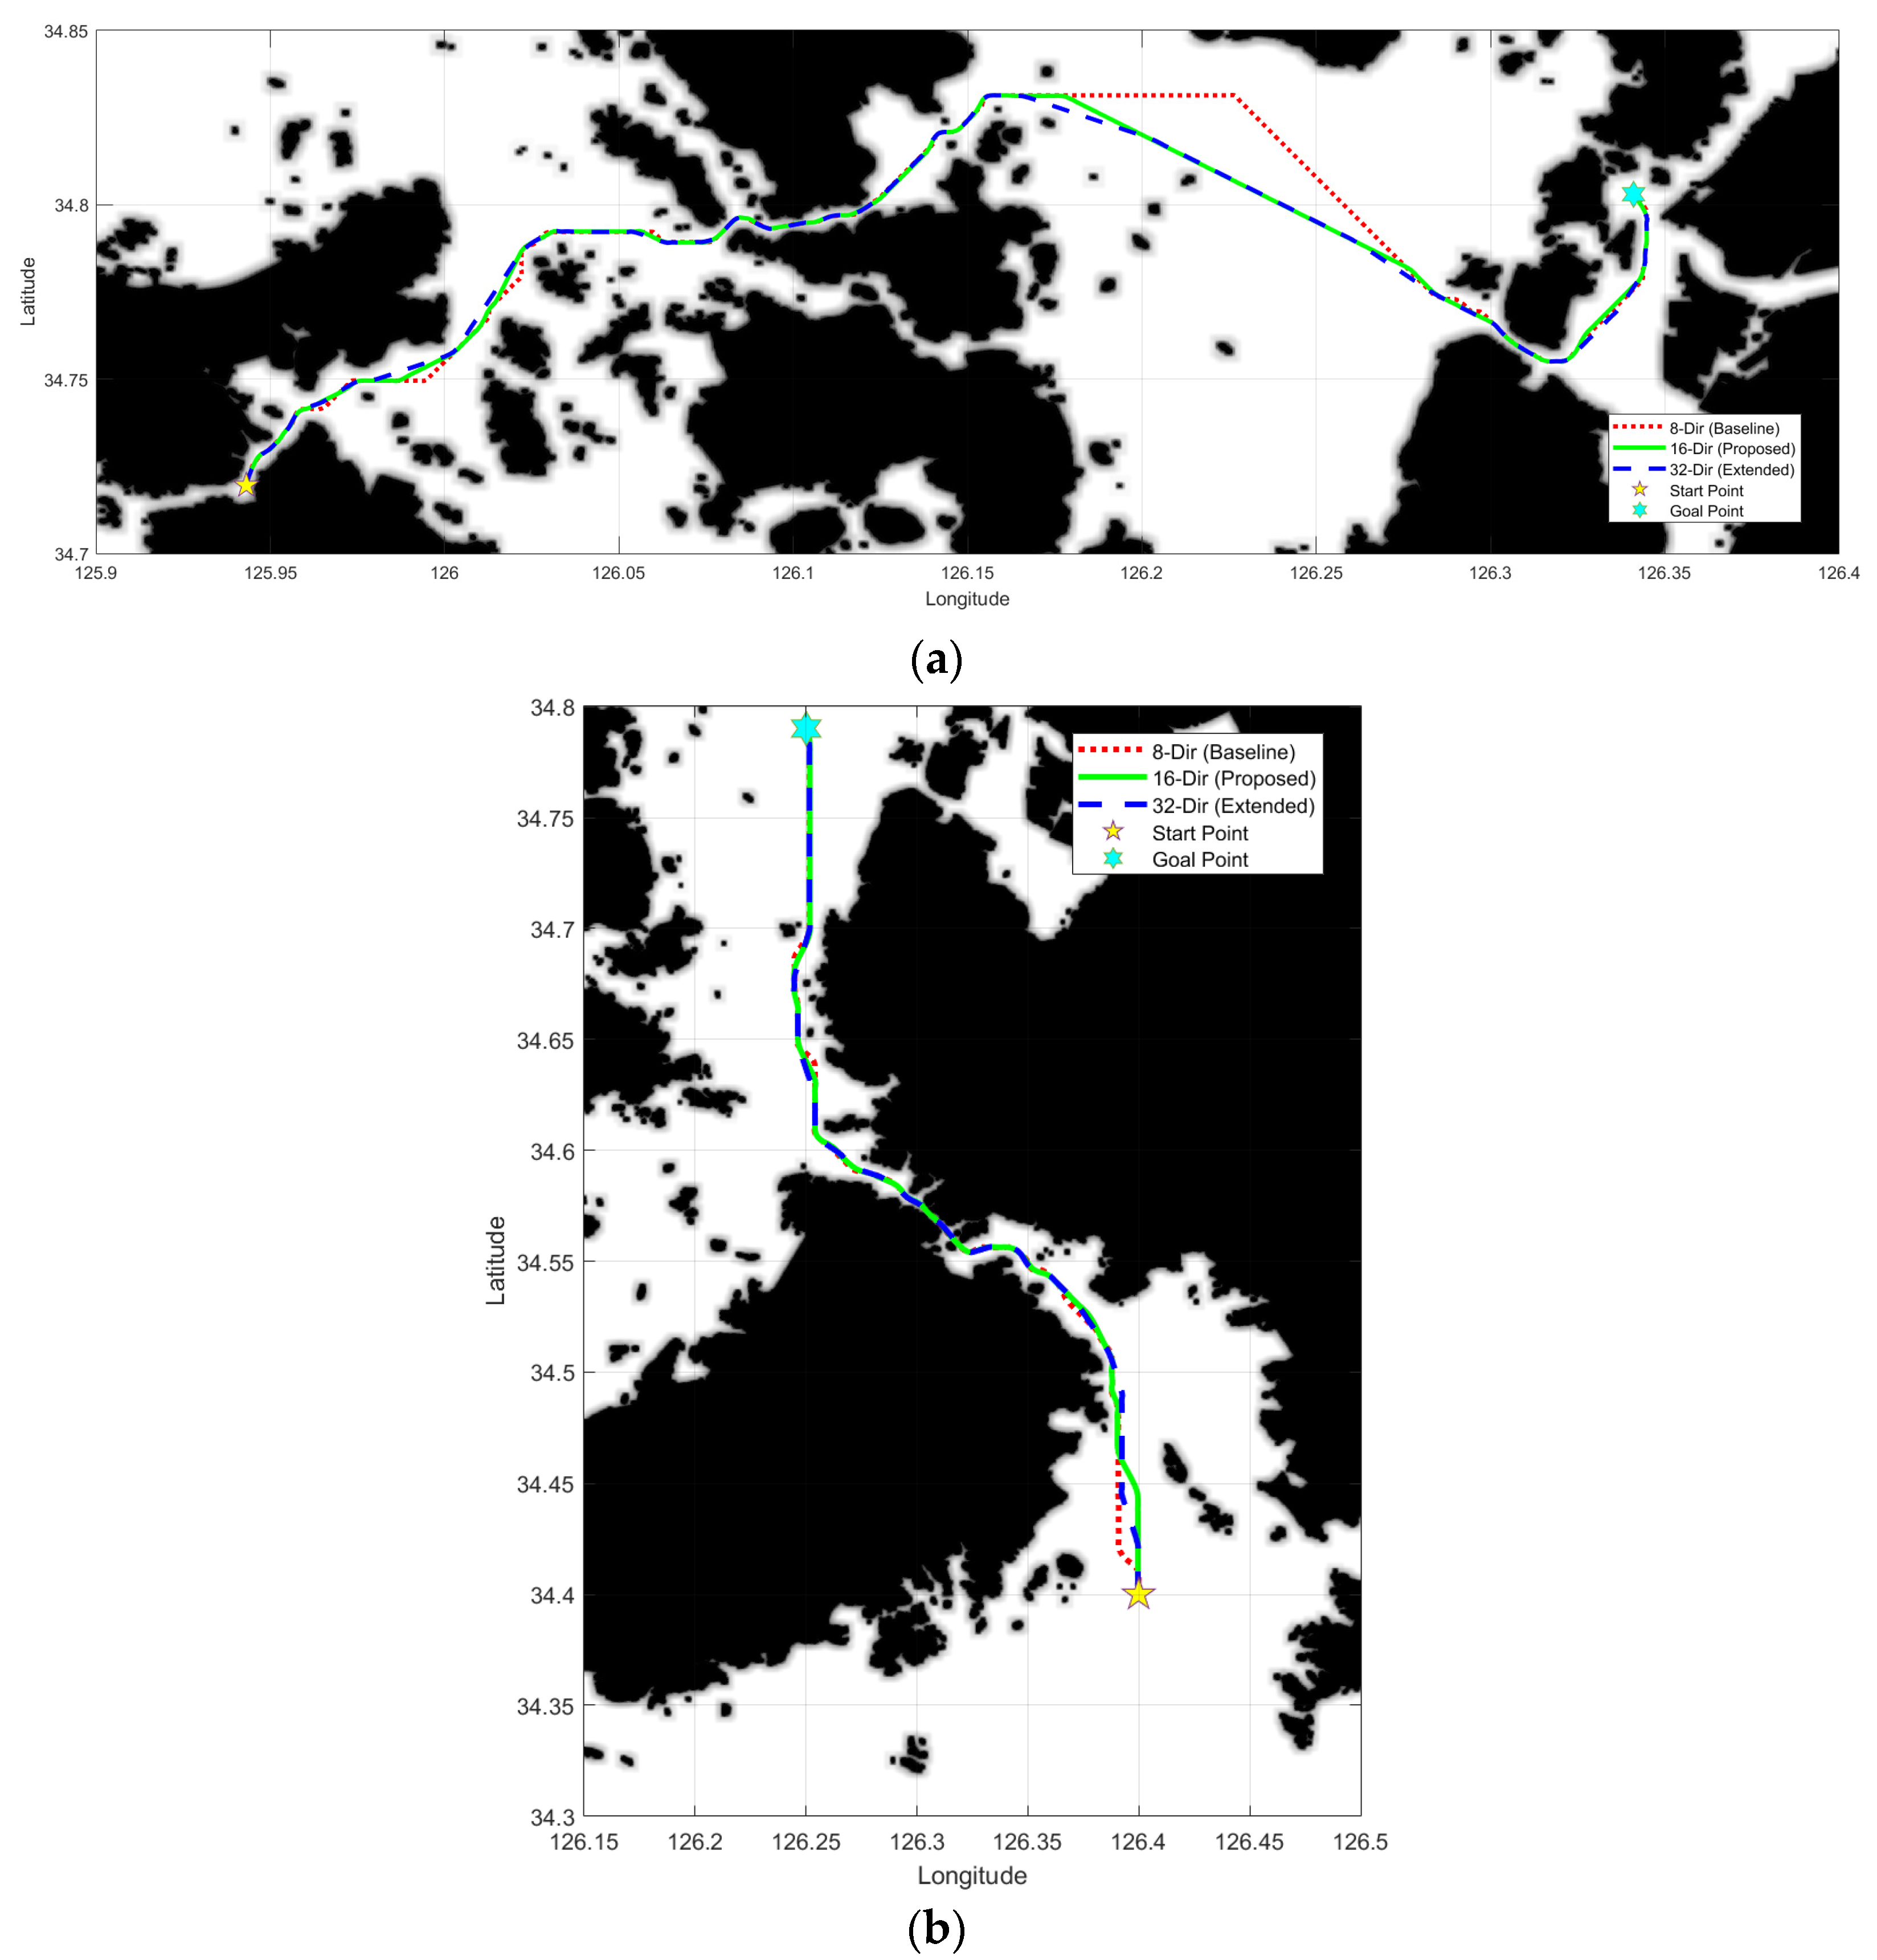
In this study, the search resolution was expanded from the conventional 8-direction to 16-direction to algorithmically implement the kinematic constraints of the vessel.
Table 9 summarizes the quantitative performance changes according to the variation in search resolution.
Simulation results for the Mokpo–Sinan route showed that the proposed 16-direction search increased computation time by approximately 1.44 s compared to the 8-direction search while improving the kinematic feasibility of the resulting route. In the 8-direction search, the maximum course change angle reached 35.10°, indicating a comparatively larger discrete heading change at the route’s most demanding turning point. The 16-direction search reduced the maximum course change angle to 29.85°, through the finer 22.5° angular resolution. More notably, the average course change angle decreased from 4.16° to 1.87°, a reduction of approximately 55%, indicating that the overall steering burden across the route, not just its worst-case point, was substantially reduced. In terms of distance efficiency, the 16-direction search shortened the navigation distance from 52.11 km to 50.44 km, a reduction of approximately 3.2%, through more precise node evaluation.
Since course change angle and physical turning radius are governed by distinct geometric mechanisms, kinematic feasibility was additionally verified through direct curvature analysis of the final B-spline path. The minimum turning radius decreased from 202.91 m under the 8-direction search to 115.61 m under the 16-direction search, and further to 92.22 m under the 32-direction search, consistent with the reduction in navigation distance observed across the same configurations. This trend reflects the finer angular resolution enabling the search to exploit narrower passages between islands, producing shorter but more tightly curved paths. Notably, this trend is opposite to what the course change angle alone would suggest. Although the 8-direction configuration exhibited the largest discrete course change angles, its smoothed trajectory consistently produced the largest turning radius since course change angle reflects the largest single heading deviation between adjacent sampled points, whereas the minimum turning radius reflects the tightest continuous curvature across the entire smoothed path. All three configurations nonetheless satisfied the vessel’s theoretical minimum turning radius,
Rmin (
Section 3.1), with even the tightest case, 92.22 m under the 32-direction search, exceeding
Rmin by a margin of approximately 1.9-fold, confirming that all generated paths remain physically executable.
The 32-direction search further increased computation time to 4.94 s while reducing the navigation distance only marginally, from 50.44 km to 50.07 km, and the average course change angle from 1.87° to 1.75°. Given the disproportionate increase in computational cost relative to the marginal gain in path quality, the 16-direction search is confirmed as the optimal balance between computational efficiency and kinematic precision.
For the Myeongnyang Strait simulation, the 8-direction search completed route planning in 1.18 s with a navigation distance of 50.7 km but yielded a maximum course change angle of 30.67° and an average of 2.45°. Increasing the search resolution to 16 directions reduced the navigation distance to 50.2 km while substantially reducing the course change angle, with the maximum and average decreasing to 18.64° and 1.80°, respectively, at a computation time of 2.12 s. The 32-direction search further reduced the navigation distance marginally to 50.1 km and the maximum and average course change angles to 14.65° and 1.76°, respectively, but required a computation time of 5.25 s, an increase of approximately 3.13 s relative to the 16-direction search.
As with the Mokpo–Sinan route, the minimum turning radius for the Myeongnyang Strait route decreased consistently with increasing search direction count, from 235.60 m under the 8-direction search to 193.00 m under the 16-direction search and 175.28 m under the 32-direction search, mirroring the same trend observed for Mokpo–Sinan and reflecting the similarly island-dense topology of both navigational environments. Even the tightest case, 175.28 m under the 32-direction search, exceeded Rmin by a margin of approximately 3.5-fold, indicating a substantially wider safety margin than that observed for Mokpo–Sinan. This consistent trend across both topologically distinct yet similarly obstacle-dense routes confirms that finer search resolution reliably improves path efficiency while remaining within kinematically feasible limits and further demonstrates that course change angle and physical turning radius should be interpreted as complementary rather than interchangeable indicators of kinematic performance. Given the disproportionate increase in computational cost relative to the marginal gains in distance, course change angle, and turning radius margin beyond 16 directions, these results confirm that the 16-direction model achieves the optimal balance between computational efficiency and kinematic feasibility in the Myeongnyang Strait simulation, consistent with the findings observed in the Mokpo–Sinan simulation.
As shown in
Figure 13a,b, the planned routes under the 8-, 16-, and 32-direction search configurations are illustrated for the Mokpo–Sinan and Myeongnyang Strait simulations, respectively, both generated using the proposed kinematic A* algorithm with cubic B-spline smoothing. Consistent with the quantitative results in
Table 9, the 8-direction route traces a visibly wider detour in both environments, while the 16- and 32-direction routes closely overlap throughout, confirming that the improvement from 16- to 32-direction search is marginal despite the added computational cost.
5. Discussion
The framework proposed in this study was designed to construct a path planning structure integrating an integral image-based risk field with kinematic constraints, aimed at securing navigational safety for small vessels in complex coastal waters.
The proposed method improved the minimum clearance distance from 20 m to 238.32 m and the average clearance distance from 884.2 m to 1038.3 m compared to the conventional A* baseline at Mokpo-Sinan. This improvement is attributed to the area-based obstacle density evaluation, which internalizes a context-adaptive repulsion into the cost function, guiding vessels toward open safety corridors beyond simple collision avoidance. This characteristic overcomes the limitation of the static buffer method, which reacts rigidly to binary obstacle expansion boundaries, and demonstrates the practical feasibility of generating conservative navigation routes using only coastline-based spatial information, even in environments where bathymetric data are unavailable.
Reducing the local risk computation complexity from O(W2) to O(1) through the integral image structure represents the core methodological contribution of this study. Although the application of 16-direction search expansion and kinematic constraint filtering increased the total computation time by approximately 2.0 times compared to the 8-direction baseline, this increase is attributable to the higher search density required to secure safety margins and was partially offset by the O(1) risk computation afforded by the integral image. In the search resolution comparison experiments conducted on the Mokpo–Sinan simulation, the 16-direction search reduced the maximum course change angle from 35.10° to 29.85° relative to the 8-direction search, a reduction of approximately 15%, and the average course change angle from 4.16° to 1.87°, a reduction of approximately 55%, indicating that the overall steering burden across the route was substantially reduced. In contrast, the 32-direction search achieved only a marginal 0.7% improvement in navigation distance despite an approximately 1.94-fold increase in computation time relative to the 16-direction search. These results demonstrate a nonlinear diminishing-returns relationship between the number of search directions and path-quality improvement, supporting the conclusion that the 16-direction configuration represents the practical optimal trade-off between operational efficiency and kinematic precision.
This trend was further corroborated in the Myeongnyang Strait simulation, where the 16-direction search reduced the maximum course change angle from 30.67° to 18.64°, while the 32-direction search provided only marginal additional improvement at a higher computational cost, confirming the generalizability of the 16-direction configuration across topographically distinct navigational environments.
Beyond the discrete course change angle metrics discussed above, the physical executability of the generated trajectories was independently verified through curvature-based analysis of the final B-spline path. Across all tested search resolutions and both evaluated routes, the minimum turning radius of the smoothed trajectory consistently exceeded the vessel’s theoretical minimum turning radius by a margin of at least 1.9-fold, confirming that the proposed framework generates kinematically executable routes regardless of search resolution. This analysis further revealed that course change angle and physical turning radius, while both indicative of maneuvering demand, are governed by distinct geometric mechanisms and should therefore be interpreted as complementary rather than interchangeable indicators of kinematic feasibility.
Furthermore, whereas the static buffer method requires repeated parameter sweeps to identify a feasible radius, thereby incurring structural replanning overhead, the proposed framework eliminates this dependency through its parameter-free risk field formulation, representing a meaningful advantage in operational autonomy beyond computational efficiency alone. Beyond the trade-offs in search resolution and computation time discussed above, a further distinction concerns the operational efficiency of parameter selection. The static buffer method requires the dilation radius to be manually specified, and
Table 7 demonstrates that this radius must be tuned to the specific channel geometry. The radii of 100 m and 120 m yielded feasible routes, whereas radii of 140 m and 160 m resulted in complete search failure, with the failed attempts in the narrow-channel case study requiring approximately twice the computation time of the successful ones, since infeasibility could only be confirmed after exhaustively expanding the entire reachable search space up to the point of channel closure. Notably, this pattern is specific to cases where the buffer radius approaches the channel’s critical width. In the open water case study, an excessively large buffer radius instead reduced the reachable search space near the start/goal points themselves, resulting in fewer node expansions and a shorter failure-detection time. Furthermore, even when a larger buffer radius remains feasible, as observed for the 200 m setting in
Section 4.3, it can produce a substantially longer and more circuitous route without a regulatory basis for the additional margin. Taken together, these results indicate that the computational and geometric consequences of static buffer selection are highly environment dependent and difficult to predict a priori, further underscoring the unpredictability of the static buffer method across heterogeneous waterway geometries, and reinforcing, rather than weakening, the case for the proposed risk-weighted approach, which requires no such radius specification.
However, this study has several limitations. One limitation of the area-based risk index
R(
x,
y) is that it quantifies obstacle occupancy density within a window but does not directly capture the geometric width of navigable passages. Consequently, a narrow but long passage bounded by sparse obstacles may register a low
R(
x,
y) despite posing considerable navigational risk. The Adaptive Dual-Window strategy partially mitigates this by reducing the window size in higher-risk zones, improving local resolution. However, it does not explicitly compute channel width or minimum clearance geometry. Future extensions could incorporate a distance-transform-based passage-width metric alongside
R(
x,
y) to more directly capture this risk mode. In the present case studies, this limitation did not manifest as a critical failure mode, as the Mokpo–Sinan and Myeongnyang Strait channels evaluated in
Section 4 contained sufficient obstacle density along their boundaries for
R(
x,
y) to register elevated risk. Nonetheless, its generality to sparser or more elongated channel geometries remains to be verified.
In addition, the current simulations were conducted under the assumption of a static environment and did not incorporate dynamic factors that have significant influences in actual maritime environments, such as moving vessels, tidal currents, wave conditions, and wind. Furthermore, risk computation was performed primarily based on coastline-based occupancy grid information, and bathymetric data and navigational regulatory constraints were not directly reflected. Therefore, future studies should integrate multi-layered environmental information based on Electronic Navigational Charts (ENC), dynamic obstacle avoidance models, and multi-vessel interaction techniques to extend the framework into a more realistic autonomous navigation support system.