Article

Record-Breaking Marine Heatwave Event in the Yellow Sea During Summer 2024 and Its Underlying Mechanisms

National Marine Data and Information Service, Tianjin 300171, China
*
Author to whom correspondence should be addressed.
J. Mar. Sci. Eng. 2026, 14(15), 1438; https://doi.org/10.3390/jmse14151438
Submission received: 7 July 2026 / Revised: 27 July 2026 / Accepted: 31 July 2026 / Published: 5 August 2026
(This article belongs to the Section Physical Oceanography)

Abstract

Marine heatwaves (MHWs) are persistent extreme warm events in the ocean that pose substantial threats to marine ecosystems, fisheries, aquaculture, and offshore energy infrastructure. In 2024, the Yellow Sea experienced the most intense MHW on record in terms of cumulative intensity, with sea surface temperature (SST) anomalies exceeding 5 °C and an exceptional duration of 118 days. Using the ERA5 atmospheric reanalysis and GLORYS12V1 ocean reanalysis, this study systematically investigates the characteristics, driving mechanisms, and extremity of this event. Mixed-layer heat budget analysis indicates that enhanced shortwave radiation was the primary contributor to the warming, which is closely linked to the westward-extending and northward-shifting subtropical high. During MHW decay, sea surface cooling is dominated by enhanced latent heat flux, closely linked to typhoon and cold air activities. Further analysis links the positive SST anomalies to the North Atlantic and the Barents Sea warming, which triggered a Eurasian teleconnection wave train. These results highlight the importance of cross-basin climate connectivity in driving regional maritime temperature extremes.

1. Introduction

Marine heatwaves (MHWs) are defined as discrete, prolonged extreme high-temperature events during which sea surface temperatures (SSTs) exceed the 90th percentile of a local climatological baseline for at least five consecutive days [1]. Under the influence of global warming, the frequency and intensity of MHWs have increased significantly. These phenomena not only trigger ecological crises, such as coral bleaching and the decline in fishery resources [2,3,4,5], but also threaten the structural integrity and operational safety of offshore energy infrastructure—including floating photovoltaics and wind farms—by intensifying thermal loads [6,7]. Observational data indicate that the global annual number of MHW days has more than tripled since the 1940s, a trend projected to persist as anthropogenic warming continues [8,9].
The development of MHWs is typically associated with anomalous air–sea heat fluxes and ocean dynamical processes. Enhanced shortwave radiation resulting from reduced cloud cover, together with suppressed latent heat loss under warm and humid atmospheric conditions, can substantially increase the net heat input into the ocean surface [10,11]. Oceanic dynamical processes, such as anomalous currents, eddies, shallower mixed layer, weakened vertical mixing, and reduced upwelling, are important drivers of marine heatwaves [12,13]. Concurrently, stratification induced by local warming and freshwater advection can inhibit vertical mixing and heat exchange, thereby generating positive feedback that amplifies upper-ocean warming. In addition to these local processes, large-scale climate modes such as the El Niño–Southern Oscillation (ENSO), Arctic Oscillation (OA) and the North Atlantic Oscillation (NAO) can remotely modulate SST variability through atmospheric teleconnections [14,15,16].
The Yellow Sea, an important fishery region of China, has a mean depth of only about 44 m. Its shallow bathymetry and semi-enclosed geographic setting make it particularly sensitive to climate variability and change. SST and sea surface salinity in the Yellow Sea have increased in recent decades, with pronounced regional and seasonal differences. Permanent hypoxia has not yet been observed. DIN and DIP concentrations have risen, driving up the DIN/DIP ratio [17]. DIN increased more than sevenfold, from <3 μmol L−1 in the late 1950s to >22 μmol L−1 in the mid 2010s [18,19,20]. From 1976 to 2016, winter bottom water pH in the northern Yellow Sea declined by 0.011 ± 0.009 [21]. In 2025, coastal bottom dissolved oxygen of Yellow Sea exceeded 6 mg L−1, and surface pH was ~8.1 [22]. In recent years, the Yellow Sea has experienced frequent extreme MHWs: summer heatwaves disrupted the ecosystem for three consecutive years from 2016 to 2018 [13], and a record-breaking event occurred during the 2019/20 winter, lasting over 90 days [16]. Previous studies suggest that MHWs in the Yellow Sea are driven by the combined effects of large-scale atmospheric forcing, regional air–sea interactions, and local oceanic processes operating across multiple spatial and temporal scales [11,13,23,24,25,26,27]. For example, the events in the southern Yellow Sea during 2016 and 2018 were attributed to anomalous strengthening of the western Pacific subtropical high, which enhanced atmospheric stability, reduced wind speed, and increased radiative heating, thereby promoting heat accumulation within a shoaling mixed layer [28]. Clarifying the relative contributions of atmospheric forcing and ocean dynamical processes is therefore central to understanding the formation of these extreme events.
In 2024, global ocean temperatures reached a new historical high. According to the World Meteorological Organization (WMO), Asian marginal seas experienced the most extensive MHW conditions on record, with the Yellow Sea among the most severely affected regions. The spatial extent of the extreme MHW in the Yellow Sea exceeded all previous records since 1993. This study aims to comprehensively quantify the core characteristics of the 2024 MHW in the Yellow Sea, evaluate its extremity, identify the dominant drivers, and elucidate the underlying formation mechanisms. The findings are of significant scientific and practical importance for improving disaster prediction capabilities, assessing future risks under global warming, and developing mitigation strategies for the regional ecology and economy.

2. Materials and Methods

2.1. Data Sources and Description

This study utilizes the daily Optimum Interpolation Sea Surface Temperature (OISST) v2 dataset provided by the National Oceanic and Atmospheric Administration (NOAA) [29]. The data spans from 1 January 1982, to 31 December 2024, with a spatial resolution of 0.25° × 0.25°. This product integrates Advanced Very High Resolution Radiometer (AVHRR) data from the Pathfinder satellite with in situ observations from buoys and ships. The dataset was accessed via NOAA Physical Sciences Laboratory.
Atmospheric variables—including surface heat fluxes, wind speed, sea–air heat exchange, mean sea-level pressure (SLP), and cloud cover—were obtained from the ERA5 reanalysis dataset, the fifth generation of atmospheric reanalysis from the European Center for Medium-Range Weather Forecasts (ECMWFs). We utilized both daily and monthly mean data from 1981 to 2024 with a horizontal resolution of 0.25°. ERA5 data can be retrieved from the Copernicus Climate Data Store.
Oceanic physical parameters, including seawater temperature and zonal/meridional current velocities at 1/12° resolution, were sourced from the GLORYS12V1 global ocean reanalysis [30], covering the period from 1993 to 2024. Developed based on the NEMO global ocean model, GLORYS12 features 50 vertical levels and utilizes a reduced-order Kalman filter to assimilate observations, including along-track altimetry (sea-level anomalies), satellite-derived SST, sea-ice concentration, and in situ temperature/salinity profiles. Furthermore, a 3D-variational (3DVAR) scheme is implemented to correct for large-scale, slowly evolving biases in temperature and salinity. The reanalysis is forced by ERA-Interim atmospheric fluxes from 1993 to 2019 and by ERA5 fluxes thereafter. Data were downloaded from the Copernicus Marine Service. SST data from both OISST and GLORYS12 show good consistency with MF03007 buoy located in central Yellow Sea collected by the Ministry of Natural Resources of the People’s Republic of China (MNR), with pairwise correlation coefficients exceeding 0.99, which fully validates their reliable applicability in this study.
Additionally, monthly mean geopotential height (17 vertical levels) and radiation flux data were extracted from the NCEP/NCAR Reanalysis 1 dataset [31]. These data have a spatial resolution of 2.5° × 2.5° and cover the period from January 1948 to December 2024, accessible at NOAA PSL.

2.2. Research Methods

2.2.1. Marine Heatwave Definition and Intensity Classification

Following the framework proposed by Hobday et al. [1], an MHW is defined as a discrete, prolonged extreme warming event where daily SST exceeds a specific climatological threshold for at least five consecutive days. The threshold is established at the 90th percentile of daily SST relative to a defined climatological baseline (1993~2022). This definition allows for the identification of events spanning multiple months and extending across thousands of kilometers. This approach identifies MHWs based on daily SST time series and has been widely accepted and applied in recent studies. Statistical metrics for MHWs include frequency, duration, intensity (mean and maximum), and spatial extent. Building upon this framework, Hobday et al. [32] further introduced a classification scheme that categorizes MHWs into four levels of severity, enabling the identification of more extreme events. These categories include moderate MHWs (SST exceeding the climatological threshold), strong MHWs (SST anomalies exceeding twice the difference between the threshold and the climatological mean), severe MHWs (SST anomalies exceeding three times this difference), and extreme MHWs (SST anomalies exceeding four times this difference).

2.2.2. Anomalous Mixed-Layer Heat Budget Equation

To quantify the thermodynamic drivers of the MHW, we performed a mixed-layer heat budget (MLHB) analysis using the ERA5 and GLORYS12 datasets following the methodology of Nigam et al. [33]. To ensure data consistency and comparability, the GLORYS12 data were interpolated to match the spatial resolution of the ERA5 reanalysis dataset.
The governing equation for the mixed-layer temperature tendency is expressed as
T m t = Q n e t ρ C p h m ( u m T m x + v m T m y ) w T m T d h m + R E S
w = h t + u m h x + v m h y
In Equation (1), the terms from left to right represent the mixed-layer temperature tendency (dT/dt), net surface heat flux (NHF), horizontal (zonal and meridional) advection (ADV), vertical entrainment (ENT), and the residual term (RES). The RES is the residual term that encompasses mixing, diffusive fluxes, and calculation errors. The net surface heat flux Q n e t is composed of the net shortwave radiation (SWR), net longwave radiation (LWR), latent heat flux (LHF), and sensible heat flux (SHF). By convention, positive (negative) values of Q n e t denote downward (upward) flux, representing heat gain (loss) by the ocean. Here, ρ is the seawater density (1025 kg m−3), and C p is the specific heat capacity of seawater at constant pressure (3992 J·kg−1·°C−1). The variables T m , u m , and v m denote the depth-averaged temperature, zonal velocity, and meridional velocity within the mixed-layer depth ( h m ), respectively. h m is defined as the depth where ocean temperature is 0.2 °C below the surface value. Additionally, T d represents the temperature at the base of the mixed layer, and w is the vertical entrainment velocity and is calculated using Equation (2).
To separate the seasonal cycle signal, each term in Equation (1) is decomposed into the climatological mean and the anomaly. By neglecting higher-order nonlinear terms, Equation (1) becomes
T m t = Q n e t ρ C p h m u m T m ¯ x + u m ¯ T m x + v m T m ¯ y + v m ¯ T m y w ¯ T m T d h m ¯ + w T m T d ¯ h m ¯ + R E S

2.2.3. Horizontal Wave Activity Flux

To diagnose the horizontal propagation characteristics of Rossby waves in the atmosphere, the horizontal wave activity fluxes are calculated using Equation (4) [34]:
W = 1 2 U ¯ U ¯ Ψ x 2 Ψ 2 Ψ x 2 + V ¯ Ψ x Ψ y Ψ 2 Ψ x y , U ¯ Ψ x Ψ y Ψ 2 Ψ x y + V ¯ Ψ y 2 Ψ 2 Ψ y 2
where W is the wave activity flux vector; U ¯ is the climatological mean wind speed, U ¯ and V ¯ are the climatological mean zonal and meridional wind, respectively. x and y are longitude and latitude, respectively; The stream function, Ψ , is defined as Ψ = Φ f , where Φ and f denote geopotential height and Coriolis parameter, respectively.

3. Results

3.1. Characteristics and Extremity of the 2024 Marine Heatwave

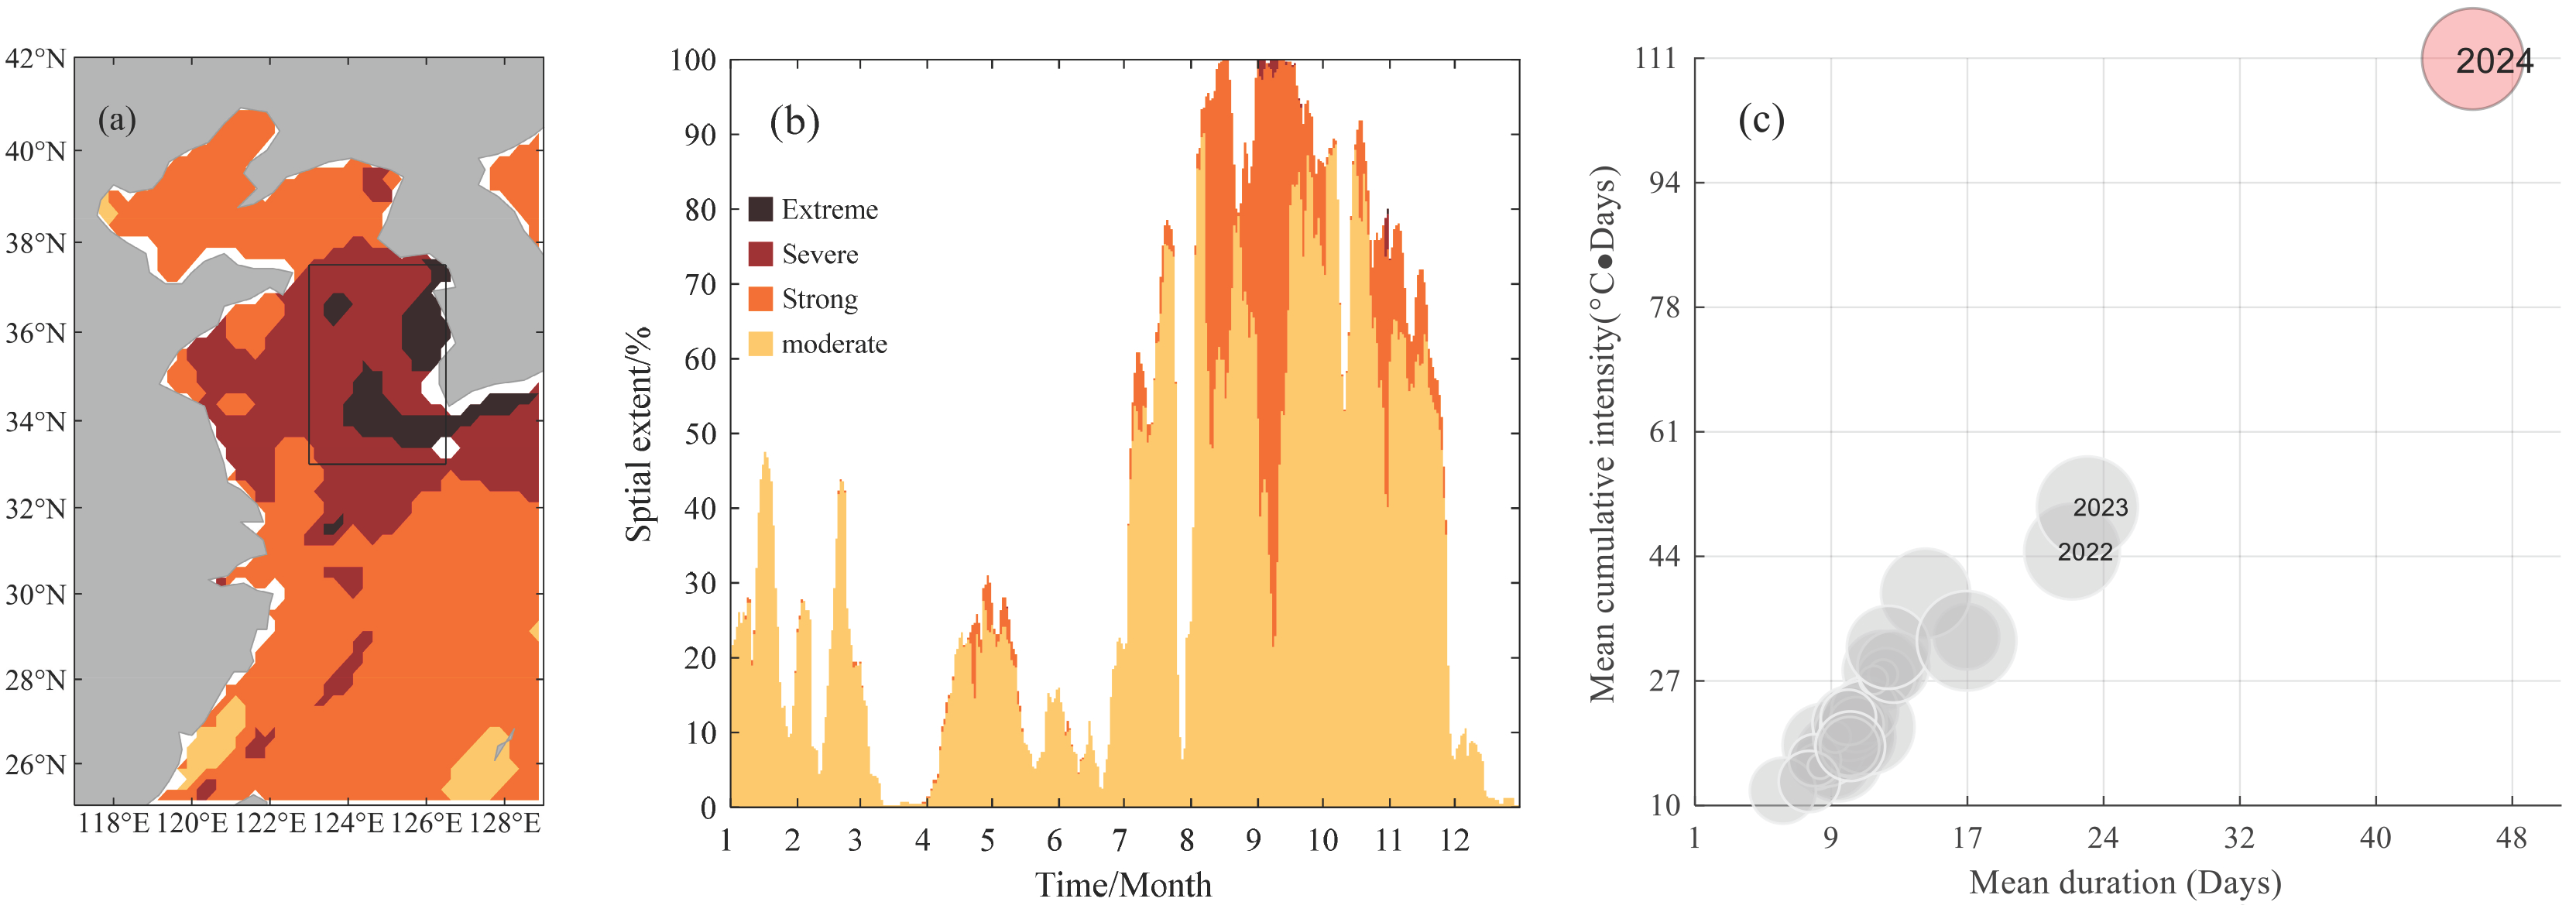
In 2024, the Yellow Sea experienced a record-breaking MHW event, with both cumulative intensity and duration exceeding the previous record set in 2023, marking it the most severe year for thermal extremes since 1993. The mean cumulative intensity and duration in 2024 were approximately 5 times and 4 times the climatological average, respectively. In terms of spatial extent, the MHW coverage reached a peak in September (100%), representing an expansion of 80.2% relative to the climatological average of the same month. Notably, “Extreme” (Category IV) MHW conditions were predominantly concentrated in the central and eastern Yellow Sea during September (Figure 1). We selected this region (indicated by the black box in Figure 1) as the core study area for investigating the extreme marine heatwave event in 2024.
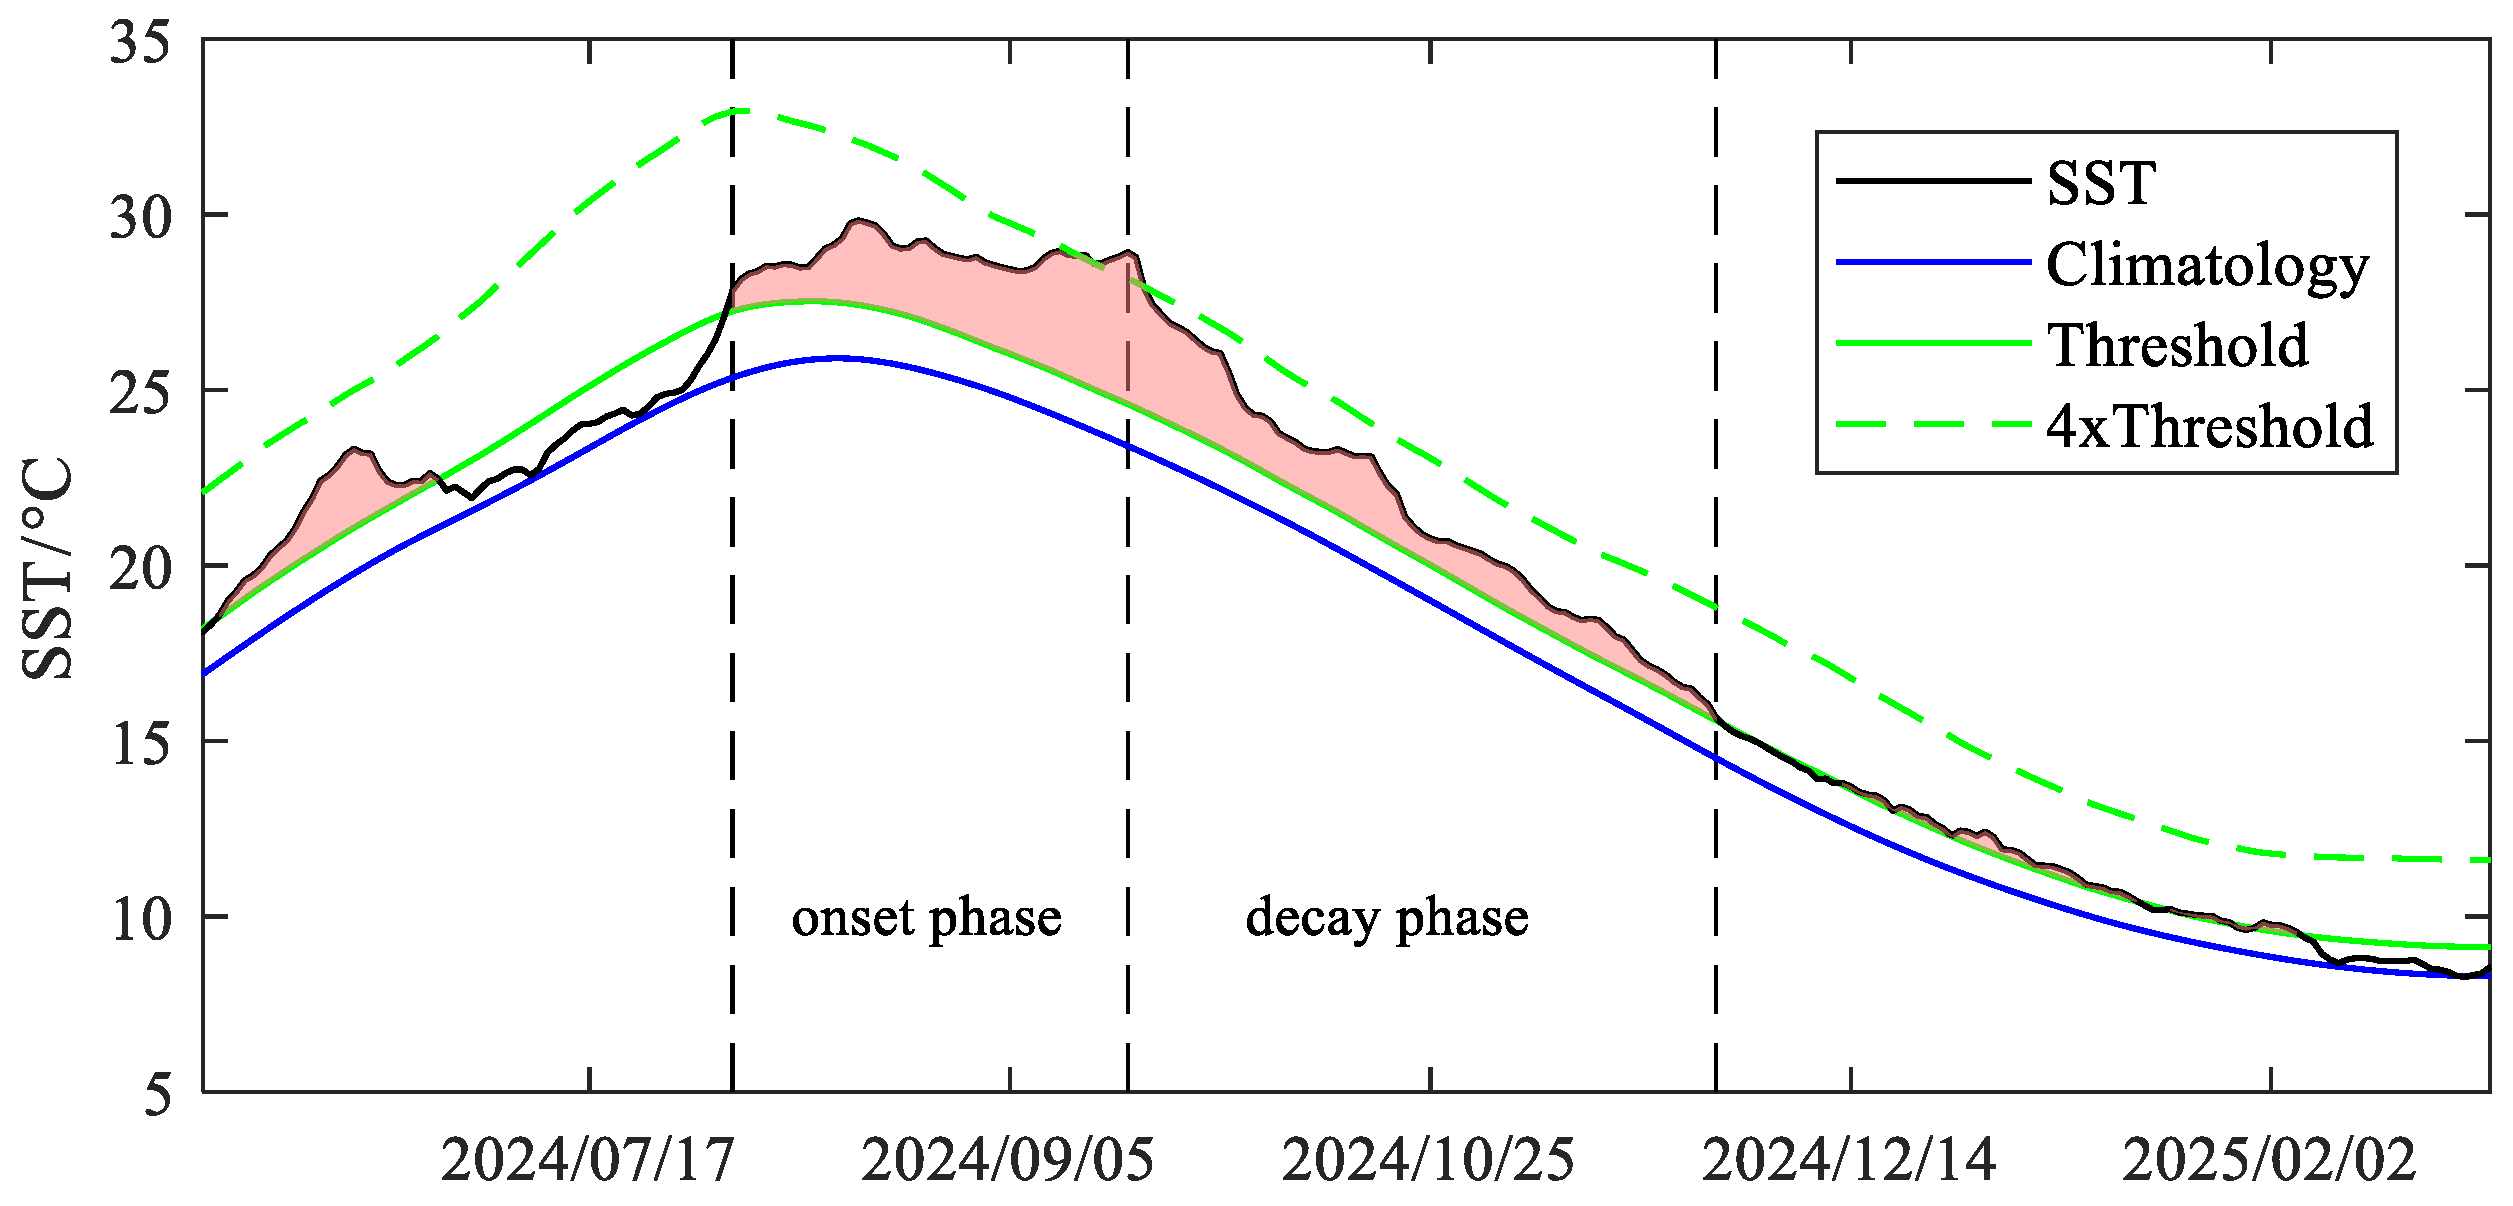
We identified MHWs using regionally averaged SST. The extreme MHW event, with SST anomalies exceeding 5 °C, persisted for 118 days, approximately 10 standard deviations above the climatological mean of annual maximum duration. It initiated on 3 August, reached its peak on 19 September, then gradually weakened and dissipated on 28 November (Figure 2). Further analysis reveals that temperatures exceeding 1.5 °C above the climatological mean penetrated to depths greater than 40 m. Characterized by exceptionally intense and prolonged SST anomalies, this extreme summer MHW imposed unprecedented thermal stress on the study region, posing high risks to local fisheries and aquaculture. Here, we define 19 September (the date of the maximum MHW intensity) as the demarcation point. Accordingly, the MHW event is partitioned into an onset phase (3 August–19 September) and a decay phase (19 September–28 November). The warming rate during the onset phase (0.09 °C day−1) was markedly higher than the cooling rate during the decay phase (−0.06 °C day−1), implying that the physical forcing mechanisms driving MHW development were more vigorous and induced a rapid thermal response within the region.

3.2. Impact of Large-Scale Atmospheric Circulation

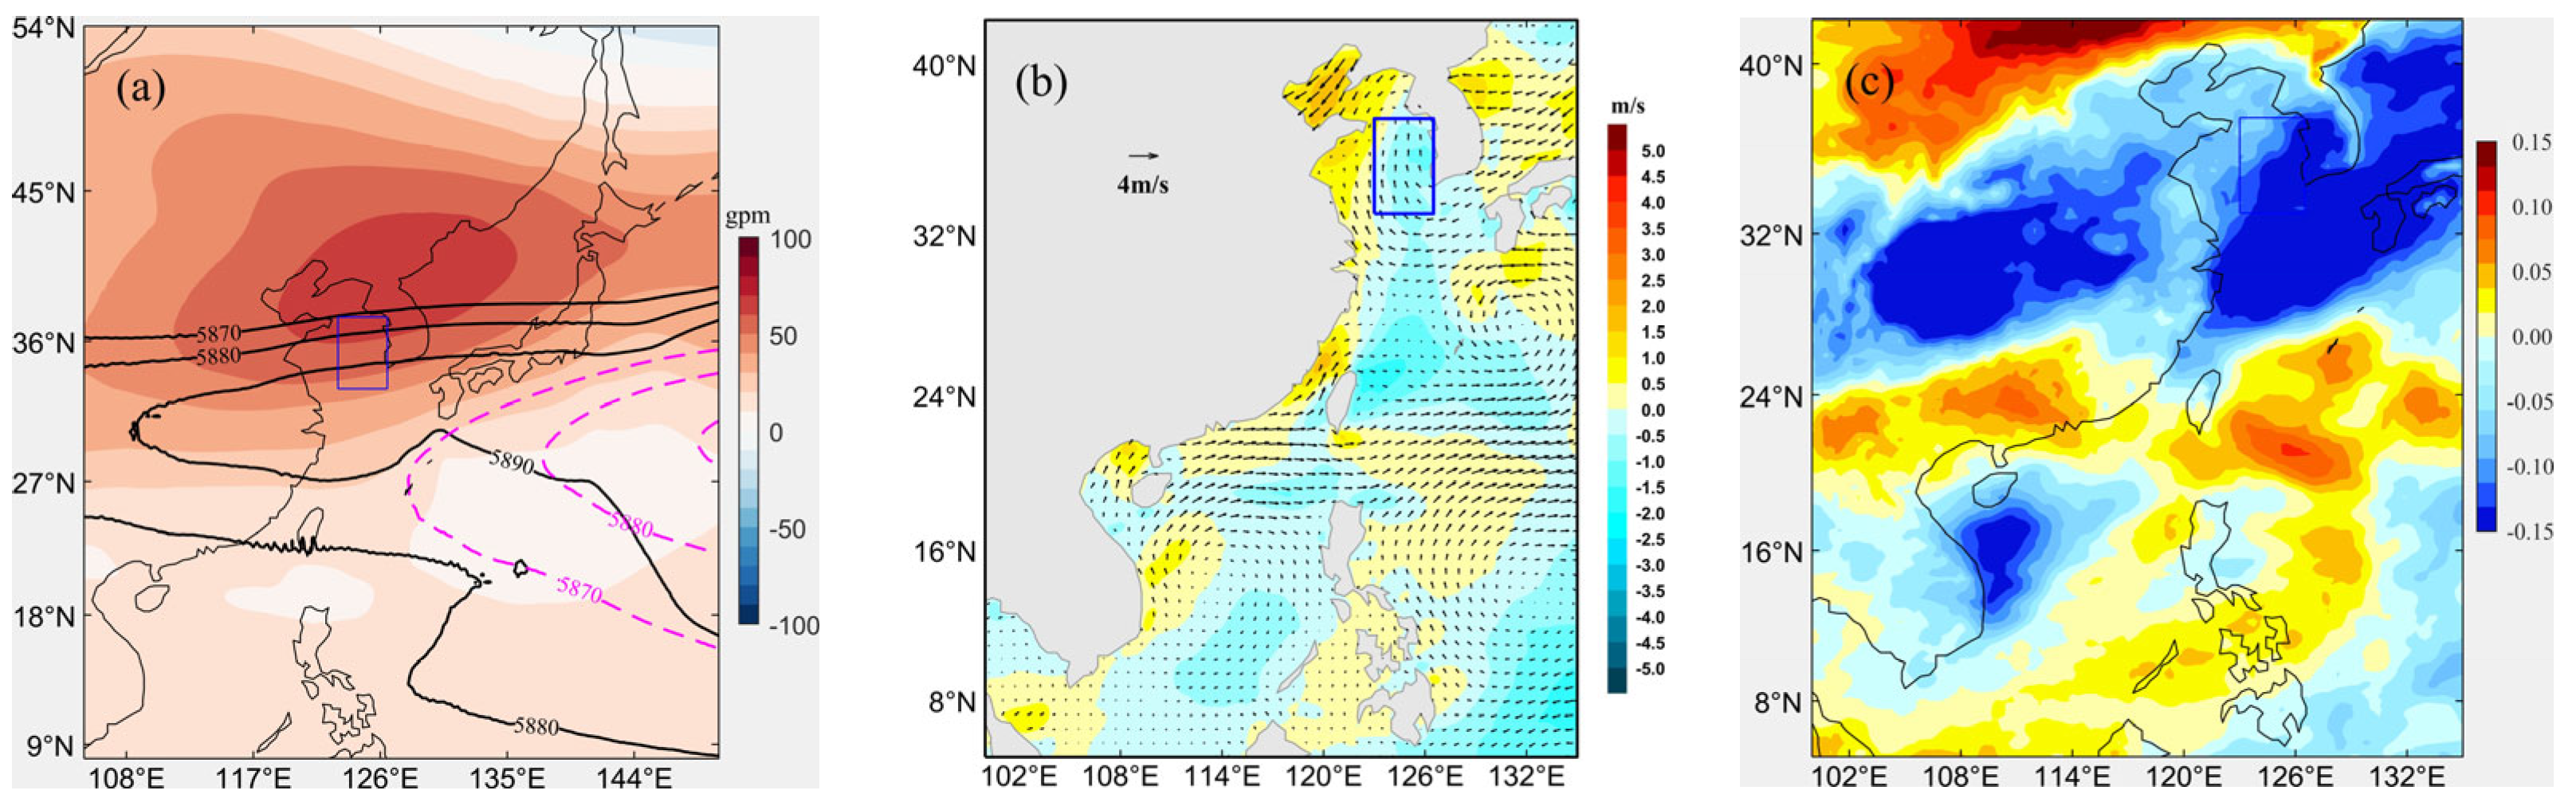
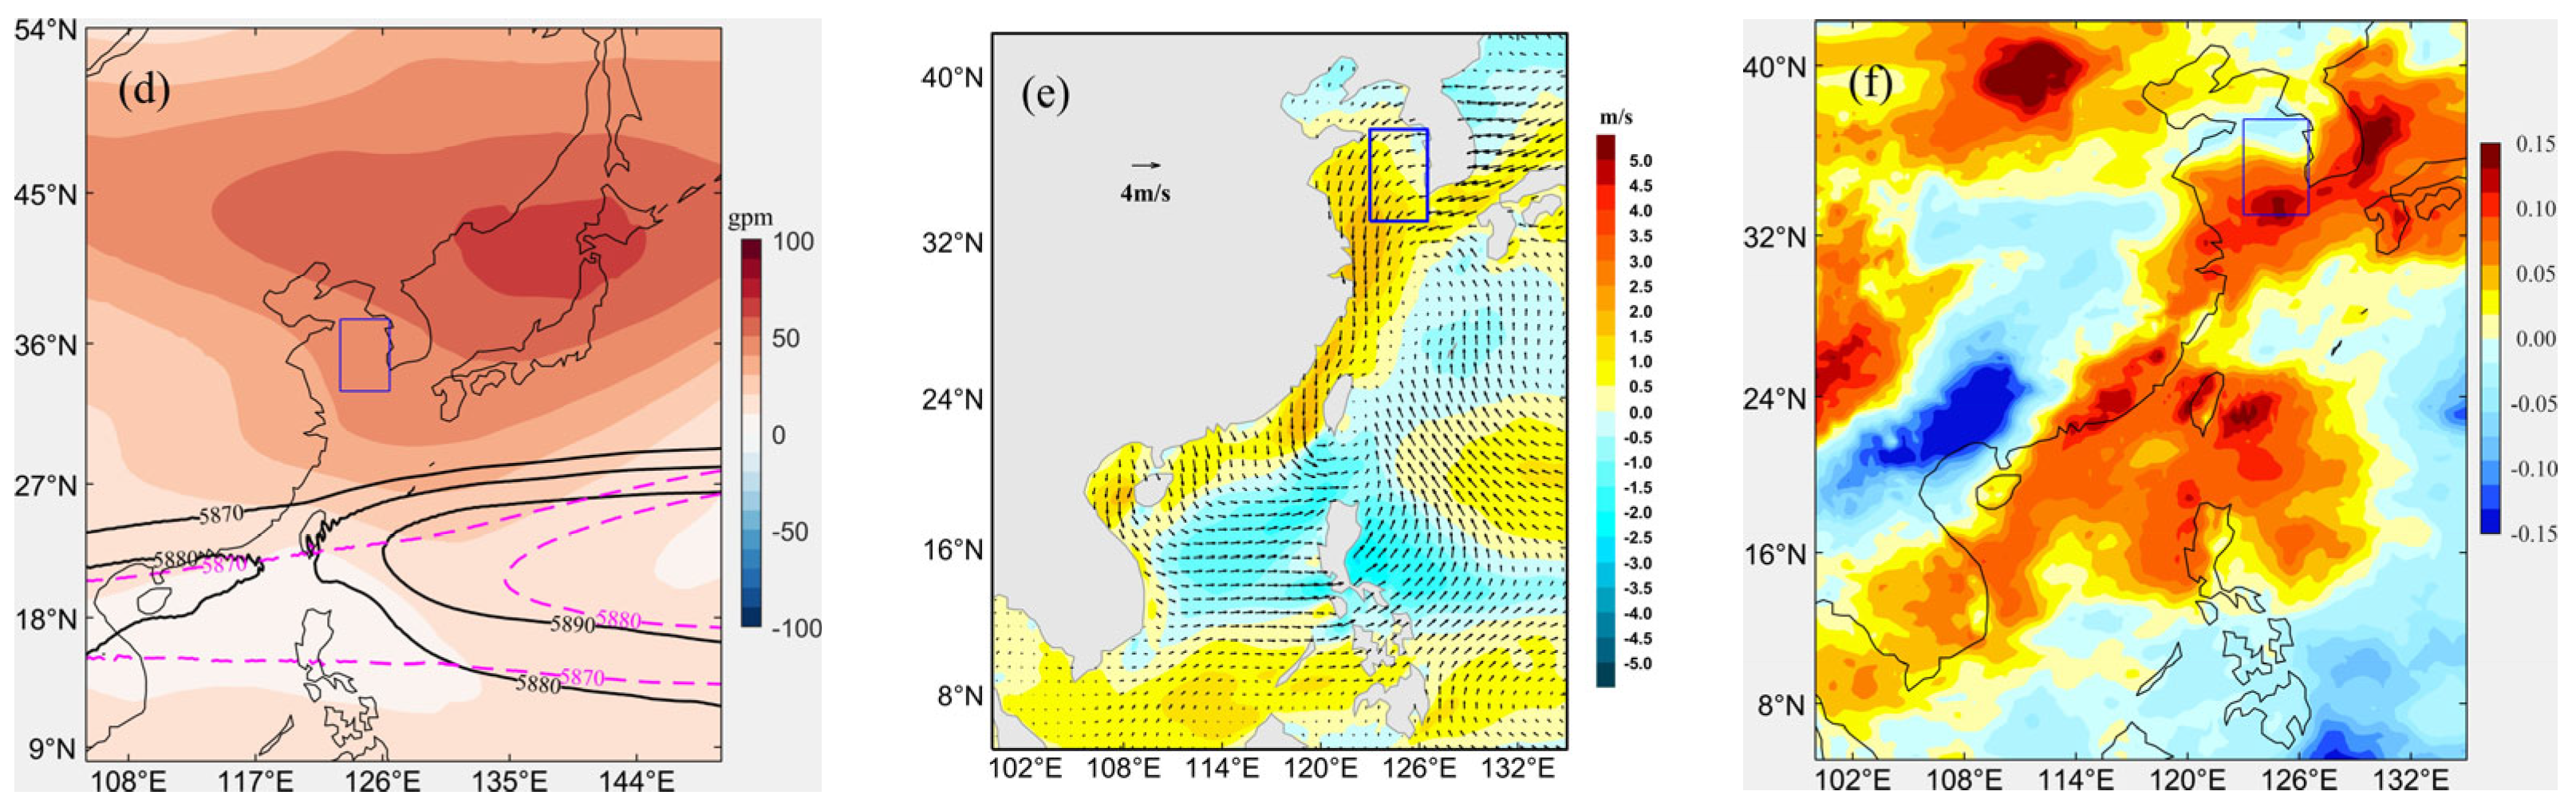
To investigate the mechanisms underlying the occurrence and evolution of this MHW, we analyzed the anomaly fields of geopotential height, wind, and the total cloud cover (Figure 3). The Western North Pacific subtropical high (WNPSH) is a key atmospheric forcing factor influencing the summer climate of the East Asian monsoon region. Variations in its position and intensity significantly affect SST and MHW characteristics in China’s coastal seas [35,36]. Synoptically, the location and extent of the WNPSH are typically delineated using the 5880 gpm contour of 500 hPa geopotential height. However, due to systematic biases in reanalysis datasets, most studies adopt the 5870 gpm contour instead [37]. The 500 hPa geopotential height anomalies reveal a pronounced high pressure anomaly over the northern Yellow Sea. During the onset phase, the WNPSH exhibited a marked westward extension and northward shift, covering the entire study area and leading to reduced wind speeds and decreased cloud cover (Figure 3a–c). These anomalous variations in the WNPSH were influenced by the strong EP type El Niño event of 2023/24 [38], as well as by enhanced convective activity over the Indian Ocean to the Maritime Continent and western Pacific associated with the eastward propagation of the Madden–Julian Oscillation (MJO) from August to September. The WNPSH will be robustly intensified in the future due to the suppressed warming in the western Pacific and the enhanced land–sea thermal contrast [39].
Previous studies have demonstrated that the large-scale subsidence associated with the WNPSH suppressed convective activity and reduced cloud cover, thereby increasing the amount of incoming solar radiation reaching the ocean surface and substantially enhancing the absorption of shortwave radiation by the upper ocean [10,40]. The weakened surface wind environment under the high-pressure system inhibited air–sea heat exchange and evaporation, reducing latent heat loss and promoting the accumulation of heat within the upper ocean. Concurrently, weak winds reduce vertical mixing in the upper ocean, leading to a shallower mixed layer and promoting heat accumulation at the surface, which favors the generation and maintenance of MHWs. During the decay phase of the MHW, the WNPSH retreats southward, resulting in positive wind speed anomalies and increased cloud cover over the study area (Figure 3d–f). The increased cloud cover reduces incoming shortwave radiation. Meanwhile, anomalous easterly winds over the Yellow Sea further intensify the background wind field, promoting surface evaporation. The wind-evaporation-SST (WES) feedback mechanism enhances latent heat release, driving surface cooling.

3.3. Mixed-Layer Heat Budget Analysis

To quantify the relative contributions of atmospheric forcing and oceanic dynamic processes to the onset and decay of MHWs, we conducted a mixed layer heat budget analysis and plotted regionally averaged heat budget bar charts for the onset and decay phases, further verifying the dominant role of atmospheric forcing.
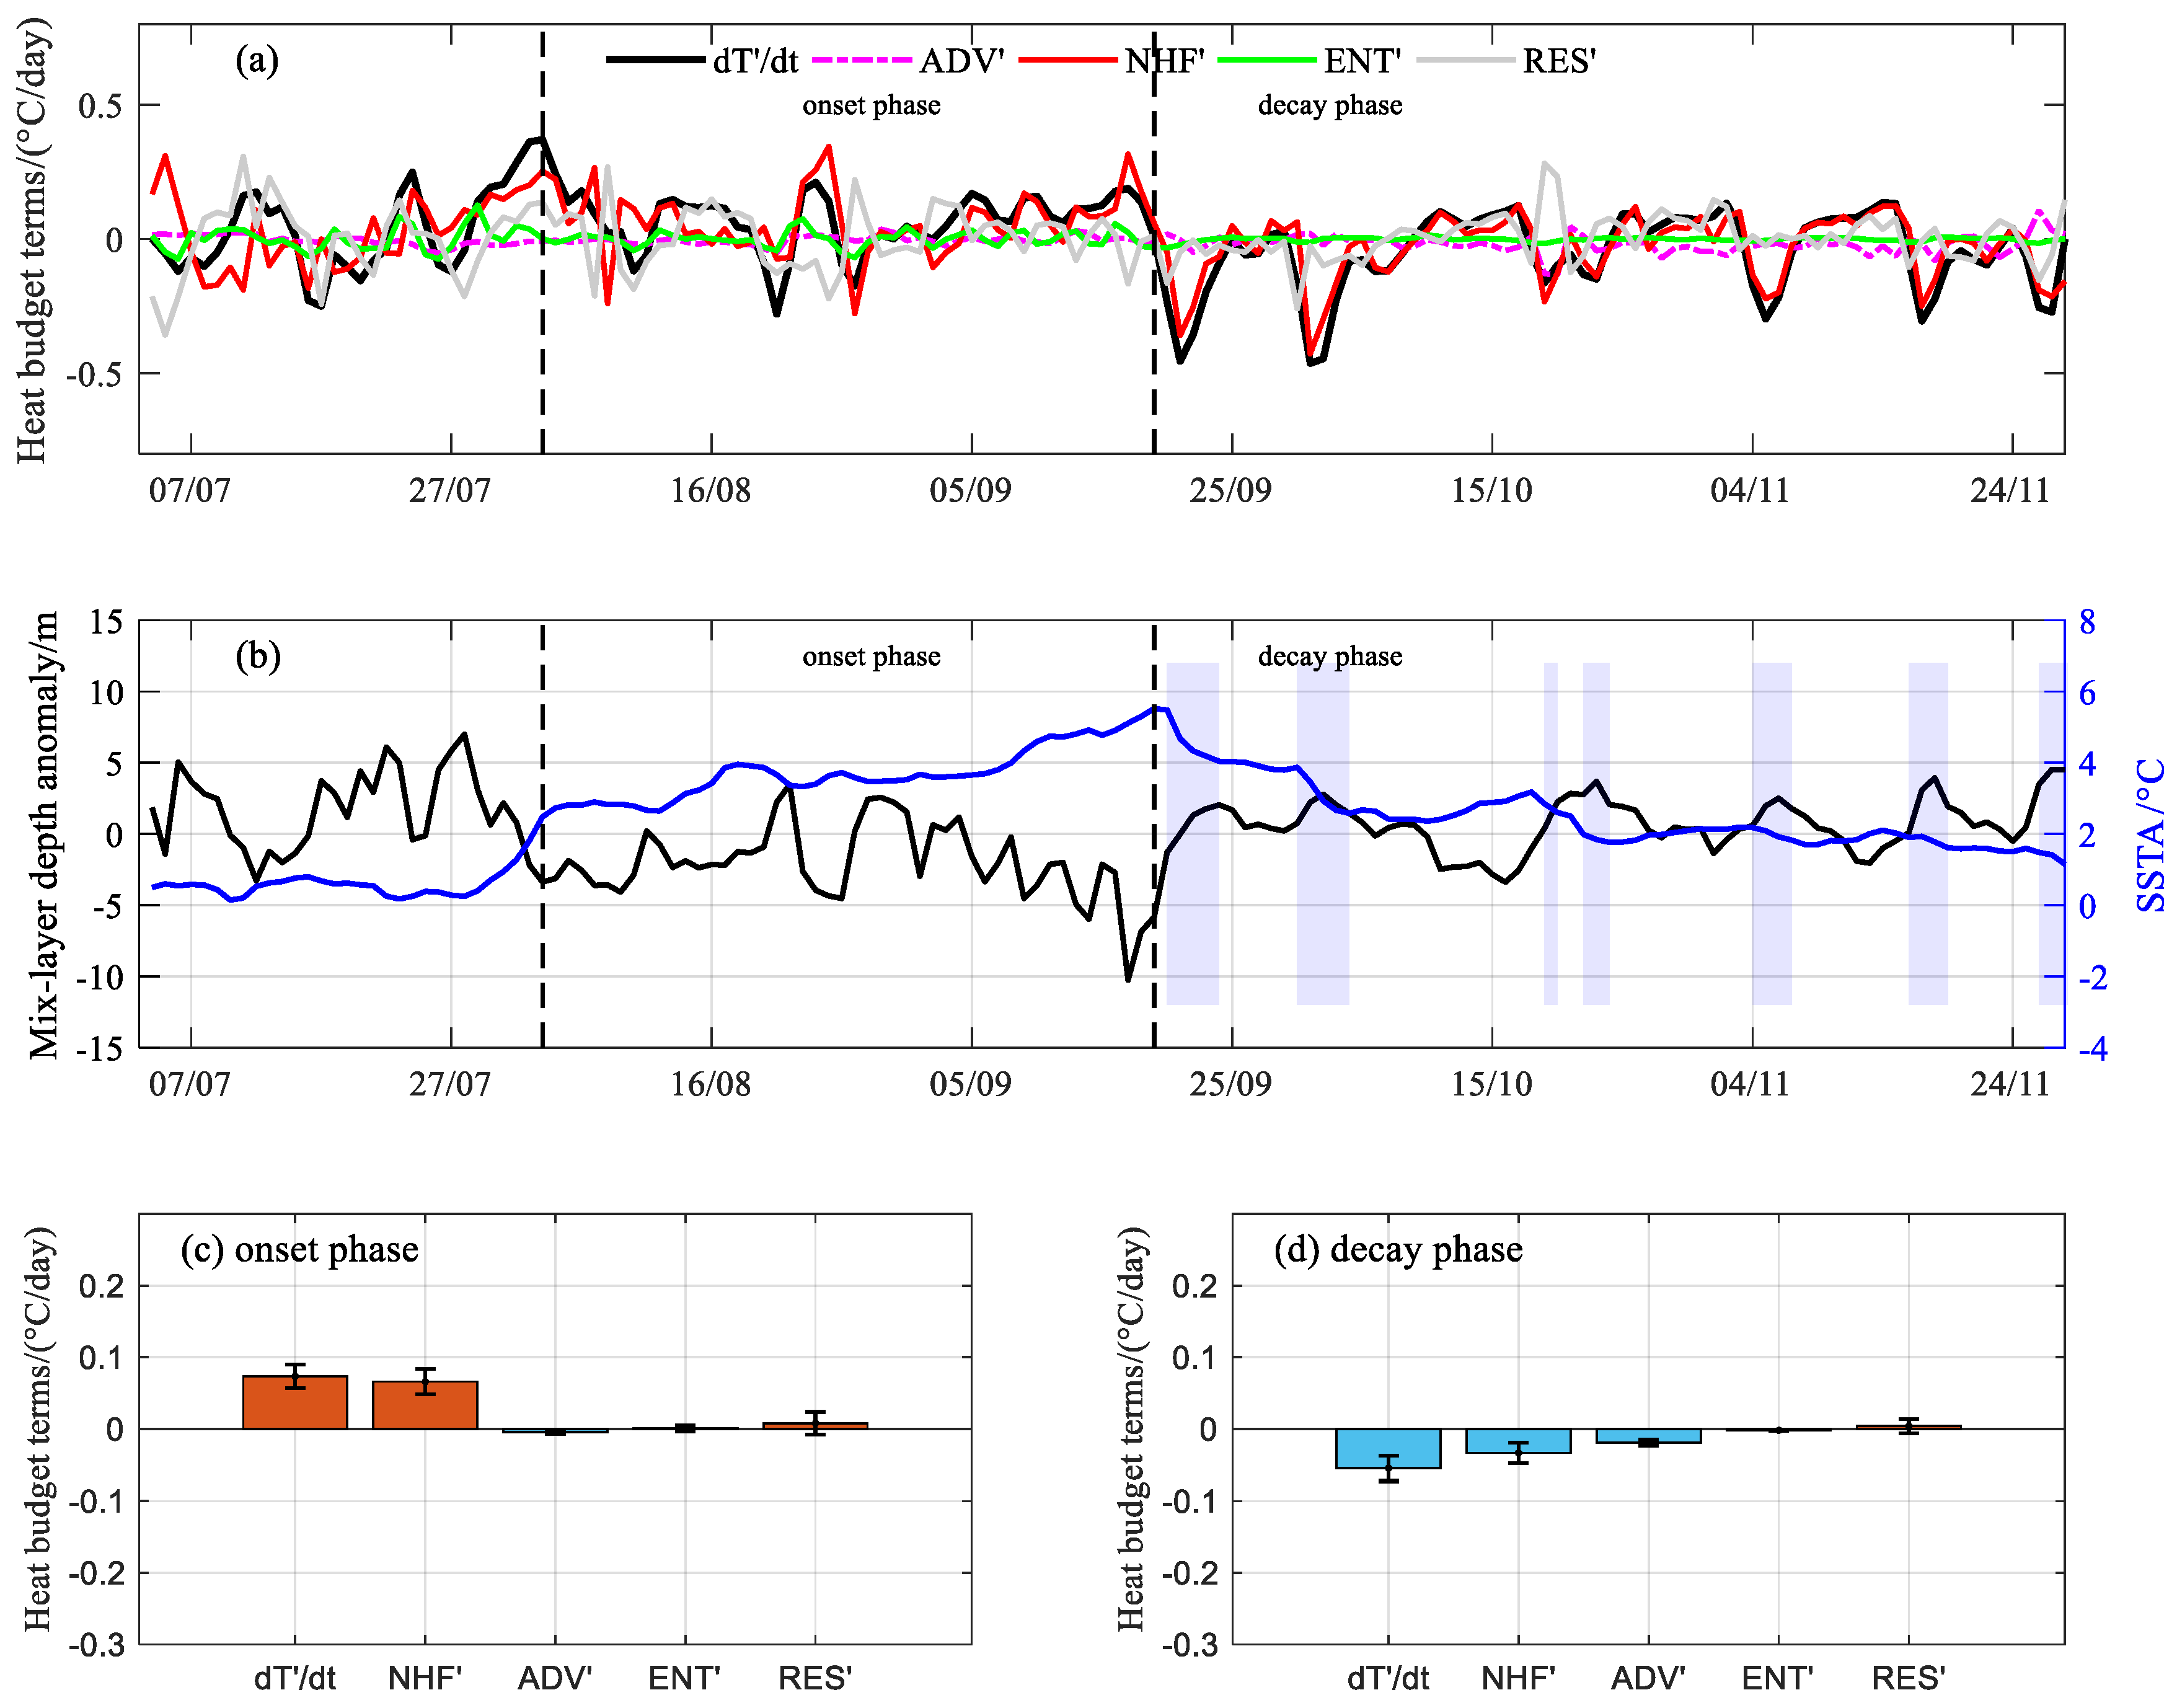
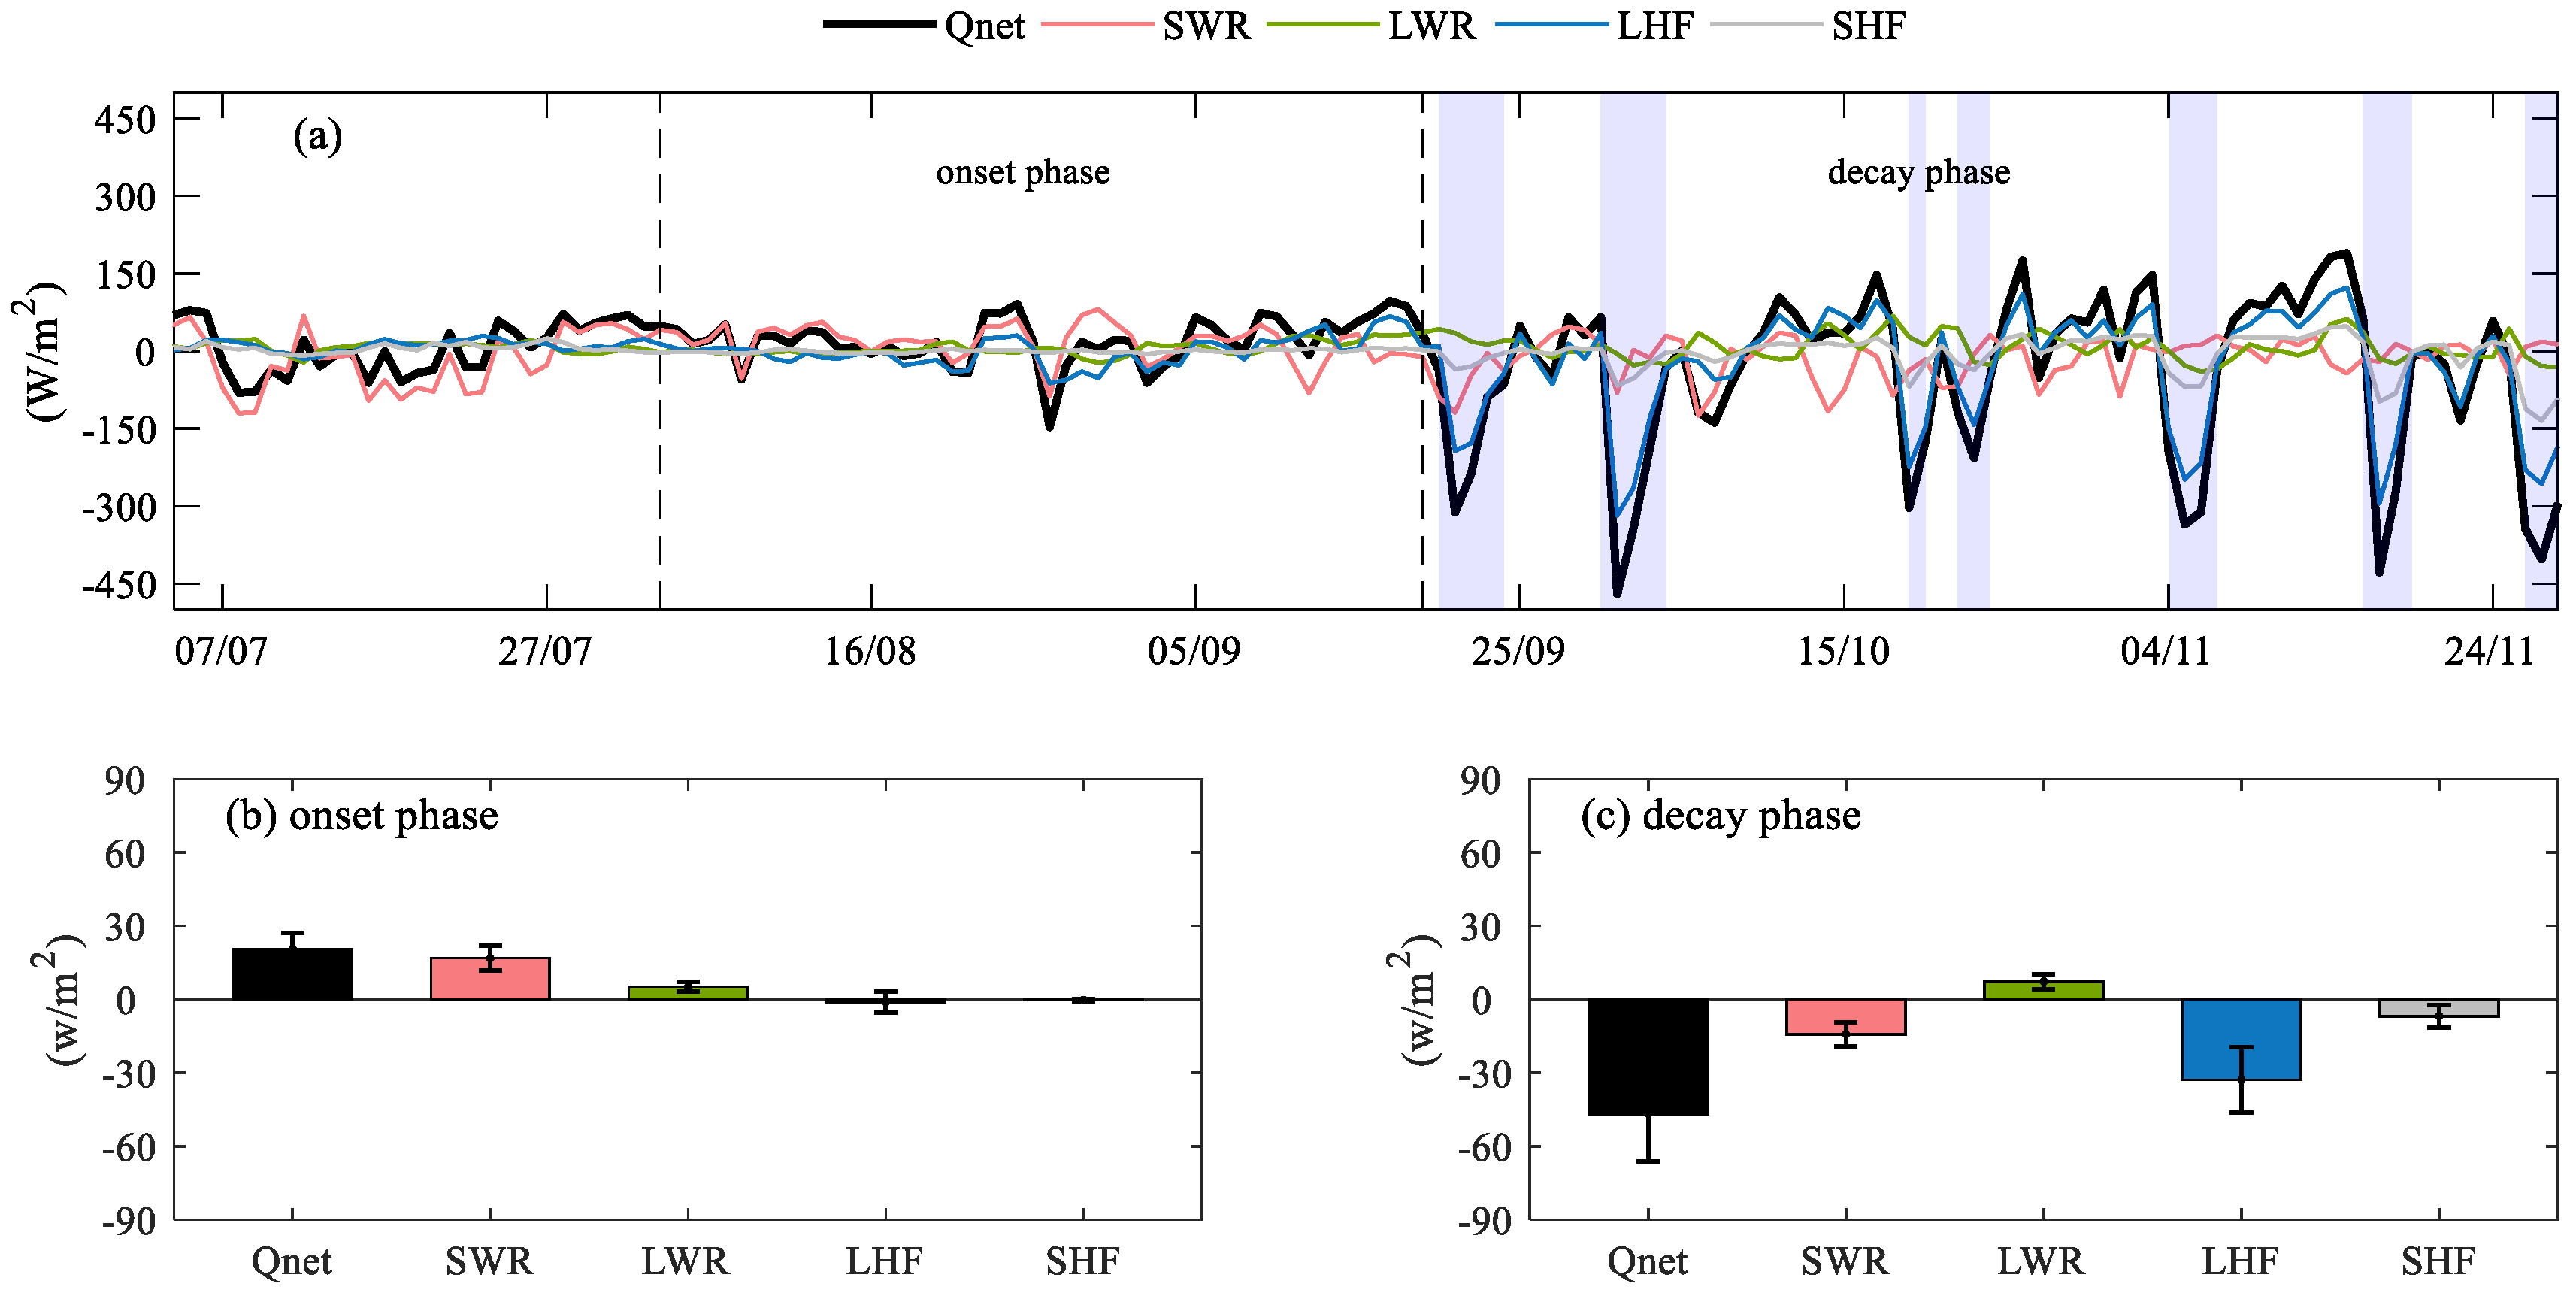
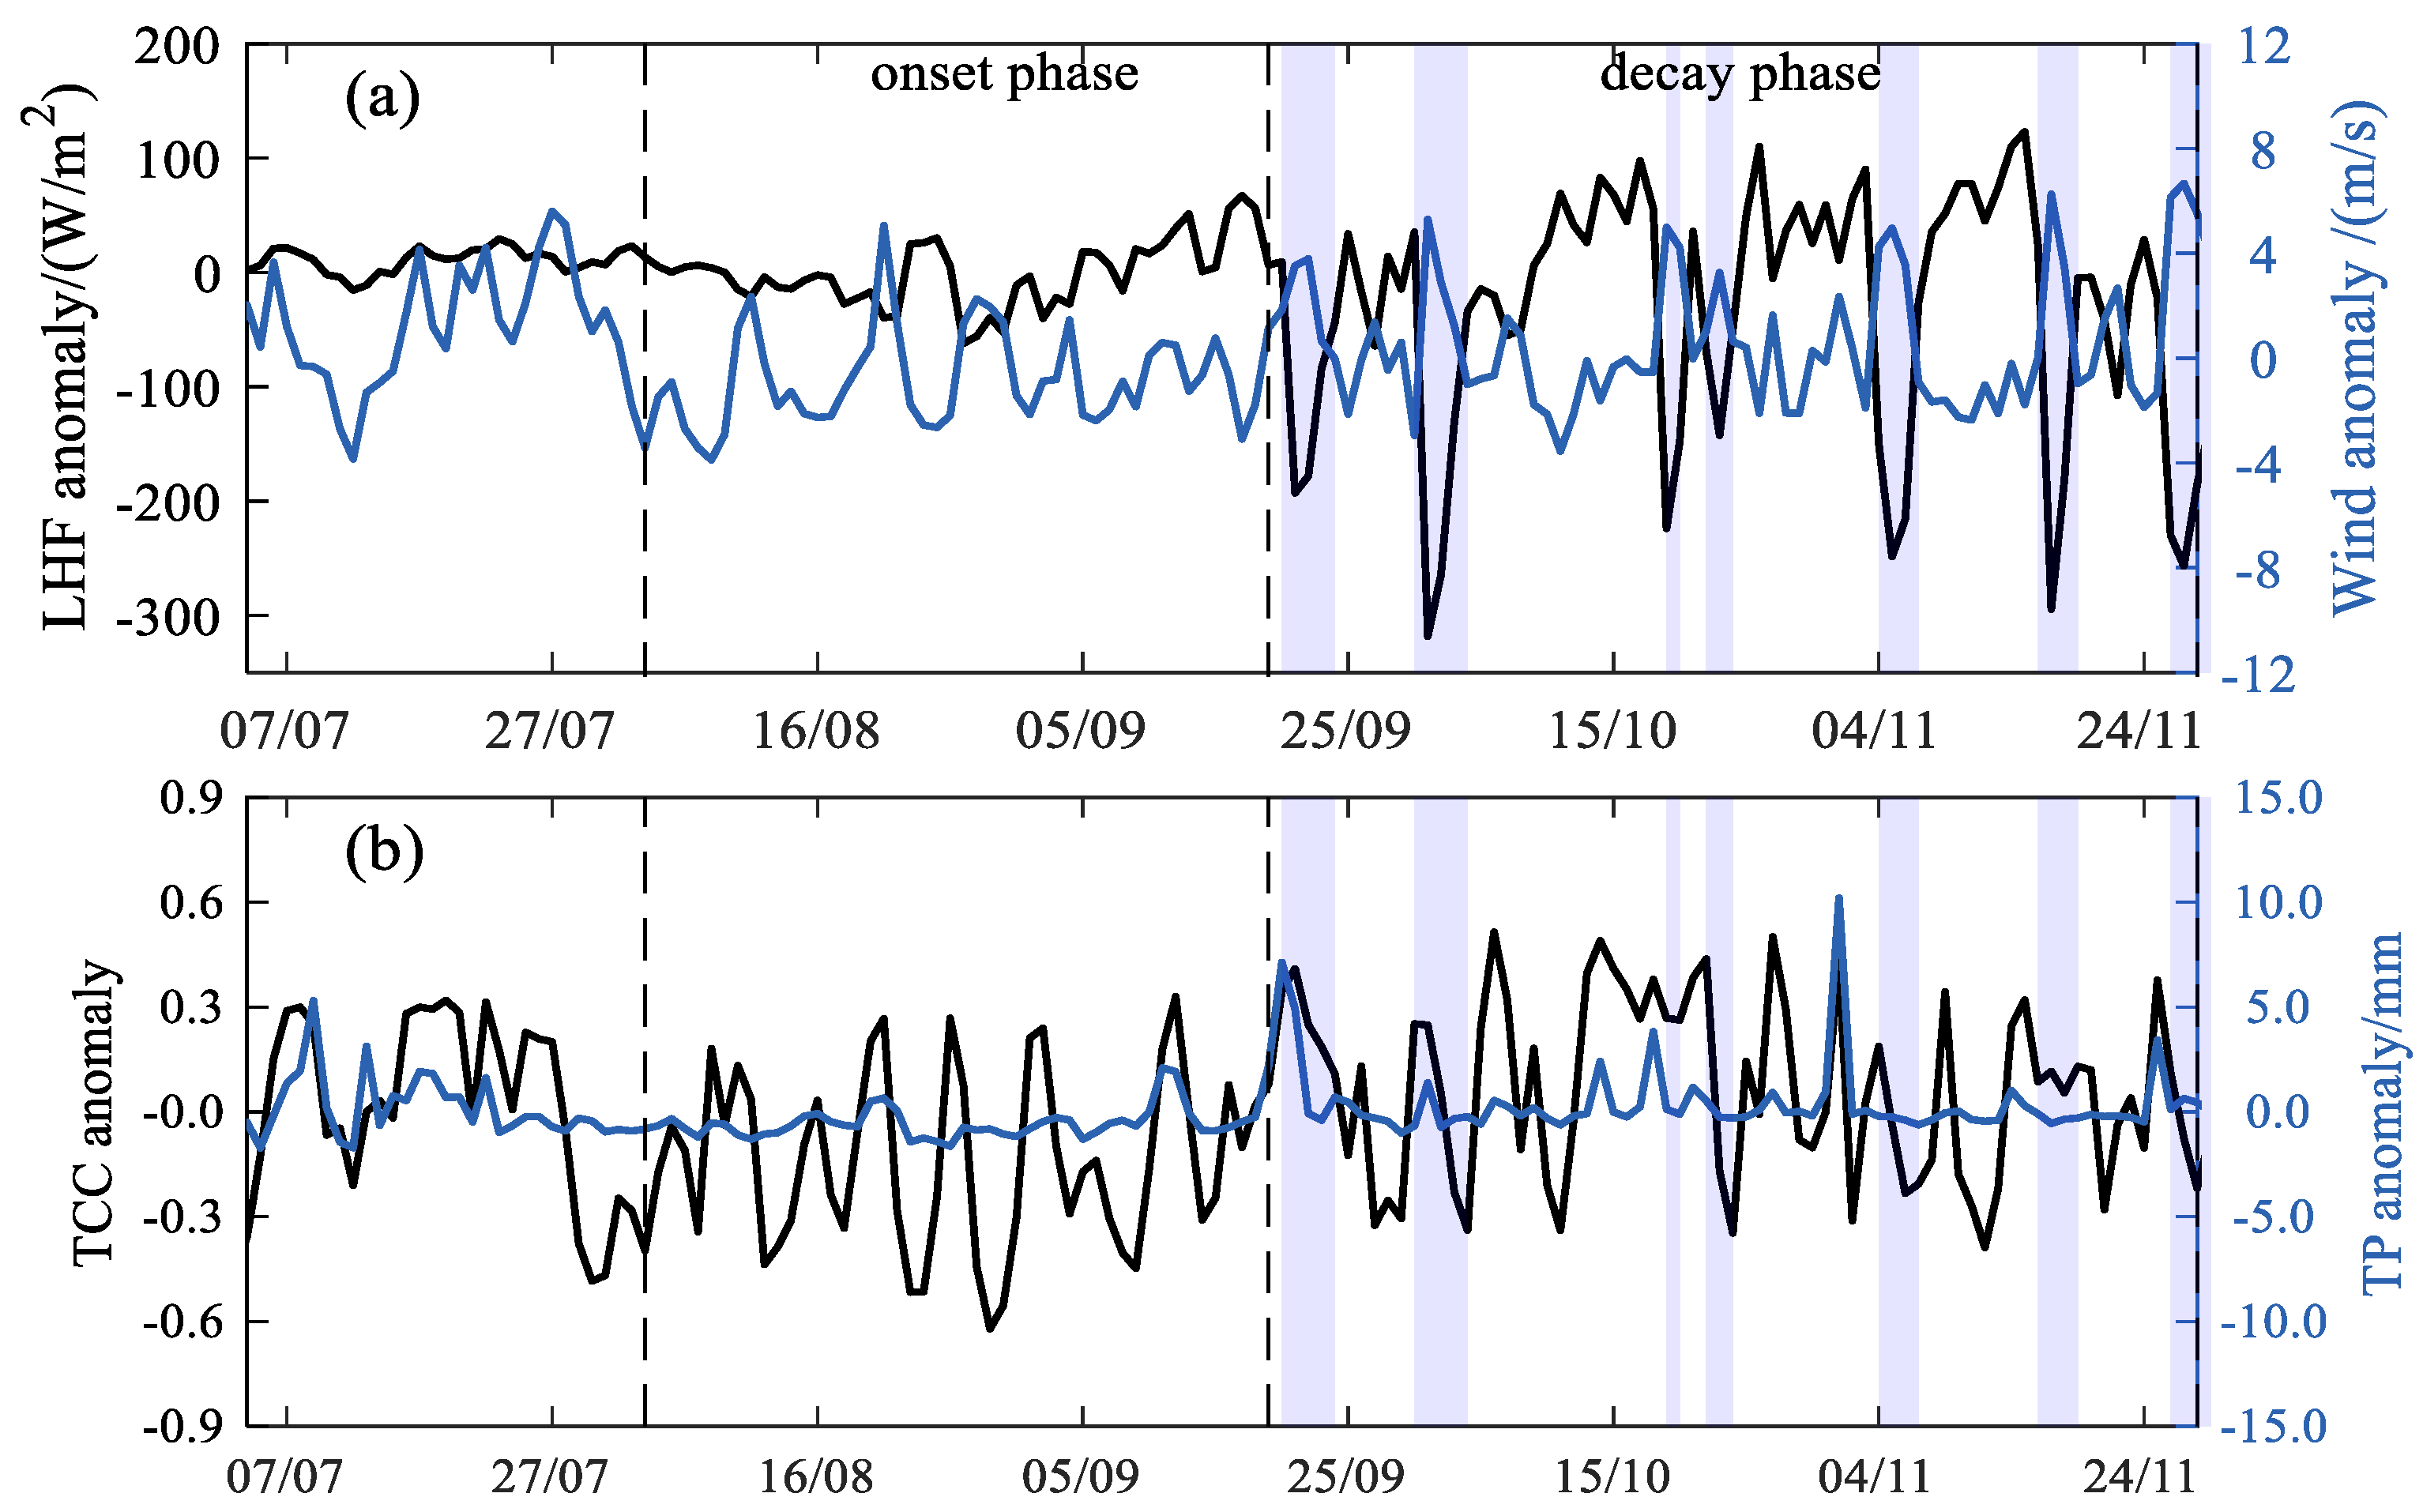
Our results indicate that horizontal advection and vertical entrainment terms contributed minimally to this summer MHW; instead, the mixed-layer temperature tendency was predominantly controlled by the net surface heat flux (Table 1 and Figure 4). During the onset phase of the MHW, the WNPSH extended westward and shifted northward, placing the Yellow Sea under the influence of this subtropical high system. This high-pressure system induced sustained atmospheric subsidence and increased static stability, leading to a significant reduction in cloud cover (negative cloudiness anomalies). In August 2024, the mean cloud cover over the study area in the Yellow Sea ranked as the second-lowest since 1980. Consequently, the resulting increase in net shortwave radiation provided favorable conditions for the maintenance and intensification of the MHW. In contrast, variations in sensible heat flux and longwave radiation were relatively small, contributing little to the development of the MHW (Figure 5a). During 19–20 August, the MHW intensity temporarily declined under the influence of Typhoon Jongdari. The typhoon attenuated the heatwave through two main effects: increased cloud cover reduced incoming solar radiation, while intensified surface winds deepened the mixed layer and enhanced latent heat flux, jointly promoting surface cooling (Figure 6). In summary, during the onset phase, the pronounced increase in shortwave radiation and weakened surface winds stabilized the upper ocean and inhibited turbulent mixing, ultimately generating positive sea surface heat flux anomalies that drove anomalous ocean warming. Under conditions of an extremely shallow mixed layer, shortwave radiation acted as the primary forcing agent responsible for Yellow Sea SST anomalies from August to September 2024. Accordingly, the 2024 Yellow Sea MHW was closely associated with anomalously enhanced solar radiation and weakened surface winds.
During the decay phase, mixed layer cooling was primarily dominated by net surface heat flux and advective contributions (Table 1 and Figure 4), with latent heat flux acting as the dominant drivers of negative heat flux anomalies (Figure 5b). Further analysis of seven prominent cooling episodes identified multiple weather systems affecting the Yellow Sea (Table 2). Specifically, the region was influenced by Typhoons Pulasan (2414), Krathon (2418), Trami (2420), and Man-yi (2424), all of which were coupled with cold air intrusions on various dates between September and November. Additionally, episodes driven solely by cold air occurred in mid-October and throughout November [41,42]. Positive wind speed anomaly controlled latent heat fluxes and mixed-layer dynamics (Figure 4b). Both of the first three cooling events were also influenced by the reduction in shortwave radiation resulting from increased cloud cover (Figure 6). Under the combined influence of typhoon induced low pressure systems and cold air intrusions, surface latent heat flux exhibited pronounced negative anomalies, leading to declines in SST.

3.4. Remote Driving Mechanisms: Atmospheric Teleconnections

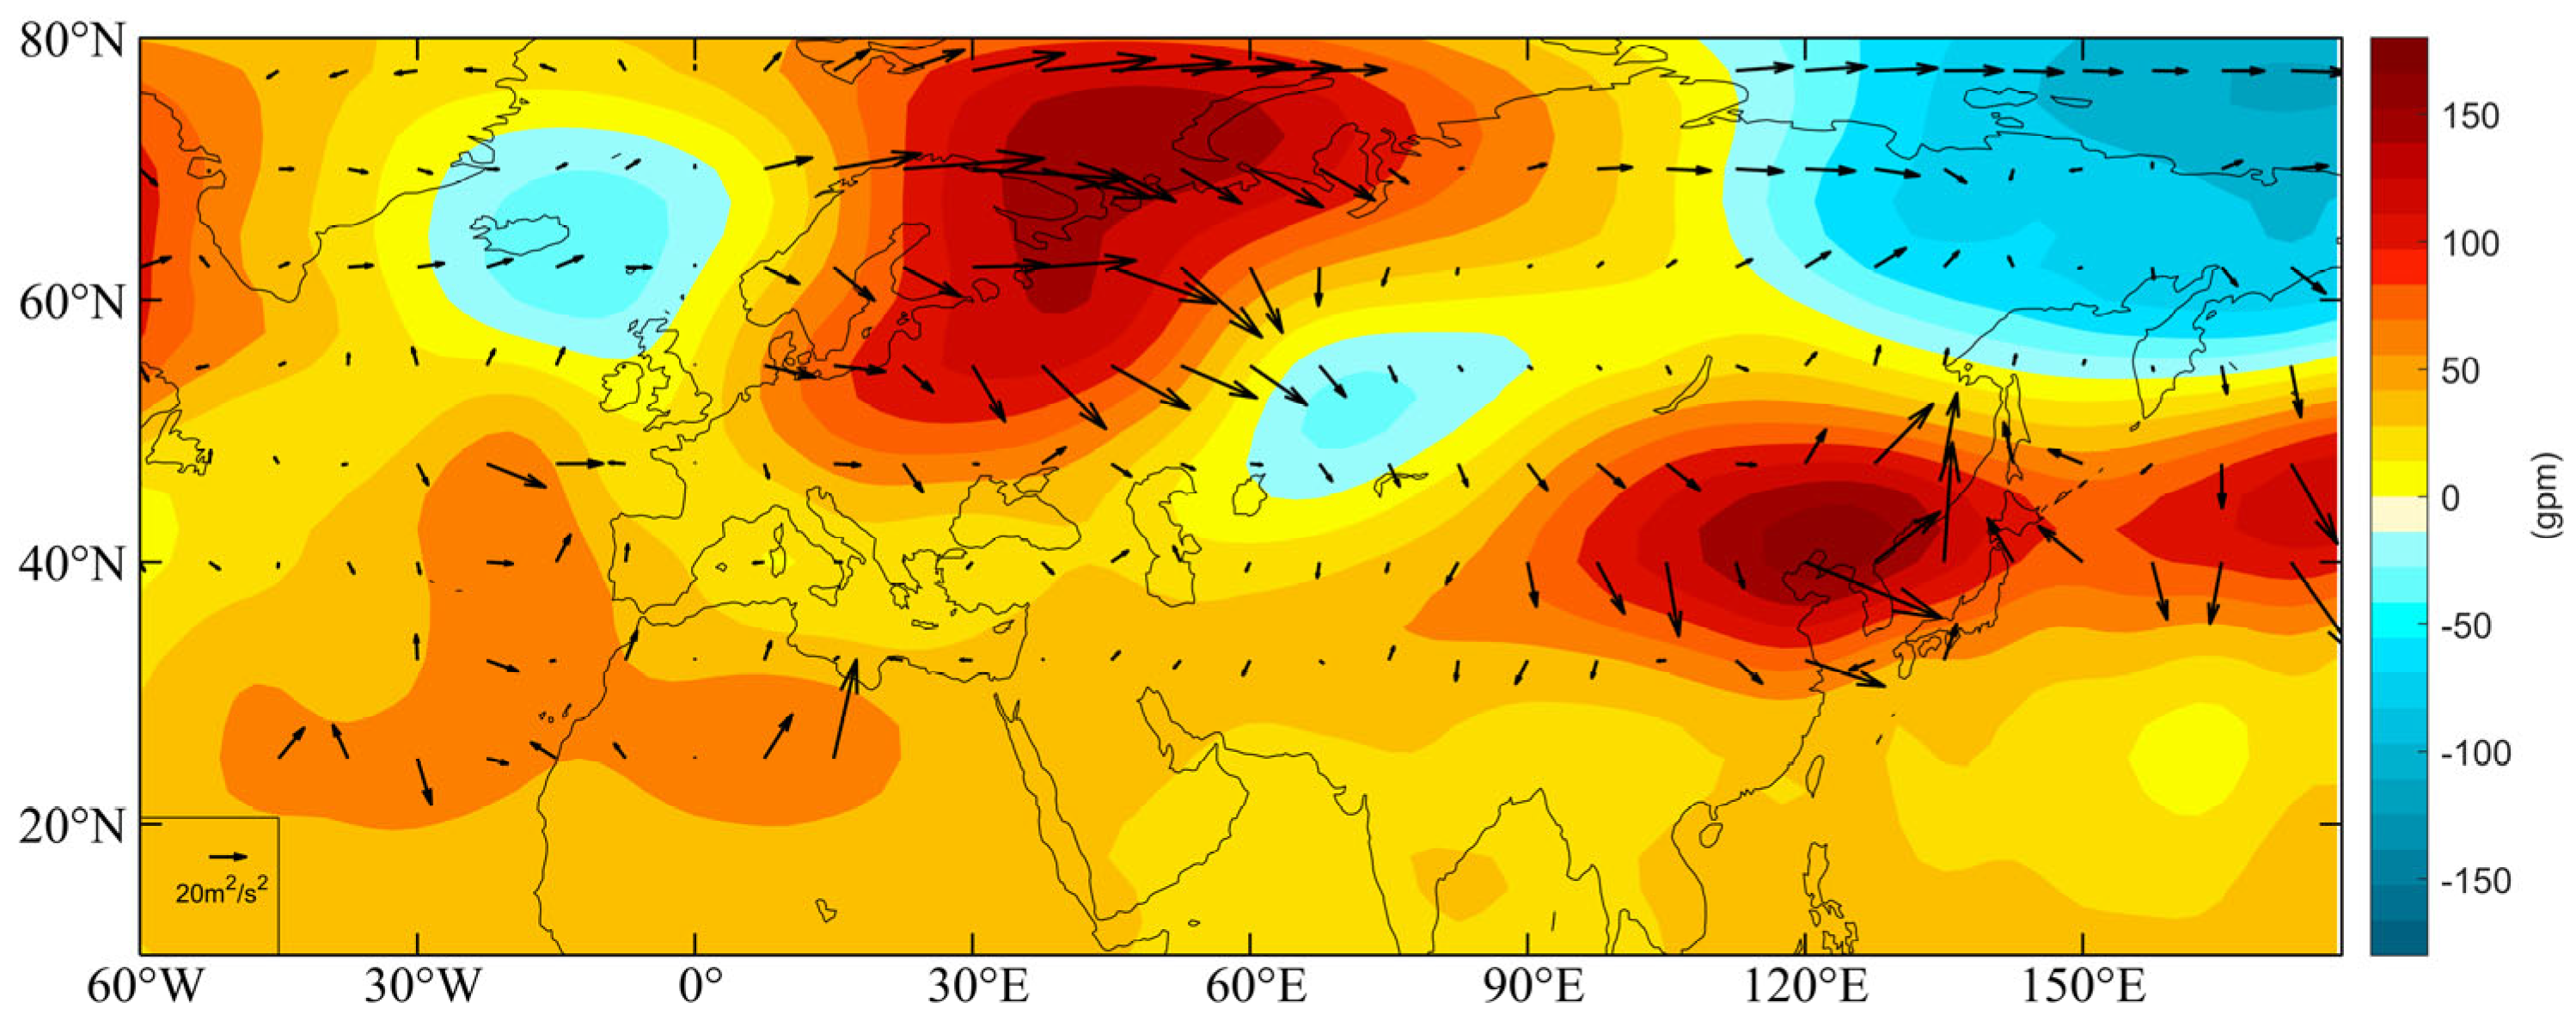
The anomalous high-pressure system over the Yellow Sea has been identified as a key driver of the 2024 MHW. However, a fundamental question arises: what physical mechanisms triggered this local circulation anomaly? Previous studies have shown that mid-to-high latitude wave trains across Eurasia can induce anticyclonic anomalies over East Asia [43]. To elucidate the dynamical propagation pathways, we analyzed the 250 hPa geopotential height anomalies and the corresponding horizontal wave activity flux. The wave activity flux vectors indicate that the energy of the Northeast Asian high over the Yellow Sea primarily originated from the upstream European high. Meanwhile, the subtropical high provided a local energy supply for the maintenance of the Northeast Asian high through meridional advection and circulation coupling. The energy convergence and synergistic effects of these two systems in Northeast Asia jointly led to the establishment and maintenance of the blocking high in that region (Figure 7). Under the influence of this teleconnection pattern, a wave structure—comprising an anticyclone over Northern Europe, a cyclone east of the Ural Mountains, and an anticyclone over Northeast Asia—acts as the primary driver for the formation and intensification of the local anticyclonic anomaly. The extreme prolonged MHW event investigated in this study was influenced by a persistent anomalous anticyclone over the Yellow Sea that remained quasi-stationary for nearly four months. Both observational and numerical studies have confirmed the profound impact of North Atlantic SST anomalies on Eurasian atmospheric circulation and regional climate [44,45,46]. Reduced sea ice in the northern Barents Sea can produce strong turbulent heat fluxes, acting as an anomalous Rossby wave source [47,48]. The resulting quasi-stationary Rossby wave activity flux propagates toward East Asia and induces a summer Eurasian mid–high latitude teleconnection pattern characterized by a “+ − +” wave structure. This wave train induces an anomalous anticyclone over East Asia, favoring the westward extension of the WNPSH and the formation of regional anticyclonic circulation anomalies.
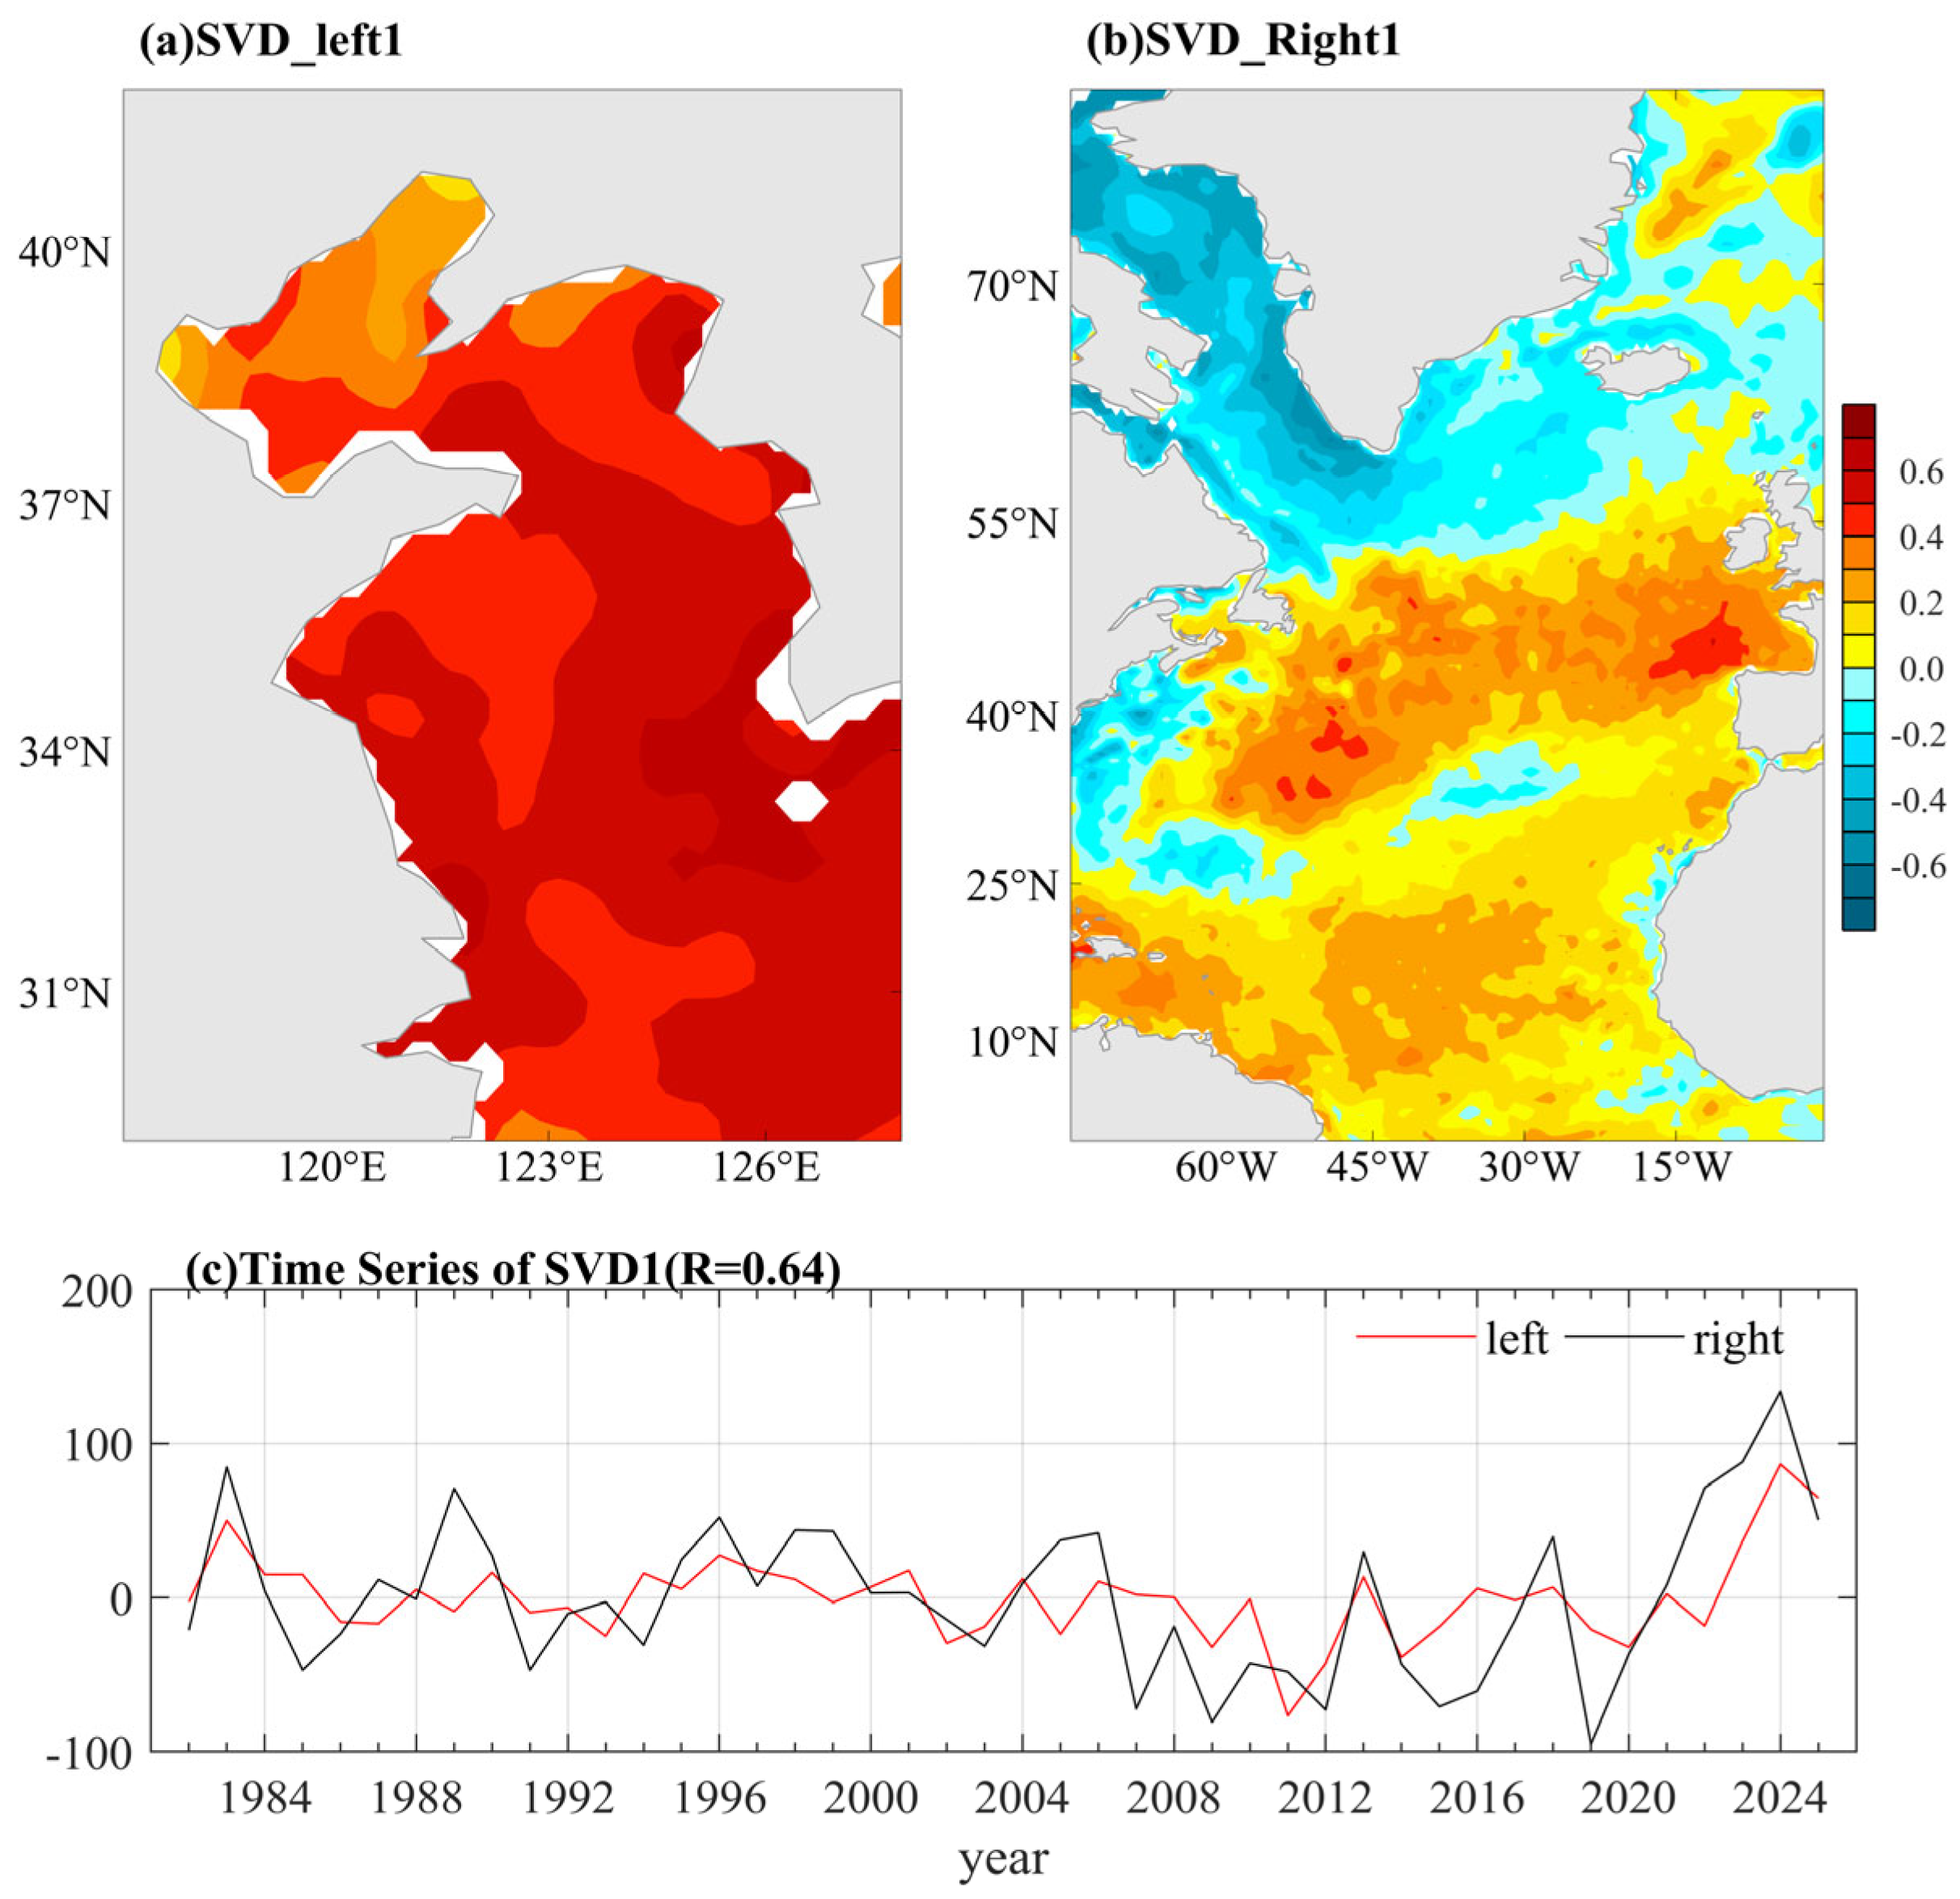
To further verify this teleconnection, we conducted a lead-lag singular value decomposition (SVD) analysis of SST anomaly fields over the Yellow Sea and two remote regions, the North Atlantic and the Barents Sea. The results indicate that when North Atlantic SST leads Yellow Sea SST by one month, both the variance contribution of the first mode and the temporal correlation coefficient reach their maxima, indicating a strong coupling relationship. The first mode explains 74.7% of the total variance, which is much larger than that of other modes, and the correlation coefficient between the time series of the spatial patterns is 0.64, well above the 95% confidence level (Figure 8). The spatial pattern of this dominant mode is consistent with the SST anomalies observed during the same period in 2024, suggesting that the anomalous thermal state of the North Atlantic serves as a preceding signal driving the SST variability in the Yellow Sea.
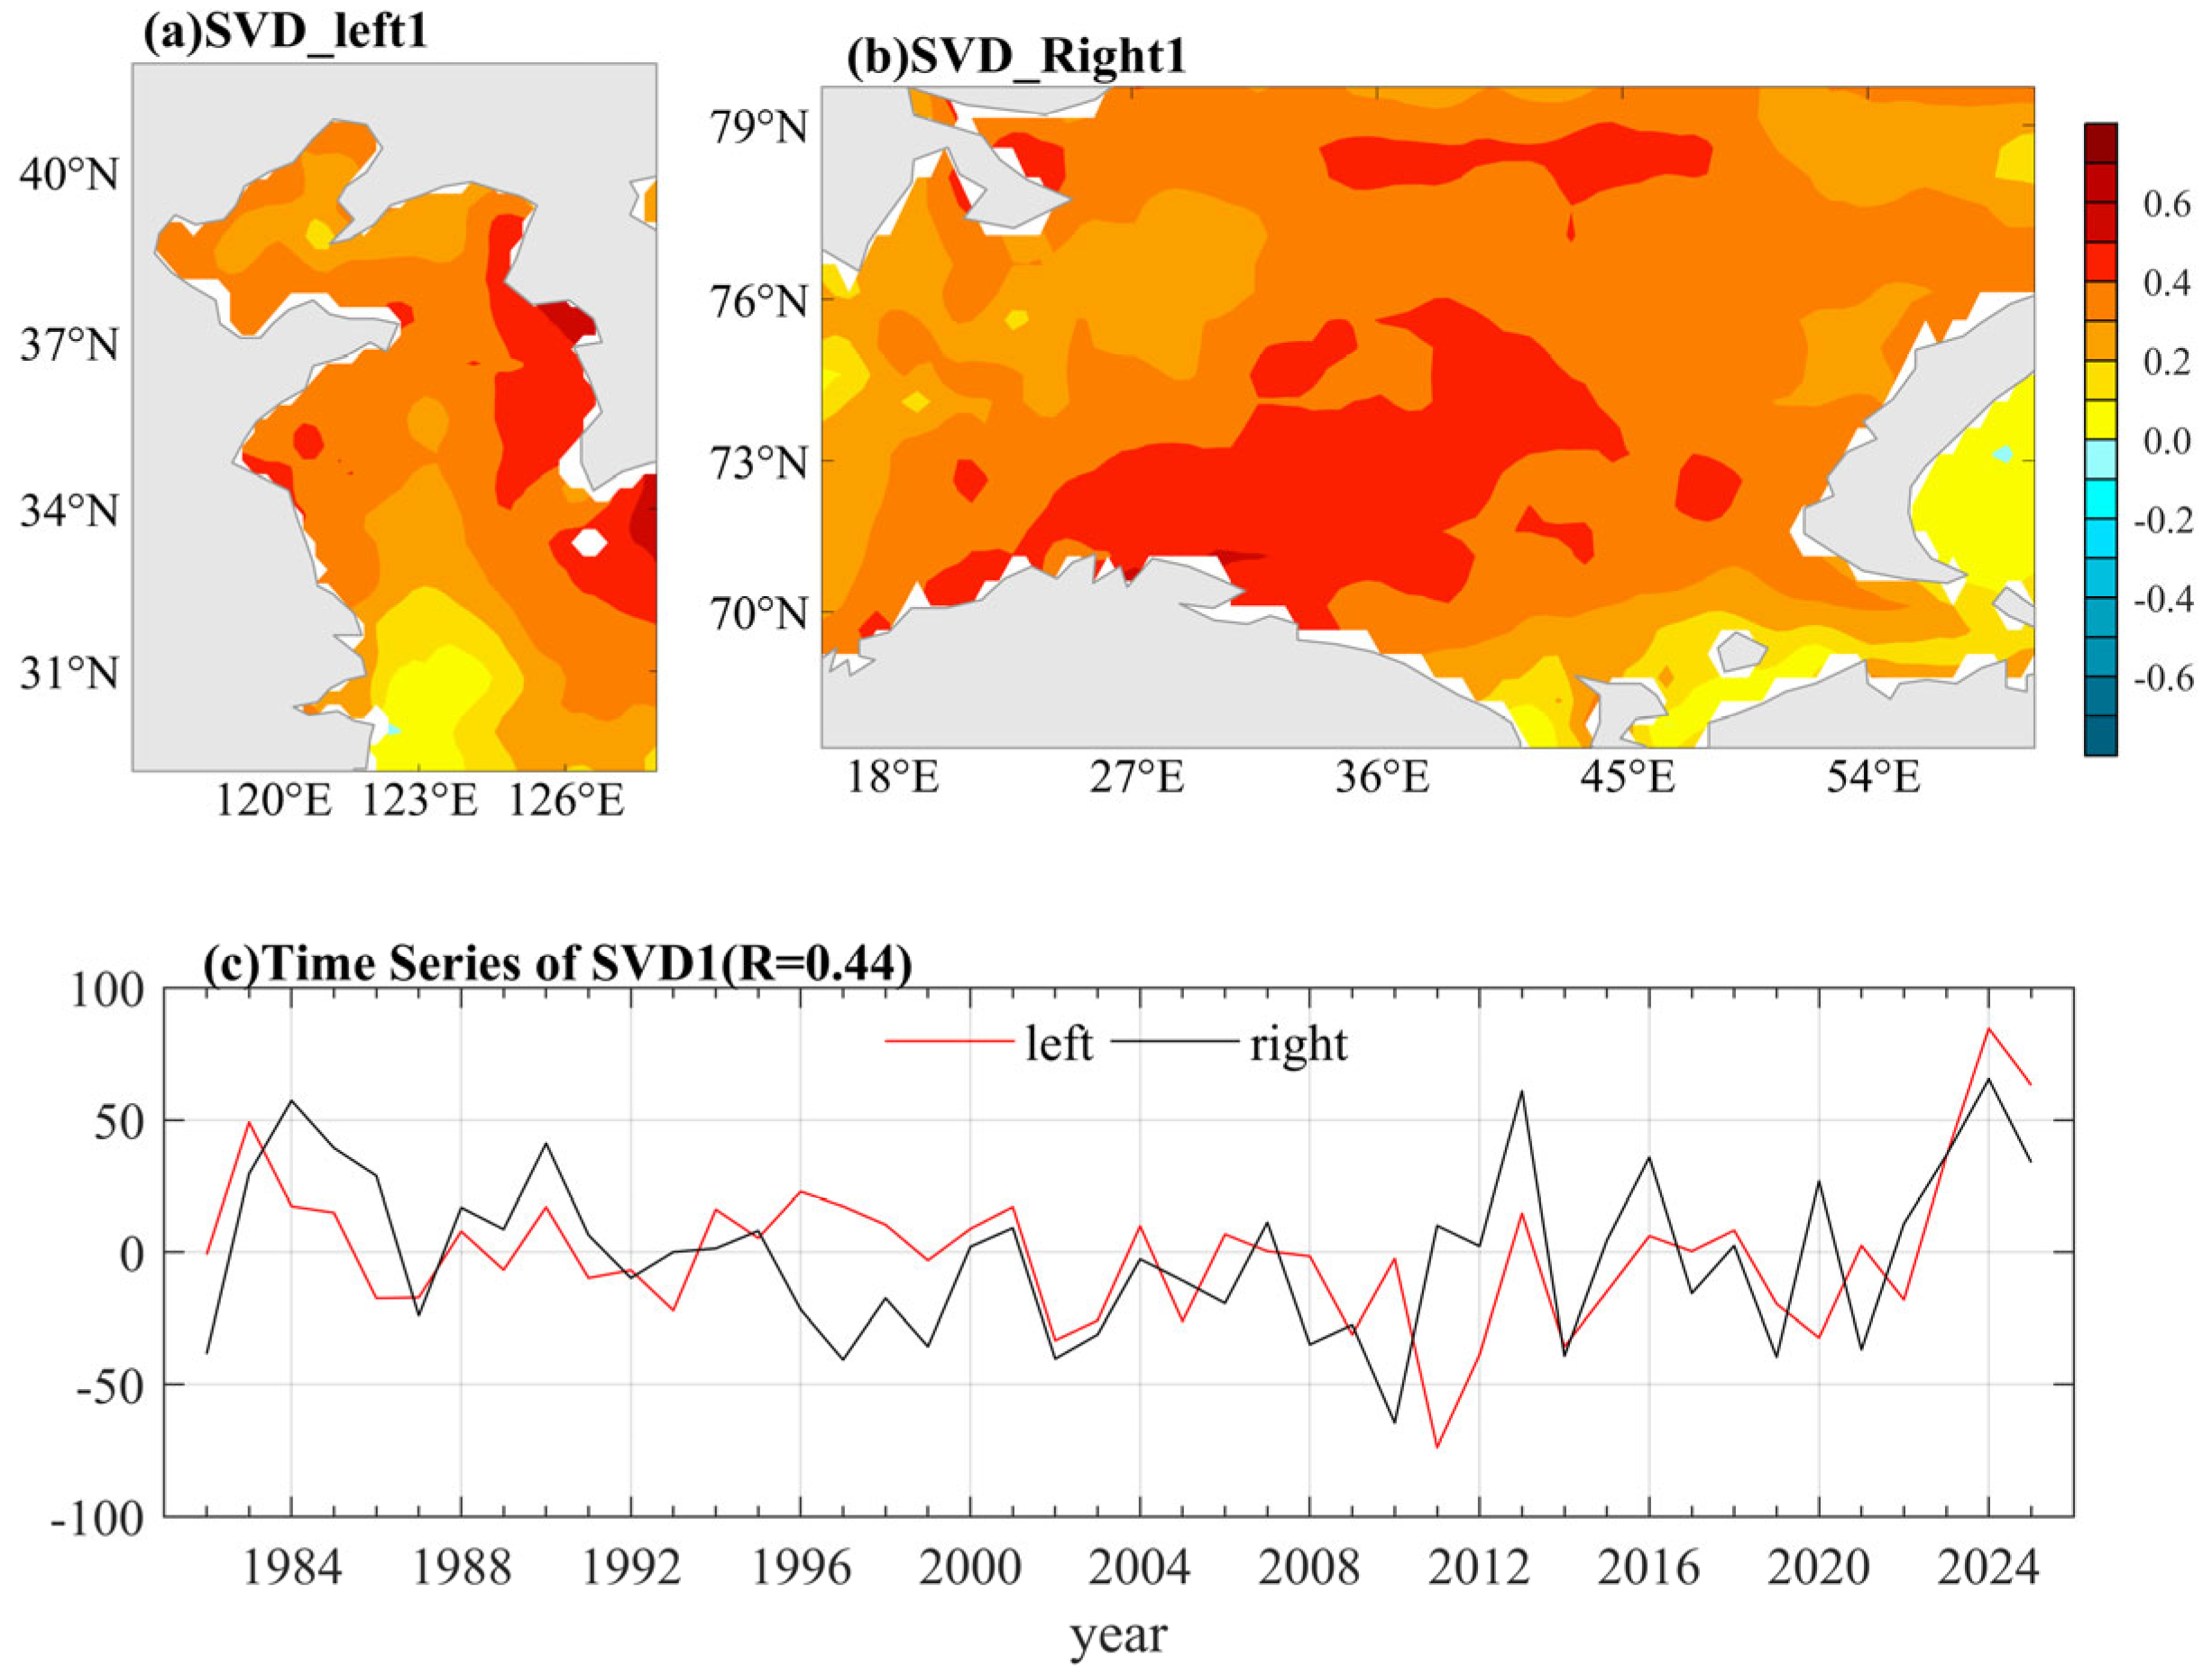
When the Barents Sea SST is concurrent with the Yellow Sea SST, the first mode again exhibits the largest variance contribution and temporal correlation coefficient, indicating the strongest coupling between the two fields. The first mode accounts for 92.9% of the total variance, far exceeding other modes, and the correlation coefficient between the time series of the spatial patterns is 0.44, well above the 95% confidence level (Figure 9). The spatial pattern of this dominant mode is also consistent with the SST anomalies during the same period in 2024: when the Barents Sea SST shows a positive anomaly, the Yellow Sea SST also exhibits a positive anomaly. Notably, the time coefficients of the coupled modes for the Atlantic, the Barents Sea, and the Yellow Sea all reached their maxima in 2024. These statistical diagnostics confirm a robust linkage between the thermal states of the North Atlantic, the Barents Sea, and the Yellow Sea during this extreme event. To investigate whether the coupling between the left and right fields is driven by the common large-scale circulation factor ENSO, we removed the preceding winter (December–February) ENSO signal from both fields to isolate its influence and then performed the SVD analysis again. The results show that the coupling between the two fields remains significant, indicating a genuine interaction that is independent of ENSO.

4. Discussion and Limitations

The Yellow Sea, a key marginal sea along the eastern coast of China, exhibits distinctive characteristics in the occurrence of MHWs, which arise from the combined influences of anthropogenic climate warming, atmospheric forcing, oceanic dynamical processes, large-scale climate modes, and regional environmental conditions. Recent research highlights the important role of stratospheric variability in influencing heatwaves and weather conditions more generally [49]. Anthropogenic global warming provides the fundamental background for the increasing frequency and intensity of MHWs in the Yellow Sea, as rising global temperatures substantially elevate the probability of extreme thermal events. In contrast, atmospheric forcing acts as the immediate driver of most summer MHWs in this region. During such events, the Yellow Sea is typically dominated by persistent high-pressure systems that suppress cloud formation, thereby enhancing incoming shortwave radiation and increasing heat absorption at the sea surface. Concurrently, the shallow summer mixed layer facilitates rapid heat accumulation in the upper ocean, significantly amplifying the intensity of MHWs. Although direct investigations of local anthropogenic influences in the Yellow Sea—such as coastal reclamation and shipping—remain limited, global-scale studies suggest that localized thermal discharge and modifications of the underlying surface conditions associated with human activities may further exacerbate nearshore MHW intensity [50].
From 1982 to 2025, both the cumulative intensity and duration of MHWs in the Yellow Sea have exhibited significant upward trends. This evolution is consistent with the global tendency toward increasingly frequent and intense marine heatwaves [51,52]. As the upper ocean continues to warm under ongoing climate change, the duration and intensity of MHWs are projected to increase further [8,53]. In this study, we provide a comprehensive assessment of the extensive MHW event that occurred in the Yellow Sea during the summer of 2024. Mixed-layer heat budget analysis indicates that anomalous surface heat fluxes associated with an anticyclonic high-pressure system played a dominant role in driving the mixed-layer warming. Previous studies have demonstrated that atmospheric circulation over East Asia is strongly influenced by several large-scale teleconnection patterns, including zonally oriented wave trains such as the Eurasian (EU), Silk Road (SR), and circumglobal teleconnection (CGT), as well as meridional patterns such as the Pacific–Japan/East Asia–Pacific (PJ/EAP) teleconnection [54,55,56]. Using horizontal wave activity flux diagnostics, this study further examines the atmospheric background during the summer of 2024 and reveals the dynamical pathway responsible for the anomalous high-pressure system over the Yellow Sea. The results indicate a close association with the EU teleconnection pattern. Characterized by a zonally propagating wave train, the EU pattern was persistently forced by warm SST anomalies in the North Atlantic and Barents Sea, which induced circulation anomalies across the mid–high latitudes of Eurasia and ultimately modulated wind patterns and radiative fluxes over the Yellow Sea region. Equatorial tropical convection, particularly the Madden–Julian Oscillation (MJO; Madden and Julian, [57]), can also excite large-scale circulation anomalies. Much like the Eurasian (EU) wave train driven by North Atlantic and Barents Sea warming, these anomalies can propagate into the mid–high latitudes and subsequently influence marine heatwaves in the Yellow Sea. Large-scale circulation anomalies in the extratropics vary with both the intensity and location of MJO-related diabatic heating [58,59,60]. When the equatorial heat source associated with the MJO intensifies, positive anomalies in geopotential height and surface air temperature over Northeast Asia tend to strengthen accordingly [61]. During the marine heatwave period in August and September 2024, MJO activity over the Indian Ocean, the Maritime Continent, and the western Pacific was unusually active. thereby driving an anomalous northward displacement of the western North Pacific subtropical high (WNPSH) [62,63]. Future work will quantify the respective impacts of the MJO and Atlantic teleconnections on Yellow Sea MHWs.
MHWs are increasingly recognized as “biological wildfires” with profound socio-economic ramifications [64,65]. The catastrophic 2018 MHW in the Bohai and Yellow Seas—where SSTs surged 5 °C above the climatological mean for over 20 days—resulted in the mass mortality of farmed sea cucumbers and economic losses exceeding 15 billion RMB [11,15]. Moreover, MHWs often manifest as compound disasters, co-occurring with ocean acidification, hypoxia, terrestrial heatwaves and droughts [66,67].
Despite the increasing frequency of these events, significant gaps remain in our ability to quantify their impacts on plankton communities, benthic ecosystems, and secondary disasters like harmful algal blooms (HABs). Currently, the lack of a formalized, multi-phase emergency response plan to guide mitigation efforts at various stages of an MHW cycle is a pressing concern for researchers and policymakers alike. Drawing inspiration from the New South Wales Marine Heatwave Response Plan [68], we advocate for the establishment of a specialized Yellow Sea MHW early-warning and response system. Such a framework should integrate real-time monitoring, response-level assessments, and strategic communication to inform stakeholders in the fisheries and aquaculture sectors. By embedding these response protocols into local marine spatial planning and climate adaptation policies, we can enhance regional resilience and mitigate the escalating risks posed by marine thermal extremes in a warming world.
This work has several inherent limitations. Heat budget calculations are largely based on ERA5 and GLORYS12V1 reanalysis datasets, while the adopted dynamical framework does not incorporate tidal and tidal current processes. As a result, the model cannot precisely quantify localized warming and vertical mixing properties. Though teleconnection analyses using SVD and wave activity flux identify statistical links between SST anomalies over the North Atlantic and Barents Sea and MHWs in the Yellow Sea, such correlations do not represent causal relationships. Additional sensitivity experiments driven by atmospheric numerical models are required to verify these physical connections. In addition, this study only documents physical characteristic parameters of MHWs without constructing coupled physical–biogeochemical models, making it impossible to quantitatively estimate the adverse impacts of warm anomalies on plankton communities and coastal fishery resources.

5. Conclusions

From 1982 to 2024, the Yellow Sea warmed at a rate of 0.32 °C/10 yr, significantly outstripping the global average and creating a precondition for more frequent thermal extremes. The year 2024 stands out as pivotal, marked by record-high temperatures and unprecedented thermal persistence that pose escalating risks to regional mariculture and offshore energy infrastructure. Our comprehensive assessment of the 2024 summer MHW event highlights the following key findings:
  • Unprecedented Extremity and Spatial Dominance: The 2024 Yellow Sea MHW represents the most severe thermal extreme in the observational record, with sea surface temperature (SST) anomalies exceeding 5 °C and an exceptional duration of 118 days. Spanning the entire basin with maximum intensity concentrated in the central–eastern sector, this event set new historical benchmarks for spatial extent, magnitude, and longevity.
  • Mechanistic Drivers and Cross-Basin Teleconnections: The event was physically driven by a persistent anomalous anticyclone over the Yellow Sea that remained quasi-stationary for nearly four months. During the onset phase of the MHW, the increase in net surface heat flux (primarily enhanced downward shortwave radiation) induced by the anomalous anticyclone served as the dominant driver. This atmospheric anomaly was linked to a Eurasian Rossby wave train. During the decay phase, the sea surface cooling was mainly governed by enhancement latent heat flux, closely associated with typhoon and cold air activities.
  • Implications for Predictability and Climate Resilience: Under the SSP2-4.5 scenario, with projected temperature increases of 2.18 °C and over 280 days of MHWs annually on average by the end of the century [17], MHWs comparable to the 2024 event will become increasingly frequent. This prospect requires the integration of MHW dynamics into climate-sensitivity models for offshore energy systems to bolster infrastructure resilience. Future research would aim to quantify how remote drivers, including basin-scale SST anomalies, Tibetan Plateau snow cover, and Arctic sea-ice decline, collectively modulate Yellow Sea extreme events. Elucidating these teleconnections will enhance seasonal prediction and provide scientific support for regional climate risk and fisheries management.

Author Contributions

Conceptualization, A.W. and J.L.; methodology, A.W.; validation, A.W. and J.L.; formal analysis, A.W. and J.L.; data curation, A.W., J.L. and D.W.; writing—original draft preparation, A.W.; writing—review and editing, A.W., J.L., D.W. and W.L. All authors have read and agreed to the published version of the manuscript.

Funding

This research was supported by the National Key R&D Program of China No. 2022RDC2013304.

Data Availability Statement

All datasets used in this study are publicly available. The ERA5 reanalysis dataset is available at https://cds.climate.copernicus.eu/cdsapp#!/dataset/reanalysis-era5-single-levels?tab=overview (accessed on 7 March 2026). The SST datasets can be downloaded from the website https://downloads.psl.noaa.gov/Datasets/noaa.oisst.v2.highres/ (accessed on 7 March 2026). the GLORYS12 datasets (DOI: 10.48670/moi-00021) can be downloaded from the website https://data.marine.copernicus.eu/product/GLOBAL_MULTIYEAR_PHY_001_030/ (accessed on 7 March 2026). The NECP reanalysis dataset is available at https://psl.noaa.gov/data/gridded/data.ncep.reanalysis.html (accessed on 7 March 2026).

Conflicts of Interest

The authors declare no conflicts of interest.

Abbreviations

The following abbreviations are used in this manuscript:
MHWsMarine heatwaves
SSTSea surface temperature
ENSOEl Niño–Southern Oscillation
NAONorth Atlantic Oscillation
SLPSea-level pressure
dT/dtMixed-layer temperature tendency
NHFNet surface heat flux
ADVHorizontal (zonal and meridional) advection
ENTVertical entrainment
RESResidual term
WNPSHWestern North Pacific subtropical high
MJOMadden–Julian Oscillation
SWRShortwave radiation
LWRLongwave radiation
LHFLatent heat flux
QnetNet surface heat flux
TCCTotal cloud cover
TPTotal precipitation

References

  1. Hobday, A.J.; Alexander, L.V.; Perkins, S.E.; Smale, D.A.; Straub, S.C.; Oliver, E.C.J.; Benthuysen, J.A.; Burrows, M.T.; Donat, M.G.; Feng, M.; et al. A hierarchical approach to defining marine heatwaves. Prog. Oceanogr. 2016, 141, 227–238. [Google Scholar] [CrossRef]
  2. Smale, D.A.; Wernberg, T.; Oliver, E.C.J.; Thomsen, M.; Harvey, B.P.; Straub, S.C.; Burrows, M.T.; Alexander, L.V.; Benthuysen, J.A.; Donat, M.G.; et al. Marine heatwaves threaten global biodiversity and the provision of ecosystem services. Nat. Clim. Chang. 2019, 9, 306–312. [Google Scholar] [CrossRef]
  3. Smith, K.E.; Burrows, M.T.; Hobday, A.J.; Sen Gupta, A.; Moore, P.J.; Thomsen, M.; Wernberg, T.; Smale, D.A. Socioeconomic impacts of marine heatwaves: Global issues and opportunities. Science 2021, 374, eabj3593. [Google Scholar] [CrossRef] [PubMed]
  4. Oliver, E.C.J.; Burrows, M.T.; Donat, M.G.; Sen Gupta, A.; Alexander, L.V.; Perkins-Kirkpatrick, S.E.; Benthuysen, J.A.; Hobday, A.J.; Holbrook, N.J.; Moore, P.J.; et al. Projected marine heatwaves in the 21st century and the potential for ecological impact. Front. Mar. Sci. 2019, 6, 734. [Google Scholar] [CrossRef]
  5. Free, C.M.; Anderson, S.C.; Hellmers, E.A.; Muhling, B.A.; Navarro, M.O.; Richerson, K.; Rogers, L.A.; Satterthwaite, W.H.; Thompson, A.R.; Burt, J.M.; et al. Impact of the 2014–16 marine heatwave on US and Canada West Coast fisheries: Surprises and lessons from key case studies. Fish Fish. 2023, 24, 652–674. [Google Scholar] [CrossRef]
  6. Sun, X.H.; Gao, J.; Guo, W.M.; Cheng, W.H.; Li, X.G. Seawater temperature on the protection properties of epoxy coatings used in deep sea. Chin. J. Eng. 2011, 33, 570–574. [Google Scholar] [CrossRef]
  7. Dong, T.; Chen, Y.; Zeng, Z. Record-breaking 2023 marine heatwaves raise alarms for ocean energy infrastructure. Innov. Energy 2025, 2, 100120. [Google Scholar] [CrossRef]
  8. Frölicher, T.L.; Fischer, E.M.; Gruber, N. Marine heatwaves under global warming. Nature 2018, 560, 360–364. [Google Scholar] [CrossRef] [PubMed]
  9. Marcos, M.; Amores, A.; Agulles, M.; Jordà, J.; Feng, X. Global warming drives a threefold increase in persistence and 1 °C rise in intensity of marine heatwaves. Proc. Natl. Acad. Sci. USA 2025, 122, e2413505122. [Google Scholar] [CrossRef] [PubMed]
  10. Schmeisser, L.; Bond, N.A.; Siedlecki, S.A.; Ackerman, T.P. The role of clouds and surface heat fluxes in the maintenance of the 2013–2016 northeast Pacific marine heatwave. J. Geophys. Res. Atmos. 2019, 124, 10772–10783. [Google Scholar] [CrossRef]
  11. Li, Y.; Ren, G.Y.; Wang, Q.Y.; You, Q. Record-breaking marine heatwave in northern Yellow Sea during summer 2018: Characteristics, drivers and ecological impact. Sci. Total Environ. 2023, 904, 166385. [Google Scholar] [CrossRef] [PubMed]
  12. Oliver, E.C.J.; Benthuysen, J.A.; Bindoff, N.L.; Hobday, A.J.; Holbrook, N.J.; Mundy, C.N.; Perkins-Kirkpatrick, S.E. The unprecedented 2015/16 Tasman Sea marine heatwave. Nat. Commun. 2017, 8, 16101. [Google Scholar] [CrossRef] [PubMed]
  13. Gao, G.D.; Marin, M.; Feng, M.; Yin, B.S.; Yang, D.Z.; Feng, X.R.; Ding, Y.; Song, D.H. Drivers of marine heatwaves in the East China Sea and the South Yellow Sea in three consecutive summers during 2016–2018. J. Geophys. Res. Ocean. 2020, 125, e2020JC016518. [Google Scholar] [CrossRef]
  14. Holbrook, N.J.; Scannell, H.A.; Sen Gupta, A.; Benthuysen, J.A.; Feng, M.; Oliver, E.C.J.; Alexander, L.V.; Burrows, M.T.; Donat, M.G.; Hobday, A.J.; et al. A global assessment of marine heatwaves and their drivers. Nat. Commun. 2019, 10, 2624. [Google Scholar] [CrossRef] [PubMed]
  15. Cai, R.S.; Tan, H.J. Progress on the evolutionary characteristics and climatic causes for warming and marine heatwaves in the coastal China seas. Chin. J. Atmos. Sci. 2024, 48, 121–146. (In Chinese) [Google Scholar] [CrossRef]
  16. Yu, H.; Ma, J.; Wang, H.; Xing, Q.; Jiang, L. An Extreme Marine Heatwave Event in the Yellow Sea during Winter 2019/20: Causes and Consequences. Remote Sens. 2024, 16, 33. [Google Scholar] [CrossRef]
  17. Wang, F.; Li, X.G.; Tang, X.H.; Sun, X.X.; Zhang, J.L.; Yang, D.Z.; Xu, L.J.; Zhang, H.; Yuan, H.M.; Wang, Y.T.; et al. The seas around China in a warming climate. Nat. Rev. Earth Environ. 2023, 4, 535–551. [Google Scholar] [CrossRef]
  18. Moon, J.-Y.; Lee, K.; Lim, W.-A.; Lee, E.; Dai, M.; Choi, Y.-H.; Han, I.-S.; Shin, K.; Kim, J.-M.; Chae, J. Anthropogenic nitrogen is changing the East China and Yellow seas from being N deficient to being P deficient. Limnol. Oceanogr. 2021, 66, 914–924. [Google Scholar] [CrossRef]
  19. Li, H.-M.; Zhang, C.-S.; Han, X.-R.; Shi, X.-Y. Changes in concentrations of oxygen, dissolved nitrogen, phosphate, and silicate in the southern Yellow Sea, 1980–2012: Sources and seaward gradients. Estuar. Coast. Shelf Sci. 2015, 163, 44–55. [Google Scholar] [CrossRef]
  20. Lin, C.; Ning, X.; Su, J.; Lin, Y.; Xu, B. Environmental changes and the responses of the ecosystems of the Yellow Sea during 1976–2000. J. Mar. Syst. 2005, 55, 223–234. [Google Scholar] [CrossRef]
  21. Li, C.-L.; Yang, D.-Z.; Zhai, W.-D. Effects of warming, eutrophication and climate variability on acidification of the seasonally stratified North Yellow Sea over the past 40 years. Sci. Total Environ. 2022, 815, 152935. [Google Scholar] [CrossRef] [PubMed]
  22. MNR. 2025 Bulletin on China‘s Marine Ecological Early Warning and Monitoring. 2026. Available online: https://gi.mnr.gov.cn/202606/t20260608_2931390.html (accessed on 21 July 2026).
  23. Lee, S.; Park, M.S.; Kwon, M.; Kim, Y.H.; Park, Y.G. Two major modes of East Asian marine heatwaves. Environ. Res. Lett. 2020, 15, 074008. [Google Scholar] [CrossRef]
  24. Yan, Y.; Chai, F.; Xue, H.; Wang, G. Record-breaking sea surface temperatures in the yellow and ECSs. J. Geophys. Res. Ocean. 2020, 125, e2019JC015883. [Google Scholar] [CrossRef]
  25. Oh, H.; Kim, G.U.; Kim, Y.S.; Park, J.H.; Jang, C.J.; Min, Y.; Jun, H.; Jeong, J.Y. Classification and causes of East Asian marine heatwaves during boreal summer. J. Clim. 2023, 36, 1435–1449. [Google Scholar] [CrossRef]
  26. Dasgupta, P.; Nam, S.; Saranya, J.S.; Roxy, M.K. Marine heatwaves in the East Asian marginal seas facilitated by boreal summer intraseasonal oscillations. J. Geophys. Res. Ocean. 2024, 129, e2023JC020602. [Google Scholar] [CrossRef]
  27. Choi, W.; Bang, M.; Joh, Y.; Ham, Y.G.; Kang, N.; Jang, C.J. Characteristics and mechanisms of marine heatwaves in the East Asian marginal seas: Regional and seasonal differences. Remote Sens. 2022, 14, 3522. [Google Scholar] [CrossRef]
  28. Xu, J.; Yan, Y.; Zhang, L.; Xing, W.; Meng, L.; Yu, Y.; Chen, C. Long-term trends and extreme events of marine heatwaves in the Eastern China Marginal Seas during summer. Front. Mar. Sci. 2024, 11, 1380963. [Google Scholar] [CrossRef]
  29. Banzon, V.; Smith, T.M.; Chin, T.M.; Liu, C.; Hankins, W. A long-term record of blended satellite and in situ sea-surface temperature for climate monitoring, modeling and environmental studies. Earth Syst. Sci. Data 2016, 8, 165–176. [Google Scholar] [CrossRef]
  30. Lellouche, J.M.; Greiner, E.; Bourdallé-Badie, R.; Garric, G.; Melet, A.; Drévillon, M.; Bricaud, C.; Hamon, M.; Le Galloudec, O.; Regnier, C.; et al. The Copernicus Global 1/12° Oceanic and Sea Ice GLORYS12 Reanalysis. Front. Earth Sci. 2021, 9, 698876. [Google Scholar] [CrossRef]
  31. Kalnay, E.; Kanamitsu, M.; Kistler, R.; Collins, W.; Deaven, D.; Gandin, L.; Iredell, M.; Saha, S.; White, G.; Woollen, J.; et al. The NCEP/NCAR 40-Year Reanalysis Project. Bull. Am. Meteorol. Soc. 1996, 77, 437–471. [Google Scholar] [CrossRef]
  32. Hobday, A.J.; Oliver, E.C.J.; Sen Gupta, A.; Benthuysen, J.A.; Burrows, M.T.; Donat, M.G.; Holbrook, N.J.; Moore, P.J.; Thomsen, M.S.; Wernberg, T.; et al. Categorizing and naming marine heatwaves. Oceanography 2018, 31, 162–173. [Google Scholar] [CrossRef]
  33. Nigam, T.; Pant, V.; Prakash, K.R. Impact of Indian ocean dipole on the coastal upwelling features off the southwest coast of India. Ocean Dyn. 2018, 68, 663–676. [Google Scholar] [CrossRef]
  34. Takaya, K.; Nakamura, H. A formulation of a phase-independent wave-activity flux for stationary and migratory quasigeostrophic eddies on a zonally varying basic flow. J. Atmos. Sci. 2001, 58, 608–627. [Google Scholar] [CrossRef]
  35. Yao, Y.L.; Wang, C.Z. Variations in summer marine heatwaves in the South China Sea. J. Geophys. Res. Ocean. 2021, 126, e2021JC017792. [Google Scholar] [CrossRef]
  36. Feng, Y.T.; Bethel, B.J.; Dong, C.M.; Zhao, H.; Yao, Y.; Yu, Y. Marine heatwave events near Weizhou Island, Beibu Gulf in 2020 and their possible relations to coral bleaching. Sci. Total Environ. 2022, 823, 153414. [Google Scholar] [CrossRef] [PubMed]
  37. Zhou, T.J.; Yu, R.C.; Zhang, J.; Drange, H.; Cassou, C.; Deser, C.; Hodson, D.L.; Sanchez-Gomez, E.; Li, J.; Keenlyside, N.; et al. Why the western Pacific subtropical high has extended westward since the late 1970s. J. Clim. 2009, 22, 2199–2215. [Google Scholar] [CrossRef]
  38. Peng, Q.H.; Xie, S.P.; Miyamoto, A.; Deser, C.; Zhang, P.; Luongo, M.T. Strong 2023–2024 El Niño generated by ocean dynamics. Nat. Geosci. 2025, 18, 471–478. [Google Scholar] [CrossRef]
  39. Chen, X.; Zhou, T.; Wu, P.; Guo, Z.; Wang, M. Emergent constraints on future projections of the western North Pacific Subtropical High. Nat. Commun. 2020, 11, 2802. [Google Scholar] [CrossRef] [PubMed]
  40. Di Lorenzo, E.; Mantua, N. Multi-year persistence of the 2014/15 North Pacific marine heatwave. Nat. Clim. Chang. 2016, 6, 1042–1047. [Google Scholar] [CrossRef]
  41. Wang, Q.; Zhang, Z.H.; Dong, L.; Huang, Y. Summer 2024 marine weather review. J. Mar. Meteorol. 2024, 44, 112–124. (In Chinese) [Google Scholar] [CrossRef]
  42. Guo, Y.Y.; Zhang, Z.H.; Liu, T.; Cao, Y.; Wan, W.; Zhang, H.; Zhang, C. Autumn 2024 marine weather review. J. Mar. Meteorol. 2025, 45, 104–114. (In Chinese) [Google Scholar] [CrossRef]
  43. Enomoto, T.; Endo, H.; Harada, Y.; Ohfuchi, W. Relationship between high-impact weather events in Japan and propagation of Rossby waves along the Asian jet in July 2004. J. Meteorol. Soc. Jpn. 2009, 87, 139–156. [Google Scholar] [CrossRef]
  44. Ratna, S.B.; Osborn, T.J.; Joshi, M.; Luterbacher, J. The Influence of Atlantic Variability on Asian Summer Climate Is Sensitive to the Pattern of the Sea Surface Temperature Anomaly. J. Clim. 2020, 33, 7567–7590. [Google Scholar] [CrossRef]
  45. Chen, S.F.; Wu, R.G.; Chen, W. Influence of North Atlantic sea surface temperature anomalies on springtime surface air temperature variation over Eurasia in CMIP5 models. Clim. Dyn. 2021, 57, 2669–2686. [Google Scholar] [CrossRef]
  46. Meng, M.; Gong, D. Winter North Atlantic SST as a precursor of spring Eurasian wildfire. Geophys. Res. Lett. 2022, 49, e2022GL099920. [Google Scholar] [CrossRef]
  47. Du, Y.; Zhang, J.; Zhao, S.; Chen, Z. A mechanism of spring Barents Sea ice effect on the extreme summer droughts in northeastern China. Clim. Dyn. 2022, 58, 1033–1048. [Google Scholar] [CrossRef]
  48. Jiang, J.; Meng, J.; Bao, W.; Wu, G.; Hu, W.; Liu, Y. Spring–summer Barents Sea ice loss intensifies the synchronicity of recent extreme heatwaves in Europe and East Asia. J. Geophys. Res. Atmos. 2026, 131, e2025JD044630. [Google Scholar] [CrossRef]
  49. Chen, Z.B.; Wang, Y.; Wang, J.Q.; Zhang, R.H.; Jiang, Y.F.; Qi, Y.; Yu, X.C. Distinct mechanisms of marine heatwave formation in offshore waters of China. J. Oceanol. Limnol. 2025, 43, 1405–1424. [Google Scholar] [CrossRef]
  50. Valjarević, A.; Popovici, C.; Djekić, T.; Morar, C.; Filipović, D.; Lukić, T. Long-term monitoring of high optical imagery of the stratospheric clouds and their properties new approaches and conclusions. Egypt. J. Remote Sens. Space Sci. 2022, 25, 1037–1043. [Google Scholar] [CrossRef]
  51. Dong, C.M.; Zhang, X.Y.; Cao, Q.; Wang, Y.D.; Teng, F.Y.; Xue, J.Y. Recent advances in marine heatwaves in the northwestern Pacific. Trans. Atmos. Sci. 2026, 49, 76–93. (In Chinese) [Google Scholar] [CrossRef]
  52. Hu, S.J.; Li, S.H. Progress and prospect of marine heatwave study. Adv. Earth Sci. 2022, 37, 51–64. (In Chinese) [Google Scholar] [CrossRef]
  53. Capotondi, A.; Rodrigues, R.R.; Sen Gupta, A.; Benthuysen, J.A.; Deser, C.; Frölicher, T.L.; Lovenduski, N.S.; Amaya, D.J.; Le Grix, N.; Xu, T.; et al. A global overview of marine heatwaves in a changing climate. Commun. Earth Environ. 2024, 5, 701. [Google Scholar] [CrossRef]
  54. Choi, N.; Lee, M.I.; Cha, D.H.; Lim, Y.K.; Kim, K.M. Decadal changes in the interannual variability of heat waves in East Asia caused by atmospheric teleconnection changes. J. Clim. 2020, 33, 1505–1522. [Google Scholar] [CrossRef]
  55. Zhou, J.; Yu, H.; Xu, P.; Zhao, W.; Zhang, B.; Ren, Y.; Cheng, S.; Gong, Y.; Yang, Y. Extreme heat event over Northwest China driven by Silk Road Pattern teleconnection and its possible mechanism. Atmos. Res. 2024, 297, 107090. [Google Scholar] [CrossRef]
  56. Noh, E.; Kim, J.; Jun, S.Y.; Cha, D.H.; Park, M.S.; Kim, J.H.; Kim, H.G. The role of the Pacific-Japan pattern in extreme heatwaves over Korea and Japan. Geophys. Res. Lett. 2021, 48, e2021GL093990. [Google Scholar] [CrossRef]
  57. Madden, R.A.; Julian, P.R. Detection of a 40–50 day oscillation in the zonal wind in the tropical Pacific. J. Atmos. Sci. 1971, 28, 702–708. [Google Scholar] [CrossRef]
  58. Ding, Q.; Wang, B. Intraseasonal teleconnection between the summer Eurasian wave train and the Indian monsoon. J. Clim. 2007, 20, 3751–3767. [Google Scholar] [CrossRef]
  59. Moon, J.Y.; Wang, B.; Ha, K.J.; Lee, J.Y. Teleconnections associated with Northern Hemisphere summer monsoon intraseasonal oscillation. Clim. Dyn. 2013, 40, 2761–2774. [Google Scholar] [CrossRef]
  60. Stan, C.; Straus, D.M.; Frederiksen, J.S.; Lin, H.; Maloney, E.D.; Schumacher, C. Review of tropical-extratropical teleconnections on intraseasonal time scales. Rev. Geophys. 2017, 55, 902–937. [Google Scholar] [CrossRef]
  61. Hsu, P.C.; Qian, Y.; Liu, Y.; Murakami, H.; Gao, Y. Role of abnormally enhanced MJO over the western Pacific in the formation and subseasonal predictability of the record-breaking Northeast Asian heatwave in the summer of 2018. J. Clim. 2020, 33, 3333–3349. [Google Scholar] [CrossRef]
  62. Roberts, S.D.; Van Ruth, P.D.; Wilkinson, C.; Bastianello, S.S.; Bansemer, M.S. Marine heatwave, harmful algae blooms and an extensive fish kill event during 2013 in South Australia. Front. Mar. Sci. 2019, 6, 610. [Google Scholar] [CrossRef]
  63. Li, D.; Zhang, D.Q.; Sun, L. Features and possible causes of the climatic anomaly in China in Autumn 2024. Meteorol. Mon. 2025, 51, 496–507. (In Chinese) [Google Scholar]
  64. Yuan, Y.; Gao, H.; Ding, T. The extremely north position of the western Pacific subtropical high in summer of 2018: Important role of the convective activities in the western Pacific. Int. J. Climatol. 2020, 40, 1361–1374. [Google Scholar] [CrossRef]
  65. Doherty, M.L.; Johnson, J.V.; Goodbody-Gringley, G. Widespread coral bleaching and mass mortality during the 2023–2024 marine heatwave in Little Cayman. PLoS ONE 2025, 20, e0322636. [Google Scholar] [CrossRef] [PubMed]
  66. Rodrigues, R.R.; Taschetto, A.S.; Sen Gupta, A.; Foltz, G.R. Common cause for severe droughts in South America and marine heatwaves in the South Atlantic. Nat. Geosci. 2019, 12, 620–626. [Google Scholar] [CrossRef]
  67. Li, C.; Huang, J.; Liu, X.; Ding, L.; He, Y.; Xie, Y. The ocean losing its breath under the heatwaves. Nat. Commun. 2024, 15, 6840. [Google Scholar] [CrossRef] [PubMed]
  68. Champion, C.; Coleman, M.A. The emerging need for marine heatwave response plans: A globally relevant example from New South Wales, Australia. Ocean Coast. Manag. 2025, 261, 107526. [Google Scholar] [CrossRef]
Figure 1. Distribution of the maximum marine heatwave categories (a) and spatial extent (b) in 2024, and MHW characteristics from 1993 to 2024 (c) in the Yellow Sea. The region of interest is boxed in black. The yellow, orange, red, and dark red indicate Moderate, Strong, Severe, and Extreme categories, respectively. 2024 is highlighted with pink color in (c). The size of the circles is scaled according to the maximum spatial extent.
Jmse 14 01438 g001
Figure 2. Evolution Process of Marine Heatwaves in the study region of the Yellow Sea. The SST climatology (blue), 90th percentile MHW threshold (green), extreme MHW threshold (dashed green), SST time series (black) and MHW identified (shading) were denoted. Dashed black lines separate the extreme MHW into onset and decay phases.
Jmse 14 01438 g002
Figure 3. Spatial distributions of (a,e) geopotential height anomalies at 500 hPa (shading). Solid and dashed contours denote the 500 hPa geopotential height and its climatological mean, respectively; (b,e) Surface wind anomalies; (c,f) Total cloud cover anomalies. (ac) correspond to the MHW onset phase, and (df) correspond to the decay phase.
Jmse 14 01438 g003aJmse 14 01438 g003b
Figure 4. Mixed-layer heat budget of the 2024 MHW event. (a) Time series of mixed-layer heat budget terms averaged over the region of extreme warming during the 2024 event, including the temperature tendency term (dT’/dt), horizontal (zonal and meridional) advection terms (ADV’), net surface heat flux term (NHF’), entrainment (ENT’), and the residual term (RES’); (b) anomalies of mixed-layer depth and SST; (c,d) anomalies during the onset and decay phases. The error bars in (c,d) represent the standard errors during the onset and decay phases, respectively. Purple shading indicates low temperature tendency periods.
Jmse 14 01438 g004
Figure 5. Time series of surface heat flux anomaly averaged over the region of extreme warming during the 2024 event (a), and average anomalies during the onset (b) and decay (c) phases. Abbreviations are as follows: SWR (shortwave radiation), LWR (longwave radiation), LHF (latent heat flux), SHF (sensible heat flux), and Qnet (net surface heat flux). Purple shading indicates low temperature tendency periods.
Jmse 14 01438 g005
Figure 6. (a) Anomalies of surface latent heat flux (LHF) and wind, and (b) anomalies of total cloud cover (TCC) and total precipitation (TP) during the onset and decay phases. Purple shading indicates low temperature tendency periods.
Jmse 14 01438 g006
Figure 7. 250 hPa Geopotential Height (Shaded) and Wave Activity Flux (vectors) in August–September 2024. Wave Activity Flux vectors are plotted only where the climatological mean zonal wind at 250 hPa exceeds 5 m/s.
Jmse 14 01438 g007
Figure 8. Spatial patterns of the first leading SVD coupled modes of SST anomalies over the Yellow Sea (a) and the North Atlantic (b), respectively. (c) presents the matching standardized time series of paired SVD modes.
Jmse 14 01438 g008
Figure 9. Spatial patterns of the first leading SVD coupled modes of SST anomalies over the Yellow Sea (a) and Barents Sea (b), respectively. (c) presents the matching standardized time series of paired SVD modes.
Jmse 14 01438 g009
Table 1. Period-mean contributions of mixed-layer heat budget terms during the onset and decay stages of 2024 event (°C/day).
MHW PhasesdT’/dtNHF’ADV’ENT’RES’
Onset0.073 ± 0.0160.066 ± 0.018−0.004 ± 0.002±0.0040.008 ± 0.016
Decay−0.055 ± 0.018−0.034 ± 0.014−0.019 ± 0.004−0.002 ± 0.0010.004 ± 0.001
Table 2. Information of cooling episodes during the decay phases.
DatesAssociated Synoptic SystemNHF’ (°C/Day)dT’/dt (°C/Day)
20–24 SeptemberPulasan (2414) and cold air−0.164−0.266
2–4 OctoberKrathon (2418) and cold air−0.171−0.277
19–20 Octobercold air−0.181−0.130
22–24 OctoberTrami (2420) and cold air−0.086−0.096
4–7 Novembercold air−0.144−0.185
16–19 NovemberMan-yi (2424) and cold air−0.092−0.173
26–28 Novembercold air−0.187−0.176
Disclaimer/Publisher’s Note: The statements, opinions and data contained in all publications are solely those of the individual author(s) and contributor(s) and not of MDPI and/or the editor(s). MDPI and/or the editor(s) disclaim responsibility for any injury to people or property resulting from any ideas, methods, instructions or products referred to in the content.