Article

Sea-Level and Environmental Change Across the K/Pg Boundary and PETM Event on the Southern Tethyan Margin: Foraminiferal and Sequence-Stratigraphic Evidence from Egypt


1
Department of Biological and Geological Sciences, Faculty of Education, Ain Shams University, Cairo 11341, Egypt
2
Geology Department, Faculty of Science, Al-Azhar University, Assiut Branch, Assiut 71524, Egypt
3
State Key Laboratory of Geomicrobiology and Environmental Changes, Hubei Key Laboratory of Critical Zone Evolution, School of Earth Sciences, China University of Geosciences, Wuhan 430074, China
4
Geology Department, Faculty of Science, Sohag University, Sohag 82524, Egypt
5
Geology Department, Faculty of Science, Assiut University, Assiut 71516, Egypt
6
Geosciences Department, College of Science, United Arab Emirates University, Al Ain 15551, United Arab Emirates
7
Geology Department, Faculty of Science, Ain Shams University, Cairo 11566, Egypt
*
Authors to whom correspondence should be addressed.
J. Mar. Sci. Eng. 2026, 14(15), 1413; https://doi.org/10.3390/jmse14151413
Submission received: 6 July 2026 / Revised: 26 July 2026 / Accepted: 26 July 2026 / Published: 31 July 2026
(This article belongs to the Special Issue Advances in Sedimentology and Coastal and Marine Geology, 3rd Edition)

Abstract

Upper Cretaceous–Lower Paleogene successions along the southern Tethyan margin record the combined effects of global environmental perturbations, relative sea-level change, and regional tectonism. This study reconstructs paleoenvironmental and sequence-stratigraphic evolution across Maastrichtian–Ypresian strata in four Esh El-Mellaha sections, northern Eastern Desert, Egypt, using integrated lithostratigraphy, microfacies, benthic foraminiferal assemblages, faunal indices, quantitative paleodepth estimates, and sequence-stratigraphic analysis. The exposed succession comprises the Sudr, Dib, Esna, and Thebes Formations and includes intervals spanning the Cretaceous/Paleogene (K/Pg) boundary and the Paleocene–Eocene Thermal Maximum (PETM). Two major erosional surfaces are recognized: the Sudr/Dib boundary, associated with an incomplete K/Pg transition and a latest Maastrichtian–early Danian hiatus, and the Dib/Esna boundary, related to Late Paleocene erosion/non-deposition during the Selandian–Thanetian interval. Four benthic foraminiferal biofacies indicate deposition mainly in middle-neritic to upper bathyal settings, with pronounced shallowing during Dib Formation deposition. Foraminiferal trophic-oxygen signals indicate contrasting ecological responses, with comparatively oxygenated, low-productivity conditions in the strata bracketing the K/Pg interval and increased organic flux, dysoxia, and opportunistic infaunal taxa during the PETM. Five depositional sequences and five sequence boundaries provide a refined Maastrichtian–Ypresian framework, showing that global eustatic and environmental signals were locally modified by Syrian Arc-related accommodation changes.

1. Introduction

Upper Cretaceous–Lower Paleogene marine successions provide exceptional archives for evaluating how shelf-margin ecosystems responded to abrupt environmental disruption, relative sea-level change, and tectonically controlled accommodation [1,2,3,4,5].
Two intervals are especially important: the Cretaceous/Paleogene (K/Pg) boundary at ~66 Ma and the Paleocene–Eocene Thermal Maximum (PETM) at ~56 Ma [6,7]. The K/Pg boundary records one of the most severe Phanerozoic biotic crises, linked primarily to the Chicxulub impact and associated global-scale disturbance, whereas the PETM represents a major early Cenozoic hyperthermal characterized by rapid carbon-cycle perturbation, greenhouse warming, ocean acidification, intensified hydrological cycling, enhanced sediment routing, and spatially variable oxygenation changes [8,9,10,11,12,13,14]. These events are globally recognizable, but their sedimentary expression differs markedly among basins because global signals were commonly filtered by local water depth, productivity, carbonate saturation, detrital influx, condensation, erosion, and tectonic subsidence or uplift [5,15,16,17,18,19,20].
Foraminiferal records are particularly valuable for resolving these complex responses because planktic and benthic communities did not react identically to K/Pg and PETM perturbations. Across the K/Pg boundary, planktic foraminifera suffered severe diversity loss and delayed recovery, whereas benthic foraminifera generally show ecological restructuring related to changes in food supply, oxygenation, and substrate conditions rather than complete extinction [21,22,23,24]. During the PETM, benthic assemblages commonly record environmental stress through reduced diversity, increased opportunistic taxa, shifts in epifaunal/infaunal morphogroups, and changes in trophic-redox conditions [12,13,25,26]. Accordingly, benthic foraminiferal assemblages, when combined with microfacies, planktic/benthic ratios, diversity indices, total foraminiferal number, benthic foraminiferal oxygen indices, and quantitative paleodepth estimates, provide a robust basis for distinguishing ecological change from stratigraphic condensation, hiatus development, and tectonic overprinting [27,28,29,30,31,32].
The southern Tethyan margin is a key region for studying these interactions because Upper Cretaceous–Lower Paleogene successions are widely exposed across North Africa, Arabia, and the eastern Mediterranean region. Egypt occupies a central position in this margin and includes both globally significant reference sections and regionally variable marginal-marine successions. The Dababiya section in southern Egypt, which defines the Global Boundary Stratotype Section and Point for the base of the Eocene Series, provides a critical reference for the PETM and the lower Esna Formation [33,34,35,36,37]. Recent Egyptian studies have further shown that Upper Cretaceous–Lower Paleogene successions may preserve complete, condensed, or hiatus-modified records depending on local accommodation, sea-level change, and syn-sedimentary tectonics [1,30,38,39,40,41].
The Esh El-Mellaha area is especially relevant for evaluating these controls because it lies along the western margin of the Gulf of Suez within a structurally sensitive sector of the southern Tethyan margin. This area was affected by Late Cretaceous–Eocene deformation related to the Syrian Arc Tectonic Event, which influenced accommodation, lateral facies variability, erosional surfaces, and stratigraphic completeness [42,43,44,45,46,47]. Accordingly, Esh El-Mellaha provides an important natural laboratory for testing how global K/Pg and PETM signals were recorded in a marginal basin where eustasy, climate-driven environmental change, and Syrian Arc-related tectonic accommodation interacted.
Despite this importance, several issues remain unresolved. First, the completeness of the K/Pg interval in the Esh El-Mellaha succession requires careful evaluation because the absence or condensation of latest Maastrichtian–earliest Danian Zones suggests that the boundary interval may be modified by erosion and/or non-deposition. Second, the stratigraphic significance of the Dib Formation, including its relationship to Dakhla and Tarawan equivalents in other Egyptian basins, remains important for regional correlation. Third, the PETM interval represented by the Dababiya Quarry Member must be clearly distinguished from the earlier K/Pg-related environmental signals because the two events affected benthic ecosystems through contrasting ecological mechanisms. The K/Pg event was characterized mainly by impact-related ecological disruption and changes in food supply, oxygenation, and substrate conditions, whereas the PETM was associated with warming-driven trophic stress, eutrophication, deoxygenation, and increased abundance of opportunistic benthic taxa [21,22,25,26]. Finally, previous studies have rarely integrated benthic foraminiferal biofacies, quantitative faunal indices, microfacies, numerical paleodepth estimation, and depositional-sequence architecture across all studied Esh El-Mellaha sections.
The present study addresses these gaps by applying a multi-proxy approach to the Upper Cretaceous–Lower Paleogene succession at Esh El-Mellaha. The study integrates field lithostratigraphy, microfacies observations, benthic foraminiferal assemblages, R-mode cluster analysis, quantitative paleoenvironmental indices, paleodepth estimation, and sequence-stratigraphic interpretation. The novelty of this work lies in linking benthic foraminiferal paleoecology with depositional-sequence architecture across both the K/Pg and PETM intervals in a tectonically modified southern Tethyan margin setting. The objectives of this study are to: (1) reconstruct changes in water depth, oxygenation, and trophic conditions; (2) identify benthic biofacies and their paleoenvironmental significance; (3) clarify the stratigraphic expression of major erosional or correlative surfaces; (4) evaluate the causes of missing or condensed stratigraphic intervals; and (5) distinguish global eustatic and environmental signals from local accommodation changes related to Syrian Arc tectonism.

2. Materials and Methods

2.1. The Study Area

The northern Eastern Desert of Egypt, particularly the Esh El-Mellaha area, west of the Gulf of Suez (between latitudes 27°24′–27°49′ N and longitudes 33°11′–33°40′ E) (Figure 1; modified after Conoco [48]) offers a key geological setting to investigate these events. Along the southern Tethyan margin, this region was influenced by the Syrian Arc Tectonic Event (SATE) during the Late Cretaceous to Eocene time interval, which produced widespread deformation, facies variability, and localized unconformities [42,43,44,45,46,47]. The interaction of regional tectonics and eustatic sea-level changes significantly affected the depositional systems and stratigraphic architecture, complicating interpretations of the sedimentary record.

2.2. Geological Setting and Stratigraphy

Upper Cretaceous–Lower Paleogene strata are widely exposed across several Egyptian geological provinces. The sequences within this interval are distinguished by vertical and lateral variations in sedimentary facies across different localities. The Esh El-Mellaha area is situated along the western margin of the Gulf of Suez in the northern Eastern Desert of Egypt with a structurally complex setting that was influenced by the Late Cretaceous–Eocene SATE [46,47]. Reactivation of pre-existing extensional faults during this interval resulted in differential uplift, which strongly controlled sedimentation patterns. Earlier studies recognized only the Sudr, Esna, and Thebes Formations within the study area [49,50]. More recent investigations, however, documented the occurrence of the Dib Formation, a previously unrecognized lithostratigraphic unit interpreted as a lateral equivalent of the upper Dakhla Fm. (Beida Member) in other Egyptian basins [45,46,47]. The age framework adopted in this study follows the integrated biostratigraphic scheme established by El-Mohandes et al. [46].
The Upper Cretaceous–Lower Paleogene (UK/LPg) succession exposed at Esh El-Mellaha comprises, from base to top, the Sudr, Dib, Esna, and Thebes Formations, which display significant lateral thickness variations among the Gabal El-Mellaha (GM), Wadi Abu Had (WH), Wadi Dib (WD), and Gabal Tarbul (GT) sections, reflecting the influence of tectonic activity and differential sediment accumulation. The Sudr Fm. forms the lowermost exposed unit and consists of argillaceous limestone overlain by calcareous shale rich in pectenid shells. Its total thickness ranges from approximately 14 m in the WD section to about 33 m in the GM section. The overlying Dib Fm. is represented by a glauconitic bioclastic limestone unit containing reworked fossil debris with thicknesses varying between 0.5 and 1.5 m (Figure A1c). Two erosional surfaces were identified within the succession. The lower one marks the contact between the Sudr and Dib Formations and coincides with the K/Pg boundary (Figure A1b,c), whereas the upper one separates the Dib and Esna Formations and corresponds to a Late Paleocene erosional surface associated with the Selandian–Thanetian interval (Figure A1b,d). These unconformities have been linked to syn-sedimentary tectonic pulses that affected the basin architecture and stratigraphic completeness [45,46,47]. The Esna Fm. is composed predominantly of greenish gray to dark gray shale with subordinate marl, phosphatic shale, calcareous shale, and limestone interbeds. It includes El-Hanadi, El-Dababiya Quarry, El-Mahmiya, and Abu Had members. The El-Dababiya Quarry Member (DQM), which records the PETM, is consistently developed in all studied sections and reaches approximately 2.3–2.5 m in thickness. The El-Mahmiya and Abu Had members exhibit marked thickness variations, indicating localized changes in sedimentation rates and accommodation space. The succession is capped by the Thebes Fm., which consists mainly of limestone grading upward into thick-bedded limestone with abundant flint bands and nodules, attaining thicknesses between approximately 8 m and 13.5 m. Collectively, the lithological characteristics, stratigraphic architecture, and thickness variations in these units provide a robust geological framework for evaluating the paleoenvironment and sea-level fluctuations in the Esh El-Mellaha basin.
The pronounced lateral thickness variations among equivalent stratigraphic units and the regional distribution of the erosional surfaces suggest differential accommodation development across the basin. These observations are consistent with previous interpretations linking the stratigraphic setting of Esh El-Mellaha to Late Cretaceous–Eocene phases of the SATE [45,46,47]. Nevertheless, the timing of the K/Pg and Late Paleocene unconformities also broadly coincides with intervals of documented global sea-level fluctuations, indicating that the observed stratigraphic discontinuities most likely reflect the combined influence of regional tectonic activity and eustatic sea-level changes rather than a solely tectonic origin.
The age framework adopted in this study is based on the planktic foraminiferal (PF) biostratigraphy established by El-Mohandes et al. [46], who recognized thirteen biozones spanning the Maastrichtian to Early Eocene interval. The Upper Maastrichtian succession is represented by the Gansserina gansseri (CF4), Pseudoguembelina hariaensis/Gansserina gansseri (CF3), and Pseudoguembelina palpebra (CF2) Zones. The K/Pg boundary is associated with a stratigraphic hiatus marked by the absence of the latest Maastrichtian Plummerita hantkeninoides Zone and the earliest Danian Zones (P0–P1c). The Paleocene succession begins with the Praemurica uncinata (P2) Zone and is locally represented by Morozovella angulata (P3a) and Morozovella velascoensis (P5), indicating that much of the Danian to Thanetian interval was removed by erosion and/or represented by non-deposition. The Paleocene–Eocene transition is marked by the Acarinina sibaiyaensis (E1) Zone, which records the PETM interval and is followed by the Pseudohastigerina wilcoxensis/Morozovella velascoensis (E2), Morozovella subbotinae (E3), Morozovella formosa (E4), and Morozovella aragonensis/Morozovella subbotinae (E5) Zones. The uppermost part of the studied succession comprises the Acarinina pentacamerata (E6) and Acarinina cuneicamerata (E7) Zones, which indicate a late Ypresian age and extend into the lower part of the Thebes Fm. These biozones provide the chronostratigraphic framework used herein for sequence stratigraphy and paleoenvironmental reconstruction.

2.3. Fieldwork and Sampling

Four key stratigraphic sections were systematically described and sampled from south to north: GM, WH, WD, and GT. Their geographic coordinates and associated rock units are shown on the geological map in Figure 1b. To reconstruct depositional changes in high resolution, a total of 210 samples were collected at vertical intervals as small as 5 cm. Field lithological descriptions were refined through petrographic analysis of thin sections, using Flügel’s [51] criteria for environmental interpretation and Dunham’s [52] classification of carbonate textures. Microfacies were documented using photomicrographs captured with a Zeiss camera (MC 80, Carl Zeiss Microscopy, Oberkochen, Germany). For foraminiferal analysis, each dried sample (~100 g) was disaggregated in water using dilute hydrogen peroxide (H2O2), then wet-sieved at 63 μm. Residues were dried and, when necessary, treated with sodium bicarbonate to enhance test visibility. Benthic foraminifera (BF) tests were picked under a binocular stereomicroscope, identified, counted, and mounted on microslides. All processed residues, picked specimens, thin sections, and SEM stubs are housed in the Department of Geology, Sohag University, Egypt.

2.4. Petrographic, Microfacies, and Foraminiferal Analyses

The relative abundances of BF groups at genus and species levels were calculated, and selected specimens were imaged at Assiut University using SEM (JSM-5400LD, JEOL Ltd., Akishima, Tokyo, Japan) for high-resolution taxonomy (Figure A2 and Figure A3). A quantitative and qualitative analysis of foraminiferal assemblages offers important insights into paleoenvironmental changes across the K/Pg time intervals, particularly in relation to sea-level fluctuations, oxygenation, and nutrient availability. The planktic/benthic foraminiferal ratio (P/B ratio) was calculated following Adelseck and Berger [53] and Van der Zwaan et al. [54]. Although the planktonic/benthic (%P) ratio is one of the most widely used proxies, in the present study the infaunal and epiphytic benthic species were excluded from the %P-based calculations following the recommendations of Zachariasse et al. [55]. These taxa were used only for paleoenvironmental interpretations because their distribution is mainly controlled by ecological factors rather than water depth.
The P/B ratio is generally low (1–5%) in shallow inner neritic settings (0–50 m) but rises to 30–70% in outer neritic environments (100–200 m) and surpasses 90% in upper bathyal depths (200–600 m) [56,57,58,59]. Previous studies emphasized the usefulness of the P/B ratio in assessing depth migration and relative sea-level change during major global perturbations comparable to PETM, where a noticeable deepening trend is frequently found [56,57,58,59]. Additional indices such as the Total Foraminiferal Number (TFN), Fisher’s α diversity, Shannon–Wiener diversity index H’, and the Epifaunal/Infaunal (E/I) ratio further constrain paleoecological conditions. High TFN values and species diversity (e.g., high Fisher-α and Shannon–Wiener diversity) are typically linked to stable, oxygenated environments, while reduced diversity and foraminiferal numbers across boundary intervals often reflect ecological stress, as observed during the K/Pg and PETM events [60]. The Calcareous/Agglutinated (C/A%) ratio is another key proxy for carbonate saturation and dissolution conditions, especially near the CCD, while the Benthic Foraminiferal Oxygen Index (BFOI) provides a measure of seafloor oxygenation. Collectively, these indices allow for a robust reconstruction of paleodepths, redox states, and environmental turnover associated with mass extinction and hyperthermal events. Paleobathymetric conditions, paleoenvironmental settings, and hydrodynamic regimes that prevailed during the sedimentation of the UK-LPg strata may all be reconstructed using BF assemblages. Water-depth gradients and certain benthic taxa have been linked in several studies [61,62,63]. To classify biofacies and explore statistical relationships, R-mode cluster analysis was performed in PAST (Paleontological Statistics). Sequence-stratigraphic interpretation was based on identification of key surfaces, including sequence boundaries (SBs), transgressive surfaces (TSs), and maximum flooding surfaces (MFSs), following standard sequence-stratigraphic methodology.

2.5. Quantitative Paleoenvironmental Proxies and Paleobathymetry

This study applies a multi-proxy approach for analyzing paleoenvironmental dynamics and the most dramatic variations in sea-level changes across the K/Pg and PETM boundaries, as evidenced in a tectonically complex margin, by integrating microfaunal data, lithological observations, and facies modifications. It combines benthic foraminiferal assemblages as indicators of paleobathymetry, oxygenation, and productivity [29,54,64] with detailed sedimentological and sequence-stratigraphic analyses. Paleodepth was quantitatively estimated using the equation proposed by Hohenegger [65], which relates the relative abundance of BF species to their preferred depth ranges in modern habitats. This method provides a more objective reconstruction of depositional settings by converting fossil assemblage data into numerical paleodepth values for improving the accuracy of paleoenvironmental reconstructions and strengthening qualitative paleoenvironmental interpretations. The paleodepth was estimated using Equation (1) [65]:
D e p t h = ( n j l j d j 1 ) ( n j d j 1 )
where (nj) represents the abundance, (lj) the preferred living depth, and (dj) the depth of dispersion of the BF species. Numerical paleodepth was estimated following the method of Hohenegger [65]. Species-specific preferred-depth (lj) and depth-dispersion (dj) parameters were constrained using the ecological information compiled by Murray [66] and the taxon-specific paleobathymetric sources summarized in Figure A4, while the interpretation of habitat preferences was further supported by modern and late Quaternary ecological studies [27,28,67,68].

2.6. Biofacies and Statistical Analyses

The marine environment was subdivided according to the depth (bathymetry) by Berggren and Aubert [56], Olsson and Nyong [57], and Morkhoven et al. [58] into inner neritic (0–50 m depth), which is characterized by a low planktic ratio (1–5%), having a high benthic ratio and little species diversity; middle neritic settings (50–100 m depth), which are marked by 8–25% planktic foraminifera and greater species diversity; outer neritic (100–200 m depth), which contains a high planktic ratio (30–70%); and upper bathyal settings (200–600 m depth), which are generally characterized by very high planktic proportions, commonly exceeding 90%.

3. Results and Discussion

3.1. Benthic Foraminiferal Assemblages

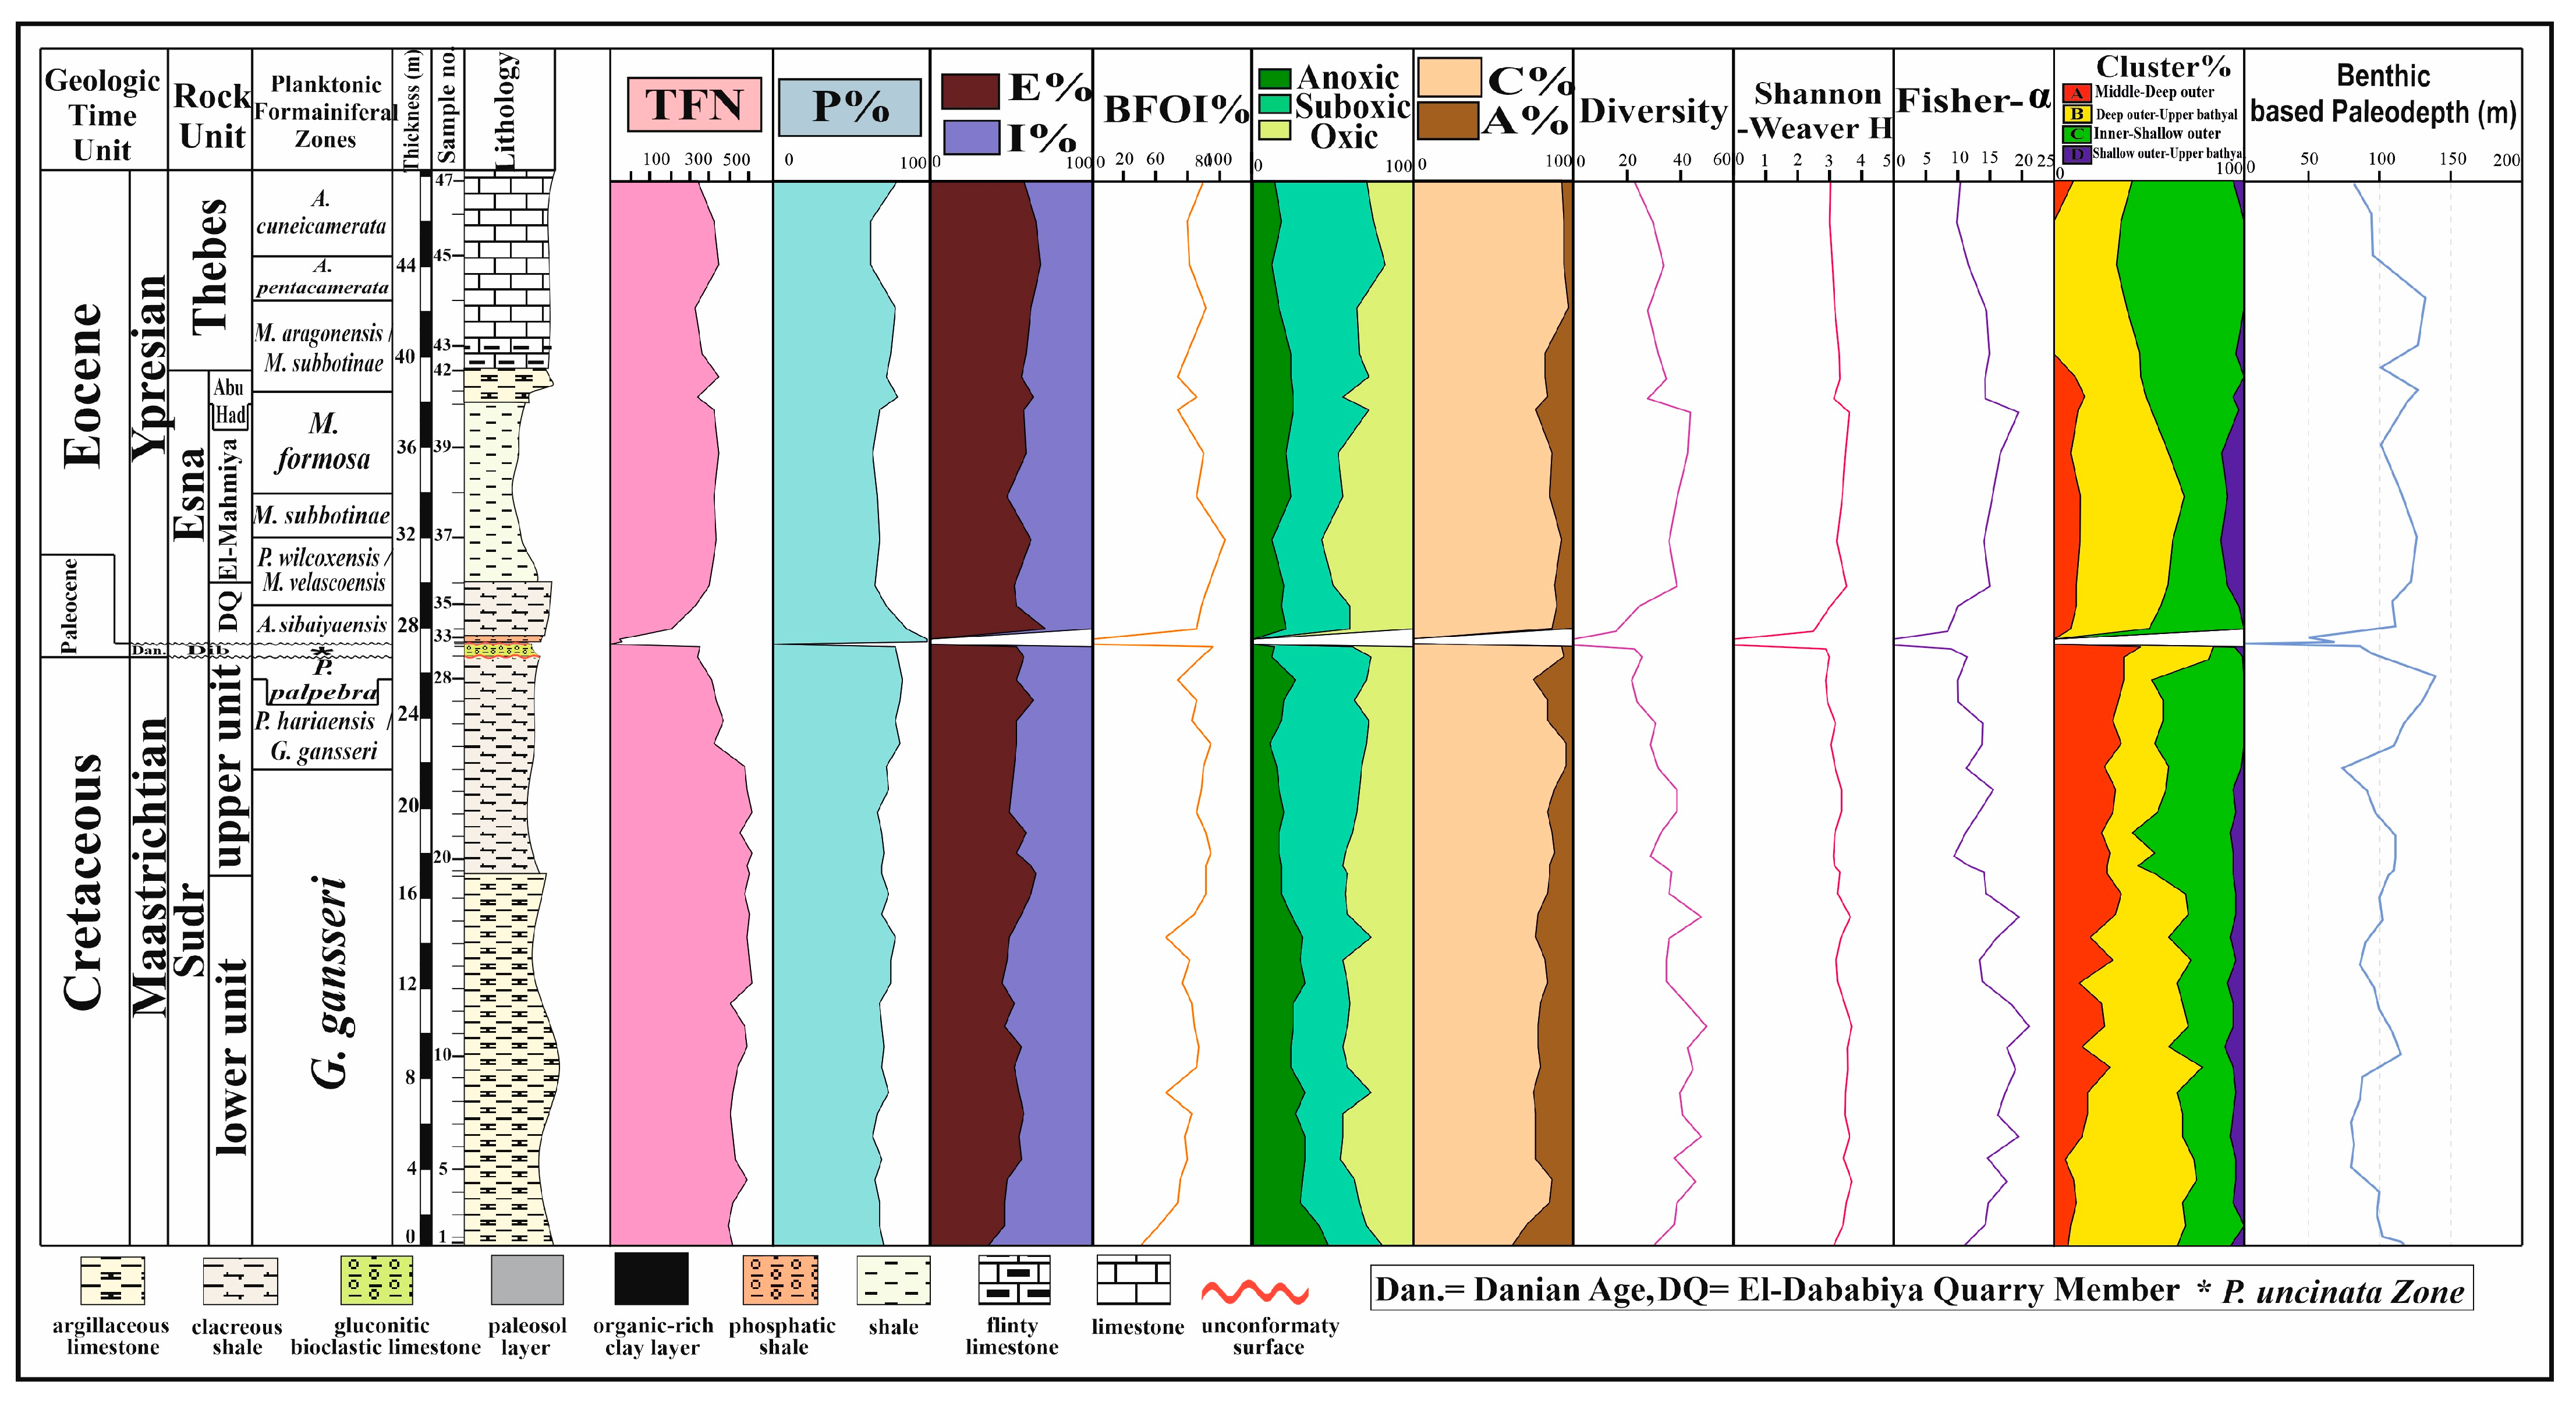
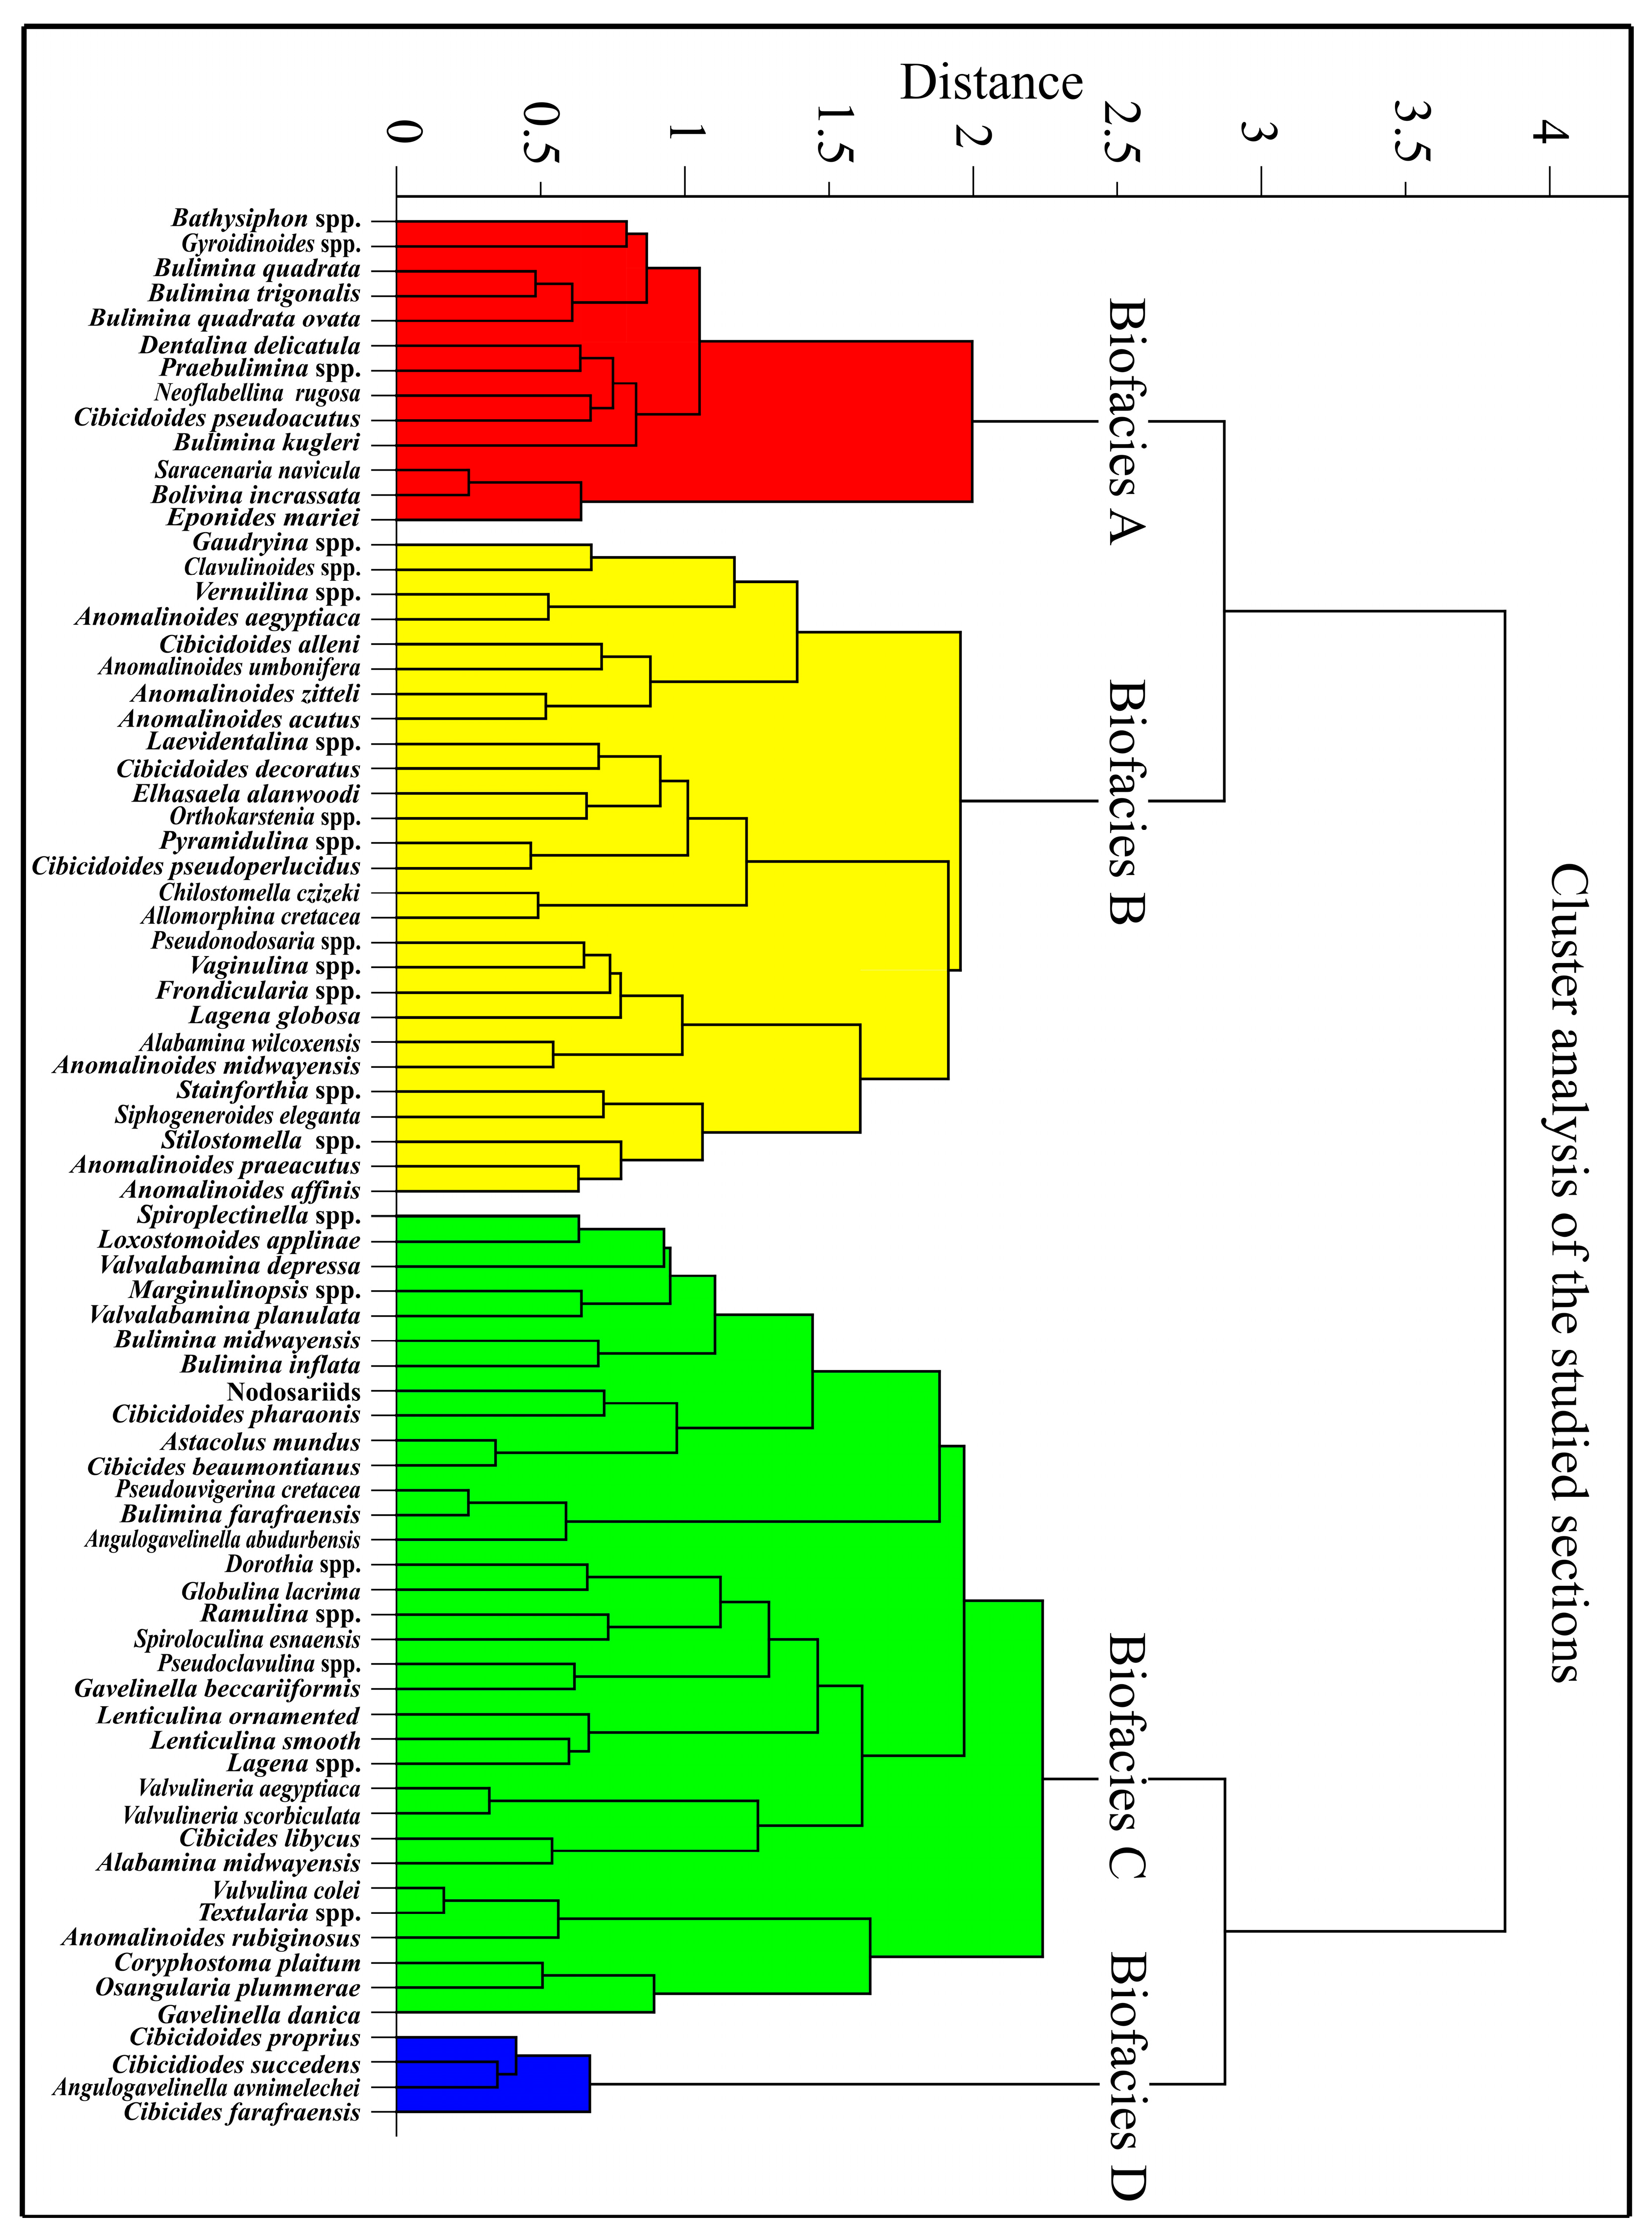
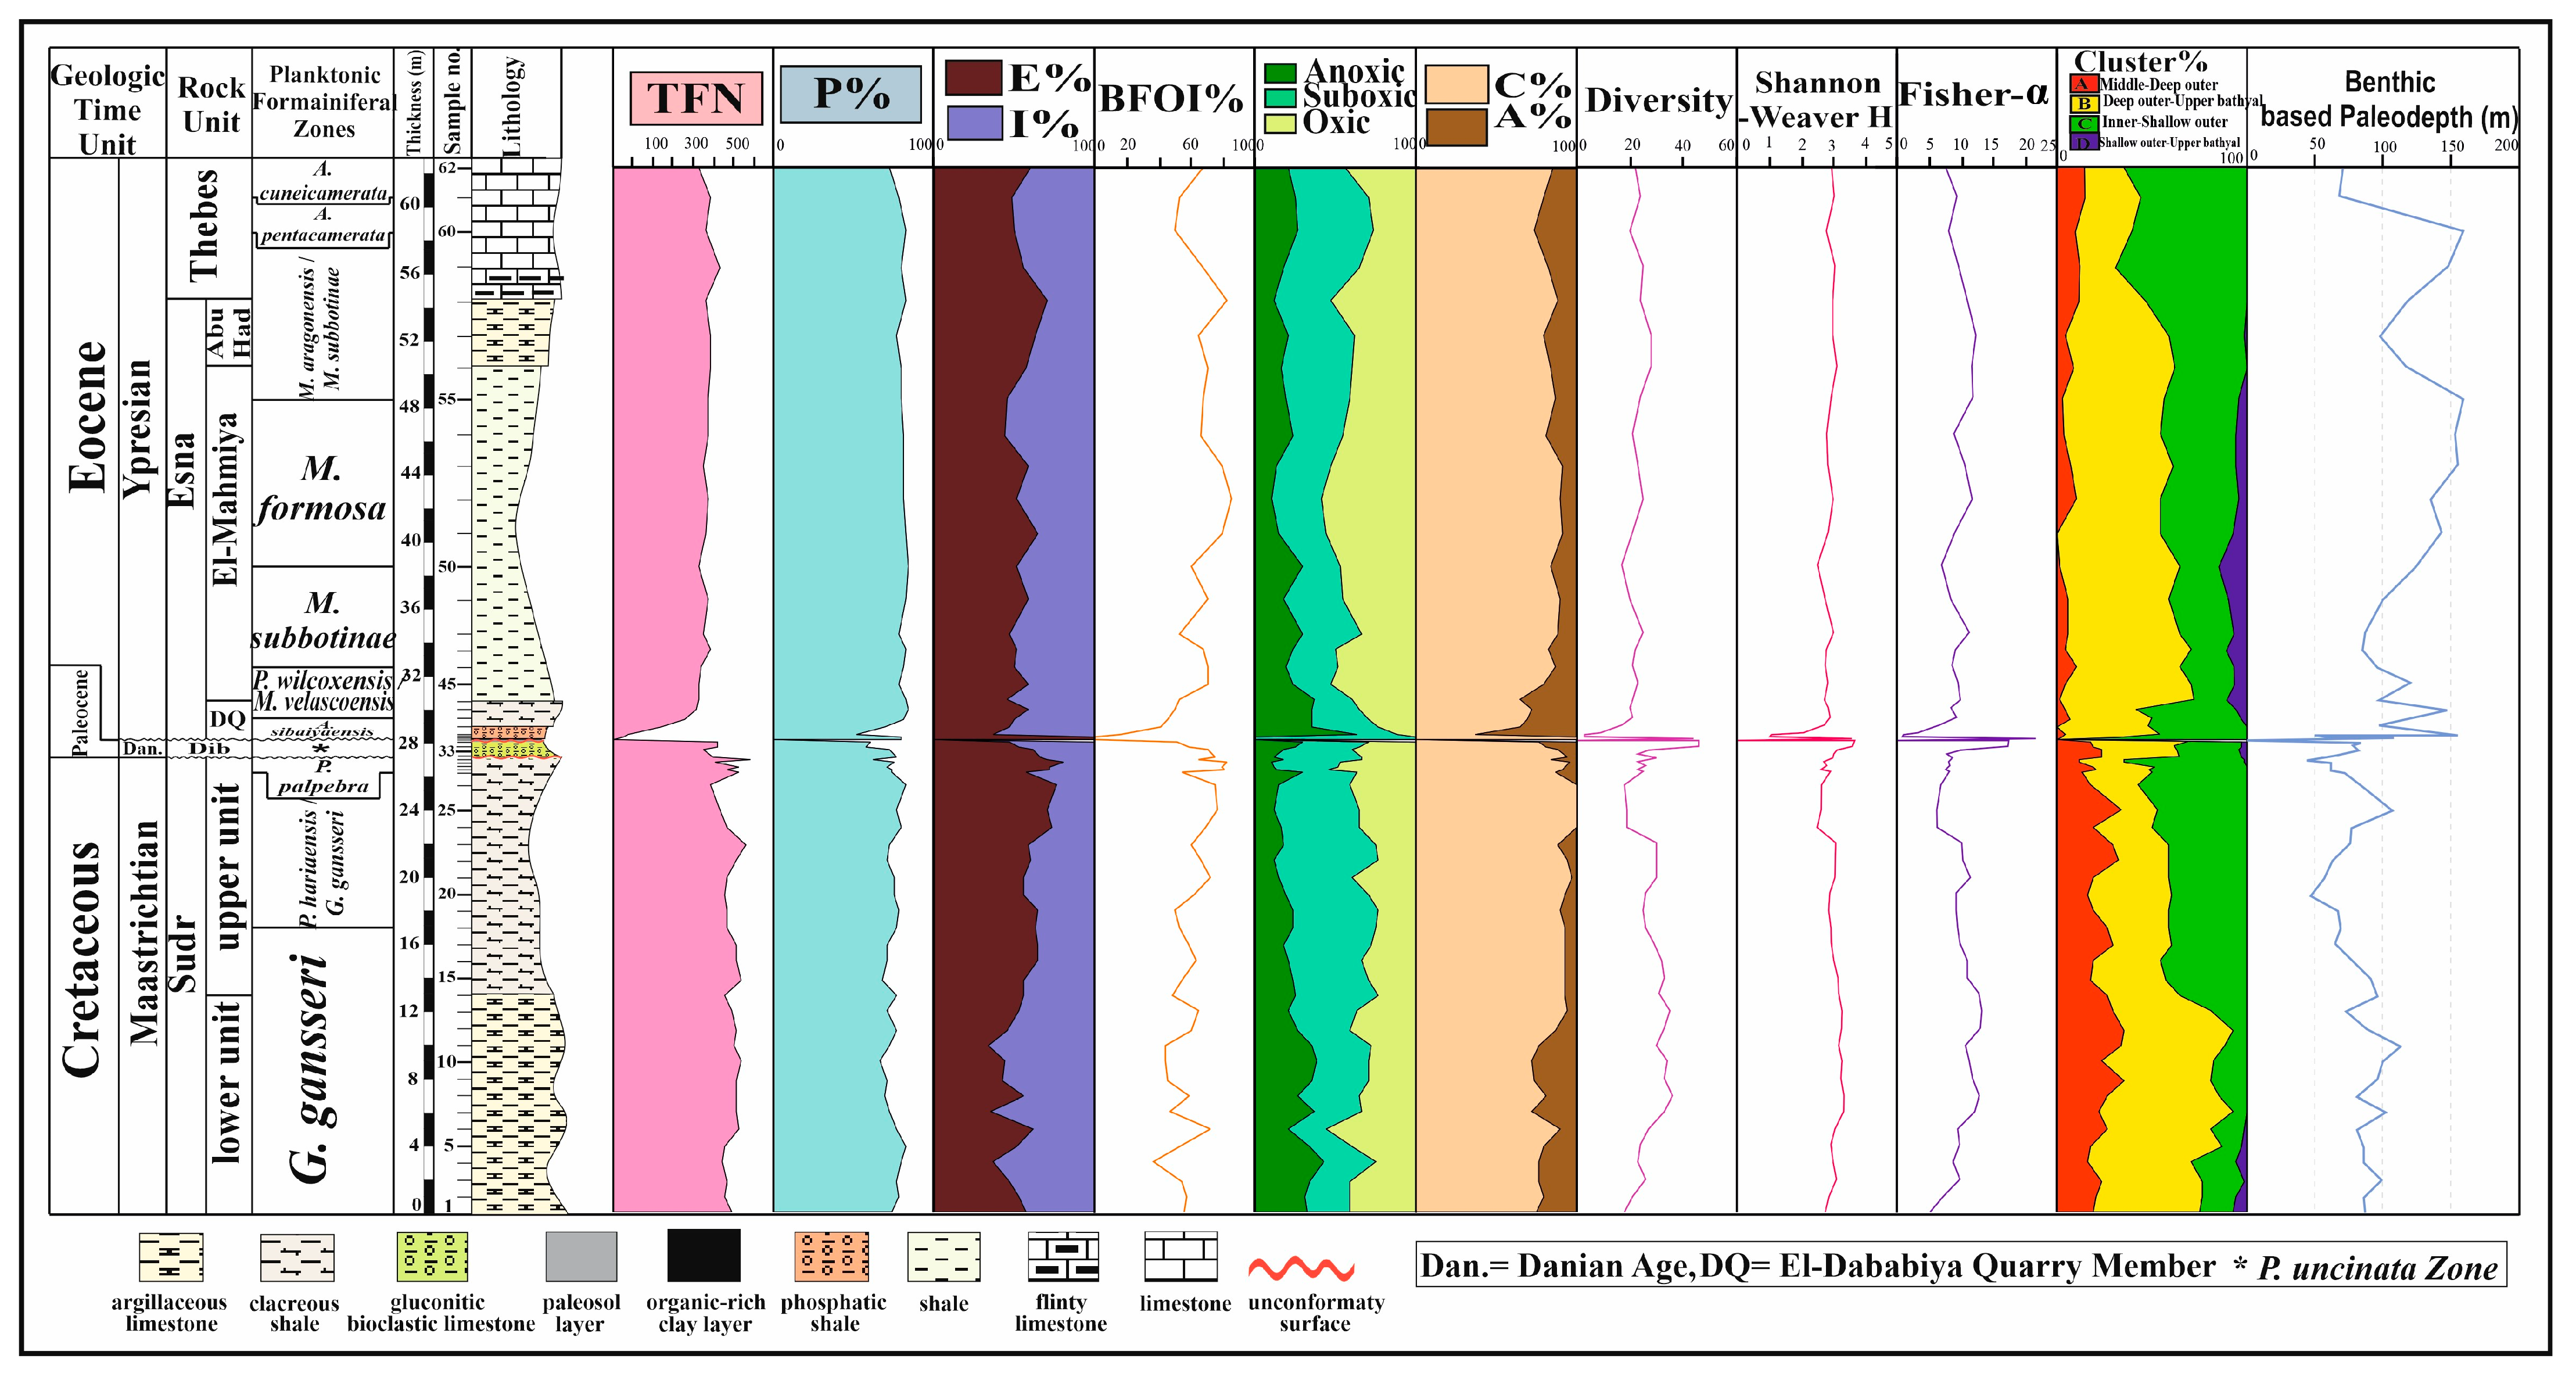
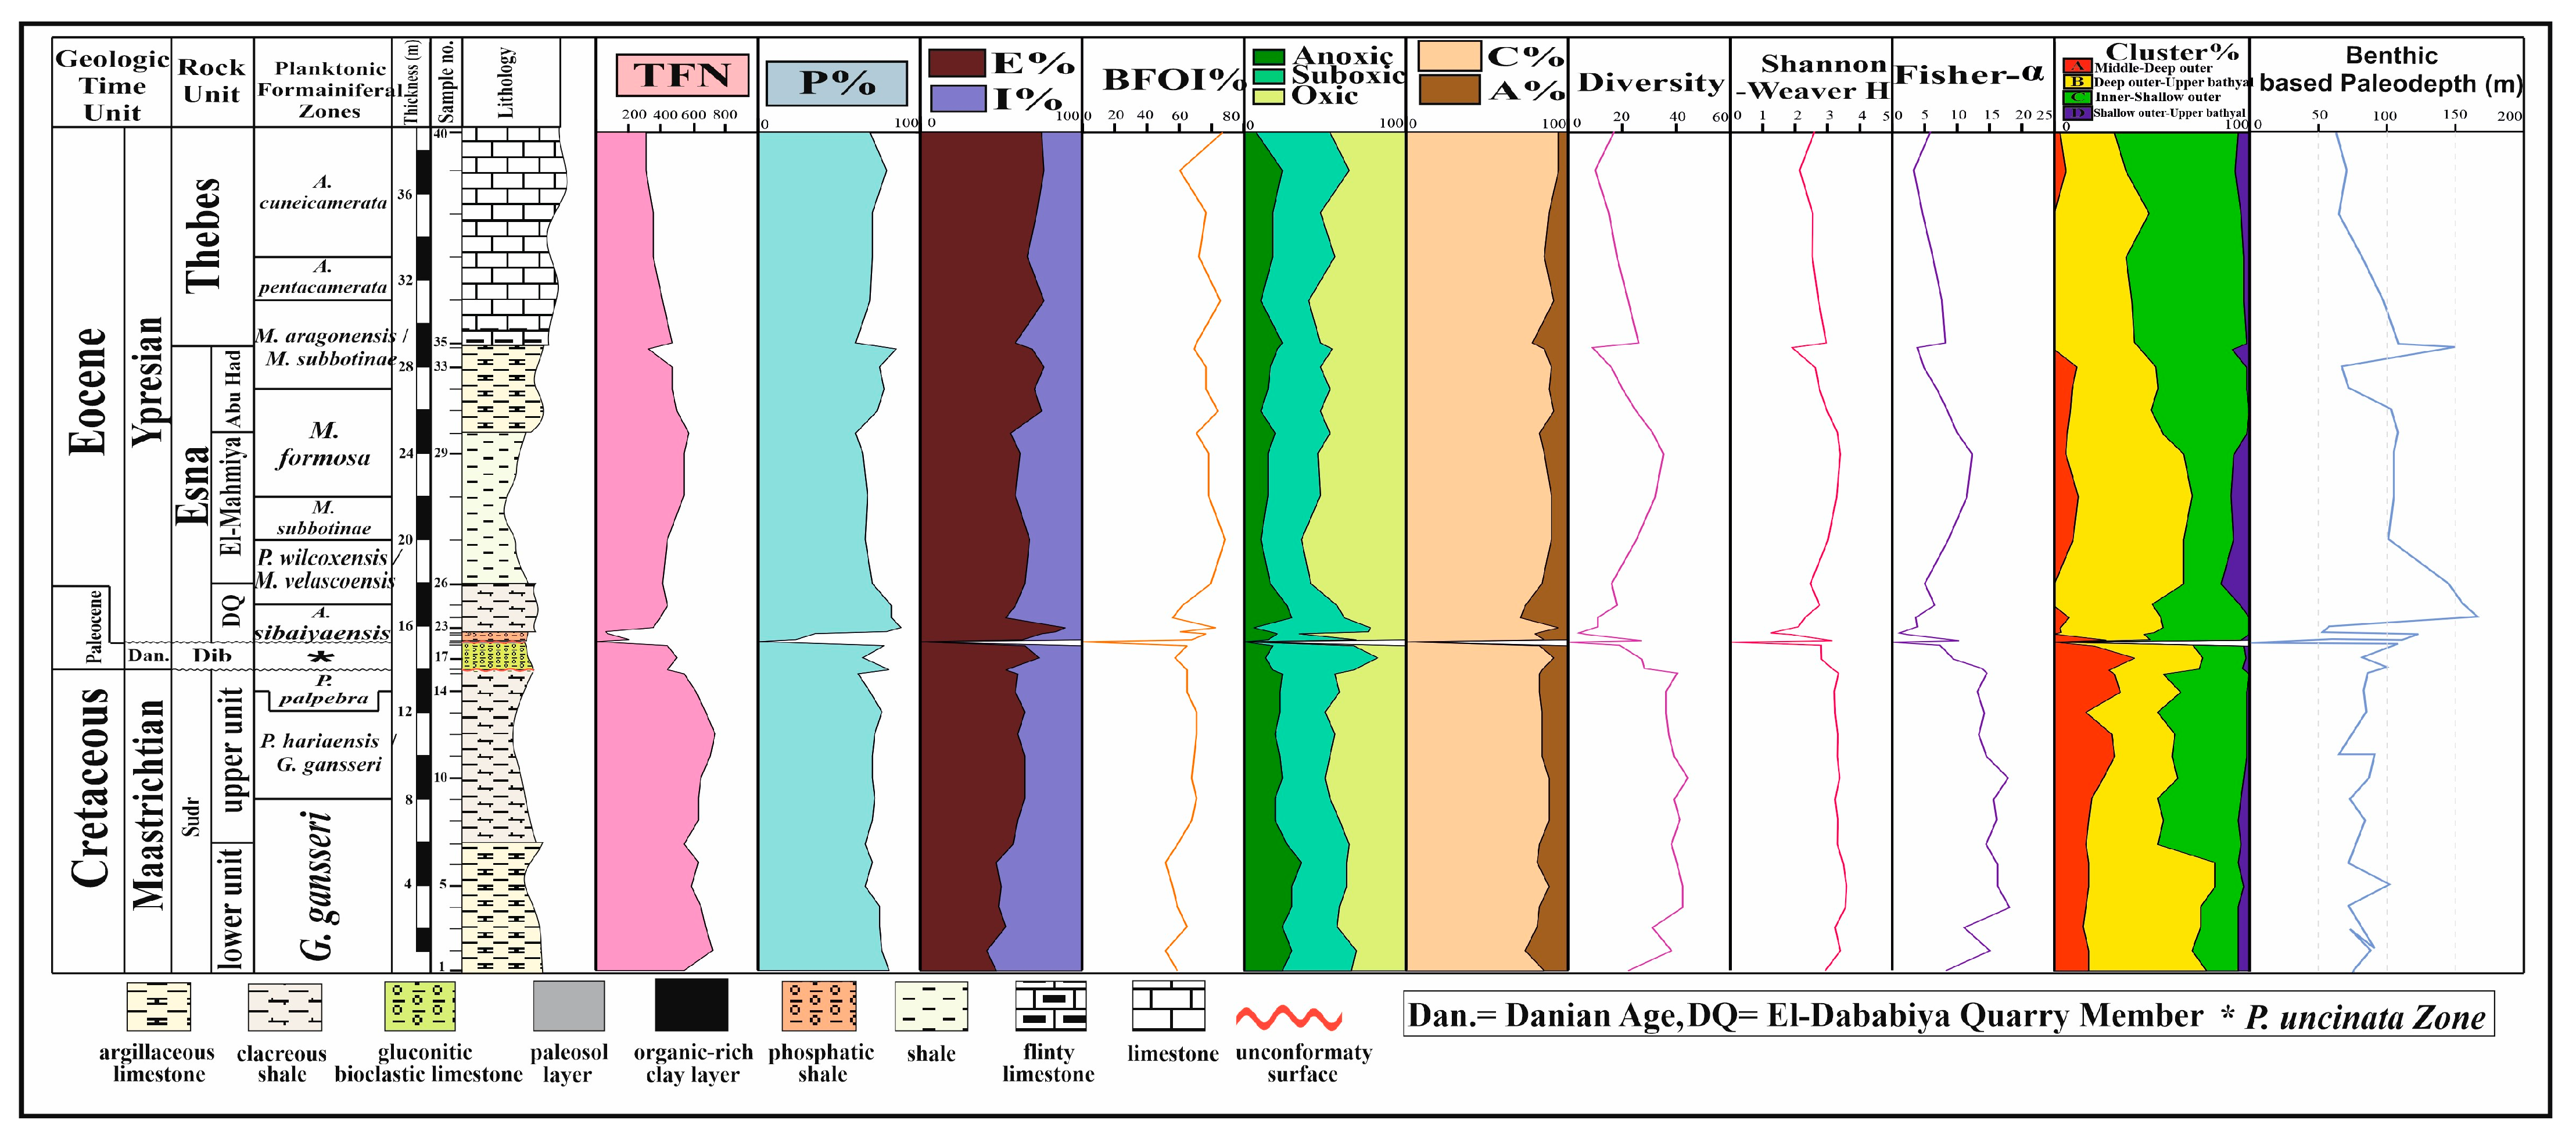
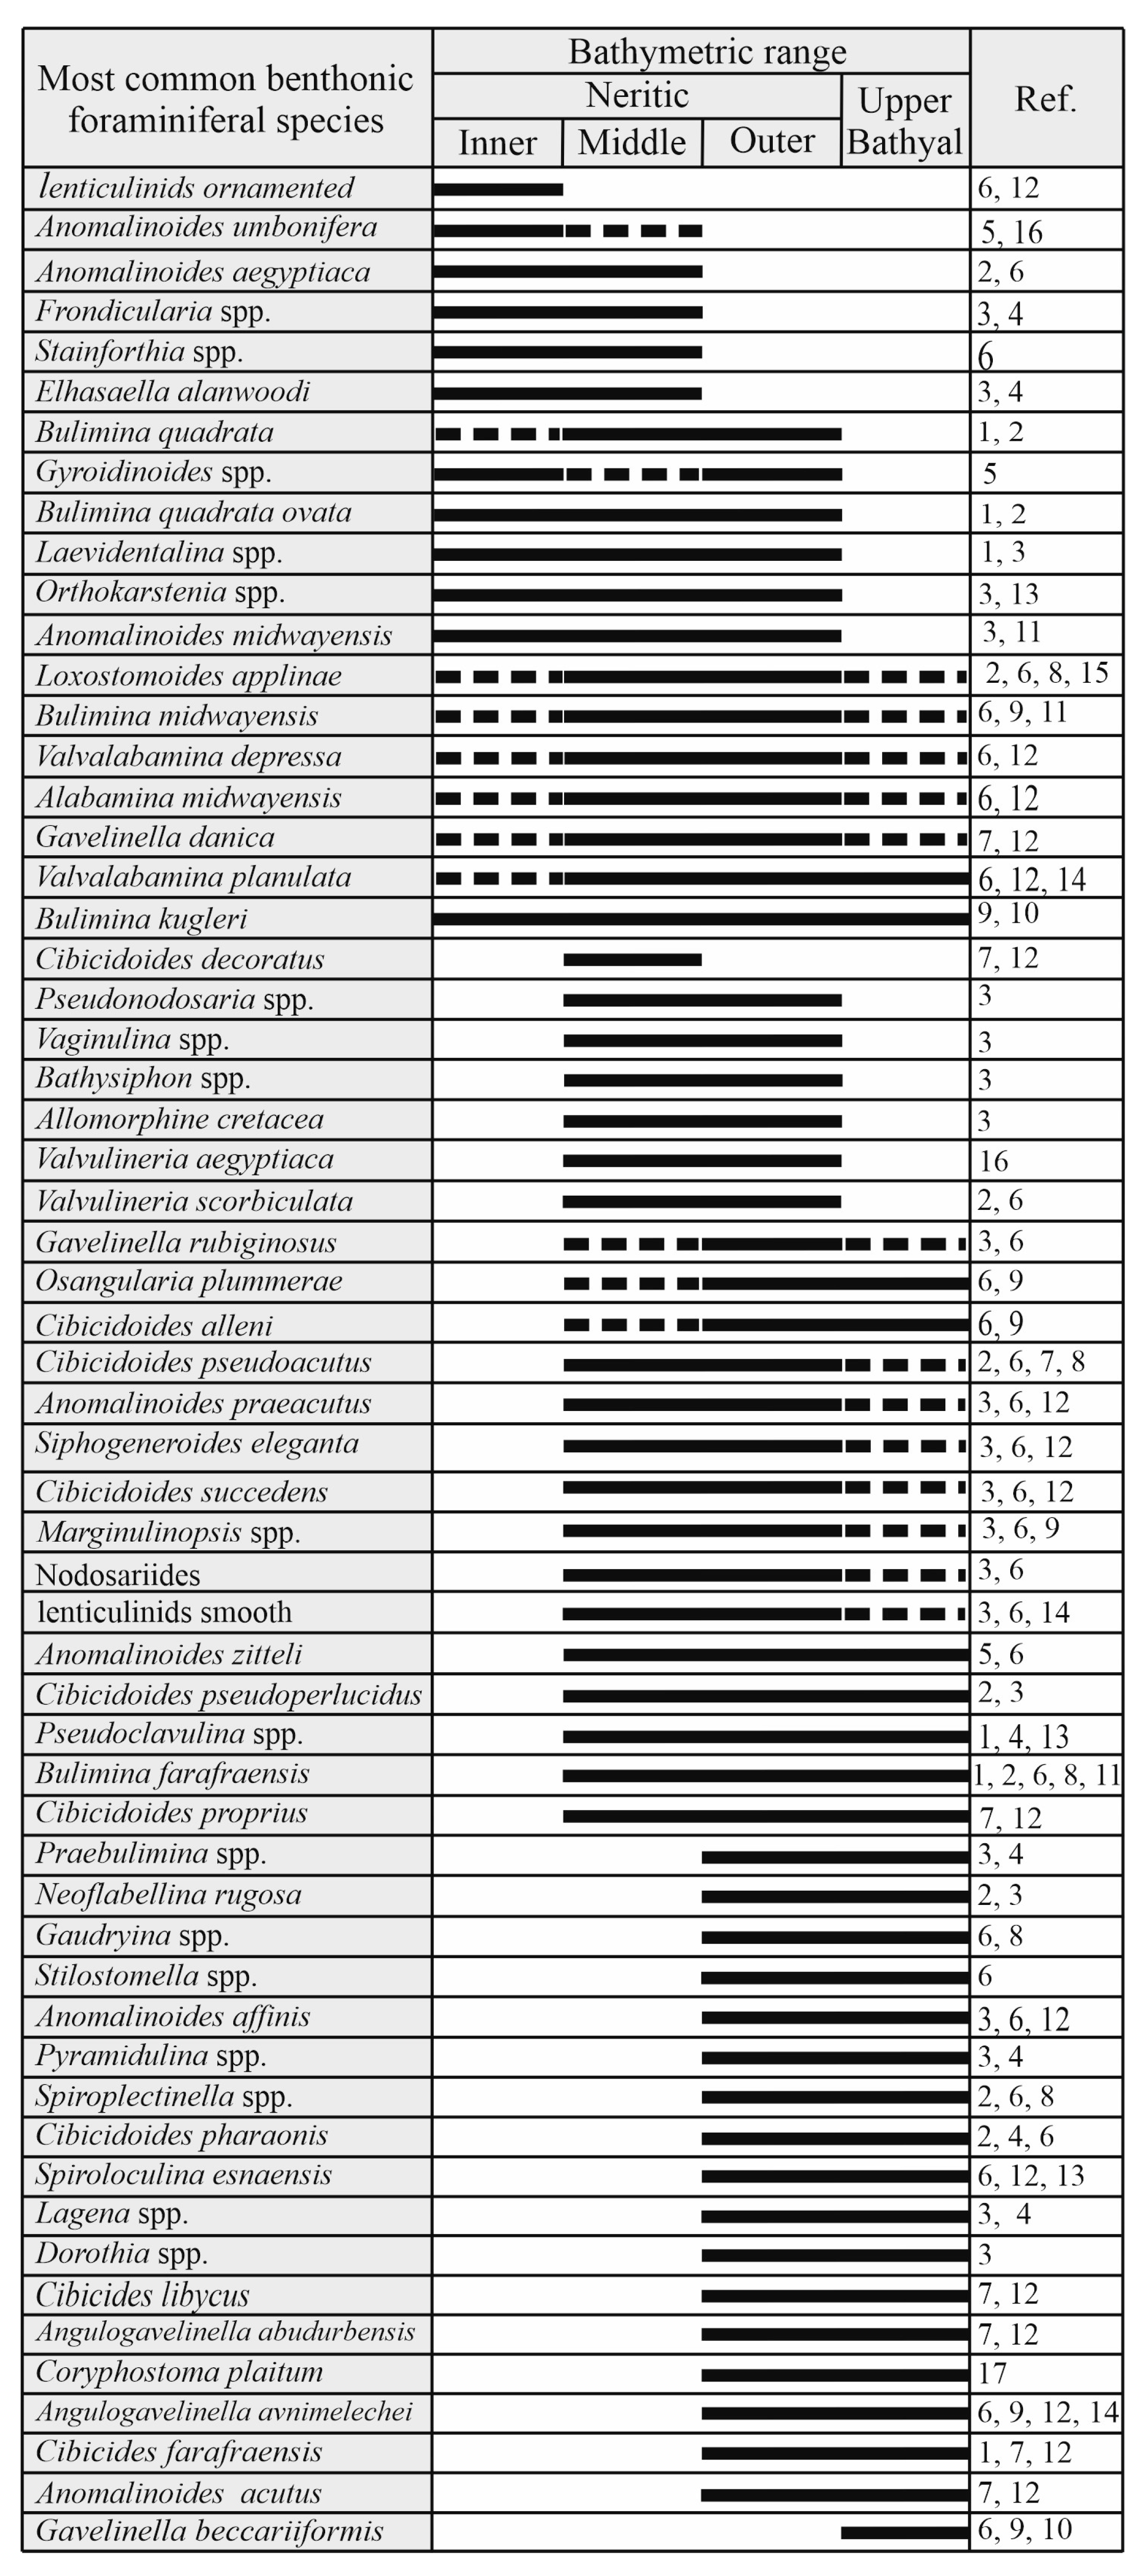
Four biofacies, designated A–D, were identified using R-mode cluster analysis of the BF dataset (Figure 2). These clusters were interpreted in terms of paleobathymetry, oxygenation, and trophic conditions. The dominant benthic taxa and cluster membership are shown in Figure 2, whereas the paleobathymetric references used to interpret their depth ranges are summarized in Figure A4.

3.1.1. Biofacies (A)

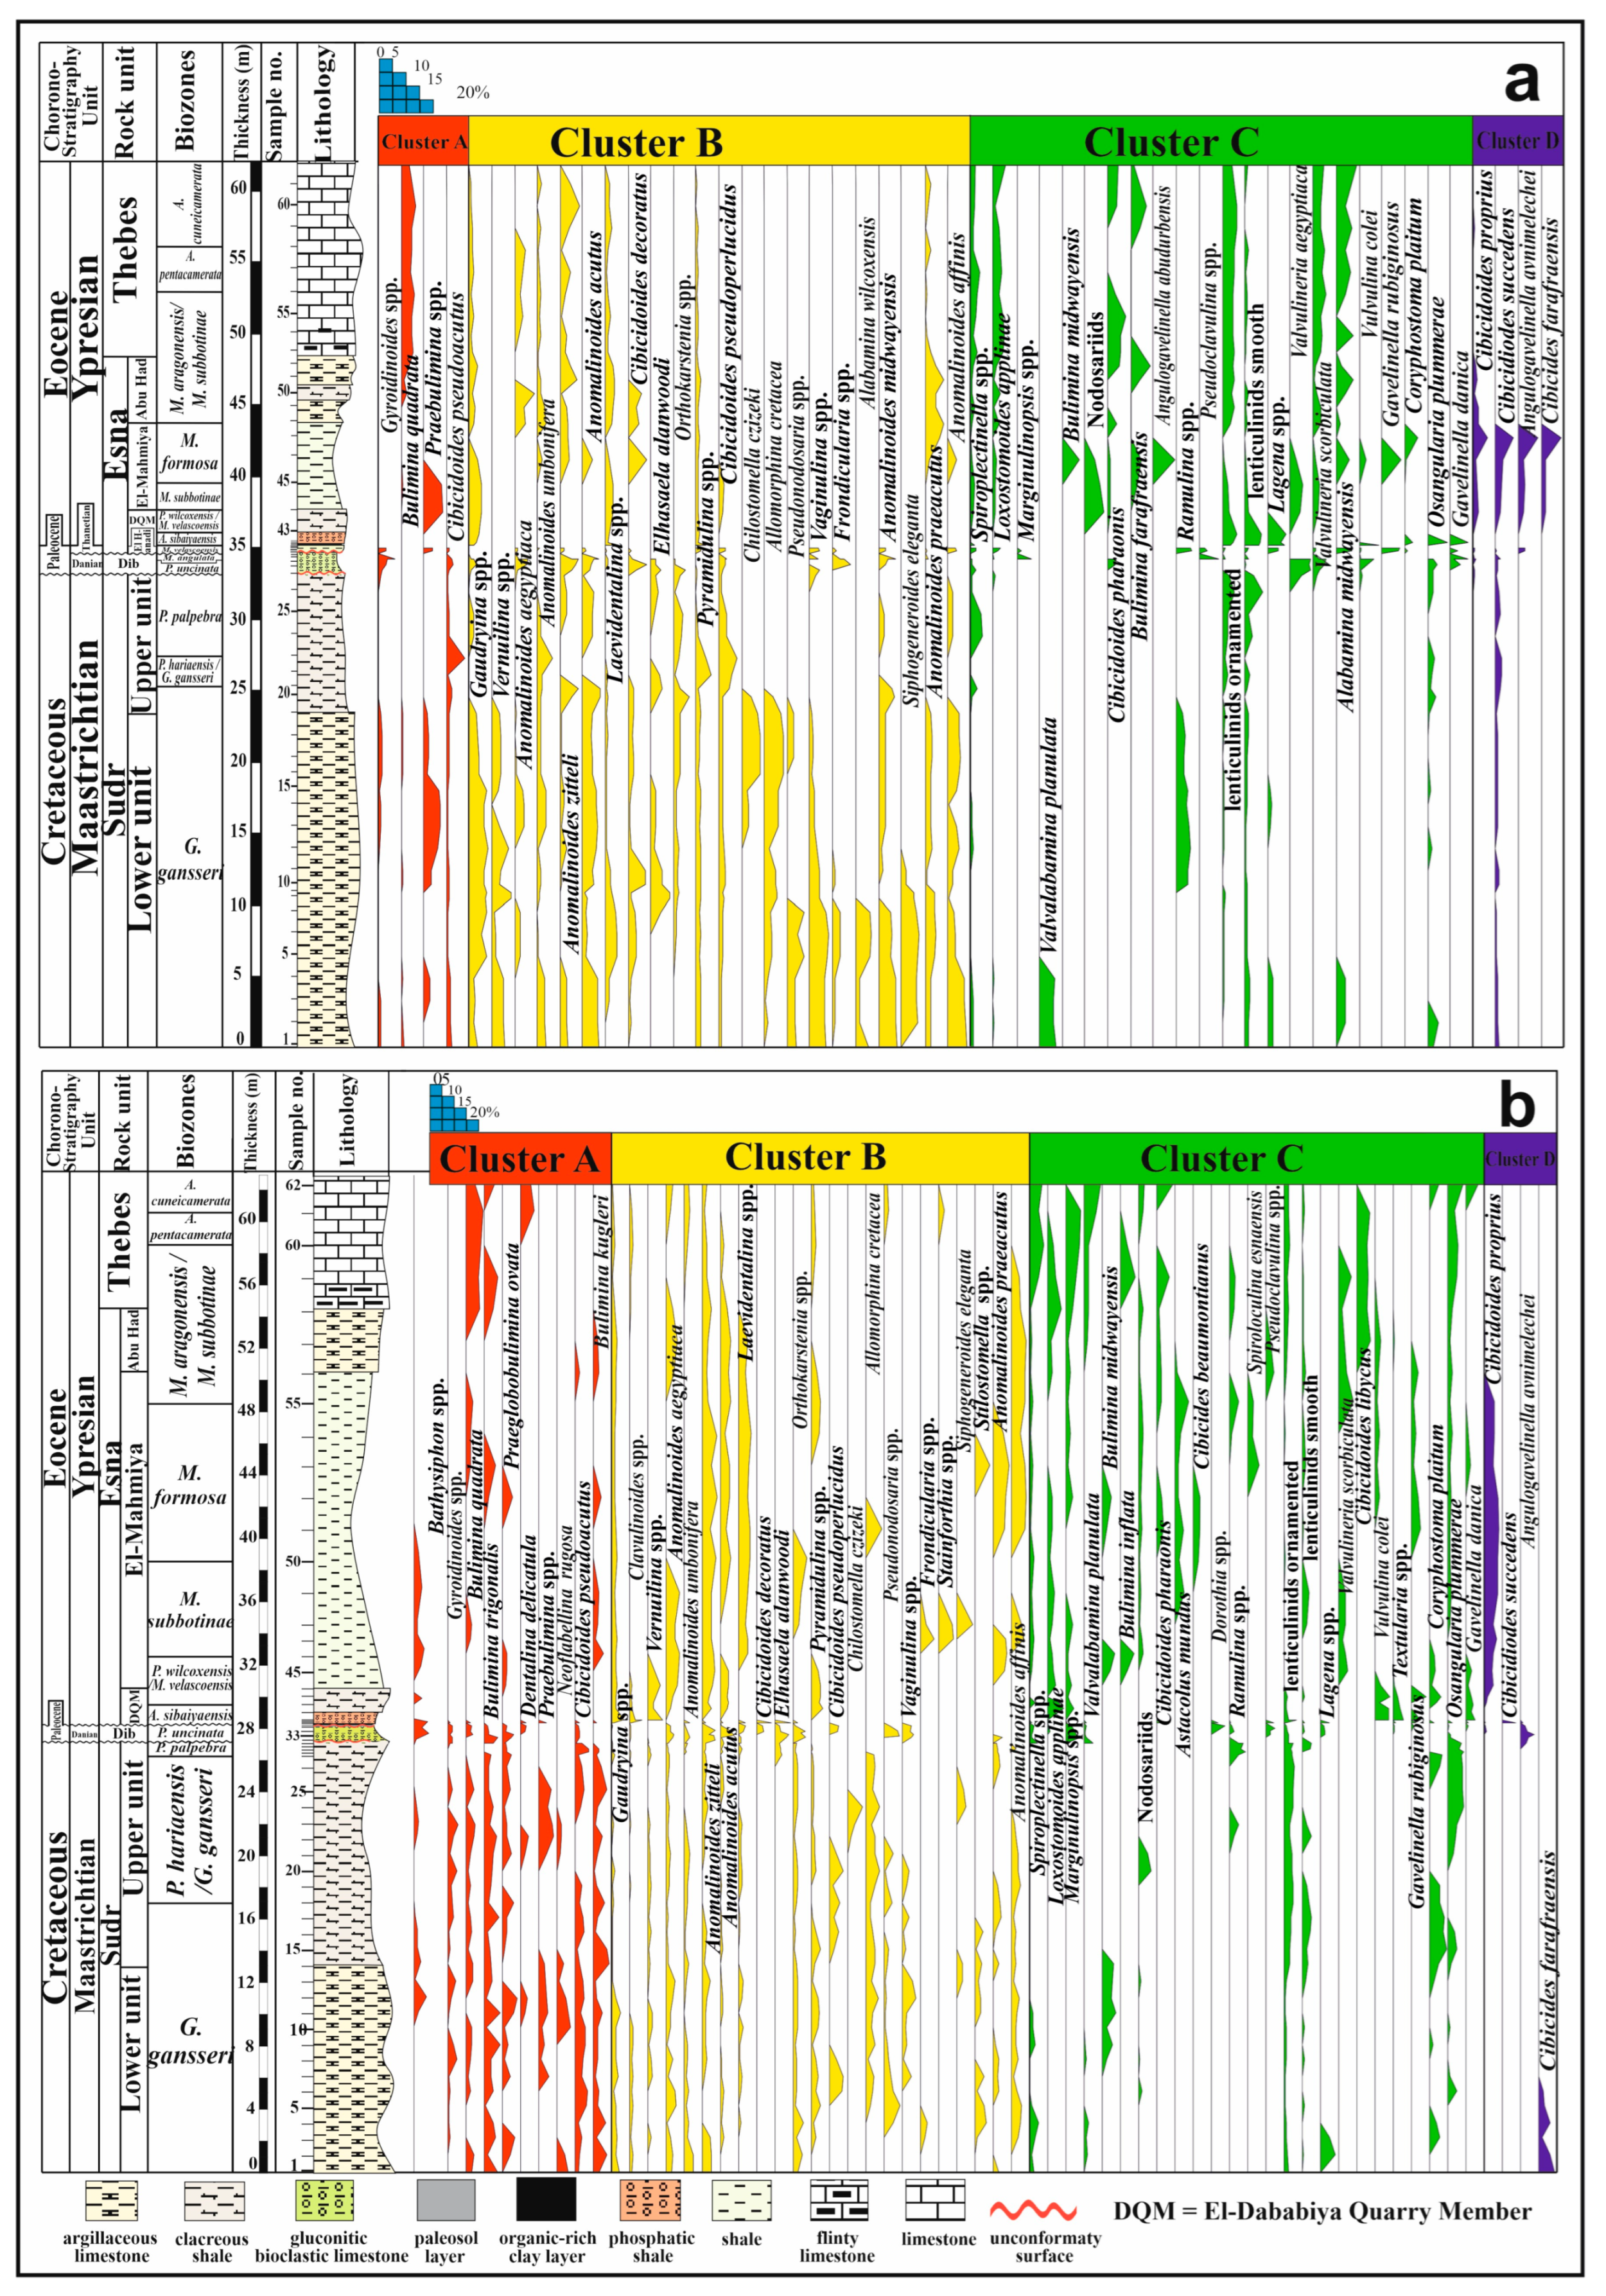
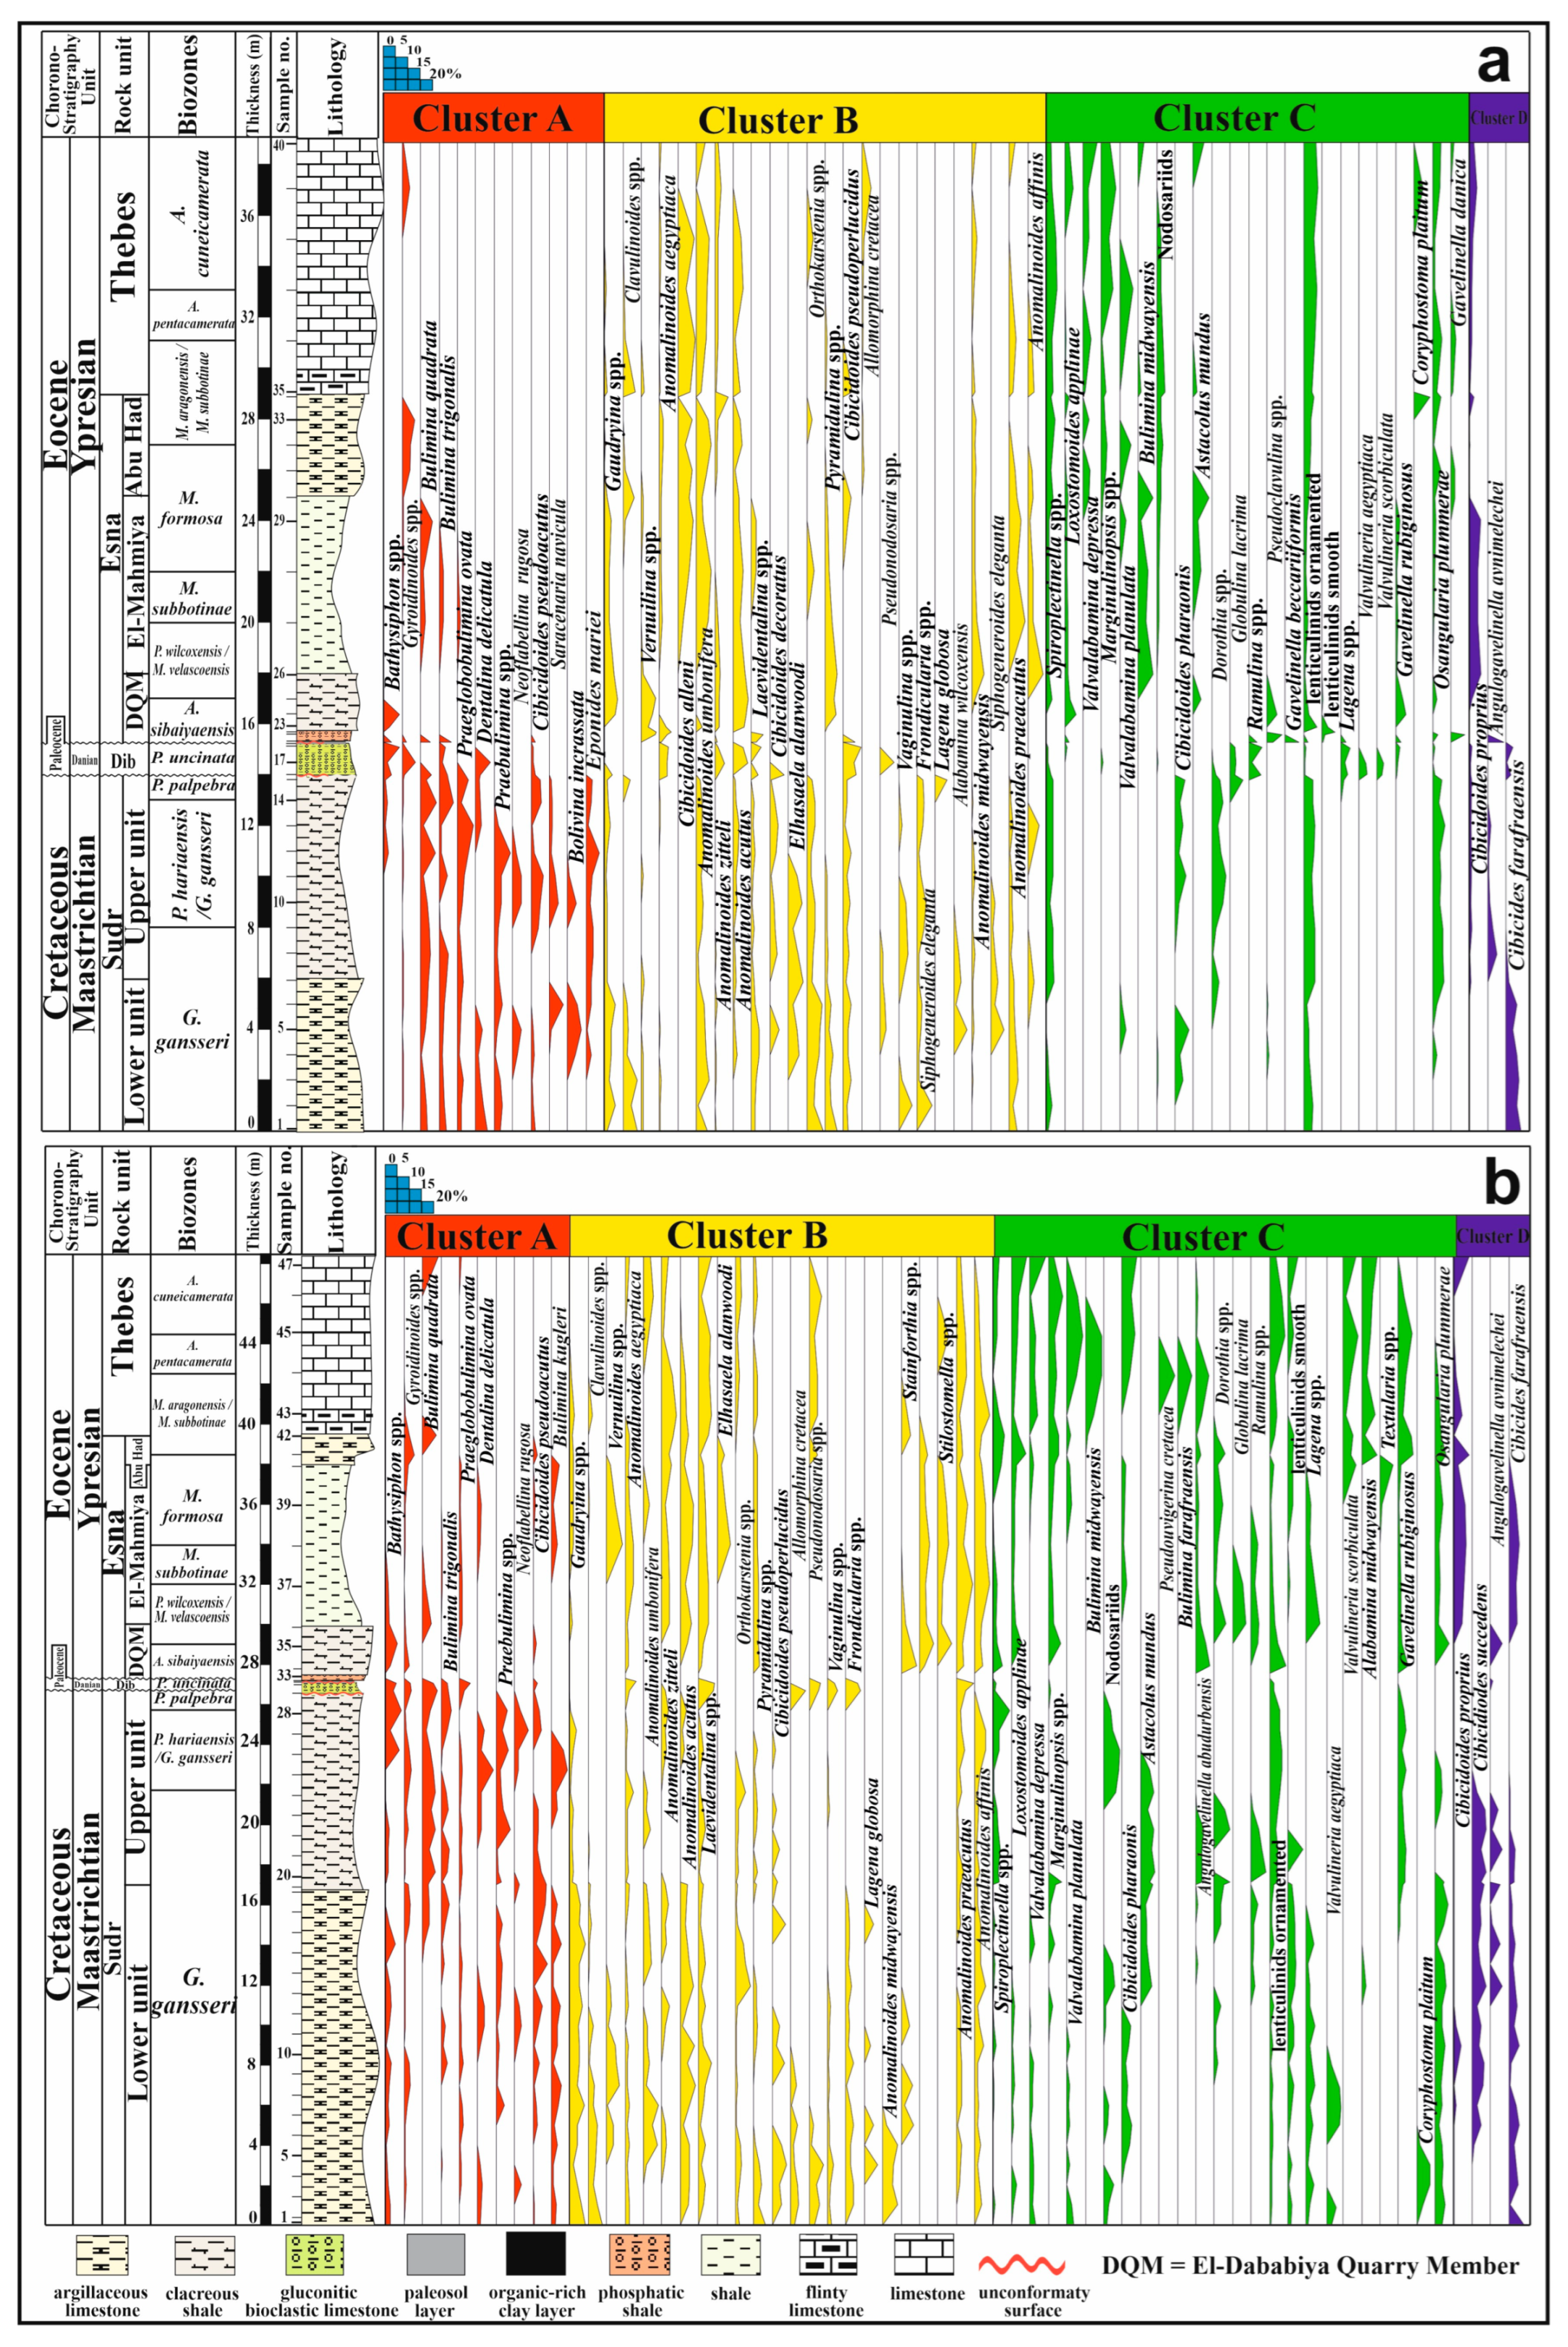
Biofacies A is most frequent in the upper Sudr Fm. and the El-Dababiya Quarry Member and is dominated by taxa indicative of middle- to deep-outer-neritic settings (50–200 m depth). It includes Bulimina trigonalis, B. quadrata, Praeglobobulimina ovate, and Gyroidinoides spp., which account for ~53% of the assemblage and indicate an inner- to outer-neritic (0–200 m depth) setting, the ~33% of middle-outer neritic (50–200 m depth) taxa (e.g., Cibicidoides pseudoacuta and Bathysiphon spp.), ~7% of inner-middle neritic (0–100 m depth) taxa (e.g., Bulimina kugleri), and ~7% of outer neritic–upper bathyal (100–500 m depth) taxa (e.g., Praebulimina spp. and Neoflabellina rugosa). Collectively, these taxa indicate a middle- to deep-outer-neritic paleoenvironmental setting (Figure 3 and Figure 4).

3.1.2. Biofacies (B)

This biofacies indicates a deep-outer-neritic to upper bathyal setting (200–600 m depth). It includes a well-diversified and abundant middle-neritic to upper bathyal component (50–600 m depth), which constitutes ~30.5% of the assemblage. It contains Pyramidulina spp., Anomalinoides praeacutus, A. zittelli, Siphogenerinoides eleganta, Cibicidoides pseudoperlucidus, and C. alleni., ~25.5% of outer neritic–upper bathyal (100–600 m depth) taxa (e.g., Gaudryina spp., Anomalinoides acutus, A. affinis, Stilostomella spp.), ~20.5% of inner-outer neritic (0–200 m depth) taxa (e.g., Laevidentalina spp., Orthokarstenia spp., Anomalinoides midwayensis), and ~17.5% of inner-middle neritic (0–100 m depth) taxa (e.g., Anomalinoides aegyptiaca, A. umbonifera, Frondicularia spp., Stainforthia spp., Elhasaella alanwoodi and Cibicidoides decoratus) with some less frequent taxa ~6% containing Pseudonodosaria spp., Vaginulina spp., and Allomorphina cretacea. Across all studied sections, the lower Sudr Fm. unit and El-Mahmiya Member had the highest frequency of this biofacies (Figure 3 and Figure 4).

3.1.3. Biofacies (C)

This assemblage indicates an inner- to shallow-outer-neritic setting (0–150 m depth). Among the studied sections, Biofacies C is most frequent in the Dib Fm. Inner neritic (0–50 m depth) taxa counts ~35% within this biofacies (e.g., ornamented lenticulinids). Also, it contains ~32% of the middle neritic–upper bathyal (50–600 m depth) taxa (e.g., Vulvulina colei, Anomalinoides rubiginosus, Osangularia plummerae, Marginulinopsis spp., Nodosaria spp., Pseudoclavulina spp., B. farafraensis, and smooth lenticulinids), ~19% of the outer neritic–upper bathyal (100–600 m depth) (e.g., Coryphostoma plaitum, Spiroplectinella spp., Cibicidoides pharaonis, Spiroloculina esnaensis, Lagena spp., Dorothia spp., Cibicides libycus, Gavelinella beccariiformis, and Angulogavelinella abudurbensis), ~11% of the inner neritic–upper bathyal (0–600 m depth) taxa (e.g., Gavelinella danica, Loxostomoides applinae, B. midwayensis, Valvalabamina depressa, and Alabamina midwayensis), and ~3% of the middle-outer neritic (50–200 m depth) taxa (e.g., Valvulineria aegyptiaca and V. scorbiculata) (Figure 3 and Figure 4).

3.1.4. Biofacies (D)

This assemblage indicates a shallow-outer-neritic to upper bathyal setting (150–600 m depth). In general, it occurs in very low proportions in all studied sections. Middle-neritic to upper bathyal (50–600 m depth) taxa represent ~60% (e.g., Cibicidoides proprius and C. succedens). Also, the middle-outer neritic (50–200 m depth) taxa account for ~40% (e.g., Angulogavelinella avnimelechei and Cibicides farafraensis) (Figure 3 and Figure 4).

3.2. Paleoenvironmental Interpretations

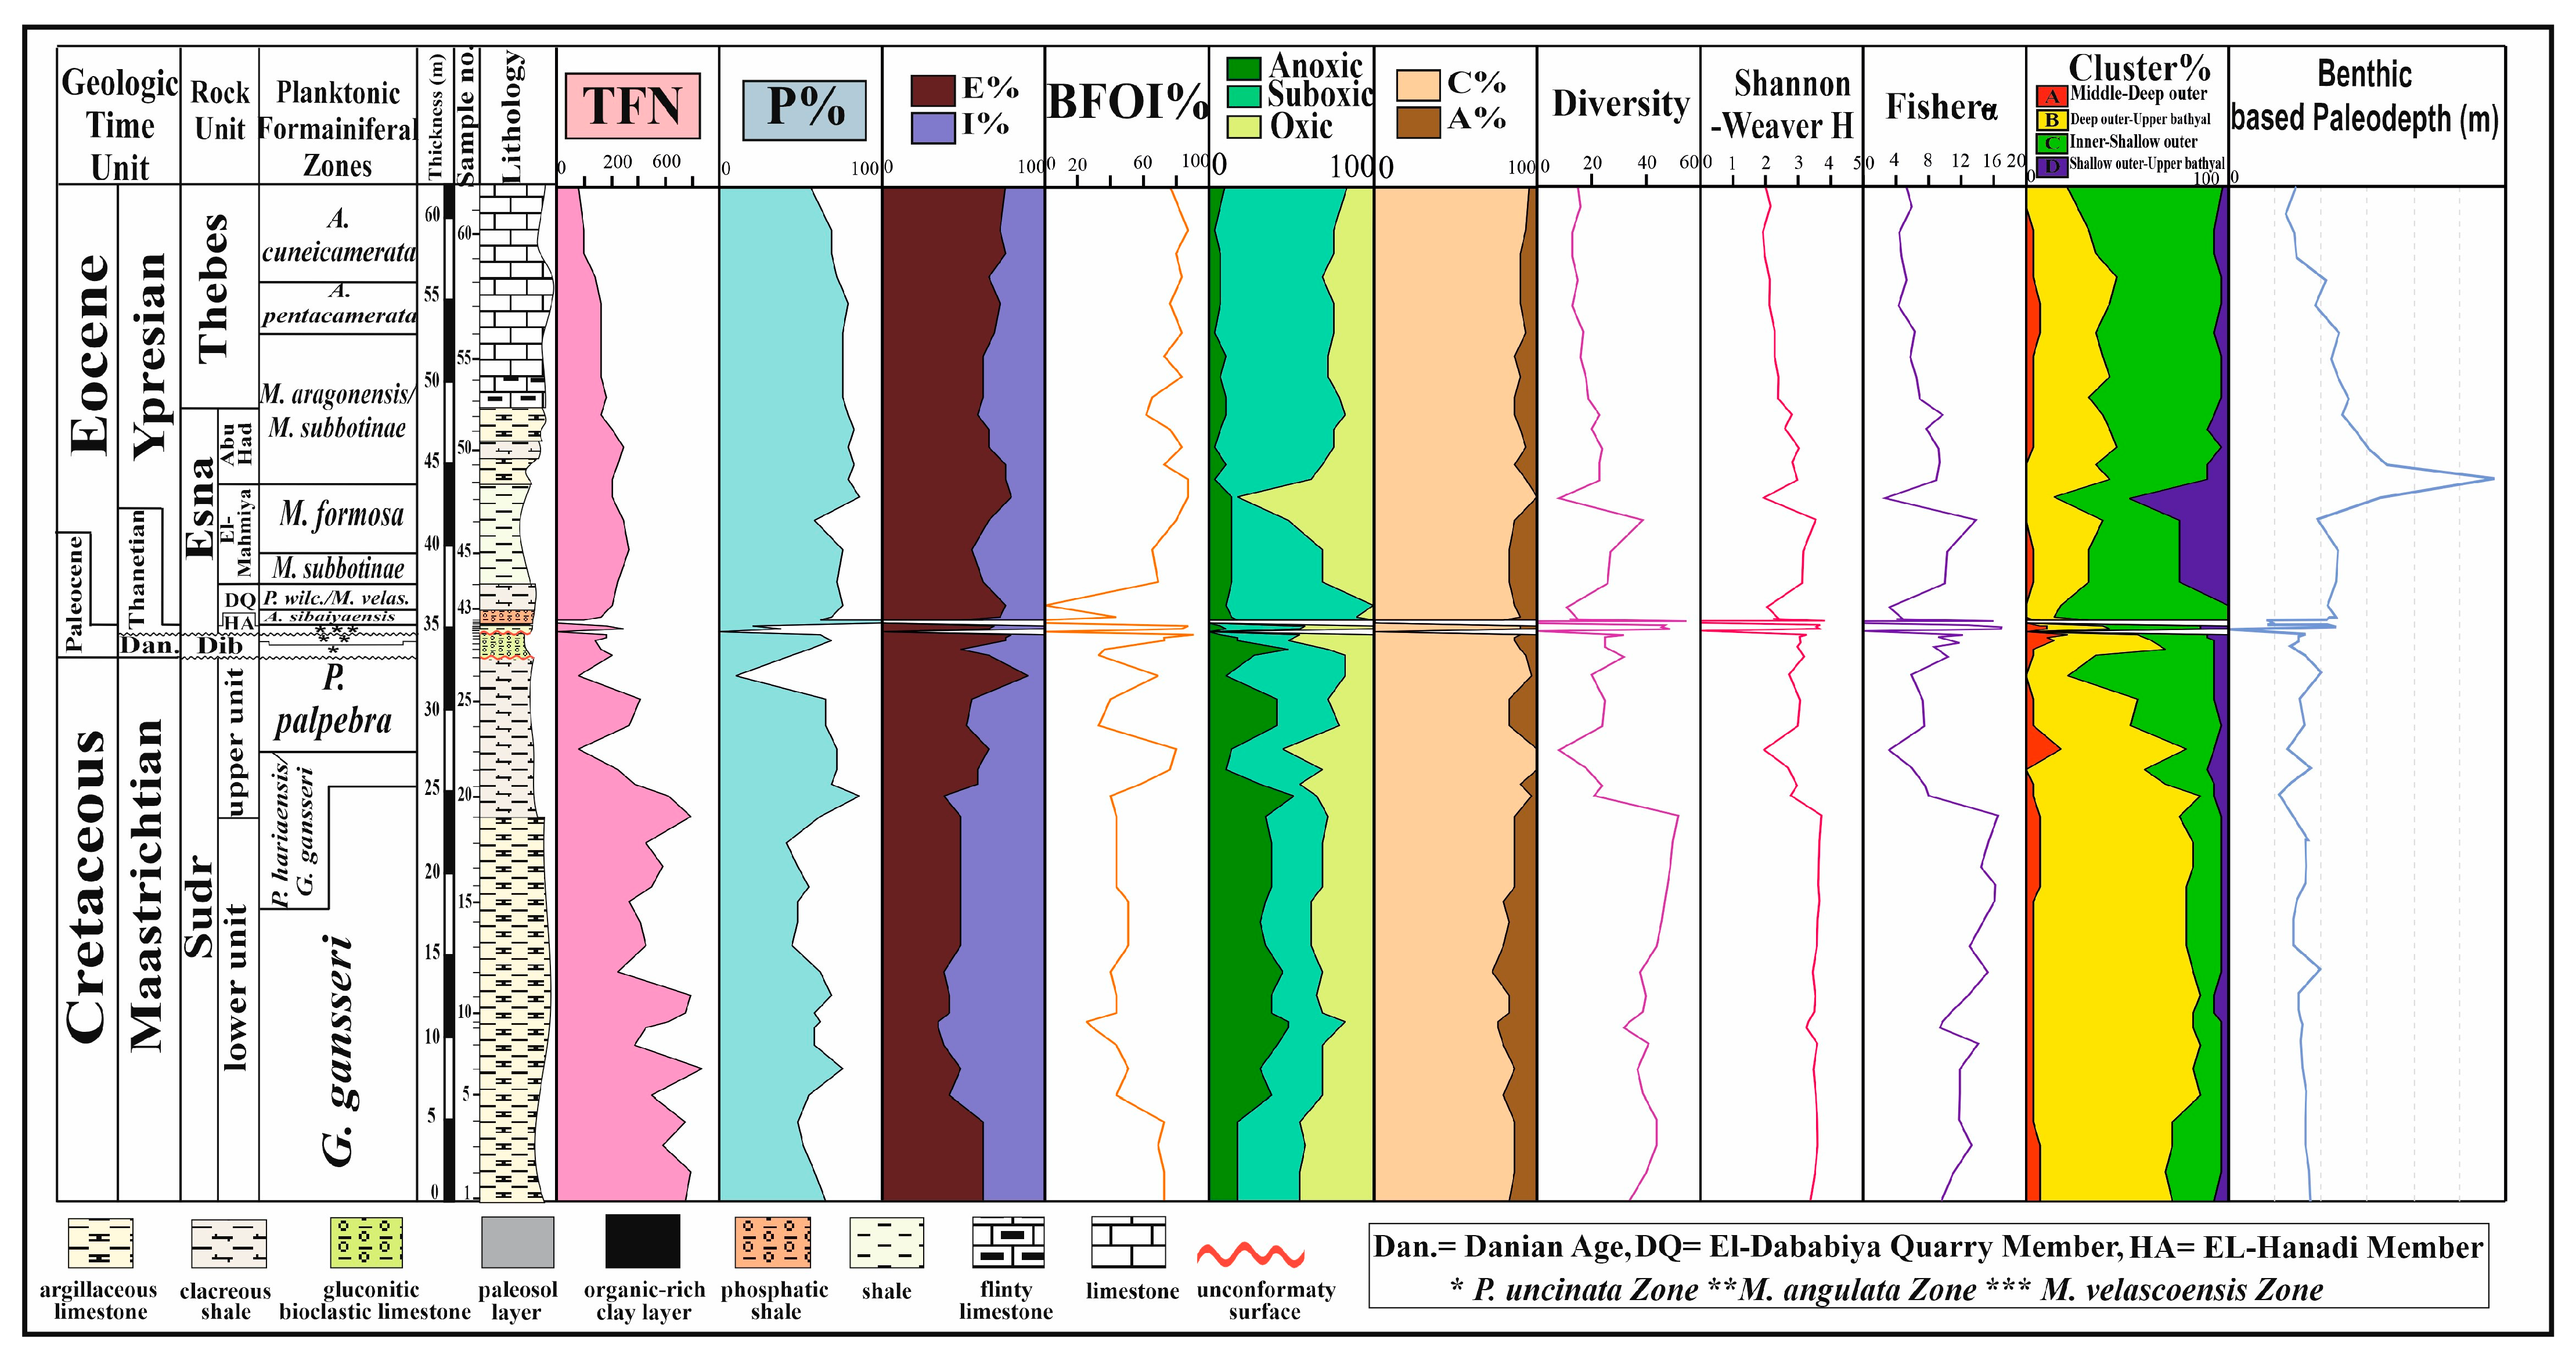
The Upper Cretaceous–Lower Paleogene paleoenvironmental conditions at the study sections are examined in terms of foraminiferal indices, benthic foraminiferal biofacies, and lithologic traits. The paleoenvironmental interpretation of each rock unit is based on key foraminiferal indices, including P/B ratio, species diversity, oxygenation, and paleoproductivity proxies such as planktic/benthic percentage (P/B%). Species diversity indices, seafloor oxygenation, and paleoproductivity were used to infer depositional conditions. These proxies provide insights into variations in water depth, bottom-water oxygenation, trophic conditions, and relative sea-level fluctuations through time. The studied succession records a major shift in depositional environments, from the basal carbonate facies of the Sudr Formation to the bioclastic carbonate facies of the Dib Formation, the siliciclastic facies of the Esna Formation, and the upper carbonate facies of the Thebes Formation. These lithological changes are accompanied by significant variations in BF assemblages and ecological indices, reflecting the influence of changing paleoceanographic conditions associated with the K/Pg and PETM intervals (Figure 5, Figure 6, Figure 7 and Figure 8). Accordingly, the paleoenvironmental evolution of each lithostratigraphic unit is discussed separately as follows:

3.2.1. The Sudr Formation

The Sudr Formation is represented by a thick succession of chalky to argillaceous yellowish-white and pale-gray limestone that passes upward into a calcareous shale. It is subdivided into two informal rock units; the lower unit is the bedded argillaceous limestone, and the upper unit is calcareous shale.
The Bedded Argillaceous Limestone
The exposed lower part of the Sudr Formation consists of well-bedded argillaceous to chalky limestone with pectenid shells and is assigned to the Late Maastrichtian G. gansseri Zone. This unit yields TFN values of ~713 individuals/g, P/B values of ~65%, species richness of ~28, Fisher’s α of ~9, and Shannon–Wiener H’ values of ~3. For both E and I morphogroups, the percentage of BF in this period is about equal throughout all study sections (~49% and 51%, respectively). The percentages of C/A and BFOI are around 81% and 54.5%, respectively. The bulk of its BF fauna is composed of the deep outer neritic–upper bathyal (200–600 m depth) species of B biofacies (~62%). Moderately diverse BF assemblages occur in the middle-deep outer neritic (50–200 m depth) and inner-shallow-outer-neritic (0–150 m depth) taxa of A and C biofacies (~17.5% and ~18%, respectively). Furthermore, the mixed epifaunal and infaunal morphogroups in this assemblage show a moderate BFOI, suggesting mesotrophic conditions and relatively elevated seafloor productivity. Accordingly, the lower Sudr Fm. was deposited in a middle-neritic to upper bathyal setting, corresponding to an estimated depth range of 50–600 m (Figure 5, Figure 6, Figure 7 and Figure 8).
The Calcareous Shale
Brownish calcareous shale that is abundant in pectenid shells comprises the upper unit of the Sudr Fm. It is covered by the late Maastrichtian P. hariaensis/G. gansseri and P. palpebra zones; the thickness of this unit ranges from 8 to 14 m in the studied sections. Mean TFN, P/B ratio, species richness, Fisher’s α, and Shannon–Wiener H’ are approximately 580 individuals/g, 70%, 26.5, 7.5, and 2.5, respectively. During this interval, the BF assemblages show increased BFOI values (~63.5%), a high percentage of C/A (~90%), and E morphogroups (~62%). About 43% of the BF fauna of this period is made up of species of C biofacies that are inner-shallow outer neritic (0–150 m depth). This biofacies’ fauna is characterized by varied BF of the middle-deep outer neritic (50–200 m depth) and deep outer neritic–upper bathyal (200–600 m depth) taxa of A and B biofacies (~20.5% and ~36.5%, respectively) (Figure 5, Figure 6, Figure 7 and Figure 8). Furthermore, mesotrophic to slightly oligotrophic conditions and lower seafloor productivity are indicated by the increasing number of epifaunal morphogroups and BFOI. Therefore, the middle-outer neritic (50–200 m depth) environment is where the top unit of the Sudr Fm. was deposited (Figure 5, Figure 6, Figure 7 and Figure 8).

3.2.2. The Dib Formation

It is composed of bioclastic and glauconitic limestone, fragmented reworked macrofossils (such as hexacorals, bivalves, gastropods, and cephalopods), and reworked pebbly extra-clasts [47]. It is assigned to the Danian M. angulata and P. uncinata Zones. Its thickness ranges from 0.5 to 1.5 m in the investigated sections. Mean TFN, P/B ratio, species richness, Fisher’s α, and Shannon–Wiener H’ are approximately 405 individuals/g, 70%, 21, 8, and 3, respectively.
Benthic foraminiferal assemblages in the Dib Formation are characterized by the predominance of the epifaunal morphogroups (~65%), with a high percentage of C/A and BFOI (~90% and ~64.5%, respectively). Furthermore, the BF assemblages of this interval’s mixed E and I morphogroups and elevated BFOI suggest mesotrophic to slightly oligotrophic conditions and declining seafloor productivity. These data indicate that the Dib Fm. was deposited in an inner- to shallow-outer-neritic setting, corresponding to an estimated depth range of 0–150 m (Figure 5, Figure 6, Figure 7 and Figure 8).

3.2.3. The Esna Formation

Aubry et al. [33] separated the Esna Fm. into four members, numbered from bottom to top: El-Hanadi, DQM, El-Mahmiya, and Abu Had.
El-Hanadi Member
This member appears only at GM and measures 0.5 m thick. It is covered by the latest Paleocene M. velascoensis (P5) Zone. It is composed of gray shale. Mean TFN, P/B ratio, species richness, Fisher’s α, and Shannon–Wiener H’ are approximately 511 individuals/g, 32%, 35.5, 10.2, and 3.3, respectively. Epifaunal morphogroups are dominant in this interval, constituting ~72.2% of the BF assemblage.
Furthermore, high C/A ratios and BFOI values (~93% and ~85%, respectively) distinguish this interval. The biofacies B (deep middle neritic–upper bathyal, 50–600 m depth) and C (inner-shallow outer neritic, 0–150 m depth) account for the majority of the BF fauna of this interval (~34.3% and ~43.7%, respectively). This contrasts with the low diversification of BF of the biofacies A (middle-deep outer neritic, 50–200 m depth) and D (shallow outer neritic–upper bathyal, 150–600 m depth) (~12% and 10%, respectively). The morphogroups of epifauna with very high BFOI values increased in this assemblage, suggesting oligotrophic conditions and poor productivity on the seafloor. Accordingly, El-Hanadi Mb. in the GM section was deposited in a middle- to shallow-outer-shelf environment (depth of 50–150 m) (Figure 5).
El-Dababiya Quarry Member (DQM)
The DQM comprises five distinct beds that are around 2.4 m thick and match those of the GSSP at El-Dababiya Village, near Luxor City, Upper Egypt. From bottom to top, these layers are organized as follows: an organic-rich clay layer (bed 1), dark phosphatic shale (beds 2 and 3), and marl (beds 4 and 5), which is extremely thin (~10 cm thick). Together, these beds average ~2.4 m in thickness in the studied sections (Figure A1b). It is covered by the earliest Eocene A. sibaiyaensis and P. wilcoxensis/M. velascoensis Zones (lower part of Esna Fm.). The DQM is present in all studied sections. Mean TFN, P/B ratio, species richness, Fisher’s α, and Shannon–Wiener H’ are approximately 350 individuals/g, 70%, 15, 5, and 2.1, respectively. The BF relative abundance over this period indicates an increase in epifaunal morphogroups (~68%).
It also shows decreased BFOI values (~48%) and a high C/A proportion (~83%). About 53% of the BF fauna of this period is made up of inner-shallow-outer-neritic (0–150 m depth) taxa of C biofacies, while about 41% is made up of varied BF of the deep outer neritic–upper bathyal (200–600 m depth) taxa of B biofacies. The rise in E. morphogroups with intermediate BFOI in this assemblage indicates mesotrophic and lower productivity conditions at the seabed. Thus, in all investigated sections, the DQM was deposited in a middle-deep outer shelf (depth of 50–200 m) (Figure 5, Figure 6, Figure 7 and Figure 8).
El-Mahmiya Member
It is represented in every study section and is composed of gray to green shale. It is assigned to the Early Eocene P. wilcoxensis/M. velascoensis upper part, M. subbotinae, and M. formosa Zones. Mean TFN, P/B ratio, species richness, Fisher’s α, and Shannon–Wiener H′ are approximately 520 individuals/g, 74%, 25, 8.5, and 3, respectively. The relative abundance of the BF during this period is characterized by moderate E. morphogroups (~64%), a high C/A ratio (~87%), and an increase in BFOI (~76%). The inner-shallow-outer-neritic (0–150 m depth) taxa of C biofacies (~29%) and the deep outer neritic–upper bathyal (200–600 m depth) taxa of B biofacies (~50.5%) comprise most of the BF fauna of this period. Additionally, moderate E. morphogroups with high BFOI, which indicate oligotrophic conditions, are representative of this assemblage. Accordingly, the El-Mahmiya Mb. was deposited in an outer shelf–upper bathyal environment situated between 200 and 600 m (Figure 5, Figure 6, Figure 7 and Figure 8).
Abu Had Member
The Abu Had Member comprises the upper part of the Esna Fm. and consists of shale with limestone intercalations. Biostratigraphically, it is covered by the Early Eocene Zones M. formosa and M. aragonensis/M. subbotinae. Mean TFN, P/B ratio, species richness, Fisher’s α, and Shannon–Wiener H′ are approximately 450 individuals/g, 78%, 22, 10, and 3, respectively. The rise in E. morphogroups (~65%), with a high percentage of C/A (~87%) and BFOI (~70%), is shown in the relative abundance of BF throughout this period.
The inner-shallow-outer-neritic (0–150 m depth) taxa of C biofacies account for around 45% of the BF fauna of this interval, whereas the deep outer neritic–upper bathyal (200–600 m depth) taxa of B biofacies have a high to moderately varied BF (~44%). The middle-deep outer neritic (50–200 m depth) taxa of A biofacies (~8%) are also accompanied by some less varied BFs. This assemblage is also characterized by an increase in E. morphogroups with high BFOI values, which suggests mesotrophic to slightly oligotrophic conditions. Abu Had Mb. may, therefore, be deposited in a middle-shallow outer shelf environment (depth of 50–150 m) (Figure 5, Figure 6, Figure 7 and Figure 8).

3.2.4. Thebes Formation

It is made mainly of yellow-white limestone with many flint bands and nodules, and it constitutes the uppermost exposed unit in the studied succession. Only the lowest portion is examined in this study. The Early Eocene Planktic Zones of A. pentacamerata, A. cuneicamerata, and M. aragonensis/M. subbotinae (upper portion) cover it. Mean TFN, P/B ratio, species richness, Fisher’s α, and Shannon–Wiener H′ are approximately 484 individuals/g, 75%, 21, 7, and 2.6, respectively. High percentages of relative abundance of E. BF, C/A, and BFOI (~65%, ~88.5%, and ~70%, respectively) are another characteristic of this period. Inner-shallow-outer-neritic (0–150 m depth) taxa of C biofacies (~60.5%) make up most of the BF fauna of this interval, although a highly varied BF of deep outer neritic–upper bathyal (200–600 m depth) taxa of B biofacies (~31.5%) is also present. Additionally, the intermediate E. morphogroups in this assemblage show higher BFOI, suggesting mesotrophic to slightly oligotrophic conditions with reduced productivity. As a result, the lower part of the Thebes Formation was deposited in a middle- to outer-shelf environment (50–200 m depth) (Figure 5, Figure 6, Figure 7 and Figure 8).
The BF assemblages documented throughout the Esh El-Mellaha succession reflect complex interactions among food availability, bottom-water oxygenation, sea-level fluctuations, and regional tectonic controls. These relationships can be better understood using the Trophic-Oxygen (TROX) model, which links the vertical distribution and composition of BF communities to variations in organic matter flux and oxygen availability at the sediment–water interface [27,28]. According to this model, epifaunal taxa are generally favored under well-oxygenated and food-limited conditions, whereas infaunal taxa become dominant where high organic matter flux enhances food availability but simultaneously reduces oxygen concentrations through microbial degradation. Across the K/Pg boundary, the observed increase in epifaunal taxa, including Cibicidoides and Gavelinella, together with relatively higher BFOI values and reduced abundance of infaunal opportunists, suggests relatively improved bottom-water oxygenation and diminished organic carbon delivery to the seafloor. This pattern is consistent with reduced or reorganized export productivity following the end-Cretaceous impact event [22,69,70]. The dramatic reduction in primary productivity decreased the export flux of organic matter from surface waters, resulting in oligotrophic seafloor conditions and favoring epifaunal communities adapted to low food availability. This indicates that the benthic ecosystem response at Esh El-Mellaha formed part of a broader Tethyan paleoceanographic reorganization during the earliest Paleocene.
In contrast, the PETM interval recorded within the DQM is characterized by a marked increase in dysoxic infaunal taxa, accompanied by declining BFOI values and significant restructuring of benthic biofacies. Within the TROX framework, these ecological conditions indicate increased organic matter flux to the seafloor and reduced bottom-water oxygenation (Figure 5, Figure 6, Figure 7 and Figure 8). Consequently, opportunistic infaunal taxa such as Praebulimina, Bulimina, and other low-oxygen-tolerant forms became more abundant, whereas oxygen-demanding epifaunal taxa declined. The succession at Esh El-Mellaha therefore records two fundamentally different trophic responses to global environmental crises. The K/Pg interval reflects a local reduction or reorganization of organic-matter delivery to the seafloor, promoting oligotrophic and relatively oxygenated conditions dominated by epifaunal communities. Conversely, the PETM shows nutrient enrichment, enhanced organic carbon burial, and oxygen depletion, which favored opportunistic infaunal assemblages, similar to patterns documented at the Dababiya GSSP within the Esna Fm. [25,33]. The close correspondence between these biofacies changes and globally recognized trophic disturbances demonstrates that the BF communities of Esh El-Mellaha record major reorganizations of the marine carbon cycle. At the same time, local tectonic controls associated with the SATE influenced sediment accumulation and preservation, modulating the expression of these global signals within the marginal basin setting.

3.3. Sequence Stratigraphy and Sea-Level Changes

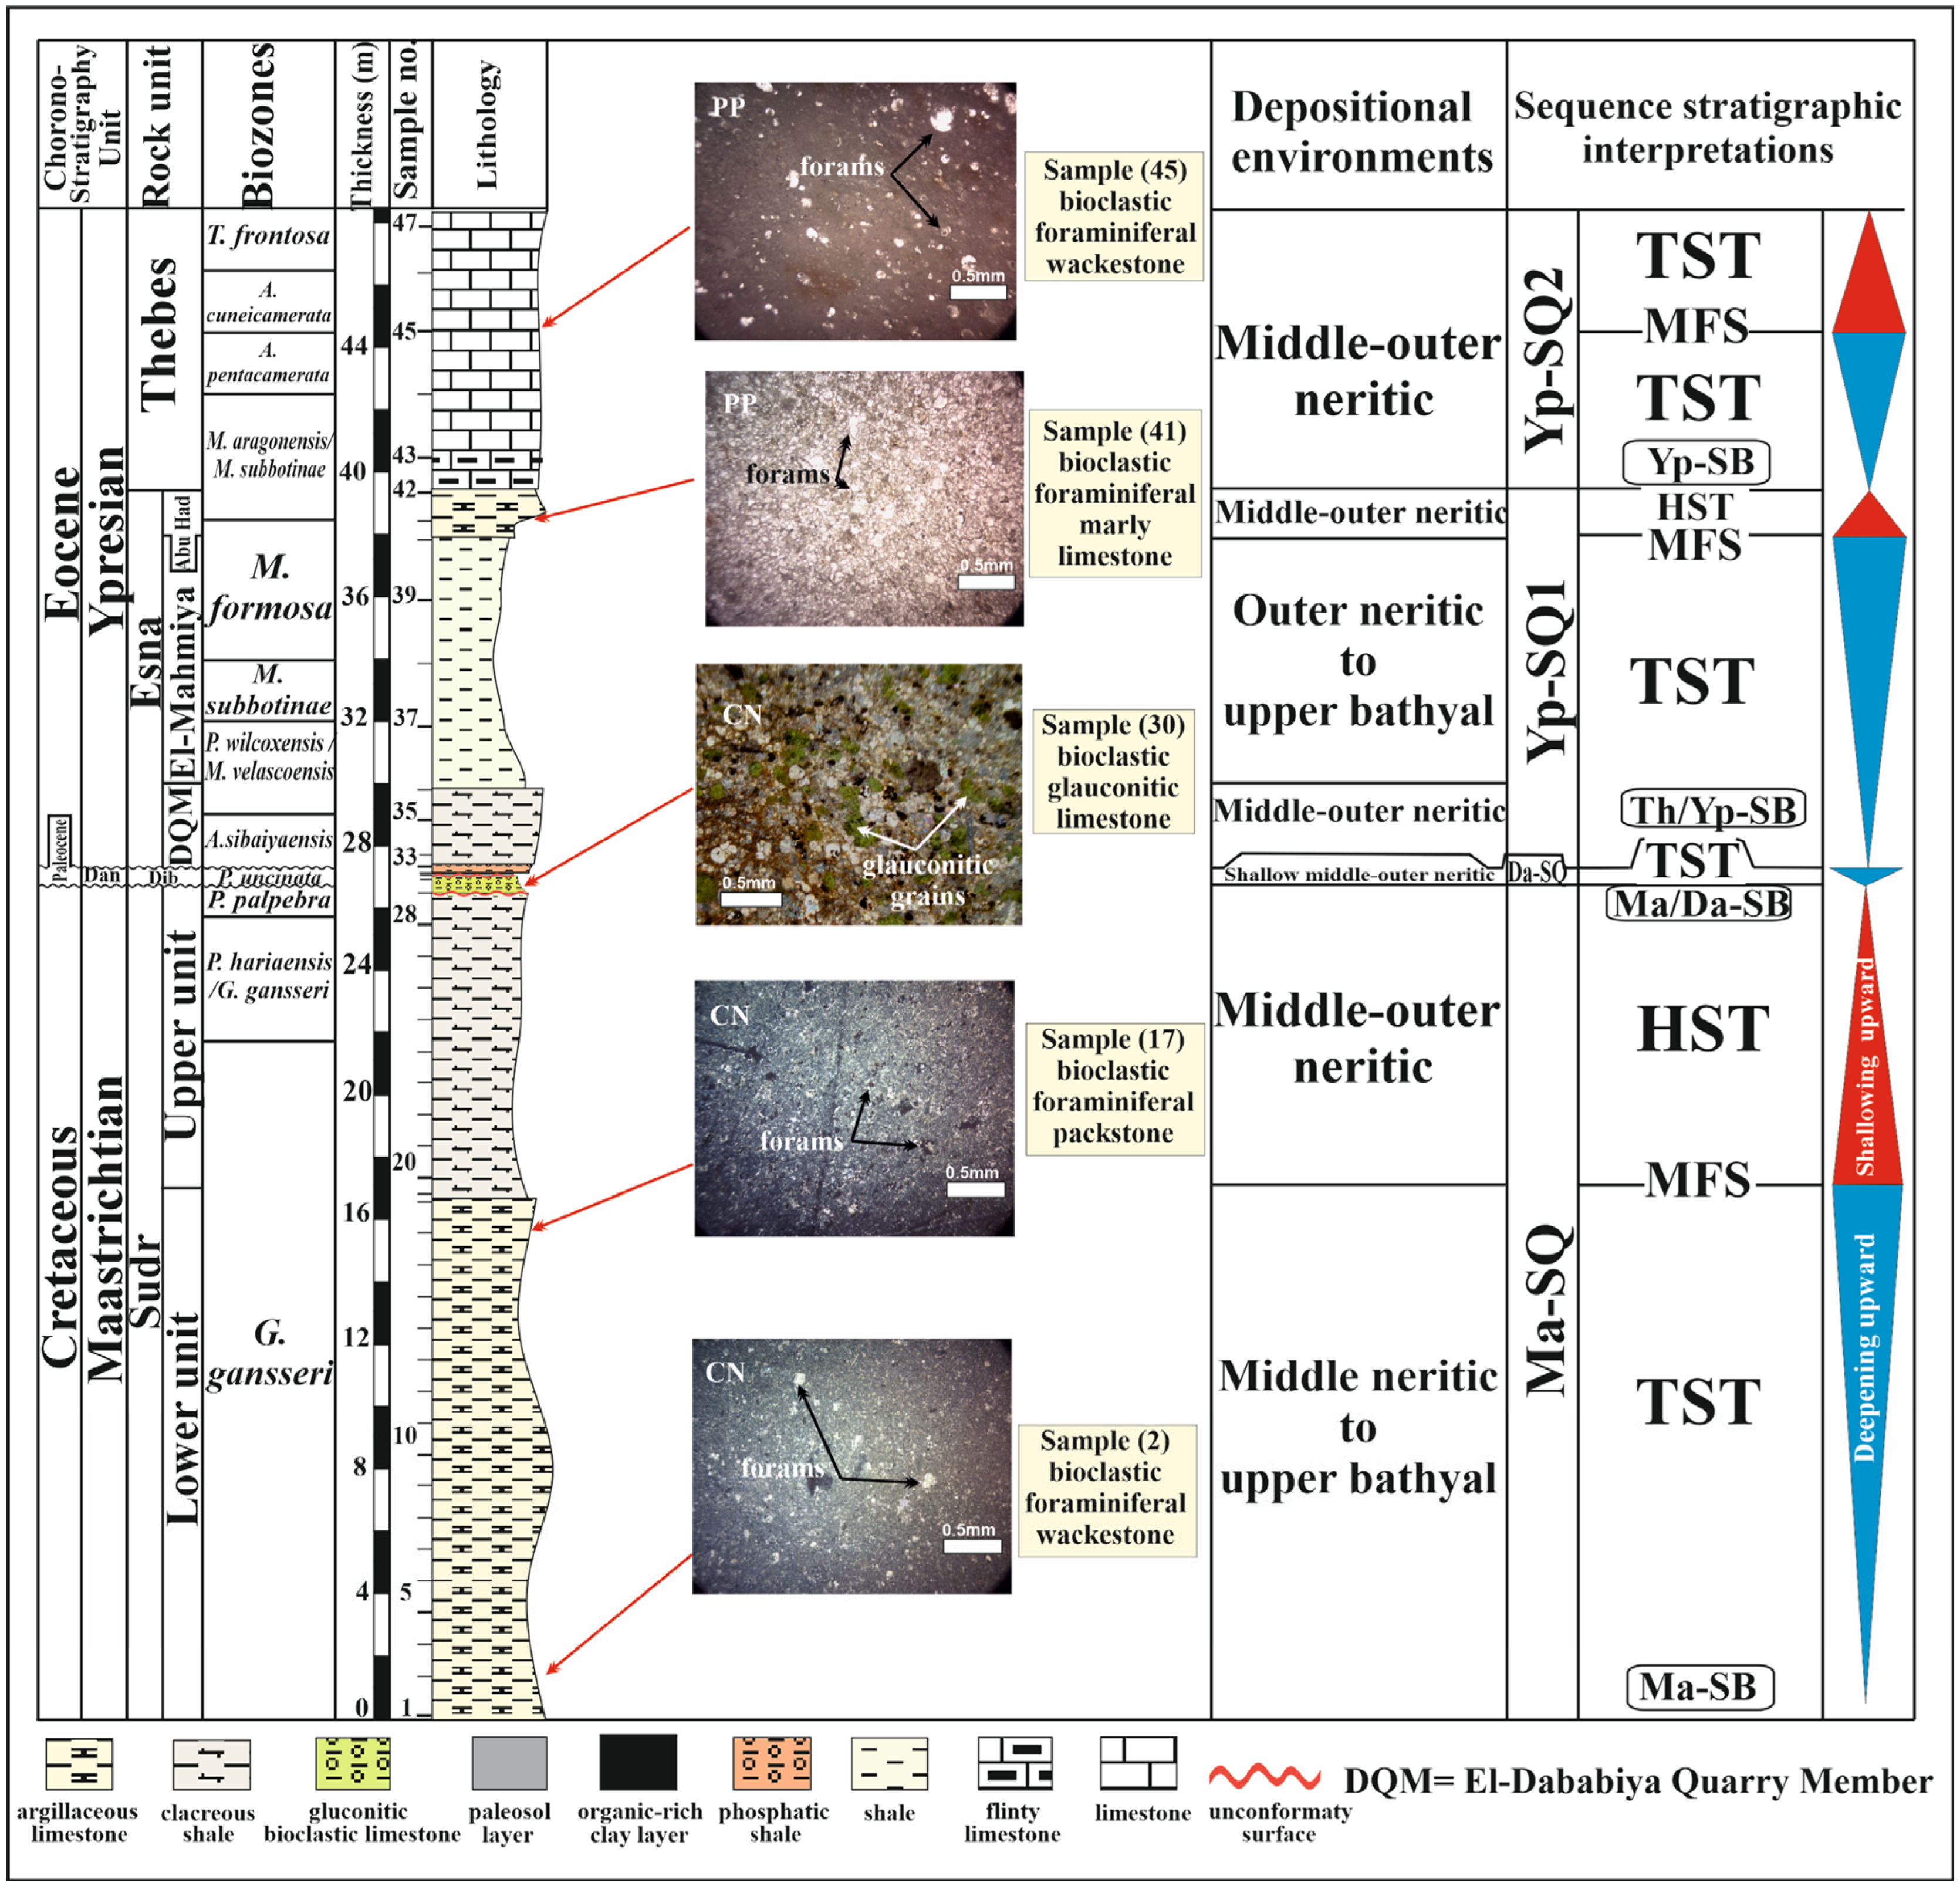
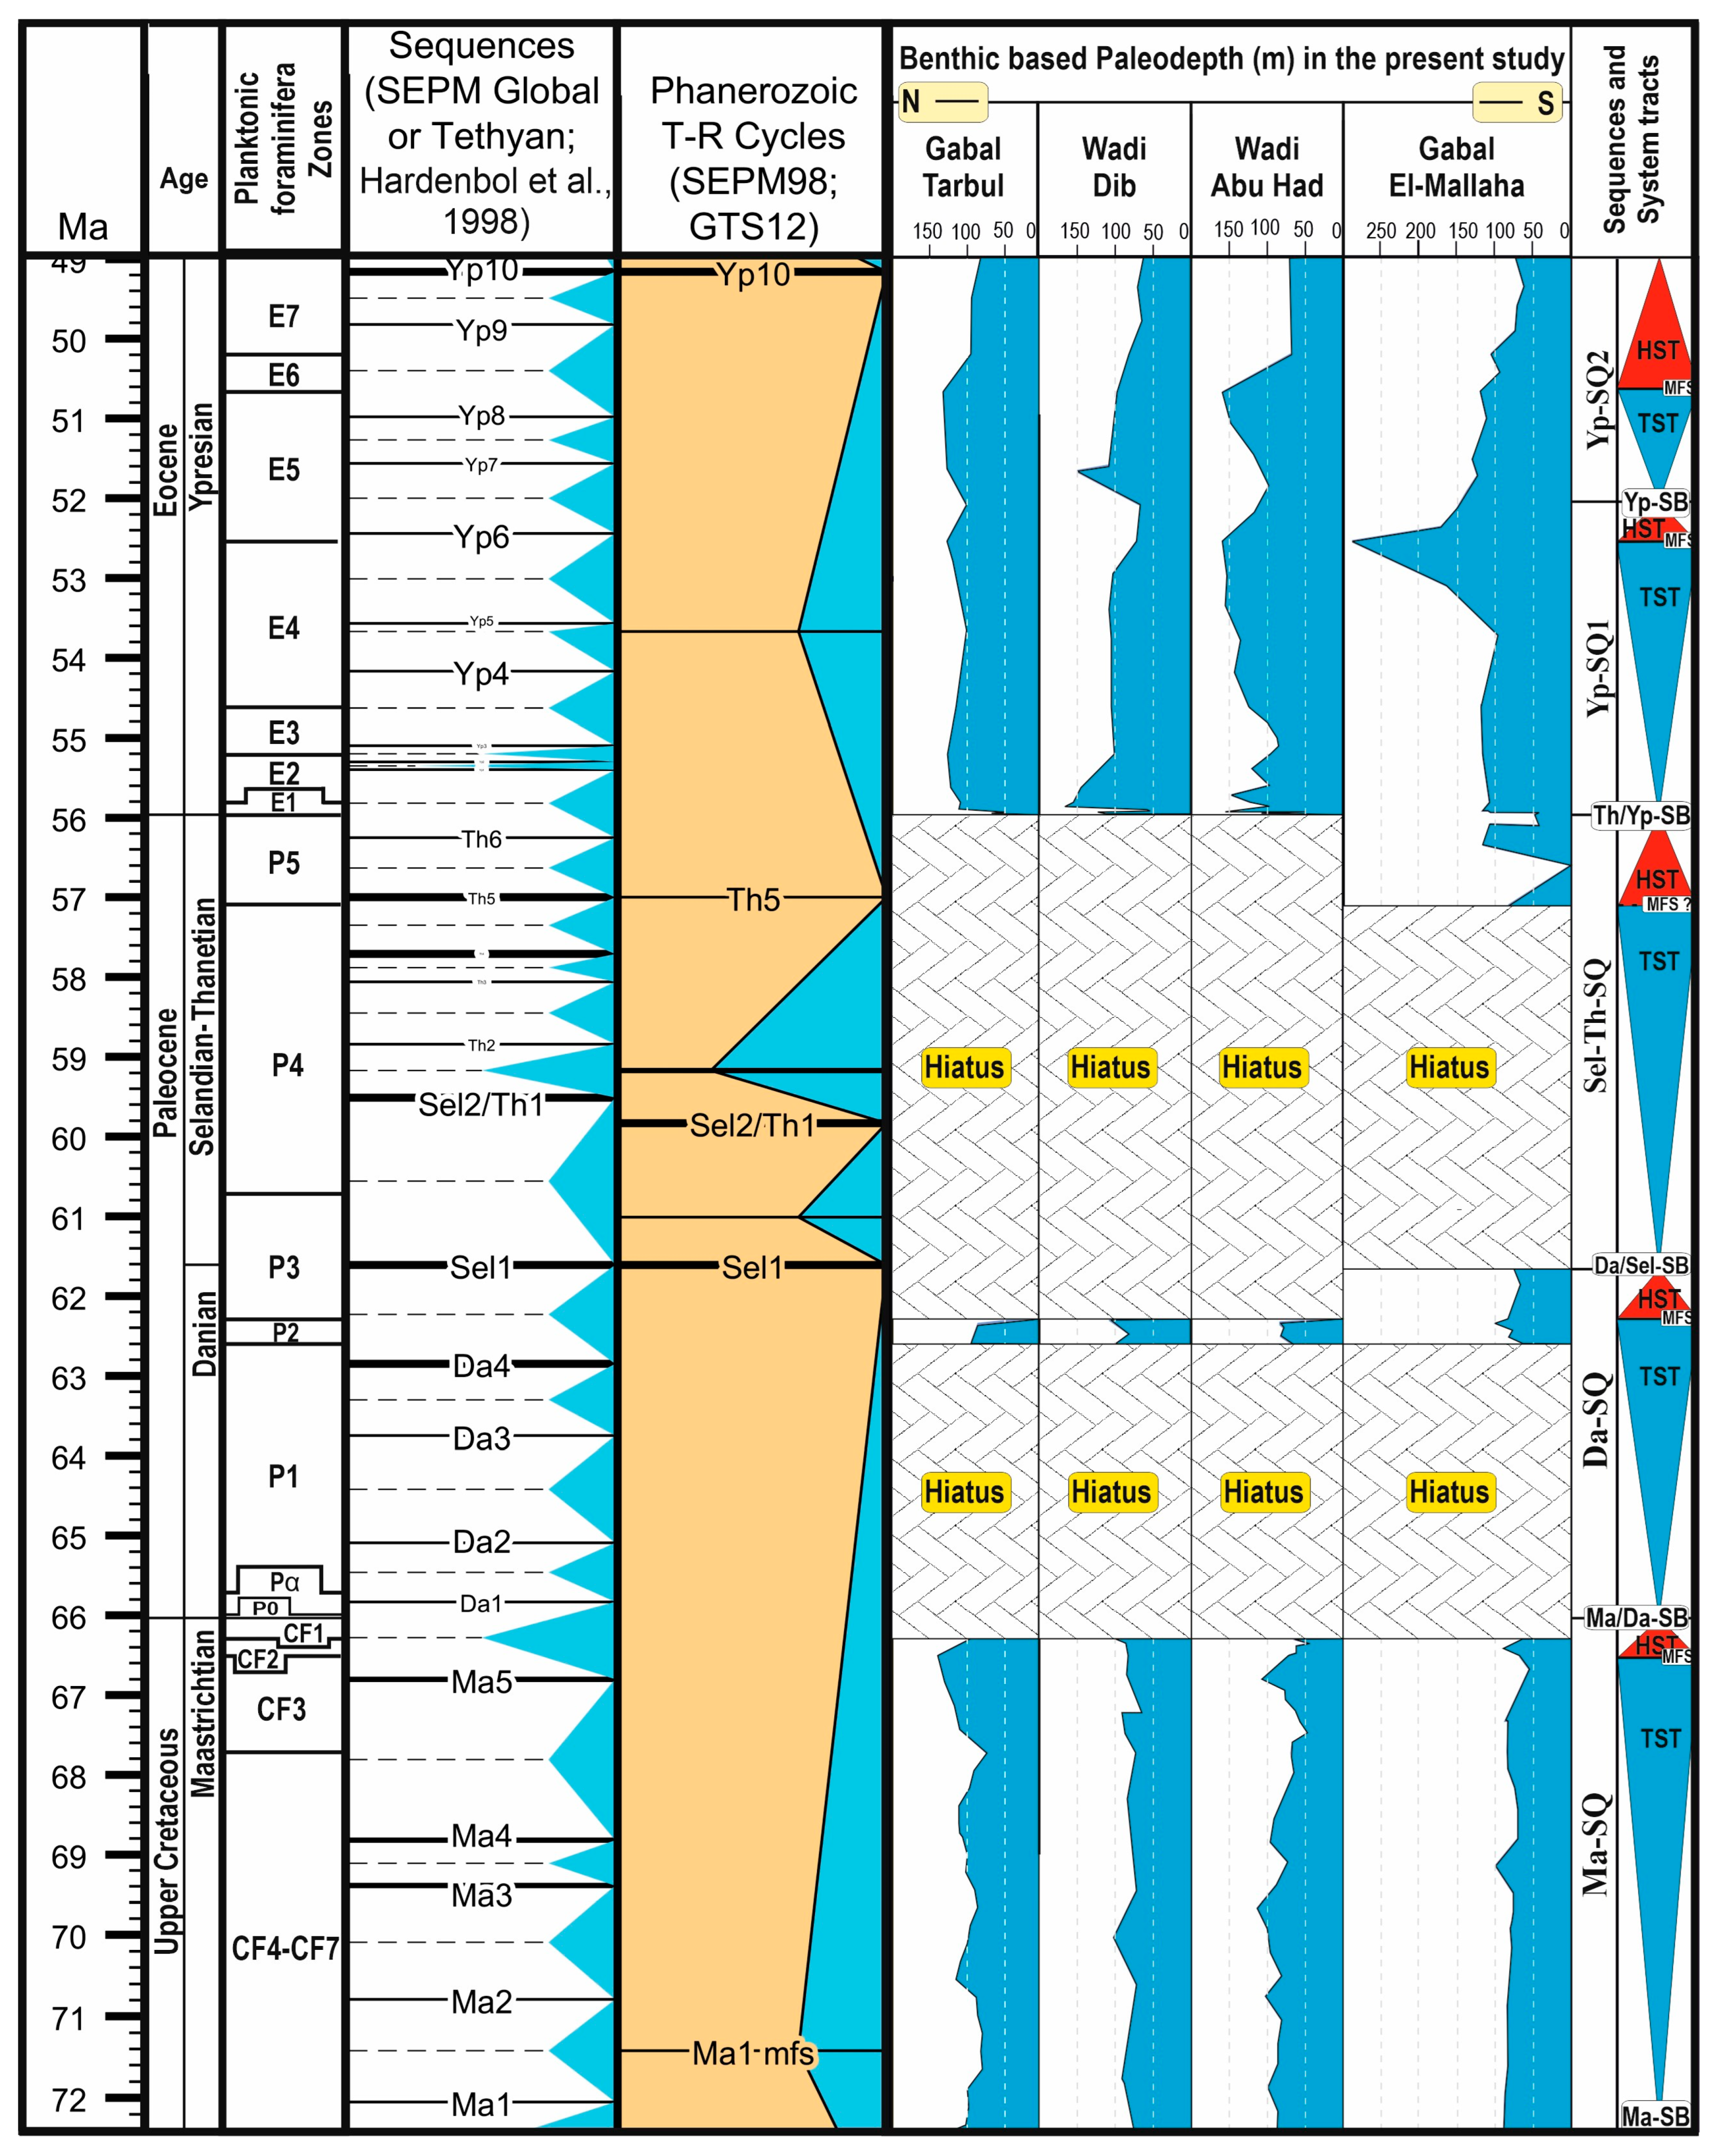
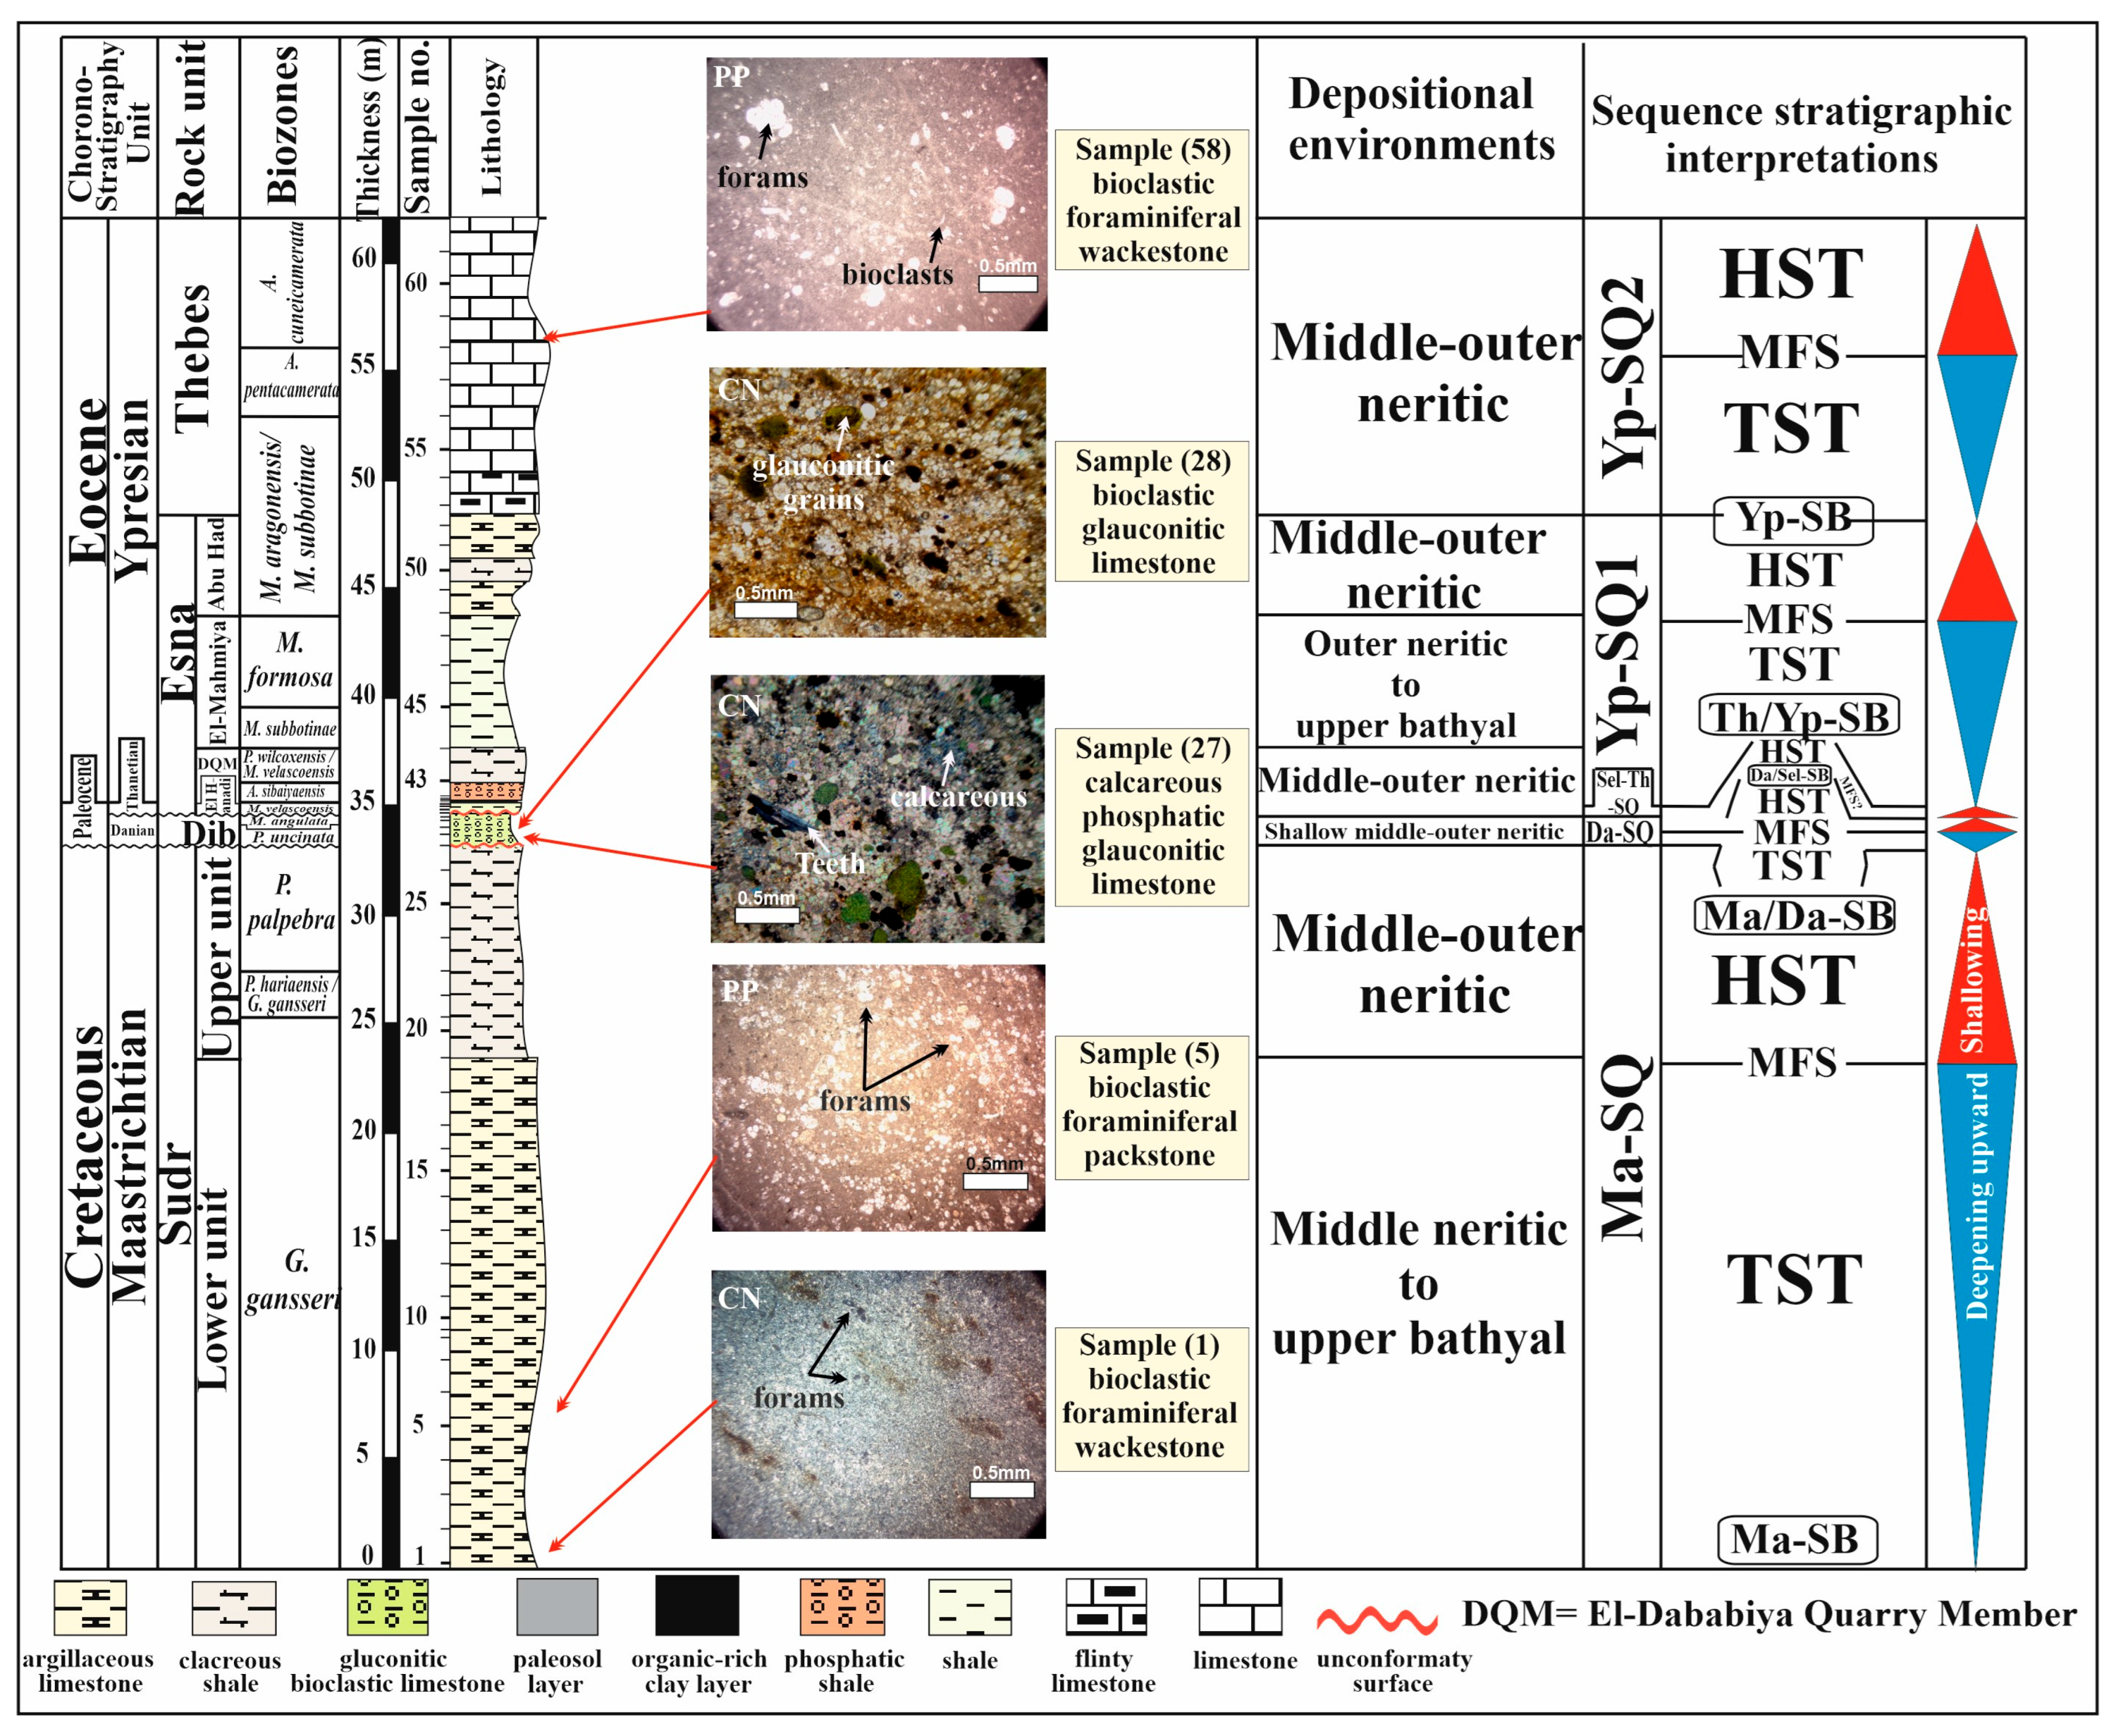
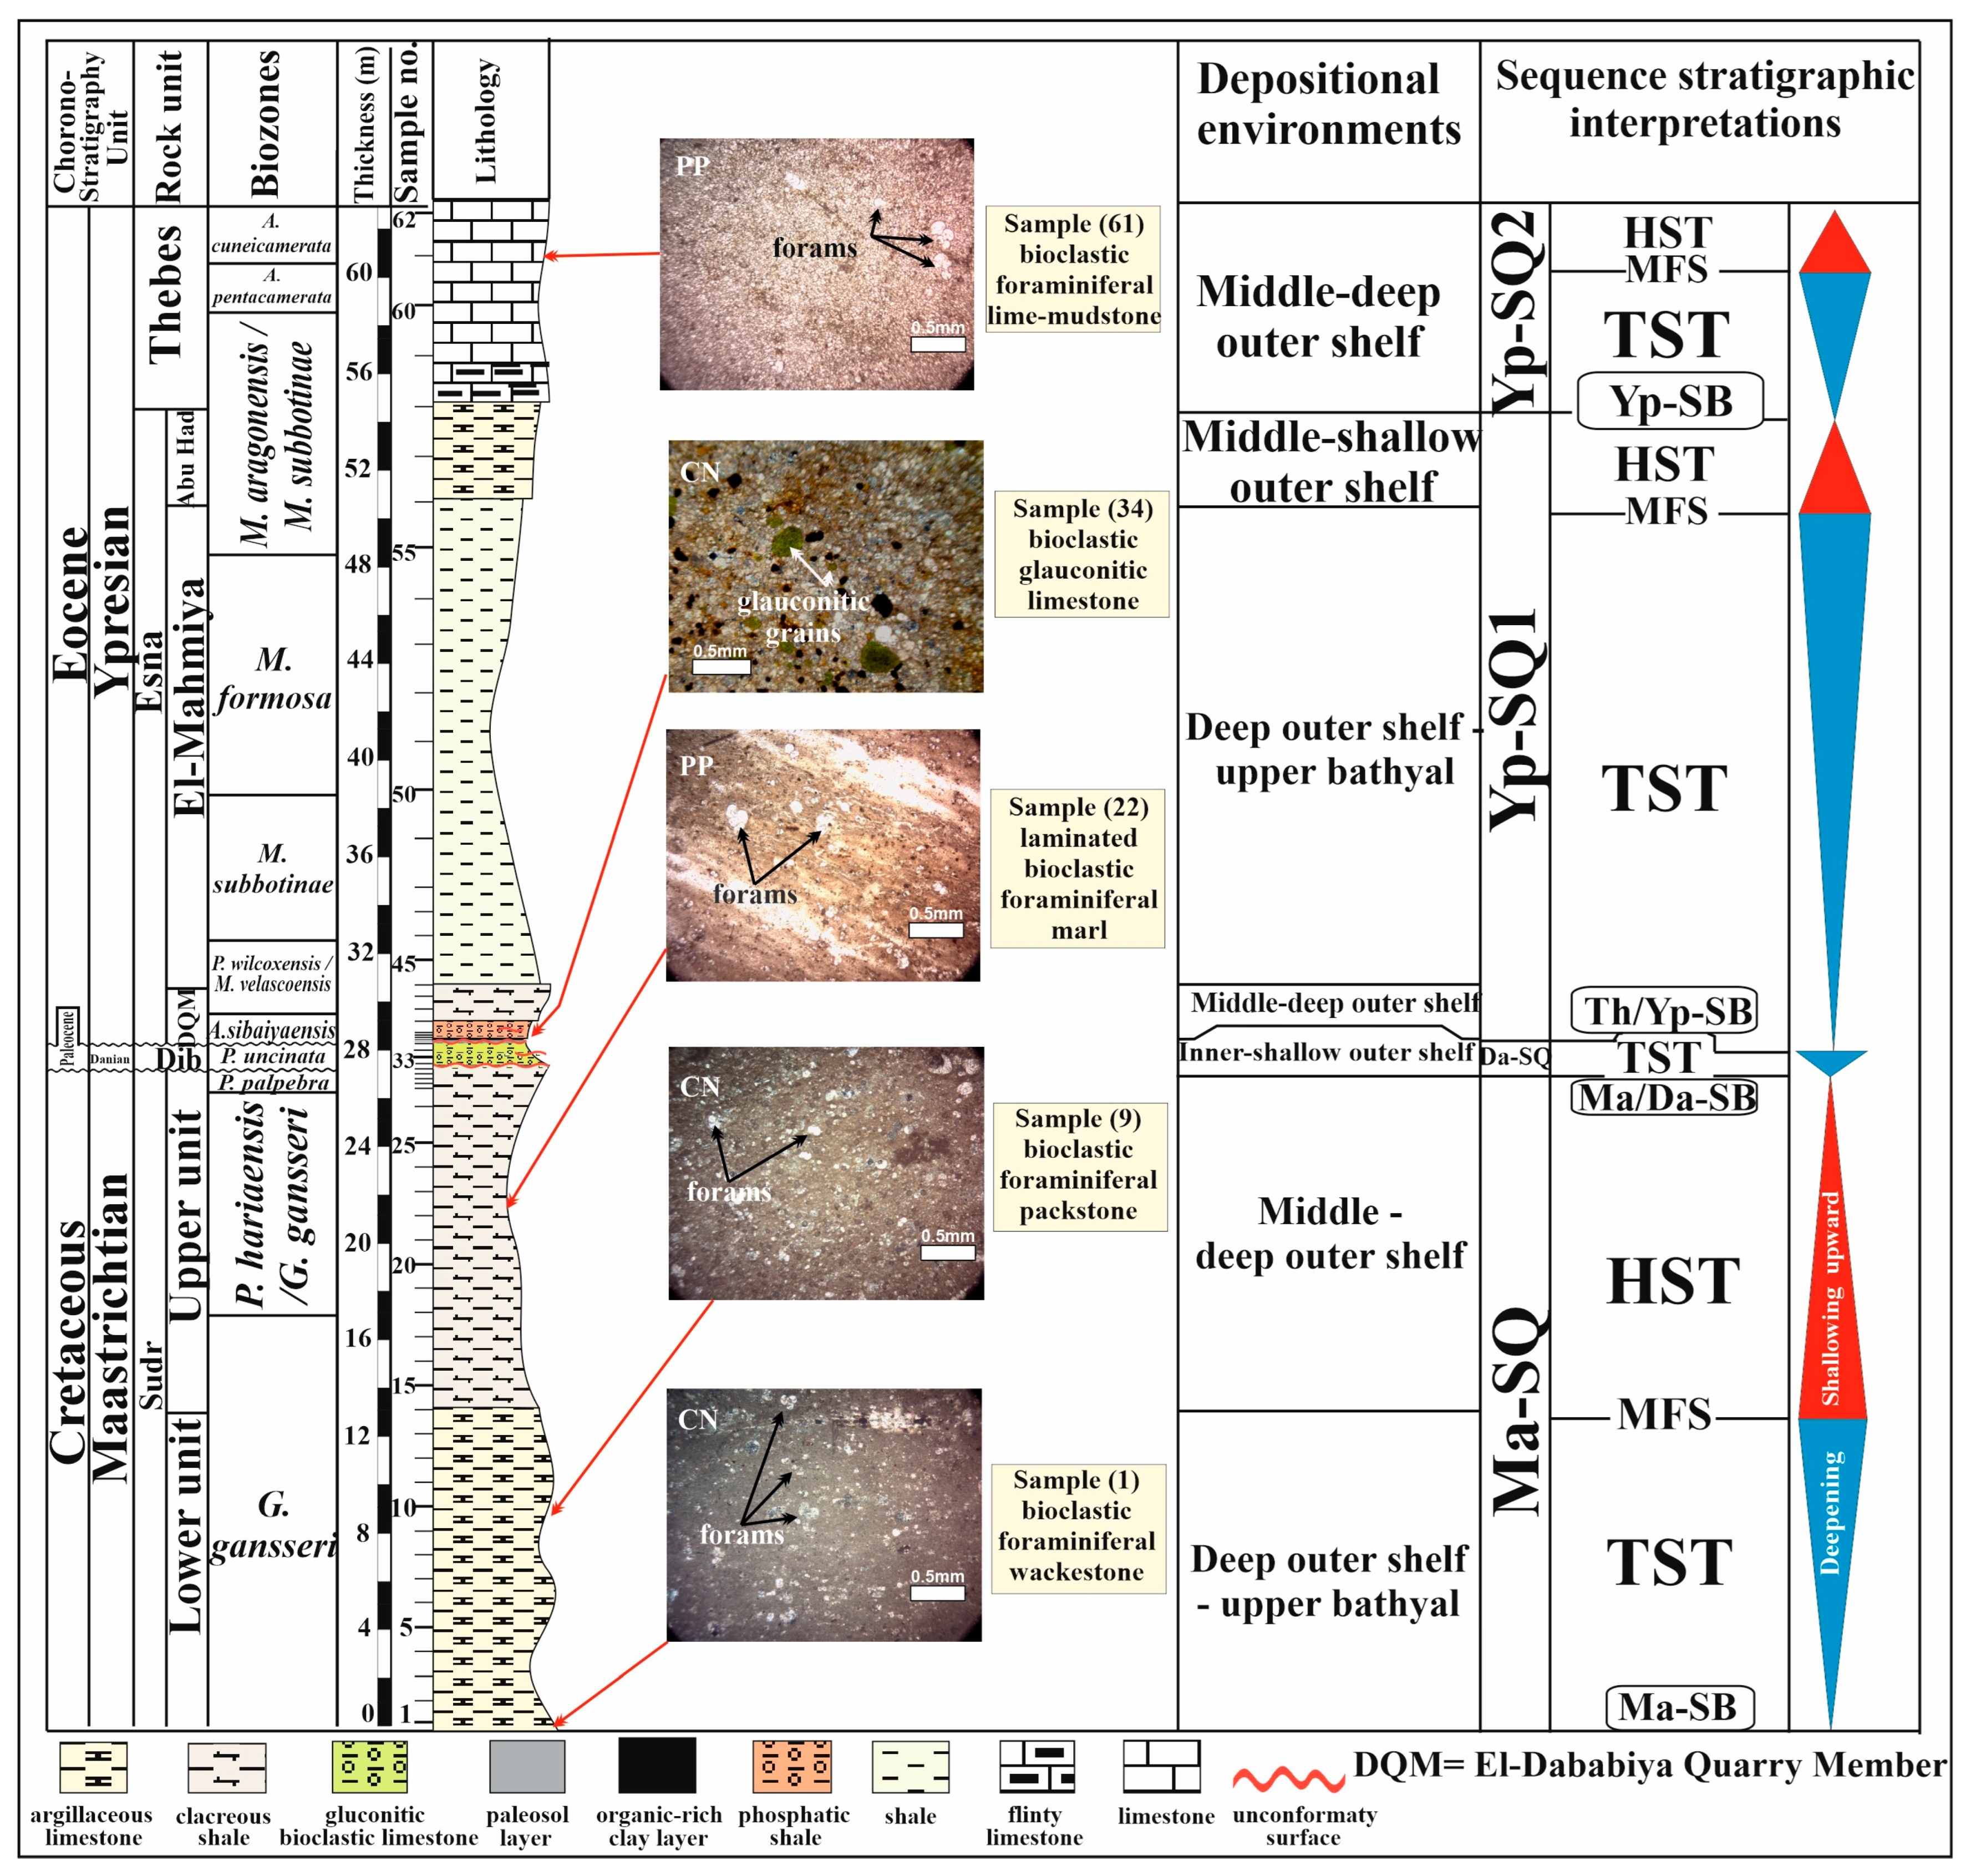
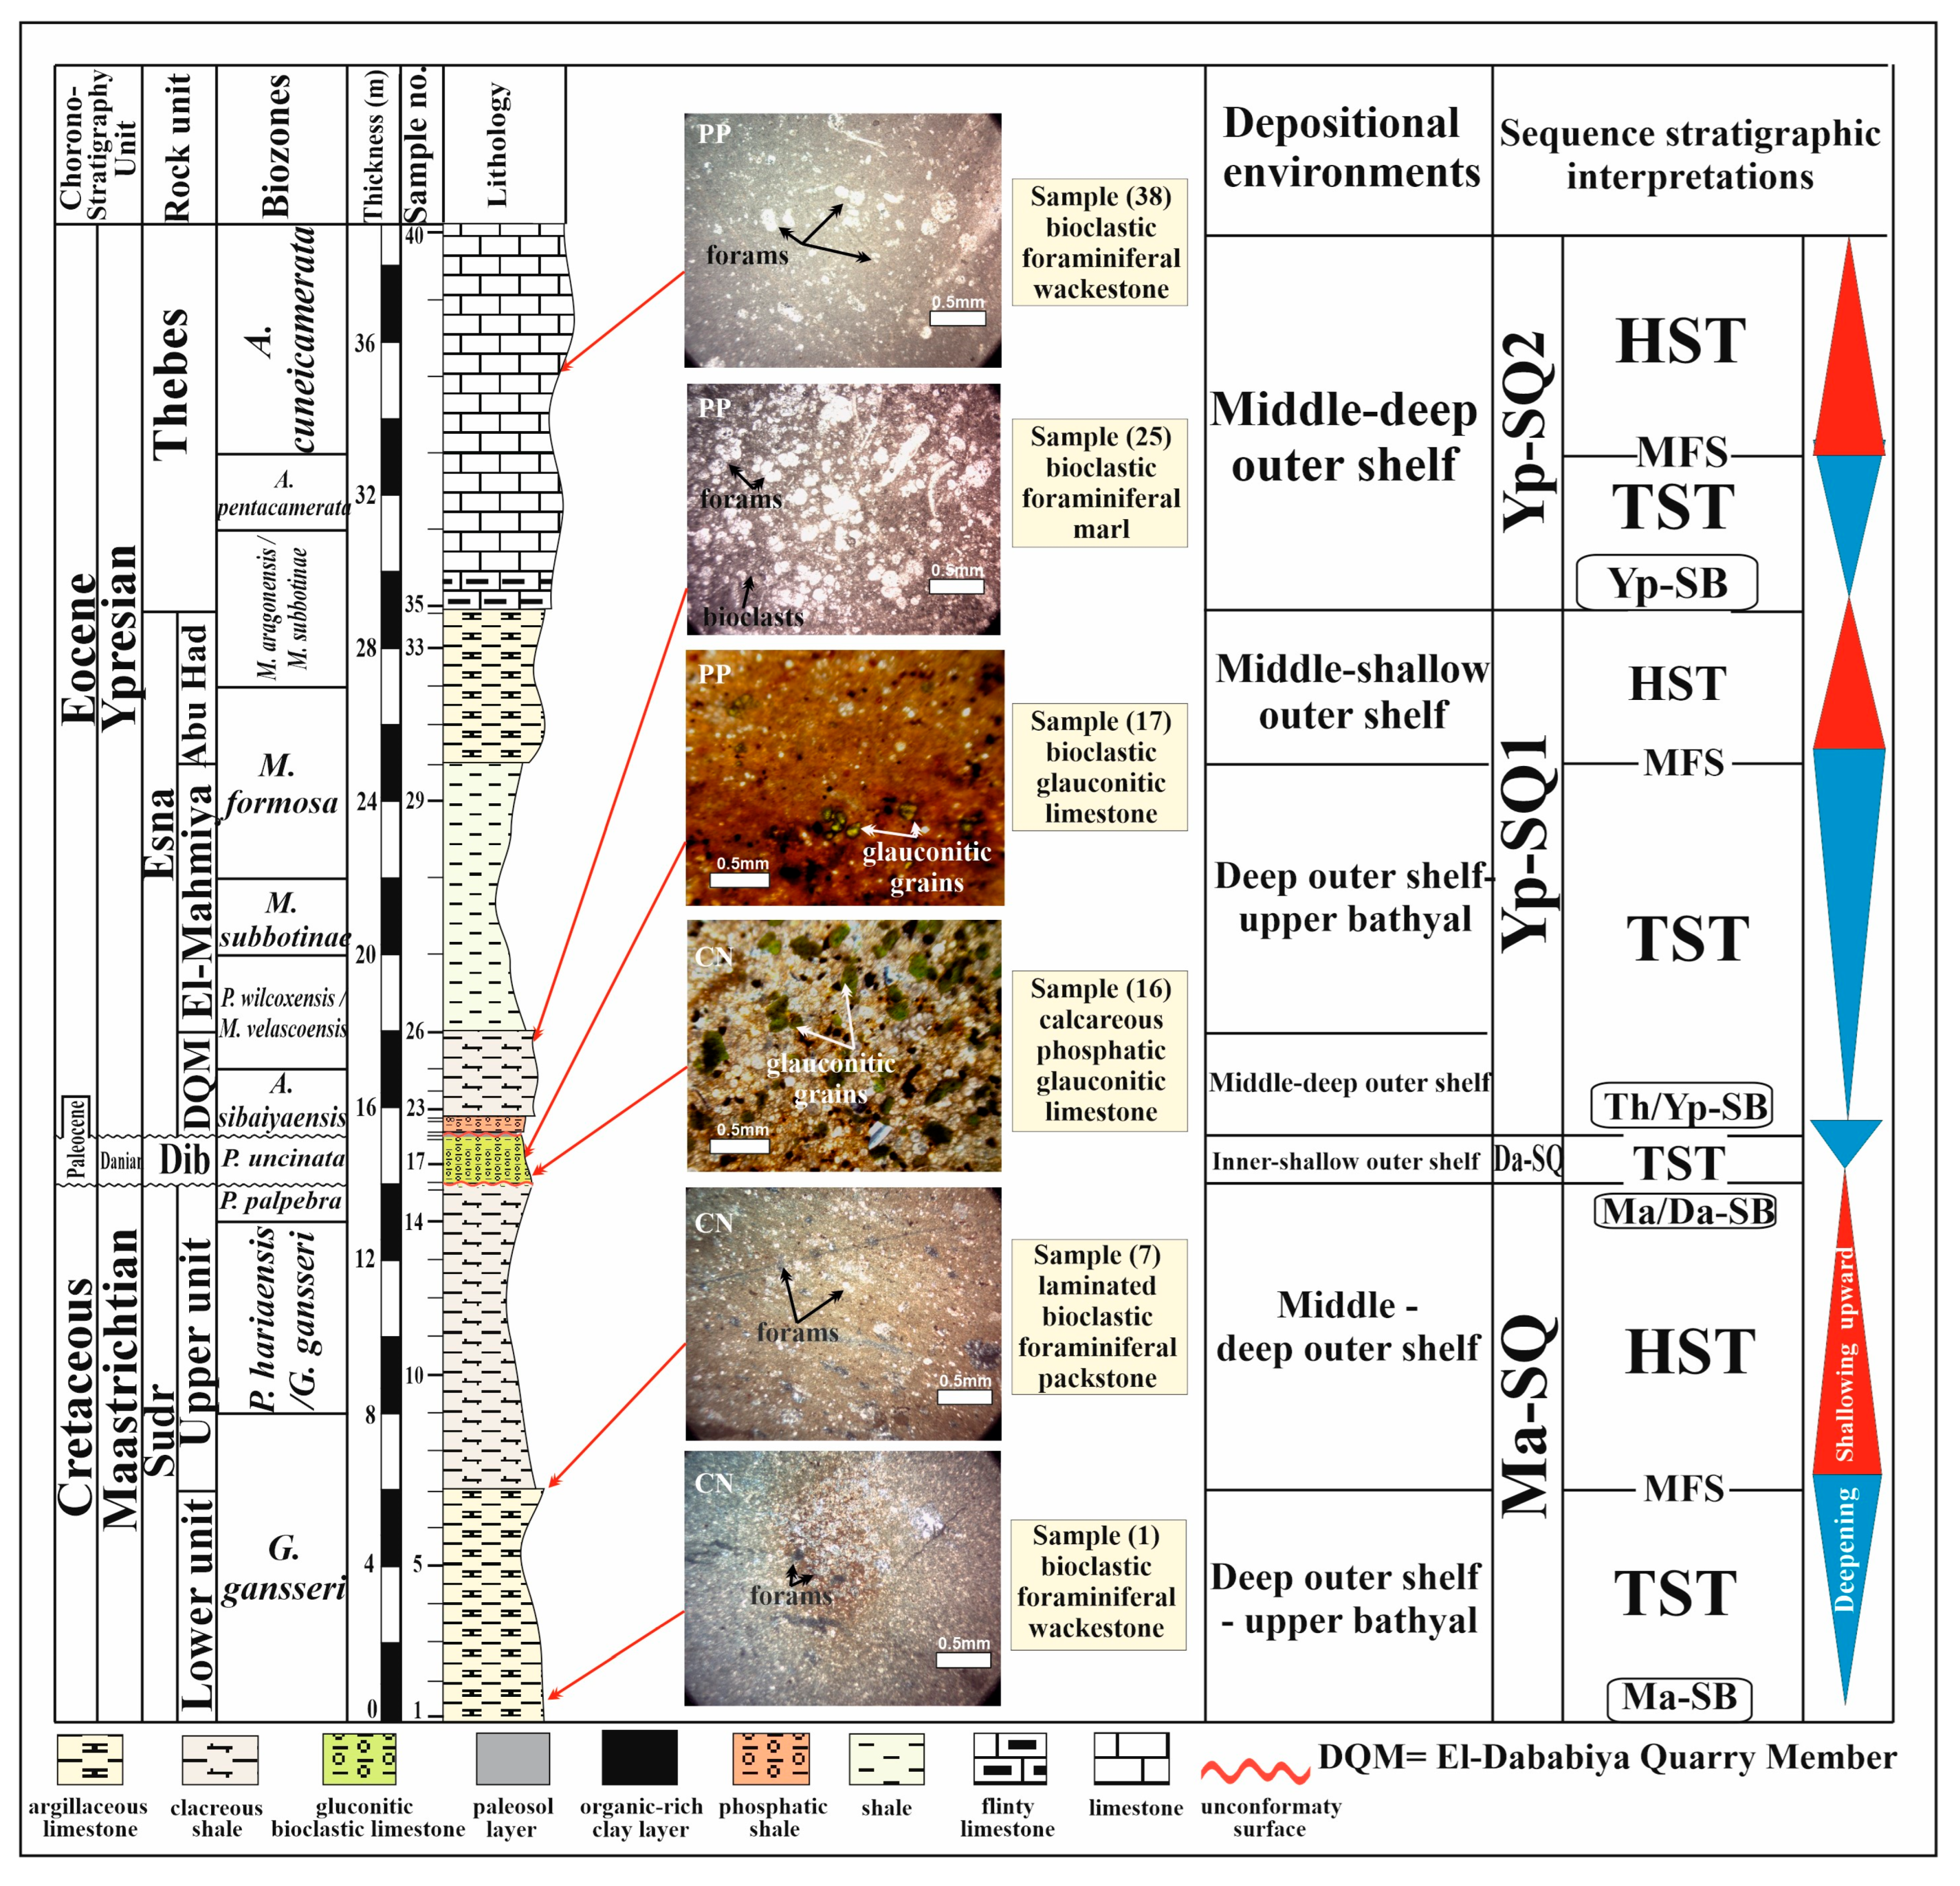
Five depositional sequences (Ma-SQ, Da-SQ, Sel-Th-SQ, Yp-SQ1, and Yp-SQ2) and their associated systems tracts were defined by sequence-stratigraphic analysis integrating field observations, lithofacies, and high-resolution benthic and planktic foraminiferal data. These depositional sequences were separated by five sequence boundaries (Ma-SB, Ma/Da-SB, Da/Sel-SB, Th/Yp-SB, and Yp-SB) across the UK/LPg successions at Esh El-Mellaha area. The late Maastrichtian Sudr Fm. forms part of the first depositional sequence (Ma-SQ). The Dib (Fm.) of the Danian age is made up entirely of the transgressive systems tract (TST) and is associated with the second depositional sequence (Da-SQ). The conformable contact boundary (Th/Yp-SB) at the P/E boundary, in the GM section, defines the top of the third depositional sequence (Sel-Th-SQ), which includes El-Hanadi Mb. of the latest Paleocene age. This sequence, which reflects a shallowing-upward cycle and a relative sea-level decline, is representative of the highstand systems tract (HST). The fourth depositional sequence (Yp-SQ1) covers the top three members of the Esna Fm. The lowest part of the Thebes Fm. is part of the fifth depositional sequence (Yp-SQ2) throughout the whole region, which includes the conformable contact boundary (Yp-SB) between Abu Had Mb. (top of the Esna Fm.) and the Thebes Fm. (Figure 9, Figure 10, Figure 11 and Figure 12).

3.3.1. Ma-SQ

The Sudr Formation, which varies in thickness from ~14 m at WD to ~33 m at GM, forms part of Ma-SQ and represents the oldest depositional sequence in the study area (Figure 9, Figure 10, Figure 11 and Figure 12). This series is covered by the late Maastrichtian Zones (G. gansseri, P. hariaensis/G. gansseri, and P. palpebra). The base of this depositional sequence (base of the studied sections) coincides with the global Ma1-sequence boundary of Haq et al. [71]. It is terminated by the sequence boundary Ma/Da-SB, which coincides with the erosional surface of the Sudr/Dib formational boundary. A stratigraphic gap of the latest Maastrichtian–early Danian age is indicated by Ma/Da-SB in the study sections (Figure 9, Figure 10, Figure 11, Figure 12 and Figure 13). Several authors have identified this boundary regionally in Egypt in the Eastern Desert and along the Red Sea coast [3,72,73,74,75,76]. Additionally, it can be linked to a worldwide short-term sea-level decline of the latest Maastrichtian of Haq et al. [71].

3.3.2. Da-SQ

Da-SQ encompasses the Dib Fm. of the Danian age. The top of this series is delineated by the existence of an erosional surface (paleosol) between the Dib and Esna Fms., which is named Da/Sel-SB (Figure A1d and Figure 13). This boundary (Da/Sel-SB) is comparable to both the Sel 1-SB suggested by Hardenbol et al. [77] outside of Egypt and the SB2 provided by Faris et al. [75] in Egypt. The Dib Fm. reaches its maximum thickness in the GM section. Within Da-SQ, the TST is bounded by two erosional surfaces (Ma/Da-SB and Da/Sel-SB). In the TST, glauconitic bioclastic limestone dominates the interval and was deposited in a relatively shallow inner- to shallow-outer-shelf setting (0–150 m; Figure 9, Figure 10, Figure 11 and Figure 12).

3.3.3. Sel-Th-SQ

It is covered by the latest Paleocene M. velascoensis Zone. It includes the lowest portion of Esna Fm. (El-Hanadi Mb.), which is only visible in the GM section and is about 0.5 m thick. The top of this sequence at the P/E boundary is defined by a conformable contact boundary Th/Yp-SB in the GM section (Figure A1b,d and Figure 13). A comparable relationship has been reported from the GSSP Dababiya Quarry section [33]. At the remaining sections (WH, WD, and GT), the Th/Yp-SB is represented by a major unconformity surface covering the gap from the Danian to the Ypresian. It is related to an unconformable contact provided by Abdelhady et al. [76] at Naqb Assiut, Kharga Oasis, Western Desert, due to the absence of beds nos. 1 and 2 of the lowermost portions of the DQM, which indicates a brief hiatus at the P/E boundary. The Sel-Th-SQ was deposited in a middle-shallow outer shelf (50–150 m) environment (Figure 9, Figure 10, Figure 11, Figure 12 and Figure 13). This interval is assigned to the HST and reflects a relative sea-level fall and a shallowing-upward cycle. El-Hanadi Mb. was interpreted as a HST in the Dababiya Quarry section and at Naqb Assiut, Kharga Oasis, Western Desert, by Abdelhady et al. [76].

3.3.4. Yp-SQ1

The majority of the Esna Fm. is occupied by the fourth depositional series, which is widely dispersed over the area. This sequence comprises, from base to top, the DQM, El-Mahmiya Member, and Abu Had Member. It reaches its maximum thickness at WH (~26.3 m) and its minimum thickness at GT (~12.4 m). It is Early Eocene in age. The highest point of Yp-SQ1 is defined by a conformable Yp-SB at the contact between Abu Had Mb. (top of Esna Fm.) and the Thebes Fm. The Yp-SB is interpreted as a correlative conformity in the studied sections, although it corresponds regionally to an unconformity reported at Wadi El-Dakhl [44]. The Early Eocene M. aragonensis/M. subbotinae (E5) Zone coincides with this boundary, which matches the sequence boundary (Yp-SB) reported by Abdelhady et al. [76] from Naqb Assiut, Kharga Oasis, Western Desert. El-Ayyat and Obaidalla [44] reported that it is also linked to the unconformity surface at Wadi El-Dakhl in the northern Eastern Desert.
The middle-deep outer shelf (50–200 m depth) is where the five distinct beds of DQM that comprise this sequence were deposited. The DQM passes upward into the El-Mahmiya Member, which was deposited in a deep-outer-shelf to upper bathyal environment (200–600 m depth). These strata are characterized by numerous, highly diversified and well-preserved planktic foraminifera (PF) and sparse BF. They belong to the TST, which exhibits a fast relative rise in sea level and a deepening-upward cycle. The maximum paleodepth value associated with the higher P/B ratio is found at the top of the El-Mahmiya Mb., at the MFS above the TST (Figure 13). Abu Had Mb. was developed in the middle-shallow outer shelf environment (50–150 m depth) (Figure 9, Figure 10, Figure 11 and Figure 12) and is covered by a progradational parasequence of marly limestone. This set has been designated as the HST. It signals the start of the early Eocene sea level fall.

3.3.5. Yp-SQ2

Yp-SQ2 includes the basal Thebes Formation. Its thickness is 13.5 m in GM, 8 m at WH, 10 m at WD, and 9 m at GT, and it is mostly composed of limestone with nodules and flint bands. It is an example of the bioclastic foraminiferal lime mudstone to wackestone microfacies deposited in a middle- to deep-outer-shelf setting (50–200 m) during the Early Eocene (Figure 9, Figure 10, Figure 11 and Figure 12). The stacking pattern indicates a TST formed during gradual relative sea-level rise. The gradual relative sea-level fall recorded at the top of the studied sections is assigned to the HST of Yp-SQ2.

3.4. Integrated Paleoenvironmental and Sequence-Stratigraphic Significance

The Esh El-Mellaha succession clearly illustrates that perturbations associated with global events such as the K/Pg and PETM were not simply preserved passively along the southern Tethyan margin, but were modified by local accommodation, erosion, condensation, and shelf-basin physiography. For instance, the K/Pg interval is represented primarily as an erosional boundary with no preservation of the latest Maastrichtian–earliest Danian Zones, whereas the PETM interval is preserved within the El-Dababiya Quarry Member as a more complete ecological and sedimentological event. Preservation potential of global signals thus varied significantly through time, controlled by local interplays among eustasy, Syrian Arc-related tectonic instability, sediment supply, and water-depth change [33,34,71,77,78,79]. Moreover, the studied benthic foraminiferal record illustrates that K/Pg and PETM disturbances caused fundamentally different ecological effects on seafloor communities. Increased epifaunal taxa, relatively high BFOI values, and lower opportunistic infaunal components around the K/Pg interval suggest comparatively oxygenated seafloor conditions and diminished or reorganized organic-matter supply. In contrast, benthic impoverishment, lower BFOI values, and enrichment of low-oxygen-tolerant infaunal taxa during the PETM interval reflect higher organic-matter flux and dysoxic bottom-water conditions. Thus, our succession records two different modes of benthic ecosystem reorganization: post-impact bottom-water food chain disruption around the K/Pg boundary and warming-induced eutrophication–dysoxia during the PETM [25,26,80,81].
Collectively, the studied sections in Esh El-Mellaha illustrate that southern Tethyan marginal successions can contain globally identifiable K/Pg and PETM environmental signals, but only after alteration by local accommodation, condensation processes, erosion, and Syrian Arc-related tectonic instability. This makes the succession particularly interesting, not because it is complete, but because it highlights how global crises are modified as they pass through a tectonically active shelf-margin.

4. Conclusions

This study provides an integrated lithostratigraphic, benthic foraminiferal, paleoenvironmental, and sequence-stratigraphic assessment of the Upper Cretaceous–Lower Paleogene succession exposed in four sections at Esh El-Mellaha, northern Eastern Desert, Egypt. The investigated succession comprises, from base to top, the Sudr, Dib, Esna, and Thebes Formations. Two regionally significant discontinuities are recognized: an erosional surface at the Sudr/Dib formational boundary, associated with an incomplete K/Pg transition and a latest Maastrichtian–early Danian hiatus, and an erosional to non-depositional surface at the Dib/Esna boundary, related to removal or non-deposition of much of the Selandian–Thanetian interval. These surfaces indicate that the stratigraphic architecture of the Esh El-Mellaha area was controlled by the combined effects of eustatic sea-level change and syn-sedimentary tectonic activity linked to the Syrian Arc Tectonic Event.
Benthic foraminiferal assemblages, supported by faunal indices and quantitative paleodepth estimates, reveal deposition mainly in middle-neritic to upper bathyal settings, interrupted by shorter episodes of relative shallowing. Four benthic foraminiferal biofacies were identified. Biofacies A characterizes mainly middle- to outer-neritic settings and is common in the upper Sudr Formation and the El-Dababiya Quarry Member. Biofacies B records deeper outer-neritic to upper bathyal conditions and is prominent in the lower Sudr Formation and the El-Mahmiya Member. Biofacies C reflects inner- to shallow-outer-neritic conditions and is especially associated with the condensed, glauconitic, bioclastic Dib Formation. Biofacies D, indicating shallow-outer-neritic to upper bathyal conditions, is rare and subordinate throughout the studied sections.
The paleoenvironmental record shows two contrasting benthic ecosystem responses across the studied interval. Near the K/Pg boundary, the increase in epifaunal taxa, relatively high BFOI values, and reduced abundance of opportunistic infaunal forms suggest comparatively oxygenated, low-productivity seafloor conditions following reduced organic-matter flux. In contrast, the PETM interval, represented by the El-Dababiya Quarry Member, records lower benthic diversity, decreased BFOI values, and increased abundance of low-oxygen-tolerant taxa, indicating enhanced organic-matter delivery, dysoxic bottom-water conditions, and ecological restructuring during early Eocene warming.
Sequence-stratigraphic analysis identifies five depositional sequences: Ma-SQ, Da-SQ, Sel-Th-SQ, Yp-SQ1, and Yp-SQ2. These are bounded by five key sequence boundaries or correlative surfaces: Ma-SB, Ma/Da-SB, Da/Sel-SB, Th/Yp-SB, and Yp-SB. The Ma-SQ includes the late Maastrichtian Sudr Formation and records a transgressive–highstand cycle. The Da-SQ is represented by the Danian Dib Formation and reflects a condensed transgressive interval deposited under relatively shallow marine conditions. The Sel-Th-SQ is preserved only locally at the Gabal El-Mellaha section in the El-Hanadi Member and represents a latest Paleocene highstand phase. The Yp-SQ1 comprises the El-Dababiya Quarry, El-Mahmiya, and Abu Had members of the Esna Formation and records an early Ypresian deepening followed by shallowing. The Yp-SQ2 includes the lower Thebes Formation and represents renewed carbonate deposition during the early Eocene.
Comparison with global sea-level curves shows that the Esh El-Mellaha succession preserves recognizable eustatic signals, including Maastrichtian, Danian, late Paleocene, and Ypresian relative sea-level changes. However, the local expression of these signals was strongly modified by differential accommodation, erosion, condensation, and lateral facies variability related to Syrian Arc tectonism. The integrated results therefore refine the Maastrichtian–Ypresian stratigraphic framework of the Esh El-Mellaha area and demonstrate that the southern Tethyan margin recorded global K/Pg and PETM environmental perturbations with strong local tectono-sedimentary overprinting.

Author Contributions

Conceptualization, A.S., I.E.-S., I.Y.E.-M., N.A.O., K.H.M., A.G. and A.M.S.; methodology, A.S., I.E.-S., I.Y.E.-M., N.A.O., K.H.M. and A.M.S.; software, A.S., I.E.-S., I.Y.E.-M. and A.M.S.; validation, A.S., N.A.O., K.H.M., A.G. and A.M.S.; formal analysis, A.S., I.E.-S., I.Y.E.-M., N.A.O., K.H.M. and A.M.S.; investigation, A.S., I.E.-S., I.Y.E.-M., N.A.O., K.H.M. and A.M.S.; data curation, A.S., I.E.-S., I.Y.E.-M., N.A.O., K.H.M. and A.M.S.; writing—original draft preparation, A.S., I.E.-S., I.Y.E.-M., N.A.O., K.H.M. and A.M.S.; writing—review and editing, A.S., I.E.-S., I.Y.E.-M., N.A.O., K.H.M., A.G. and A.M.S.; supervision, N.A.O. and K.H.M. All authors have read and agreed to the published version of the manuscript.

Funding

This research received no external funding.

Data Availability Statement

The data presented in this study are included in the article and Appendix A.

Conflicts of Interest

The authors declare no conflicts of interest.

Appendix A

Appendix A.1

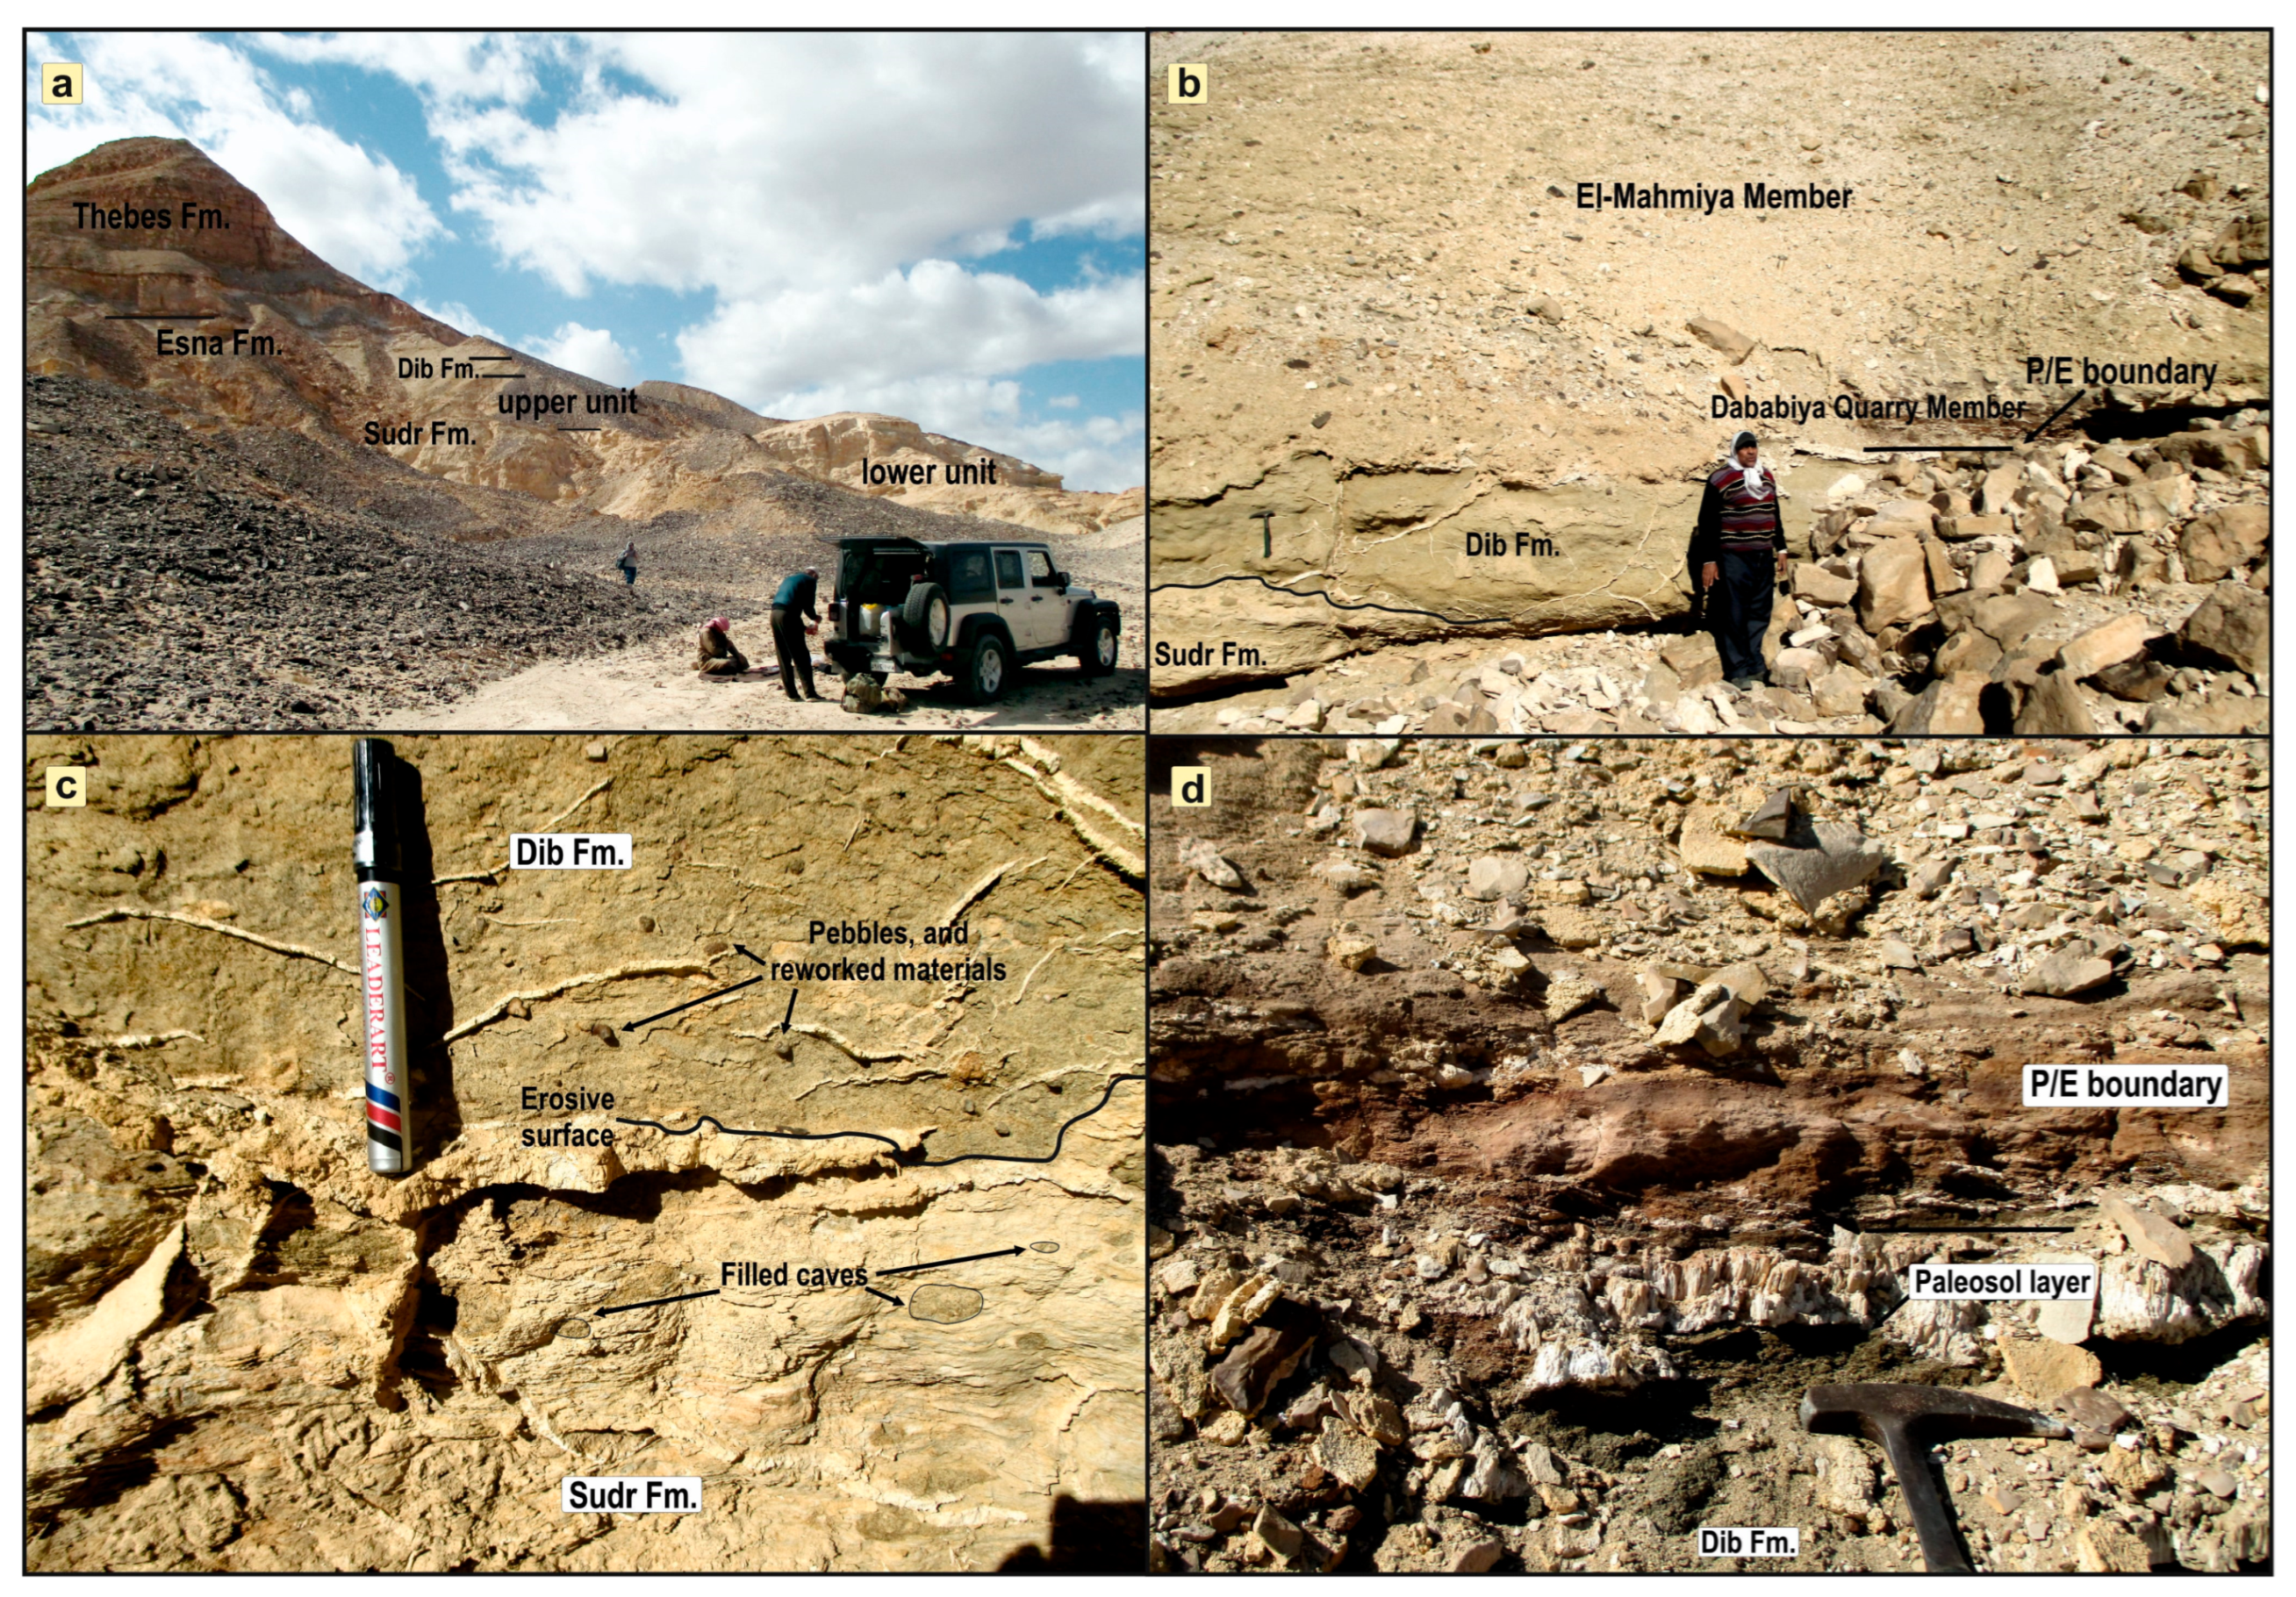
Figure A1. Field photographs illustrating (a) the most significant rock units and their subdivisions at (GT) section; (b) the irregular surface at the Sudr/Dib formational boundary and P/E boundary at the (WH) section; (c) the erosional surface at the Sudr/Dib Formations at (WH) section; (d) the paleosol layer above the Dib Fm. and P/E boundary at the (GT) section.
Jmse 14 01413 g0a1

Appendix A.2

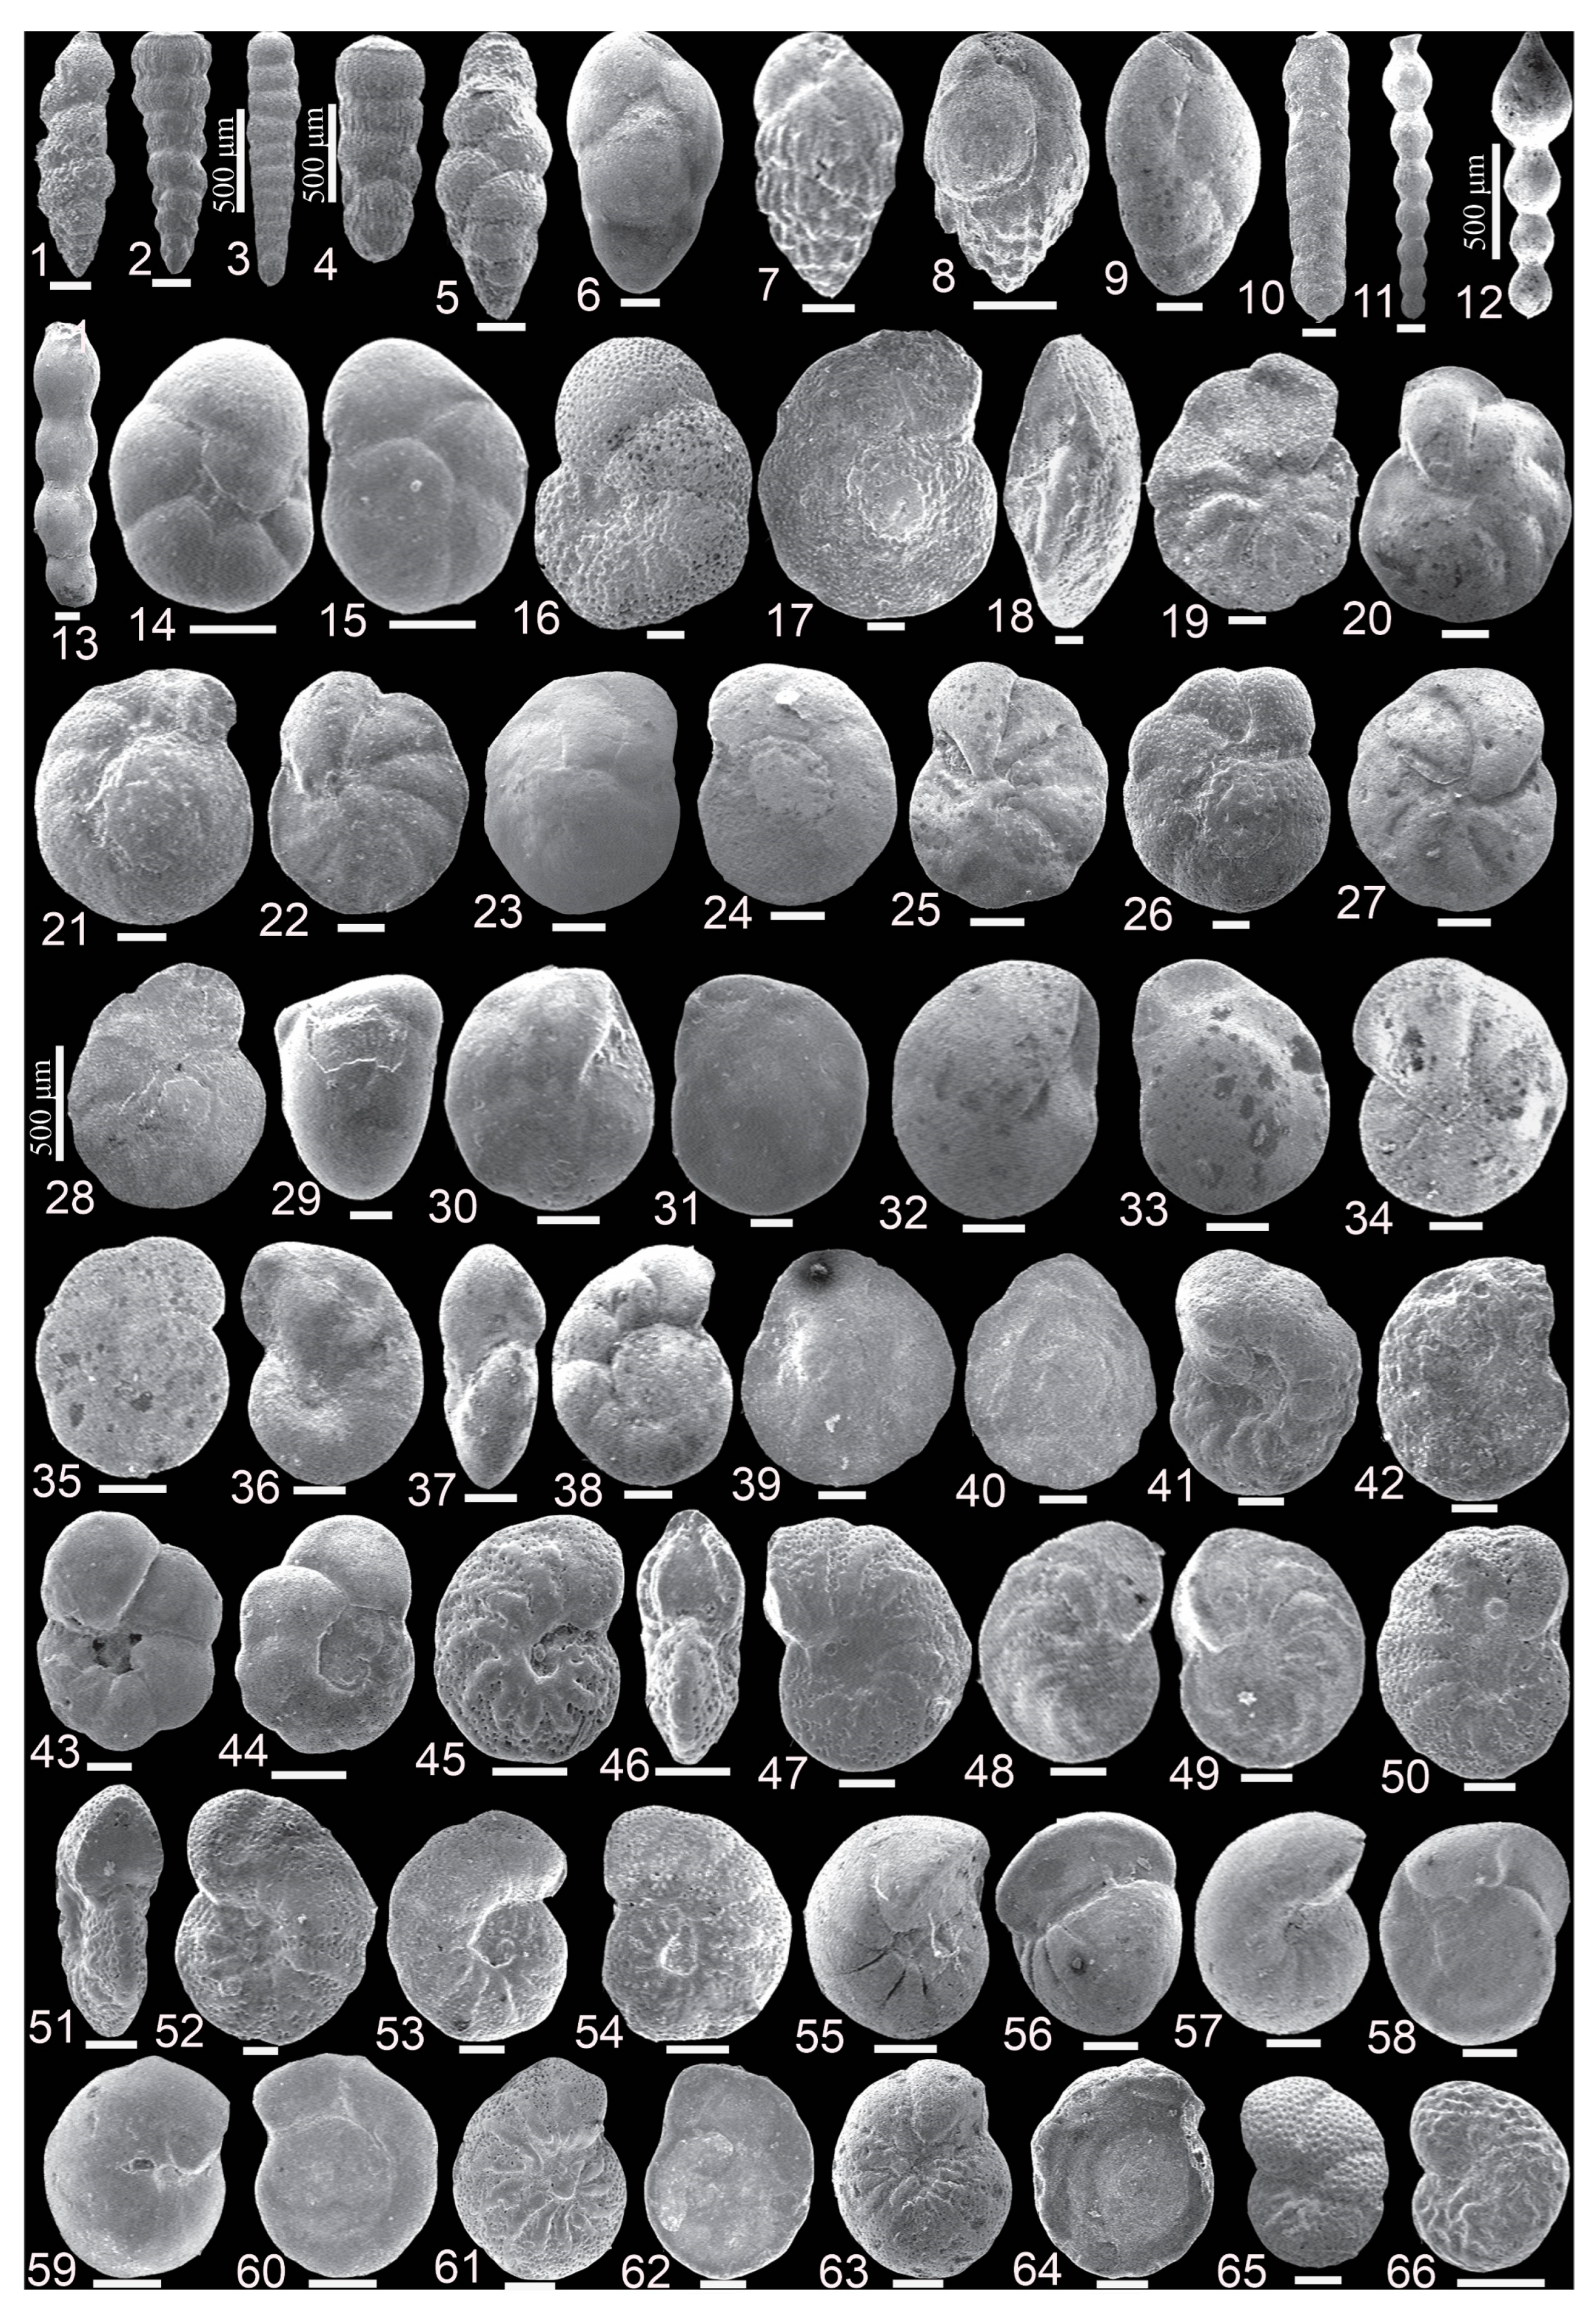
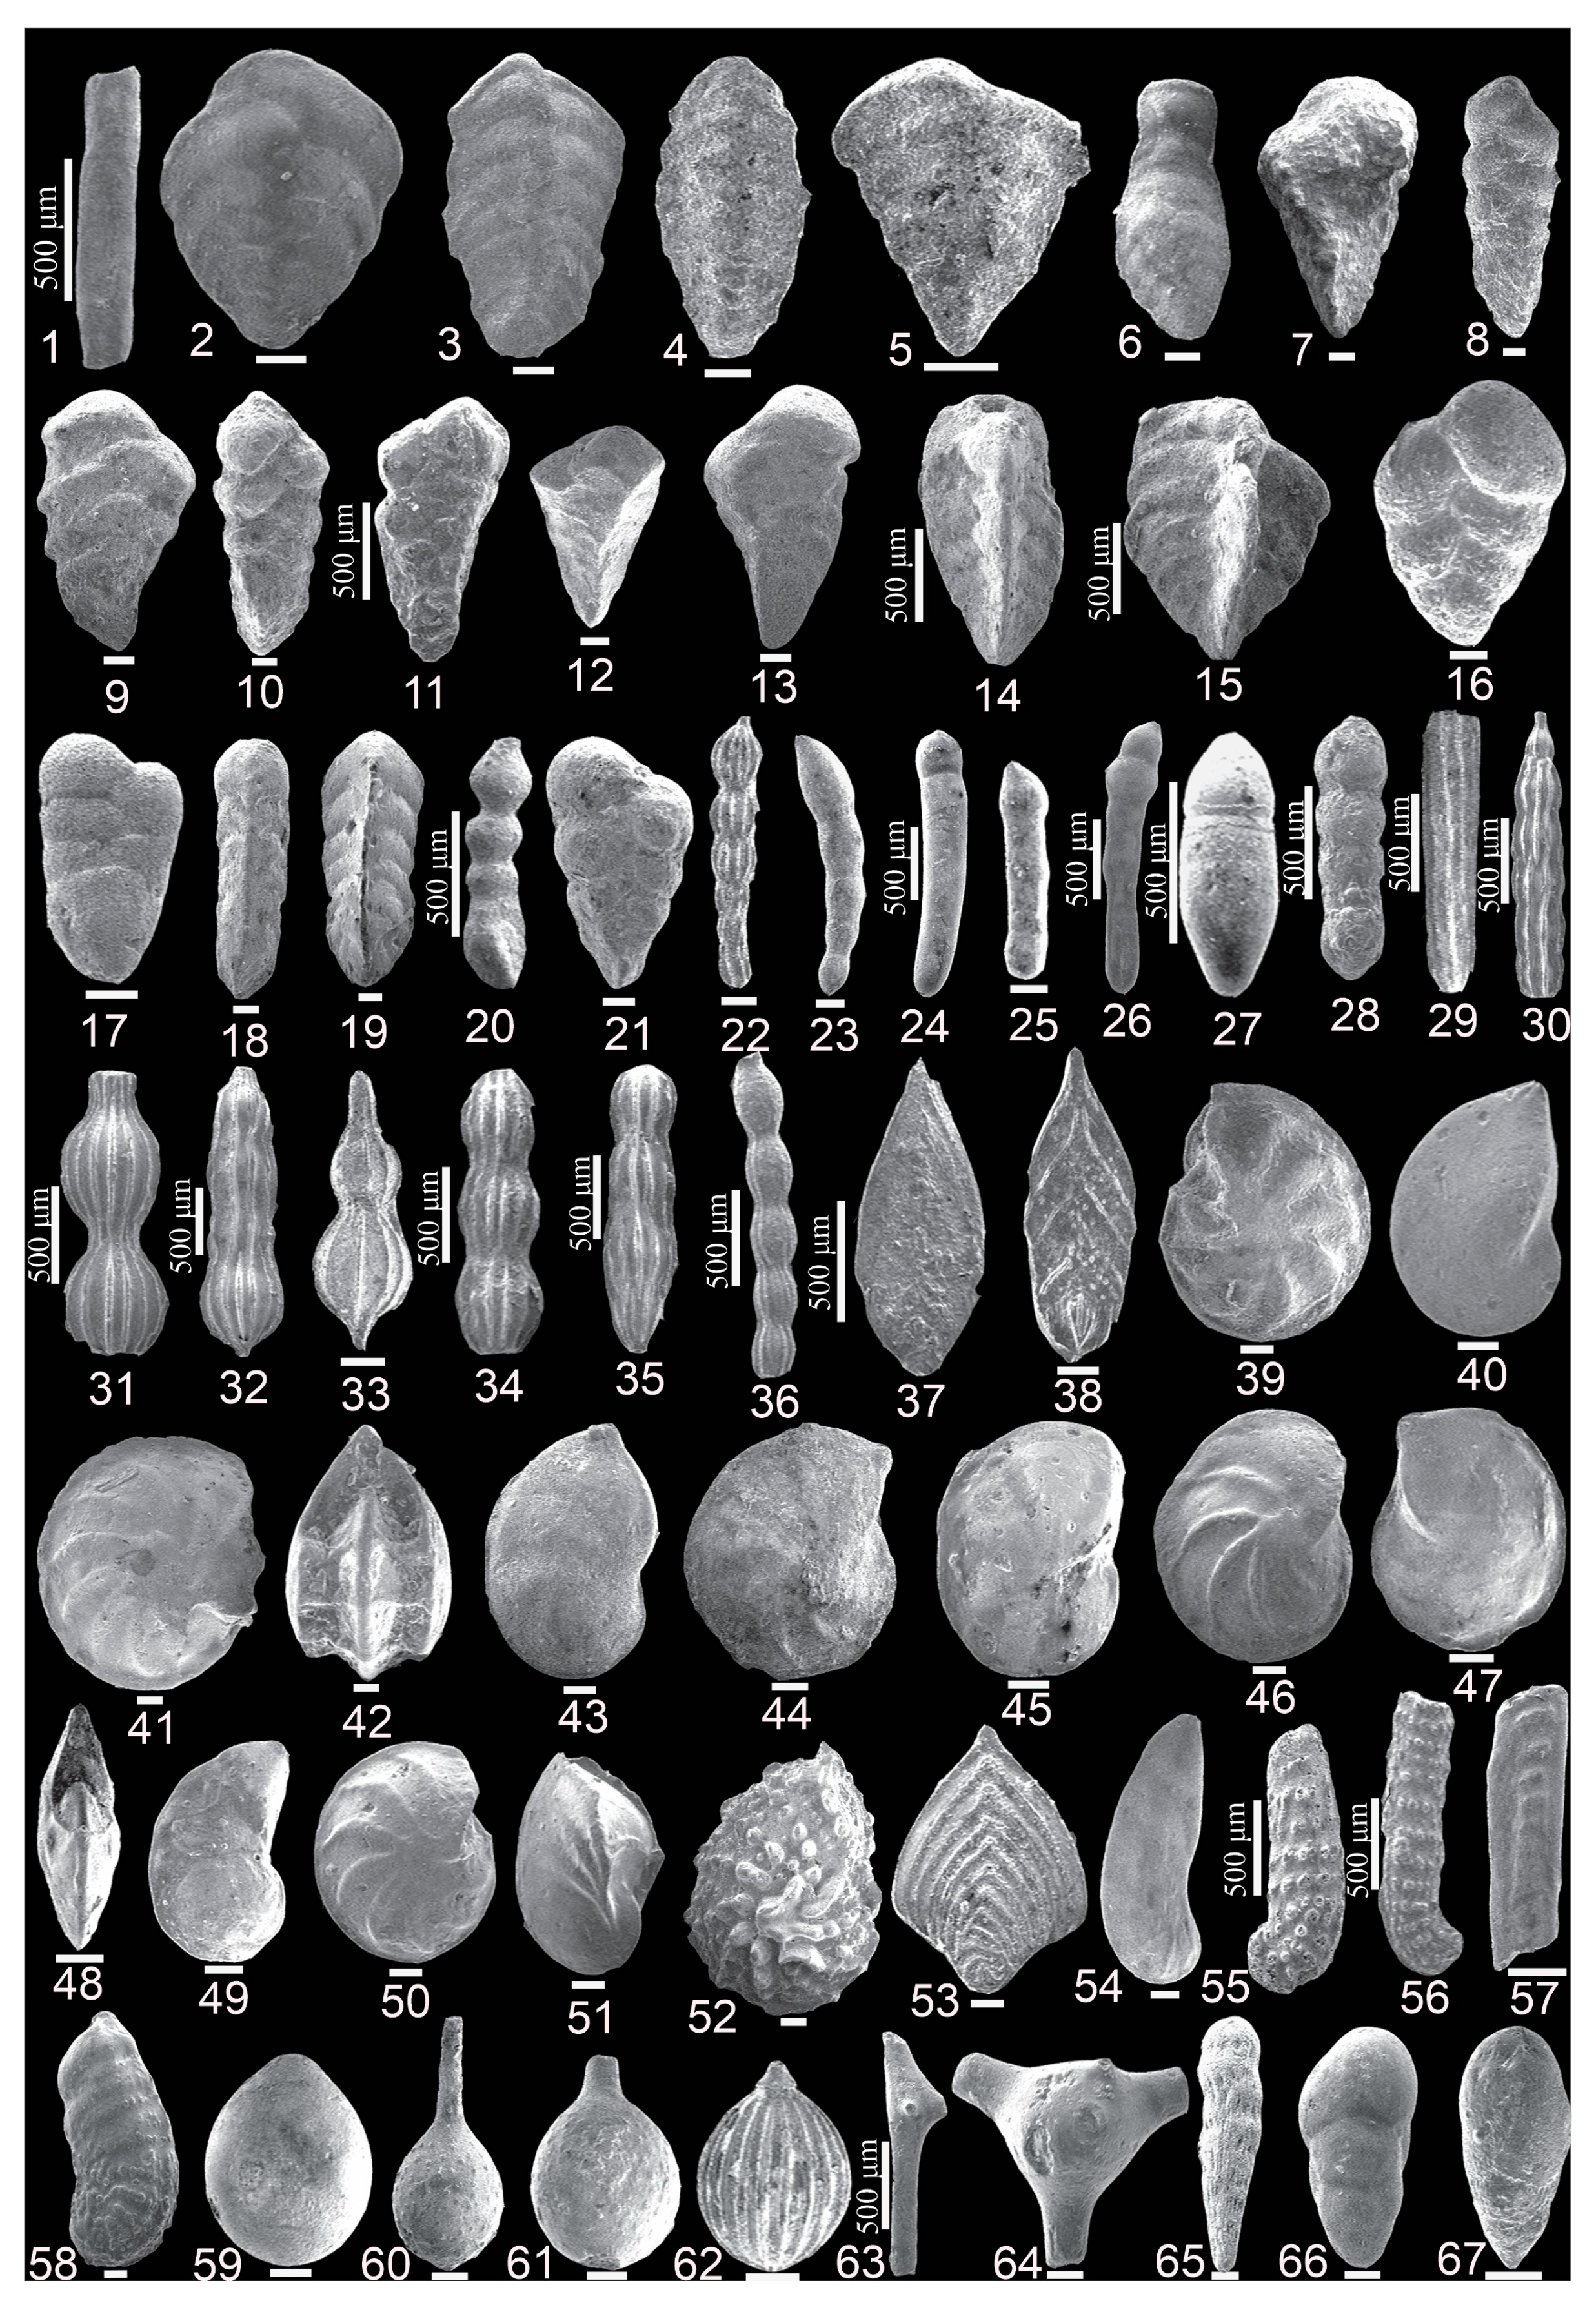
Figure A2. SEM images of selected benthic foraminiferal taxa. Scale bars = 100 μm unless otherwise indicated. 1. Bathysiphon paleocenicus 2. Spiroplectinella knebeli 3. Spiroplectinella dentata 4. Spiroplectammina henryi 5. Spiroplectinella esnaensis 6. Vulvulina colei 7. Gaudryina (Siphogaudryina) austinana 8. Gaudryina elegantissma 9. Gaudryina nekhlensis 10. Gaudryina Africana 11. Gaudryina rugosa 12. Gaudryina pyramidata 13. Gaudryina soldadoensis 14. Verneuilina karreri 15. Verneuilina luxorensis 16. Dorothia pupa 17. Dorothia bulletta 18. Clavulinoides aspera 19. Clavulinoides trilatera 20. Pseudoclavulina maqfiensis 21. Textularia farafraensis 22. Dentalina delicatula 23. Laevidentalina basiplanata 24. Laevidentalina colei 25. Laevidentalina gracilis 26. Chrysalogonium granti 27. Pseudonodosaria lagenoides 28. Pseudonodosaria manifesta 29. Dentalina vertebralis 30. Pyramidulina affinis 31. Pyramidulina zippei 32. Pyramidulina distans 33. Pyramidulina latejugata 34. Pyramidulina paupercula 35. Pyramidulina semispinosa 36. Pyramidulina limbata 37. Frondicularia goldfussia 38. Frondicularia linearis 39. Lenticulina midwayensis 40. Saracenaria navicula 41,42. Lenticulina cultrata 43. Lenticulina oligostegia 44. Lenticulina muensteri 45. Lenticulina discrepans 46. Lenticulina rotulata 47,48. Lenticulina isidis 49. Lenticulina turbinatus 50. Lenticulina chitanii 51. Saracenaria navicular 52. Vaginulinopsis echinata 53. Neoflabellina rugosa 54. Astacolus mundus 55. Marginulina wetherellii var. intercostata 56. Marginulina wetherellii var. longiscata 57. Vaginulina longiformis 58. Vaginulina trilobata 59. Oolina globosa 60. Lagena hispida 61. Reussoolina apiculata 62. Lagena sulcata 63. Ramulina elkhoudaryi 64. Ramulina navarroana 65. Loxostomoides applinae 66. Praebulimina kikapooensis 67. Neobulimina aspera.
Jmse 14 01413 g0a2

Appendix A.3

Figure A3. SEM images of selected benthic foraminiferal taxa. Scale bars = 100 μm unless otherwise indicated. 1. Siphogeneroides eleganta 2. Orthokarstenia whitei 3. Orthokarstenia oveyi 4. Orthokarstenia parva 5. Orthokarstenia esnehensis, 6. Bulimina quadrata 7. Bulimina farafraensis 8. Bulimina midwayensis 9. Bulimina kugleri 10. Coryphostoma plaitum 11. Siphonodosaria lohmani 12. Stilostomella midwayensis 13. Siphonodosaria sentifera 14,15. Valvulineria aegyptiaca 16. Valvulineria scorbiculata 17,18. Cibicidoides alleni 19. Cibicides decoratus 20. Cibicidoides succedens 21,22. Cibicidoides pseudoperlucidus 23,24. Cibicidoides proprius 25,26. Cibicidoides pharaonic 27. Cibicides farafraensis 28. Heterolepa libyca 29. Allomorphina cretacea 30,31. Alabamina midwayensis 32,33. Alabamina wilcoxensis 34,35. Gyroidinoides depressa 36–38. Gyroidinoides planulata 39,40. Osangularia plummerae 41,42 Anomalinoides aegyptiacus 43,44. Anomalinoides umbonifera 45–47. Gavelinella midwayensis 48,49 Anomalinoides zitteli 50–52. Anomalinoides acutus 53,54. Anomalinoides affinis 55,56. Gyroidinoides globosa 57,58. Gyroidinoides girardana 59,60. Gyroidinoides subangulata 61,62. Angulogavelinella abudurbensis 63,64. Angulogavelinella avnimelechi 65. Gavelinella danica 66. Gavelinella beccariiformis.
Jmse 14 01413 g0a3

Appendix A.4

Figure A4. Summary of paleobathymetrical references of the most common benthic species: 1—Le Roy [82]; 2—Nogan [83]; 3—Berggren [61]; 4—Luger [62]; 5—Saint-Marc [84]; 6—Speijer [85]; 7— Culver [86]; 8—Hewaidy [87]; 9—Speijer and Schmitz [88]; 10—Schnack [89]; 11—Hewaidy and Strougo [90]; 12—El Dawy and Hewaidy [91]; 13—Alegret and Thomas [92]; 14—Ernst et al. [93]; 15—Stassen et al. [94]; 16—Sprong et al. [95]; 17—El Dawy et al. [96].
Jmse 14 01413 g0a4

References

  1. Zahran, S.; El Hedeny, M.; El-Sabbagh, A.; Rashwan, M.; El-Refaiy, A.; Abu El-Kheir, G. A palaeoenvironmental reconstruction of the Campanian-lower Palaeocene succession of the Dakhla Oasis (Western Desert, Egypt): Insights from integrated sequence stratigraphy, macrobenthos, and trace fossil analyses. J. Afr. Earth Sci. 2025, 227, 105629. [Google Scholar] [CrossRef]
  2. Chakir, S.; Slimani, H.; Hssaida, T.; Kocsis, L.; Gheerbrant, E.; Bardet, N.; Jalil, N.; Mouflih, M.; Mahboub, I.; Jbari, H. Dinoflagellate cyst evidence for the age, palaeoenvironment and paleoclimate of a new Cretaceous–Paleogene (K/Pg) boundary section at the Bou Angueur syncline, Middle Atlas, Morocco. Cretac. Res. 2020, 106, 104219. [Google Scholar] [CrossRef]
  3. Obaidalla, N.A.; El-Sheikh, I.; Mahfouz, K.H.; Salman, A.M.; Soliman, M.F.; Abdel-Aleem, F.E.Z.M. Upper Cretaceous–lower Paleocene subsurface sequence, Farafra Oasis, Western Desert, Egypt: Stratigraphical and paleoenvironmental inferences. Arab. J. Geosci. 2020, 13, 957. [Google Scholar] [CrossRef]
  4. George, S.W.M.; Davis, S.N.; Fernández, R.A.; Manríquez, L.M.E.; Leppe, M.A.; Horton, B.K.; Clarke, J.A. Chronology of deposition and unconformity development across the Cretaceous–Paleogene boundary, Magallanes-Austral Basin, Patagonian Andes. J. South Am. Earth Sci. 2020, 97, 102237. [Google Scholar] [CrossRef]
  5. Moforis, L.; Kontakiotis, G.; Janjuhah, H.T.; Zambetakis-Lekkas, A.; Galanakis, D.; Paschos, P.; Kanellopoulos, C.; Sboras, S.; Besiou, E.; Karakitsios, V.; et al. Sedimentary and Diagenetic Controls across the Cretaceous—Paleogene Transition: New Paleoenvironmental Insights of the External Ionian Zone from the Pelagic Carbonates of the Gardiki Section (Epirus, Western Greece). J. Mar. Sci. Eng. 2022, 10, 1948. [Google Scholar] [CrossRef]
  6. Renne, P.R.; Deino, A.L.; Hilgen, F.J.; Kuiper, K.F.; Mark, D.F.; Mitchell, W.S.; Morgan, L.E.; Mundil, R.; Smit, J. Time Scales of Critical Events Around the Cretaceous-Paleogene Boundary. Science 2013, 339, 684–687. [Google Scholar] [CrossRef] [PubMed]
  7. Doubrawa, M.; Stassen, P.; Robinson, M.M.; Babila, T.L.; Zachos, J.C.; Speijer, R.P. Shelf ecosystems along the U.S. Atlantic Coastal Plain prior to and during the Paleocene-Eocene Thermal Maximum: Insights into the stratigraphic architecture. Paleoceanogr. Paleoclimatol. 2022, 37, e2022PA004475. [Google Scholar] [CrossRef]
  8. Schulte, P.; Alegret, L.; Arenillas, I.; Arz, J.A.; Barton, P.J.; Bown, P.R.; Bralower, T.J.; Christeson, G.L.; Claeys, P.; Cockell, C.S.; et al. The Chicxulub asteroid impact and mass extinction at the Cretaceous-Paleogene boundary. Science 2010, 327, 1214–1218. [Google Scholar] [CrossRef] [PubMed]
  9. Zachos, J.C.; Dickens, G.R.; Zeebe, R.E. An early Cenozoic perspective on greenhouse warming and carbon-cycle dynamics. Nature 2008, 451, 279–283. [Google Scholar] [CrossRef] [PubMed]
  10. McInerney, F.A.; Wing, S.L. The Paleocene-Eocene Thermal Maximum: A perturbation of carbon cycle, climate, and biosphere with implications for the future. Annu. Rev. Earth Planet. Sci. 2011, 39, 489–516. [Google Scholar] [CrossRef]
  11. Hull, P.M.; Bornemann, A.; Penman, D.E.; Henehan, M.J.; Norris, R.D.; Wilson, P.A.; Blum, P.; Alegret, L.; Batenburg, S.J.; Bown, P.R.; et al. On impact and volcanism across the Cretaceous–Paleogene boundary. Science 2020, 367, 266–272. [Google Scholar] [CrossRef] [PubMed]
  12. Li, M.; Bralower, T.J.; Kump, L.R.; Self-Trail, J.; Zachos, J.C.; Rush, W.D.; Robinson, M.M. Astrochronology of the Paleocene–Eocene Thermal Maximum on the Atlantic Coastal Plain. Nat. Commun. 2022, 13, 5618. [Google Scholar] [CrossRef] [PubMed]
  13. Yao, W.; Kong, T.; Wang, X.T.; Zhai, R.; Zhang, R.; Liu, Y. Expanded subsurface ocean anoxia in the Atlantic during the Paleocene–Eocene Thermal Maximum. Nat. Commun. 2024, 15, 9053. [Google Scholar] [CrossRef] [PubMed]
  14. Wei, G.-Y.; Pohl, A.; Jiang, S.; Zhang, H.; Wang, W.; Pogge von Strandmann, P.A.E.; Maffre, P.; Xiong, G.; Shen, S.-Z.; Zhang, F.; et al. Changes in continental weathering regimes inhibited global marine deoxygenation during the Paleocene–Eocene Thermal Maximum. Nat. Commun. 2025, 16, 9163. [Google Scholar] [CrossRef] [PubMed]
  15. Mahanipour, A.; Mutterlose, J.; Parandavar, M. Integrated bio- and chemostratigraphy of the Cretaceous—Paleogene boundary interval in the Zagros Basin (Iran, central Tethys). Paleogeogr. Paleoclimatol. Paleoecol. 2022, 587, 110785. [Google Scholar] [CrossRef]
  16. Coccioni, R.; Marsili, A. The response of benthic foraminifera to the K–Pg boundary biotic crisis at Elles (northwestern Tunisia). Paleogeogr. Paleoclimatol. Paleoecol. 2007, 255, 157–180. [Google Scholar] [CrossRef]
  17. Weiss, A.M.; Foster, W.J.; Košir, A.; Muscente, A.D.; Martindale, R.C. Shallow-marine, benthic ecosystems show compositional shifts in response to the Paleocene-Eocene Thermal Maximum (PETM) on the Adriatic Carbonate Platform. Paleoceanogr. Paleoclimatol. 2025, 40, e2024PA005039. [Google Scholar] [CrossRef]
  18. Li, J.; Hu, X.; Zachos, J.C.; Garzanti, E.; BouDagher-Fadel, M. Sea level, biotic and carbon-isotope response to the Paleocene–Eocene thermal maximum in Tibetan Himalayan platform carbonates. Glob. Planet. Change 2020, 194, 103316. [Google Scholar] [CrossRef]
  19. Smirnov, P.; Deryagina, O.; Afanasieva, N.; Rudmin, M.; Gursky, H.-J. Clay Minerals and Detrital Material in Paleocene–Eocene Biogenic Siliceous Rocks (Sw Western Siberia): Implications for Volcanic and Depositional Environment Record. Geosciences 2020, 10, 162. [Google Scholar] [CrossRef]
  20. Montano, D.; Gasparrini, M.; Rohais, S.; De Luca, R. A Lacustrine Record for the Cretaceous–Paleogene Boundary—Yacoraite Fm., (Northwest Argentina). Geosciences 2023, 13, 227. [Google Scholar] [CrossRef]
  21. Alegret, L.; Thomas, E.; Lohmann, K.C. End-Cretaceous marine mass extinction is not caused by productivity collapse. Proc. Natl. Acad. Sci. USA 2012, 109, 728–732. [Google Scholar] [CrossRef] [PubMed]
  22. Alegret, L.; Thomas, E. Benthic foraminifera across the Cretaceous/Paleogene boundary in the Southern Ocean (ODP Site 690): Diversity, food, and carbonate saturation. Mar. Micropaleontol. 2013, 105, 40–51. [Google Scholar] [CrossRef]
  23. Morard, R.; Hassenrück, C.; Greco, M.; Fernandez-Guerra, A.; Rigaud, S.; Douady, C.J.; Kucera, M. Renewal of planktonic foraminifera diversity after the Cretaceous–Paleogene mass extinction by benthic colonizers. Nat. Commun. 2022, 13, 7135. [Google Scholar] [CrossRef] [PubMed]
  24. Rodríguez-Tovar, F.J. Evaluating tracemaker recovery after the Cretaceous–Paleogene (K–Pg) boundary event: Different biotic responses at the Caravaca section. J. Iber. Geol. 2024, 50, 487–501. [Google Scholar] [CrossRef]
  25. Alegret, L.; Ortiz, S.; Arenillas, I.; Molina, E. Palaeoenvironmental turnover across the Paleocene/Eocene boundary at the stratotype section in Dababiya (Egypt) based on benthic foraminifera. Terra Nova 2005, 17, 526–536. [Google Scholar] [CrossRef]
  26. Papadomanolaki, N.M.; Sluijs, A.; Slomp, C.P. Eutrophication and deoxygenation forcing of marginal marine organic carbon burial during the PETM. Paleoceanogr. Paleoclimatol. 2022, 37, e2021PA004232. [Google Scholar] [CrossRef] [PubMed]
  27. Jorissen, F.J.; de Stigter, H.C.; Widmark, J.G. A conceptual model explaining benthic foraminiferal microhabitats. Mar. Micropaleontol. 1995, 26, 3–15. [Google Scholar] [CrossRef]
  28. Van der Zwaan, G.J.; Duijnstee, A.I.; Den Dulk, M.; Ernst, S.R.; Jannink, N.T.; Kouwenhoven, T.J. Benthic foraminifers: Proxies or problems? A review of paleoecological concepts. Earth-Sci. Rev. 1999, 46, 213–236. [Google Scholar] [CrossRef]
  29. Shreif, A.; Obaidalla, N.A.; Menoufy, S.A. Stratigraphic and Paleoenvironmental Studies on the Lower Eocene Succession at El-Guss Abu Said Plateau, Farafra Oasis, Western Desert, Egypt. J. Foraminifer. Res. 2023, 53, 109–119. [Google Scholar] [CrossRef]
  30. Metwally, A.A.; Mohamed, A.A.; Obaidalla, N.A.; Salman, A.M.; Mahfouz, K.H. Cretaceous–Paleogene (K–Pg) boundary in South Sinai, Egypt: Paleoenvironment and sequence stratigraphy implications. J. Afr. Earth Sci. 2023, 205, 105017. [Google Scholar] [CrossRef]
  31. Agirrezabala, L.M.; Malaxetxebarria, A.; Pascual, A.; Rodríguez-Lázaro, J. Deep-sea paleoenvironmental evolution in the mid-Cretaceous of the Basque Pyrenees based on microfaunal analysis (Armintza section). Cont. Shelf Res. 2023, 260, 105001. [Google Scholar] [CrossRef]
  32. Ayyad, H.M.; El-Sharnoby, A.A.; El-Morsy, A.M.; Ahmed, M.A.; El-Deeb, A.A. Quantitative reconstruction of paleoenvironmental conditions in the Gulf of Suez during the Burdigalian-Langhian (early to middle Miocene) using benthic foraminifera. Paleogeogr. Paleoclimatol. Paleoecol. 2018, 503, 51–68. [Google Scholar] [CrossRef]
  33. Aubry, M.P.; Ouda, K.; Dupuis, C.; Van Couvering, J.A. The Global Standard Stratotype Section and Point (GSSP) for the base of the Eocene Series in the Dababiya section (Egypt). Episodes 2007, 30, 271–286. [Google Scholar] [CrossRef] [PubMed]
  34. Schulte, P.; Scheibner, C.; Speijer, R.P. Fluvial discharge and sea-level changes controlling black shale deposition during the Paleocene–Eocene Thermal Maximum in the Dababiya Quarry section, Egypt. Chem. Geol. 2011, 285, 167–183. [Google Scholar] [CrossRef]
  35. Al-Ameer, A.O.; Mahfouz, K.H.; El-Sheikh, I.; Metwally, A.A. Nature of the Paleocene/Eocene boundary (the Dababiya Quarry Member) at El-Ballas area, Qena region, Egypt. J. Afr. Earth Sci. 2022, 192, 104569. [Google Scholar] [CrossRef]
  36. El-Sheikh, I.; Mahfouz, K.H.; Al-Ameer, A.O.; Metwally, A.A. Paleocene–Eocene boundary in the Gabal El-Gir, east Qena, Egypt: Paleoenvironment and sequence stratigraphy interpretations. Mar. Micropaleontol. 2023, 185, 102306. [Google Scholar] [CrossRef]
  37. Abou El-Anwar, E.A.; Belal, Z.L.; Salman, S.A.; Azab, N.A.A.; Abd El Samee, M.A. Paleo-environmental conditions and provenance of the Dakhla and Esna formations, Dababiya GSSP area, Luxor, Egypt: Rare earth and trace elements geochemical approach. J. Sediment. Environ. 2026, 11, 13. [Google Scholar] [CrossRef]
  38. Metwally, A.A.; El-Sheikh, I.; Mahfouz, K.H. Paleoenvironment, sequence stratigraphy, and sea-level change in the upper Maastrichtian–Danian boundary interval in Gabal Aras, east Qena, Nile Valley, Egypt. Cretac. Res. 2023, 148, 105548. [Google Scholar] [CrossRef]
  39. Mohamed, A.A.; Obaidalla, N.A.; Salman, A.M.; Mahfouz, K.H.; Metwally, A.A. Paleoenvironmental and sea-level changes across the Paleocene–lower Eocene interval at central and southwestern Sinai, Egypt. J. Afr. Earth Sci. 2025, 222, 105483. [Google Scholar] [CrossRef]
  40. El Ayyat, A.M.; Obaidalla, N.A. Sequence stratigraphy, sea-level dynamics, and syn-sedimentary tectonic evolution of the Late Cretaceous/Paleocene basin on the western shoulder of the Gulf of Suez, Egypt. Arab. J. Geosci. 2025, 18, 95. [Google Scholar] [CrossRef]
  41. Bazeen, Y.S.; Kassab, W.G.; Moneer, E.S.M.; Abu El-Kheir, G.A.; AbdelGawad, M.K.; Ayyad, H.M. Integrated biostratigraphy and chemostratigraphy of the Maastrichtian–Danian succession at Abu Minqar, Egyptian Western Desert: Implications for sequence stratigraphy and tectonic influence. Cretac. Res. 2024, 154, 105723. [Google Scholar] [CrossRef]
  42. Elbahrawy, A.; Omran, M.A.; Khamees, H.; Sarhan, M.A. Geophysical structural interpretation of Esh El Mallaha basin, southern Gulf of Suez: Implications for oil potential in South Malak and Rabeh fields. Geomech. Geophys. Geo-Energ. Geo-Resour. 2023, 9, 58. [Google Scholar] [CrossRef]
  43. Bosworth, W.; El-Hawat, A.S.; Helgeson, D.E.; Burke, K. Cyrenaican “shock absorber” and associated inversion strain shadow in the collision zone of northeast Africa. Geology 2008, 36, 695–698. [Google Scholar] [CrossRef]
  44. El-Ayyat, A.M.; Obaidalla, N.A. The impact of the Syrian Arc Orogeny on the Early Paleogene rocks, western shoulder of the Gulf of Suez, Egypt. Paleogeogr. Paleoclimatol. Paleoecol. 2016, 454, 30–53. [Google Scholar] [CrossRef]
  45. Obaidalla, N.A.; Elattaar, A.A.; El-Mohandes, I.Y. Stratigraphy of the Upper Cretaceous–Lower Paleogene Successions at Esh El-Mellaha Area, Gulf of Suez, Egypt: New contribution. Sohag J. Sci. 2022, 7, 97–103. [Google Scholar]
  46. El-Mohandes, I.Y.; Obaidalla, N.A.; Mahfouz, K.H.; Elattaar, A.A.; El-Sheikh, I. New insights on the stratigraphy of the upper Cretaceous-lower paleogene successions at Esh-ElMellaha half-graben, Gulf of Suez, Egypt. J. Afr. Earth Sci. 2024, 218, 105381. [Google Scholar] [CrossRef]
  47. El-Mohandes, I.Y.; Mahfouz, K.H.; Shen, J.; Obaidalla, N.A.; Shreif, A.; El-Sheikh, I. Extreme impact of the Late Cretaceous–Paleocene tectonic events on the evolution of the southern Tethyan margin: A case study from Eastern Desert, Egypt. J. Afr. Earth Sci. 2025, 228, 105663. [Google Scholar] [CrossRef]
  48. Conoco. Geologic Map of Egypt. In Egyptian General Authority for Petroleum (UNESCO Joint Map Project); Conoco: Houston, TX, USA, 1987; Scale (1:500,000), NG 36 SNE Quseir Sheet. [Google Scholar]
  49. Hewaidy, A.A.; Farouk, S.; El-Balkiemy, F.A. Planktonic foraminiferal biostratigraphy of the Campanian-Maastrichtian Sudr Formation at Esh El-Mellaha area, Northeastern Desert, Egypt. J. Am. Sci. 2017, 13, 42–69. [Google Scholar]
  50. Hewaidy, A.A.; Farouk, S.; El-Balkiemy, F.A. Foraminiferal biostratigraphy, stage boundaries, and paleoecology of the uppermost Maastrichtian-lower Eocene succession at Esh el-mellaha area, Northeastern Desert, Egypt. J. Am. Sci. 2017, 13, 73–113. [Google Scholar]
  51. Flügel, E.; Munnecke, A. Microfacies of Carbonate Rocks: Analysis, Interpretation and Application, 2nd ed.; Springer: Berlin/Heidelberg, Germany, 2010; p. 984. [Google Scholar] [CrossRef]
  52. Dunham, R.J. Classification of carbonate rocks according to depositional texture. In Classification of Carbonate Rocks; Ham, W.E., Ed.; AAPG Memoir 1; American Association of Petroleum Geologists: Tulsa, OK, USA, 1962; pp. 108–121. [Google Scholar]
  53. Adelseck, C.G.; Berger, W.H. On the dissolution of planktonic foraminifera and associated microfossils during settling and on the sea floor. In Dissolution of Deep-Sea Carbonates; Sliter, W.V., Bé, A.W.H., Berger, W.H., Eds.; Cushman Special Publications: Washington, DC, USA, 1975; Volume 13, pp. 70–81. [Google Scholar]
  54. Van Der Zwaan, G.J.; Jorissen, F.J.; de Stigter, H.C. The depth dependency of planktonic/benthic foraminiferal ratios: Constraints and applications. Mar. Geol. 1990, 95, 1–16. [Google Scholar] [CrossRef]
  55. Zachariasse, W.J.; Kontakiotis, G.; Lourens, L.J.; Antonarakou, A. The Messinian of Agios Myron (Crete, Greece): A Key to Better Understanding of Diatomite Formation on Gavdos (South of Crete). Palaeogeogr. Palaeoclimatol. Palaeoecol. 2021, 581, 110633. [Google Scholar] [CrossRef]
  56. Berggren, W.A.; Aubert, J. Paleocene benthonic foraminiferal biostratigraphy, paleobiogeography, and paleoecology of Atlantic-Tethyan regions: Midway-type fauna. Paleogeogr. Paleoclimatol. Paleoecol. 1975, 18, 73–192. [Google Scholar] [CrossRef]
  57. Olsson, R.K.; Nyong, E.E. A paleoslope model for Campanian-lower Maestrichtian foraminifera of New Jersey and Delaware. J. Foraminifer. Res. 1984, 14, 50–68. [Google Scholar] [CrossRef]
  58. Morkhoven, V.; Berggren, W.A.; Edwards, A.S. Cenozoic cosmopolitan deep-water benthic foraminifera. Bull. Cent. Rech. Explor.-Prod. Elf-Aquitaine 1986, 11, 421. [Google Scholar]
  59. Speijer, R.P.; Van der Zwaan, G.J. Extinction and survivorship of southern Tethyan benthic foraminifera across the Cretaceous/Paleogene boundary. Geol. Soc. 1996, 102, 343–371. [Google Scholar] [CrossRef]
  60. Kaiho, K. Benthic foraminiferal dissolved-oxygen index and dissolved-oxygen levels in the modern ocean. Geology 1994, 22, 719–722. [Google Scholar] [CrossRef]
  61. Berggren, W.A. Paleocene benthonic foraminiferal biostratigraphy, biogeography, and paleoecology of Libya and Mali. Micropaleontology 1974, 20, 449–465. [Google Scholar] [CrossRef]
  62. Luger, P. Stratigraphie der Marinen Oberkreide und des Alttertiärs im südwestlichen Obernil-Becken (SW-Ägypten); Reimer: Berlin, Germany, 1985. [Google Scholar] [CrossRef]
  63. Shreif, A.; Boukhary, M.; Abul-Nasr, R.A.; Obaidalla, N.A. Ypresian Nummulites and their stratigraphic significance from El-Guss Abu Said plateau, Farafra Oasis, Western Desert, Egypt. Arab. J. Geosci. 2019, 12, 72. [Google Scholar] [CrossRef]
  64. Leckie, R.M.; Olson, H.C. Foraminifera as proxies for sea-level change on siliciclastic margins. In Micropaleontologic Proxies for Sea-Level Change and Stratigraphic Discontinuities; Olson, H.C., Leckie, R.M., Eds.; Special Publication; SEPM (Society for Sedimentary Geology 2003): Claremore, OK, USA, 2003; Volume 75, pp. 5–19. [Google Scholar] [CrossRef]
  65. Hohenegger, J. Estimation of environmental paleogradient values based on presence/absence data: A case study using benthic foraminifera for paleo-depth estimation. Paleogeogr. Paleoclimatol. Paleoecol. 2005, 217, 115–130. [Google Scholar] [CrossRef]
  66. Murray, J.W. Ecology and Applications of Benthic Foraminifera; Cambridge University Press: Cambridge, UK, 2006. [Google Scholar]
  67. Drinia, H.; Antonarakou, A.; Tsourou, T.; Kontakiotis, G.; Psychogiou, M.; Anastasakis, G. Foraminifera eco-biostratigraphy of the southern Evoikos outer shelf, central Aegean Sea, during MIS 5 to present. Cont. Shelf Res. 2016, 126, 36–49. [Google Scholar] [CrossRef]
  68. Avnaim-Katav, S.; Almogi-Labin, A.; Kanari, M.; Herut, B. Living benthic foraminifera of southeastern Mediterranean ultra-oligotrophic shelf habitats: Implications for ecological studies. Estuar. Coast. Shelf Sci. 2020, 234, 106633. [Google Scholar] [CrossRef]
  69. Thomas, E. Late Cretaceous–early Eocene mass extinctions in the deep sea. In Global Catastrophes in Earth History; An Interdisciplinary Conference on Impacts, Volcanism, and Mass Mortality; Sharpton, V.L., Ward, P.D., Eds.; Geological Society of America: Boulder, CO, USA, 1990. [Google Scholar]
  70. Schulte, P.; Alegret, L.; Arenillas, I.; Arz, J.A.; Barton, P.J.; Bown, P.R.; Willumsen, P.S. Response—Cretaceous extinctions. Science 2010, 328, 975–976. [Google Scholar] [CrossRef]
  71. Haq, B.U.; Hardenbol, J.; Vail, P.R. Chronology of fluctuating sea levels since the Triassic. Science 1987, 235, 1156–1167. [Google Scholar] [CrossRef] [PubMed]
  72. Obaidalla, N.A.; Abdel-Maksoud, N.A.; Hosny, A.M.; Mahfouz, K.H. Nature of the Paleocene/Eocene (P/E) boundary in Sinai, Egypt. J. Afr. Earth Sci. 2017, 136, 44–60. [Google Scholar] [CrossRef]
  73. Mahfouz, K.H.; El-Sheikh, I.; Obaidalla, N.A.; Shreif, A. New insights into stratigraphy and paleoenvironment of the upper Cretaceous–Eocene succession, Farafra Oasis, Western Desert, Egypt. J. Afr. Earth Sci. 2021, 175, 104096. [Google Scholar] [CrossRef]
  74. Mahfouz, K.H.; Obaidalla, N.A.; Hewaidy, A.G.A.; Mostafa, A.; El-Sheikh, I. Evolution of the Maastrichtian-Paleocene sedimentary basin in the Safaga-Quseir region, Red Sea coast, Egypt. Mar. Micropaleontol. 2021, 169, 102039. [Google Scholar] [CrossRef]
  75. Faris, M.; Obaidalla, N.A.; Metwally, A.A.; Salman, A.M.; Zaky, A.S. Late Cretaceous–early Paleogene tectonic events at the Farafra-Abu Minqar stretch, Western Desert, Egypt: Results from calcareous plankton. Arab. J. Geosci. 2018, 11, 429. [Google Scholar] [CrossRef]
  76. Abdelhady, A.A.; Seuss, B.; El-Dawy, M.H.; Obaidalla, N.A.; Mahfouz, K.H.; Wahed, S.A.A. The Unitary Association method in biochronology and its potential stratigraphic power between benthic and planktic organisms: A case study on foraminifers from Paleocene–Eocene strata of southern, Egypt. Geobios 2018, 51, 259–268. [Google Scholar] [CrossRef]
  77. Hardenbol, J.; Thierry, J.; Farley, M.B.; Jacquin, T.; De Graciansky, P.C.; Vail, P.R. Cenozoic biochronostratigraphy: Mesozoic and Cenozoic Sequence Chronostratigraphic framework of European basins. Soc. Sediment. Geol. 1998, 60, 3–13. [Google Scholar]
  78. Henehan, M.J.; Ridgwell, A.; Thomas, E.; Zhang, S.; Alegret, L.; Schmidt, D.N.; Rae, J.W.B.; Witts, J.D.; Landman, N.H.; Greene, S.E.; et al. Rapid Ocean acidification and protracted Earth system recovery followed the end-Cretaceous Chicxulub impact. Proc. Natl. Acad. Sci. USA 2019, 116, 22500–22504. [Google Scholar] [CrossRef] [PubMed]
  79. Penman, D.E.; Hönisch, B.; Zeebe, R.E.; Thomas, E.; Zachos, J.C. Rapid and sustained surface ocean acidification during the Paleocene–Eocene Thermal Maximum. Paleoceanography 2014, 29, 357–369. [Google Scholar] [CrossRef]
  80. Gutjahr, M.; Ridgwell, A.; Sexton, P.F.; Anagnostou, E.; Pearson, P.N.; Pälike, H.; Norris, R.D.; Thomas, E.; Foster, G.L. Very large release of mostly volcanic carbon during the Palaeocene–Eocene Thermal Maximum. Nature 2017, 548, 573–577. [Google Scholar] [CrossRef] [PubMed]
  81. Miller, K.G.; Browning, J.V.; Schmelz, W.J.; Kopp, R.E.; Mountain, G.S.; Wright, J.D. Cenozoic sea-level and cryospheric evolution from deep-sea geochemical and continental margin records. Sci. Adv. 2020, 6, eaaz1346. [Google Scholar] [CrossRef] [PubMed]
  82. Le Roy, L.W. Biostratigraphy of the Maqfi section, Egypt. In Geological Society of America Memoirs; Geological Society of America: Boulder, CO, USA, 1953; Volume 54, pp. 1–81. [Google Scholar]
  83. Nogan, D.S. Foraminifera, Stratigraphy, and Paleoecology of the Aquia Formation of Maryland and Virginia; Cushman Foundation for Foraminiferal Research: Glen Allen, VA, USA, 1964. [Google Scholar]
  84. Saint-Marc, P. Biogeographic and bathymetric distribution of benthic foraminifera in Paleocene El Haria Formation of Tunisia. J. Afr. Earth Sci. (Middle East) 1992, 15, 473–487. [Google Scholar] [CrossRef]
  85. Speijer, R.P. Extinction and Recovery Patterns in Benthic Foraminiferal Paleocommunities Across the Cretaceous/Paleogene and Paleocene/Eocene Boundaries. Ph.D. Thesis, Utrecht University, Utrecht, The Netherlands, 1994. [Google Scholar]
  86. Culver, S.J. New foraminiferal depth zonation of the northwestern Gulf of Mexico. Palaios 1988, 3, 69–85. [Google Scholar] [CrossRef]
  87. Hewaidy, A.A. A proposed paleoecologic Scheme for the Upper Cretaceous–Lower Tertiary Sequences in Egypt. Middle East Res. Cent. Ain Shams Univ. Earth Sci. Ser. 1997, 11, 159–168. [Google Scholar]
  88. Speijer, R.P.; Schmitz, B. A benthic foraminiferal record of Paleocene sea level and trophic/redox conditions at Gebel Aweina, Egypt. Paleogeogr. Paleoclimatol. Paleoecol. 1998, 137, 79–101. [Google Scholar] [CrossRef]
  89. Schnack, K. Biostratigraphie und Fazielle und Entwicklung in der Oberkreide und im Alttertiär im Bereich der Kharga Schwelle, Westliche Wüste, SW–Ägypten. Ph.D. Thesis, Universität Bremen, Bremen, Germany, 2000; p. 142. [Google Scholar]
  90. Hewaidy, A.A.; Strougo, A. Maastrichtian–Lower Eocene benthonic foraminiferal distribution and paleoecology of three outcrop sections in Farafra, Western Desert, Egypt. Egypt. J. Paleontol. 2001, 1, 1–22. [Google Scholar]
  91. El-Dawy, M.H.; Hewaidy, A.G.A. Biostratigraphy, Paleobathymetry and Biogeography of Some Late Maastrichtian-Early Eocene Rotauina from Egypt. Egypt. J. Paleontol. 2003, 3, 55–86. [Google Scholar]
  92. Alegret, L.; Thomas, E. Benthic foraminifera and environmental turnover across the Cretaceous/Paleogene boundary at Blake Nose (ODP Hole 1049C, Northwestern Atlantic). Paleogeogr. Paleoclimatol. Paleoecol. 2004, 208, 59–83. [Google Scholar] [CrossRef]
  93. Ernst, S.R.; Guasti, E.; Dupuis, C.; Speijer, R.P. Environmental perturbation in the southern Tethys across the Paleocene/Eocene boundary (Dababiya, Egypt): Foraminiferal and clay mineral records. Mar. Micropaleontol. 2006, 60, 89–111. [Google Scholar] [CrossRef]
  94. Stassen, P.; Thomas, E.; Speijer, R. The progression of environmental changes during the onset of the Paleocene-Eocene Thermal Maximum (New Jersey Coastal Plain). Austrian J. Earth Sci. 2012, 105, 169–178. [Google Scholar]
  95. Sprong, J.; Kouwenhoven, T.J.; Bornemann, A.; Schulte, P.; Stassen, P.; Steurbaut, E.; Youssef, M.; Speijer, R.P. Characterization of the Latest Danian Event by means of benthic foraminiferal assemblages along a depth transect at the southern Tethyan margin (Nile Basin, Egypt). Mar. Micropaleontol. 2012, 86, 15–31. [Google Scholar] [CrossRef]
  96. El-Dawy, M.H.; Obaidalla, N.A.; Mahfouz, K.H.; Salman, A.M.; Wahed, S.A.A. Benthonic foraminiferal biostratigraphy and faunal turnover events during the Late Paleocene-Early Eocene at Darb Gaga, Western Desert, Egypt: Paleoenvironmental and sequence stratigraphic interpretations. J. Afr. Earth Sci. 2018, 145, 246–260. [Google Scholar] [CrossRef]
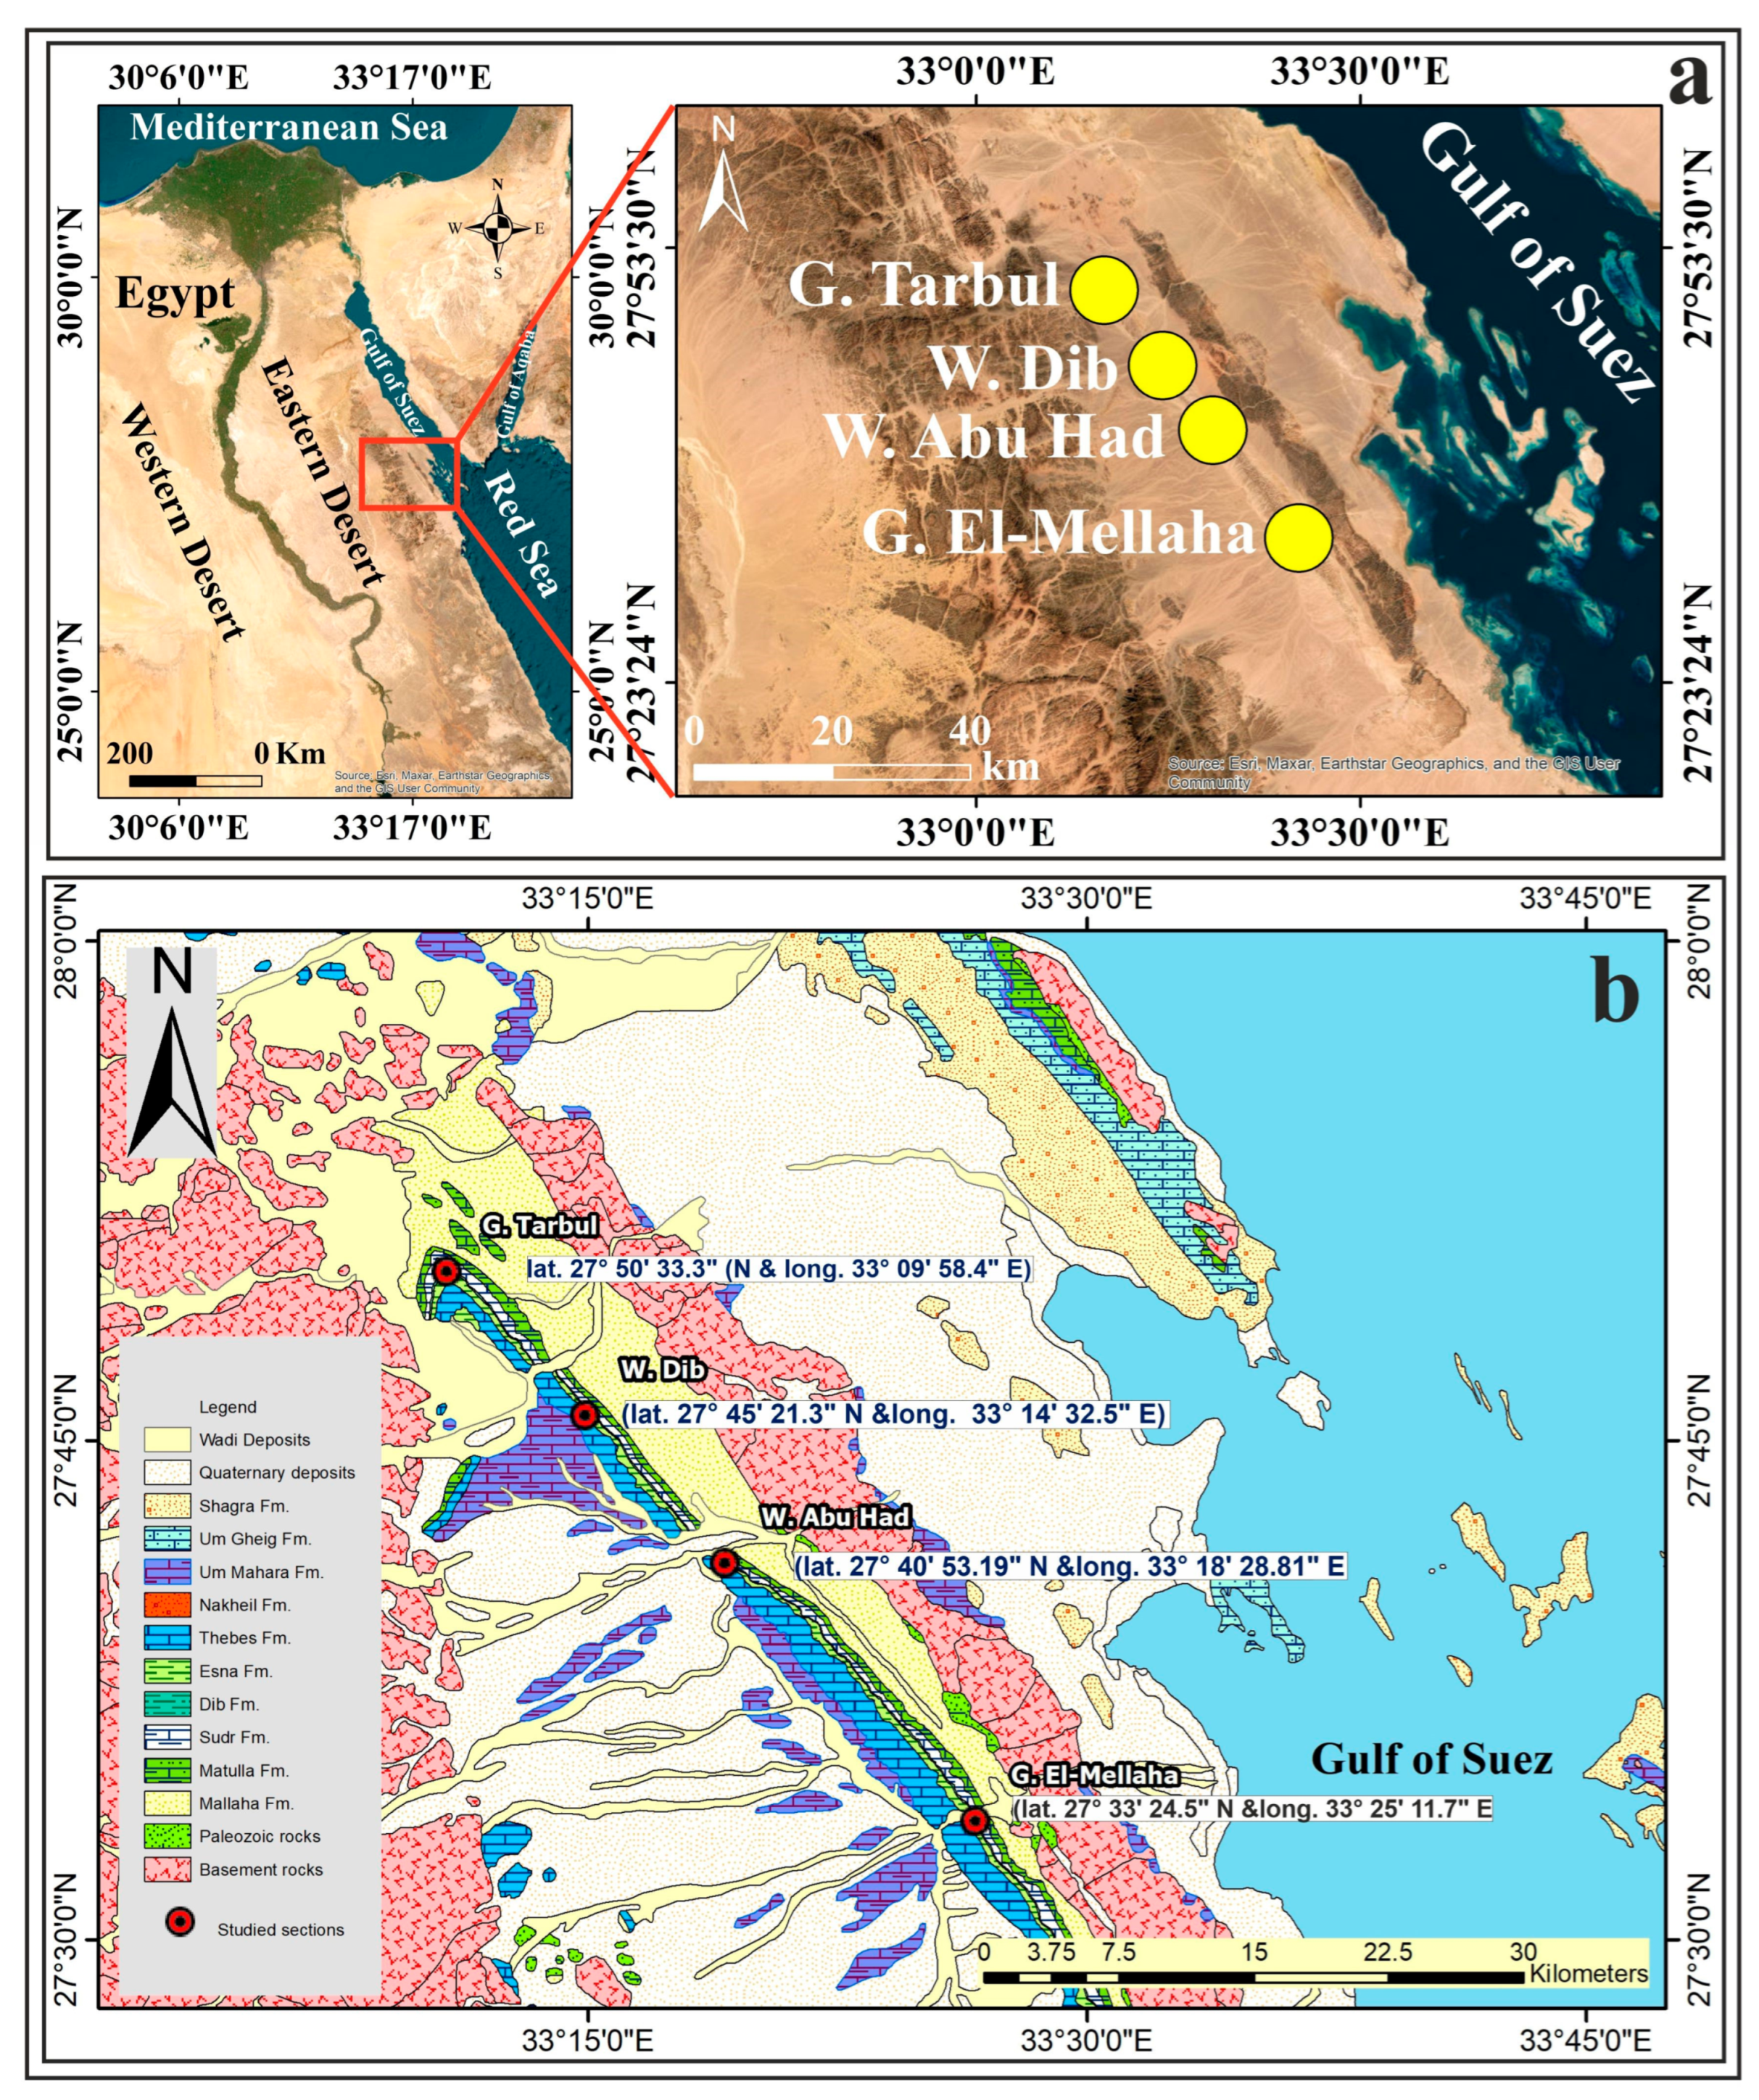
Figure 1. (a) Location map of the study area and investigated sections; (b) geologic map showing the main rock units of Esh El-Mellaha area, G = Gabal; W = Wadi.
Jmse 14 01413 g001
Figure 2. Dendrogram of the R-mode cluster analysis of the benthic foraminiferal species recorded in the study area.
Jmse 14 01413 g002
Figure 3. Relative abundance of the identified benthic foraminiferal species: (a) Gabal El-Mellaha section; (b) Gabal Wadi Abu Had section.
Jmse 14 01413 g003
Figure 4. Relative abundance of the identified benthic foraminiferal species: (a) Gabal Wadi Dib section; (b) Gabal Tarbul section.
Jmse 14 01413 g004
Figure 5. Litho- and biostratigraphic columnar section of (GM) section showing foraminiferal indices TFN (individuals/g), P/B%, C/A%, E/I%, BFOI, seafloor oxygenation, diversity indices, and benthic foraminifera-based paleodepth reconstruction.
Jmse 14 01413 g005
Figure 6. Litho- and biostratigraphic columnar section of the (WH) section showing foraminiferal indices TFN (individuals/g), P/B%, C/A%, E/I%, BFOI, seafloor oxygenation, diversity indices, and benthic foraminifera-based paleodepth reconstruction.
Jmse 14 01413 g006
Figure 7. Litho- and biostratigraphic columnar section of (WD) section foraminiferal indices TFN (individuals/g), P/B%, C/A%, E/I%, BFOI, seafloor oxygenation, diversity indices, and benthic foraminifera-based paleodepth reconstruction.
Jmse 14 01413 g007
Figure 8. Litho- and biostratigraphic columnar section of (GT) section showing foraminiferal indices TFN (individuals/g), P/B%, C/A%, E/I%, BFOI, seafloor oxygenation, diversity indices, and benthic foraminifera-based paleodepth reconstruction.
Jmse 14 01413 g008
Figure 9. The litho- and biostratigraphic columnar section of (GM) section showing microfacies photographs, depositional environments, and sequence-stratigraphic interpretations, CN = Cross Nicols; PP = Plane Polarized.
Jmse 14 01413 g009
Figure 10. Litho- and biostratigraphic columnar section of (WH) section showing microfacies photographs, depositional environments, and sequence-stratigraphic interpretations, CN = Cross Nicols; PP = Plane Polarized.
Jmse 14 01413 g010
Figure 11. The litho- and biostratigraphic columnar section of (WD) showing microfacies photographs, depositional environments, and sequence-stratigraphic interpretations, CN = Cross Nicols; PP = Plane Polarized.
Jmse 14 01413 g011
Figure 12. Litho- and biostratigraphic columnar section of (GT) section, showing microfacies photographs, depositional environments and sequence-stratigraphic interpretations, CN = Cross Nicols; PP = Plane Polarized.
Jmse 14 01413 g012
Figure 13. Comparison of the relative sea-level curve and depositional sequences identified in the studied sections with equivalent sequences of Hardenbol et al. [77] across the Cretaceous–Eocene interval.
Jmse 14 01413 g013
Disclaimer/Publisher’s Note: The statements, opinions and data contained in all publications are solely those of the individual author(s) and contributor(s) and not of MDPI and/or the editor(s). MDPI and/or the editor(s) disclaim responsibility for any injury to people or property resulting from any ideas, methods, instructions or products referred to in the content.