1. Introduction
Sea surface temperature (SST) plays a critical role in air–sea interactions and is influenced by thermal and dynamic oceanic processes as well as air–sea coupling [
1]. SST datasets are widely used in climate change research, marine biogeochemical studies, and fisheries analyses [
2]. In addition, SST provides an essential boundary condition for numerical weather prediction and ocean forecasting systems [
3,
4]. With the increasing demand for high-precision marine environmental monitoring, Level-4 (L4) SST products generated through the assimilation of multi-source satellite observations using advanced objective analysis methods have become essential datasets for scientific applications. However, coastal regions characterized by complex hydrodynamics, strong temporal variability, and land contamination remain challenging for global SST products. Therefore, systematic evaluation of L4 SST accuracy in coastal environments is essential for reliable oceanographic applications.
SST observations have been conducted for over 150 years [
5], initially based on in situ measurements from ships, buoys, and offshore platforms, which provide high accuracy but limited spatial and temporal coverage [
6]. Since the 1970s, satellite remote sensing has enabled global SST monitoring using infrared and microwave sensors, offering high temporal resolution and near-global coverage. However, satellite-derived SST accuracy is affected by clouds, atmospheric conditions, viewing geometry, and sea state. Due to differences in sensors, retrieval algorithms, and spatial resolution, SST products from different platforms exhibit varying performance [
7].
Satellite SST products are generally classified into four levels. Level-1 data refer to brightness temperatures directly observed by sensors, while Level-2 products provide pixel-level SST retrievals. Level-3 products are gridded and quality-controlled datasets but often contain gaps due to clouds and land contamination. To address these limitations, L4 SST products are produced through objective analysis and data assimilation to generate gap-free fields [
8]. The Group for High-Resolution Sea Surface Temperature (GHRSST) provides a suite of global L4 SST products from different institutions [
9]. However, differences in input data, processing methods, and quality control procedures lead to regional variations in product accuracy [
10].
Numerous studies have evaluated the accuracy and applicability of satellite-derived SST products at both global and regional scales. At the global scale, substantial discrepancies among SST products have been reported in regions with strong thermal gradients or sparse observations. These differences are mainly attributed to variations in input data sources, retrieval algorithms, and data assimilation strategies [
11,
12]. In general, multi-source merged SST products exhibit higher accuracy and greater temporal stability than single-sensor infrared or microwave products [
13,
14]. In addition, certain long-term datasets, such as HadISST2 and MGDSST, are more suitable for climate-scale applications, whereas SST CCI products are better suited for high-resolution regional studies [
15]. Microwave-based SST products may also exhibit systematic biases under specific environmental conditions, particularly during daytime under low wind speed conditions [
16]. However, these global-scale assessments do not fully capture the performance of SST products in coastal and marginal seas, where ocean dynamics and environmental conditions are substantially more complex.
To address this limitation, increasing attention has been given to the evaluation of satellite SST products using in situ observations from buoys, drifters, research vessels, coastal stations, and unmanned surface vehicles. Studies have shown that microwave-based products (e.g., TMI), infrared-based products (e.g., AVHRR and MODIS), and multi-source L-4 products (e.g., MUR and OSTIA) consistently exhibit decreasing accuracy from offshore to nearshore regions. This degradation is particularly evident in dynamically complex coastal environments, where product performance is strongly influenced by sensor characteristics, interpolation methods, and quality control procedures [
17,
18]. This degradation is mainly attributed to cloud and fog contamination, precipitation, land contamination, sea surface roughness, and complex coastal hydrodynamic processes [
9]. This offshore-to-nearshore degradation has been widely reported in many coastal regions worldwide, including the South China Sea and the East China Sea in the Northwest Pacific [
19,
20,
21,
22,
23,
24,
25], as well as the Western Mediterranean [
26], the U.S. West Coast [
20], and the Brazilian shelf [
27].
The coastal waters surrounding the Shandong Peninsula, located between the Bohai Sea and the Yellow Sea, constitute a dynamically complex marginal sea. SST variability in this region is jointly influenced by shallow bathymetry, strong tidal mixing, monsoonal forcing, seasonal water-mass exchanges, and multiple coastal current systems. In addition, the intricate coastline, numerous semi-enclosed bays, river discharge, suspended sediments, and optically complex coastal waters, together with frequent cloud and aerosol contamination, increase the uncertainty of satellite-derived SST retrievals, particularly in nearshore areas. Although global L4 SST products have been widely applied in regional oceanographic studies, their performance in the coastal waters of the Shandong Peninsula has not been comprehensively evaluated using both offshore and nearshore in situ observations. Therefore, a systematic assessment of these products is essential for understanding their applicability in this representative coastal environment and for supporting regional marine environmental monitoring and operational applications.
Therefore, this study aims to (1) evaluate the accuracy of four widely used global L4 SST products in the coastal waters surrounding the Shandong Peninsula; (2) examine their spatial and statistical differences using both iQuam and regional buoy observations; and (3) assess their suitability for coastal and climate-related applications. The rest of this paper is organized as follows:
Section 2 describes the materials and methods used in this study,
Section 3 analyses the results,
Section 4 provides a comprehensive discussion, and
Section 5 presents the conclusion.
2. Materials and Methods
2.1. Study Area
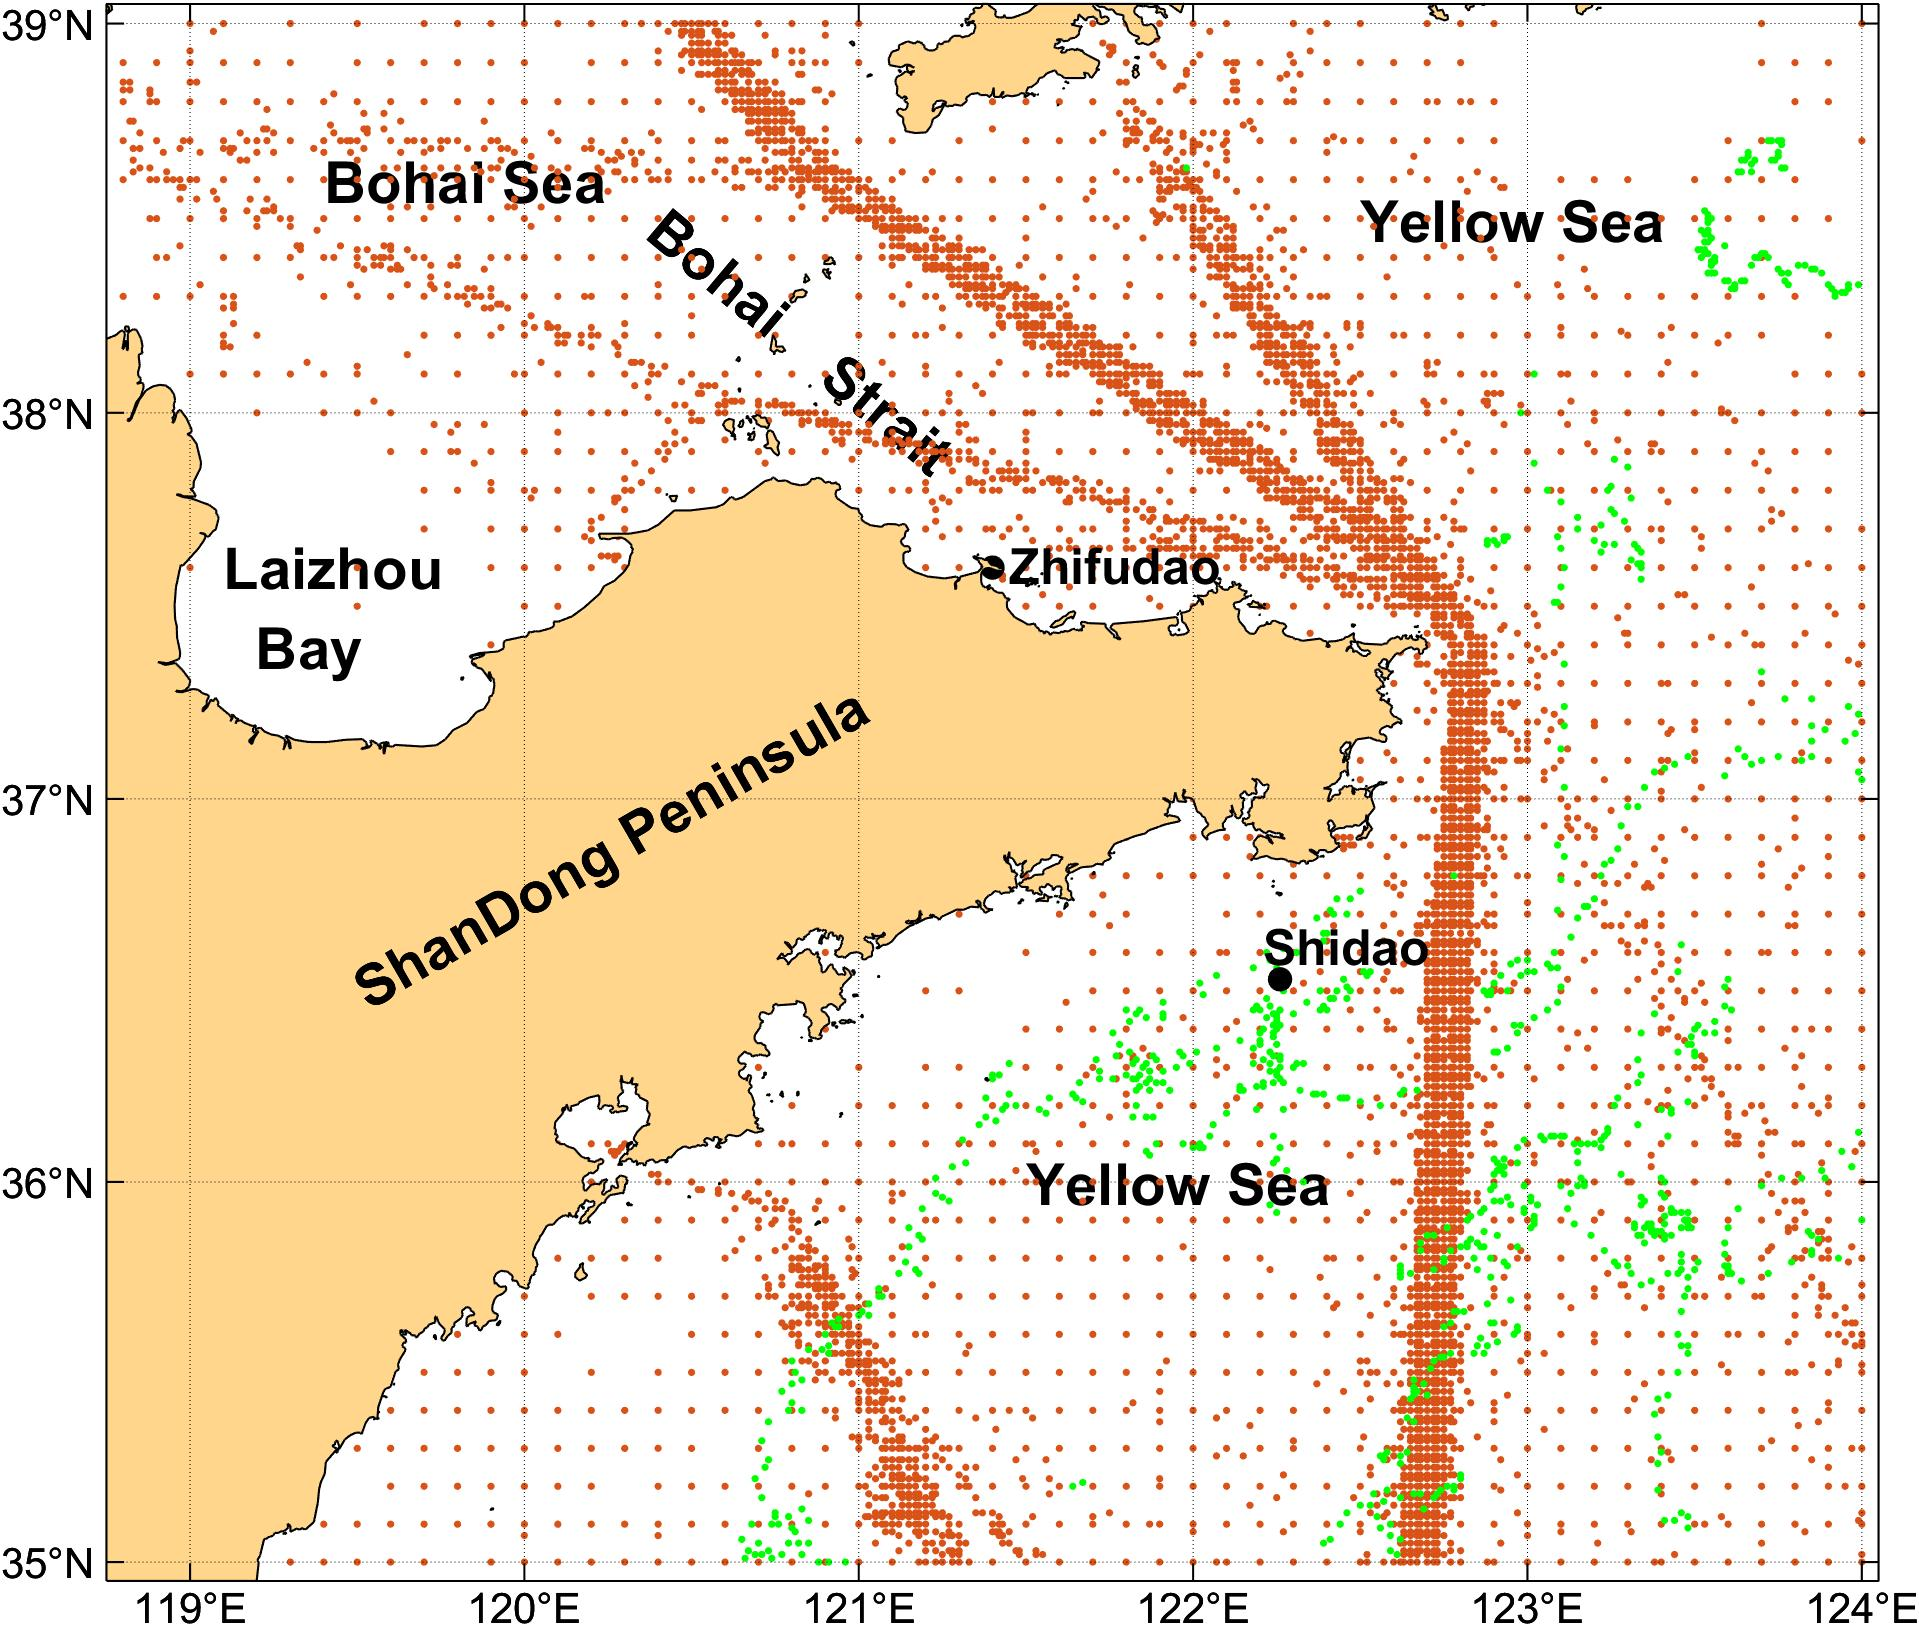
The study area covers the coastal waters surrounding the Shandong Peninsula (35–37.5° N, 119–123.5° E). The peninsula is bordered by the Laizhou Bay in the Bohai Sea, the Bohai Strait, and the Yellow Sea (
Figure 1). The Bohai Sea is the innermost semi-enclosed shallow sea of China, covering an area of approximately 77,000 km
2 with an average depth of about 18 m. It is connected to the Yellow Sea through the Bohai Strait. The Yellow Sea covers approximately 380,000 km
2, with an average depth of about 44 m and a maximum depth of nearly 140 m [
28].
SST in this region exhibits strong seasonal and spatial variability, driven by the combined influence of oceanic and atmospheric forcing. The dominant controlling processes include riverine input, monsoonal forcing, tidal mixing, and coastal circulation, which together shape the large-scale SST distribution. At the regional scale of the Shandong Peninsula, SST variability is further regulated by tidal mixing-induced modifications of vertical stratification [
29], coastal currents that govern horizontal heat transport and thermal front development [
30], and the seasonal evolution of water masses such as the Yellow Sea Cold Water Mass and the Qingdao Cold Water Mass [
31]. On the other hand, oceanic horizontal advection, surface heat fluxes, and mesoscale SST–wind coupling processes jointly modulate local SST variability [
32].
2.2. Global L4 Satellite SST Data
The Copernicus Climate Change Service SST (C3SSST) product is a global gap-free L4 daily sea surface temperature dataset with a spatial resolution of 0.05°. It is generated using the Danish Meteorological Institute Optimal Interpolation (DMIOI) system by combining multi-source infrared and microwave satellite observations, including data from the (A) ATSR series, SLSTR, AVHRR, AMSR-E, and AMSR2, together with sea ice surface temperature products [
33,
34,
35,
36,
37]. The dataset covers the global ocean, sea ice, and marginal ice zones from September 1981 to December 2024, with data available at
https://doi.org/10.48670/moi-00169 (accessed on 8 September 2025).
The Operational Sea Surface Temperature and Sea Ice Analysis (OSTIA) product provided by CMEMS is a global L4 daily gap-free SST dataset with a spatial resolution of 0.05°. It is generated by merging multi-source satellite observations from ESA SST CCI, C3S, EUMETSAT, and REMSS with in situ observations from the HadIOD dataset using the OSTIA system [
38]. The dataset covers the global ocean and selected lakes from 1 October 1981 to 18 December 2025 and is available at
https://doi.org/10.48670/moi-00168 (accessed on 4 June 2023).
The Merged satellite and in situ data Global Daily SST (MGDSST) product, produced by the Japan Meteorological Agency (JMA), is a global daily gap-free SST dataset with a spatial resolution of 0.25° [
39]. It combines multi-source infrared and microwave satellite observations, including AVHRR, VIIRS, AMSR-E, WindSat, and AMSR2, together with in situ measurements from ships and buoys. Bias correction is applied using in situ observations to improve the consistency of satellite-derived SSTs. The dataset covers the period from January 1982 to the present and is available at
https://www.data.jma.go.jp/goos/data/pub/JMA-product/mgd_sst_glb_D/ (accessed on 23 April 2025).
The NOAA Optimum Interpolation SST (OISST) product is a global daily L4 SST analysis dataset with a spatial resolution of 0.25°. It integrates observations from satellites, ships, buoys, and Argo floats using an optimum interpolation approach to generate a spatially complete SST field. The product applies buoy-based bias correction to reduce systematic differences among observation platforms and sensors [
17]. The latest version, OISST v2.1, includes improvements in in situ data coverage, satellite inputs, and sea ice correction schemes. The dataset covers from September 1981 to the present, and is available at
https://www.ncei.noaa.gov/data/sea-surface-temperature-optimum-interpolation/v2.1/access/avhrr/ (accessed on 24 June 2025).
In this study, all L4 SST datasets were uniformly extracted for the period 1 January 1982 to 31 December 2021, covering a continuous 40-year time series.
2.3. iQuam SST Data
The In situ Sea Surface Temperature Quality Monitor (iQuam) dataset, developed by the NOAA Satellite Applications and Research Center (STAR), is widely used for the calibration and validation of satellite-derived SST products within the GHRSST framework [
40,
41,
42]. The latest version (v2.10) integrates quality-controlled in situ observations from multiple platforms, including Argo floats, drifting buoys, moored buoys, ship measurements, and Coral Reef Watch (CRW) buoys. These observations undergo unified quality control procedures to ensure data consistency and reliability. In the iQuam dataset, SST observations are assigned quality levels ranging from 1 to 5, with level 5 representing the highest data quality. In this study, only quality level-5 SST observations were used to ensure the reliability of the validation dataset. The dataset covers from September 1981 to May 2025 and was obtained from the NOAA STAR website (
http://www.star.nesdis.noaa.gov/sod/sst/iquam/) (accessed on 1 June 2025).
For consistency with the satellite SST datasets used in this study, iQuam in situ observations also span from 1 January 1982 to 31 December 2021 and contain a 40-year validation dataset.
Figure 1 shows the spatial distribution of the iQuam observations. Ship-based measurements cover most areas of the Bohai Sea and Yellow Sea, while drifting buoys are mainly concentrated in the southern Yellow Sea.
The iQuam dataset provides in situ SST observations covering the period from 1982 to 2021. Rather than representing a temporally continuous time series at individual locations, it consists of discrete observations collected from multiple observing platforms over four decades.
2.4. Coastal Buoy Data Along Shandong Peninsula
The observational SST data used in this study were obtained from the National Marine Big Data Service (iOcean) of China, which provides quality-controlled observational datasets collected by the North Sea Bureau of the Ministry of Natural Resources of China. Three moored buoy (MB) stations located along the coast of the Shandong Peninsula were used: Zhifudao (121.40° E, 37.60° N) and Shidao (122.26° E, 36.53° N) (
Figure 1).
The Zhifudao station provides hourly hydrometeorological observations, including seawater temperature, salinity, wave parameters, air temperature, atmospheric pressure, relative humidity, and wind. Before calculating daily mean SST values, the hourly water temperature observations from Zhifudao were screened using the 3σ criterion to remove potential outliers. The Shidao stations provide quality-controlled wave observations together with routine surface water temperature and salinity measurements at 08:00, 12:00, and 20:00 local time each day, and these observations were directly averaged to the daily mean SST. At all three stations, water temperature is measured using sensors installed at a depth of 0.5 m below the sea surface, with a measurement range of −5 to 40 °C and an accuracy of ±0.2 °C.
To ensure consistency with the daily satellite SST products, all buoy observations were averaged to daily means. Missing values, identified by the default flag value of 999.9, were excluded during the averaging process. Among the available records, observations from 1 January 2015 to 30 June 2020 provide the best temporal continuity across all three stations and were therefore selected as an independent validation dataset in addition to the iQuam observations. The processed buoy data are available from the National Marine Big Data Service (iOcean) via
https://oceancloud.nmdis.org.cn/home (accessed on 1 July 2026).
2.5. Evaluation Methods
To evaluate the performance of the four L4 SST products, the mean absolute error (MAE), root mean square error (RMSE), correlation coefficient (COR), and mean bias (BIAS) were calculated against in situ observations. Since the L4 SST products are provided on regular latitude–longitude grids, bilinear interpolation was applied to extract SST values at the locations of iQuam observations and buoy measurements. Identical matchup samples were used for all products to ensure a consistent comparison. Based on these matched datasets, the accuracy of the four SST products was quantitatively assessed using the statistical metrics described below.
For uncertainty estimation of the evaluation metrics, a block bootstrap approach was applied to account for the potential temporal dependence of SST observations. For iQuam matchups, the observations were first processed into daily discrete matchup datasets, and monthly blocks were used as resampling units, with all observations within the same calendar month treated as one block. For two buoy observations, weekly blocks were adopted due to their continuous measurements and stronger short-term temporal dependence. In both cases, blocks were randomly sampled with replacement to generate resampled datasets for 2000 iterations. The 95% confidence intervals (CIs) were derived from the 2.5th and 97.5th percentiles of the bootstrap distributions.All data processing and statistical analyses were performed using Python (Version 3.12) with the following main packages: NumPy (Version 1.26.4), Pandas (Version 2.2.2), Matplotlib (Version 3.9.2), Cartopy (Version 0.25.0), NetCDF4 (Version 1.7.4), Xarray (Version 2023.6.0), and SciPy (Version 1.13.1).
3. Results
3.1. Dataset Characteristics
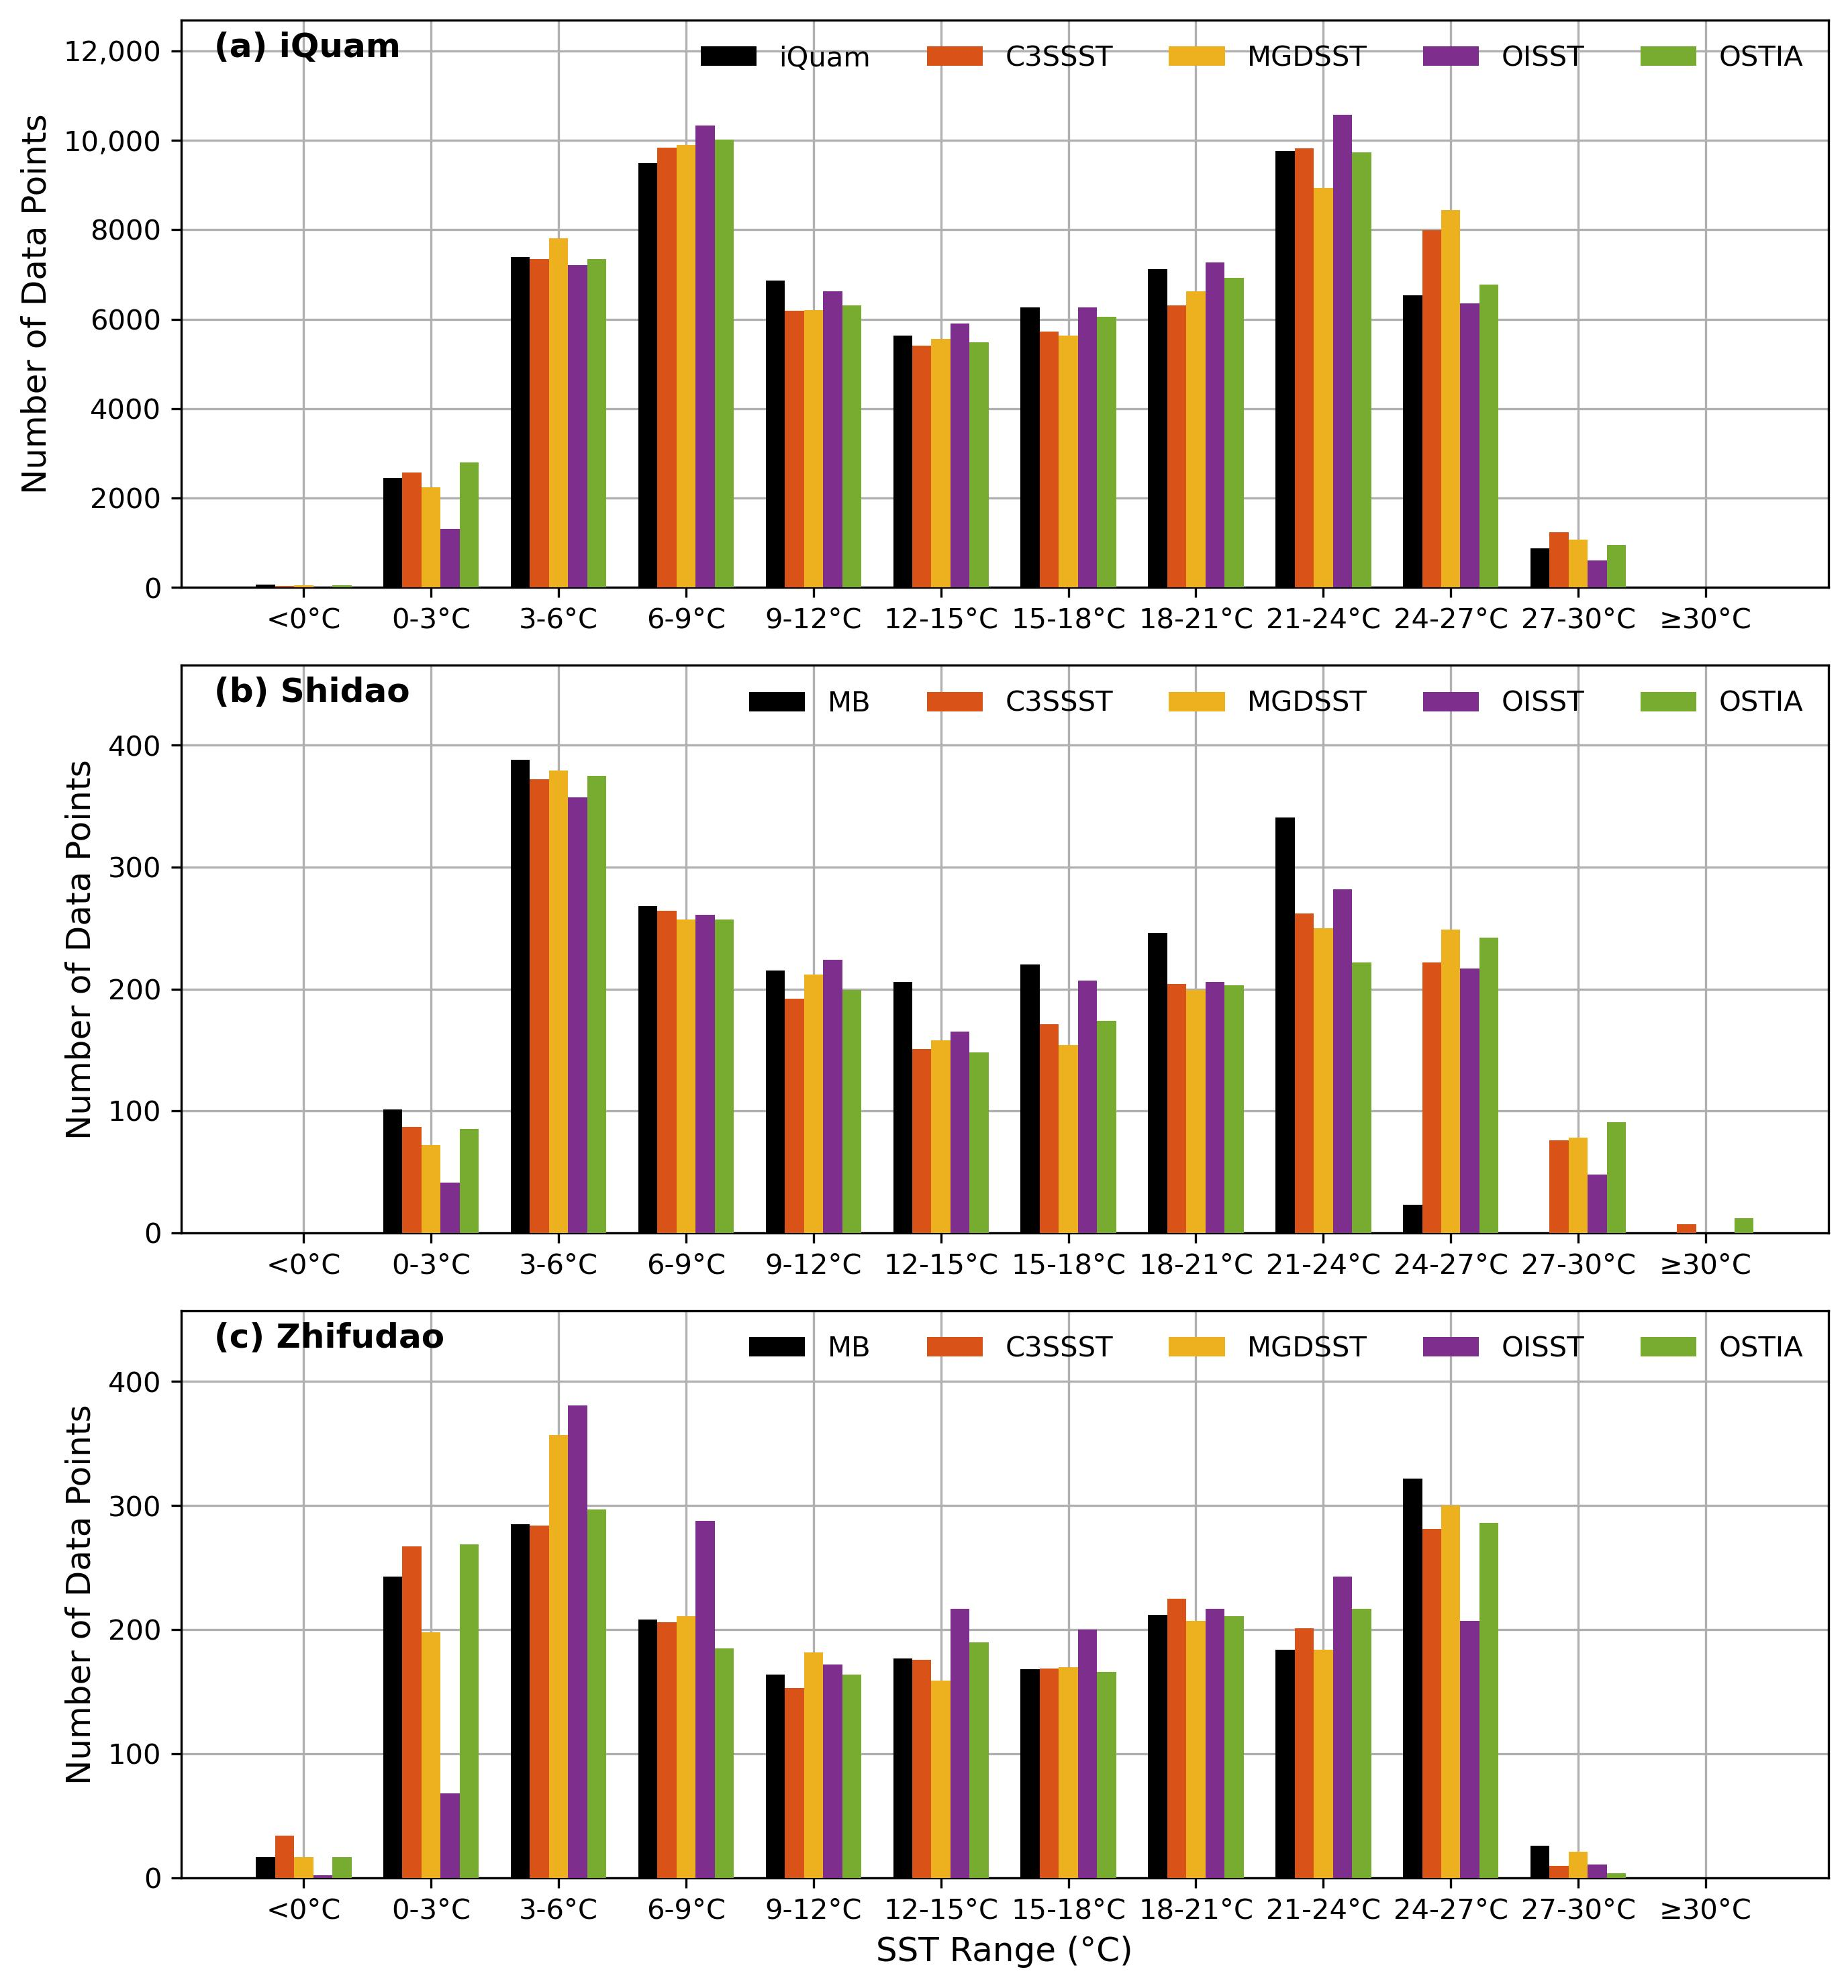
The SST range distribution of the matched datasets between the L4 SST products and in situ observations is shown in
Figure 2. For the iQuam matchup dataset (
Figure 2a), the SST frequency distributions of the four L4 SST products (C3SSST, MGDSST, OISST, and OSTIA) closely resemble those of the iQuam observations, with most matchups occurring within the 0–30 °C range. A bimodal distribution is observed, with relatively high frequencies in the 6–9 °C and 21–24 °C intervals, while extremely low (<0 °C) and high (>30 °C) temperatures account for only a small fraction of the matchups. Similar distribution patterns are also observed at the two representative stations (
Figure 2b,c). At the Shidao station (
Figure 2b), matchups are mainly distributed between 3 °C and 27 °C, with higher frequencies in the 3–6 °C and 21–24 °C intervals. The four SST products show slightly higher occurrence frequencies than MB observations in the 24–30 °C range, while SST values above 30 °C are rare. At the Zhifudao station (
Figure 2c), the temperature distribution extends from below 0 °C to approximately 30 °C, with dominant frequencies in the cold season (3–6 °C) and warm season (24–27 °C) intervals. Overall, the four L4SST products reproduce the major thermal distribution characteristics of the in situ observations, demonstrating their capability to represent SST variability across different oceanic environments. Detailed matchup statistics for different SST ranges are summarized in
Table 1.
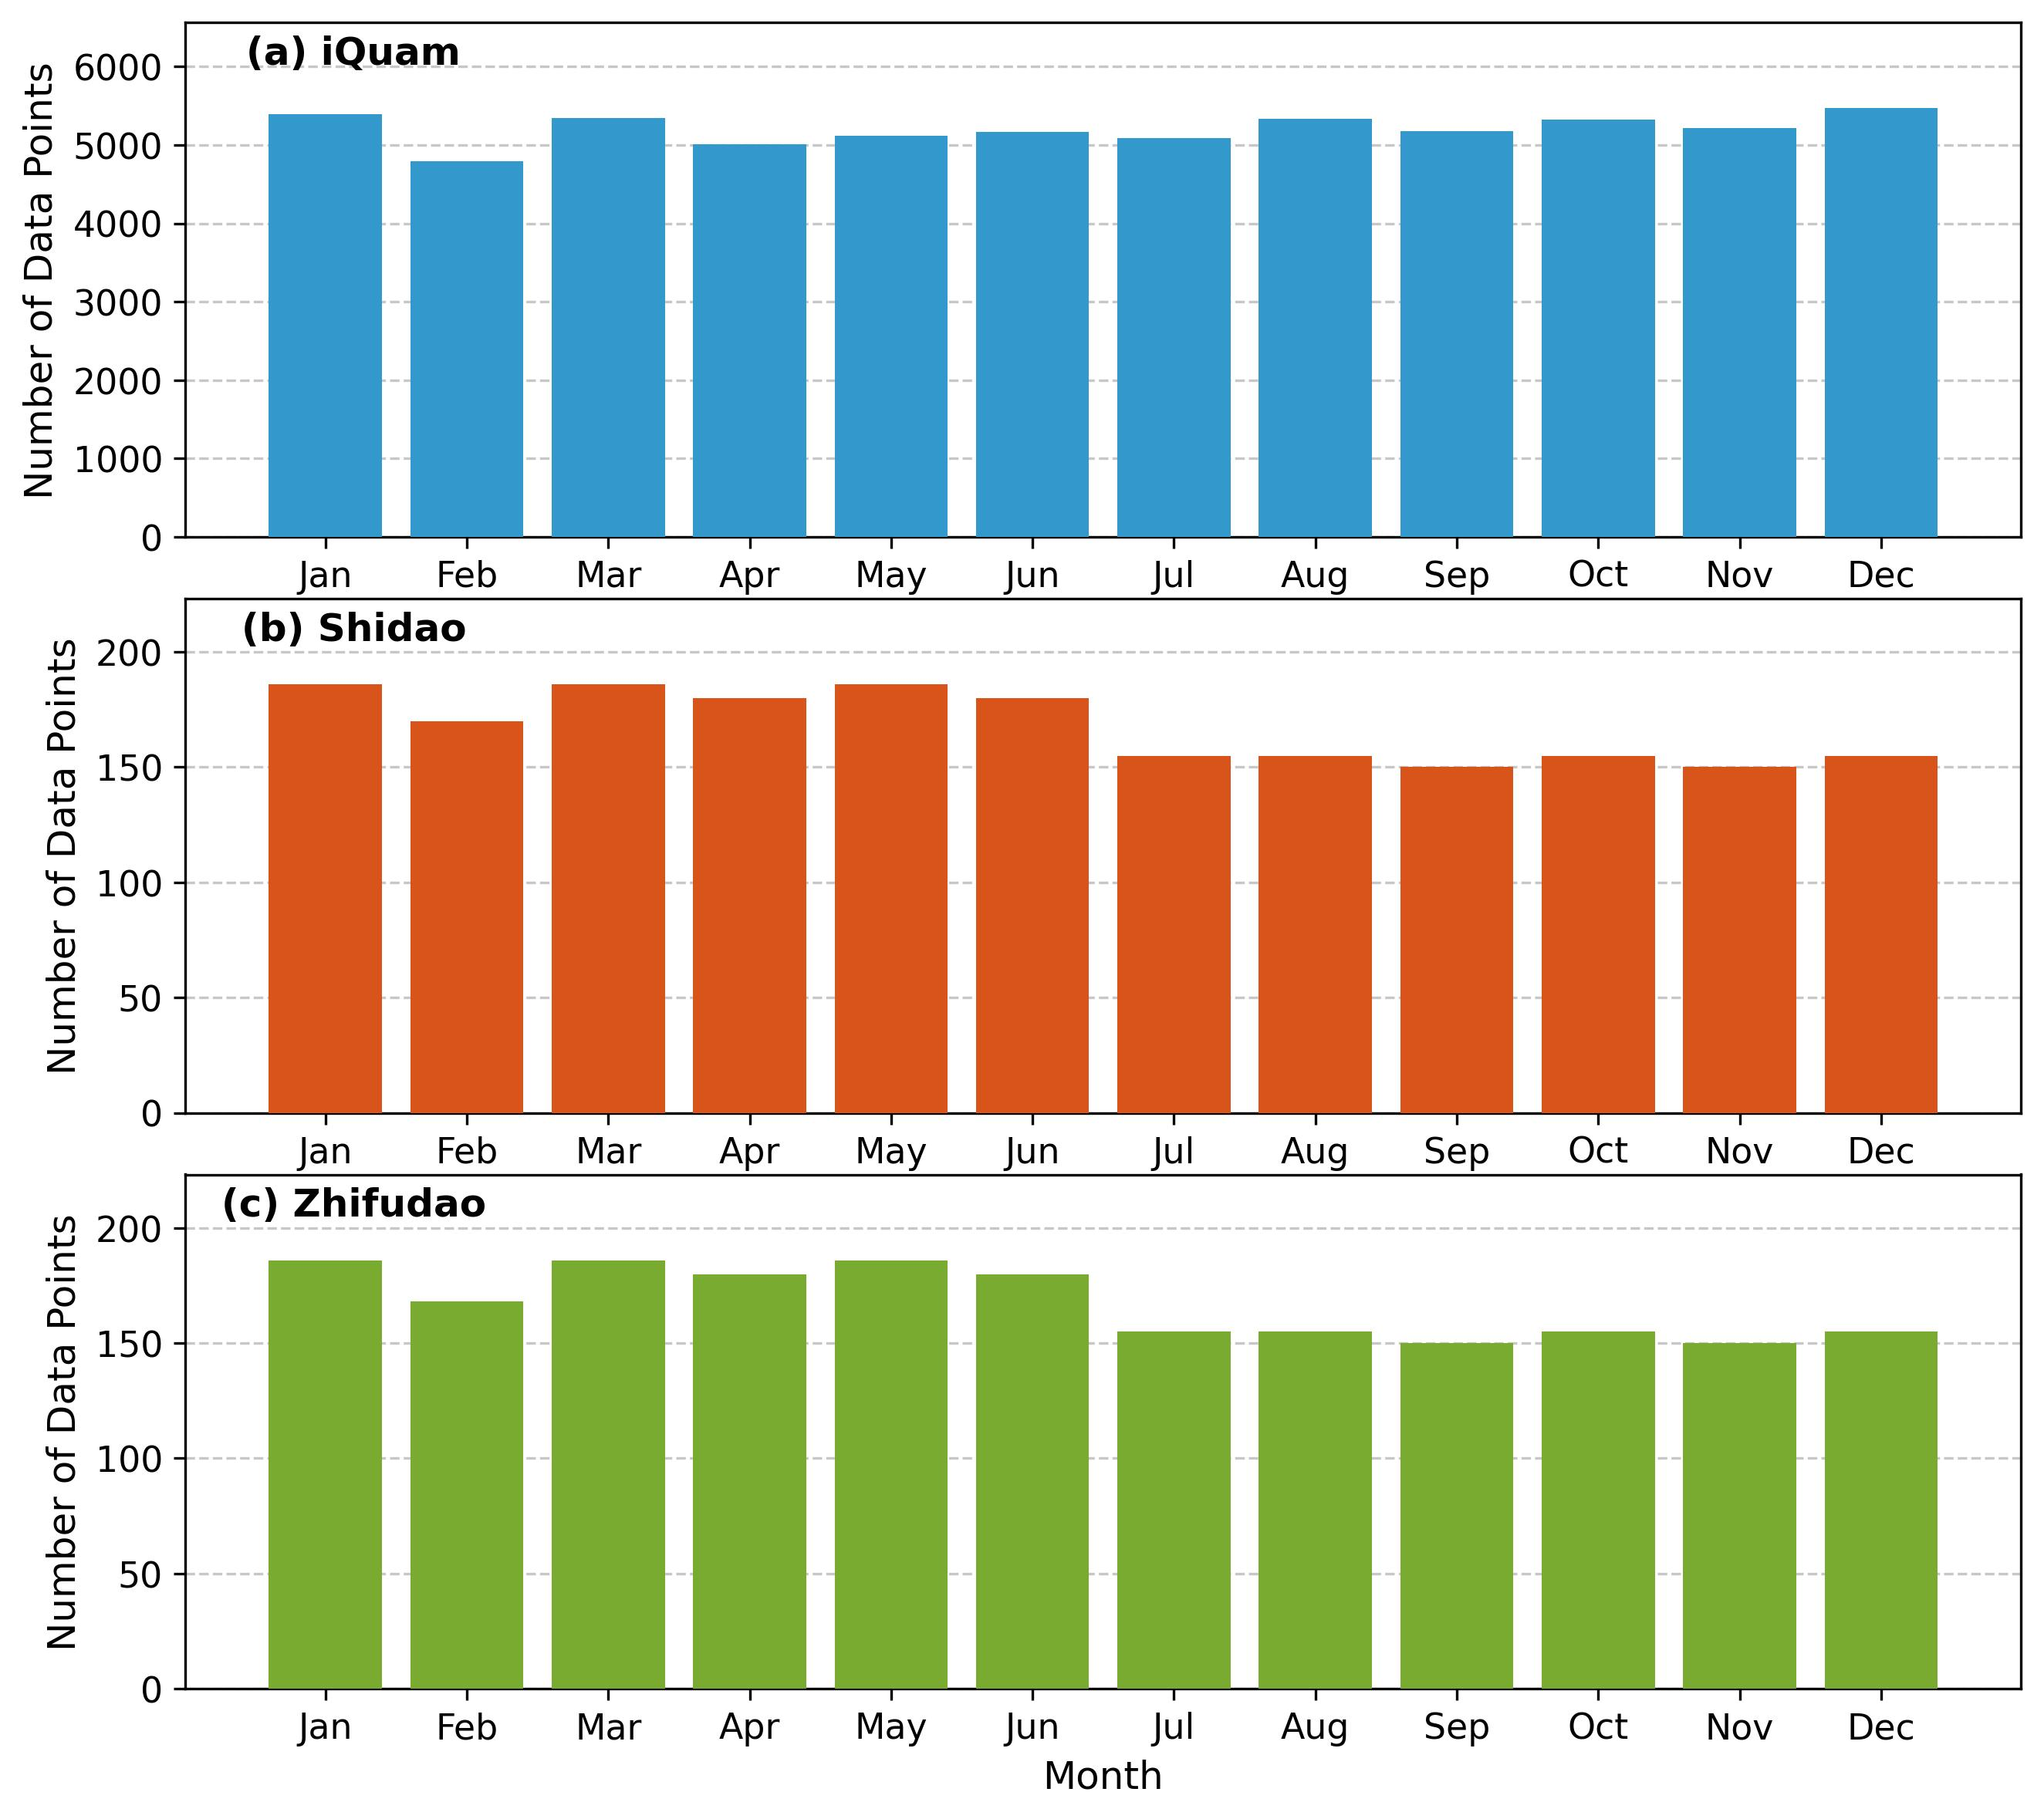
Figure 3 illustrates the monthly distribution of the matched datasets. The iQuam observations provide year-round coverage, with relatively uniform monthly sampling ranging from approximately 4300 to 5900 matchups per month. Similarly, the two moored buoy stations (Shidao and Zhifudao) contain observations in all 12 months, with approximately 150–186 matchups per month, although their sampling density is lower due to the shorter temporal coverage. The slight difference in February matchup numbers between the two buoy stations (170 for Shidao and 168 for Zhifudao) is attributed to missing observations on 29 February 2016 and 29 February 2020 in the Zhifudao dataset. To ensure a consistent comparison, the four satellite SST products were matched using the same in situ observations, resulting in identical matchup numbers for each product. The detailed matchup statistics by month are summarized in
Table 2.
3.2. Validation with iQuam Data
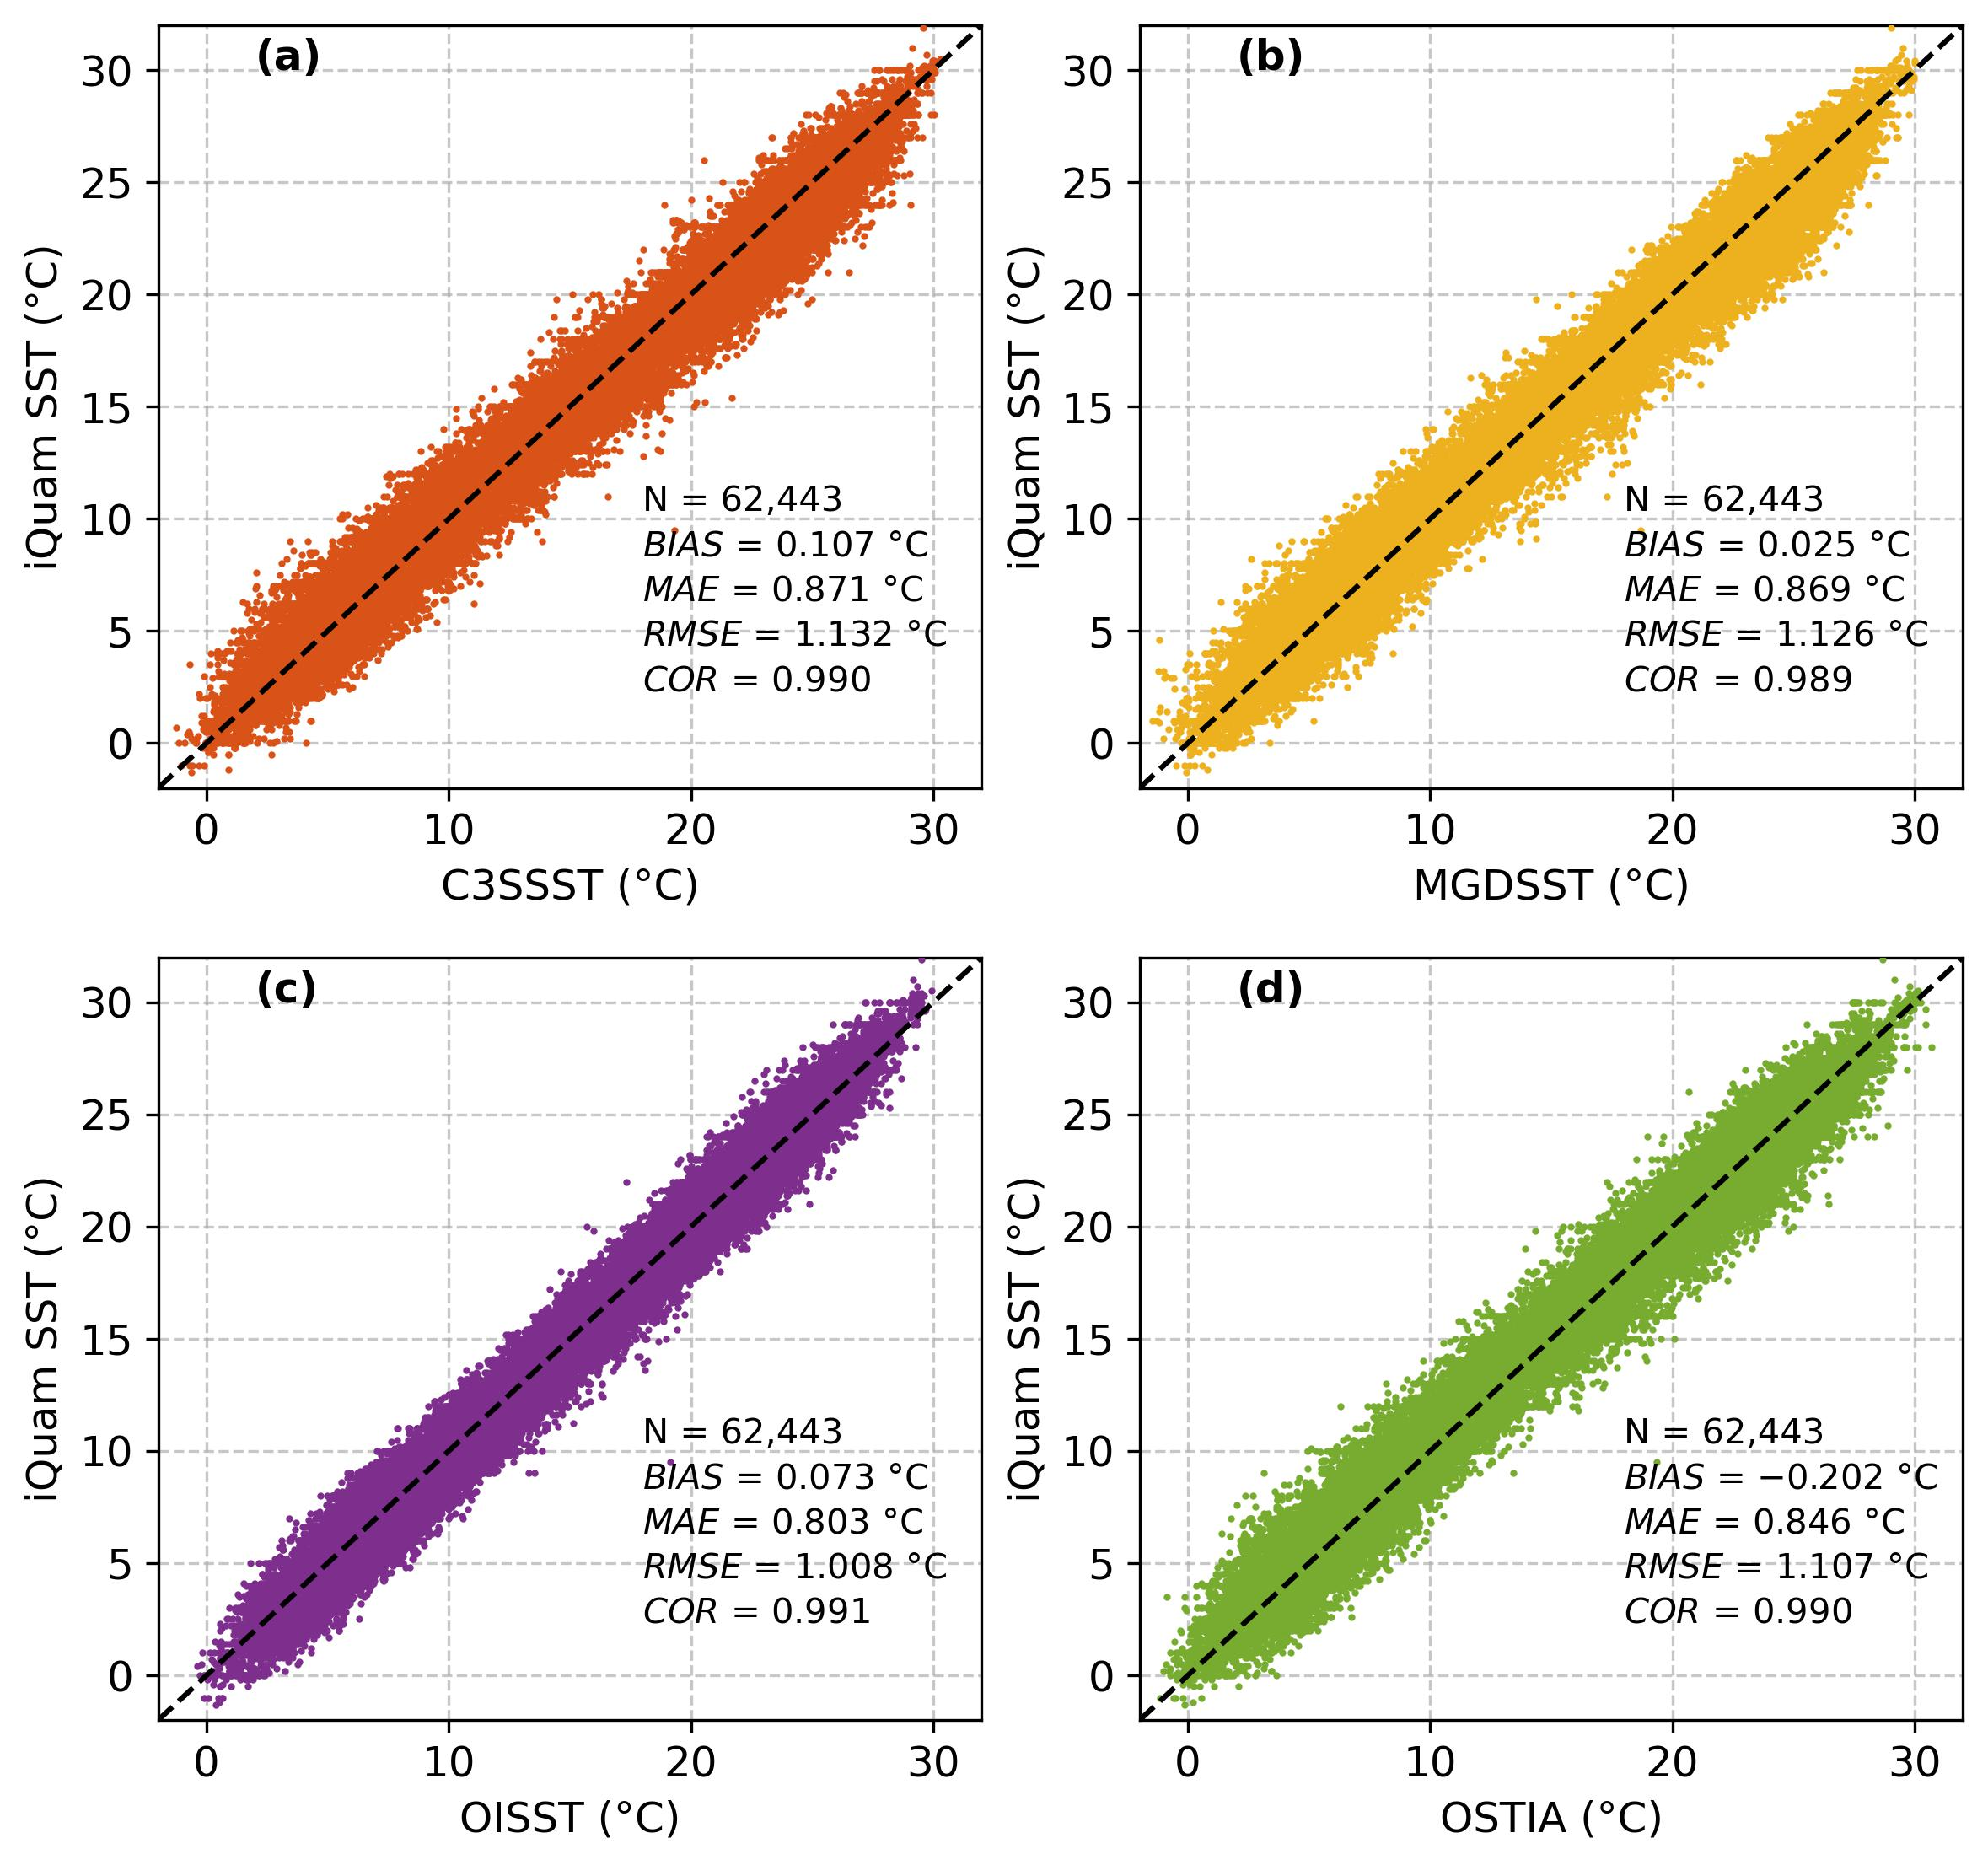
To evaluate the accuracy of the four L4 SST products in the coastal waters surrounding the Shandong Peninsula, satellite-derived SSTs were compared with iQuam observations using the same number of matchup samples (62,443) for each L4 SST product (
Figure 4). The uncertainties of the evaluation metrics were estimated using a monthly block bootstrap approach, and the corresponding 95% confidence intervals (CIs) are provided in
Table 3. The bias values ranged from −0.202 °C to 0.107 °C, indicating relatively small systematic deviations among the four products. OSTIA showed a cold bias (−0.202 °C), whereas C3SSST, MGDSST, and OISST exhibited weak warm biases of 0.107 °C, 0.025 °C, and 0.073 °C, respectively. The RMSE values ranged from 1.008 °C to 1.132 °C, while the MAE values ranged from 0.803 °C to 0.871 °C. Among the four products, OISST achieved the lowest RMSE (1.008 °C) and the smallest MAE (0.803 °C), indicating the closest agreement with the iQuam observations. In comparison, C3SSST showed the largest RMSE (1.132 °C), while MGDSST and OSTIA exhibited intermediate performance. All four products demonstrated strong correlations with the iQuam observations, with correlation coefficients ranging from 0.989 to 0.991, suggesting that the L4 SST products successfully captured the temporal variability of observed SST in the coastal waters surrounding the Shandong Peninsula.
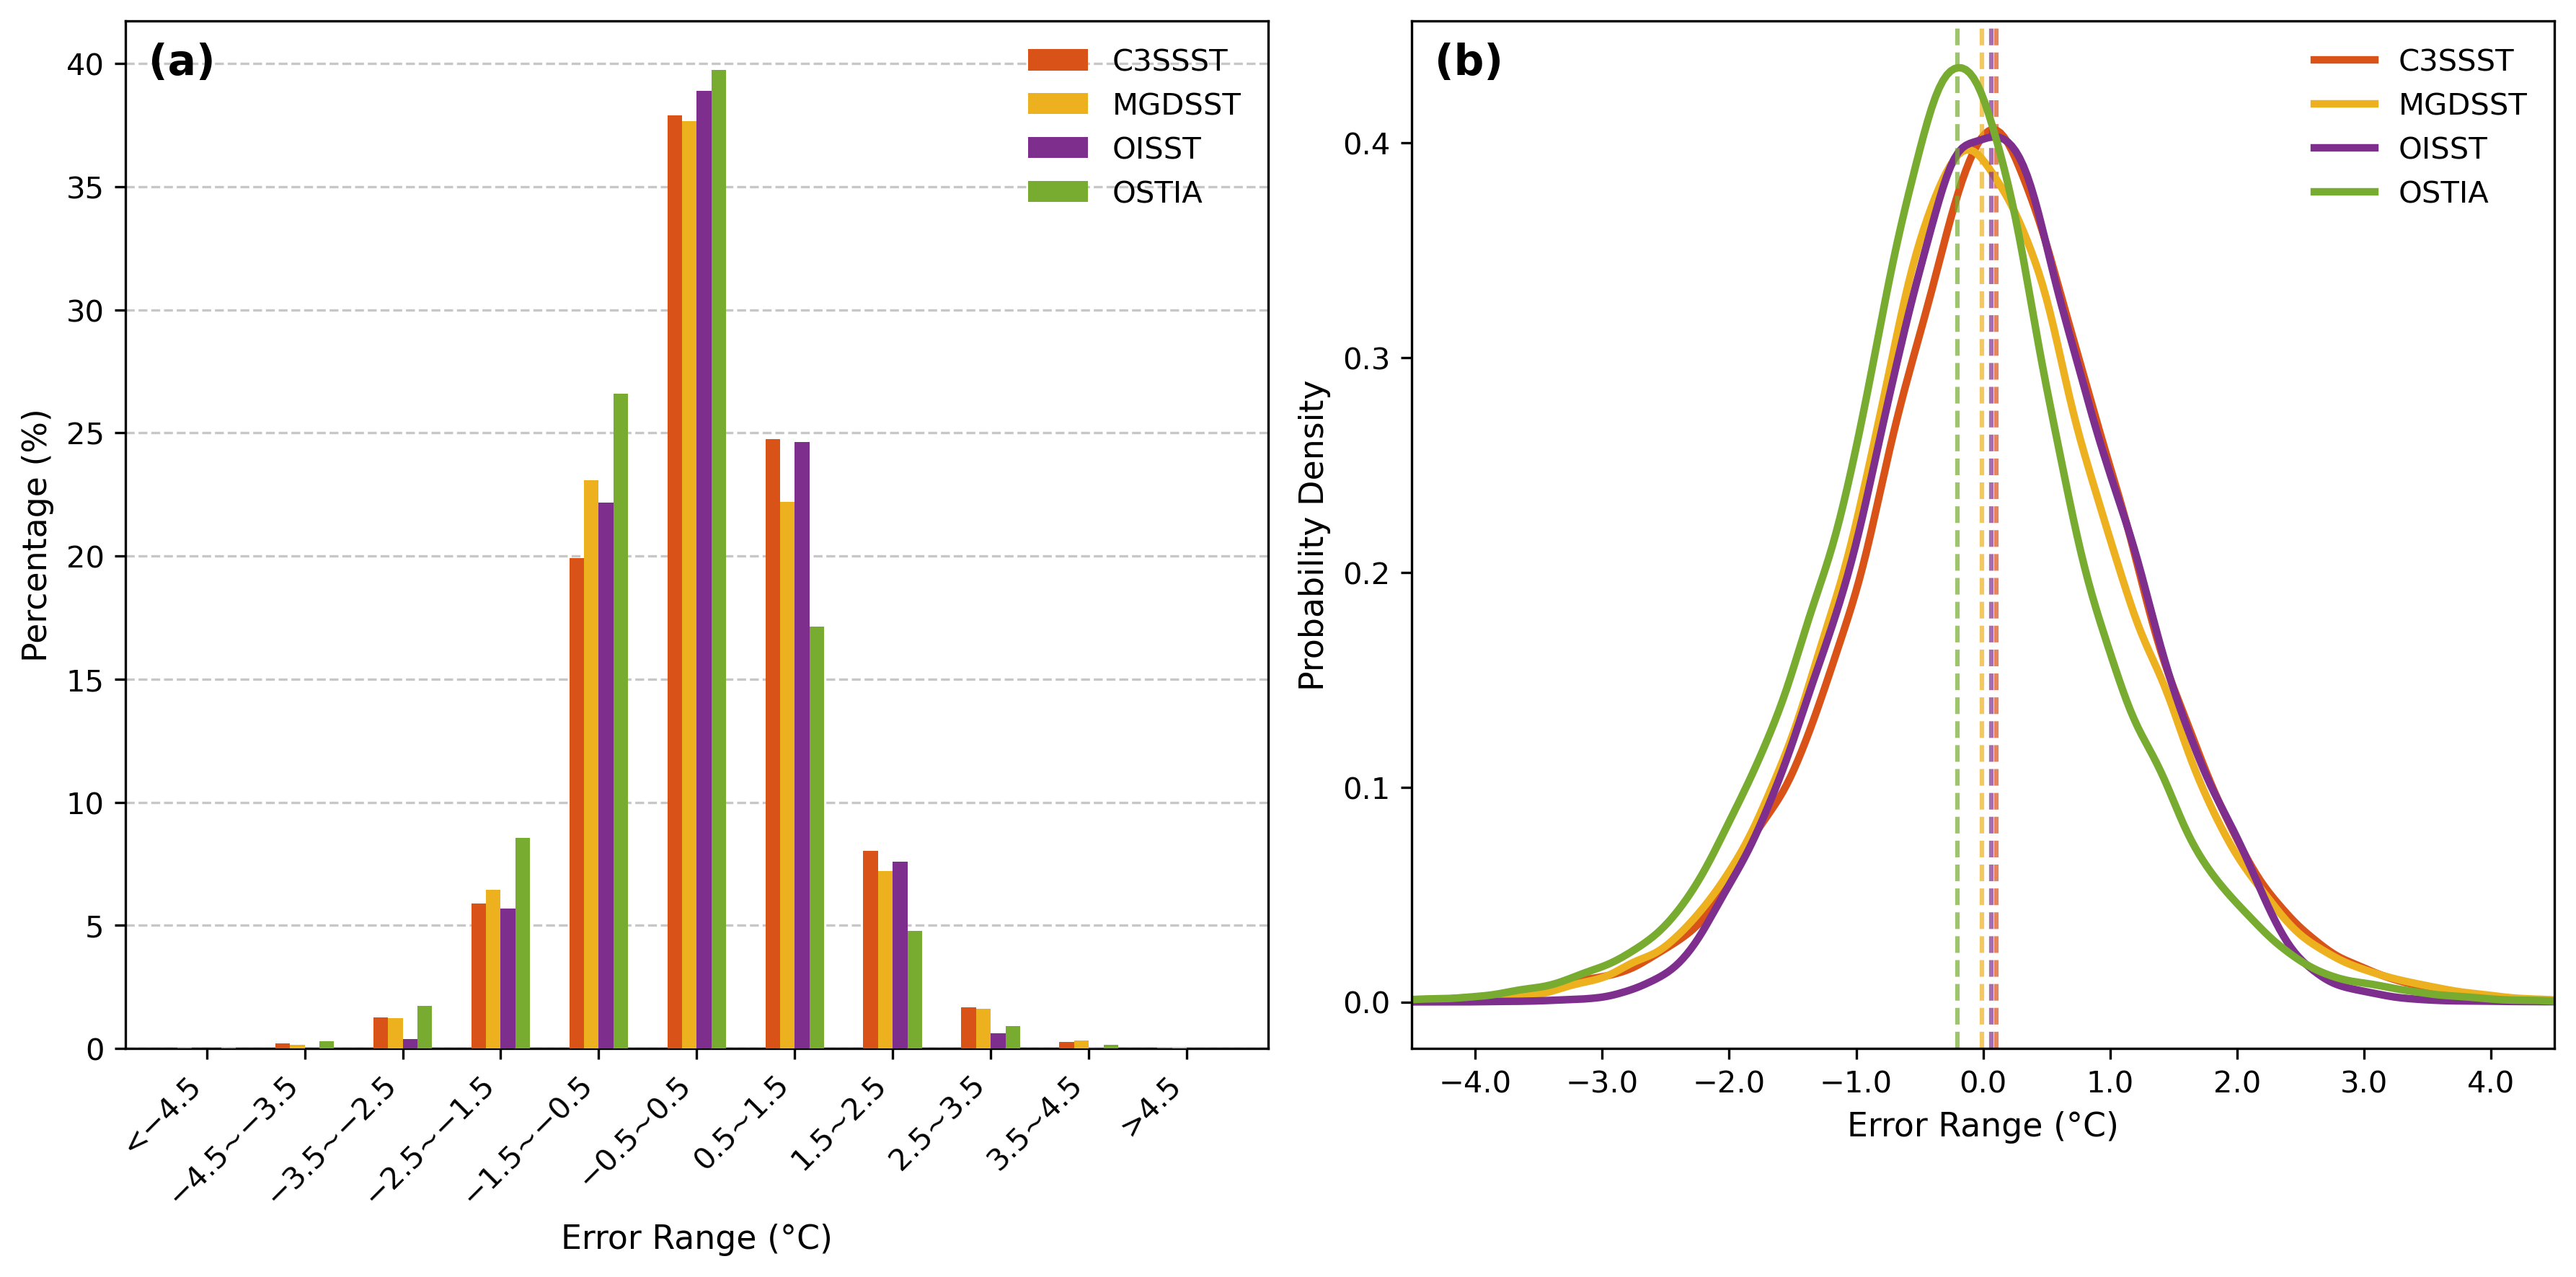
The frequency distributions of SST errors for the four L4 SST products are shown in
Figure 5a using a bin interval of 1 °C. For all products, the errors were mainly concentrated within the range of −2.5 °C to 2.5 °C, with the highest frequencies occurring in the −0.5 °C to 0.5 °C interval, indicating generally good agreement between the L4 SST products and iQuam observations. The proportions of matchup errors within the −0.5 °C to 0.5 °C interval were 37.90%, 37.67%, 38.89%, and 39.74% for C3SSST, MGDSST, OISST, and OSTIA, respectively. When considering the broader error range of −1.5 °C to 1.5 °C, the corresponding proportions increased to 82.58%, 82.94%, 85.69%, and 83.48%, respectively. Among the four products, OISST exhibited the highest proportion of errors within ±1.5 °C, consistent with its lowest RMSE and MAE values. Meanwhile, OSTIA showed the highest proportion of errors within ±0.5 °C, indicating that its errors were more concentrated around zero. In contrast, C3SSST and MGDSST showed slightly lower proportions of small errors, although more than 82% of their matchup errors were still within ±1.5 °C. Overall, the error distributions demonstrate that all four products generally reproduced the observed SST variations, with OISST showing better overall consistency and OSTIA exhibiting a more concentrated near-zero error distribution.
To further investigate the characteristics of the SST error distributions, kernel density estimation (KDE) and statistical moments were analyzed for each SST product, including mean bias and skewness (
Figure 5b). The skewness values for C3SSST, MGDSST, OISST, and OSTIA were −0.034, 0.140, 0.038, and 0.043, respectively. All skewness values were close to zero, indicating that the error distributions of the four L4 SST products were approximately symmetric, with no pronounced asymmetric tails. The KDE curves further show that the errors were mainly concentrated around the mean values, indicating relatively stable error characteristics among the four products. C3SSST, MGDSST, and OISST exhibited slight positive or negative deviations in their error distributions, whereas MGDSST showed the largest skewness magnitude; however, this asymmetry remained weak. Combined with the small bias values, these results indicate that the differences between the L4 SST products and iQuam observations were primarily associated with the magnitude of errors rather than substantial distributional asymmetry.
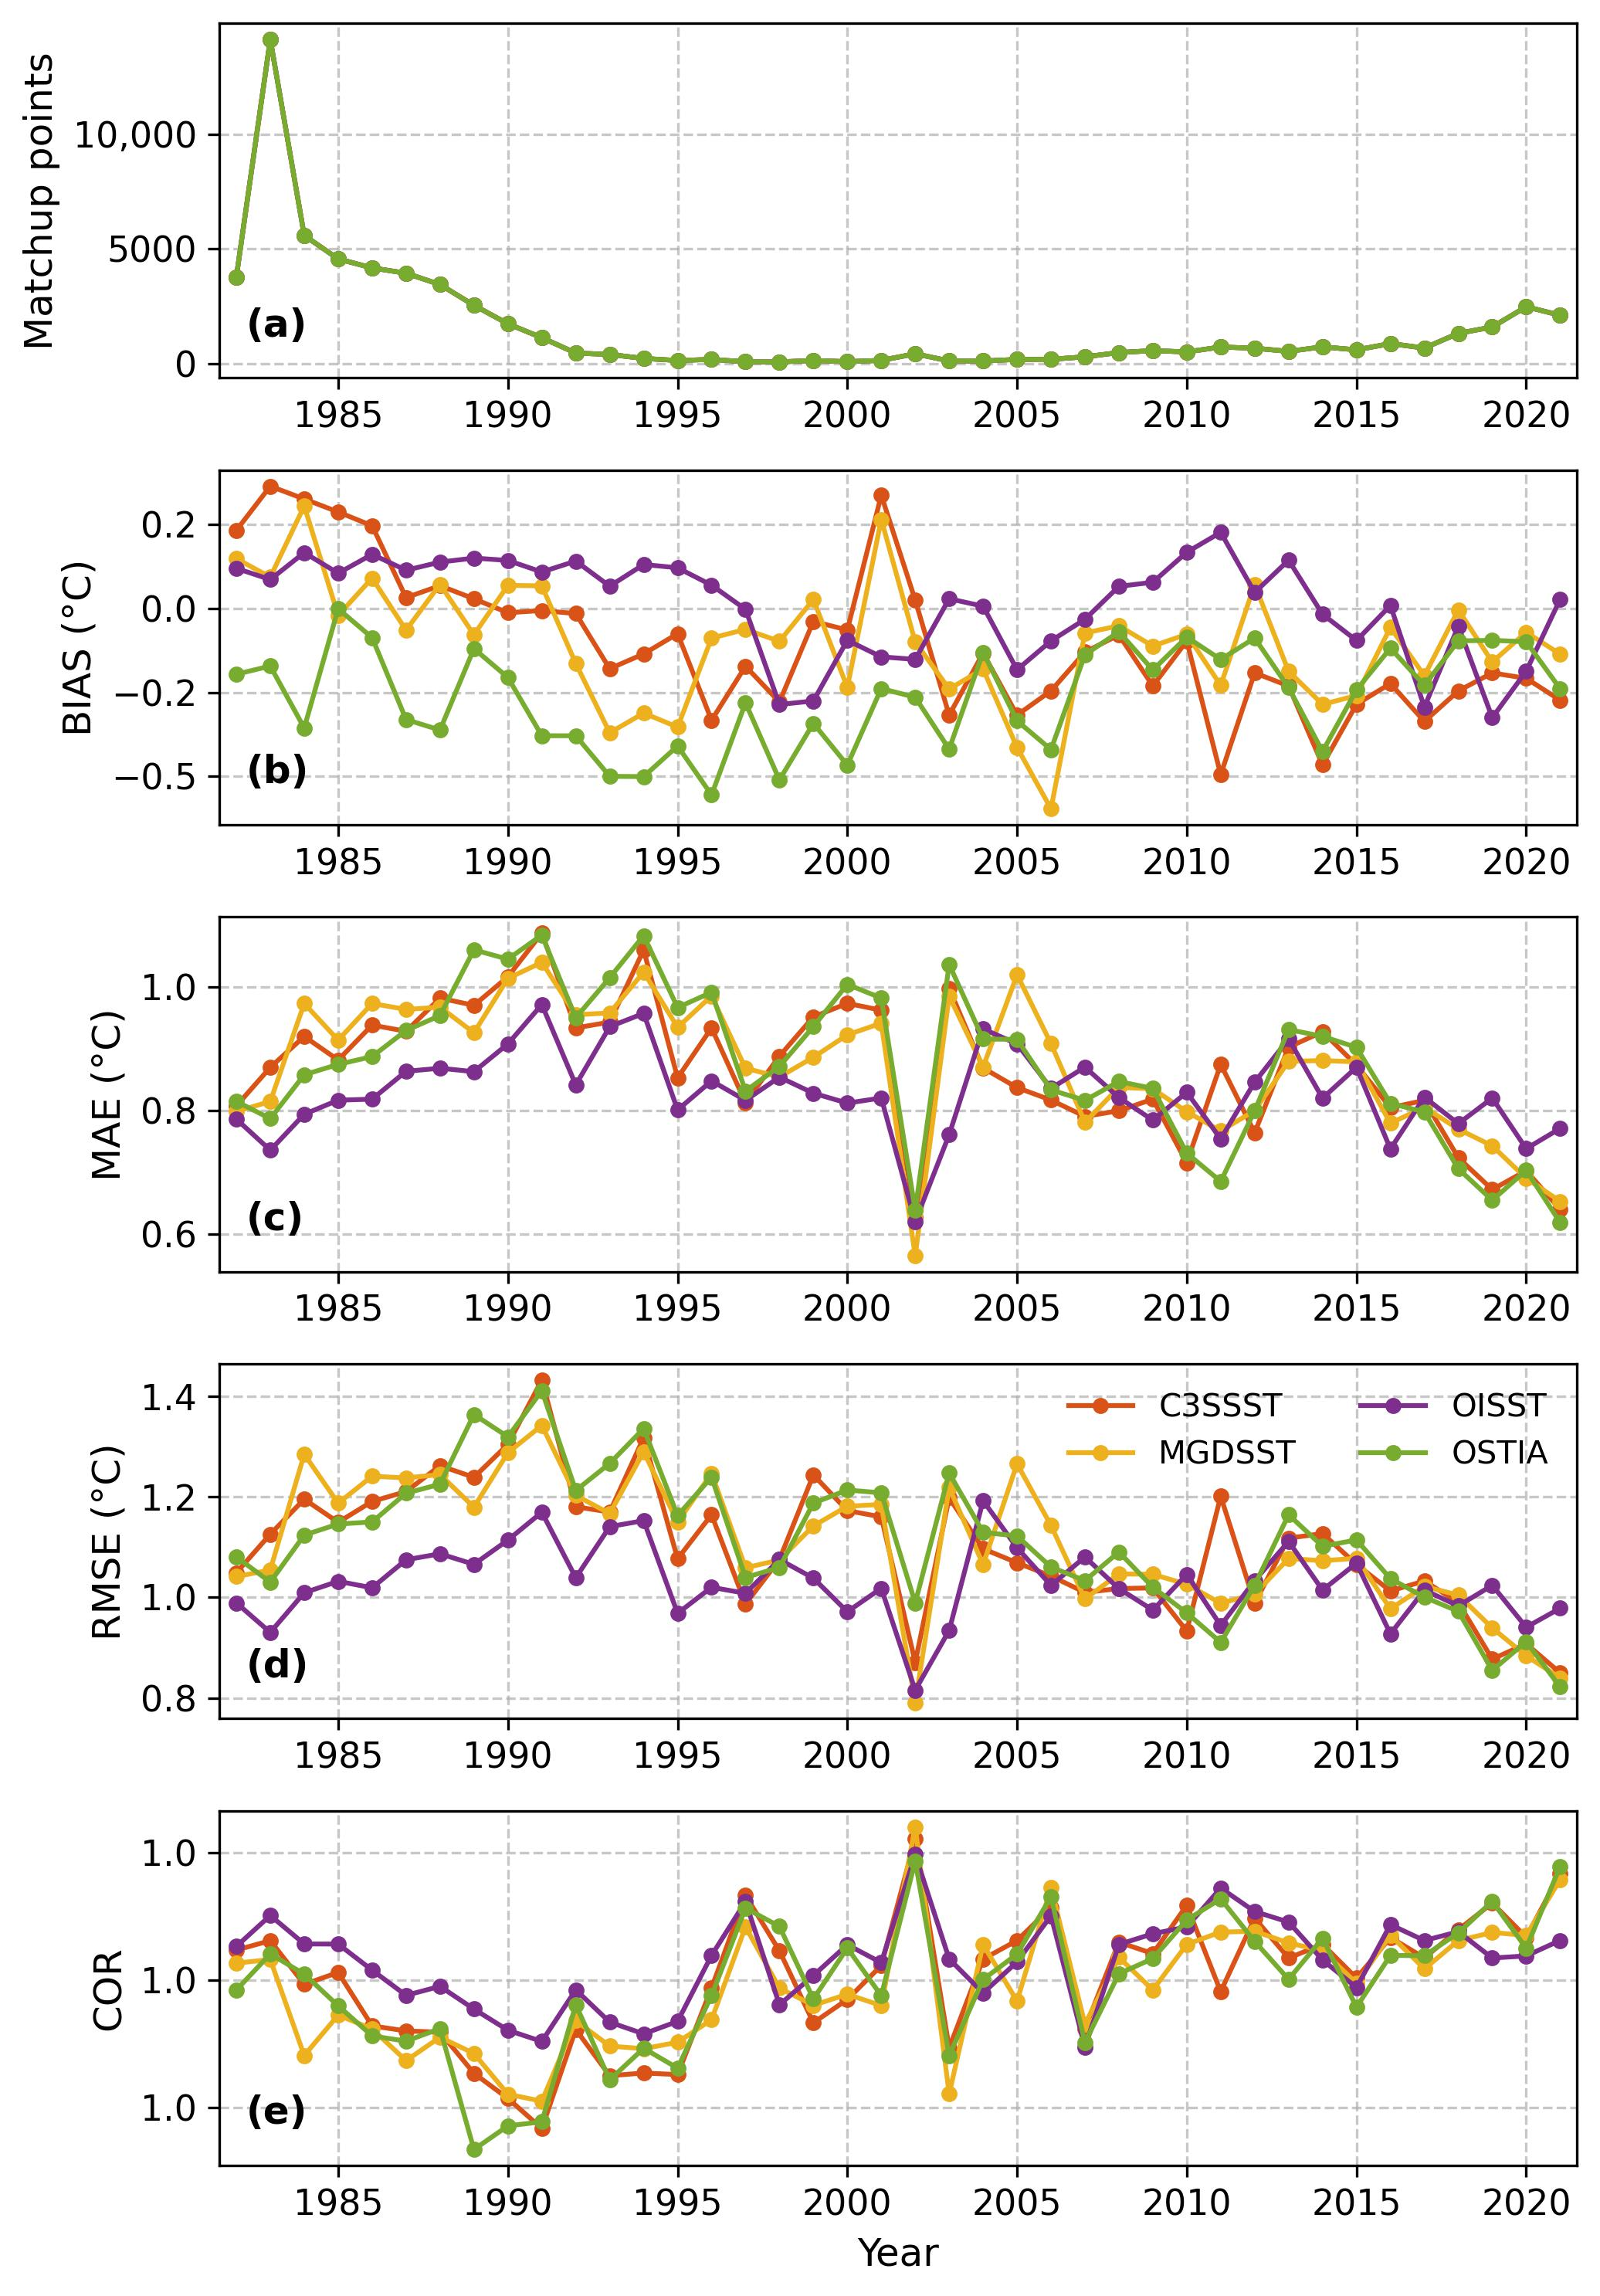
The annual numbers of L4 SST and iQuam in situ matchups vary substantially over the study period (
Figure 6), reflecting the evolution of the in situ observing system. The number of annual matchups ranges from fewer than 100 during the late 1990s to early 2000s to more than 14,000 in 1983. Despite these variations in sampling density, the validation statistics remain generally stable throughout the 1982–2021 period. For all four L4 SST products, annual correlation coefficients are consistently high (>0.98), while RMSE values remain close to 1 °C with no evidence of systematic temporal degradation. Although the annual number of matchups varies considerably across the study period, the validation metrics show only modest interannual variability. Annual RMSE values generally range between approximately 0.8 °C and 1.4 °C, MAE remains around 0.6–1.1 °C, correlation coefficients are consistently above 0.98, and bias shows no systematic long-term drift among the four L4 SST products.
3.3. Validation with MB Data
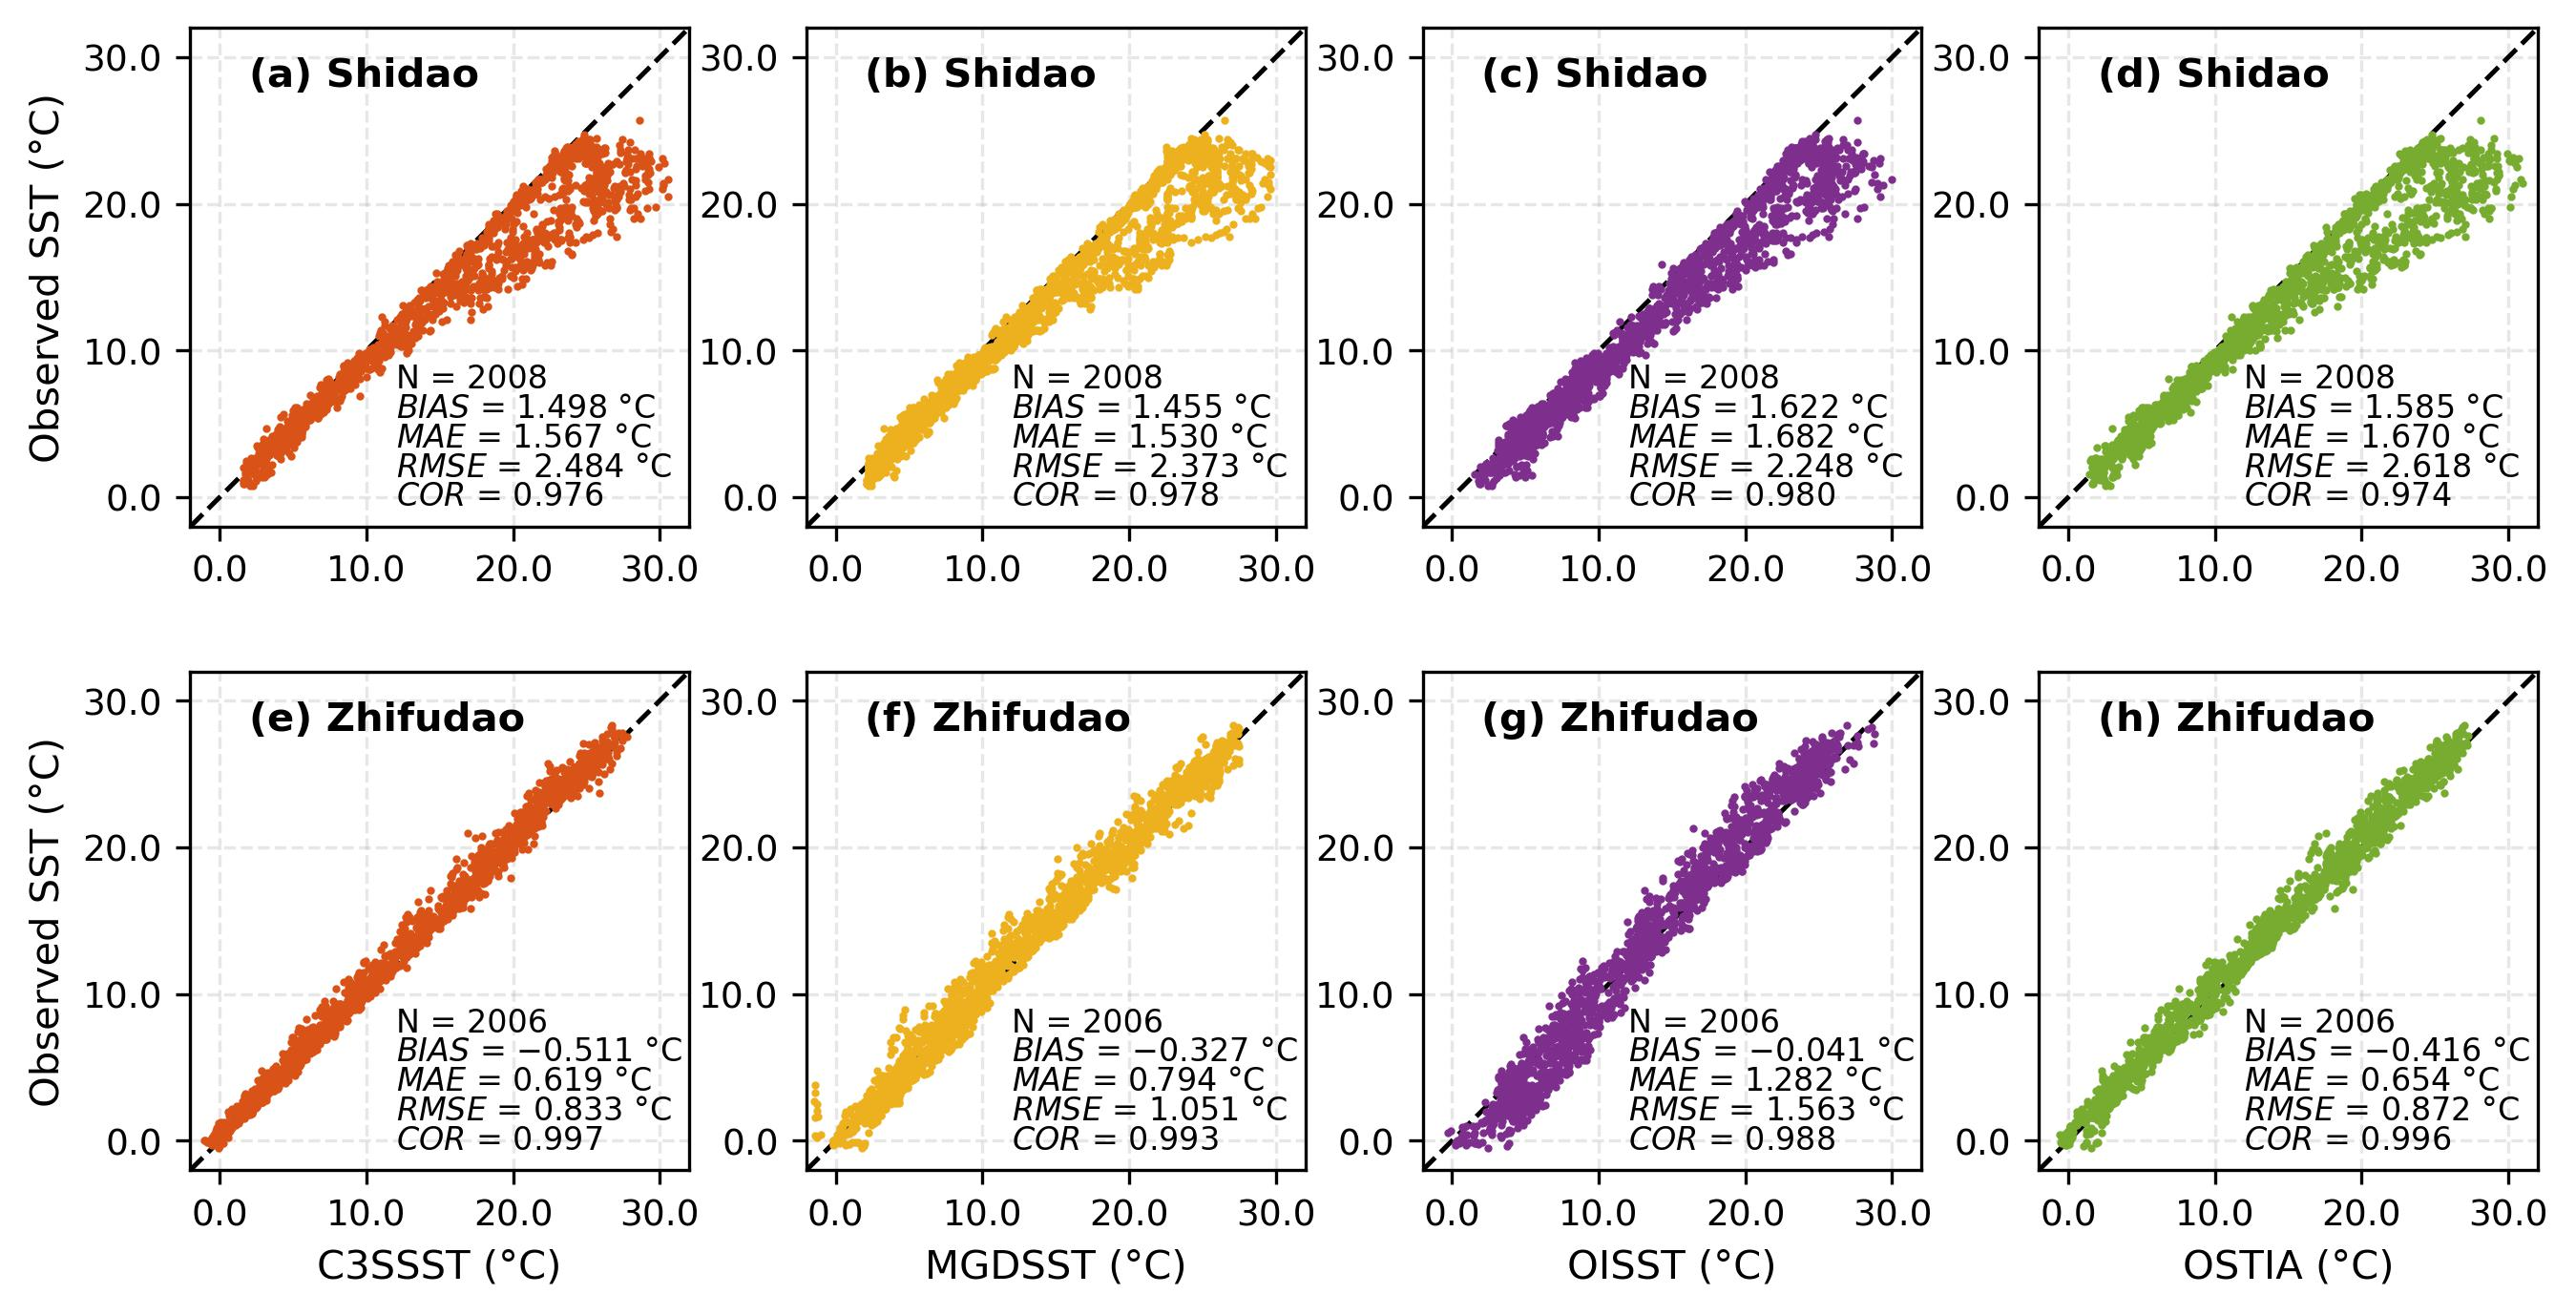
SSTs from the four L4 products were evaluated against in situ observations at the Shidao and Zhifudao stations. Following the matchup criteria, 2008 and 2006 valid matchups were obtained at Shidao and Zhifudao, respectively (
Figure 7). The uncertainties of the evaluation metrics were estimated using a weekly block bootstrap method with 2000 iterations, and the corresponding 95% confidence intervals are provided in
Table 4.
The validation results showed clear spatial differences in product performance. At Shidao, all four SST products exhibited significant warm biases (1.455–1.622 °C), with RMSE values ranging from 2.248 to 2.618 °C. OISST showed the lowest RMSE (2.248 °C), while MGDSST achieved the lowest MAE (1.530 °C). In contrast, much better agreement was observed at Zhifudao, where biases ranged from −0.511 to −0.041 °C and RMSE values ranged from 0.833 to 1.563 °C. C3SSST showed the best performance at this station, with the lowest RMSE (0.833 °C) and MAE (0.619 °C), and a high correlation coefficient (R = 0.997).
Overall, all four L4 SST products captured the temporal variability of in situ SST, with correlation coefficients exceeding 0.97 at both stations. However, substantial differences in bias magnitude and direction were observed between the two sites, characterized by a pronounced warm bias at Shidao and weak cold biases at Zhifudao. These results highlight the strong influence of local coastal conditions on SST product accuracy. Further analysis showed that the largest discrepancies at Shidao mainly occurred during summer, suggesting that warm-season coastal processes may contribute to the observed biases.
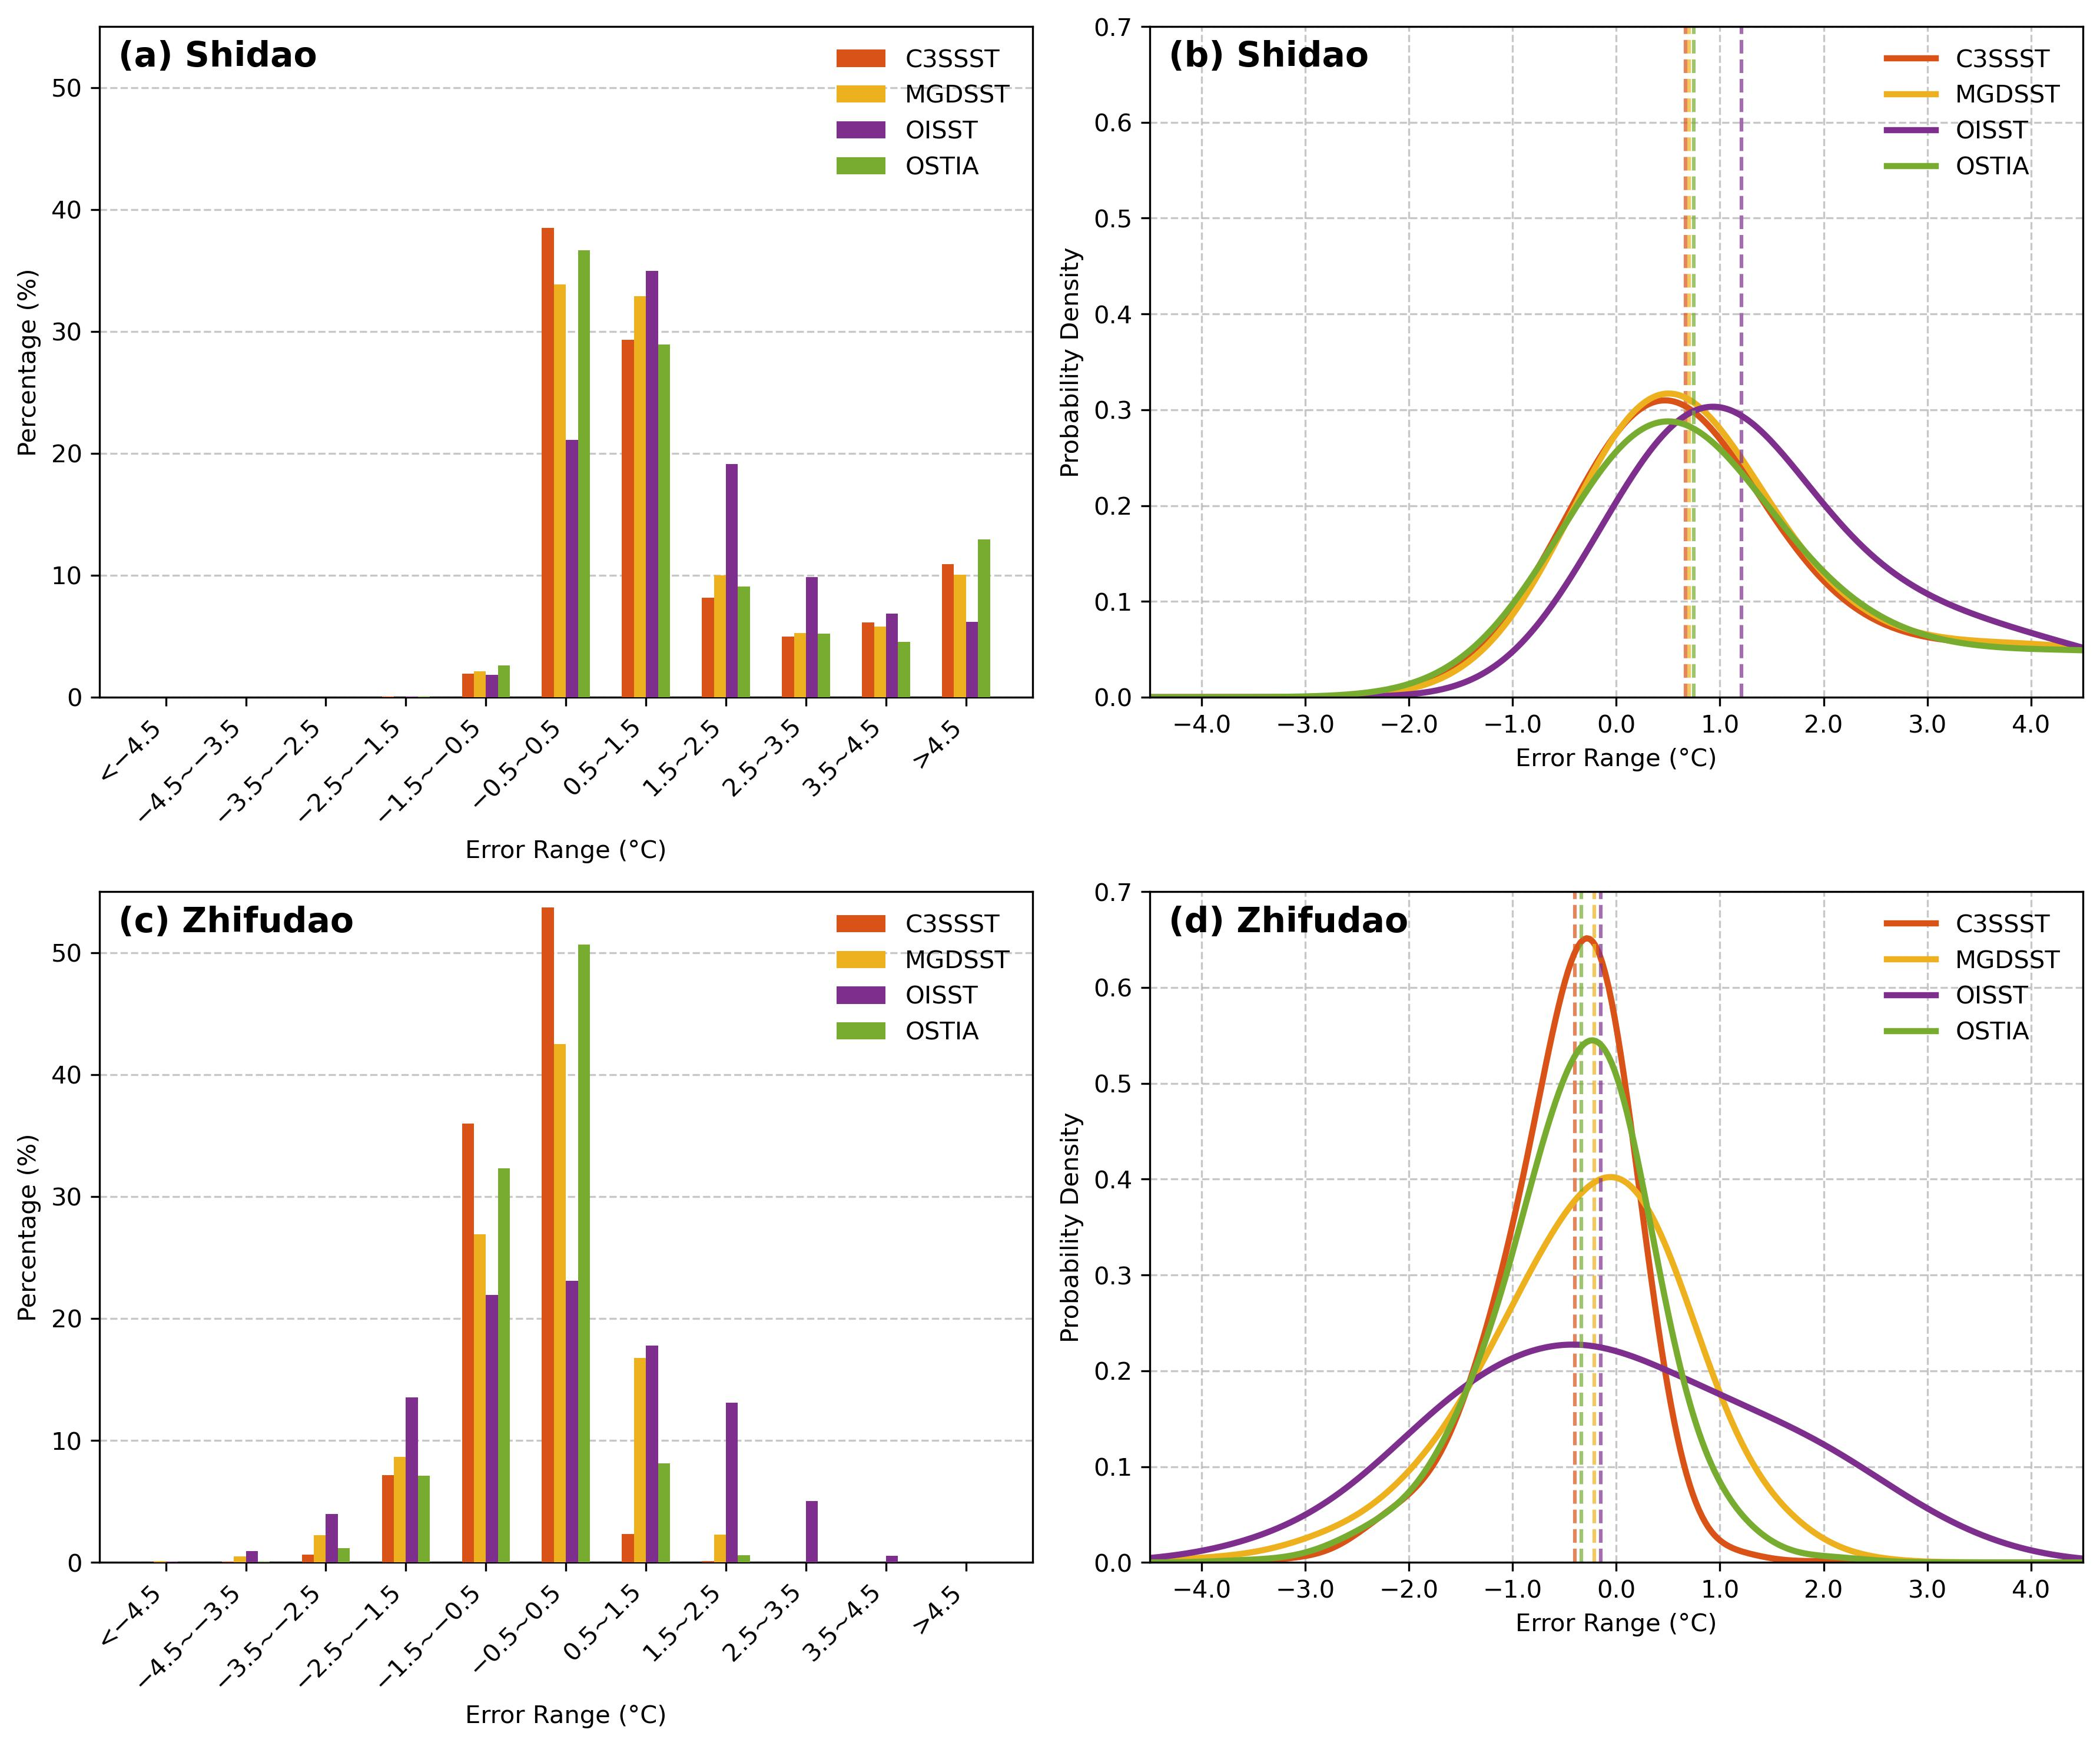
The frequency distributions of SST errors further revealed distinct differences between the two stations (
Figure 8a,c). At Zhifudao, errors were mainly distributed around zero, with more than 86% of matchups falling within the range of −1.5 °C to 1.5 °C for all products except OISST (63.31%). C3SSST and OSTIA showed the highest percentages of errors within the −0.5 °C to 0.5 °C interval (53.69% and 50.65%, respectively), indicating superior consistency with the in situ observations. In contrast, the error distributions at Shidao were shifted toward positive values, reflecting the systematic warm bias of satellite-derived SSTs. The proportion of errors within 0.5 °C to 1.5 °C exceeded that within the −0.5 °C to 0.5 °C interval for all products, and large positive errors (>4.5 °C) occurred more frequently than at Zhifudao. This spatial difference suggests that the accuracy of L4 SST products is strongly influenced by local coastal processes.
To further characterize the statistical characteristics of SST errors, kernel density estimation (KDE) and skewness analysis were performed for the four L4 SST products at Shidao and Zhifudao (
Figure 8b,d). The error distributions showed distinct differences between the two stations. At Shidao, all products exhibited positive skewness, with skewness values of 1.613, 1.611, 1.251, and 1.546 for C3SSST, MGDSST, OISST, and OSTIA, respectively. The right-skewed distributions indicate extended positive error tails, suggesting that large positive deviations occurred more frequently, with satellite-derived SSTs tending to overestimate in situ observations during certain periods.
In contrast, the error distributions at Zhifudao showed weaker and more balanced skewness. C3SSST and MGDSST exhibited negative skewness values of −0.789 and −0.593, respectively, indicating occasional underestimation of SST. OSTIA showed weak negative skewness (−0.424), while OISST displayed an approximately symmetric distribution (skewness = 0.093). Overall, the KDE and skewness analyses indicate that SST error characteristics varied between the two stations, with pronounced positive deviations at Shidao and relatively balanced error distributions at Zhifudao, highlighting the influence of regional environmental conditions on the performance of different L4 SST products.
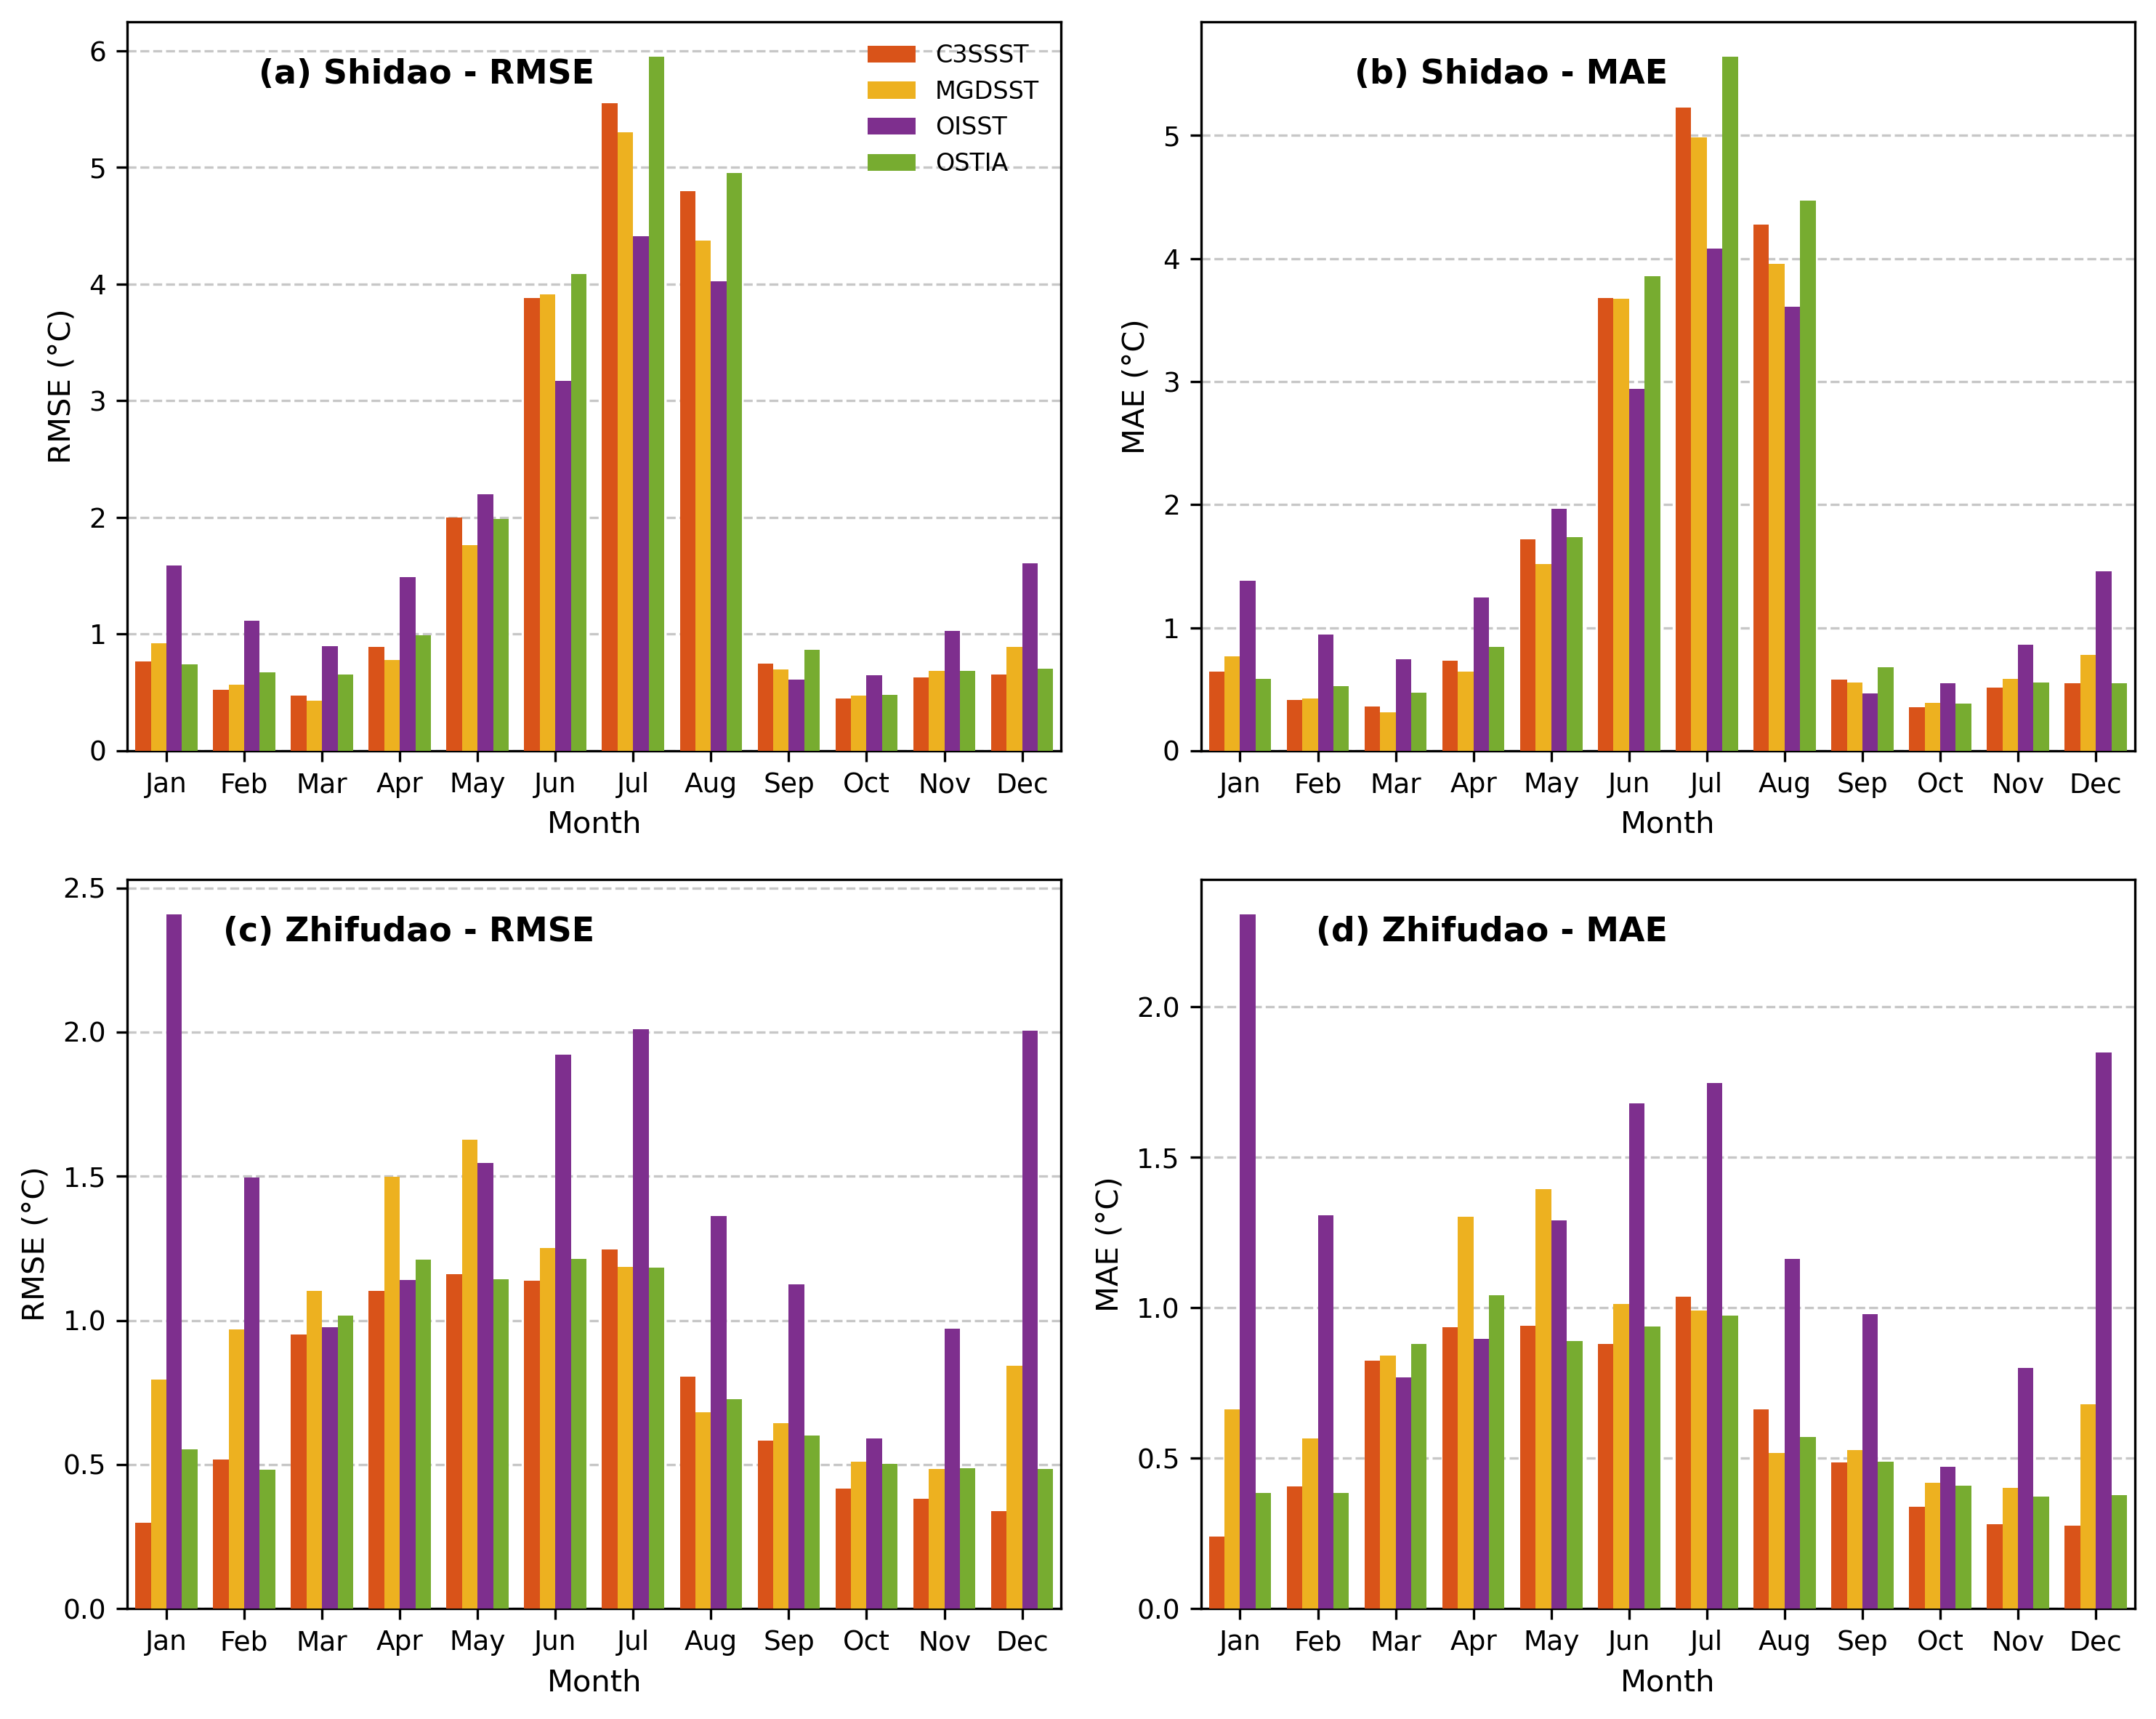
Figure 9 presents the monthly variations in RMSE and MAE for C3SSST, MGDSST, OISST, and OSTIA at the Shidao and Zhifudao stations. The RMSE and MAE exhibited similar seasonal variations at both stations, with relatively low errors during winter and autumn, while substantially increased errors occurred during summer, particularly from June to August. This indicates that the accuracy of different SST products was affected by seasonal changes in SST variability and coastal ocean conditions.
At the Shidao station, all four SST products exhibited substantially increased RMSE and MAE during summer, with the largest errors occurring in July and August. Although some differences existed among the products, their performances were generally comparable during this period, indicating that the elevated uncertainties were mainly related to strong seasonal variability. During the other months, C3SSST, MGDSST, and OSTIA showed relatively lower and more stable errors, whereas OISST generally exhibited larger deviations.
At the Zhifudao station, clearer differences among SST products were observed. C3SSST and OSTIA showed better overall agreement with in situ observations, particularly in winter and autumn. C3SSST achieved the lowest errors in January (RMSE = 0.297 °C; MAE = 0.238 °C) and maintained low errors during October–December (RMSE: 0.340–0.417 °C; MAE: 0.275–0.338 °C). In contrast, OISST showed larger deviations, with RMSE values of 2.408 °C and 2.006 °C in January and December, respectively. MGDSST showed intermediate performance, while all products exhibited increased summer errors, although the magnitude was lower than that at Shidao (July RMSE: 1.19–2.01 °C).
3.4. Inter-Comparison of the L4 SST Products
The validation results in
Section 3.2 and
Section 3.3 provide complementary evaluations of the four L4 SST products at regional and nearshore scales. The iQuam dataset enables large-scale assessment across the Bohai and Yellow Seas, while MB observations provide detailed validation at representative coastal sites. Based on these results, inter-comparisons among the four SST products were further conducted to assess their mutual consistency and spatial differences.
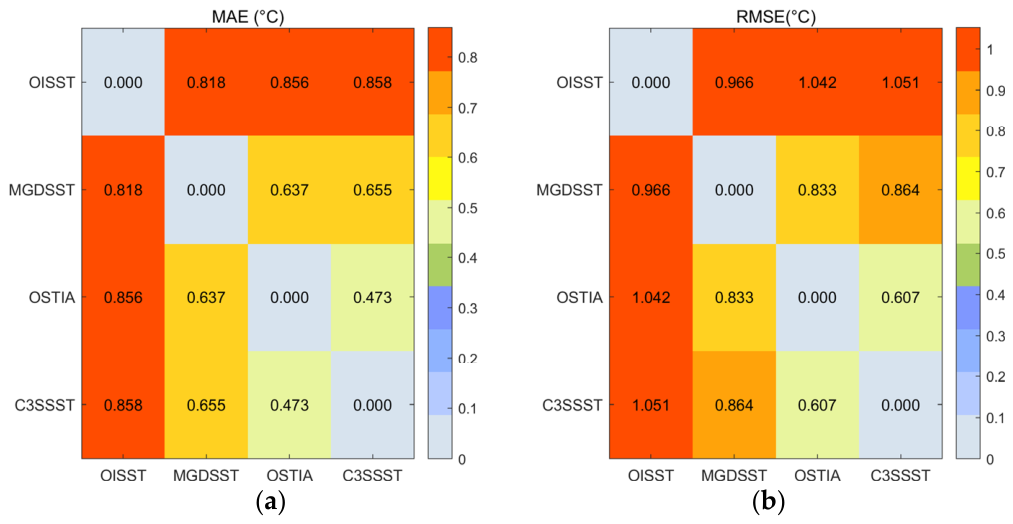
To quantify the consistency among SST products, pairwise MAE and RMSE were calculated. Unlike validation against in situ observations, these metrics represent the relative differences between products and reflect their similarity. As shown in
Figure 10, C3SSST and OSTIA exhibited the highest consistency, with the lowest MAE and RMSE values (0.473 and 0.607 °C, respectively). In contrast, OISST showed larger discrepancies with other products, with RMSE values generally exceeding 0.9 °C and reaching 1.051 °C when compared with C3SSST. MGDSST showed intermediate differences, with MAE and RMSE values ranging from 0.637 to 0.818 °C and from 0.833 to 0.966 °C, respectively. Overall, the RMSE values were higher than the corresponding MAE values, indicating the influence of larger local deviations.
The pairwise comparison suggests that C3SSST and OSTIA produce highly consistent SST fields, whereas the larger differences involving OISST may be related to its coarser spatial resolution (0.25°) and stronger smoothing during optimal interpolation, which can limit the representation of fine-scale coastal SST variability.
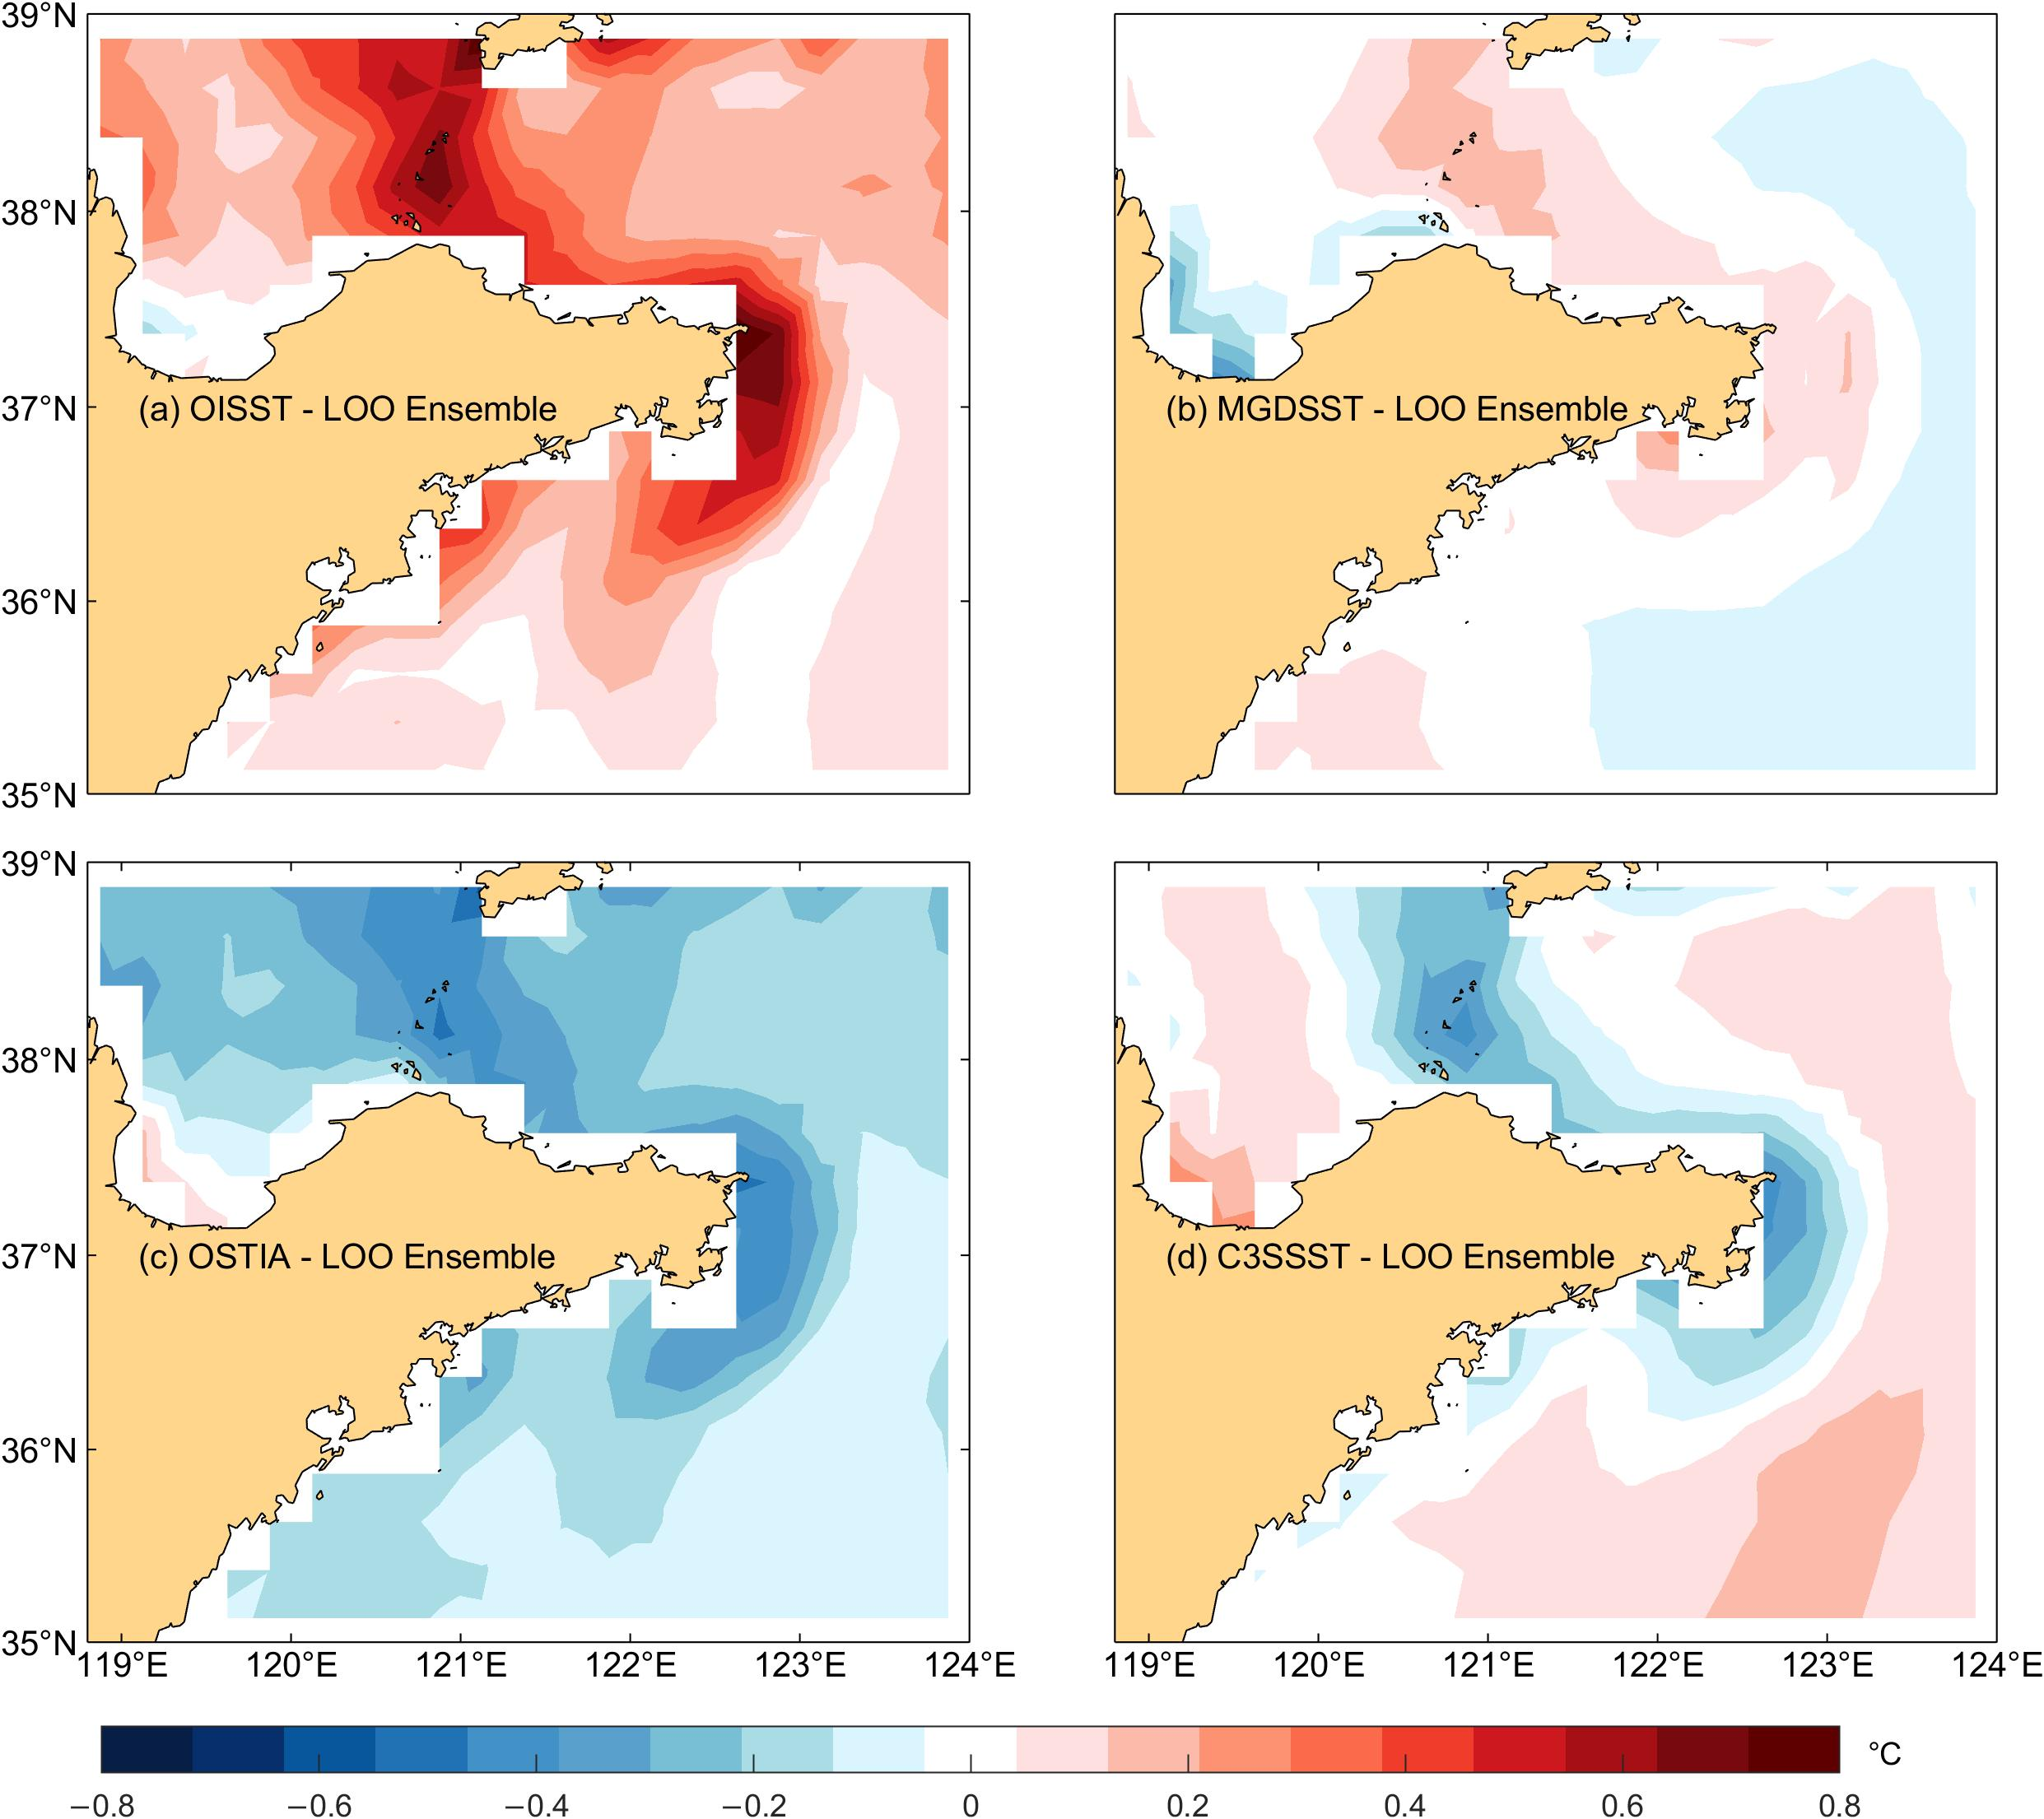
The leave-one-out (LOO) ensemble analysis was applied, in which each SST product was compared with the ensemble mean of the other three products. This approach avoids the circular reference problem of the conventional ensemble mean and provides an independent evaluation of the relative deviations among SST products.
Figure 11 shows the spatial differences between each SST product and its corresponding LOO ensemble. The spatial patterns are consistent with those obtained from the original ensemble mean, confirming the robustness of the inter-product differences. OISST and MGDSST generally exhibit positive deviations in the coastal waters surrounding the Shandong Peninsula, indicating warmer SST estimates relative to the ensemble, with OISST showing stronger warm anomalies, particularly in nearshore and semi-enclosed regions. In contrast, C3SSST and OSTIA mainly show negative deviations, suggesting relatively cooler SST estimates, especially for OSTIA. For all products, the magnitude of deviations increases toward the coast, reflecting the enhanced influence of complex coastal processes and stronger SST gradients.
These spatial differences are likely related to variations in spatial resolution, data assimilation, and interpolation schemes among the SST products. The larger warm deviations of OISST may be associated with its coarser resolution (0.25°) and stronger smoothing during optimal interpolation, which limits the representation of fine-scale coastal SST variability. Conversely, higher-resolution products such as C3SSST and OSTIA better capture coastal thermal structures, resulting in relatively lower SST estimates in nearshore areas.
4. Discussion
Compared with the iQuam and mooring buoy observations, the four L4 SST products showed certain discrepancies among themselves. These differences are mainly related to the distinct input datasets, quality-control procedures, interpolation methods, and data assimilation schemes used in their generation. However, some products may also assimilate similar observational data or apply comparable SST corrections, which could introduce common signals and potentially affect the evaluation results in this study.
Relative to the independent buoy observations, all four L4 SST products exhibited pronounced warm biases at the Shidao station during summer (June–August), suggesting that satellite-based SST products may overestimate the SST in the surrounding coastal waters during this period. The coastal waters around the Shandong Peninsula are characterized by complex bathymetry, strong tidal mixing, multiple current systems, and an irregular coastline, resulting in highly heterogeneous SST distributions. In addition, cloud contamination, high suspended sediment concentrations, and land adjacency effects may further increase uncertainties in nearshore satellite SST retrievals.
4.1. Interpretation of Product Differences
The four L4 SST products exhibit noticeable differences in both statistical performance and spatial characteristics over the coastal waters surrounding the Shandong Peninsula. These differences can largely be attributed to variations in input observations, analysis methodologies, and spatial resolution. Although all products aim to provide spatially complete SST fields through multi-source data fusion, they differ substantially in the types of satellite observations employed, the incorporation of in situ observations, and the algorithms used for bias correction and interpolation.
OISST exhibited the lowest RMSE and MAE in comparison with the reference observations, suggesting the closest agreement with the observed SSTs. One possible explanation is its mature optimal interpolation framework, which combines satellite observations with in situ measurements while applying relatively strong spatial smoothing. Such smoothing effectively suppresses random noise and produces stable large-scale SST fields, although it may reduce the representation of fine-scale coastal variability.
In contrast, C3SSST and OSTIA retain more mesoscale and coastal structures owing to their finer spatial resolution (0.05°) and different analysis systems. These products are capable of resolving coastal fronts and nearshore temperature gradients more effectively, but the increased spatial variability may also lead to larger local discrepancies with the reference observations. MGDSST exhibits intermediate characteristics, reflecting its combination of multi-source satellite observations with in situ bias correction.
Spatial resolution plays an important role in coastal environments such as the Shandong Peninsula, where strong horizontal SST gradients frequently occur due to tidal mixing, river discharge, and complex coastline geometry. Higher-resolution products preserve these gradients more effectively, whereas coarser-resolution products inevitably smooth local temperature extremes during interpolation. However, the present results indicate that spatial resolution alone does not determine product performance, as differences in input observations and analysis methodologies also contribute substantially to the observed biases.
4.2. Potential Dependence Between iQuam Observations and L4 SST Products
The iQuam dataset is widely used as a high-quality reference for SST validation; however, complete independence between iQuam observations and the evaluated L4 SST products cannot be fully guaranteed. According to product documentation, OISST incorporates ship, buoy, and Argo observations from ICOADS, NCEP/FNMOC, and Argo GDAC for satellite bias correction and SST analysis. Similarly, OSTIA uses in situ observations from the HadIOD database, while MGDSST applies in situ observations from the GTS and Internet-based sources for satellite bias correction. In contrast, the available documentation for the C3S SST product mainly describes the use of satellite observations from the ESA SST CCI record and does not explicitly report the assimilation of in situ observations.
Because iQuam also integrates observations from major global in situ observing systems, including ICOADS, Argo data centers, and FNMOC, some observational overlap may exist between iQuam and certain L4 SST products, particularly OISST. However, the lack of observation-level information in operational processing records prevents quantification of the actual overlap. Therefore, the validation results should be interpreted as measures of agreement with available in situ observations rather than fully independent estimates of product accuracy. The relatively lower RMSE and MAE of OISST may partly reflect shared observational information.
As an additional comparison, validation against the two coastal buoy stations provides an independent assessment under localized coastal conditions. Although the relative rankings of the SST products differ somewhat from those obtained using the iQuam dataset, both evaluations consistently show that product performance depends on the validation dataset and environmental conditions. Therefore, the buoy-based results complement the iQuam-based evaluation, while the potential influence of partial dependence in the iQuam validation should still be acknowledged.
4.3. Possible Causes of L4 SST Overestimation in Summer at Shidao Station
The systematic summer SST overestimation observed in the four L4 SST products at the Shidao station may be related to the difficulty of accurately representing regional coastal upwelling processes. As shown in
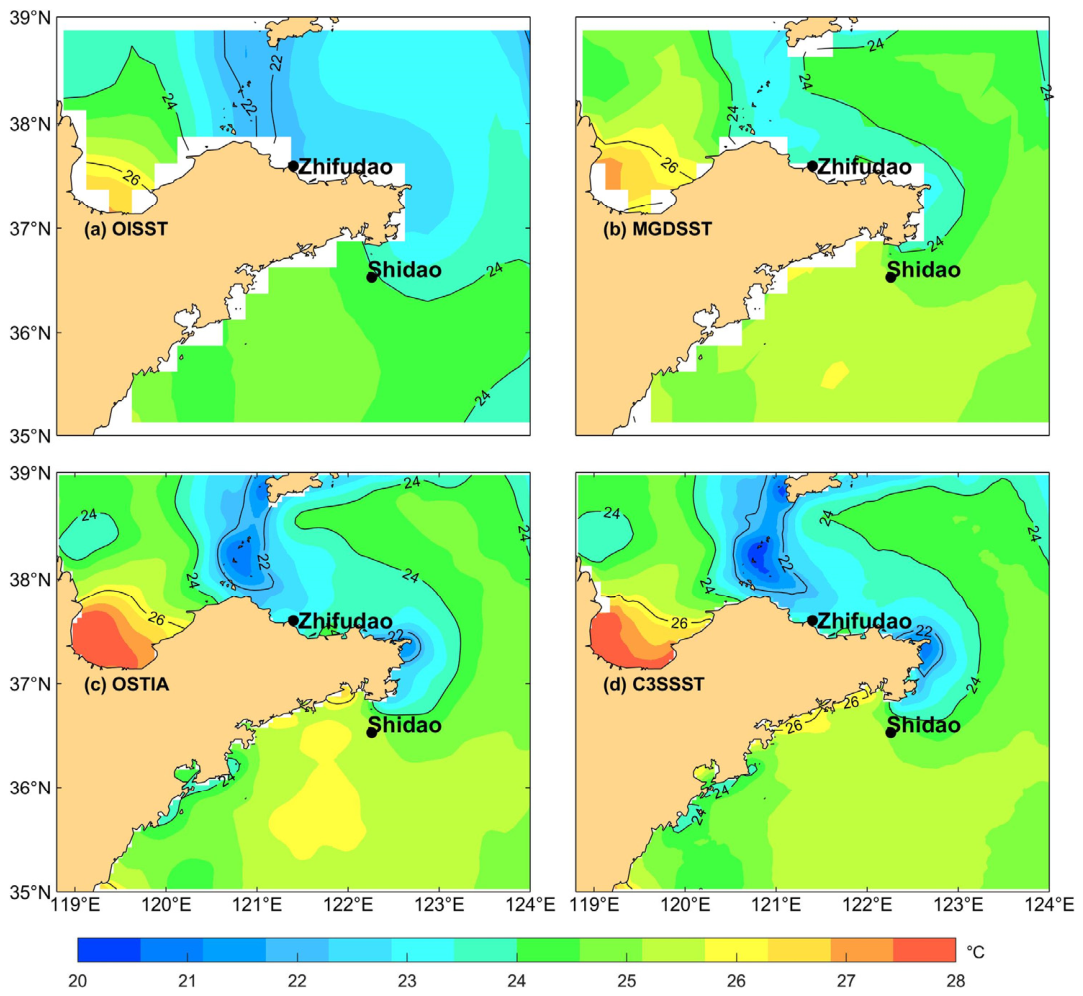
Figure 9, the four products exhibited their largest RMSE and MAE values at Shidao station in July. Therefore, the monthly mean SST distributions for July during 2015–2019 were further examined (
Figure 12). All four SST products showed a pronounced low-temperature region around the Shandong Peninsula in July, suggesting the presence of a regional coastal upwelling system. The Zhifu station was located within the low-temperature area enclosed by the 24 °C isotherm, whereas the Shidao station was located outside this cold-water region with SST values higher than 24 °C. This indicates that the L4 SST products consistently represented relatively higher SST values at Shidao during the upwelling season. One possible explanation is that the actual influence range of the coastal upwelling may extend beyond the cold-water area depicted by the satellite-derived SST fields, resulting in an underestimation of the cooling effect at Shidao.
The coastal waters surrounding Shidao are strongly influenced by seasonal upwelling, which induces substantial surface cooling and strong spatial–temporal SST variability during summer. Although satellite observations can capture the general characteristics of upwelling-induced cooling, the intensity and spatial extent of these cold signals may be underestimated due to limitations in satellite retrievals and spatial resolution. Furthermore, L4 SST products generate continuous fields through multi-source data merging and analysis schemes, which may smooth localized cold anomalies in regions with strong SST gradients and weaken nearshore cooling signals. The shallow shelf environment, strong tidal mixing, and complex coastline geometry around Shidao further increase the difficulty of resolving small-scale SST variability.
Therefore, the summer SST overestimation in the four evaluated L4 SST products is likely associated with an underrepresentation of the magnitude and spatial extent of upwelling-induced cooling rather than a complete failure to detect the regional upwelling signal. Further investigations using higher-resolution observations and dedicated coastal upwelling datasets are needed to quantify the contribution of these processes to SST product biases.
4.4. Uncertainty and Limitations in Assessment
Several uncertainties should be considered when interpreting the validation results. First, the reference observations from iQuam and buoy stations are point measurements, whereas L4 SST products represent spatially averaged grid values. This point-to-grid mismatch may introduce uncertainty, particularly in coastal regions with strong SST gradients. In addition, uncertainties associated with in situ measurements and uneven observational coverage may affect the representativeness of the validation results, especially in offshore areas of the Yellow Sea.
Moreover, although this study evaluates the long-term statistical consistency and seasonal variability of the four L4 SST products, the ability of these products to represent short-term coastal processes, such as strong upwelling events, SST fronts, and rapid thermal changes, requires further investigation. The limited spatial resolution of the validation observations also restricts the quantitative assessment of small-scale coastal SST variability.
Despite these limitations, the four L4 SST products show consistent representation of regional-scale SST patterns around the Shandong Peninsula. However, larger discrepancies remain in shallow and dynamically active coastal waters, indicating that product selection should consider the specific application requirements, including spatial resolution, coastal accuracy, and representation of fine-scale variability.
5. Conclusions
This study evaluated four widely used L44 SST products (C3SSST, OSTIA, MGDSST, and OISST) in the coastal waters surrounding the Shandong Peninsula using iQuam observations and moored buoy measurements. The main conclusions are summarized as follows:
(1) All four L4 SST products showed good agreement with in situ observations, with correlation coefficients exceeding 0.97, demonstrating their capability to capture SST variability. However, differences in bias and error magnitude were observed among products and sites. The iQuam validation showed comparable performance among the four products, with OISST achieving an RMSE of 1.008 °C. At the moored buoy stations, RMSE values ranged from 2.248 to 2.618 °C at Shidao and from 0.833 to 1.563 °C at Zhifudao. All products exhibited warm biases at Shidao (1.455–1.622 °C), while relatively small cold biases were observed at Zhifudao.
(2) The monthly analysis revealed clear seasonal variations in SST errors. At Shidao, all products showed increased RMSE and MAE during summer, especially in July and August. The observed warm biases may be related to enhanced coastal processes, such as upwelling and small-scale SST variability, which may not be fully represented by L4 SST products. In contrast, the four products showed more stable error characteristics at Zhifudao.
(3) The inter-comparison analysis revealed differences in spatial consistency among the four SST products. C3SSST and OSTIA showed relatively high consistency, whereas OISST exhibited larger deviations from the other products. The leave-one-out ensemble analysis confirmed that these differences were robust and mainly associated with the characteristics of individual SST products.
(4) The differences among L4 SST products are influenced by multiple factors, including input observations, quality-control procedures, spatial resolution, interpolation methods, and assimilation strategies. Meanwhile, complex coastal environments around the Shandong Peninsula may further increase uncertainties in SST representation. These results provide useful guidance for selecting appropriate SST datasets for coastal monitoring and SST-related applications.
Finally, future studies should further investigate the influence of regional oceanographic processes, such as tidally induced SST variability in Laizhou Bay and other semi-enclosed bays, coastal fronts, and seasonal water-mass evolution, on the performance of different SST products in complex coastal environments. Extending the validation with longer-term and more spatially representative coastal observations, together with newly available high-resolution SST products, would further improve the robustness of future assessments. In addition, the findings of this study provide useful guidance for selecting appropriate SST datasets for marine ranching, coastal aquaculture, and marine environmental monitoring in the coastal waters surrounding the Shandong Peninsula. They may also serve as a valuable reference for machine-learning-based SST prediction, reconstruction, bias correction, and multi-source data fusion.