Article

Numerical Analysis of the Hydrodynamic Performance of a Connected Offshore Floating Photovoltaic Platform Array

1
Guangxi Key Laboratory of Ocean Engineering Equipment and Technology, Beibu Gulf University, Qinzhou 535011, China
2
School of Naval Architecture and Maritime, Zhejiang Ocean University, Zhoushan 316022, China
*
Author to whom correspondence should be addressed.
J. Mar. Sci. Eng. 2026, 14(14), 1336; https://doi.org/10.3390/jmse14141336
Submission received: 14 June 2026 / Revised: 16 July 2026 / Accepted: 18 July 2026 / Published: 20 July 2026
(This article belongs to the Topic Marine Energy)

Abstract

Offshore floating photovoltaic (FPV) platforms have attracted attention as a promising approach for expanding solar energy utilization in marine environments. However, the hydrodynamic behavior of connected FPV arrays and the associated mooring response under realistic offshore conditions remain insufficiently understood. In this study, a numerical model of a connected offshore FPV platform array designed for the East China Sea is established using frequency-domain hydrodynamic analysis and time-domain simulations. The effects of module spacing and connector configuration are first examined for a twin-float system, and the optimized connection scheme is then applied to a 4 × 4 array. The motion responses, air-gap variation, and mooring performance of the array are evaluated under operational and extreme sea states. The results show that the surge response of the array is governed by an edge amplification effect under operational conditions, whereas the array tends to exhibit a more coordinated, quasi-rigid-body response as environmental loading increases. The heave response is influenced by wave shielding among adjacent units, while the pitch motion is strongly synchronized by the spring–damper connection system. The air-gap and mooring analyses indicate that the platform maintains sufficient freeboard and mooring safety margins under the considered sea states. These findings provide useful guidance for the preliminary design and safety assessment of connected offshore FPV arrays.

1. Introduction

The development of the global economy and the continuous growth in energy demand have spurred the accelerated development of renewable energy. As a key form of renewable energy, solar power offers the advantages of being pollution-free and sustainable. Compared to onshore photovoltaic systems, offshore PV systems offer benefits such as natural cooling and reduced water evaporation [1]. They can utilise more resources. This makes offshore PV a key direction for the future development of the offshore photovoltaic industry towards the open sea and deep-sea areas [2]. Unlike PV systems deployed on lakes, offshore PV must contend with the coupled effects of waves, tidal currents and wind loads. In seas prone to typhoons, the system must simultaneously withstand extreme loads from both periodic sea conditions and sudden, extreme weather events [3]. This presents greater challenges for offshore PV. Currently, most offshore PV systems employ modular array designs and mooring systems to ensure the stable operation of the platform.
In recent years, significant progress has been made in the research on offshore FPV platform technology; however, a unified standard system for the design of offshore FPV platforms has yet to be established. Design practice primarily refers to the relevant technical specifications issued by the Norwegian classification society DNV [4] and draws on experience from the traditional marine engineering sector. In response to these issues, scholars both domestically and internationally have undertaken active research; Pu et al. [5] Using the superposition method to generate rogue wave sequences and integrating global time-domain analysis, this study reveals the significant influence of rogue waves on platform motions and mooring tensions, thereby offering a crucial reference for structural design. Yang et al. [6] proposed a novel star-shaped FPV configuration and employed a numerical simulation method utilising multi-body flexible connections to investigate the hydrodynamic performance during towing operations, verifying the reliability of this method through experimental validation. Jin et al. [7] constructed an anchored-hinged multi-float OFPV platform to compare the motion responses of each module under wave action alone and under combined wave and wind action, whilst also calculating the influence of hinge damping on the motion response to investigate its overall hydrodynamic characteristics. Lian et al. [8] proposed a novel pontoon-type platform for power generation and investigated the effects of wave parameters and array configurations on the anchoring forces and node stresses of offshore floating photovoltaic platforms. It is worth noting that existing research has largely focused on the performance analysis of PV platforms in shallow water areas, whilst studies on platform performance in deep water and under severe sea conditions remain insufficient. Furthermore, when the system scale is expanded to multi-body arrays, the dynamic coupling and wave interference effects within the inter-module connection system become more complex; consequently, research conclusions based on single-body models are difficult to apply directly to the hydroelastic analysis and engineering design of array systems [9,10].
As a key branch of offshore renewable energy technology, floating photovoltaic systems have a relatively short history, and in their early stages of development drew extensively on the established experience of related marine engineering technologies. Research into the dynamics of multi-float connection systems has, to a large extent, drawn upon design experience and research findings from wave energy conversion devices [11,12], deep-sea aquaculture cages [13], and other offshore floating structures (such as floating breakwaters and very large floating structures) [14]. Research indicates that the motion response and power generation efficiency of offshore FPV systems are significantly influenced by wave parameters and the method of float connection [15]. Wu et al. [16] proposed a simplified algorithm for dynamic constraint forces in flexible connection structures under severe sea conditions for offshore mobile platforms, providing methodological support for evaluating connection performance under different sea conditions. Song et al. [17] conducted load tests using a twin-float model with hinged joints to validate the accuracy of numerical simulation methods; Yao et al. [18], using a numerical wave tank based on the Navier–Stokes equations and the generalized mode superposition method, analyzed the OFPV (offshore floating photovoltaic) platform. It is found that elastic connections outperform rigid connections under extreme wave conditions, and the mean pressure is positively correlated with wave height; Yan et al. [19] performed numerical modelling and coupled analysis of a novel modular offshore floating photovoltaic system, evaluating the motion of the multi-body platform under wave–wind conditions and the strength of the connectors. They found that hinged connections generate additional moments and recommended avoiding installation at a 0° wave direction. Ma et al. [20] employed numerical simulations to establish three types of rigid connector models, and the influence of degrees of freedom on the motions and connector loads was analyzed for different numbers of floaters. Due to functional requirements such as power generation, aquaculture and mooring protection, multi-module connection arrangements are commonly adopted [21], and their connection design concepts provide valuable references for the design of FPV arrays.
Currently, extensive research has been conducted on floating multi-body systems, exploring wave interference and hydrodynamic coupling between platforms. However, studies on floating photovoltaic (FPV) platform arrays remain notably insufficient. Most existing investigations are still confined to single-body structures or small-scale arrays, and the global evolution characteristics of large-scale complex arrays under realistic sea states are inadequately addressed [22]. Therefore, it is of significant importance to carry out reasonable conceptual design and numerical simulation studies in the early stage of research on large-scale complex arrays. In recent years, many scholars have contributed to this field. Xu et al. [23] employed fully coupled simulations using ANSYS-AQWA and found that rectangular FPV arrays exhibit the strongest stability, low mooring forces, and insensitivity to wave incidence angles. Lu et al. [24] evaluated the hydrodynamic characteristics of a single-row floating photovoltaic system based on potential theory and ANSYS-AQWA, revealing that wave loads dominate and wave height significantly enhances dynamic responses. Wang et al. [25] adopted a coupled dynamic model to analyze the connector line tensions in an FPV array, finding that wave direction is the dominant factor, and that adjacent line tensions surge by 64.3% upon connector failure. Zhang et al. [26] employed a nonlinear time-domain solver combined with a multi-body model, uncovering the damping characteristics and coupling effects of FPV modules, thereby rectifying deficiencies inherent in traditional frequency-domain methods. P Amouzadrad et al. [27], using a boundary-element numerical model, analyzed the dynamic behavior of a multi-module floating structure subjected to combined wind and current actions. The computed results show good consistency with experimental data, and it is observed that the presence of a submerged structure near the water surface can substantially attenuate the hydroelasticity responses. These studies provide valuable reference frameworks for FPV array research, and the present study draws upon them accordingly; for instance, Xu et al. demonstrated the stability advantages of rectangular platforms, and thus the present study also adopts a rectangular FPV platform configuration.
Although FPV platforms have received increasing attention, the hydrodynamic behavior of connected FPV arrays remains insufficiently understood. Most existing studies have focused on single floating units or small-scale arrays, while the global motion response, connector-induced coupling, air-gap variation, and mooring performance of larger arrays under complex offshore conditions require further investigation. To address these issues, this study considers an offshore FPV platform designed for the East China Sea. The effects of module spacing and connector configuration are first examined using a twin-float system, and the selected scheme is then applied to a four-by-four FPV array. The motion responses, air-gap variations, and mooring system behavior under operational and extreme sea states are analyzed. The results provide useful guidance for the preliminary design and safety assessment of connected offshore FPV platform arrays.

2. Numerical Methodology and Theoretical Formulation

The offshore FPV system investigated in this paper is a multi-body system, requiring careful consideration of the hydrodynamic interactions between the floats. Furthermore, when validating numerical methods for multi-body array systems, the influence of connectors plays a key role in the hydrodynamic response. The following therefore outlines the main research background and theoretical model.

2.1. Potential-Flow Formulation

In the field of fluids that are incompressible, inviscid and irrotational, the Laplace equation is considered to govern the velocity potential at every point [28]
Φ ( x , y , z , t ) = Φ I ( x , y , z , t ) + Φ R ( x , y , z , t ) + Φ D ( x , y , z , t )
where Φ I is the incident potential, Φ R is the radiation potential, Φ D is the diffraction potential, x , y , z are the spatial coordinates, and t is time.
The unstable linear potential function, which is generated as a response to a sinusoidal excitation at an angular frequency of ω , is given mathematically by:
ϕ ( x , y , z , t ) = [ ϕ I ( x , y , z ) + ϕ D ( x , y , z ) + j ξ j ϕ j ] e i ω t
where ϕ I ( x , y , z ) is the incident potential, ϕ D ( x , y , z ) is the diffraction potential, ξ j is the motion of the object in each degree of freedom, and ϕ j is the radiation potential.
The angular frequency ω is defined as:
ω = 2 π / T
where T is the wave period.
At the boundary of the fluid domain, the generalized wave perturbation must asymptotically vanish, thereby ensuring that the radiation conditions are properly satisfied:
lim R R ϕ t + c w ϕ R = 0
where R = x 2 + y 2 is used to quantify the radial distance from the object, and c w is the phase velocity of the wave.
Integrating the pressure on the object’s surface can yield the forces related to the incident wave and the diffraction wave:
F i I + D = F i I + F i D = i ρ ω S A + S B ( ϕ I + ϕ D ) n i d s
The radiative component of the wave excitation force is subsequently connected by the following expression:
F i j = i ρ ω S A + S B j = 1 , , 12 ξ j ϕ j n i d s = j = 1 , , 12 T i j ξ j
Among T i j = ω 2 A i j i ω B i j j , the coefficients A i j and B i j related to the additional mass and damping are defined as follows:
A i j = ρ ω Im S A + S B ϕ j n i d s B i j = ρ Re S A + S B ϕ j n i d s

2.2. Equations of Motion for the Multi-Body FPV System

In the time-domain analysis, the motion response of the floating photovoltaic platform can be described by specific equations:
M p , a + C p , v + K p = F p , v , t
where M p , a is the inertia load of the system, which includes the inertia load generated by the additional mass; C p , v is the damping load of the system; K p is the stiffness load of the system, including the stiffness of the mooring system, the static water stiffness of the platform, and the stiffness of the connecting components; F p , v , t is the external load, including the wave load on the platform, the mooring load, and the load at the connection point; p is the vector of position, v is velocity, a is acceleration; and t is the simulation time.
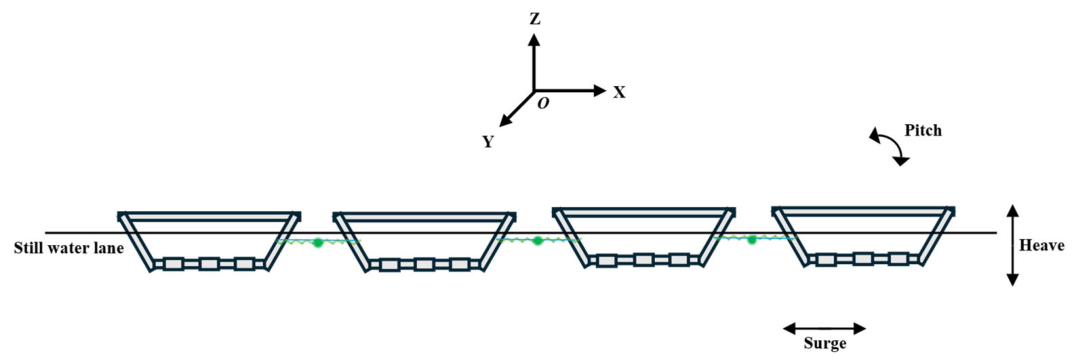
In the frequency domain, the motion response of the floating body can be described by a linear transfer function. Furthermore, a schematic diagram illustrating the motion of the arrayed photovoltaic platform is shown in Figure 1. For the response at the wave frequency, it can be expressed as:
X ( f ) = 2 π f 2 M + i 2 π f C + k 1
where X ( f ) is the transfer function at frequency f ; M is the system inertia matrix; C is the system damping matrix; and K is the system stiffness matrix.
The response at wave frequencies X ( f ) can be calculated using the following formula:
x ( f ) = X ( f ) λ ( f ) η ( f )
where λ ( f ) is the transfer function that maps the wave water level process to the load process, and η ( f ) is the wave water level spectrum.

2.3. Dynamic Model of the Mooring Lines

This study uses the OrcaFlex software (version 11.3) to conduct simulation analysis for the mooring system and performs mooring load calculation mainly by using the finite element method. In the OrcaFlex software, the simulation of the lines is achieved through the segmentation method. Specifically, the lines are divided into multiple segments, and each segment is simulated for its axial and torsional characteristics using a linear massless model segment.
The motion equation of the i-th node can be expressed as:
( M i + A i ) a i = T i 1 + T i + f i + B i
where M i is the mass matrix concentrated at the i-th node, A i is the additional mass matrix concentrated at the i-th node, a i is the acceleration matrix at the i-th node, T i 1 is the tension at the (i − 1)th node, T i is the tension at the i-th node, f i is the fluid load acting on the i-th node, and B i is the tension of the i-th mooring cable.
The formula for the tension of the i-th section of the mooring cable is:
T i = E A ε i + E A c i d l i d t l l i
where E A is the axial stiffness, ε i = l i l i 0 / l i 0 is the axial strain, l i is the instantaneous length of the i-th segment, l i 0 is the original length of the i-th segment, and c i is the damping coefficient of the i-th segment of the mooring cable.
The fluid force acting on the i-th node can be derived using the Morison equation, as shown below:
f i = 1 2 ρ C D D i l i | v i | v i + C M ρ V i a i
where C D is the drag coefficient, D i is the characteristic diameter of the i-th element, C M is the inertia force coefficient, V i is velocity of the i-th node, a i is the acceleration of the i-th node, and v i is the volume of the i-th segment.

3. FPV System Description and Numerical Validation

3.1. Twin-Float FPV Model and Mooring Configuration

Based on the environmental parameters of the target sea area, relevant engineering design specifications, and recent research findings—such as the stability advantages of rectangular photovoltaic structures mentioned in the introduction, the superior performance of buoy–truss photovoltaic platforms over conventional semi-submersible platforms proposed by Luo et al. [29], and the American Bureau of Shipping (ABS) offshore standard [30] indicating that buoy–truss-type photovoltaics become more advantageous when the inclination angle exceeds 20°—this study integrates these references, environmental data, and design codes to develop a novel floating photovoltaic (FPV) platform and to determine its primary structural dimensions.
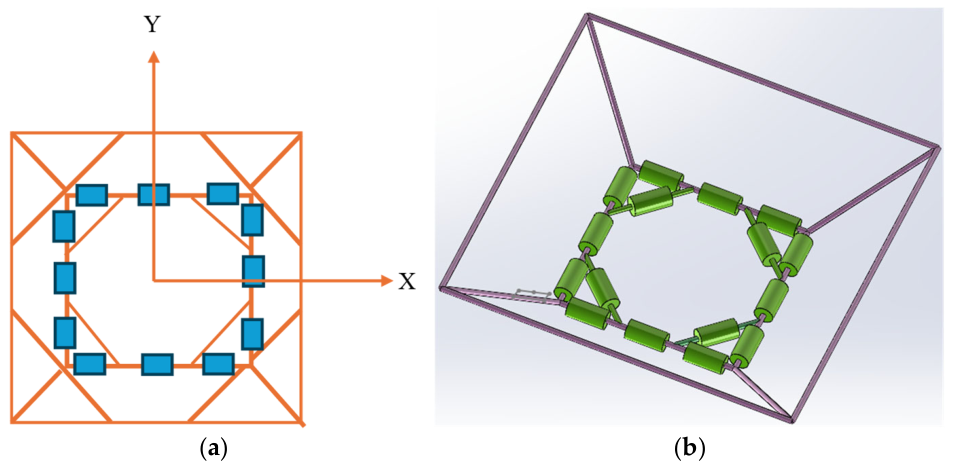
The main structure of a single platform consists of four components: buoyancy pontoons, a steel truss, deck beams, and rubber buoyancy elements. This combined system, through functional synergy and geometric optimization among the components, aims to improve the platform’s motion performance and operational safety under wave action. Specifically, the pontoons provide the primary buoyancy; the steel truss adopts a spatial grid configuration to enhance overall bending and torsional stiffness; the deck beams serve as the load-bearing layer for the photovoltaic panels; and the rubber buoyancy elements supply supplementary buoyancy while simultaneously acting as wave-current disturbance suppressors. These four components collectively determine the platform’s natural frequencies, damping characteristics, and air gap distribution, thereby influencing the motion responses and the risk of deck wetting in waves. A schematic diagram of the single floating photovoltaic platform is presented in Figure 2, and the relevant parameters are listed in Table 1.
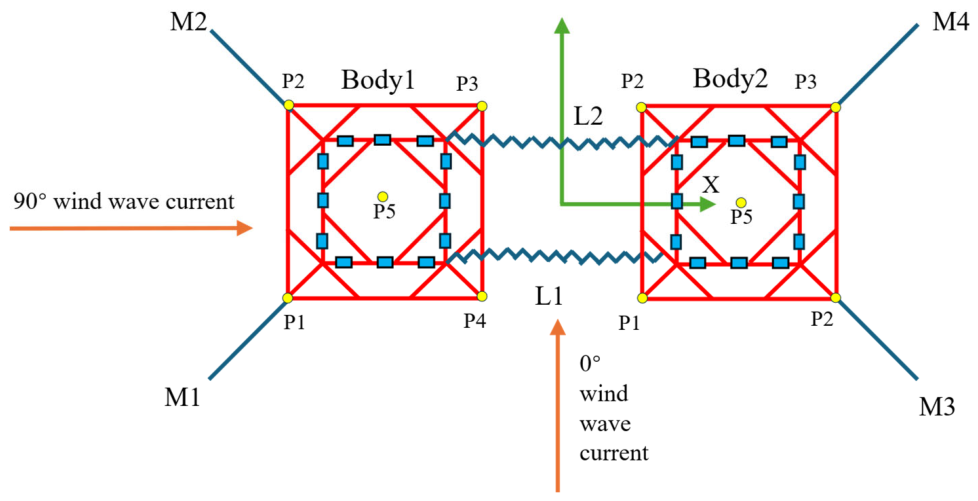
After determining the structural parameters of the individual platform, and considering the complexity of the marine environment and the limited power generation capacity of a single unit, this study adopts a multi-platform array connection scheme to increase the total installed capacity and reduce the levelized cost of electricity, while leveraging the coupling effects among modules to share environmental loads and mitigate the risk of single-point failure. Initially, a two-floater mooring concept is validated, with two semi-submersible platforms, each having six degrees of freedom, arranged side by side. The mooring system layout and the positions of air gap monitoring points are shown in Figure 3. In this figure, each platform is anchored to the seabed by four catenary mooring lines, forming a symmetrically distributed mooring system to restrain horizontal drift and yaw motions. The pretension and axial stiffness of the mooring lines are determined based on the water depth and design wave height, in conjunction with the actual sea state conditions of the East China Sea, using a quasi-static catenary analysis method; the corresponding mooring parameters are listed in Table 2. An elastic connector with bidirectional tension–compression capacity and equal stiffness in both tension and compression is installed between the adjacent sides of the two platforms, to restrict relative surge, sway, and yaw motions while allowing a certain degree of elastic deformation to dissipate low-frequency slow-drift energy induced by incident waves. Figure 3 also indicates the locations of air gap monitoring points, used to simultaneously acquire wave run-up and the instantaneous submergence depth of the lower deck edge, in order to assess the risk of deck wetting under various separation distances. In the practical study, the clear spacing between the two platforms is varied to investigate the influence of spacing variations on the hydrodynamic interference effects of the twin-floater system, including the motion responses of the platform system and the connector forces. These influencing factors are all closely related to the spacing: when the spacing is small, narrow-band resonance between the platforms may amplify local wave amplitudes and increase connector fatigue loads; when the spacing is large, the shadowing effect weakens, and the stiffness matching between mooring lines and connectors requires re-optimization.

3.2. Environmental Load Cases

This study primarily examines the motion response of the offshore FPV array platform and the performance variations of the mooring system under three sea conditions. Based on relevant sea condition data derived from the research by Chen Hongxia et al. [31] on surface wind speeds and wave characteristics in China’s coastal waters, irregular waves from the JONSWAP spectrum were employed, with the current velocity set as the surface current velocity. The data sets employed correspond to normal sea conditions, once-in-a-year extreme sea conditions, and once-in-fifty-years extreme sea conditions. In the following text, the once-in-a-year and once-in-fifty-years extreme sea conditions are referred to as ‘severe operating conditions’ and ‘limit operating conditions’, respectively. Specific environmental conditions are shown in Table 3.

3.3. Validation of the Numerical Model

In this study, the numerical simulations were performed using the OrcaFlex software to replicate the benchmark study conducted by MARIN. The OC4 semi-submersible floating wind turbine adopted in that benchmark has been extensively validated by numerous scholars, confirming the correctness of both the methodology and the results for hydrodynamic analysis. By reproducing the benchmark study and comparing with its published results, the reliability of the numerical approach employed in the present work is accordingly verified. On the basis of this validation framework, the hydrodynamic responses of floating photovoltaic (FPV) systems in both array-connected and twin-body connected configurations are analyzed to evaluate their motion behaviors. However, the application of this validation approach—originally established for the OC4 semi-submersible wind turbine—to connected FPV platforms entails certain limitations. For instance, the consideration of connector characteristics and separation distances is not sufficiently comprehensive, and the influence of factors such as the “edge radiation effect” arising from connected FPV arrays is not fully addressed. Since the primary purpose of this section is to demonstrate the correctness of the numerical method, these issues will be investigated in more detail in future work.
This section presents a detailed description of the validation procedure for the OC4 semi-submersible floating wind turbine platform. The platform hull consists of three offset columns and one central column, which are interconnected by cross-braces, forming a spatial frame structure. To mitigate heave motion, a large-diameter base column is installed at the bottom of the platform, thereby enhancing the added-mass effect. The main geometric parameters are as follows: the central column has a length of 30 m and a diameter of 6.5 m; each offset column has a length of 26 m and a diameter of 12 m; the base column has a length of 6 m and a diameter of 24 m; the cross braces have a diameter of 1.6 m and are arranged in a crossed configuration. These dimensions, together with the connection layout, collectively ensure the platform’s stability and structural integrity. All numerical simulations are conducted in calm water conditions.
To validate the free-decay motion of the platform, this study focuses on two modes of motion: heave and roll. Figure 4 shows the free-decay curves for both modes; a comparison reveals that the simulation data is in close agreement with the results reported in the MARIN literature [32]. Based on these validation findings, the same numerical simulation method is employed in this paper to analyze the modified FPV platform, thereby ensuring the accuracy and reliability of the simulation results. Furthermore, this study draws upon the fundamental fluid dynamics theory proposed by He et al. [33] in their research on twin-body FPV platforms, which is based on the existing three-dimensional potential flow theory for multiple floating bodies in a flow field.

3.4. Mesh Convergence Analysis

In this study, the GeniE (version v8.5-04, 2022)software was used to generate three different mesh sizes for this model; namely, 0.1 m, 0.3 m and 0.5 m, designated as M1, M2 and M3, respectively. The aim was to evaluate the accuracy of the numerical simulation results under different mesh sizes. The specific meshing schemes are shown in Table 4.
Prior to conducting the numerical analysis, it is necessary to verify the convergence of the mesh. Verification of mesh convergence is one of the key factors influencing the accuracy and reliability of simulation results. By meshing the model with different grid sizes, it is possible to assess convergence at various levels of precision. Generally, the smaller the mesh size, the more accurate the simulation results; however, this often requires greater computational resources and time. Therefore, by comparing simulation results at different mesh sizes and selecting a mesh size that meets a specific accuracy requirement, it is possible not only to reduce computational costs and ensure the accuracy of the numerical simulation results but also to provide important support for hydrodynamic analysis.
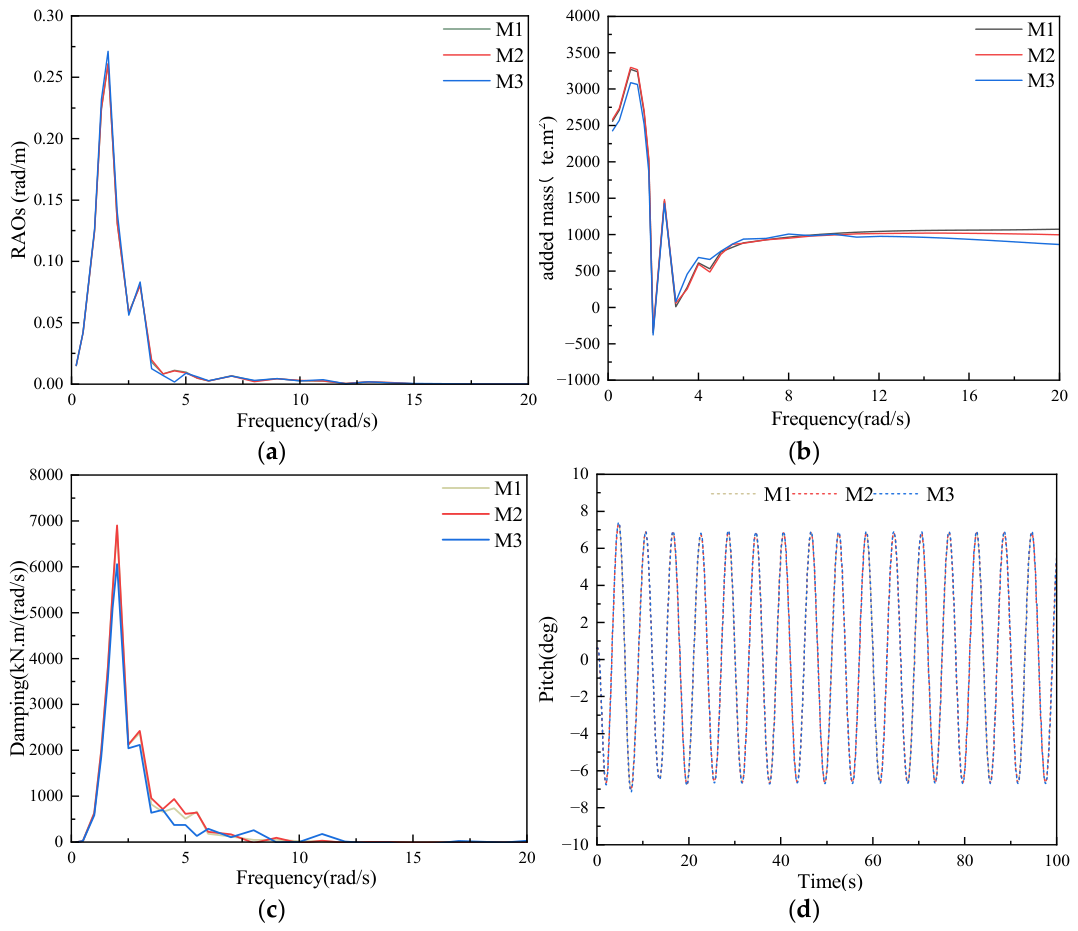
Grid independence verification was performed by conducting frequency-domain hydrodynamic analyses using OrcaWave on mesh models of varying sizes, followed by time-domain simulations in OrcaFlex. Figure 5 presents the frequency-domain results in the pitching direction, including the response amplitude operator (RAO), added mass, and radiation damping, as well as the time-domain pitch motion response. As observed from Figure 5a–c, the simulation data exhibit a high degree of consistency across different mesh sizes, confirming the efficacy of the grid convergence. Notably, for Figure 5d, the pitch motion displays a characteristic periodic steady-state oscillation around the zero-mean position. From a physical perspective, this apparent “stability” arises from the dynamic equilibrium among the wave-induced excitation moment, the hydrodynamic radiation damping, and the pitch hydrostatic restoring moment, which effectively confine the oscillation within a bounded range without long-term drift. This indicates that the transient effects have fully decayed within the defined simulation duration, and the motion is governed by the inherent pitch natural period and excitation frequency. Since mesh size critically influences both computational accuracy and efficiency, a grid size of 0.30 m (the M2 scheme) was ultimately selected as the baseline for this study. This choice offers a balanced compromise, ensuring computational efficiency and reduced costs while providing reliable data support for the optimized design and performance evaluation of the photovoltaic platform.

4. Connector Optimization of FPV System

4.1. Effect of Module Spacing on Motion Responses

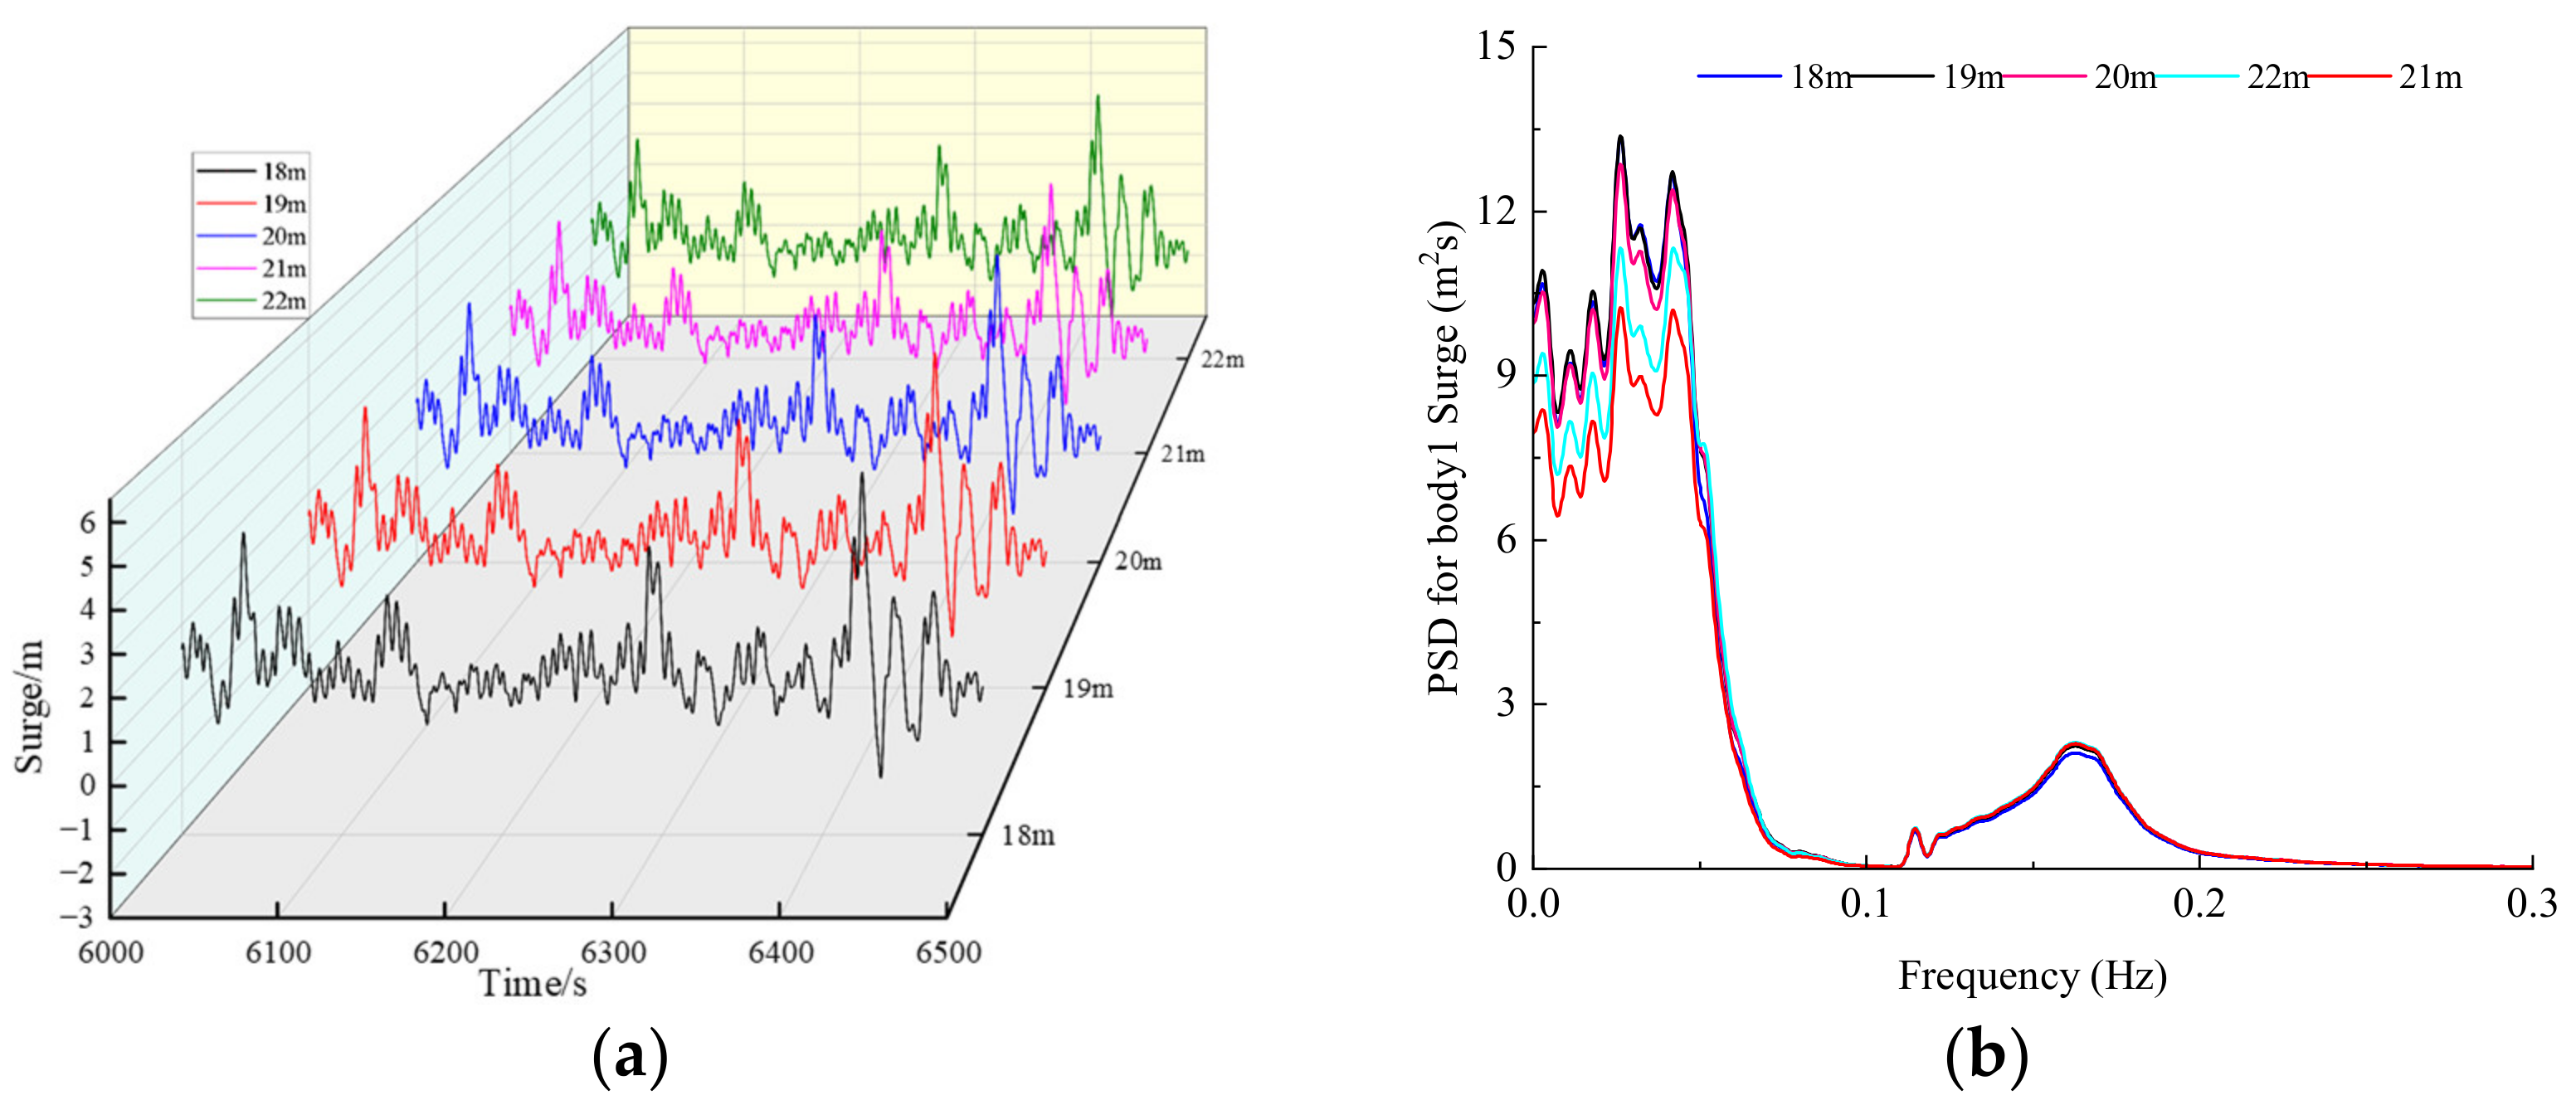
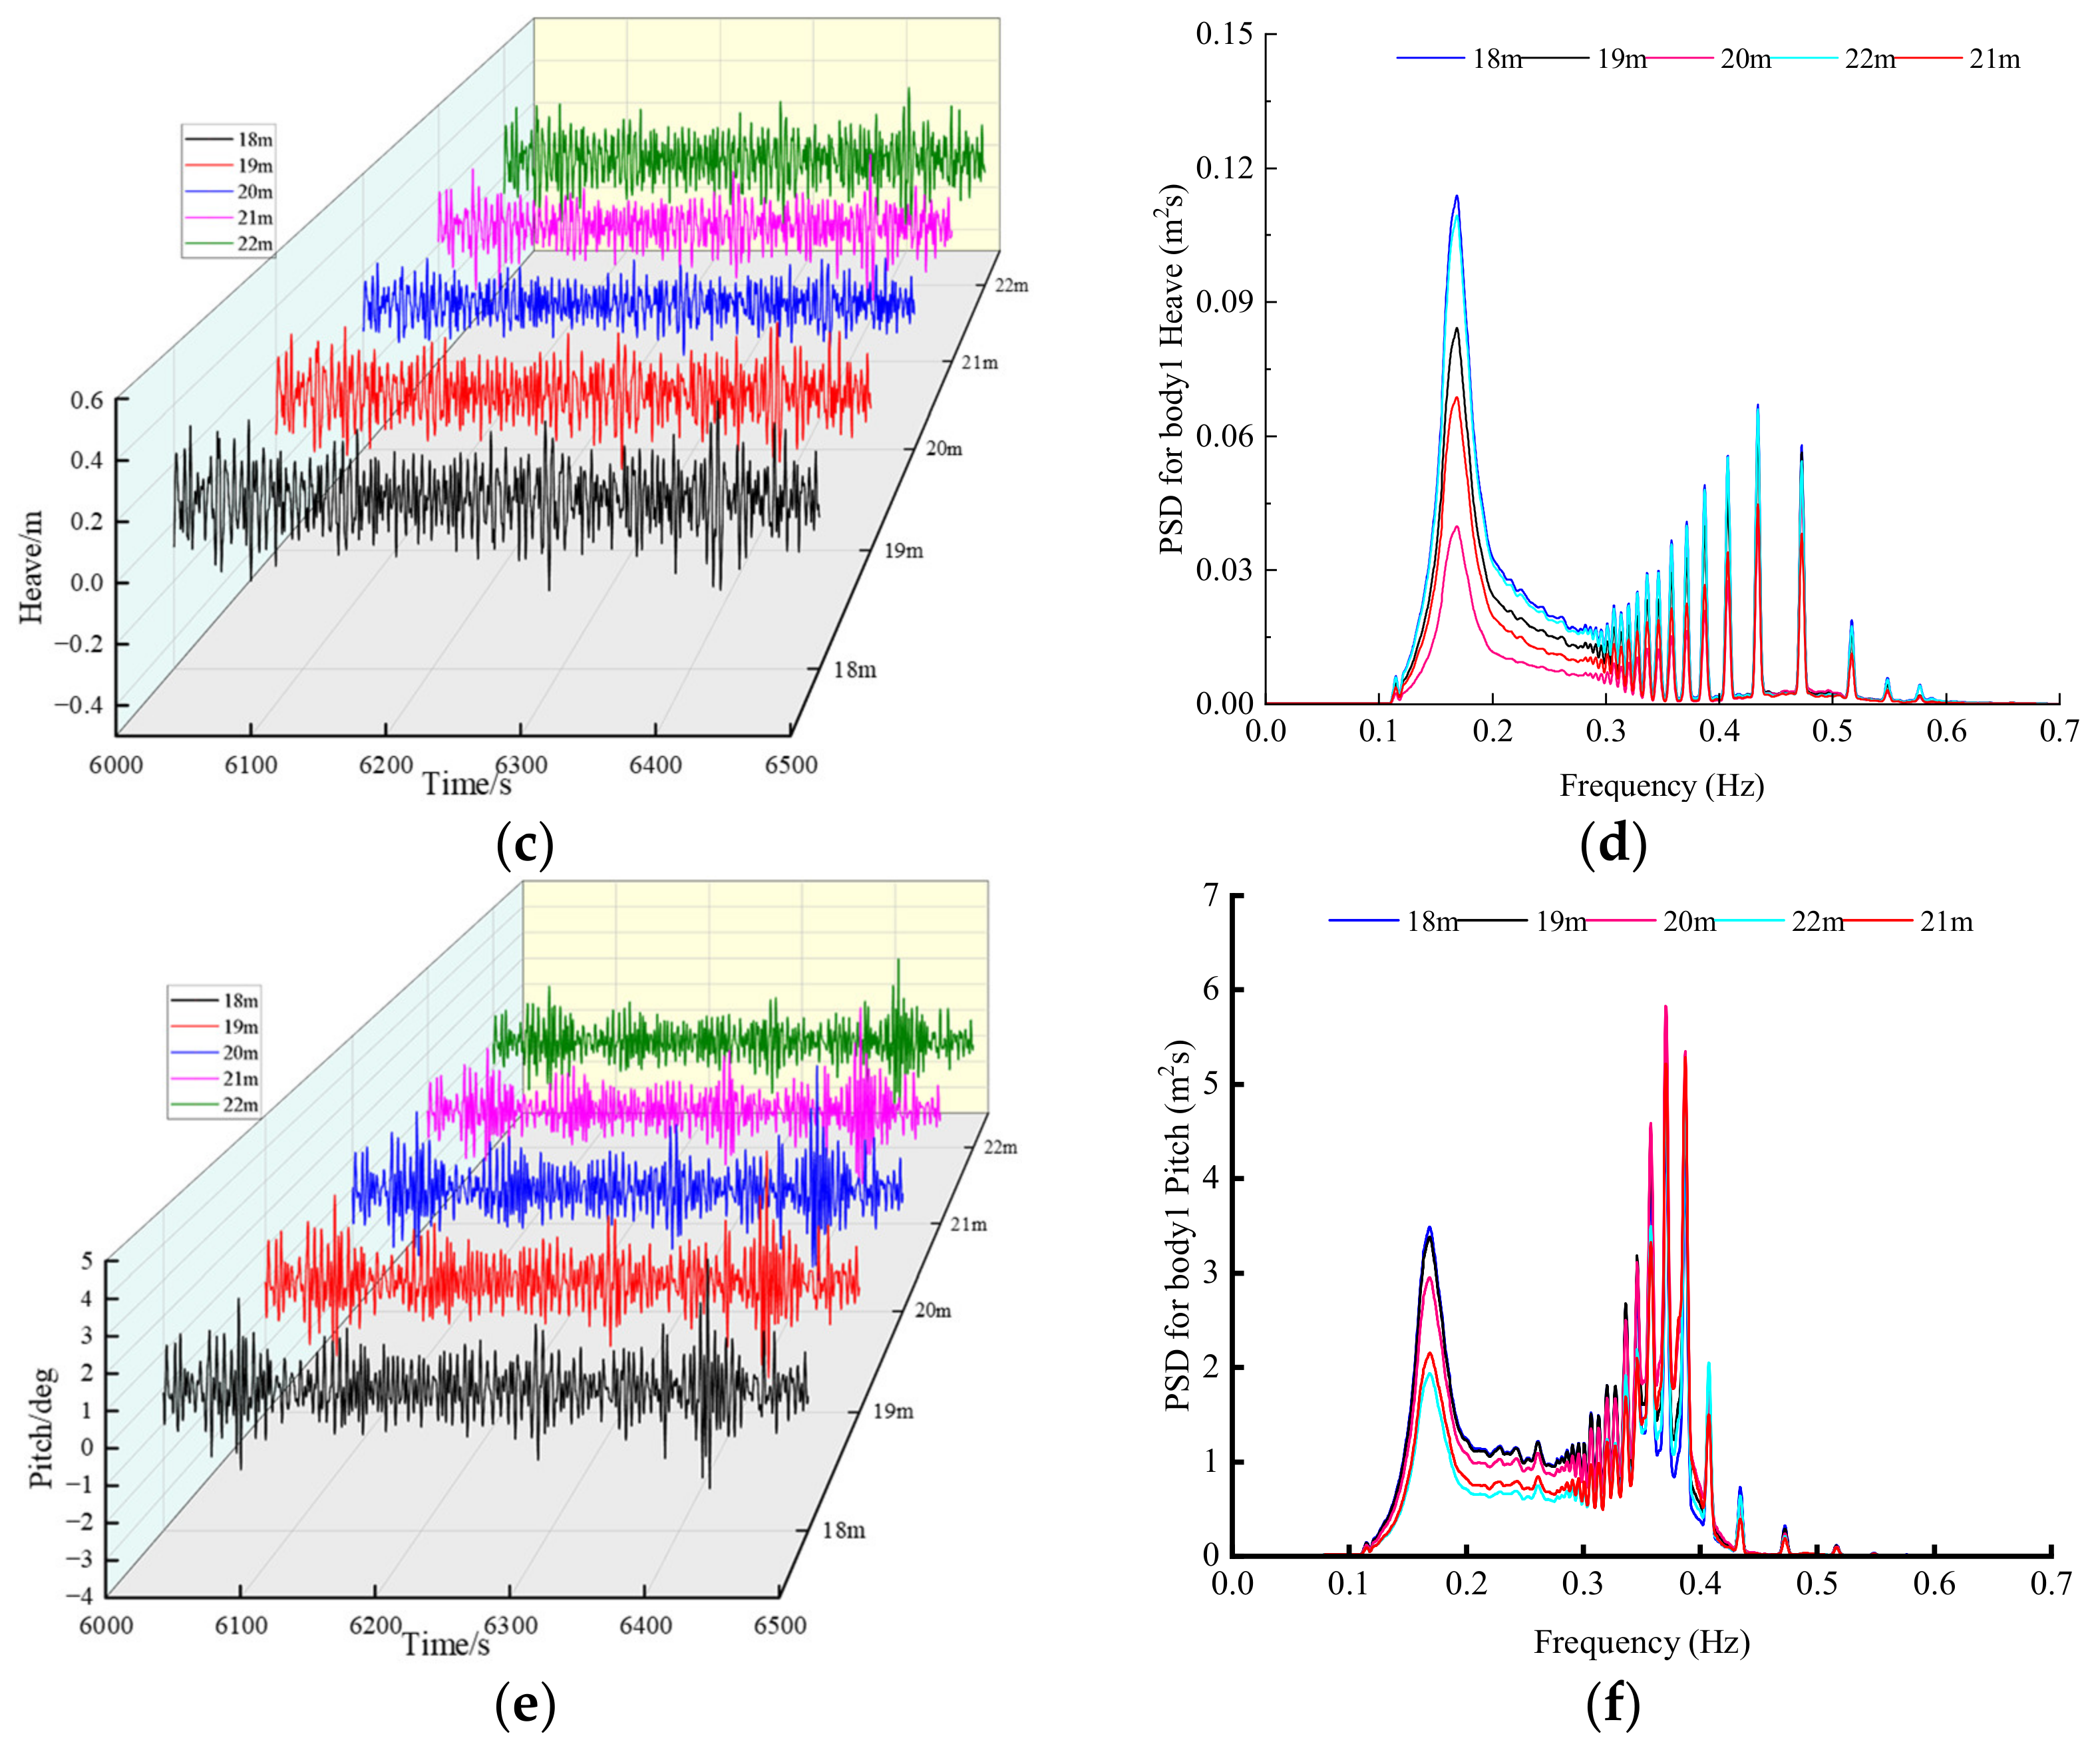
In this section, the JONSWAP wave spectrum with a peak enhancement factor γ = 3.3 is adopted for the operational condition. The NPD wind spectrum is selected with a wind speed of 8.7 m/s, and the current velocity is set to 0.3 m/s, representing an operational sea state. Time-domain simulations are performed in OrcaFlex for a dual-float floating photovoltaic platform under different spacing configurations, with a simulation duration of 12,000 s for each case. To clearly present the dynamic response characteristics, the computational results within the time window from 6000 s to 6500 s are extracted for graphical illustration. Since the wave incidence angle is 0°, There are two formats of them (Body 1 and Body 2) are symmetrically arranged with respect to the incoming flow direction, and their motion responses are essentially identical; therefore, Body 1 is selected as the analysis object. Figure 6 presents the time-history curves and the corresponding power spectral density (PSD) distributions of this float in the three principal degrees of freedom; namely, surge, heave, and pitch. The wave spectral peak frequency corresponding to this operational sea state is approximately 0.17 Hz.
As can be observed from the PSD spectra in Figure 6, the excitation mechanisms for motions in different degrees of freedom differ significantly. For surge, the energy is concentrated in the low-frequency band, and its spectral peak frequency is distinctly lower than the wave spectral peak frequency, indicating that the surge motion is not directly driven by first-order wave forces but is mainly governed by the second-order difference-frequency slow-drift force. This behaviour is consistent with the low-frequency slow-drift response characteristics of unmoored floating structures under regular waves. For heave, the PSD peak frequency coincides well with the wave spectral peak frequency, and the spectral energy is well concentrated, implying that heave is predominantly excited by first-order wave forces and exhibits typical characteristics of linear wave-forced motion. For pitch, the PSD distribution exhibits bimodal or multimodal features; its dominant frequency component is close to that of heave, suggesting a certain motion coupling between heave and pitch. In addition, non-negligible high-frequency energy components persist in the frequency band of 0.28–0.51 Hz, which lies above the dominant wave frequency. These high-frequency components are speculated to originate from hydrodynamic interference effects between the two float modules and local dynamic perturbations introduced by the elastic constraints of the connecting lines. The above spectral features reflect that, in a dual-float system, the mechanical coupling effects of the connecting components exert a non-negligible influence on the high-frequency response of the pitch degree of freedom.
To further quantify the influence of float spacing on the motion responses, the maximum response amplitudes of the float in each degree of freedom under different spacing cases are statistically summarised, and the results are listed in Table 5. In the surge direction, the maximum response amplitude is about 5.74 m at a spacing of 19 m, and the minimum about 5.29 m at 21 m; the variation among the different cases is approximately 7.8%, indicating a relatively limited range of change. In heave, the maximum amplitude is about 0.46 m at a spacing of 18 m, and the minimum about 0.42 m at 20 m; the overall fluctuation is small, suggesting that heave motion has low sensitivity to spacing variation. In pitch, the response amplitude is most significantly affected by spacing: the maximum is about 4.04° at 20 m, while the minimum is about 3.10° at 22 m, with a difference of about 23.3% in extreme values. This indicates that pitch motion is highly sensitive to changes in float spacing, mainly because the spacing variation substantially alters the hydrodynamic interference phase relationship between the two floats and the geometric stiffness characteristics of the connecting lines.
Considering the motion responses in the three directions comprehensively, when the float spacing is 21 m, the surge, heave, and pitch responses are all at relatively low or moderate levels, and the overall motion balance of the system is optimal. Therefore, within the range of discrete cases selected in this study, a spacing of 21 m can be considered a preferable design layout scheme. It should be emphasised, however, that this conclusion is only a local optimum under the present discrete sampling conditions, rather than the global optimum of the system.

4.2. Effect of Module Spacing on Connector Forces

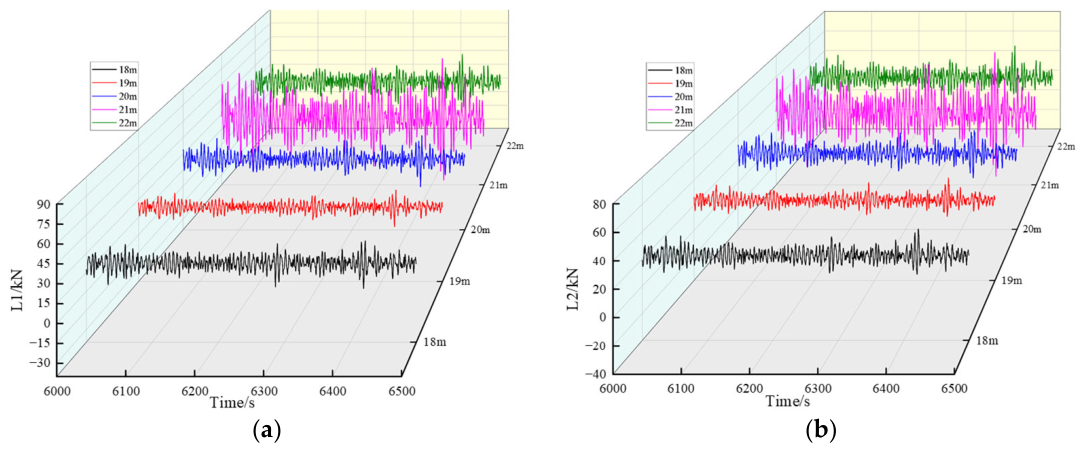
The forces acting on the connectors of the twin-float floating photovoltaic system under operating conditions are shown in Figure 7, whilst Table 6 summarises the maximum forces on the connectors. Overall, it can be observed that the loads on connector L1 and connector L2 are generally similar, with L1 reaching its maximum value at a spacing of 21 m. This is because waves reach the front connector L1 first, causing greater displacement; the resulting heave and rotation lead to a larger front-side lever arm. Consequently, under equal stiffness conditions, the difference in displacement is directly converted into a difference in force, resulting in the front-side L1 bearing a greater load than the rear-side L2. Furthermore, it can be observed that, generally speaking, the magnitude of the forces acting on the connecting members does not increase with an increase in spacing; rather, it first increases and then decreases, with a peak range. Specifically, in this study, when the spacing between the two floats is 19 m, the forces on the connecting members are at their minimum, with a maximum force of 38.28 kN; when the distance between the floats is 21 m, the force on the connecting member is at its maximum, with a maximum force of 91.96 kN, approximately 2.40 times the minimum force; when the distance between the floats increases to 22 m, the maximum force on the connecting member decreases by approximately 35.75%.
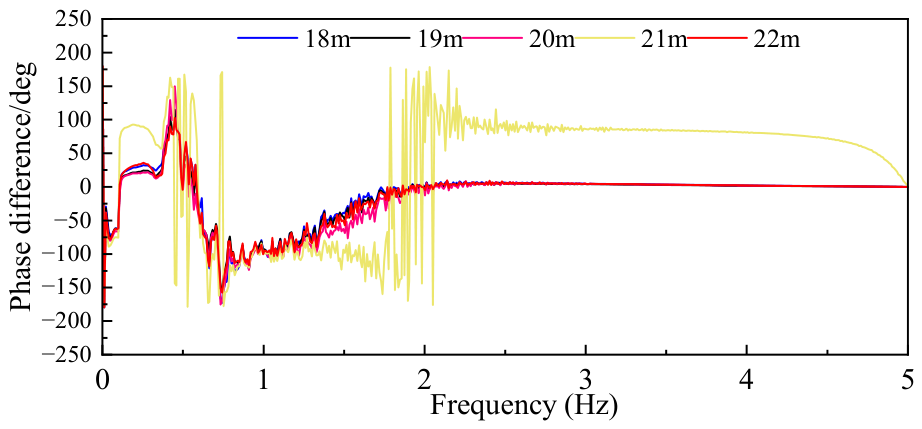
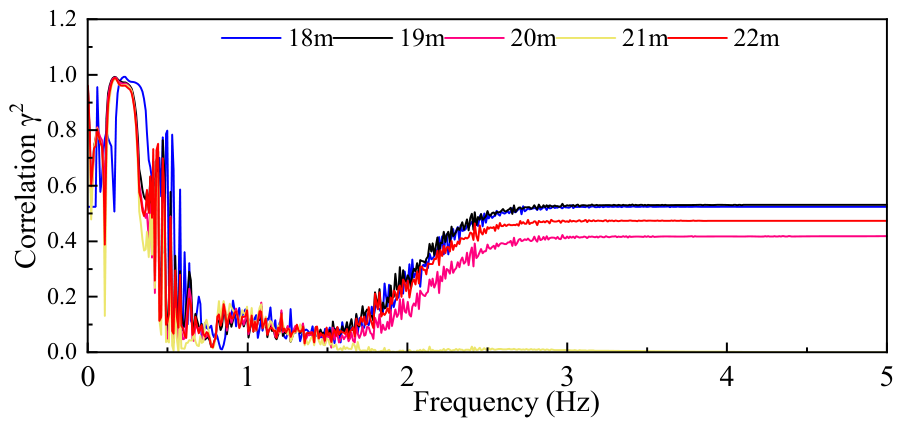
To investigate the underlying mechanism of this phenomenon, a cross-spectral analysis was performed on the time-history data of heave and pitch motions, yielding two key curves; i.e., the coherence function and the phase difference, as shown in Figure 8 and Figure 9, respectively. The coherence function γ2 is used to evaluate the statistical correlation between the two-time series: when γ2 > 0.8, the heave displacement and pitch angle are highly synchronized at that frequency, indicating a non-random and repeatable relationship with high confidence in the phase difference; when 0.3 < γ2 < 0.8, a moderate correlation exists and the phase difference is informative; when γ2 < 0.3, the two signals are essentially uncorrelated, and the phase difference is not meaningful.
Within the frequency range where γ2 > 0.8 in Figure 8, a weighted average of the phase differences shown in Figure 9 was computed, yielding phase differences of 25.46°, 23.87°, 21.98°, 84.96°, and 23.2° for twin-floater spacings of 18 m, 19 m, 20 m, 21 m, and 22 m, respectively. However, it should be particularly noted that the phase-difference curve for the 21 m spacing in Figure 9 exhibits violent fluctuations within the frequency band of 1.5–2.1 Hz, and a sharp drop near 5 Hz, which is distinctly inconsistent with the smooth and continuous variation observed for the other spacings (18 m, 19 m, 20 m, and 22 m). This abnormal feature strongly suggests potential issues at the numerical post-processing stage, such as failure of phase unwrapping or local numerical singularities in the solver. Consequently, the calculated phase difference (84.96°) for the 21 m spacing is of low reliability and should not be directly adopted as a quantitative criterion for the coupling mechanism.
Nevertheless, after excluding this anomalous datum, the phase differences for the remaining spacings all fall within the range of 20–26°, whereas only at the 21 m spacing is the pitch–heave coupling effect significantly enhanced, accompanied by high-frequency stretching action, which results in the largest tensile force on the connector under this spacing. It is therefore recommended that the 21 m spacing be avoided in practical engineering design, or alternatively, the connector structural configuration be optimized to suppress this coupling effect.

4.3. Connector Load Mitigation Based on Heave–Pitch Coupling Analysis

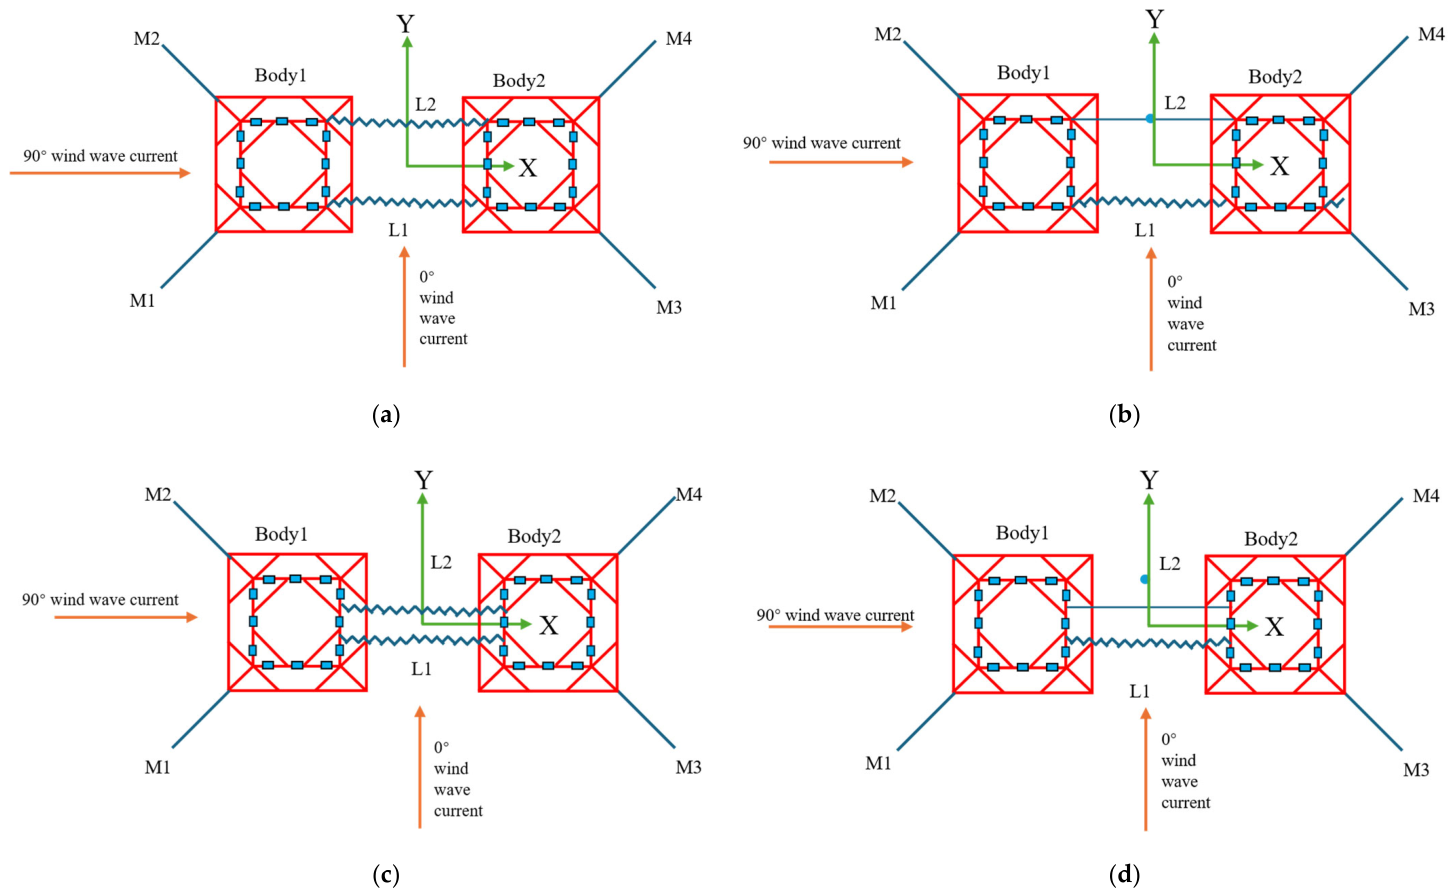
In the multi-module coupled design of floating structures, there are currently no established multi-row connection schemes for offshore floating photovoltaic systems; based on the magnitude of permissible displacement between modules, connection types are primarily categorized into two forms: rigid connections and flexible connections. Under operational sea conditions, when the distance between floats is 21 m, the motion response of the floating PV platform is relatively stable, but this has a significant impact on power generation. However, at this spacing, coupled resonance occurs, causing the connecting components to be subjected to substantial forces, which severely affects their service life. To ensure the PV system can operate smoothly at this spacing, the connection components require optimized design. Consequently, this study proposes a connection method and connection positions, comprising a total of four connection configurations as shown in Figure 10. Another connection method involves adding a damping device to the elastic connection and installing it at different positions on different floating PV platforms to investigate the impact of varying connection component positions and connection types on the forces exerted.
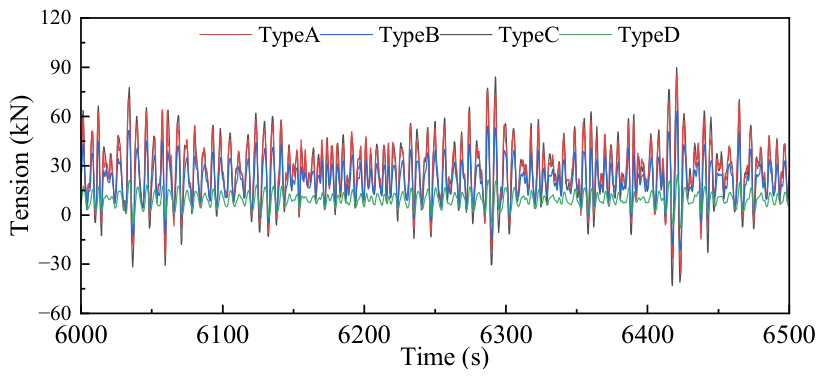
Based on the conclusions from the preceding section, the spacing between the floating bodies is selected as 21 m, and numerical simulations are carried out under the operational sea state. The damper is implemented via the Constraint module in OrcaFlex, with a damping coefficient of 500 kN·m·s/deg. Given that only the connection configuration between the twin floating bodies is altered, while the primary resonance frequency, mass-stiffness characteristics, and external excitation of the system remain unchanged, the response amplitudes of the platform in heave, surge, and pitch are essentially unchanged. Accordingly, this section only presents the load response of connector L1, with the corresponding time-history curves shown in Figure 11.
For the four connection configurations (Types A, B, C, and D), the maximum axial forces on connector L1 are 91.96 kN, 65.28 kN, 98.30 kN, and 24.95 kN, respectively. Compared with the baseline configuration, Type B exhibits a reduction of 29.01% in the maximum force, while Type D shows a reduction of 72.87%; Type C, however, presents an increase of 6.89%.
It is clearly observed from Figure 11 that the incorporation of the damper significantly reduces the peak loads on the connector. Among all configurations, Type D yields the lowest force, which is attributed to the effective dissipation of wave energy by the damper. By suppressing the relative displacements between the floating bodies and mitigating resonance amplification effects, the damper substantially decreases the peak stress, stress amplitude, and fatigue cycle counts of the connector, thereby prolonging its service life. Furthermore, the analysis also indicates that for the purely elastic connection scheme, reducing the transverse spacing between the two elastic connectors does not lower the loads; on the contrary, it leads to higher forces. However, for the combined “elastic connector + damper” configuration, shortening the same spacing results in a notable decrease in the elastic connector forces. The underlying mechanism is as follows: in the purely elastic case, the pitch moment induced by transverse external loads remains essentially constant; when the spacing is reduced, the lever arm decreases, and thus each elastic connector must provide a larger tensile force to maintain moment equilibrium, which increases the loads. In contrast, when one of the connectors is replaced by a damper, the damper dissipates the resonant energy of the system, causing the attenuation of the actual vibration amplitude to exceed the lever effect arising from the shortened lever arm, ultimately leading to an overall reduction in the connector forces.

5. Hydrodynamic Response Analysis of the 4 × 4 FPV Array

5.1. 4 × 4 FPV Array Model and Mooring Layout

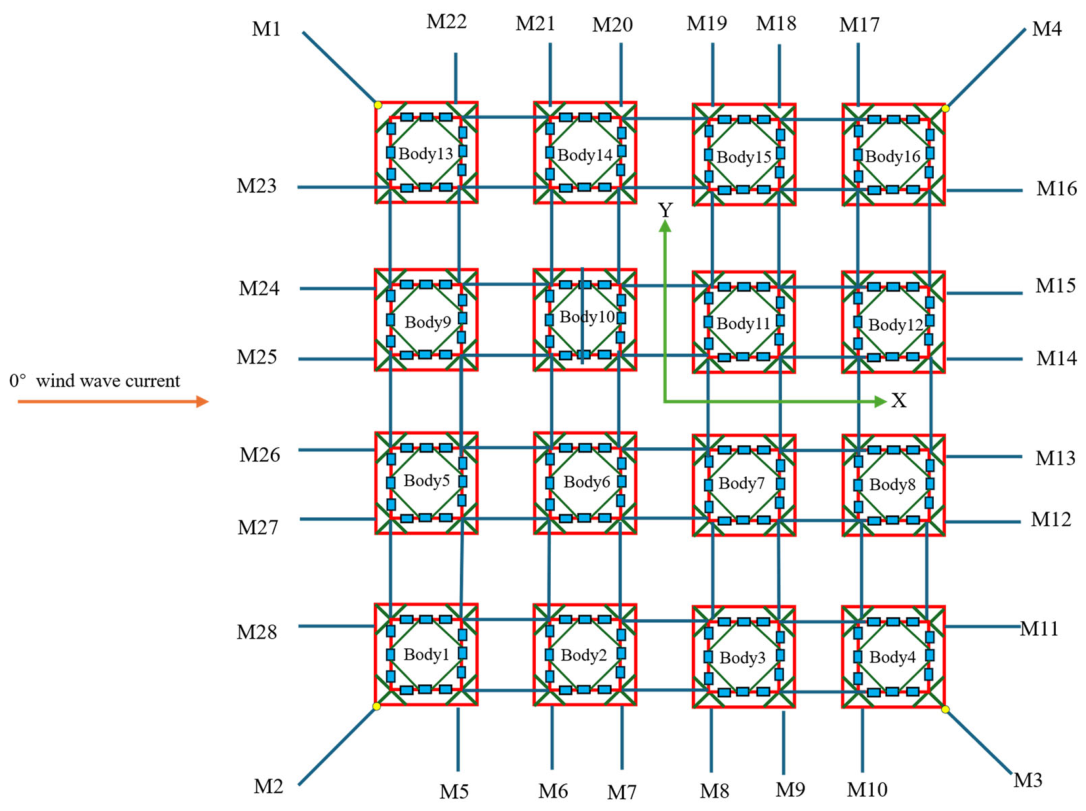
The mooring lines are arranged along the periphery of the floating bodies in a symmetrical radial distribution among the modules. The specific number and spatial layout of these mooring lines are determined according to the following design criteria: (1) since both ends of the internal flexible connectors are hinged and can only transmit axial tension (without transmitting bending moments), all horizontal environmental loads from wind, waves, and currents are ultimately concentrated onto the four corner floating bodies through the longitudinal and transverse connectors, which necessitates that the mooring attachment points be predominantly located at the outer corners; (2) the symmetrical radial layout (with a 90° angle between adjacent main lines) ensures uniform resistance against loads from any direction and effectively suppresses the yaw motion of the entire platform; (3) under extreme environmental conditions in the target sea area, the maximum dynamic tension of any mooring line obtained through time-domain coupled analysis shall not exceed the minimum breaking strength (1000 kN) divided by an appropriate safety factor; and (4) the system is designed to ensure that failure of any single mooring line will not impair the station-keeping capability, and the remaining lines can still maintain the array within acceptable displacement limits. Based on iterative numerical verification against the design environmental loads, the configuration shown in Figure 12 was finally adopted, which satisfies all the above constraints within reasonable margins.
Owing to the array configuration, the 16 floating bodies are “locked” together, resulting in an instantaneous increase in the total mass by several times. The internal flexible connectors can only transmit tensile forces without transferring bending moments; therefore, the horizontal forces acting on the photovoltaic array under wind, waves, and currents are eventually concentrated onto the four corner floating bodies through the longitudinal and transverse connecting members. Moreover, the “total displacement” of the array floats also increases accordingly. Consequently, the mooring line parameters derived for a single floating photovoltaic system cannot be directly applied. The mooring system for the array-types floating photovoltaic system still adopts a catenary configuration, with the fairleads located at the end points of the bottom truss. The angles between mooring lines M1, M2, M3, and M4 are 90°, and the minimum breaking strength is 1000 kN. Table 7 lists the mooring parameters for the array-type photovoltaic platform. Figure 12 presents a schematic diagram of the mooring arrangement of the FPV array.

5.2. Surge Motion Response of the FPV Array

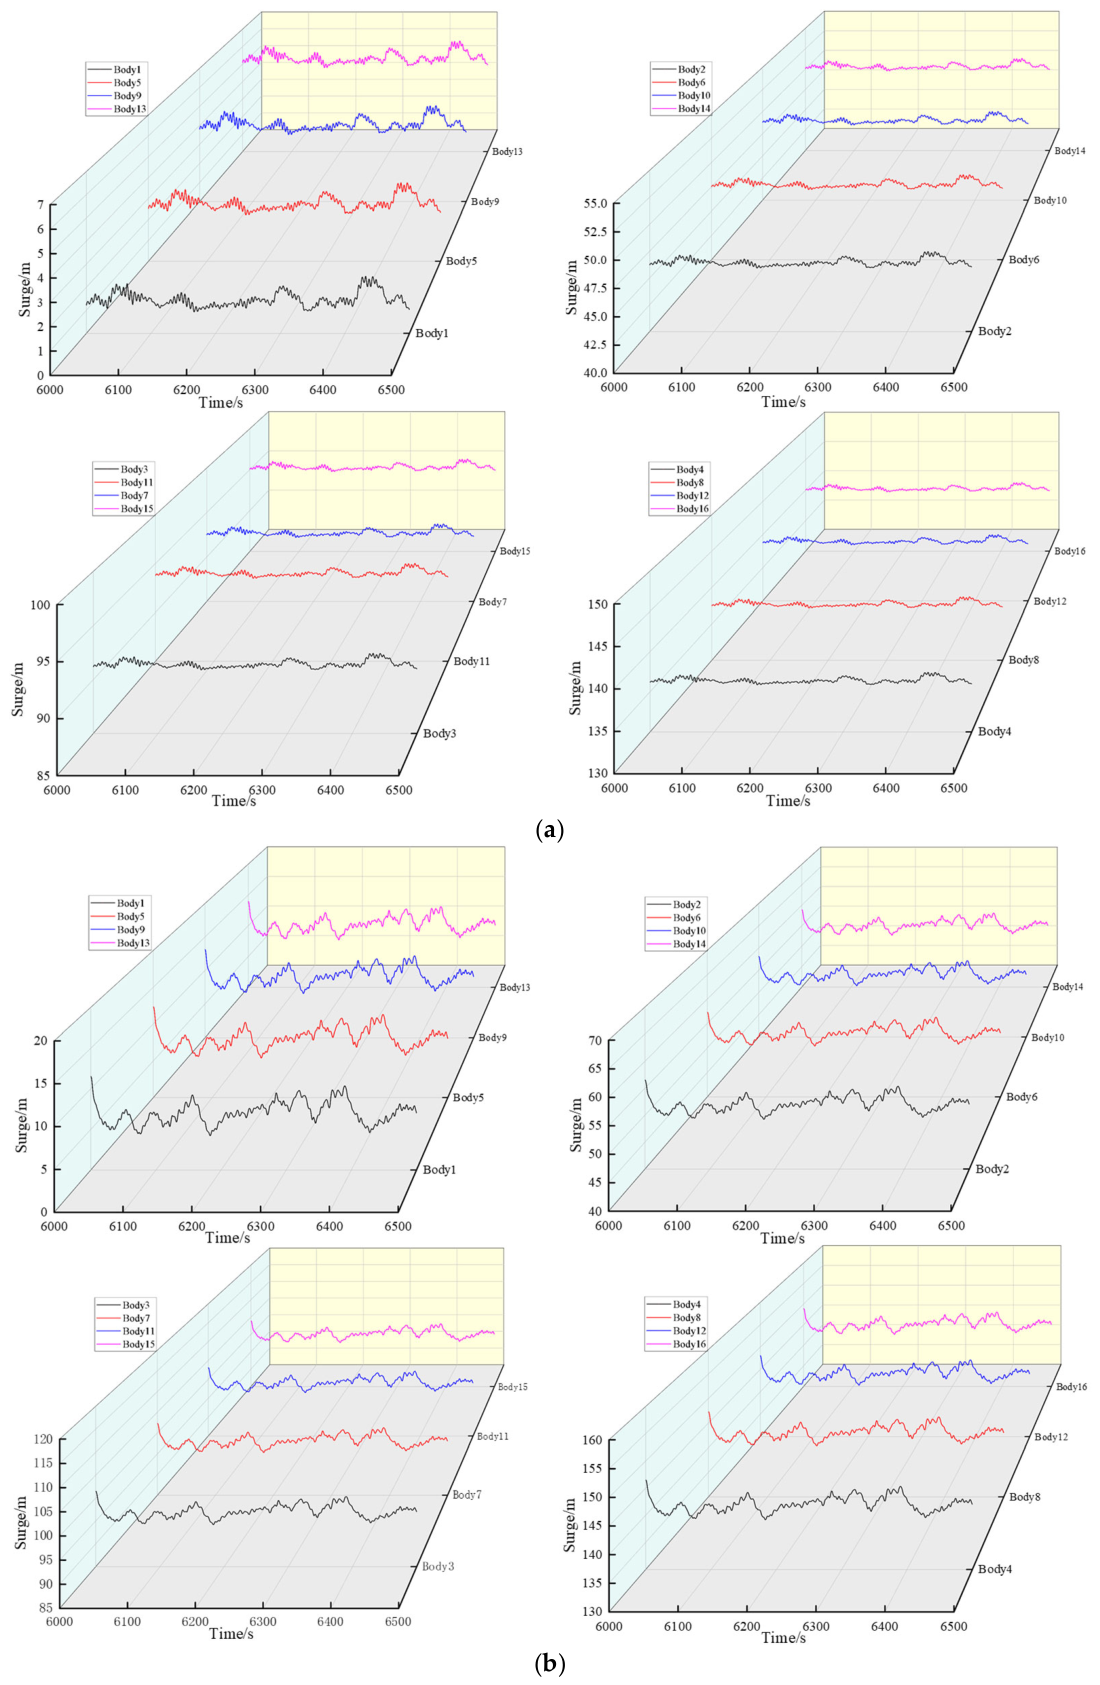
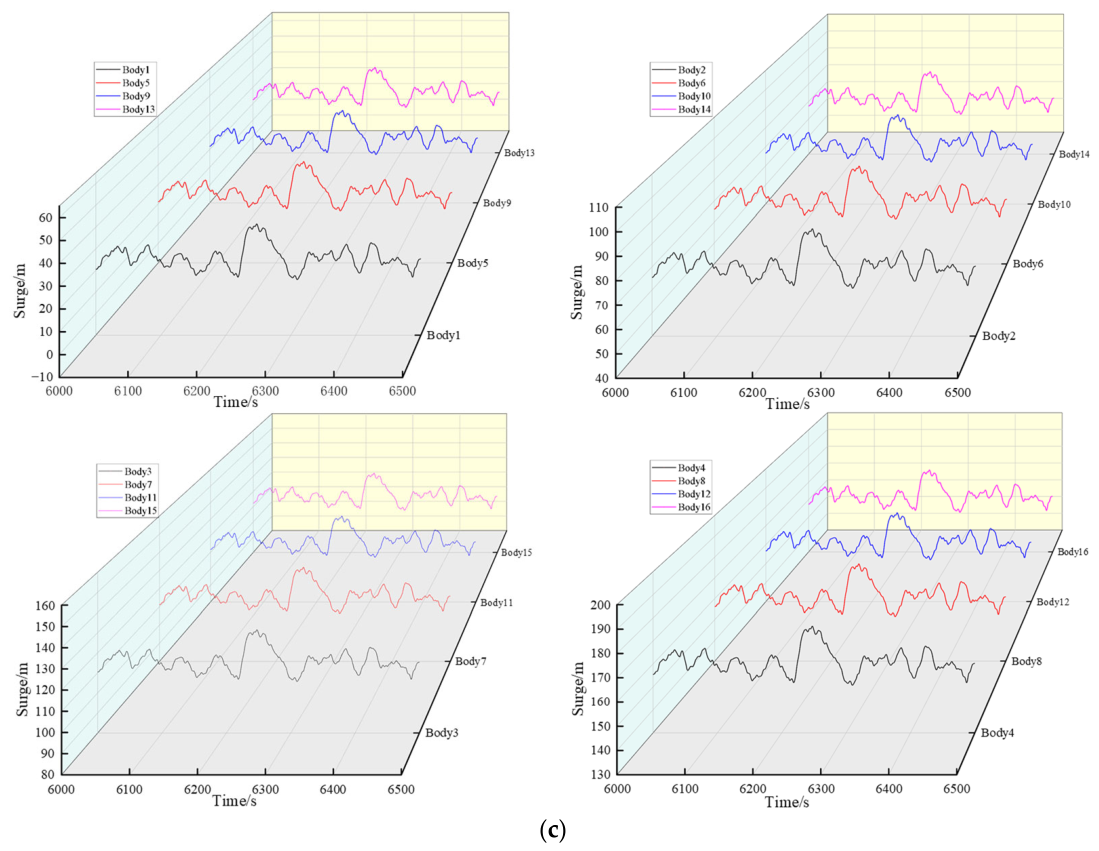
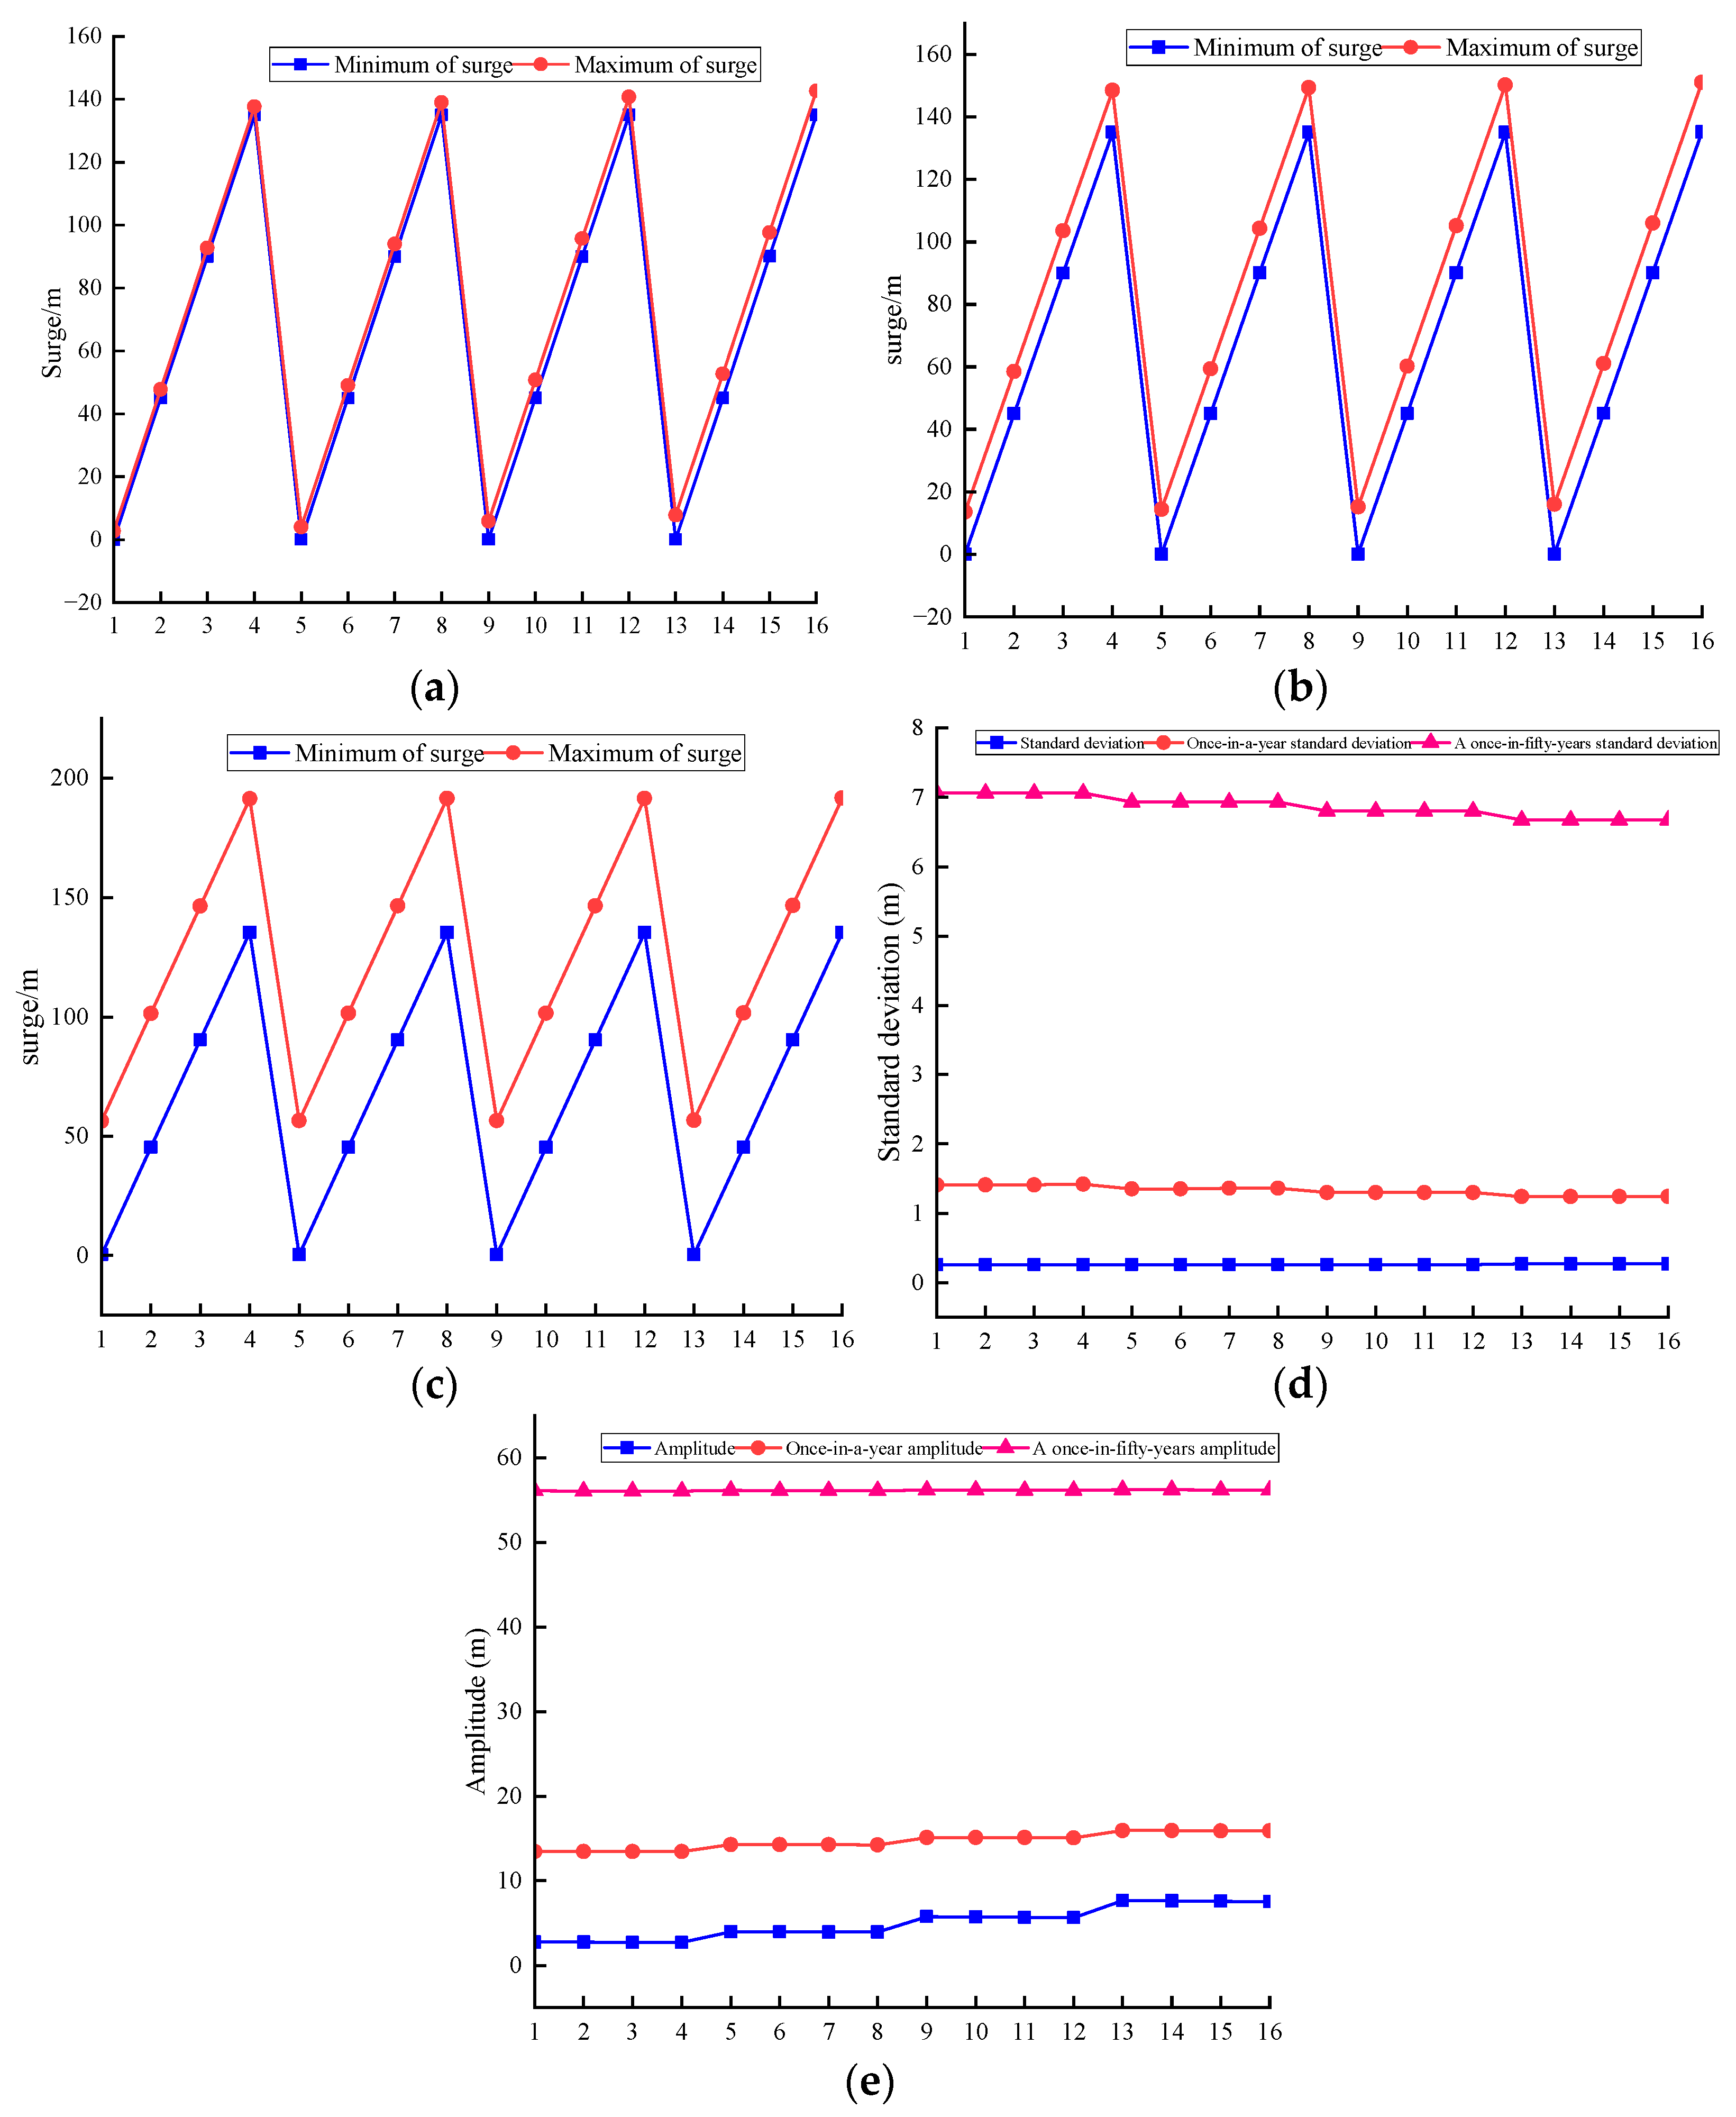
Under the 4 × 4 array arrangement, fully coupled time-domain simulations were conducted for 16 floating photovoltaic units over a total duration of 12,000 s, with the wave incidence angle set to 0°. Given that the motion response curves over the entire 12,000 s are too dense for clear presentation, the time window from 6000 s to 6500 s was extracted for illustration. Figure 13 presents the surge time-history curves for each photovoltaic platform. The surge amplitudes of all units, irrespective of their positions (upstream, downstream, or lateral), exhibit a monotonic increase as the sea state worsens from the operational condition to the 50-year return period condition. Under both the operational and 1-year return period conditions, a pronounced “edge amplification effect” is observed: peripheral modules consistently experience greater surge motions than their interior counterparts. This phenomenon aligns with the findings of Zou et al. [34], who reported similar edge-dominant behaviour in axial force responses for outer-frame components.
To identify the dominant physical mechanism underlying this edge amplification effect, three potential factors are examined: (1) wave diffraction and shielding effects due to wave incidence; (2) spatially non-uniform distribution of mooring system stiffness; and (3) non-uniform transmission of dynamic loads through the spring-damper connector network among floats. For the operational condition, the statistical data in Figure 14 show that the surge response amplitudes in the first column on the wave-facing side (body 1–body 4) are relatively small, with body 4 being the smallest (approximately 2.72 m), whereas those in the fourth column on the leeward side (body 13–body 16) are considerably larger, with body 13 reaching the maximum (approximately 7.68 m). Within the same column (body 1, body 5, body 9, body 13), the amplitude increases along the wave propagation direction, with a maximum difference of 4.91 m. This distribution pattern contradicts the expectation from pure wave shielding effects (which would typically reduce downstream amplitudes) but correlates strongly with the spatial distribution of mooring stiffness—the upstream mooring lines have lower pretension, while the downstream mooring lines exhibit increased equivalent stiffness due to cumulative constraints. Consequently, the upstream floats are less constrained and their responses are amplified, indicating that the edge amplification effect primarily originates from the non-uniform spatial distribution of mooring system stiffness, rather than from wave diffraction or uneven dynamic transmission through the connectors. Furthermore, under the 1-year return-period condition, the minimum amplitude remains at body 4 (approximately 13.46 m) and the maximum at body 13 (approximately 15.95 m), but the maximum difference within the same column reduces to 2.47 m, suggesting that as the sea state worsens, the increased mooring line tension relatively diminishes the stiffness non-uniformity, thereby alleviating the edge effect.
Under the extreme 50-year return-period condition, the surge amplitudes of all photovoltaic units become essentially consistent. At this stage, both the mooring lines and the float connectors enter a high-stiffness limit state, the entire array behaves as a single rigid-body motion mode, the hydrodynamic phase differences among individual units approach zero, the surge mode becomes locked, and the edge amplification effect disappears. This evolutionary process further corroborates that, under the operational condition, the primary cause of the edge effect is not the spatial variation of the wave field but rather the spatial non-uniformity of mooring stiffness.
In summary, the observed edge amplification effect, under the operational and 1-year return-period conditions, is mainly attributed to the non-uniform distribution of mooring system stiffness along the wave propagation direction, while the non-uniform dynamic transmission through connectors and wave diffraction effects play a minor role in this study. This conclusion provides some recommendations for the optimization design of array mooring systems, such as emphasizing the adjustment of stiffness configurations between upstream and downstream mooring lines to suppress the edge amplitude amplification under operational conditions.

5.3. Heave Motion Response of the FPV Array

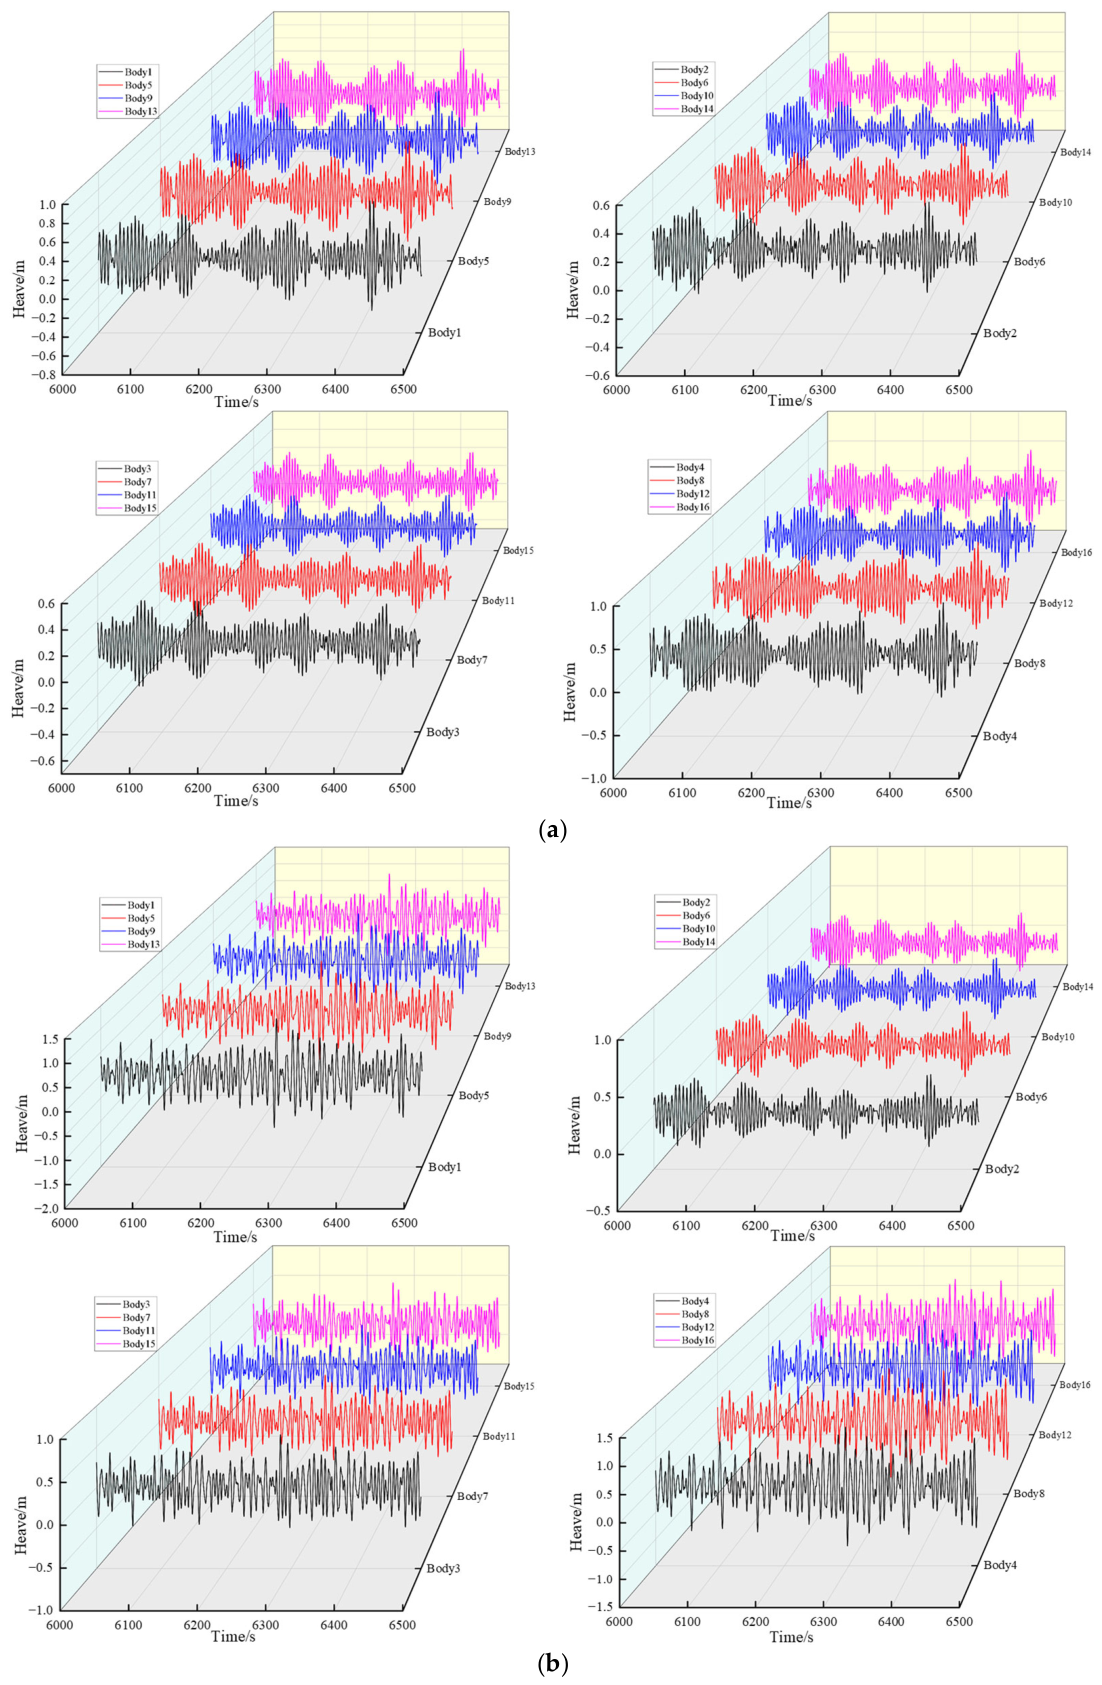
Figure 15 shows the time-history plot of the motion response of the 4 × 4 array photovoltaic platform in the heave direction. It is clear from the figure that the heave motion is significantly affected by the array’s shadowing effect. The motion response of each floating photovoltaic unit gradually increases as environmental conditions deteriorate.
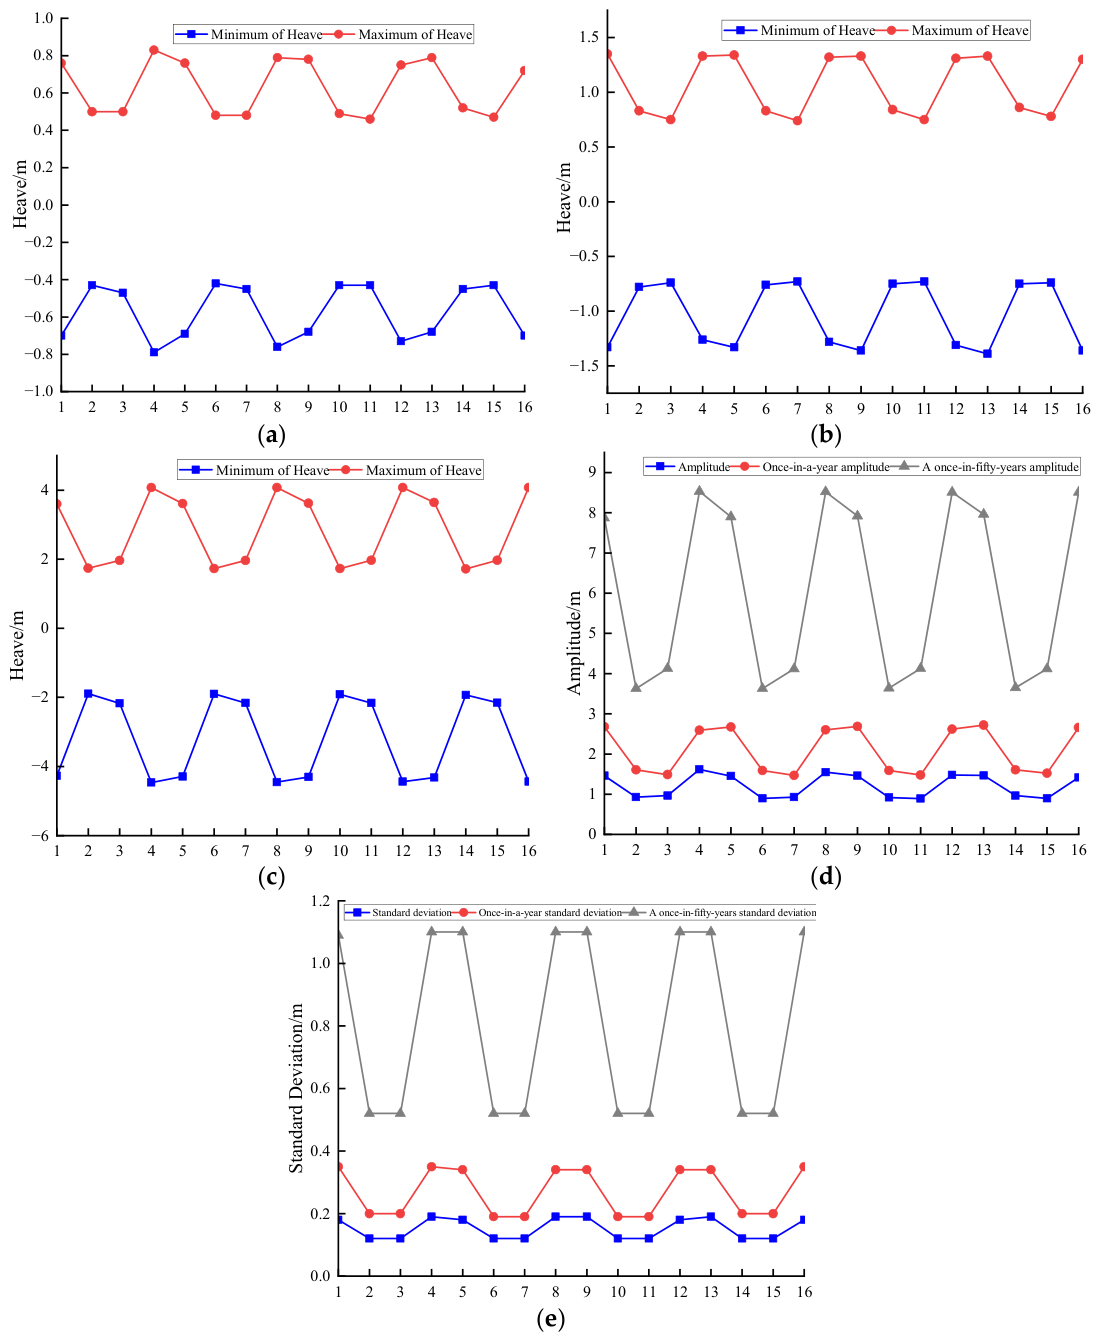
Figure 16a presents the statistical distribution of heave responses under operating conditions. The amplitudes are larger for the floating photovoltaic (PV) units at the two ends and smaller for those in the central position. Specifically, the minimum single amplitude, approximately 0.89 m, occurs at body 11, whereas the maximum single amplitude, approximately 1.62 m, occurs at body 4.
Figure 16b shows the corresponding statistical results under severe conditions. The response amplitudes for each column remain largely uniform, with values of approximately 2.69 m, 1.60 m, 1.49 m, and 2.61 m from left to right. Moreover, under these conditions, the amplitudes on the windward side are higher than those on the leeward side.
Figure 16c illustrates the heave responses under extreme conditions. The inner units consistently exhibit smaller motion amplitudes than the outer units. However, in this case, the amplitudes on the windward side are smaller than those on the leeward side. Specifically, the absolute single amplitudes for body 1, body 5, body 9, and body 13 on the windward side are 7.87 m, 7.90 m, 7.92 m, and 7.96 m, respectively, while those for body 4, body 8, body 12, and body16 on the leeward side are 8.53 m, 8.52 m, 8.51 m, and 8.51 m, respectively. This phenomenon is attributed to the fact that the wave-facing units are the first to be struck by incoming waves, where part of the wave energy is dissipated through reflection, radiation, and the screening effect induced by the array configuration. The residual waves continue propagating towards the leeward side and undergo multiple diffraction and superposition due to the multi-row arrangement. As a result, the effective wave height on the leeward side increases, while the added mass and damping decrease, leading to a strengthened heave excitation force. Consequently, the heave amplitude on the leeward side is significantly greater than that on the wave-facing side.

5.4. Pitch Motion Response of the FPV Array

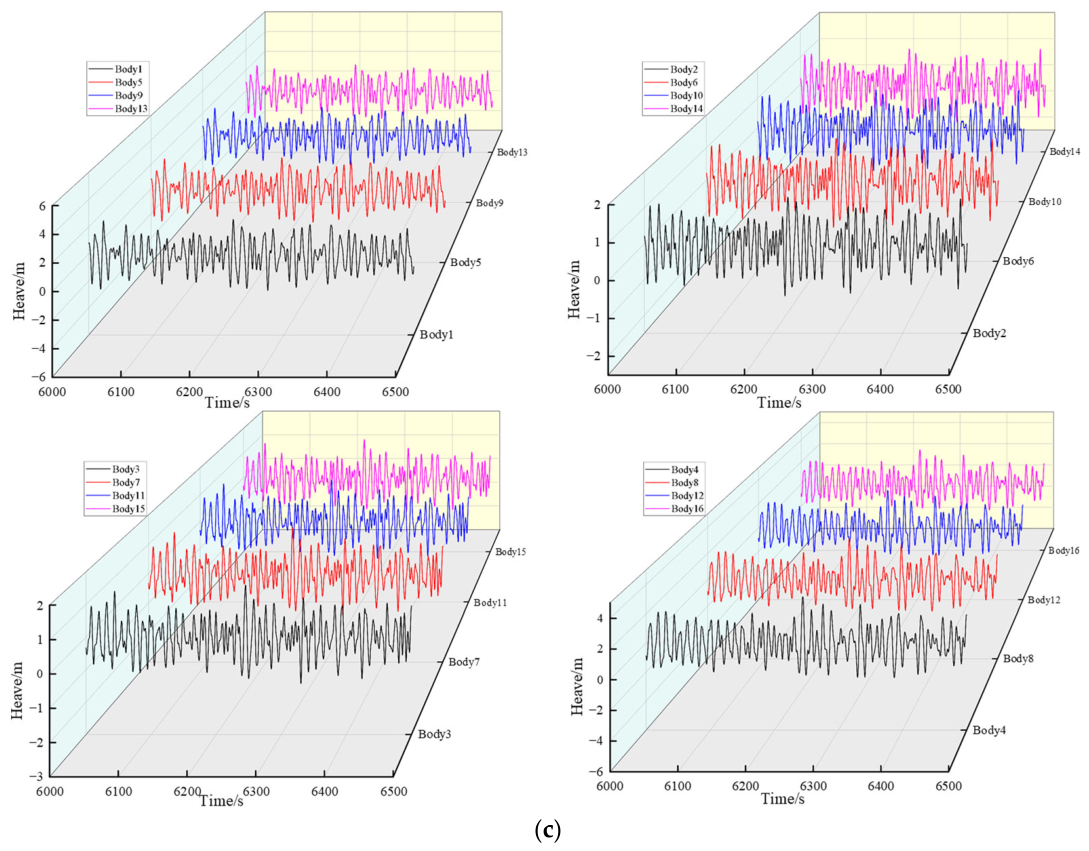
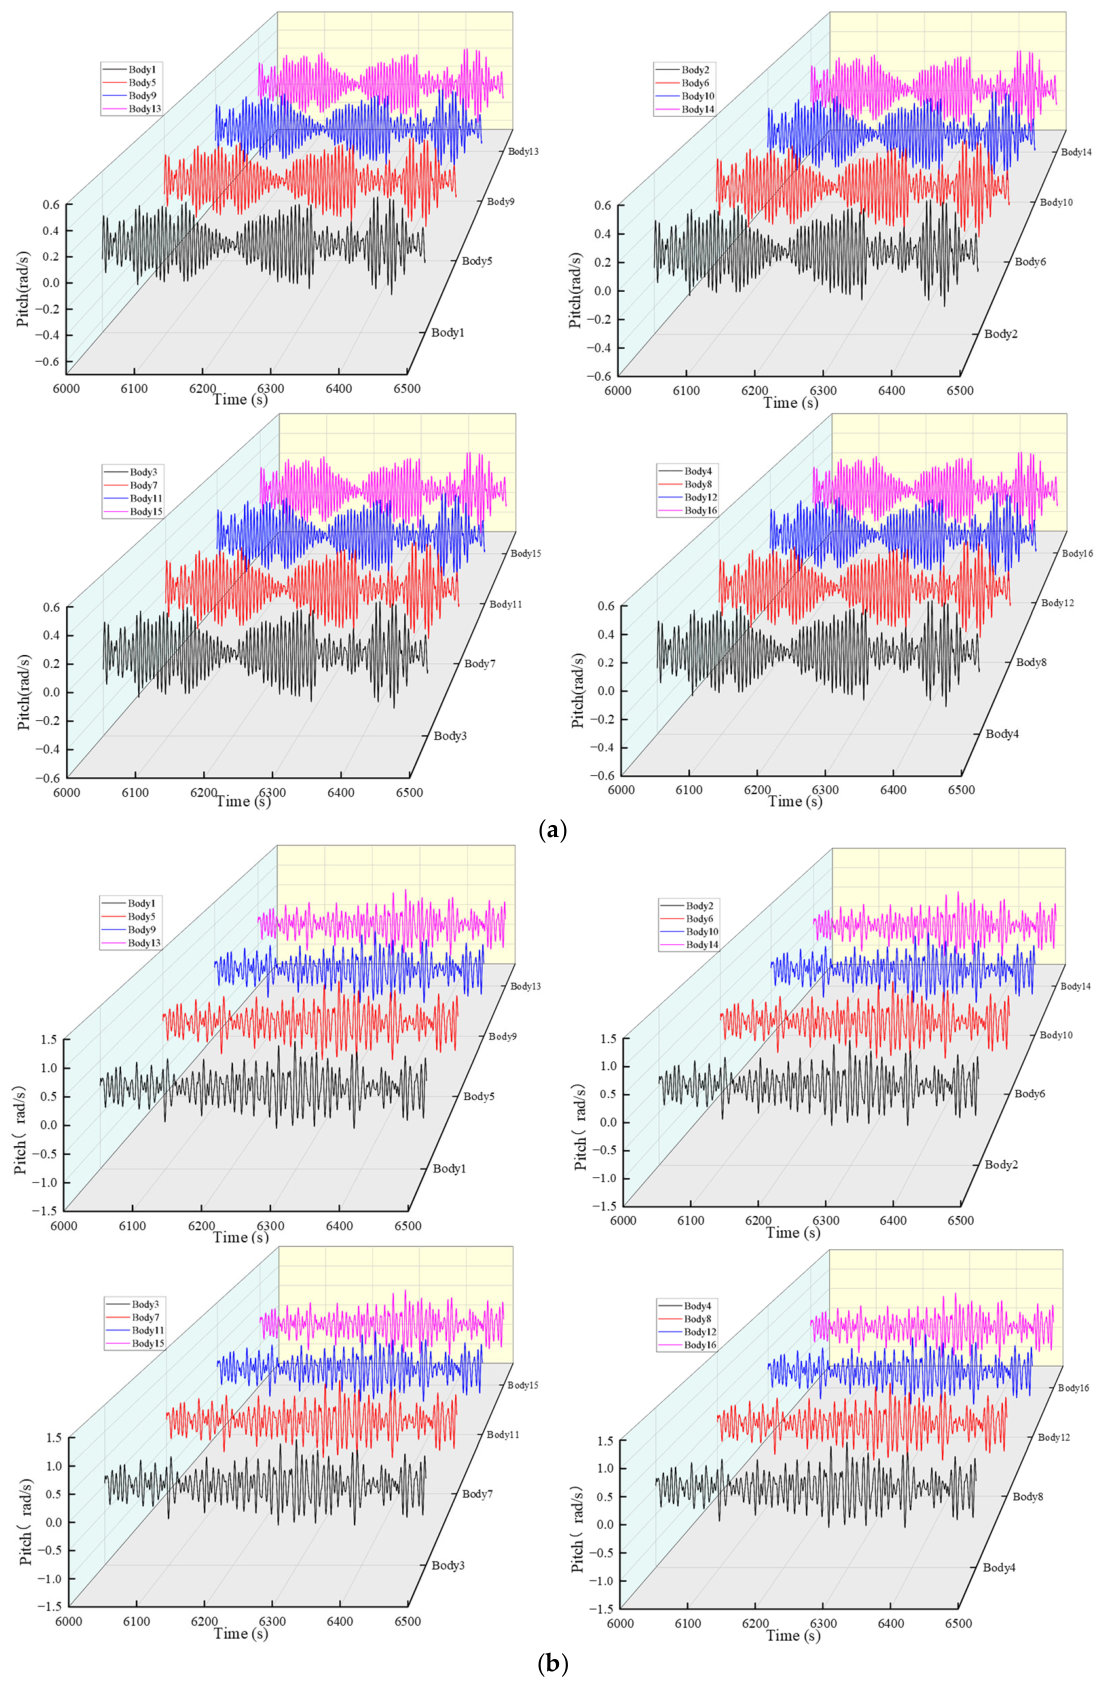
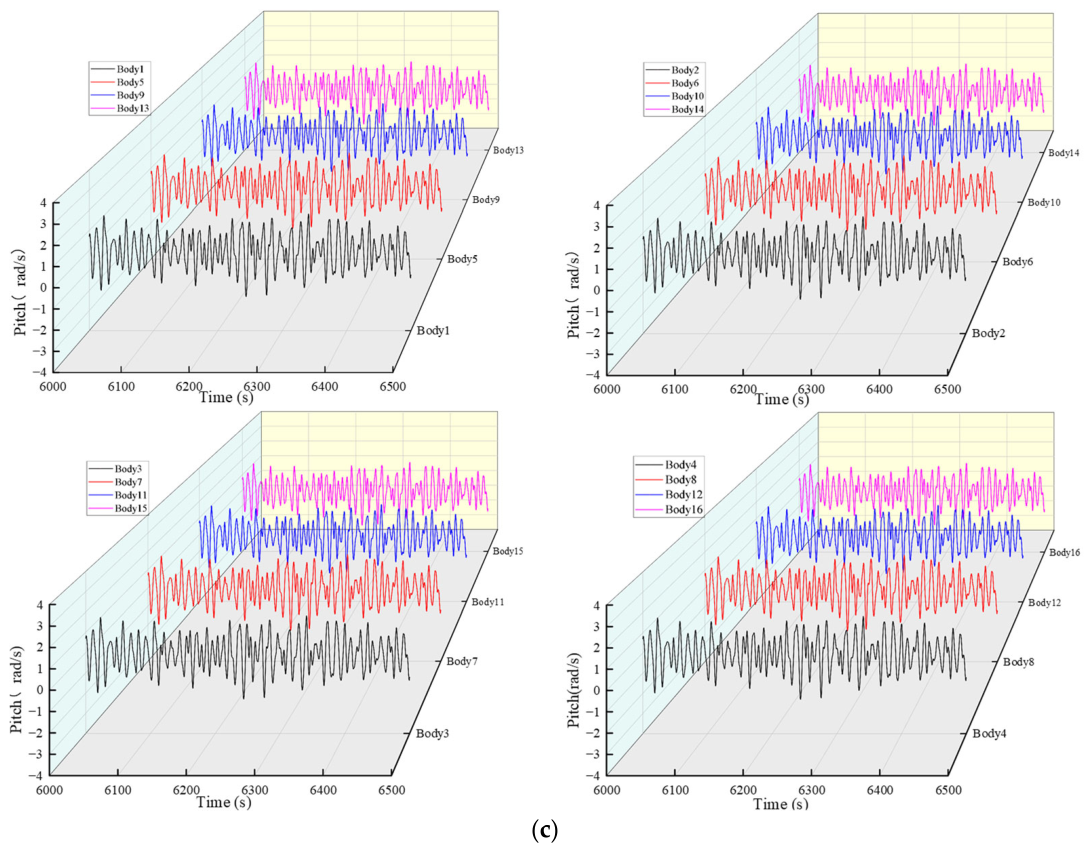
Figure 17 displays the time-domain pitch response histories of the 4 × 4 floating photovoltaic array under different sea states. It is observed that, for the operational, 1-year, and 50-year return-period conditions, the pitch amplitudes do not exhibit any notable spatial variation across the array elements. In quantitative terms, the pitch amplitudes remain virtually identical for all units under each condition, with mean values of approximately 0.98°, 2.07°, and 6.22°, respectively. The corresponding peak positive values are 0.49°, 1.09°, and 3.01°, while the peak negative values reach −0.49°, −0.98°, and −3.21°, respectively.
This behaviour can be primarily attributed to the dominance of global structural stiffness in the array dynamics. The spring-damper connectors provide high rotational restraint stiffness in both the horizontal and vertical planes, effectively rendering the 16 floating PV units a strongly coupled quasi-rigid system. Under this strong constraint, the pitch natural frequency of the array becomes considerably higher than the dominant frequency band of the incident wave energy. Consequently, wave-induced pitching excitation acts essentially as a quasi-static forcing mechanism rather than a resonant driver. As a result, the entire 4 × 4 array undergoes a coherent rigid-body pitch motion that follows the instantaneous slope of the wave surface, while relative rotational displacements among individual modules are largely suppressed. This leads to nearly identical pitch amplitudes and phases across all array positions.

5.5. Air-Gap Response of the FPV Array

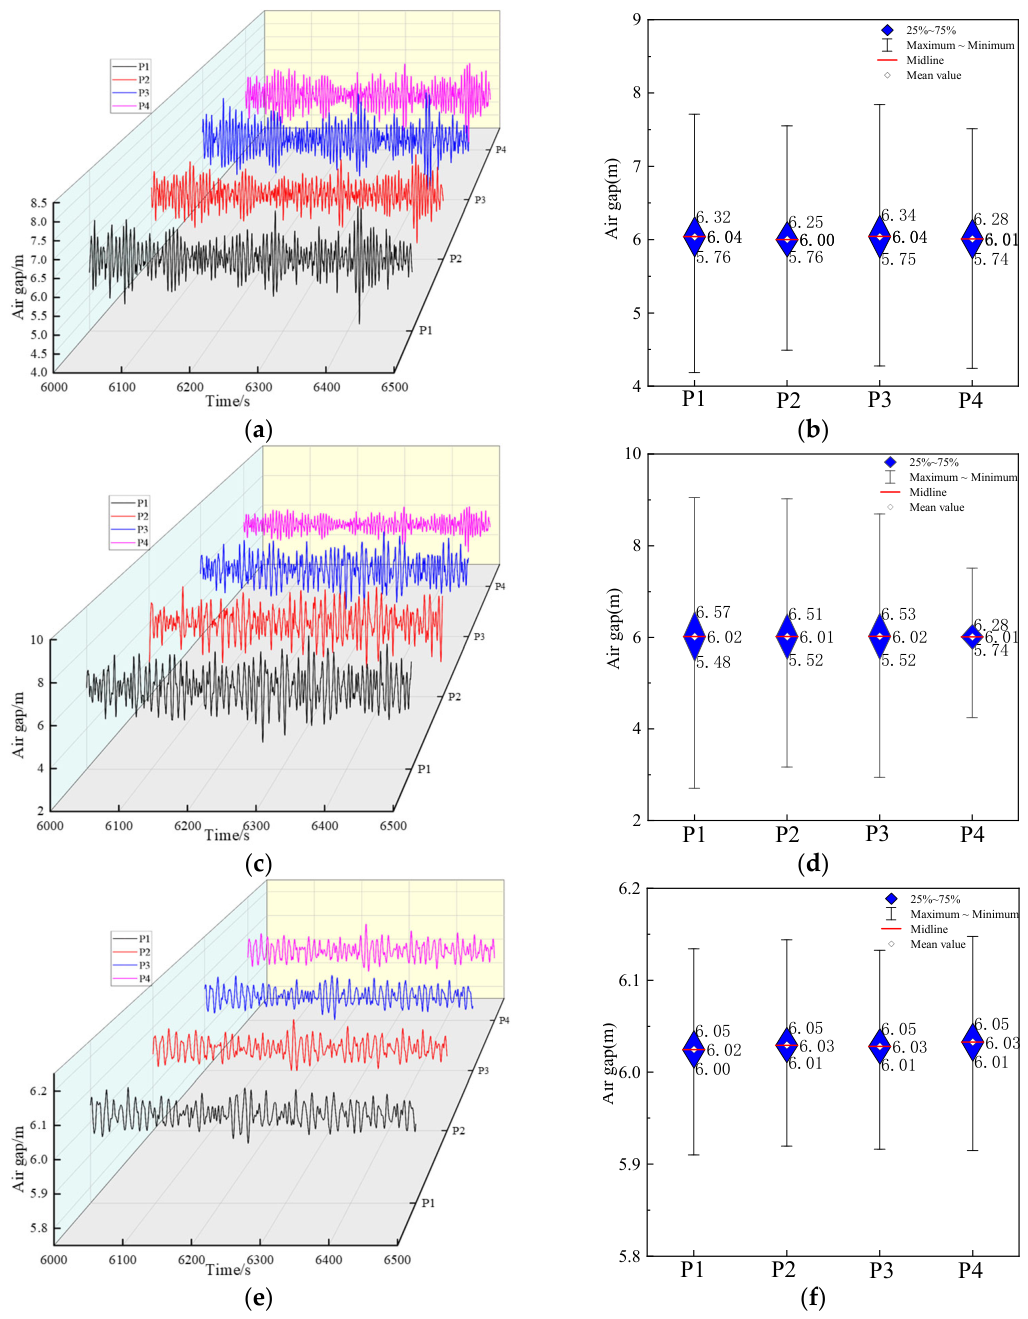
In a 4 × 4 photovoltaic array, the distribution of air gap monitoring points is shown in Figure 12. Figure 18 presents the time-history plots of air gap distances and statistical results for each monitoring point under different operating conditions. As can be seen from the figure, the air gap distances at monitoring points on the windward side are greater than those on the leeward side. Under extreme conditions, the differences in air gap distances between monitoring points are small, and they remain largely consistent. Furthermore, the median air gap distances for all monitoring points under different operating conditions are approximately 6.02 m. The minimum air gap under severe conditions is smaller than that under normal and extreme conditions, with a minimum air gap of 2.67 m. In summary, no negative air gap values were observed at any monitoring point of the 4 × 4 PV array under all simulated conditions, indicating that the array possesses sufficient deck height margin under various sea conditions, with no risk of waves surging onto the deck, thereby meeting safety operation requirements.

5.6. Mooring Tension and Safety Assessment of the FPV Array

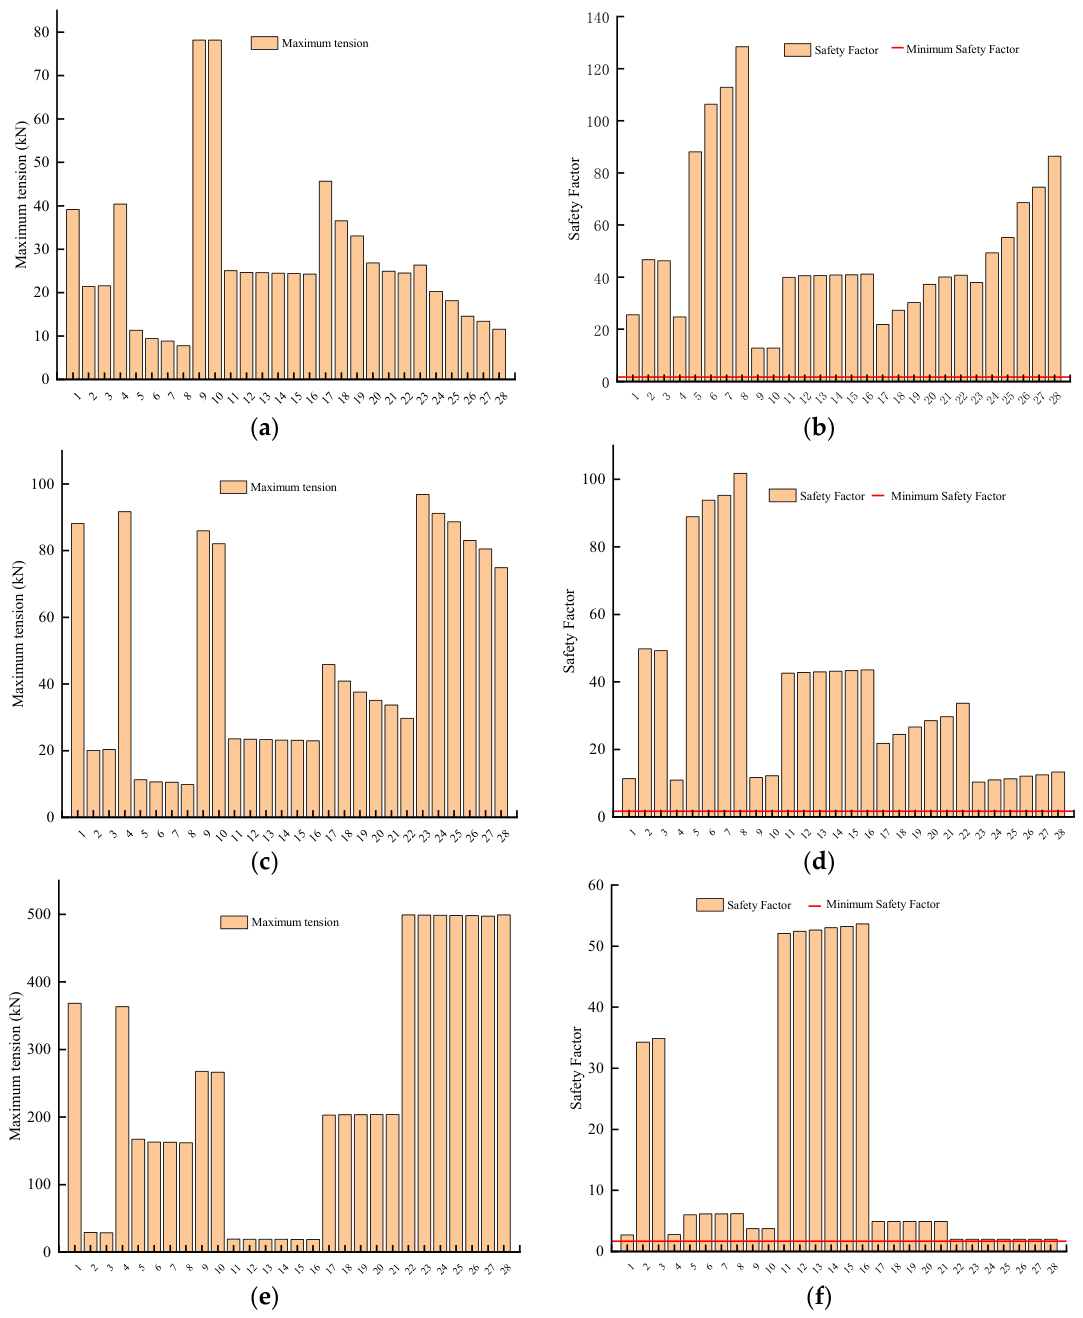
In a 4 × 4 array photovoltaic configuration, the statistical table of maximum tension values and safety factors for the 28 mooring cables under operational, adverse and extreme conditions is shown in Figure 19 below. As can be seen from Figure 19, the tension experienced by moorings on the windward side is greater than that experienced by moorings on the leeward side; moorings symmetrical to the direction of the incoming waves experience similar levels of tension. Specifically, the tension values experienced by mooring lines M1 and M4 are greater than those experienced by mooring lines M2 and M3. In terms of safety factors, under service conditions, mooring line M9 experiences the highest tension value, approximately 78.18 kN, with a safety factor of 12.79, which meets the regulatory requirements for the safety factor of the mooring system under intact conditions; under adverse conditions, M23 experiences the highest tension, approximately 96.89 kN, with a minimum safety factor of 10.32, which still meets the safety requirements of the relevant standards; under ultimate conditions, M22 and M28 experience the highest tension, approximately 499.42 kN, with a minimum safety factor of 2, which still meets the safety requirements of the relevant standards.

6. Conclusions

A time-domain numerical model was established to analyze the hydrodynamic response, connector loads, air-gap variation, and mooring performance of a connected FPV platform array under operational and extreme sea states. The main conclusions are as follows:
(1) For the twin-float system, a module spacing of 21 m provides the most balanced motion response among the considered cases. However, the connector force reaches 91.96 kN due to pitch–heave coupling. Introducing damping into the elastic connector reduces the maximum connector force by 72.9%, thereby improving the load-bearing safety of the connection system.
(2) The connected array shows distinct motion characteristics under different sea states. Under operational conditions, the surge response exhibits an edge amplification effect. Under extreme conditions, the array tends to move in a coordinated quasi-rigid-body manner. The heave response is affected by wave shielding among adjacent units, while the pitch motion is strongly synchronized by the spring–damper connection system.
(3) The air-gap results indicate that the windward side generally maintains a larger clearance than the leeward side. The minimum air gap is 2.67 m under the 1-year return period sea state, and all calculated air gaps remain positive, indicating sufficient freeboard safety under the considered conditions.
(4) The maximum mooring tensions under the operational, 1-year, and 50-year return period sea states are 78.18 kN, 96.89 kN, and 499.42 kN, respectively. The corresponding minimum safety factors are 12.79, 10.32, and 2.0, satisfying the code requirements for intact conditions.
Based on the research findings, this study proposes several design recommendations for other floating photovoltaic platforms. The stiffness and damping parameters should be tuned according to the dominant frequency of the site-specific wave spectrum to avoid relative resonance among the modules. The module spacing needs to strike a balance between motion responses and the load-bearing safety of the connectors, with the optimal value determined through time-domain sensitivity analyses under various operational conditions. The mooring system on the wave-facing side should be designed with sufficient breaking strength and safety margin, and a symmetrical radial arrangement is recommended to enhance directional adaptability.
Overall, this study has clarified the influence of module spacing and connector configuration on the hydrodynamic performance of offshore floating arrays, providing valuable guidance for array layout design, connector selection, and mooring safety assessment. However, the methodology for investigating module spacing could be further improved, for instance, by adopting a performance index for comprehensive evaluation. Moreover, regarding array studies, the consideration of realistic operating conditions and array connectors remains insufficient. Future work will focus on alternative mooring configurations and connection schemes that are more representative of practical offshore applications.


Author Contributions

Conceptualization, P.X. and Z.M.; methodology, P.X. and Z.M.; software, X.L.; validation, Y.Z. and Z.M.; formal analysis, Y.Z. and X.W.; investigation, Y.Z., X.W. and P.X.; resources, P.X.; data curation, X.W.; writing—original draft preparation, Y.Z., X.W. and P.X.; writing—review and editing, X.L., Z.Z. and Z.M.; supervision, Z.Z., Z.M. and X.L.; project administration, P.X.; funding acquisition, Y.Z. and P.X. All authors have read and agreed to the published version of the manuscript.

Funding

This work was supported by the National Natural Science Foundation of China (Grant No. 52401345) and the Natural Science Foundation of Guangxi Zhuang Autonomous Region, China (Grant No. 2026GXNSFAA00641300).

Data Availability Statement

The experimental data supporting the findings of this study are available from the corresponding author upon reasonable request. The data are not publicly available due to their large volume and because they form part of an ongoing research program. Selected datasets can be shared for academic research purposes.

Conflicts of Interest

The authors declare no conflicts of interest.

References

  1. Ramanan, C.J.; Lim, K.H.; Kurnia, J.C.; Roy, S.; Bora, B.J.; Medhi, B.J. Towards sustainable power generation: Recent advancements in floating photovoltaic technologies. Renew. Sustain. Energy Rev. 2024, 194, 114322. [Google Scholar] [CrossRef]
  2. Chang, A.T.; Li, L.; Xu, K.; Song, H. Development trend and technical challenges of ocean engineering. Coast. Eng. 2022, 41, 283–300. [Google Scholar]
  3. Yang, Y.; Mi, C.; Ou, B.; Wong, A.; Duffy, J.G.; Wood, T.; Utama, I.; Chen, W.; Huang, L. A comparative experimental study on the hydrodynamic performance of two floating solar structures with a breakwater in waves. Sol. Energy 2024, 284, 113029. [Google Scholar] [CrossRef]
  4. DNV. DNV-RP-0584 Design, Development and Operation of Floating Solar Photovoltaic Systems; DNV: Høvik, Norway, 2021. [Google Scholar]
  5. Xu, P.; Zhang, Z.; Li, S.; Song, Q.; Liu, W. Numerical investigation into the dynamic responses of floating photovoltaic platform and mooring line structures under freak waves. J. Mar. Sci. Eng. 2024, 12, 96. [Google Scholar] [CrossRef]
  6. Yang, Y.; Wang, H.; Sun, J.; Lu, W.; Shao, L. Research on multi-body towing performance of a novel star-type floating photovoltaic structure. Ocean Eng. 2025, 333, 121509. [Google Scholar] [CrossRef]
  7. Jin, R.; Zhu, T.; Geng, B.; Song, J. Hydrodynamic investigation of mooring-hinged, multi-floater offshore floating photovoltaic platform in irregular waves and wind. Energy Rep. 2026, 15, 108824. [Google Scholar] [CrossRef]
  8. Lian, J.; Cao, Z.; Lu, W.; Li, P.; Liu, D.; Yao, Y.; Shao, N.; Li, H. Experimental investigation on the dynamic characteristics of connector and mooring force for a novel pontoon-type offshore floating photovoltaic array. Sol. Energy 2025, 301, 113912. [Google Scholar] [CrossRef]
  9. Shi, X.H.; Wang, Y.; Zhang, J.; Guedes Soares, C.; Li, H.; Yu, J. Coupled response of flexible multi-buoy offshore floating photovoltaic array under waves and currents. J. Mar. Sci. Eng. 2025, 13, 930. [Google Scholar] [CrossRef]
  10. Gao, X.; Zhao, Y.; Ma, Q.; Lian, J.; Liu, M. Directed hierarchical causality analysis framework for structural damage in offshore floating photovoltaics. Ocean Coast. Manag. 2026, 273, 108069. [Google Scholar] [CrossRef]
  11. Wang, D.; Jin, S.; Hann, M.; Conley, D.; Collins, K.; Greaves, D. Power output estimation of a two-body hinged raft wave energy converter using HF radar measured representative sea states at Wave Hub in the UK. Renew. Energy 2023, 202, 103–115. [Google Scholar] [CrossRef]
  12. Huang, S.; Sheng, S.; You, Y.; Gerthoffert, A.; Wang, W.; Wang, Z. Numerical study of a novel flex mooring system of the floating wave energy converter in ultra-shallow water and experimental validation. Ocean Eng. 2018, 151, 342–354. [Google Scholar] [CrossRef]
  13. Ma, C.; Xie, S.; Bi, C.W.; Zhao, Y.P. Nonlinear dynamic analysis of aquaculture platforms in irregular waves based on Hilbert–Huang transform. J. Fluids Struct. 2023, 117, 103831. [Google Scholar] [CrossRef]
  14. Wang, B.; Gao, X.; Li, Y.; Liu, L.; Li, H. Dynamic response analysis of a semi-submersible floating wind turbine based on different coupling methods. Ocean Eng. 2024, 297, 116948. [Google Scholar] [CrossRef]
  15. Jia, G.; Zhang, Z.; Zhao, Y.; Ma, C.; Ge, X.; Shu, J. Effects of flexible connectors on hydrodynamic and energy output characteristics of floating photovoltaic (FPV) arrays in harsh marine environments: A physical model analysis. Renew. Energy 2025, 256, 124266. [Google Scholar] [CrossRef]
  16. Wu, L.; Wang, Y.; Xiao, Z.; Li, Y. Hydrodynamic response for flexible connectors of mobile offshore base at rough sea states. Pet. Explor. Dev. 2016, 43, 1089–1096. [Google Scholar] [CrossRef]
  17. Song, X.; Liu, W.; Wu, H. Investigation on load characteristics of hinged connector for a large floating structure model under wave actions. J. Mar. Sci. Eng. 2023, 11, 786. [Google Scholar] [CrossRef]
  18. Yao, Y.; Zhang, X.; Deng, Z.; Ren, X.; Song, J.; Yang, X. Hydrodynamic analysis of offshore floating photovoltaic structure with elastic connection. Mar. Energy Res. 2025, 2, 10011. [Google Scholar] [CrossRef]
  19. Yan, C.; Shi, W.; Han, X.; Li, X.; Verma, A.S. Assessing the dynamic behavior of multiconnected offshore floating photovoltaic systems under combined wave-wind loads: A comprehensive numerical analysis. Sustain. Horiz. 2023, 8, 100072. [Google Scholar] [CrossRef]
  20. Ma, G.; Zhang, C.; Chen, H.; Hou, W.; Wang, W.; Zhang, J. Hydrodynamic analysis of floating photovoltaic system constrained with rigid connectors. Sci. Rep. 2024, 14, 29920. [Google Scholar] [CrossRef] [PubMed]
  21. Song, J.; Kim, J.; Chung, W.C.; Jung, D.; Kang, Y.J.; Kim, S. Wave-induced structural response analysis of the supporting frames for multiconnected offshore floating photovoltaic units installed in the inner harbor. Ocean Eng. 2023, 271, 113812. [Google Scholar] [CrossRef]
  22. Pérez-Collazo, C.; Greaves, D.; Iglesias, G. A review of combined wave and offshore wind energy. Renew. Sustain. Energy Rev. 2015, 42, 141–153. [Google Scholar] [CrossRef]
  23. Xu, W.; Sun, Y.; He, Z. Hydrodynamic performance study of floating photovoltaic arrays with multiple floating bodies. Appl. Ocean Res. 2024, 153, 104286. [Google Scholar] [CrossRef]
  24. Lu, W.; Lian, J.; Xie, H.; Li, P.; Shao, N.; Zhang, G.; Li, X.; Wu, Z.; Xiong, D. Experimental study on hydrodynamic response characteristics of a novel floating box array offshore floating photovoltaic structure. Renew. Energy 2025, 256, 124387. [Google Scholar] [CrossRef]
  25. Wang, B.; Lian, J.; Gao, X.; Liu, L.; Yao, Y.; Li, Y.; Meng, H. Coupled dynamic analysis of polyester flexible connector for a novel lattice-type floating photovoltaic array. Ocean Eng. 2025, 320, 120354. [Google Scholar] [CrossRef]
  26. Zhang, F.; Shi, W.; Wang, Q. A study on the hydrodynamics and coupling effects of the multibody floating photovoltaic (FPV) concept. J. Mar. Sci. Eng. 2023, 11, 149132. [Google Scholar] [CrossRef]
  27. Amouzadrad, P.; Mohapatra, S.C.; Guedes Soares, C. Numerical model for the hydroelastic response of a moored articulated floating platform with a flap-type wave energy converter. J. Ocean Eng. Mar. Energy 2026, 12, 697–715. [Google Scholar]
  28. Chen, X.; Jiang, C.; Zhang, Y.; Xu, P. Experimental and numerical study on a dual-raft wave energy converter with different hinged configurations. Energy 2025, 322, 135611. [Google Scholar] [CrossRef]
  29. Luo, W.; Zhang, X.; Tian, X.; Cheng, Z.; Wen, B.; Li, X.; Luo, Y. Conceptual design and model test of a pontoon-truss type offshore floating photovoltaic system with soft connection. Ocean Eng. 2024, 309, 118518. [Google Scholar] [CrossRef]
  30. ABS. ABS Rules for Building and Classing Mobile Offshore Drilling Units; American Bureau of Shipping: Spring, TX, USA, 2014. [Google Scholar]
  31. Cheng, H.X.; Hua, F.; Yuan, Y.L. Seasonal characteristics and temporal variation of waves in China ’s offshore and adjacent sea areas. Adv. Mar. Sci. 2006, 4, 407–415. [Google Scholar]
  32. Coulling, A.J.; Goupee, A.J.; Robertson, A.N.; Jonkman, J.M.; Dagher, D.J. Validation of a FAST semi-submersible floating wind turbine numerical model withDeepCwind test data. Renew. Sustain. Energy 2013, 5, 023116. [Google Scholar] [CrossRef]
  33. He, W.; Liu, Z.; Yin, D.; Du, J.; Chang, A. Experimental and numerical research on the dynamic response of multi-module floating photovoltaics array. Ocean Eng. 2025, 338, 121969. [Google Scholar] [CrossRef]
  34. Zou, T.; Jiang, J.; Li, H.; Du, J.; Tao, L. Structural responses of offshore multi-body floating photovoltaic array under different connection conditions. Appl. Ocean Res. 2025, 158, 104544. [Google Scholar] [CrossRef]
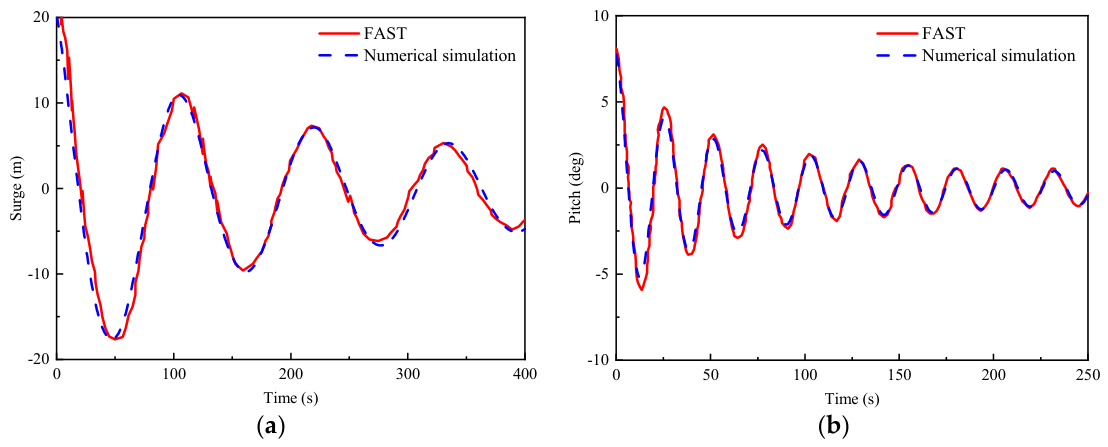
Figure 1. Schematic diagram of the movement of the array-type photovoltaic platform.
Jmse 14 01336 g001
Figure 2. PV model diagram (a) Top view of the single-panel photovoltaic platform; (b) Main view of the monolithic photovoltaic platform.
Jmse 14 01336 g002
Figure 3. Layout of Mooring System for Twin-Float Platform.
Jmse 14 01336 g003
Figure 4. Free decay curve of the OFPV platform: (a) Surge Free Decay; (b) Pitch Free Decay.
Jmse 14 01336 g004
Figure 5. Hydrodynamic Calculation Results in the Pitching Direction: (a) Response amplitude operator; (b) Added mass; (c) Damping; (d) pitch.
Jmse 14 01336 g005
Figure 6. Motion Response Results of Body 1 Under Different Spacings: (a) surge; (b) The power spectral density of the surge; (c) Heave; (d) The power spectral density of the Heave; (e) pitch; (f) The power spectral density of the Pitch.
Jmse 14 01336 g006aJmse 14 01336 g006b
Figure 7. Force Distribution Diagram of Connectors: (a) Force analysis of connection piece L1; (b) Force analysis of connection piece L2.
Jmse 14 01336 g007
Figure 8. Correlation function plot.
Jmse 14 01336 g008
Figure 9. Phase Difference plot.
Jmse 14 01336 g009
Figure 10. Optimal Design Diagram of Connectors: (a) Type A. Wide-gap double spring connection; (b) Type B. wide-gap spring with elastic damping connection; (c) Type C. Narrow-gap Double Spring Connection; (d) Type D. Narrow-gap Spring with Elastic Damping Connection.
Jmse 14 01336 g010
Figure 11. Force Diagrams of L1 Under Different Connection Types.
Jmse 14 01336 g011
Figure 12. Schematic diagram of an array photovoltaic platform.
Jmse 14 01336 g012
Figure 13. Result plot of the Surge motion response of the photovoltaic platform: (a) Surge motion response of array photovoltaic systems under normal conditions; (b) Surge motion response of array photovoltaic systems under adverse conditions; (c) Surge motion response of array photovoltaic systems under extreme conditions.
Jmse 14 01336 g013aJmse 14 01336 g013b
Figure 14. Statistical response of surge of each PV platform under array connection: (a) Surge statistical plot under normal operating conditions; (b) Surge statistical plot under severe operating conditions; (c) Surge statistical plot under extreme operating conditions; (d) Surge motion amplitude statistical plot; (e) Surge motion mean deviation statistical plot.
Jmse 14 01336 g014
Figure 15. Result plot of the Heave motion response of the photovoltaic platform (a) Heave motion response of array photovoltaic systems under normal conditions; (b) Heave motion response of array photovoltaic systems under adverse conditions; (c) Heave motion response of array photovoltaic systems under extreme conditions.
Jmse 14 01336 g015aJmse 14 01336 g015b
Figure 16. Statistical response of heave of each PV platform under array connection: (a) Heave statistical plot under normal operating conditions; (b) Heave statistical plot under severe operating conditions; (c) Heave statistical plot under extreme operating conditions; (d) Heave motion amplitude statistical plot; (e) Heave motion mean deviation statistical plot.
Jmse 14 01336 g016
Figure 17. Result plot of the Pitch motion response of the photovoltaic platform: (a) Pitch motion response of array photovoltaic systems under normal conditions; (b) Pitch motion response of array photovoltaic systems under adverse conditions; (c) Pitch motion response of array photovoltaic systems under extreme conditions.
Jmse 14 01336 g017aJmse 14 01336 g017b
Figure 18. Statistical plot of air gaps: (a) Time history diagram of air gap distance under normal conditions; (b) Statistical chart of air gap distance under working conditions; (c) Time history diagram of air gap distance under adverse conditions; (d) Statistical chart of air gap distance under adverse conditions; (e) Time history diagram of air gap distance under extreme operating conditions; (f) Statistical chart of air gap distance under extreme conditions.
Jmse 14 01336 g018
Figure 19. Force statistics of mooring cable under various working conditions of array PV plat-form: (a) Statistical plot of mooring forces under normal operating conditions; (b) Mooring safety factor under normal operating conditions; (c) Statistical plot of mooring forces under severe operating conditions; (d) Mooring safety factor under severe operating conditions; (e) Statistical plot of mooring forces under extreme operating conditions; (f) Mooring safety factor under extreme operating conditions.
Jmse 14 01336 g019
Table 1. Main Parameters of a Single Photovoltaic Platform.
Parameter NameNumerical Value
Length m24
Width m24
Height m6
Rubber buoy (height × diameter) m3 × 1.5
Water depth m20
Center of gravity m3.5
Total weight t48.1
Lxx te·m23130
Lyy te·m23130
Lzz te·m25920
Table 2. Mooring Parameters.
ParametersDataUnit
Mooring length87m
Breaking strength500kN
Mooring diameter30mm
Horizontal tension20.8kN
Unit weight25kg/m
Modulus of elasticity150GPa
Axial stiffness700kN/m
Table 3. Environmental conditions of the FPV platform.
NameSea ConditionWind Speed/(m/s)Wave HeightCurrent Speed/(m/s)
LC1Working conditions8.7γ = 3.3, Hs = 1.2 m, Tp = 6 s0.3
LC2Harsh conditions25γ = 3.3, Hs = 3 m, Tp = 9 s1
LC3Extreme conditions30γ = 3.3, Hs = 8 m, Tp = 12 s2
Table 4. Grid Partitioning Scheme.
Grid NameGrid Size (m)Number of Grids
M10.1044,746
M20.305886
M30.501996
Table 5. Statistical Data of Three Types of Motion Responses Under Operating Sea Conditions.
Spacing18 m19 m20 m21 m22 m
Amplitude
Surge (m)5.695.745.735.295.54
Heave (m)0.460.420.320.390.43
Pitch (deg)3.593.934.043.603.10
Table 6. Statistical Data of Maximum Forces on Connectors Under Operating Sea Conditions.
Spacing18 m19 m20 m21 m22 m
Load on the Connection Piece (kN)
L141.6338.2847.6091.9659.08
L244.0142.0148.2387.7660.11
Table 7. Mooring Parameters of Array Floating Photovoltaic Platforms.
ParametersDataUnit
Mooring length87m
Breaking load1020kN
Mooring diameter40mm
Elastic modulus120GPa
Axial stiffness22.5MN
Disclaimer/Publisher’s Note: The statements, opinions and data contained in all publications are solely those of the individual author(s) and contributor(s) and not of MDPI and/or the editor(s). MDPI and/or the editor(s) disclaim responsibility for any injury to people or property resulting from any ideas, methods, instructions or products referred to in the content.