1. Introduction
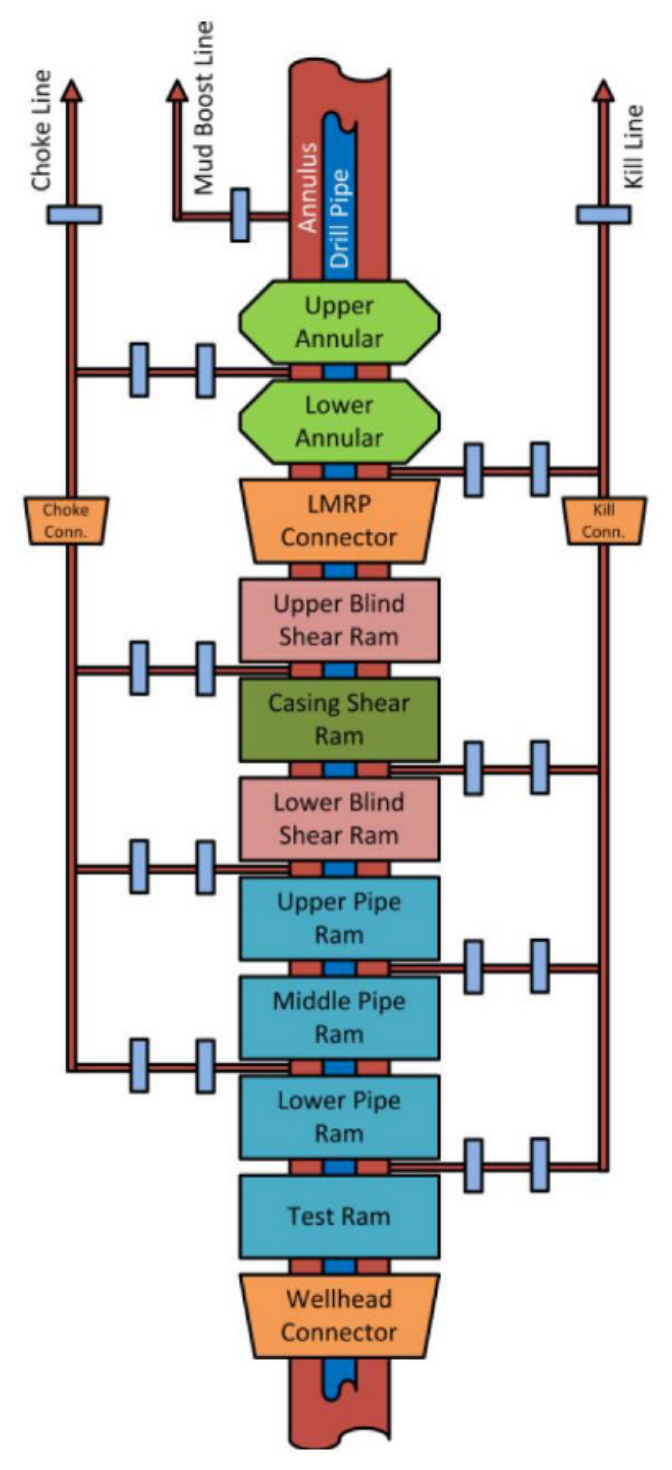
The blowout preventer (BOP) is a safety-critical system located on the wellhead that provides the primary barrier between the high-pressure subsea wellbore and the surface drilling environment. It is used during drilling and intervention operations to prevent uncontrolled hydrocarbon release and ensure well control capability under both normal and emergency conditions. The subsea BOP system consists of multiple subsystems, including mechanical preventers, hydraulic control systems, electrical modules, and communication interfaces, all of which must function reliably to maintain operational safety [
1]. Shown in
Figure 1 is a representation of a subsea BOP.
Subsea BOP systems remain a major focus of offshore safety and reliability studies because of their complex multi-domain interactions and the severe consequences associated with failure. Recent field reports indicate that a large fraction of well control equipment events are associated with subsea systems, with commonly reported failures involving control valves, accumulators, and hydraulic transmission components [
2]. These observations highlight the importance of hydraulic control system integrity as a key contributor to overall BOP reliability. In addition, comprehensive review studies emphasize that subsea BOP reliability, testing, and maintenance remain critical challenges as offshore operations extend into deeper and more complex environments [
3].
Gas-charged accumulators within the hydraulic power unit (HPU) store and regulate the hydraulic energy required for subsea BOP actuation [
4,
5]. Hydraulic power is transmitted through conduits and subsea umbilicals that provide hydraulic, electrical, and communication links between topside and subsea equipment. Hydraulic leakage may reduce stored actuation energy, degrade pressure delivery performance, and compromise emergency well control capability. Therefore, the early detection and quantification of leakage are important for maintaining hydraulic integrity and supporting condition-based maintenance.
Extensive research has been devoted to the reliability assessment and maintenance optimization of subsea BOP systems. Probabilistic approaches based on Bayesian networks, stochastic Petri nets, and fault-tree formulations have been widely used to evaluate system availability and failure risk under condition-based maintenance strategies [
6,
7,
8,
9]. More recent studies have explored digital-twin-based and data-informed reliability frameworks that incorporate operational data into system-level performance assessment and maintenance decision-making [
10,
11]. While these approaches provide valuable insight into system-level risk and maintenance planning, they typically represent degradation using probabilistic failure models rather than directly estimating hydraulic degradation from measured operational signals.
System-level modeling approaches have also been developed for the condition and performance monitoring of BOP subsystems. Physics-based frameworks have been used to analyze hydraulic circuit dynamics, estimate system parameters, and infer component health conditions from measured data [
4,
12]. These methods provide advantages over purely data-driven approaches by incorporating first-principles system behavior, enabling interpretable and adaptive monitoring without extensive training datasets. Similar approaches have also been widely studied in hydraulic and industrial process systems for fault detection and leakage diagnosis using measured system dynamics [
13,
14].
Despite these advances, the practical detection of small hydraulic leakage rates in subsea BOP control circuits remains challenging because direct flow measurements are typically unavailable during offshore operations. In contrast, pressure measurements from hydraulic power units and subsea control systems are routinely available through existing monitoring infrastructure. Consequently, there is a need for monitoring methodologies that can convert available pressure measurements into physically meaningful indicators of hydraulic integrity without requiring additional subsea instrumentation.
Physics-based monitoring approaches using adaptive parameter estimation provide a promising pathway for addressing this challenge. By leveraging hydraulic system relationships and available pressure data, leakage-induced degradation can be inferred from accumulator discharge behavior. In particular, accumulator pressure decay during discharge intervals provides a physically interpretable basis for estimating leakage rates using the compressibility relationships of gas-charged accumulators.
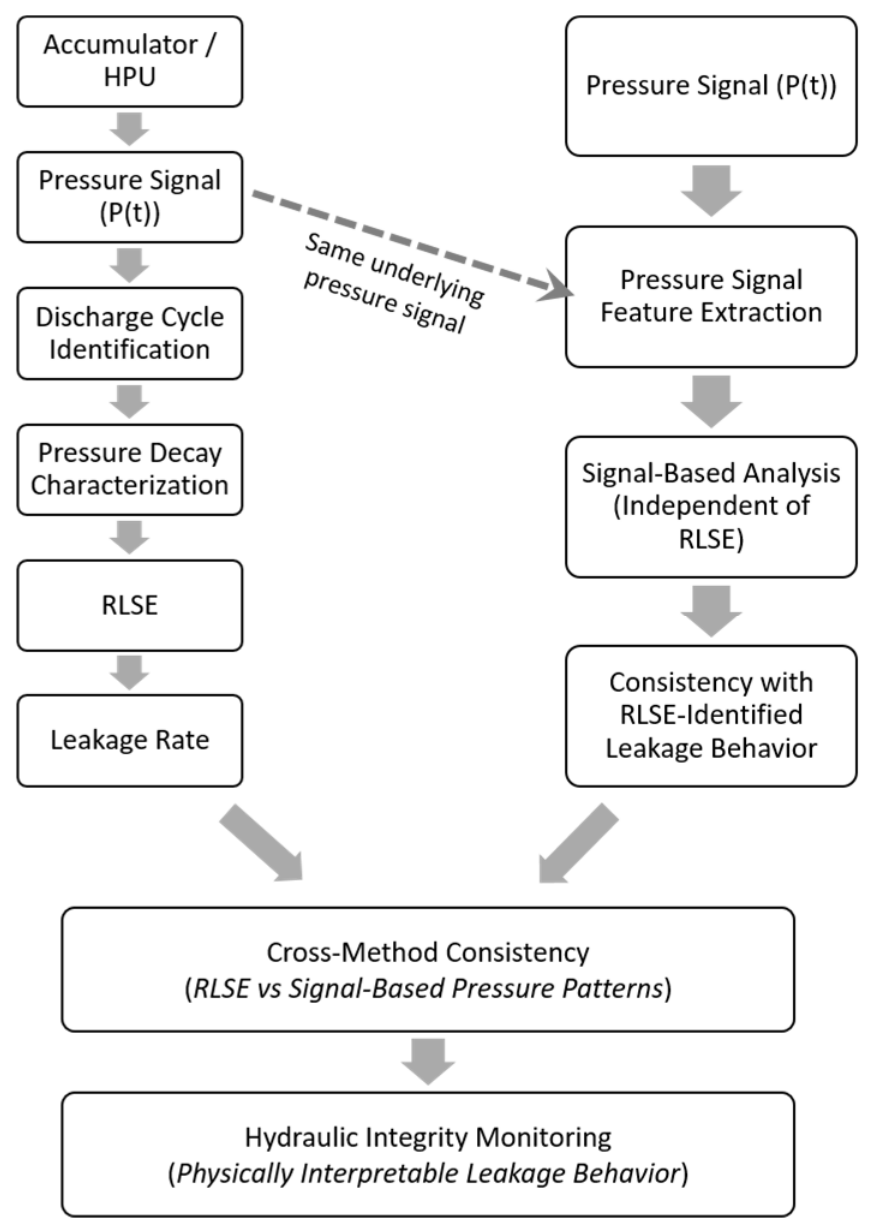
To illustrate the proposed monitoring strategy,
Figure 2 presents a conceptual framework for pressure-based hydraulic integrity monitoring focused on accumulator leakage.
Shown in
Figure 2, the methodology consists of two complementary components. The first is a physics-based leakage estimation framework in which accumulator pressure histories are analyzed over discharge cycles, and leakage rates are estimated using the recursive least-squares estimation (RLSE) of pressure decay behavior. The second is a signal-based consistency analysis in which statistical features derived directly from the pressure measurements are used to evaluate whether the leakage behavior identified by the RLSE method is reflected in observable pressure dynamics.
The objective of the consistency analysis is not to establish a direct validation of leakage magnitude but rather to evaluate whether RLSE-derived leakage behavior is consistently reflected in independently constructed pressure dynamic characteristics. Because the direct measurement of small subsea leakage rates is generally unavailable in offshore BOP control circuits, the validation of pressure-based leakage monitoring methods cannot typically rely on field measurements of leakage flow. Therefore, agreement between the estimates from RLSE and independently constructed pressure signal characteristics provides supporting evidence that the identified leakage behavior corresponds to physically meaningful system dynamics rather than artifacts of the estimation procedure. However, because both analyses are derived from the same pressure record, the consistency analysis should not be interpreted as an independent validation of the absolute leakage magnitude. Independent validation would require direct leakage flow measurements or other external evidence that was not available for the offshore operation considered in this study.
Motivated by these challenges, this study presents a physics-based methodology for estimating accumulator leakage in subsea BOP control circuits using offshore pressure measurements. The proposed framework combines RLSE-based leakage estimation with signal-based consistency analysis to provide both quantitative leakage estimates and a complementary interpretation of hydraulic system behavior. Unlike probabilistic reliability models and data-intensive monitoring approaches, the proposed methodology focuses on deployable pressure-based indicators that can be implemented using existing offshore measurement systems. The approach enables real-time hydraulic integrity assessment and provides actionable information for condition-based maintenance without requiring additional sensing hardware or extensive training data.
The main contributions of this work are summarized as follows:
- (1)
Development of a physics-based methodology for estimating accumulator leakage rates in subsea BOP hydraulic control systems using routinely available topside pressure measurements;
- (2)
Formulation of a signal-based consistency analysis framework for evaluating whether RLSE-derived leakage behavior is directionally consistent with independently constructed pressure dynamic features, without validating absolute leakage magnitudes;
- (3)
Demonstration of the combined framework using offshore operational data to support hydraulic integrity monitoring for subsea BOP systems.
The remainder of this paper is organized as follows.
Section 2 presents the accumulator leakage modeling framework based on pressure decay behavior.
Section 3 describes the data processing and recursive least-squares estimation methodology used for leakage estimation.
Section 4 presents a case study using offshore operational data.
Section 5 introduces the signal-based consistency analysis of the RLSE leakage estimates. Finally,
Section 6 summarizes the main findings and discusses future work.
2. Accumulator Leakage Modeling
Gas-charged accumulators located in the hydraulic power unit (HPU) serve as the primary energy storage components of subsea blowout preventer hydraulic control systems. These accumulators store pressurized hydraulic fluid supplied by fixed displacement pumps and provide the actuation energy required for operating subsea preventers and associated control components. Maintaining adequate accumulator pressure is therefore essential for reliable well control functionality during both normal and emergency operations.
Hydraulic leakage within the control circuit may reduce stored hydraulic energy, increase accumulator recharge frequency, and degrade subsea actuation capability. Leakage behavior can be inferred from the accumulator pressure decay characteristics observed during discharge intervals.
During normal operation, the accumulator stack is periodically recharged when pressure drops below a preset threshold. Between pump shutoff and restart events, the observed pressure decay primarily reflects hydraulic fluid loss within the control circuit. Because the selected discharge intervals exclude major commanded hydraulic actuation events, the measured pressure decay is assumed to be dominated by leakage-related flow loss. Leakage rates can therefore be estimated from the pressure decay characteristics over each discharge interval.
Assuming a gas-charged accumulator operating under quasi-static conditions, the gas pressure and volume satisfy the polytropic relationship, where pressure is expressed as absolute pressure.
where
is the accumulator pressure,
is the instantaneous nitrogen gas volume, and
n is the polytropic exponent. Differentiating Equation (1) with respect to time gives the following:
During a leakage-dominated discharge interval, accumulator pressure decreases as hydraulic fluid is lost from the pressurized control circuit. Because the accumulator shell volume remains fixed, the corresponding increase in nitrogen gas volume is treated as equivalent to the hydraulic fluid volume lost from the accumulator-supported hydraulic circuit. The leakage rate calculation assumes that the selected discharge interval is dominated by leakage-related pressure decay. Pump recharge, commanded hydraulic actuation, and major thermal transients are therefore assumed to be negligible within the selected window. In the present analysis, discharge intervals were identified from the accumulator pressure cycle, and only the central portion of each discharge interval was used for slope estimation to reduce pump-switching effects. Direct valve position, actuator command, and flow signals were not available for the dataset analyzed in this study. Therefore, the method should be interpreted as a pressure-based leakage monitoring and trending approach for leakage-dominated discharge intervals.
Under these conditions, the observed pressure decay is attributed primarily to leakage. Therefore, the leakage flow rate can be approximated as follows:
where
is the leakage flow rate, and
is the pressure decay rate during a discharge cycle.
For practical implementation, an approximately isothermal gas process is assumed (
n = 1). Under this assumption, the gas pressure relationship may be expressed using the accumulator precharge pressure
and the corresponding gas volume under the precharge condition
:
where
is the measured surface accumulator pressure. For practical implementation, the measured surface accumulator pressure and accumulator precharge pressure are treated as absolute pressures when applying the gas compression relationship and leakage rate calculation. Because the accumulator is assumed to be fully gas-filled under the precharge condition,
is taken as the total accumulator volume used in the leakage calculation.
Substituting this into Equation (3) yields
Equation (4) represents the operational leakage estimation equation used throughout this study. The formulation converts the measured pressure decay rate into an estimated hydraulic leakage rate through the accumulator gas compression relationship. Because pressure decreases during a leakage-dominated discharge interval (), the negative sign in Equation (4) results in a positive leakage rate estimate.
To evaluate the influence of parameter uncertainty on the leakage estimate, a one-at-a-time parametric sensitivity analysis was performed by varying the accumulator precharge pressure, total accumulator volume, pressure decay slope, and representative accumulator pressure by ±5% and ±10% about their nominal values. The leakage estimate was found to be approximately proportional to the precharge pressure, accumulator volume, and pressure decay slope. In contrast, the representative accumulator pressure exhibited the strongest influence because of its inverse-square relationship in Equation (4). For example, a ±5% variation in representative pressure produced leakage estimation changes ranging from −9.3% to +10.8%, while a ±10% variation produced changes ranging from −17.4% to +23.5%. In contrast, equivalent variations in precharge pressure, accumulator volume, or pressure decay slope produced approximately proportional changes in the estimated leakage rate. These results quantify the influence of parameter uncertainty on the estimated leakage rate.
The pressure decay rate during a discharge cycle, , is estimated from the slope of the accumulator pressure history between pump shutoff and restart events. For each discharge cycle, a representative pressure window centered within the discharge interval is selected to avoid transient effects associated with pump switching.
In this case, RLSE is used to estimate the pressure decay slope for each discharge interval, enabling the adaptive tracking of leakage variations over time. In this implementation, RLSE is applied to a linear pressure–time relationship within each selected discharge window, providing a computationally efficient and noise-robust estimate of . Because the methodology relies only on routinely available accumulator pressure measurements, it can be implemented without additional subsea instrumentation, making it suitable for the real-time hydraulic integrity monitoring of subsea BOP control systems.
The resulting cycle-level pressure decay estimates are subsequently converted to leakage rate estimates using Equation (4). Repeating this procedure over successive discharge intervals provides a time-resolved characterization of hydraulic leakage behavior, which forms the basis for the offshore monitoring results presented in
Section 4.
3. Leakage Estimation Methodology
The leakage estimation methodology described in
Section 2 requires the extraction of the pressure decay rate from accumulator pressure histories during discharge cycles. Because offshore pressure measurements may contain noise and transient effects associated with pump switching, a structured processing and estimation procedure is required to obtain reliable leakage estimates.
3.1. Discharge Cycle Identification
The accumulator pressure data are sampled at a fixed rate during offshore operations. To reduce measurement noise, the raw pressure signal is preprocessed using a moving average filter. In this study, a 31-point moving average is applied prior to slope estimation. This filtering step preserves the overall pressure decay trend while reducing high-frequency fluctuations.
Accumulator leakage estimation is performed over discharge intervals defined between pump shutoff and pump restart events. These events are identified from characteristic changes in pressure slope:
- (1)
Pump shutoff corresponds to the transition from increasing pressure (charging phase) to decreasing pressure (discharge phase);
- (2)
Pump restart corresponds to the transition from decreasing pressure to increasing pressure.
Each discharge interval therefore represents a period dominated primarily by leakage-related pressure decay within the hydraulic control circuit.
3.2. RLSE-Based Pressure Decay Estimation
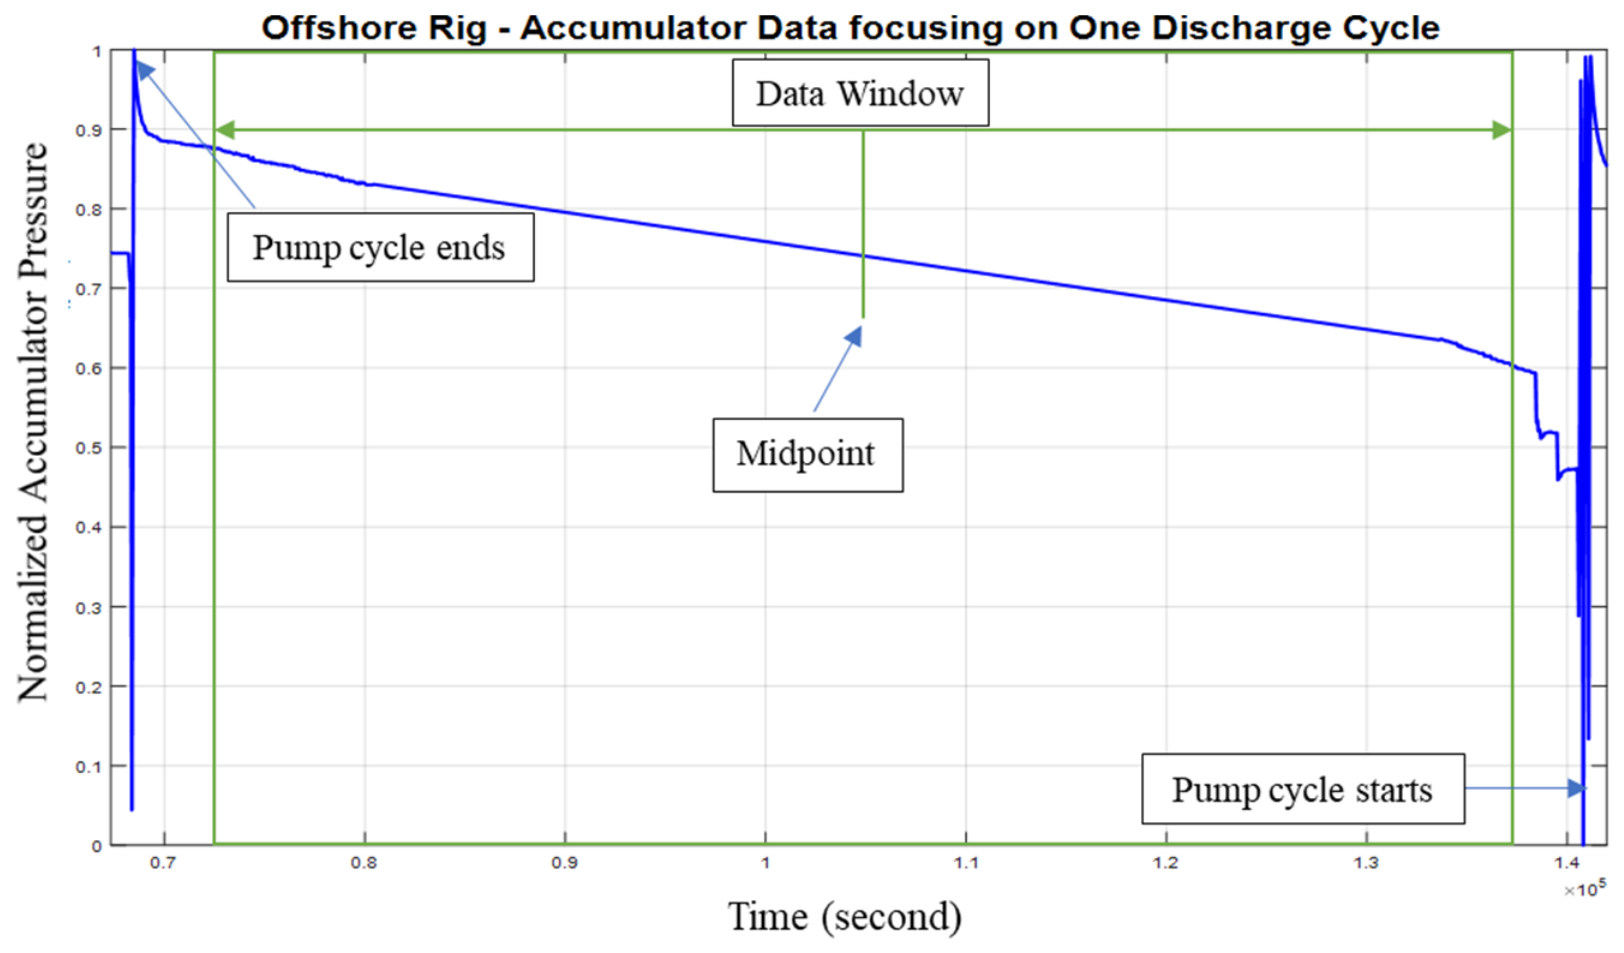
Within each discharge interval, a representative data window is selected for pressure decay estimation. To minimize transient effects associated with pump switching, only the central portion of the discharge cycle is used. A symmetric window centered about the midpoint of the discharge interval, corresponding to approximately 90% of the cycle duration, is selected to exclude transient effects near pump shutoff and restart events while preserving the dominant quasilinear pressure decay behavior used for RLSE, as illustrated in
Figure 3. For visualization purposes, the pressure signal in
Figure 3 is normalized. This normalization is applied only for visualization and confidentiality purposes. RLSE and leakage calculations are performed using the original dimensional pressure measurements, and the resulting pressure decay slopes are reported in psi/s.
The pressure decay rate
is estimated from the selected data window using recursive least-squares estimation (RLSE) [
15]. Within each window, the pressure history is approximated using a linear model:
where
a represents the estimated pressure decay rate, and
b is the intercept.
The RLSE algorithm estimates the slope parameter a recursively as new data become available. Compared with batch least-squares methods, RLSE provides several practical advantages for online implementation, including real-time implementation capability, reduced computational cost through recursive updating, the avoidance of repeated matrix inversion, and the ability to adapt to gradual changes in pressure decay behavior over time. A covariance tolerance parameter is used to ensure that the selected window represents sufficiently persistent leakage behavior, preventing short-duration fluctuations from being interpreted as meaningful leakage trends. The estimated slope a therefore serves as the operational estimate of the pressure decay rate used in the leakage model.
Alternative adaptive estimation approaches, such as Kalman filter-based methods, could also be considered for online monitoring applications. However, the present problem primarily involves the estimation of a slowly varying pressure decay slope within selected discharge windows, and a state-space representation of the system is not required for the monitoring objective considered here. RLSE therefore provides a relatively simple and computationally efficient solution that is well suited to the monitoring objective considered in this study. The contribution of the present work is not the development of a new RLSE algorithm but its integration with accumulator discharge window segmentation and the gas compression leakage model for the pressure-based hydraulic integrity monitoring of subsea BOP systems.
In the present implementation, the parameter vector is initialized as [0, 0]T, and the covariance matrix is initialized as 109I. A forgetting factor of λ = 1 is used, corresponding to standard recursive least-squares estimation without exponential forgetting. The linear pressure model includes both slope and intercept terms. Discharge windows are retained only when the final covariance norm satisfies the covariance tolerance criterion (CovTol ≤ 1). In addition, only the central 90% of each discharge interval is used for estimation to reduce the influence of pump-switching transients near the beginning and end of the cycle.
3.3. Leakage Rate Computation
Once the pressure decay rate is obtained for each discharge cycle, the accumulator leakage rate is computed using the governing relationship introduced in
Section 2. For the
i-th discharge cycle, the linear pressure model from
Section 3.2 is written as
where
represents the pressure decay slope for the
i-th discharge cycle and serves as the operational estimate of
, while
represents the corresponding intercept term. In the original implementation framework,
and
correspond to Slope(i) and Bias(i), respectively.
The cycle-level leakage rate is then computed as
where
is the average leakage rate over the
i-th discharge cycle. Repeating this procedure over successive discharge intervals provides a time-resolved estimate of hydraulic leakage behavior.
The proposed algorithm is computationally efficient and relies solely on routinely available accumulator pressure measurements, enabling continuous leakage tracking for the real-time hydraulic integrity monitoring of subsea BOP control systems. The resulting leakage estimates also provide the reference states used in the signal-based consistency analysis presented in
Section 5.
4. Offshore Leakage Monitoring Case Study
To demonstrate the proposed leakage estimation methodology, accumulator pressure data obtained from an offshore drilling operation are analyzed. The dataset consists of time-resolved pressure measurements recorded at the hydraulic power unit (HPU), capturing multiple pump recharge and discharge cycles under normal operating conditions.
4.1. Pressure Characteristics and Discharge Cycles
Shown in
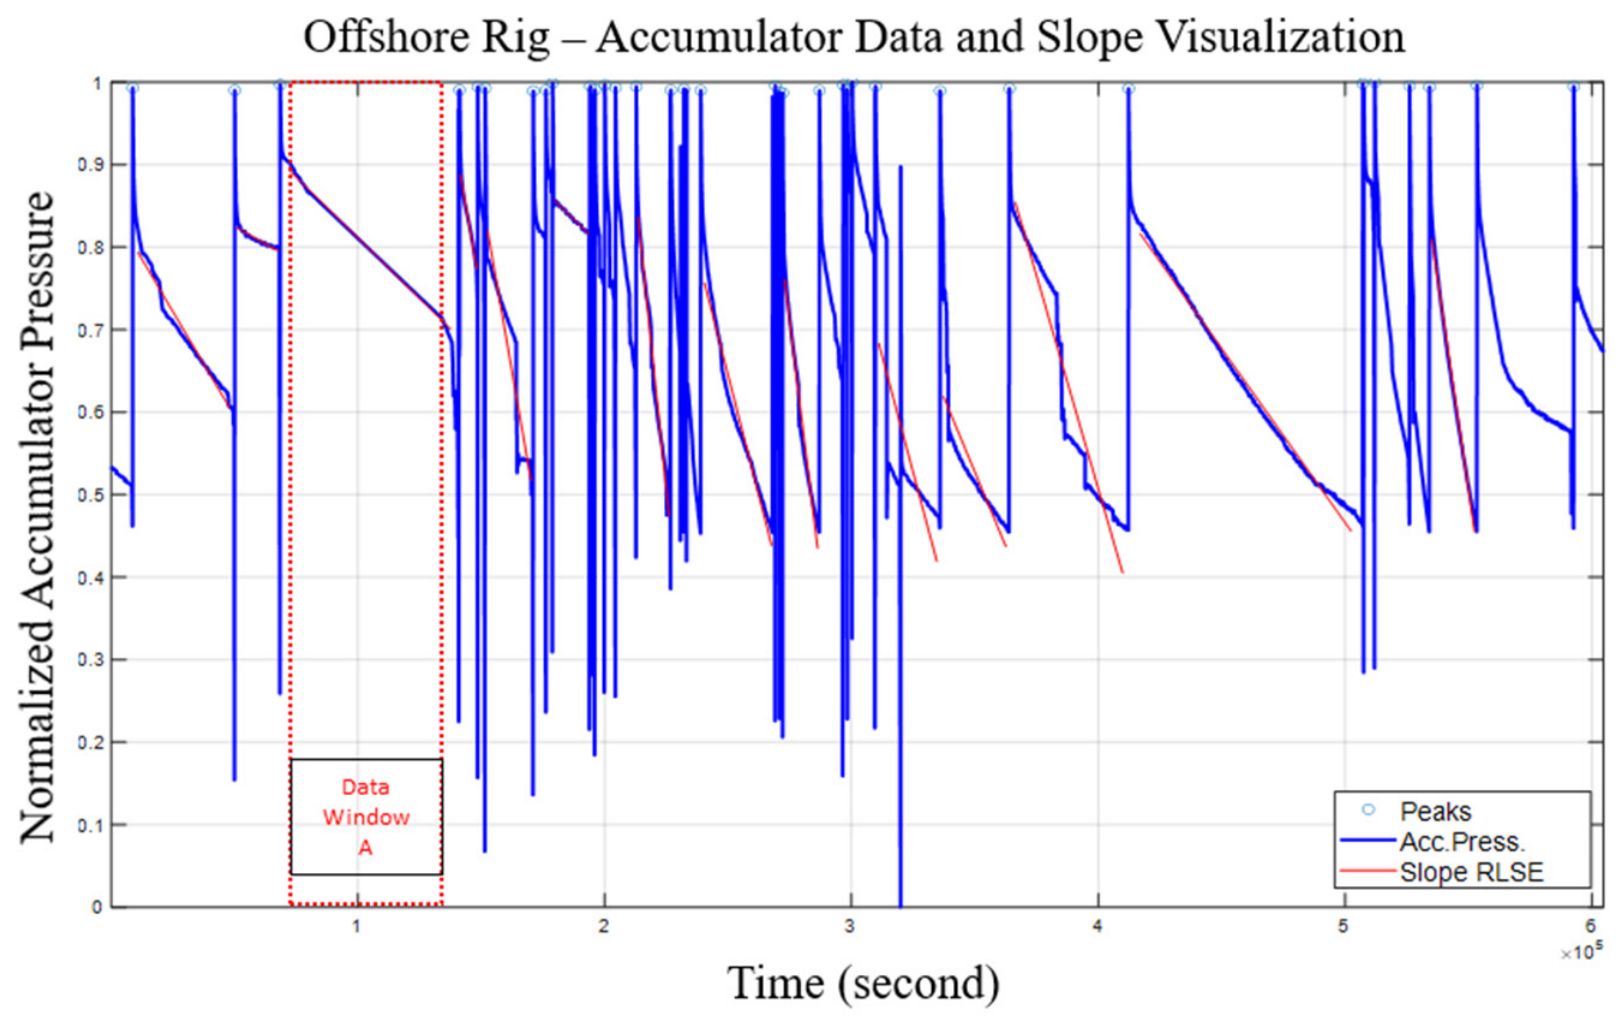
Figure 4 is a representative segment of the accumulator pressure history. The pressure profile exhibits periodic recharge cycles, during which pressure increases due to pump operation, followed by discharge intervals characterized by gradual pressure decay. Within the selected discharge intervals, the observed pressure decay is assumed to be dominated primarily by leakage-related hydraulic fluid loss within the control circuit.
A representative discharge cycle is highlighted in
Figure 4 along with the selected data window used for slope estimation. The selected window corresponds to the central portion of the discharge interval, minimizing transient effects near pump-switching events. For visualization purposes, the pressure signal in
Figure 4 is normalized; however, leakage calculations are performed using the corresponding dimensional pressure values. The superimposed RLSE slope visualization illustrates the approximately linear pressure decay behavior captured within the selected discharge windows across multiple operating cycles. The relatively consistent linear decay behavior observed across multiple discharge cycles supports the quasi-static leakage assumption used in the accumulator leakage model.
4.2. Leakage Estimation
Within each discharge interval, the pressure decay rate is estimated using the RLSE procedure described in
Section 3. The pressure data within the selected window are approximated using a linear model, and the resulting slope provides the pressure decay estimate used for leakage rate computation.
For the representative discharge cycle shown in
Figure 4, the estimated pressure decay slope is approximately −0.0026 psi/s. The pressure decay slope is estimated directly from the original dimensional pressure measurements, while the normalized pressure profile shown in
Figure 4 is provided solely for visualization purposes. To evaluate the robustness of the slope estimation procedure, different data window sizes are considered within the same discharge cycle.
Table 1 presents the estimated slopes obtained using windows ranging from 50% to 100% of the discharge interval. The results indicate that the RLSE-based estimates are relatively insensitive to window selection, with only minor variations observed across different window sizes. The 90% window provides a balanced compromise by excluding transient effects near the beginning and end of the discharge interval while retaining sufficient data for reliable estimation and is therefore adopted for subsequent leakage calculations.
Using the estimated pressure decay rates and the leakage model introduced in
Section 2, the accumulator leakage rate is computed for each discharge cycle. The computation uses system-specific parameters, including accumulator precharge pressure and total accumulator volume, obtained from equipment specifications.
To compare RLSE with a conventional slope estimation approach, ordinary least-squares (OLS) estimates were also computed using the same discharge windows. The resulting pressure decay slopes showed excellent agreement. The mean relative difference between the RLSE and OLS slope estimates was 0.00618%, and the correlation coefficient between the two methods was 0.9999999943. These results indicate that RLSE and OLS provide essentially identical slope estimates for the offline analysis of the selected discharge windows. In the present application, the primary advantage of RLSE is its recursive implementation and covariance-based monitoring capability for online deployment.
4.3. Results and Discussion
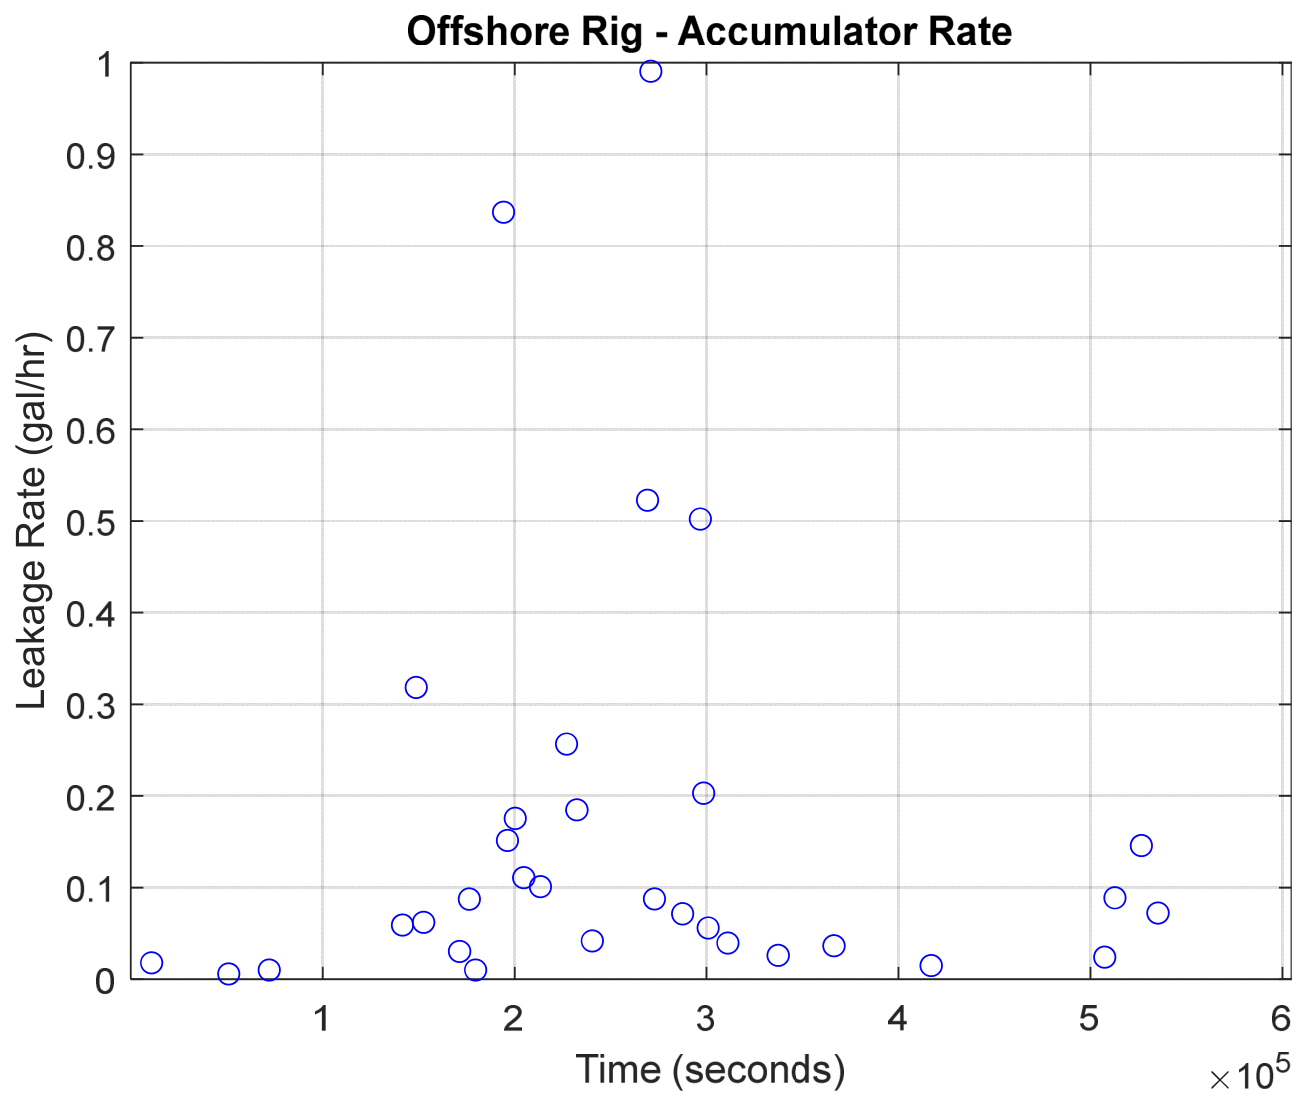
Shown in
Figure 5 is the resulting leakage rate as a function of time. The leakage estimates are computed using an assumed accumulator precharge pressure of 2000 psi and a total accumulator volume of 13.2 gallons, corresponding to the analyzed system configuration. These parameters can be readily adjusted for different accumulator configurations without modification to the underlying methodology.
The result shows generally low leakage rates during most operating cycles, with several localized periods of elevated leakage behavior. These variations suggest temporally changing hydraulic degradation and operating conditions within the control circuit rather than persistent monotonic leakage growth. Because the method relies solely on pressure measurements routinely available in offshore monitoring systems, it provides a practical approach for the real-time hydraulic integrity monitoring of subsea BOP control systems. Continuous leakage estimation also supports condition-based maintenance by improving the visibility of hydraulic degradation trends over time.
The leakage estimates obtained in this section serve as the reference states for the signal-based consistency analysis presented in
Section 5.
5. Signal-Based Consistency Analysis
This section presents a signal-based consistency analysis designed to complement the physics-based leakage estimation methodology introduced in
Section 2,
Section 3 and
Section 4. While the RLSE framework provides quantitative leakage estimates from pressure decay behavior, the present analysis examines whether the same leakage behavior is reflected in independently constructed statistical characteristics of the pressure measurements. The objective is to evaluate whether leakage states identified by the RLSE framework correspond to observable and statistically distinguishable pressure dynamics. The analysis focuses on consistency between independently constructed pressure signal characteristics and RLSE-derived leakage states rather than the validation of absolute leakage magnitudes.
5.1. Analysis Framework
The analysis uses features constructed directly from the pressure measurements to examine whether RLSE-derived leakage behavior is reflected in observable system dynamics. The raw input signal used in this analysis is the accumulator pressure time history, , which represents the accumulator pressure at time index t. The pressure data are sampled at 1 Hz and consist of approximately one year of offshore operational measurements.
Unlike the RLSE framework, which operates on discharge cycle windows and pressure decay estimation, the present analysis constructs predictors directly from the full pressure history without using RLSE-derived slopes, leakage estimates, or cycle window features. The RLSE leakage estimates are used only to define reference labels. A cycle is classified as abnormal if the estimated leakage exceeds a specified threshold:
where
is the leakage threshold used to distinguish healthy and abnormal operating behavior. In this study, the nominal threshold is 0.5 gal/h based on maintenance practice and engineering judgment. Sensitivity to this threshold selection is examined later in
Section 5.4. The RLSE labels are originally defined at the cycle level. To construct a full-signal dataset, each cycle label is mapped to all time samples within the corresponding cycle interval:
This procedure produces approximately 28 million labeled time points after propagating the cycle-level RLSE labels to the corresponding time samples within each cycle. These mapped time points should not be interpreted as independent leakage events because samples within the same operating cycle share the same RLSE label and are temporally auto-correlated. Therefore, the operating cycle remains the primary labeling unit, while the mapped time samples provide a full-signal representation of the pressure dynamics associated with each RLSE-labeled cycle. For the full-year dataset, 1588 discharge cycles were identified, including 1459 healthy cycles (91.88%) and 129 abnormal cycles (8.12%) using the nominal leakage threshold of 0.5 gal/h. The median cycle duration was 9811 s (approximately 2.7 h), while the median healthy and abnormal cycle durations were 11,682 s (approximately 3.2 h) and 1674 s (approximately 28 min), respectively. The shorter duration of abnormal cycles contributes to the lower abnormal class proportion observed at the sample level. To reduce redundancy from consecutive pressure samples, a 10 s stride was applied before model training and evaluation.
The resulting dataset is highly imbalanced at the sample level, with healthy samples representing approximately 99% of the observations and abnormal samples comprising less than 1%. This occurs because the RLSE labels are defined at the cycle level and abnormal cycles are substantially shorter than healthy cycles. Therefore, evaluation metrics sensitive to class imbalance are required for meaningful performance assessment. To preserve temporal independence between training and testing data, the dataset is partitioned chronologically by operating cycle rather than by random sampling. The first 70% of cycles are used for training and the remaining 30% for testing, with a five-cycle embargo inserted near the split boundary to reduce temporal leakage.
If the RLSE-derived leakage states correspond to meaningful hydraulic degradation behavior, independent pressure signal features should exhibit consistent statistical separation between normal and abnormal operating conditions.
5.2. Feature Construction and Physical Interpretation
A total of 23 features are constructed directly from the accumulator pressure history to characterize pressure level, local pressure motion, pressure variability, and longer-term operating trends. The feature set includes pressure values, pressure differences, rolling statistical quantities, derivative-based features, and local slope estimates computed over multiple time windows. Because these features are derived solely from the pressure measurements and do not use RLSE-derived slopes or leakage estimates as predictor variables, they provide an independent statistical representation of pressure behavior for evaluating consistency with the RLSE-derived leakage states. Similar feature-based signal representations are widely used in industrial monitoring and fault detection applications [
13,
14].
Pressure-level and memory effects
The instantaneous pressure value is defined as follows:
Lagged pressure values are computed as follows:
where
τ represents selected lag intervals. These features characterize the current operating condition of the accumulator as well as short-term pressure memory effects.
Pressure difference and local dynamic features
The first pressure difference is defined as follows:
This quantity represents the instantaneous pressure change between consecutive samples and is directly related to local pressure decay behavior. Negative values correspond to discharge behavior, while positive values correspond to recharge behavior. To characterize changes in the local pressure trend, the second pressure difference is computed as follows:
This feature provides sensitivity to transient variations and nonlinear changes in pressure behavior. The absolute pressure difference is also included:
Unlike the signed pressure difference, this quantity measures overall pressure activity independent of direction.
Rolling statistical features and multi-scale pressure variability
To characterize system behavior over different time scales, rolling statistical features are computed over moving windows of length W. For the analyzed dataset, the median discharge cycle duration was 9811 s, while the median RLSE window (90% of the cycle duration) was approximately 8830 s. The rolling windows used in the feature construction (30 s, 120 s, and 300 s) correspond to approximately 0.31%, 1.22%, and 3.06% of the median cycle duration, respectively. Relative to the median RLSE window, the same rolling windows correspond to approximately 0.34%, 1.36%, and 3.40%. These windows therefore characterize local pressure behavior within a cycle and are substantially shorter than the discharge intervals used for RLSE.
The rolling pressure mean is defined as follows:
while the rolling pressure standard deviation is defined as follows:
The rolling mean represents the local pressure baseline, while the rolling standard deviation quantifies pressure variability. From a physical perspective, leakage influences both the average pressure level and the persistence of pressure decay between recharge cycles. As leakage increases, gradual changes in pressure variability may develop over longer time intervals. Consequently, rolling variability metrics may provide indirect indicators of abnormal hydraulic behavior, consistent with the feature importance results presented later in this paper.
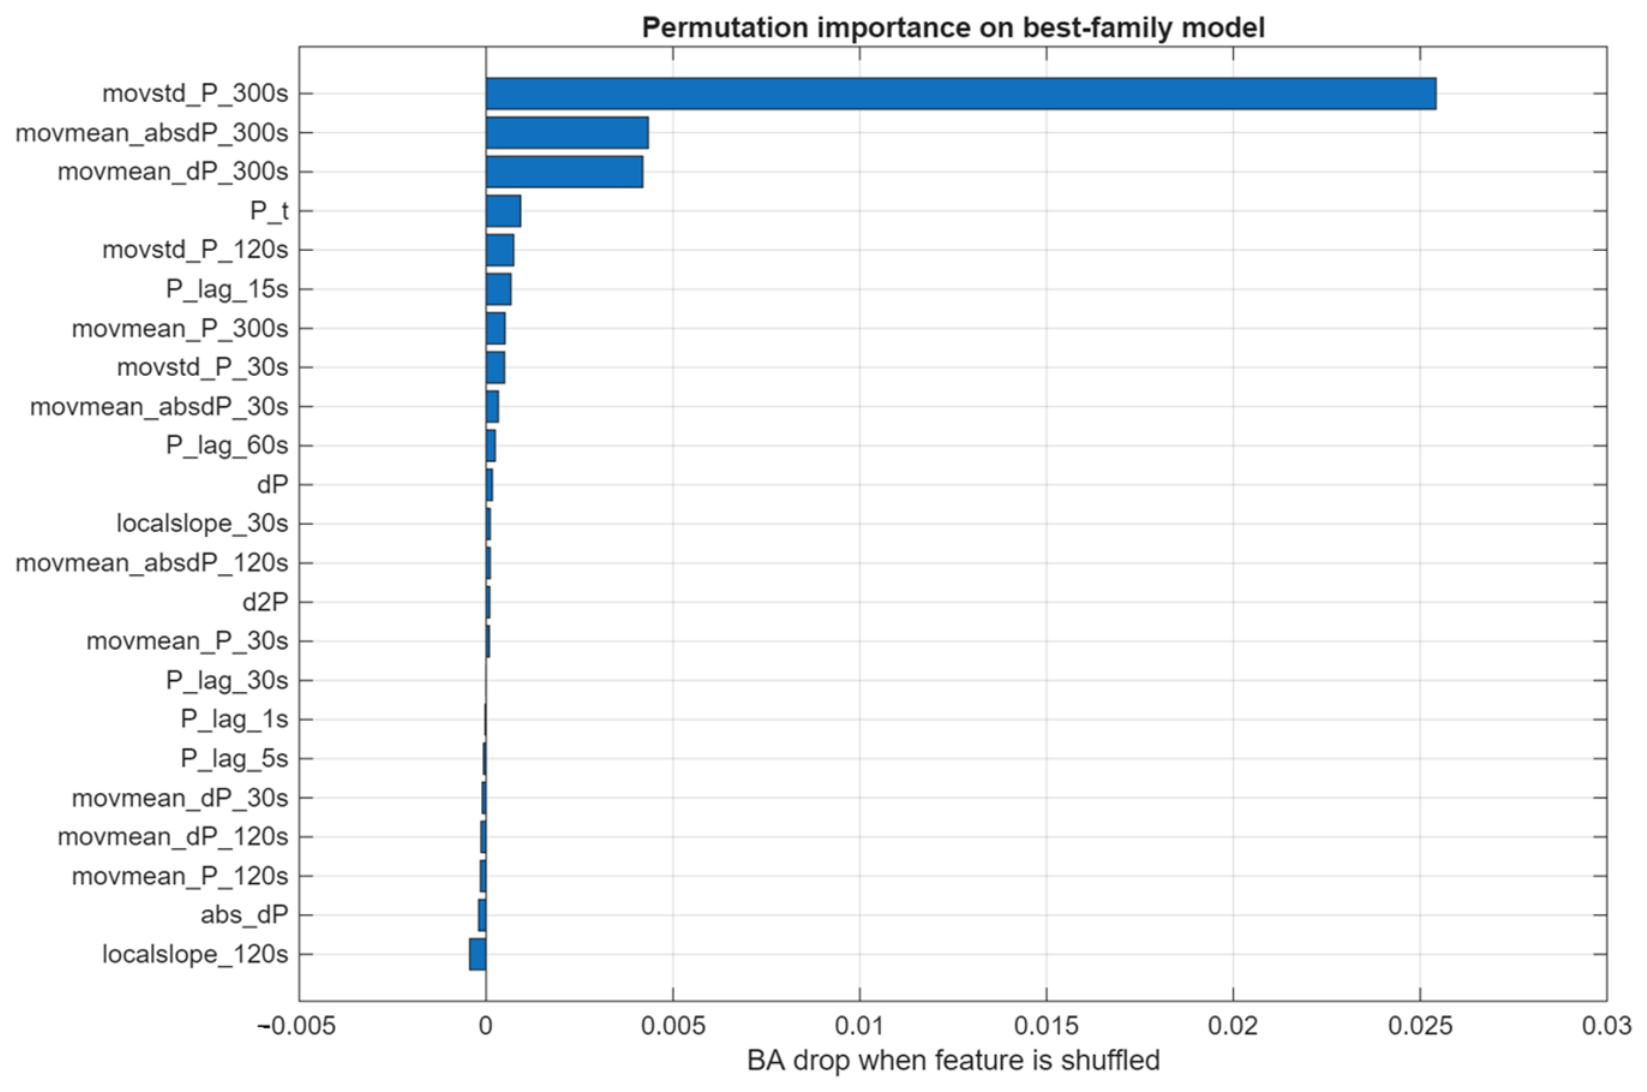
Pressure variability may also be influenced by pump operation, control valve activity, operating conditions, thermal effects, and measurement noise. Therefore, the feature importance results should be interpreted as showing an association with RLSE-derived leakage states in this dataset, rather than identifying leakage as the only cause of pressure variability.
Rolling derivative activity
To characterize sustained pressure motion, rolling derivative features are also computed:
The signed rolling derivative captures net pressure drift, while the absolute rolling derivative measures overall pressure activity independent of direction.
Local slope features and connection to RLSE
Local pressure slopes are estimated by fitting a linear relationship over moving windows:
where the coefficient a represents the local pressure slope. Although these local slope features are conceptually related to the RLSE pressure decay estimates introduced in
Section 2 and
Section 3, they are computed continuously across the full pressure history and therefore provide a complementary representation of pressure behavior. Together, these features provide a multi-scale characterization of accumulator pressure dynamics.
5.3. Consistency Evaluation
Several ensemble learning methods, including bagging [
16], Random Forest [
17], boosting [
18], LogitBoost [
19], and RUSBoost [
20], are used to evaluate whether RLSE-derived leakage states are statistically distinguishable using independently constructed pressure features. These models are used solely to assess statistical separability and are not intended as replacement leakage estimators.
Because the dataset is highly imbalanced, raw classification accuracy is not used as the primary performance metric. Instead, balanced accuracy (BA), receiver operating characteristic area under the curve (ROC-AUC), and precision–recall area under the curve (PR-AUC) are evaluated. BA compensates for class imbalance by averaging sensitivity and specificity, ROC-AUC measures threshold-independent class separability, and PR-AUC evaluates abnormal class retrieval performance.
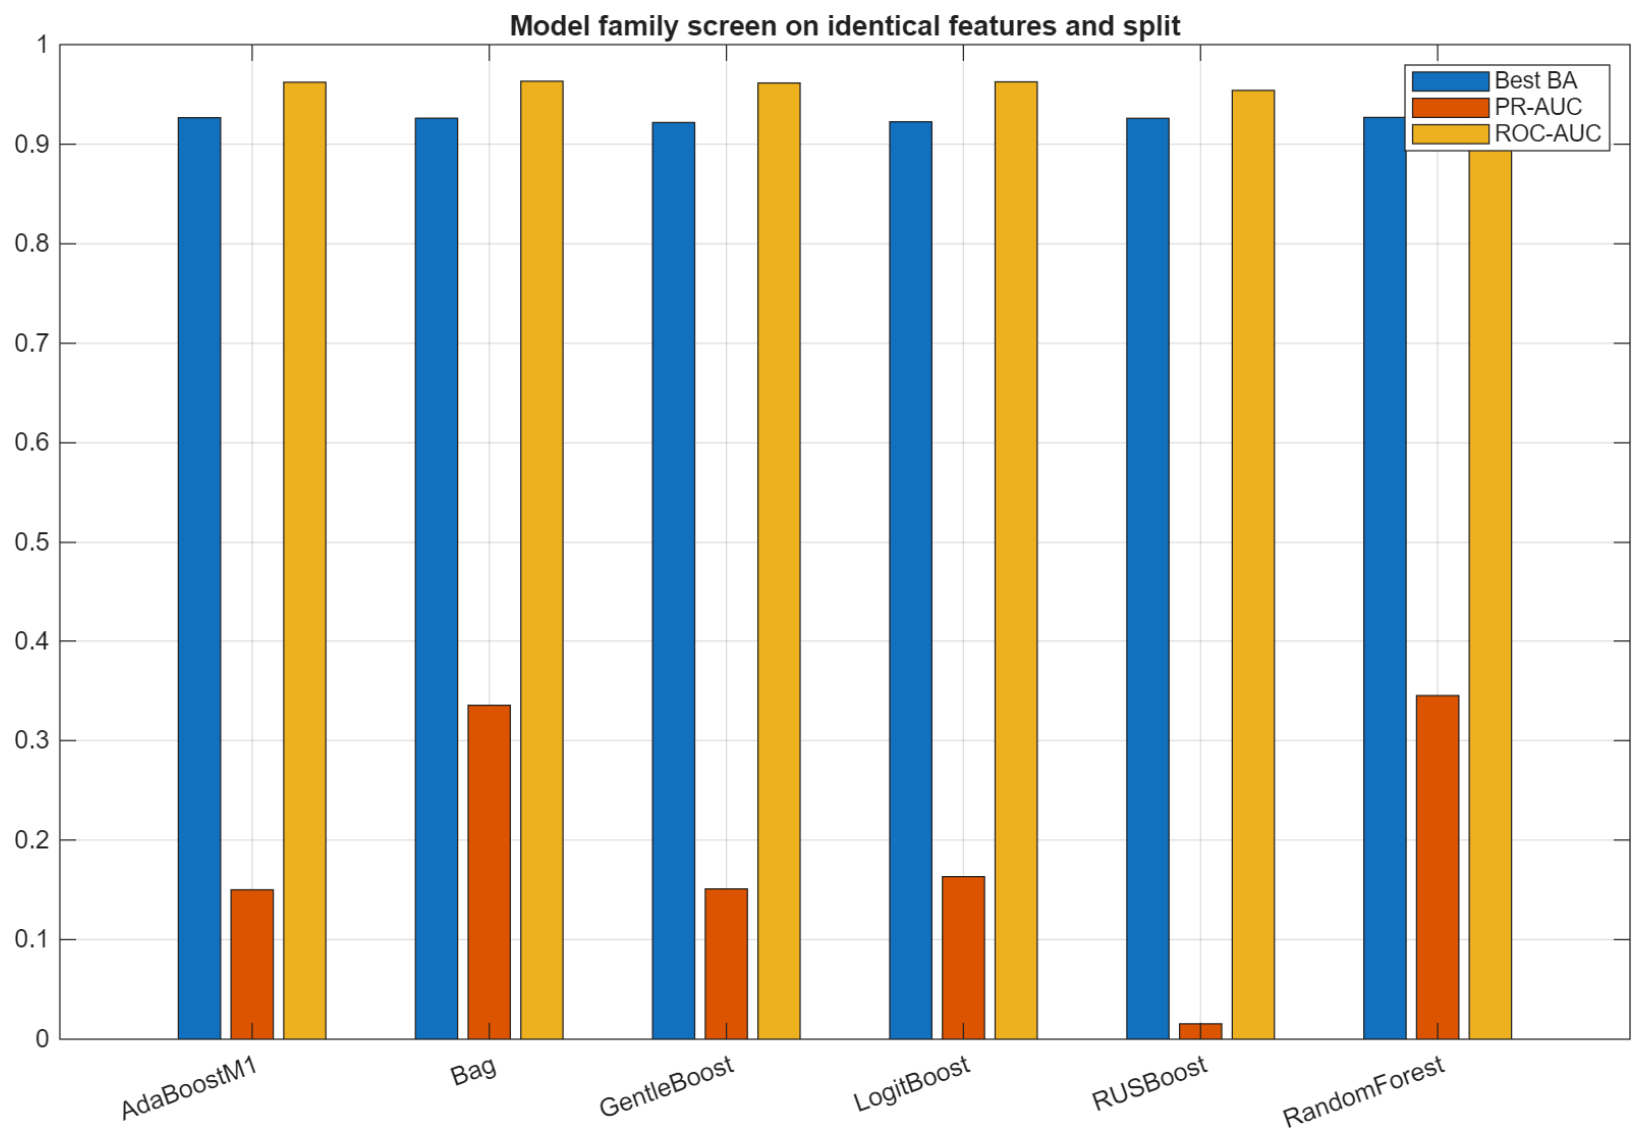
The comparison shown in
Figure 6 indicates that all evaluated ensemble models achieve similar balanced accuracy values near 0.92, suggesting that the observed consistency is not strongly dependent on a specific classifier structure. Among the evaluated methods, Random Forest provides the strongest overall combination of BA, ROC-AUC, and PR-AUC and is therefore selected for detailed analysis. The final Random Forest model consists of 200 trees with a minimum leaf size of 50.
This consistency across multiple model families suggests that the observed statistical separability is primarily driven by the underlying pressure dynamics rather than dependence on a specific classifier architecture. For evaluation, balanced accuracy is defined as follows:
where TP, TN, FP, and FN represent true-positive, true-negative, false-positive, and false-negative counts, respectively.
5.4. Results and Robustness Assessment
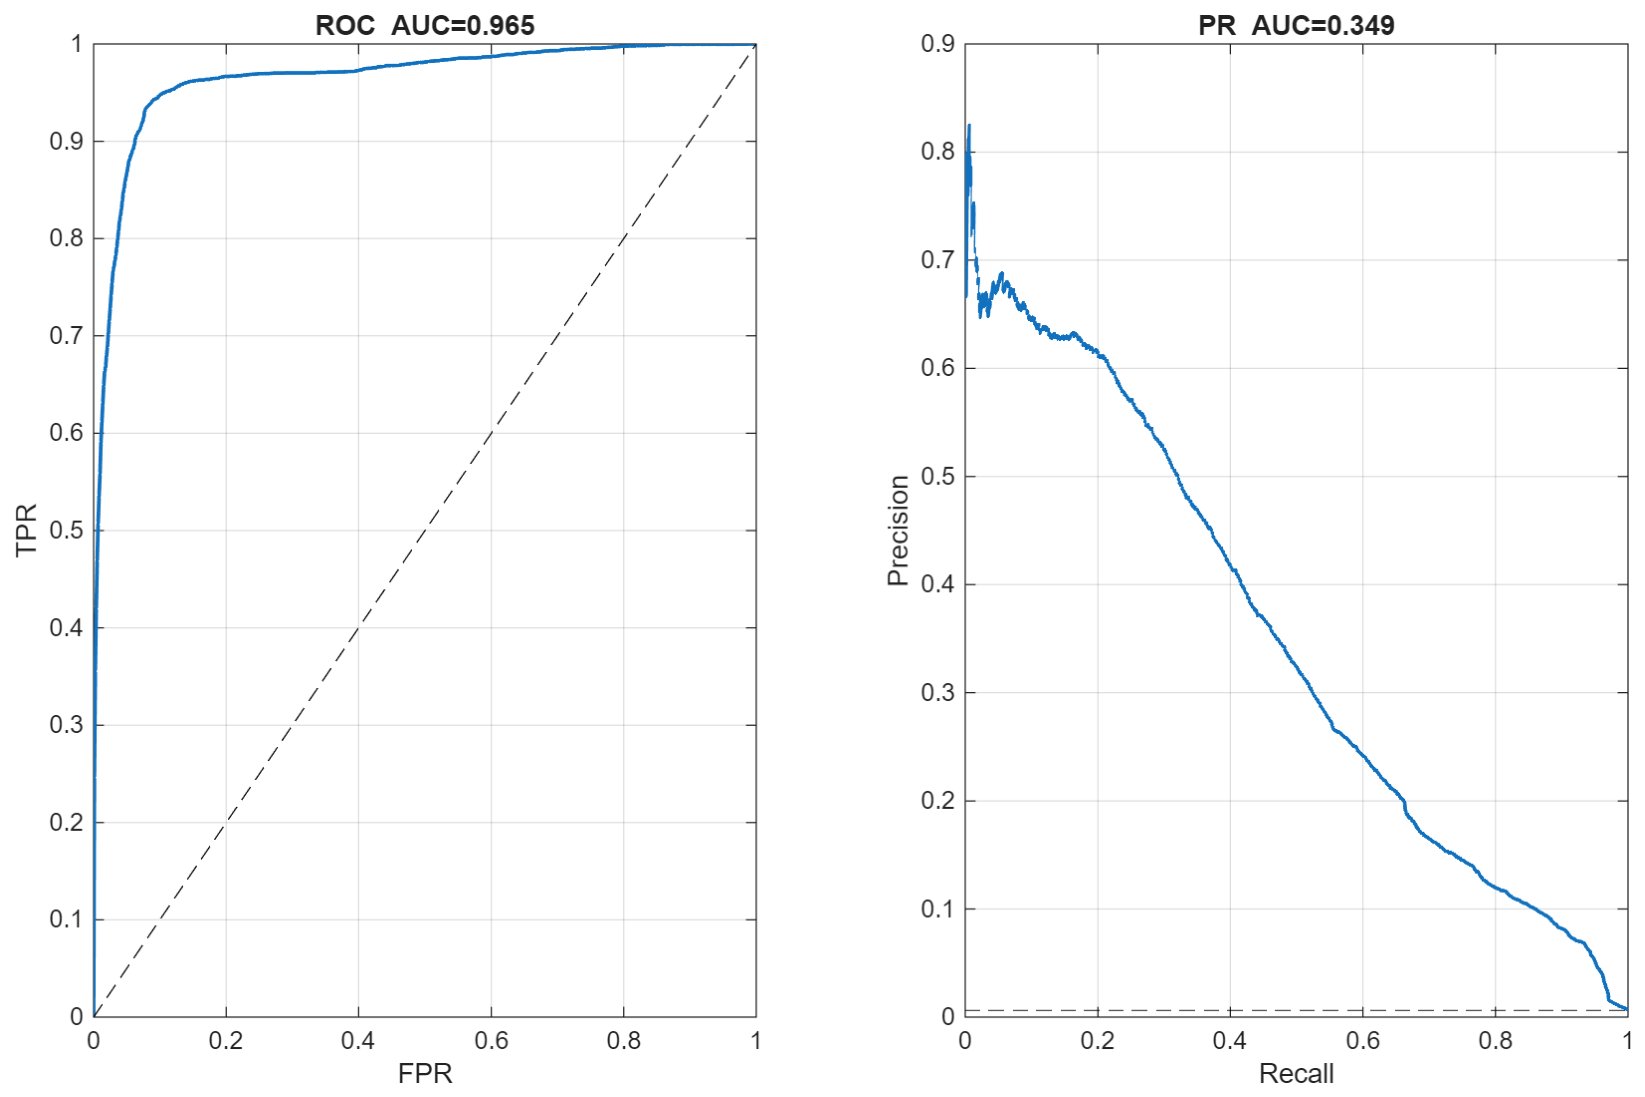
The tuned Random Forest model demonstrates strong classification performance on the held-out test set, achieving a balanced accuracy of 0.9275 and a ROC-AUC of 0.9648. Because the abnormal class is highly underrepresented, accounting for approximately 0.6% of the samples, precision–recall performance provides an important complementary measure of classifier effectiveness. A random classifier would be expected to achieve a PR-AUC approximately equal to the prevalence of the abnormal class (≈0.006). In contrast, the proposed model achieves a PR-AUC of 0.3486, which is approximately 58 times higher than the random baseline. These results indicate that abnormal leakage states remain distinguishable despite the severe class imbalance present in the offshore operational dataset.
These results indicate that RLSE-derived leakage states are recoverable from signal-derived pressure characteristics. Consistent with the cycle-level statistics presented in
Section 5.1, representative abnormal cycles exhibited substantially shorter discharge durations and faster depletion/recharge behavior than healthy cycles. These observations are consistent with the RLSE-derived leakage classifications and support the interpretation that abnormal leakage states are associated with measurable changes in pressure behavior. As shown in
Figure 7, the ROC curve remains close to the upper-left corner over a broad threshold range, while the precision–recall performance remains substantially above the abnormal class baseline despite the severe class imbalance.
Figure 8 summarizes the permutation importance ranking of the evaluated pressure features for the tuned Random Forest model. Feature importance analysis reveals that the dominant predictor is the rolling standard deviation of pressure over a 300 s window,
, as shown in
Figure 8.
This result is physically interpretable because leakage influences pressure variability over sustained time intervals. The feature importance ranking therefore suggests that leakage-related degradation is reflected more strongly through pressure variability and pressure motion characteristics than through instantaneous pressure levels alone.
A label permutation null test is performed to evaluate whether the observed classification performance could arise by chance. In each trial, the training labels are randomly shuffled while preserving the class distribution, and the model is retrained using the shuffled labels.
The empirical
p-value is computed as follows:
where
N = 200 is the number of permutation trials,
is the balanced accuracy from the
k-th shuffled label trial,
is the balanced accuracy obtained with the true labels, and
1(·) is an indicator function equal to 1 if the condition is true and 0 otherwise.
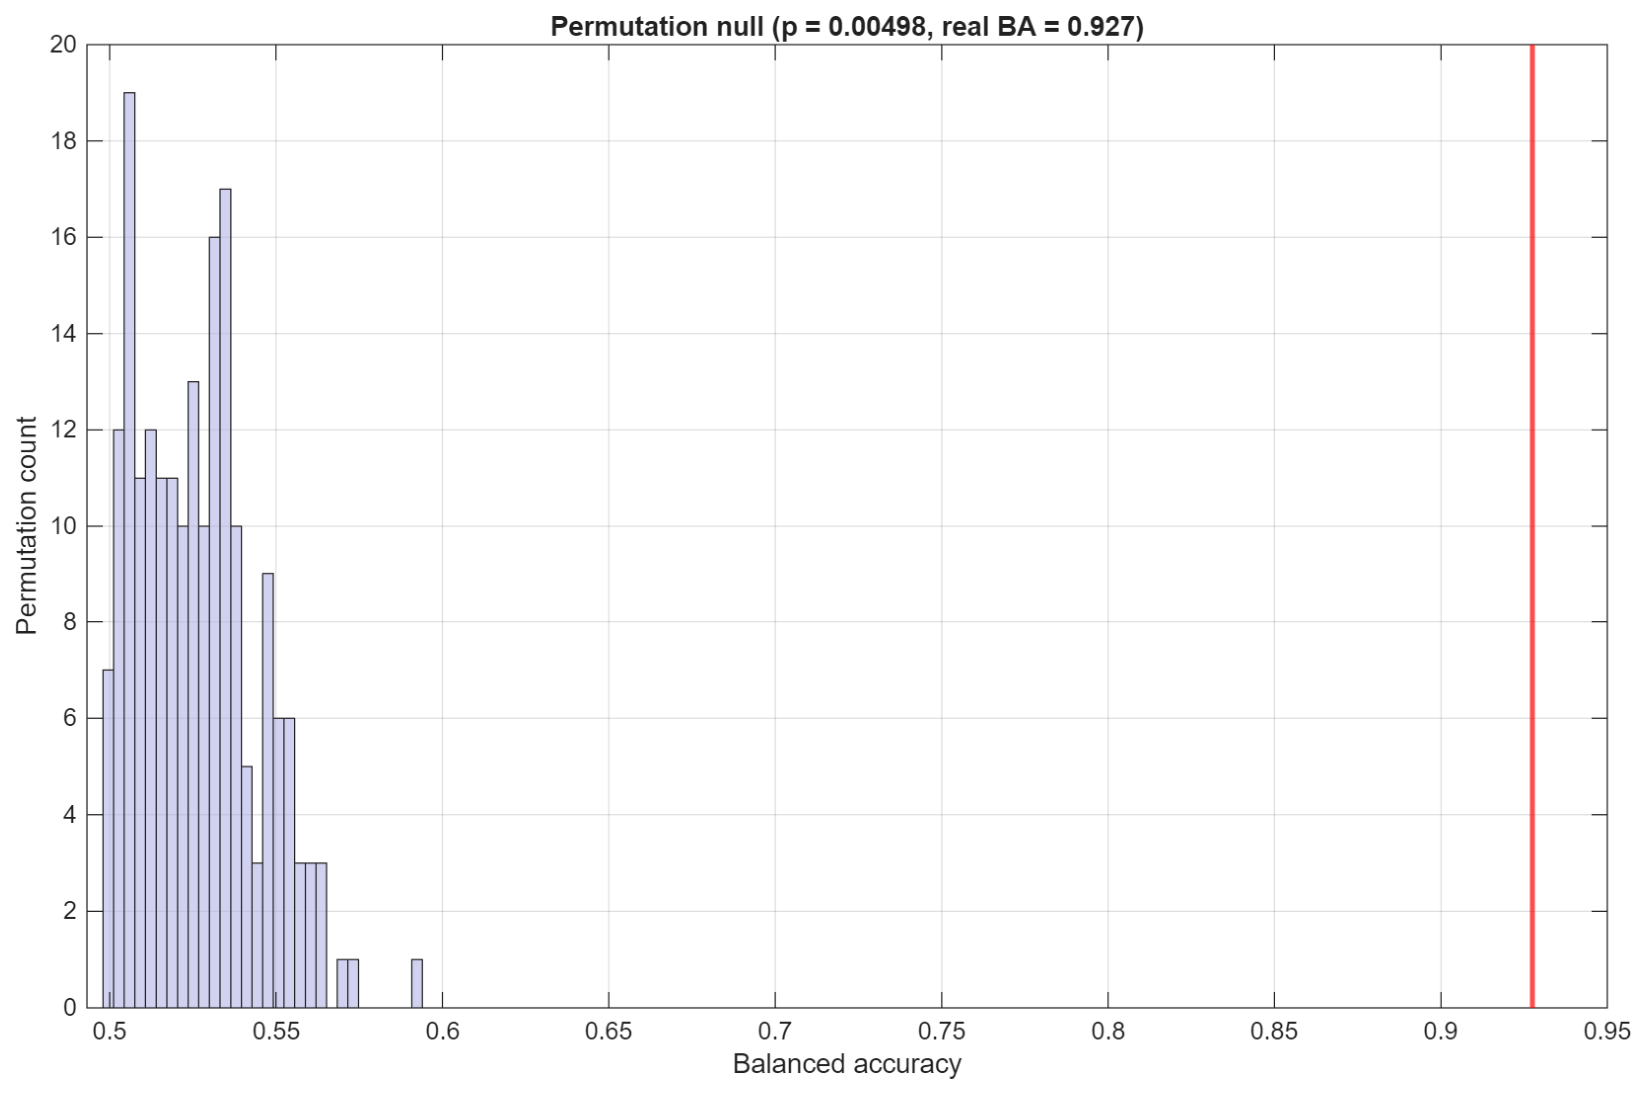
Figure 9 shows the balanced-accuracy distribution obtained from the label-permutation test, together with the result obtained using the true RLSE labels.
A total of 200 shuffled label trials were performed using the same cycle-aware chronological train/test split and feature set. In each trial, only the training labels were randomly permuted while preserving the original class distribution. None of the shuffled label trials achieved a balanced accuracy greater than or equal to that obtained using the true RLSE labels ().
Therefore, using Equation (21), the empirical p-value is . The null distribution has a mean balanced accuracy of 0.5262 and a maximum balanced accuracy of 0.5915, both substantially lower than the balanced accuracy obtained using the true RLSE labels. Together, these results indicate that the observed agreement between pressure dynamics and RLSE-derived leakage states is highly unlikely to occur under random labeling conditions.
To further assess the stability of the observed consistency, additional robustness evaluations were performed. These analyses examine the sensitivity of the results to data partitioning, leakage threshold selection, and temporal variations in operating conditions. The corresponding results are summarized in
Table 2.
For the temporal consistency evaluation, the trained model was applied to independent operating periods corresponding to the third quarter (Q3) and fourth quarter (Q4) of the one-year offshore dataset. The balanced accuracies obtained for these periods remain comparable to the overall test performance, indicating that the relationship between RLSE-derived leakage states and pressure dynamic characteristics remains consistent across different operating periods.
Overall, the robustness results indicate that the observed consistency between RLSE-derived leakage states and pressure dynamic characteristics remains stable across different train/test partitions, leakage thresholds, and operating periods.
5.5. Interpretation and Integration
The results demonstrate that physics-based leakage estimation and signal-based statistical characterization identify similar leakage behavior within the analyzed pressure record. This cross-method consistency supports the interpretation that the RLSE-derived leakage estimates reflect observable hydraulic system dynamics rather than artifacts of the estimation procedure.
Because direct subsea leakage flow measurements were unavailable during the analyzed offshore operation, this study focuses on consistency assessment rather than the validation of absolute leakage magnitude. Accordingly, the results should be interpreted as evidence that RLSE-derived leakage states are reflected in observable pressure dynamics, rather than proof that the estimated leakage rates exactly represent the true leakage flow. The practical role of the proposed framework is therefore hydraulic integrity monitoring, leakage trending, and abnormal state identification. The signal-based analysis is not intended to replace the physics-based leakage estimator. Instead, it provides a complementary consistency assessment of whether leakage states identified through RLSE correspond to statistically distinguishable pressure behavior.
From a practical perspective, the framework combines quantitative leakage estimation through RLSE with a complementary interpretation of hydraulic system behavior through signal-based analysis, enhancing confidence in pressure-based hydraulic integrity monitoring and supporting condition-based maintenance strategies for subsea BOP hydraulic control systems.
6. Conclusions
This study presents a physics-based methodology for the real-time monitoring of accumulator leakage in subsea blowout preventer (BOP) hydraulic control systems using routinely available pressure measurements. The proposed approach estimates leakage rates by analyzing pressure decay behavior during accumulator discharge intervals and applying recursive least-squares estimation (RLSE) for the adaptive tracking of leakage dynamics.
The results demonstrate that RLSE-derived leakage states correspond to statistically distinguishable and physically interpretable pressure dynamic patterns, supporting cross-method consistency between model-based estimation and signal-based characterization.
Because the methodology relies solely on routinely available offshore pressure measurements, it can be implemented without additional subsea instrumentation and is suitable for continuous hydraulic integrity monitoring applications. From an operational perspective, the proposed framework supports condition-based maintenance planning by improving the visibility of leakage-related degradation trends in subsea BOP hydraulic control systems.
The present methodology should be viewed primarily as a pressure-based hydraulic integrity monitoring and leakage trending tool. While the observed consistency between the estimates from RLSE and pressure signal characteristics supports the physical relevance of the identified leakage behavior, independent validation against measured leakage flow conditions remains necessary for absolute leakage quantification.
The methodology assumes that the selected discharge intervals are dominated primarily by leakage-related pressure decay and are not significantly influenced by commanded hydraulic actuation or other major hydraulic disturbances. Consequently, the estimated leakage magnitude may be affected when these assumptions are not satisfied. Additional operational information, such as pump status indicators or valve command records, could be used to further verify the suitability of selected discharge intervals in future applications.
Future work will focus on validation using independently measured leakage conditions, extension to predictive degradation modeling, and integration into broader offshore monitoring architectures for subsea production system safety applications.
Author Contributions
Conceptualization, S.G., Y.T. and M.F.; methodology, S.G., M.A.A., C.G., Y.T. and M.F.; validation, M.A.A.; formal analysis, S.G., M.A.A., and C.G.; investigation, S.G., M.A.A., C.G. and Y.T.; resources, M.F.; data curation, M.F.; writing—original draft preparation, S.G., M.A.A.; writing—review and editing, Y.T., M.F. and K.G.; supervision, M.F. and K.G.; project administration, M.F. and K.G. All authors have read and agreed to the published version of the manuscript.
Funding
This research received no external funding.
Data Availability Statement
The accumulator pressure data used in the offshore case study are not publicly available due to confidentiality restrictions associated with proprietary operational data.
Acknowledgments
During the preparation of this manuscript, the authors used OpenAI ChatGPT-5.5 for the purposes of grammar checking and language polishing. The authors have reviewed and edited the output and take full responsibility for the content of this publication.
Conflicts of Interest
The authors declare no conflicts of interest.
Abbreviations
The following abbreviations are used in this manuscript:
| BOP | Blowout Preventer |
| RLSE | Recursive Least-Squares Estimation |
| HPU | Hydraulic Power Unit |
| BA | Balanced Accuracy |
| ROC-AUC | Receiver Operating Characteristic Area Under the Curve |
| PR-AUC | Precision–Recall Area Under the Curve |
| TP | True Positive |
| TN | True Negative |
| FP | False Positive |
| FN | False Negative |
References
- Mutlu, M.; Arnold, Z.; Franchek, M.; Meraz, J. Qualitative Fault Tree Analysis of Blowout Preventer Control System for Real Time Availability Monitoring. In Proceedings of the Annual Offshore Technology Conference, Houston, TX, USA, 1–4 May 2017. [Google Scholar]
- Bureau of Transportation Statistics. Well Control Equipment Systems Safety—2023 Annual Report; United States Department of Transportation: Washington, DC, USA, 2023.
- Shafiee, M.; Elusakin, T.; Enjema, E. Subsea Blowout Preventer (BOP): Design, Reliability, Testing, Deployment, and Operation and Maintenance Challenges. J. Loss Prev. Process Ind. 2020, 66, 104170. [Google Scholar] [CrossRef]
- Mutlu, M.; Wassar, T.; Franchek, M.; Omrani, A.E.; Gutierrez, J.A. Real-Time Condition and Performance Monitoring of a Subsea Blowout Preventer Pipe Ram. SPE Drill. Complet. 2018, 33, 50–62. [Google Scholar] [CrossRef]
- Merritt, H.E. Hydraulic Control Systems; John Wiley & Sons: New York, NY, USA, 1967. [Google Scholar]
- Elusakin, T.; Shafiee, M. Reliability Analysis of Subsea Blowout Preventers with Condition-Based Maintenance using Stochastic Petri Nets. J. Loss Prev. Process Ind. 2020, 63, 104026. [Google Scholar] [CrossRef]
- Liu, Z.; Liu, Y. A Bayesian Network Based Method for Reliability Analysis of Subsea Blowout Preventer Control System. J. Loss Prev. Process Ind. 2019, 59, 44–53. [Google Scholar] [CrossRef]
- Cai, B.; Liu, Y.; Zhang, Y.; Fan, Q.; Yu, S. Dynamic Bayesian Networks Based Performance Evaluation of Subsea Blowout Preventers in Presence of Imperfect Repair. Expert Syst. Appl. 2013, 40, 7544–7554. [Google Scholar] [CrossRef]
- Khan, J.A.; Irawan, S.; Thurai, A.S.; Cai, B. Quantitative Analysis of Blowout Preventer Flat Time for Well Control Operation: Value Added Data Aimed at Performance Enhancement. Eng. Fail. Anal. 2021, 120, 104982. [Google Scholar] [CrossRef]
- Tao, H.; Jia, P.; Wang, X.; Wang, L. Reliability Analysis of Subsea Control Module Based on Dynamic Bayesian Network and Digital Twin. Reliab. Eng. Syst. Saf. 2024, 248, 110153. [Google Scholar] [CrossRef]
- Wen, Y.; Yue, Y.; Zuo, X.; Li, X. Reliability-based Preventive Maintenance Strategy for Subsea Control System. Processes 2024, 12, 761. [Google Scholar] [CrossRef]
- Wassar, T.; Mutlu, M.; Franchek, M.; Gutierrez, J. Leakage Monitoring of Subsea Blowout Preventer Control System. In Proceedings of the Annual Offshore Technology Conference, Houston, TX, USA, 30 April–3 May 2018. [Google Scholar]
- Zhang, Y.; Jiang, J. Bibliographical Review on Reconfigurable Fault-Tolerant Control Systems. Annu. Rev. Control 2008, 32, 229–252. [Google Scholar] [CrossRef]
- Yin, S.; Ding, S.X.; Xie, X.; Luo, H. A Review on Basic Data-Driven Approaches for Industrial Process Monitoring. IEEE Trans. Ind. Electron. 2014, 61, 6418–6428. [Google Scholar] [CrossRef]
- Ljung, L. System Identification: Theory for the User; Prentice Hall: Upper Saddle River, NJ, USA, 1999. [Google Scholar]
- Breiman, L. Bagging Predictors. Mach. Learn. 1996, 24, 123–140. [Google Scholar] [CrossRef]
- Breiman, L. Random Forests. Mach. Learn. 2001, 45, 5–32. [Google Scholar] [CrossRef]
- Freund, Y.; Schapire, R.E. A Decision-Theoretic Generalization of On-line Learning and An Application to Boosting. J. Comput. Syst. Sci. 1997, 55, 119–139. [Google Scholar] [CrossRef]
- Friedman, J.; Hastie, T.; Tibshirani, R. Additive Logistic Regression: A Statistical View of Boosting. Ann. Stat. 2000, 28, 337–407. [Google Scholar] [CrossRef]
- Seiffert, C.; Khoshgoftaar, T.M.; Van Hulse, J.; Napolitano, A. RUSBoost: A Hybrid Approach to Alleviating Class Imbalance. IEEE Trans. Syst. Man Cybern. Part A Syst. Hum. 2009, 40, 185–197. [Google Scholar] [CrossRef]
| Disclaimer/Publisher’s Note: The statements, opinions and data contained in all publications are solely those of the individual author(s) and contributor(s) and not of MDPI and/or the editor(s). MDPI and/or the editor(s) disclaim responsibility for any injury to people or property resulting from any ideas, methods, instructions or products referred to in the content. |




 ,
,