1. Introduction
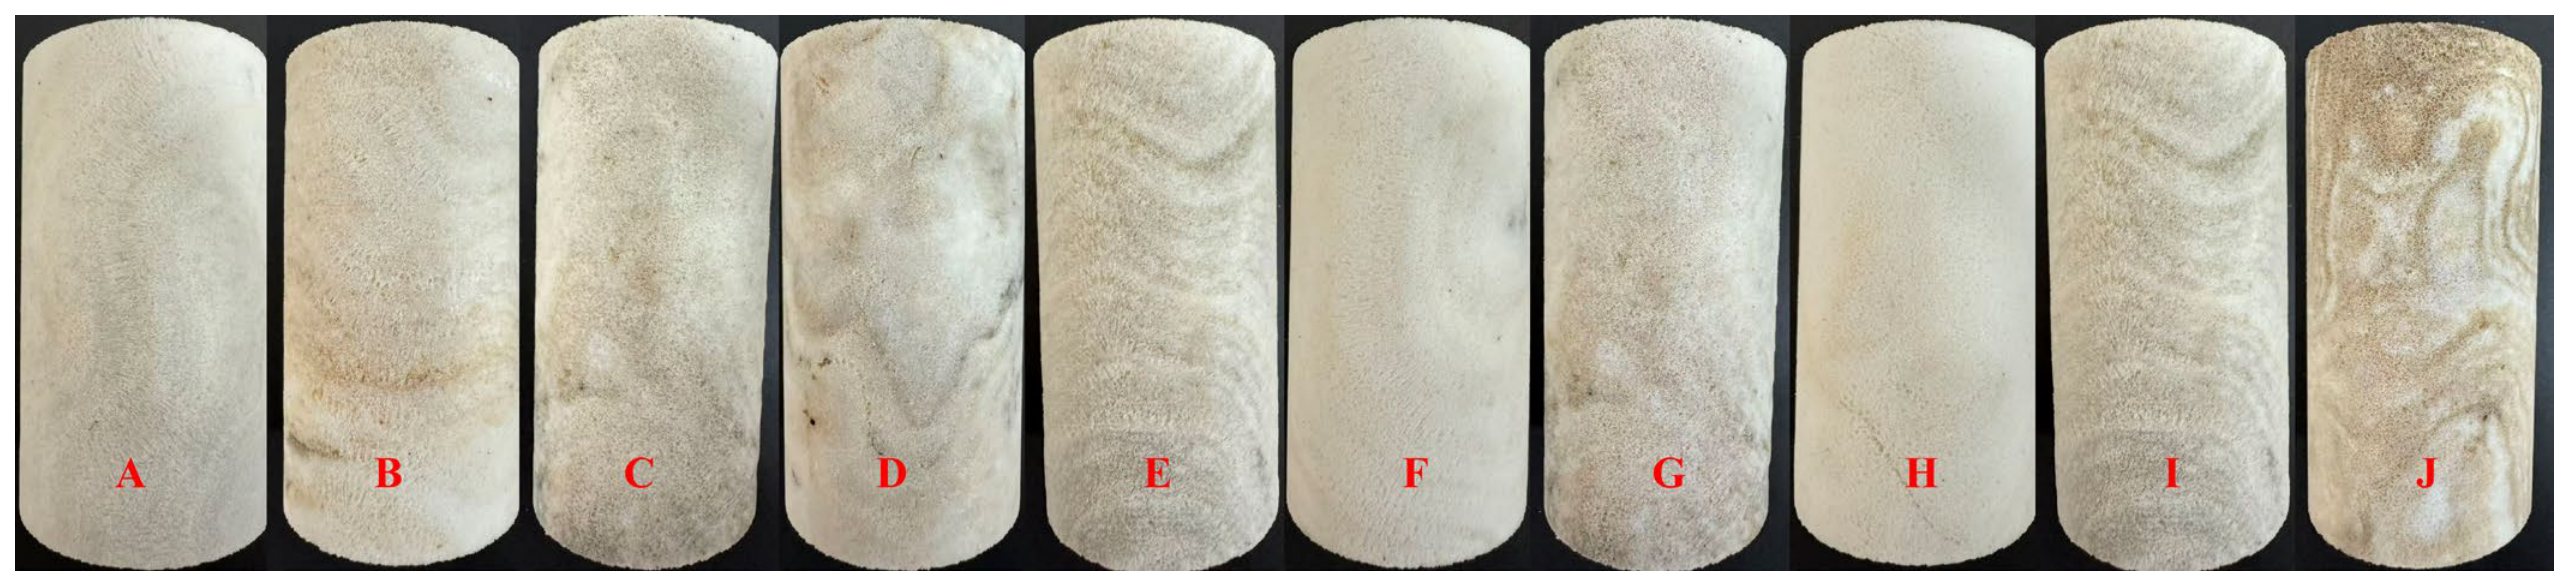
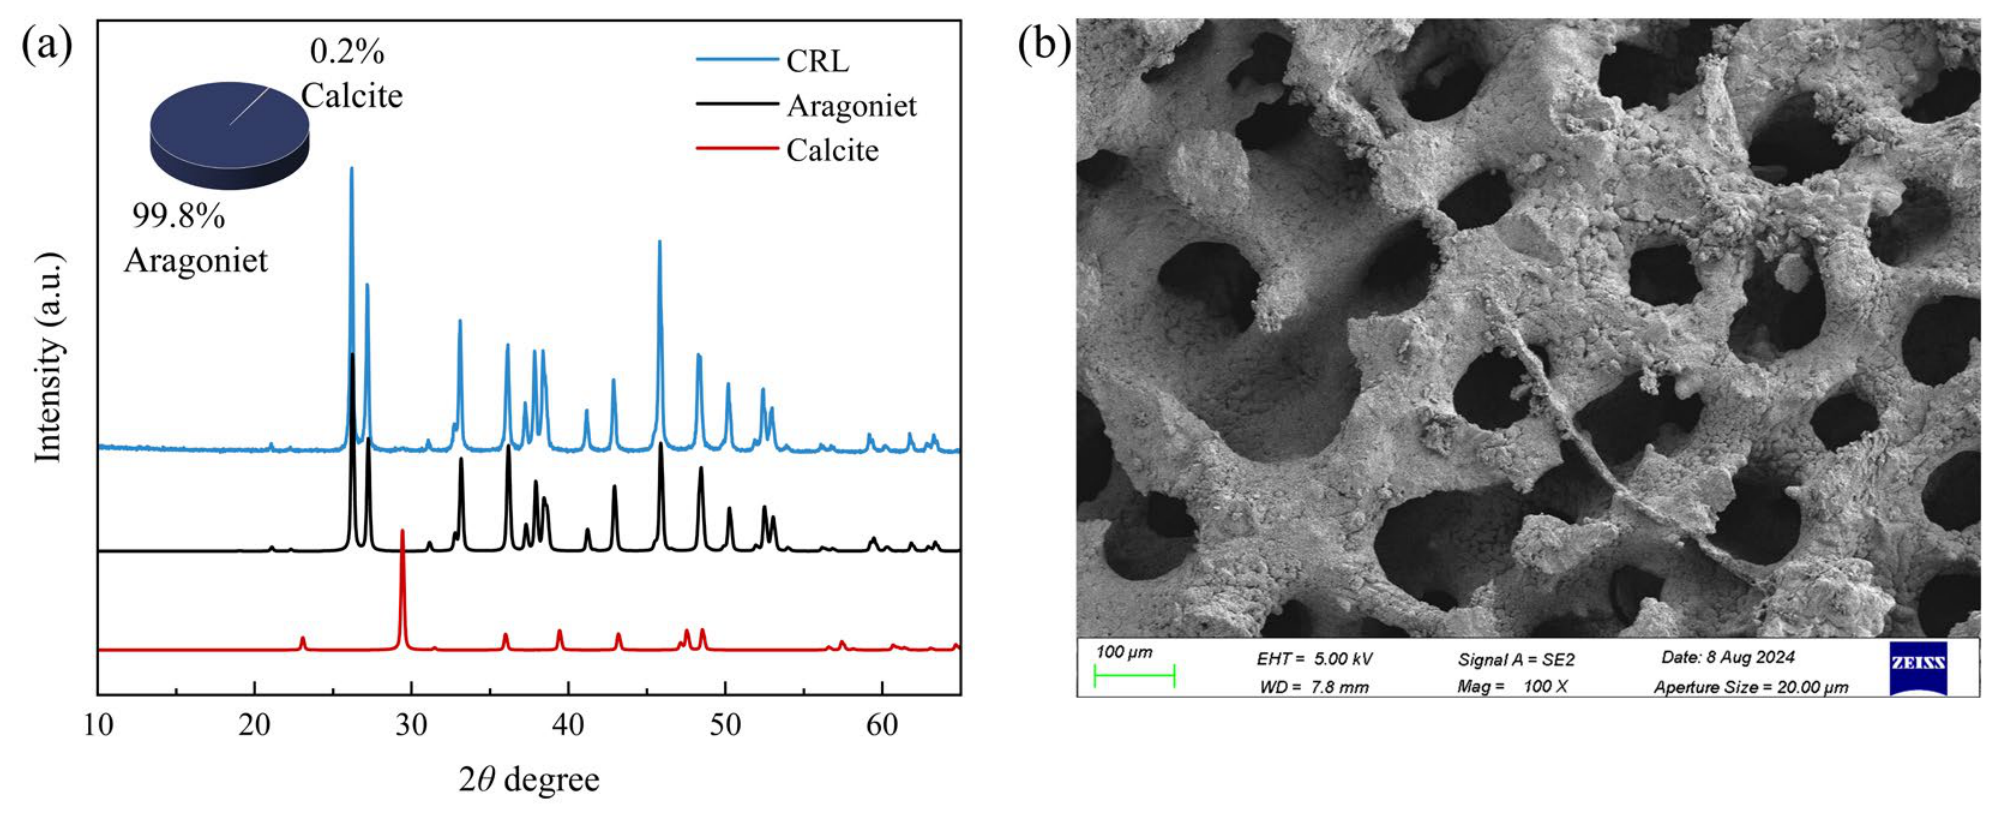
Coral reef limestone is a typical biogenic carbonate rock whose formation is jointly controlled by depositional environment, diagenesis, and biological skeletal structure. It commonly exhibits high porosity, strong heterogeneity, and complex connected pore networks [
1,
2,
3,
4]. Owing to differences in lithology, cementation, growth fabric, and diagenetic alteration, different types of coral reef limestone often show pronounced variations in strength, deformation, and failure mode. Therefore, accurately characterizing the mechanical behavior of coral reef materials under complex stress paths is of great importance for geotechnical design in marine engineering, island reef infrastructure, and underground space development. Related studies have further shown that coral-derived geomaterials can exhibit distinct interface behavior and material-design requirements in marine engineering applications [
5,
6].
In recent years, studies on the mechanical behavior of coral reef limestone have mainly focused on uniaxial compression, conventional triaxial compression, and dynamic impact loading. With the aid of CT, XRD, SEM, and real-time scanning techniques, previous studies have systematically investigated pore structure, crack propagation, dynamic response, and the influence of cementation type in reef limestone [
5,
6,
7,
8,
9,
10,
11,
12,
13,
14,
15]. Wu et al. [
7] discussed crack propagation mechanisms at the microscopic scale. Liu et al. [
8] analyzed crack initiation and damage evolution of micritized framework reef limestone. Meng et al. [
9] revealed mesoscopic damage evolution through real-time CT scanning. Wang et al. [
10] compared the strength characteristics of reef limestone with different cementation types and showed that cementation can alter load-bearing capacity, and Ma et al. [
11] demonstrated that diagenetic variation affects both static and dynamic mechanical responses. These studies indicate that the macroscopic mechanical behavior of coral reef limestone is closely related to pore structure, skeletal fabric, and cementation, with highly porous multiscale skeletal structures playing a key role in controlling deformation and failure paths. Beyond coral reef limestone itself, recent studies on porous carbonate rocks have shown that compaction, dilatancy, and failure are strongly controlled by pore architecture, cementation, and stress-path conditions. Vajdova et al. [
12] reported that porous carbonate rocks may undergo coupled compaction–dilatancy–failure transitions under loading, and Dautriat et al. [
13] further showed that heterogeneous carbonate rocks exhibit clear stress-path dependence in their hydromechanical response. Recent AE- and imaging-based studies on coral reef limestone have also confirmed that pore structure and cementation type can significantly influence strength and damage evolution [
13,
14]. These studies suggest that highly porous biogenic carbonates should be treated as a structure-sensitive rock class rather than as conventional dense limestones.
During engineering excavation, the surrounding rock generally undergoes confining-pressure release and deviatoric stress redistribution rather than simple axial loading. The classical work of Brace et al. [
15] showed that rock dilatancy is closely associated with crack opening and coalescence. Peng et al. [
16] investigated unloading path effects through true triaxial loading–unloading tests on coal, Li et al. [
17] examined triaxial unloading failure of deep composite coal rock, and Zheng et al. [
18] found that foliated rocks exhibit pronounced dilatancy and multiscale failure under confining pressure unloading. However, these studies mainly focused on coal, hard rock, or foliated rock, and direct experimental understanding of unloading path effects in highly porous intact coral blocks remains limited. This path dependence is also consistent with unloading studies on limestone, where stress redistribution and confining pressure release can accelerate dilatancy and abrupt instability under true triaxial conditions [
19]. Accordingly, unloading path effects in highly porous coral blocks may be even more pronounced because of their weak skeletal framework and connected pore network.
For underground caverns, slope excavation, and island-reef engineering, confining-pressure release is commonly accompanied by deviatoric stress redistribution, which may induce dilatancy, local instability, or even abrupt failure of surrounding rock [
20,
21,
22,
23,
24]. Nevertheless, the mechanical response, dilatancy evolution, and damage characteristics of highly porous coral blocks under triaxial unloading remain insufficiently understood, particularly regarding the relationship between unloading path and acoustic emission response. Acoustic emission (AE) monitoring has been widely used to identify crack initiation, fracture precursors, and failure modes in rocks [
16,
17,
25,
26,
27,
28,
29]. However, for highly porous coral blocks with weak and loose skeletal structures, whether AE can provide reliable precursors under complex unloading conditions, when it is most sensitive to failure, and how it relates temporally to deformation precursors still require further investigation. Recent AE-based studies on coral reef limestone and related rocks have shown that pore-structure heterogeneity and stress-path variation can lead to distinct AE evolution patterns and precursor characteristics [
13,
30]. However, most existing AE studies focus on dense rocks or on loading conditions, and the AE response of highly porous coral blocks under triaxial unloading remains insufficiently understood.
Therefore, conventional triaxial compression tests, two types of triaxial unloading tests, and synchronous AE monitoring were conducted on coral blocks from the South China Sea. By comprehensively analyzing physical properties, stress–strain curves, volumetric response, stress-path effects, and AE evolution, this study discusses the confining-pressure strengthening mechanism, the dominant role of unloading path, and the coupled relationship between deformation and AE precursors. The results are expected to provide experimental support for stability assessment and support design in coral reef strata.
3. Results of Rock Mechanics Experiments
3.1. Specimen Variability and Comparability of Test Results
The coefficients of variation for the physical parameters of the reef limestone samples are shown in
Table 3. Because coral blocks are highly porous, biogenic, and inherently heterogeneous materials, specimen variability may still influence the comparability of the mechanical responses obtained under different test conditions. Although the coefficients of variation of dry density, saturated density, porosity, and P-wave velocity are relatively limited, only one specimen was tested for each unloading condition. Therefore, the observed differences in strength, deformation, and acoustic emission response should be interpreted as preliminary trends under the present test conditions rather than as definitive evidence that excludes the effect of specimen heterogeneity.
It should also be noted that the observed variations in porosity and saturated P-wave velocity may influence both the mechanical response and the propagation of AE waves. Specimens with higher porosity and lower P-wave velocity are expected to exhibit weaker skeletal connectivity, lower stiffness and strength, and stronger attenuation of AE signals. Therefore, although the measured physical-property variability is relatively limited in terms of coefficients of variation, the influence of specimen heterogeneity on the comparability of mechanical and AE responses cannot be fully excluded.
3.2. Strength and Deformation Characteristics Under Conventional Triaxial Compression
The conventional triaxial compression results are shown in
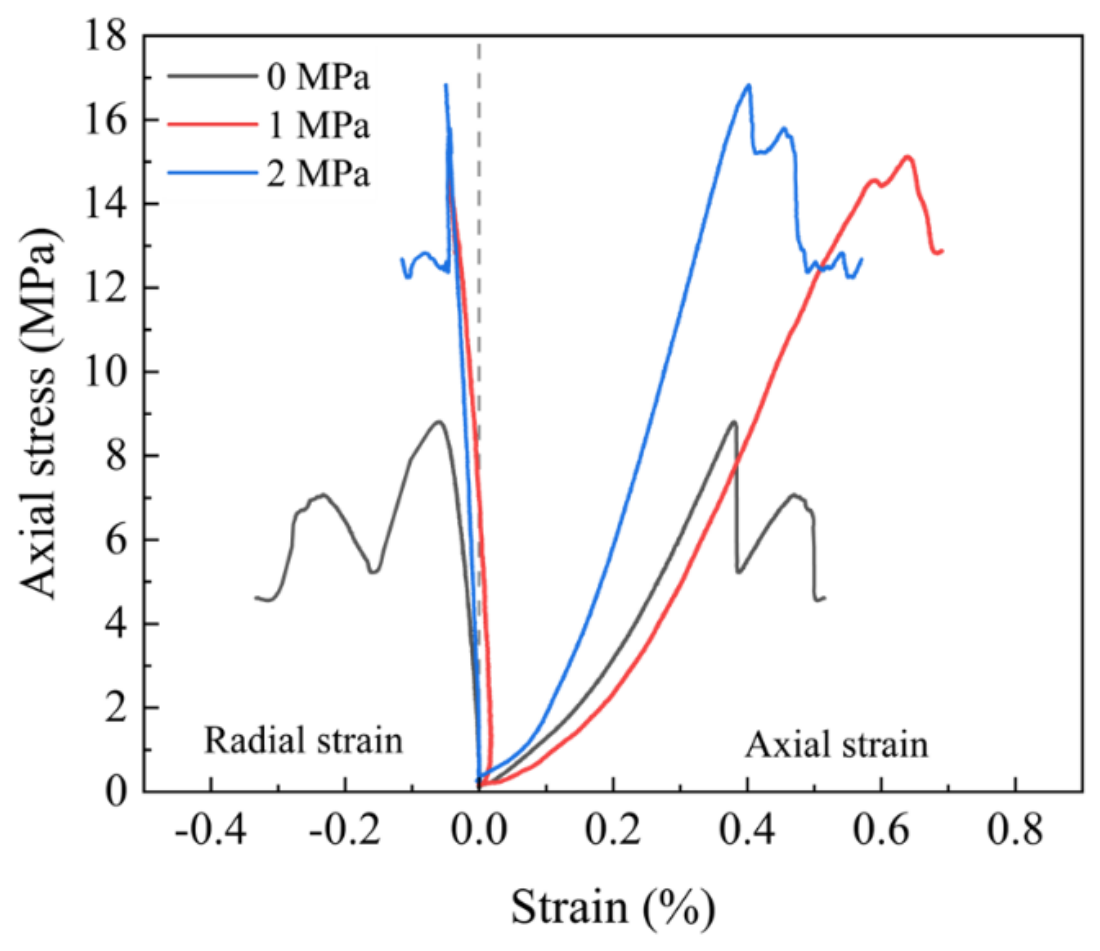
Figure 5. Under different confining pressures, the stress–strain curves of the coral blocks exhibit pronounced nonlinear responses. At the initial loading stage, the specimens undergo a distinct pore-compaction phase, followed by an approximately linear stress-increase stage. Near the peak stress, local stress fluctuations and accelerated damage development are observed. These features indicate that the compressive response of highly porous coral blocks is not a simple linear hardening process but rather a coupled evolution involving pore closure, skeletal rearrangement, and crack propagation.
As shown in
Figure 5, increasing confining pressure generally enhances the strength of the coral blocks under triaxial compression, whereas the deformation response is more complex. When the confining pressure increases from 0 to 2 MPa, the peak strength increases from 8.81 to 16.85 MPa, corresponding to an increase of 91.3%. By contrast, the axial strain at peak strength changes from 0.33% at 0 MPa to 0.63% at 1 MPa and then decreases to 0.40% at 2 MPa, indicating a nonmonotonic deformation response within the tested range. In addition, some curves exhibit local stress drops followed by stress recovery near the peak stress, indicating that local skeletal collapse, damage propagation, and load redistribution may occur during loading. Compared with dense rocks, coral blocks therefore show more pronounced stress fluctuations and a less stable pre-peak evolution.
3.3. Confining-Pressure Sensitivity and Strength Envelope Characteristics
The effect of confining pressure on strength also shows a clear staged variation within the tested range. When the confining pressure increases from 0 to 1 MPa, the peak strength rises from 8.81 to 15.11 MPa, with an increment of 6.30 MPa and a relative increase of 71.5%. When the confining pressure further increases from 1 to 2 MPa, the peak strength rises to 16.85 MPa, with an additional increment of 1.74 MPa and a relative increase of 11.5%. In other words, the strength gain induced by the second 1 MPa increase in confining pressure is only about 0.28 times of that induced by the first 1 MPa increase. This result indicates that the strengthening effect of confining pressure is nonlinear within the low-confining-pressure range of 0–2 MPa and is more pronounced during the transition from the unconfined state to weak confinement.
The variation in peak strain does not fully follow the strength evolution and instead shows a nonmonotonic trend. When the confining pressure increases from 0 to 1 MPa, the axial strain at peak strength increases from 0.33% to 0.63%, corresponding to an increase of 0.30 percentage points or 90.9%. When the confining pressure further increases from 1 to 2 MPa, the axial strain at peak strength decreases to 0.40%, corresponding to a reduction of 0.23 percentage points or 36.5%. This indicates that, although confining pressure markedly enhances peak strength, the pre-peak deformation capacity of the tested coral blocks does not increase monotonically with confinement.
It should be noted that E and μ in this study were determined from the approximately linear segment of the pre-peak stress–strain curve and should therefore be regarded as equivalent deformation parameters rather than strict elastic constants. As shown in
Table 4, E decreases from 4.01 GPa at 0 MPa to 3.42 GPa at 1 MPa and then increases to 5.72 GPa at 2 MPa, indicating a nonmonotonic trend. Under the present test conditions, this trend cannot be uniquely attributed to a single factor. It may reflect the combined influence of local pore collapse and skeletal rearrangement in the low-confinement range, specimen-to-specimen heterogeneity, and the sensitivity of slope-based parameter extraction to the shape of the approximately linear segment. Therefore, the observed variation in E should be interpreted cautiously as an experimental response of the tested specimens rather than as a definitive general law of confining-pressure-dependent stiffness.
As shown in
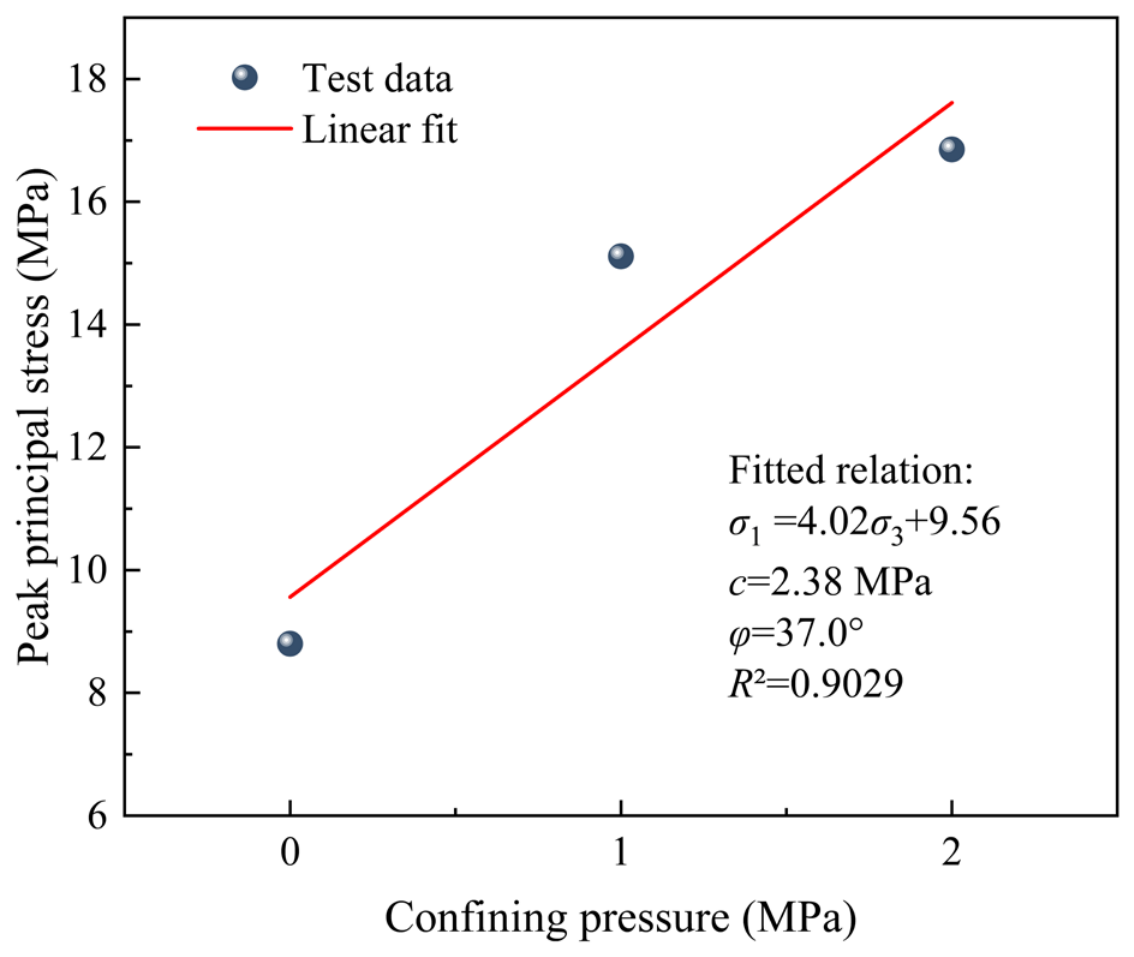
Figure 6, a preliminary equivalent Mohr–Coulomb fit was performed using the three conventional triaxial compression data points at confining pressures of 0, 1, and 2 MPa. The fitting yields an equivalent cohesion of approximately 2.38 MPa, an equivalent internal friction angle of approximately 37.0°, and a coefficient of determination R
2 of approximately 0.9029. However, because only three data points are available and the strength increase already exhibits a nonlinear trend within this low-confining-pressure range, these fitted parameters should be regarded only as equivalent approximations for the tested range of 0–2 MPa. They should not be interpreted as a reliable strength envelope or extrapolated to higher confining pressures.
This cautious interpretation is also consistent with previous studies. Wang et al. [
10] showed that the strength characteristics of reef limestone vary significantly with cementation type, indicating that strength-related parameters in reef limestones are strongly material-dependent. In addition, direct shear tests on coral limestone from the Vipingo area reported a friction angle of about 41° and a cohesion of about 0.133 MPa [
31]. Although these values were obtained using a different material source and test method, the comparison suggests that the present equivalent friction angle is of a similar order, whereas the cohesion may vary substantially with lithology, porosity, cementation, specimen condition, and testing procedure. More generally, Vajdova [
12] showed that porous carbonate rocks may display low-pressure brittle failure and nonlinear failure-envelope characteristics over wider confinement ranges. Therefore, the present three-point fit is more appropriately regarded as a local equivalent approximation for the low-confining-pressure range than as a transferable strength envelope.
3.4. Transformation of the Deformation Mechanism Under Confining Pressure
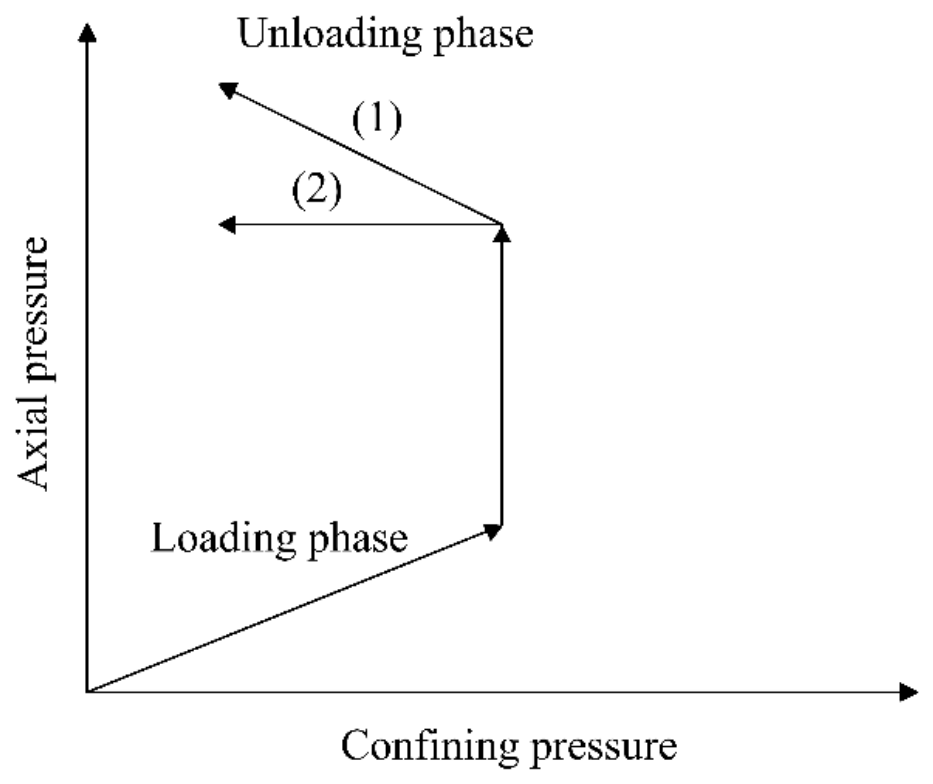
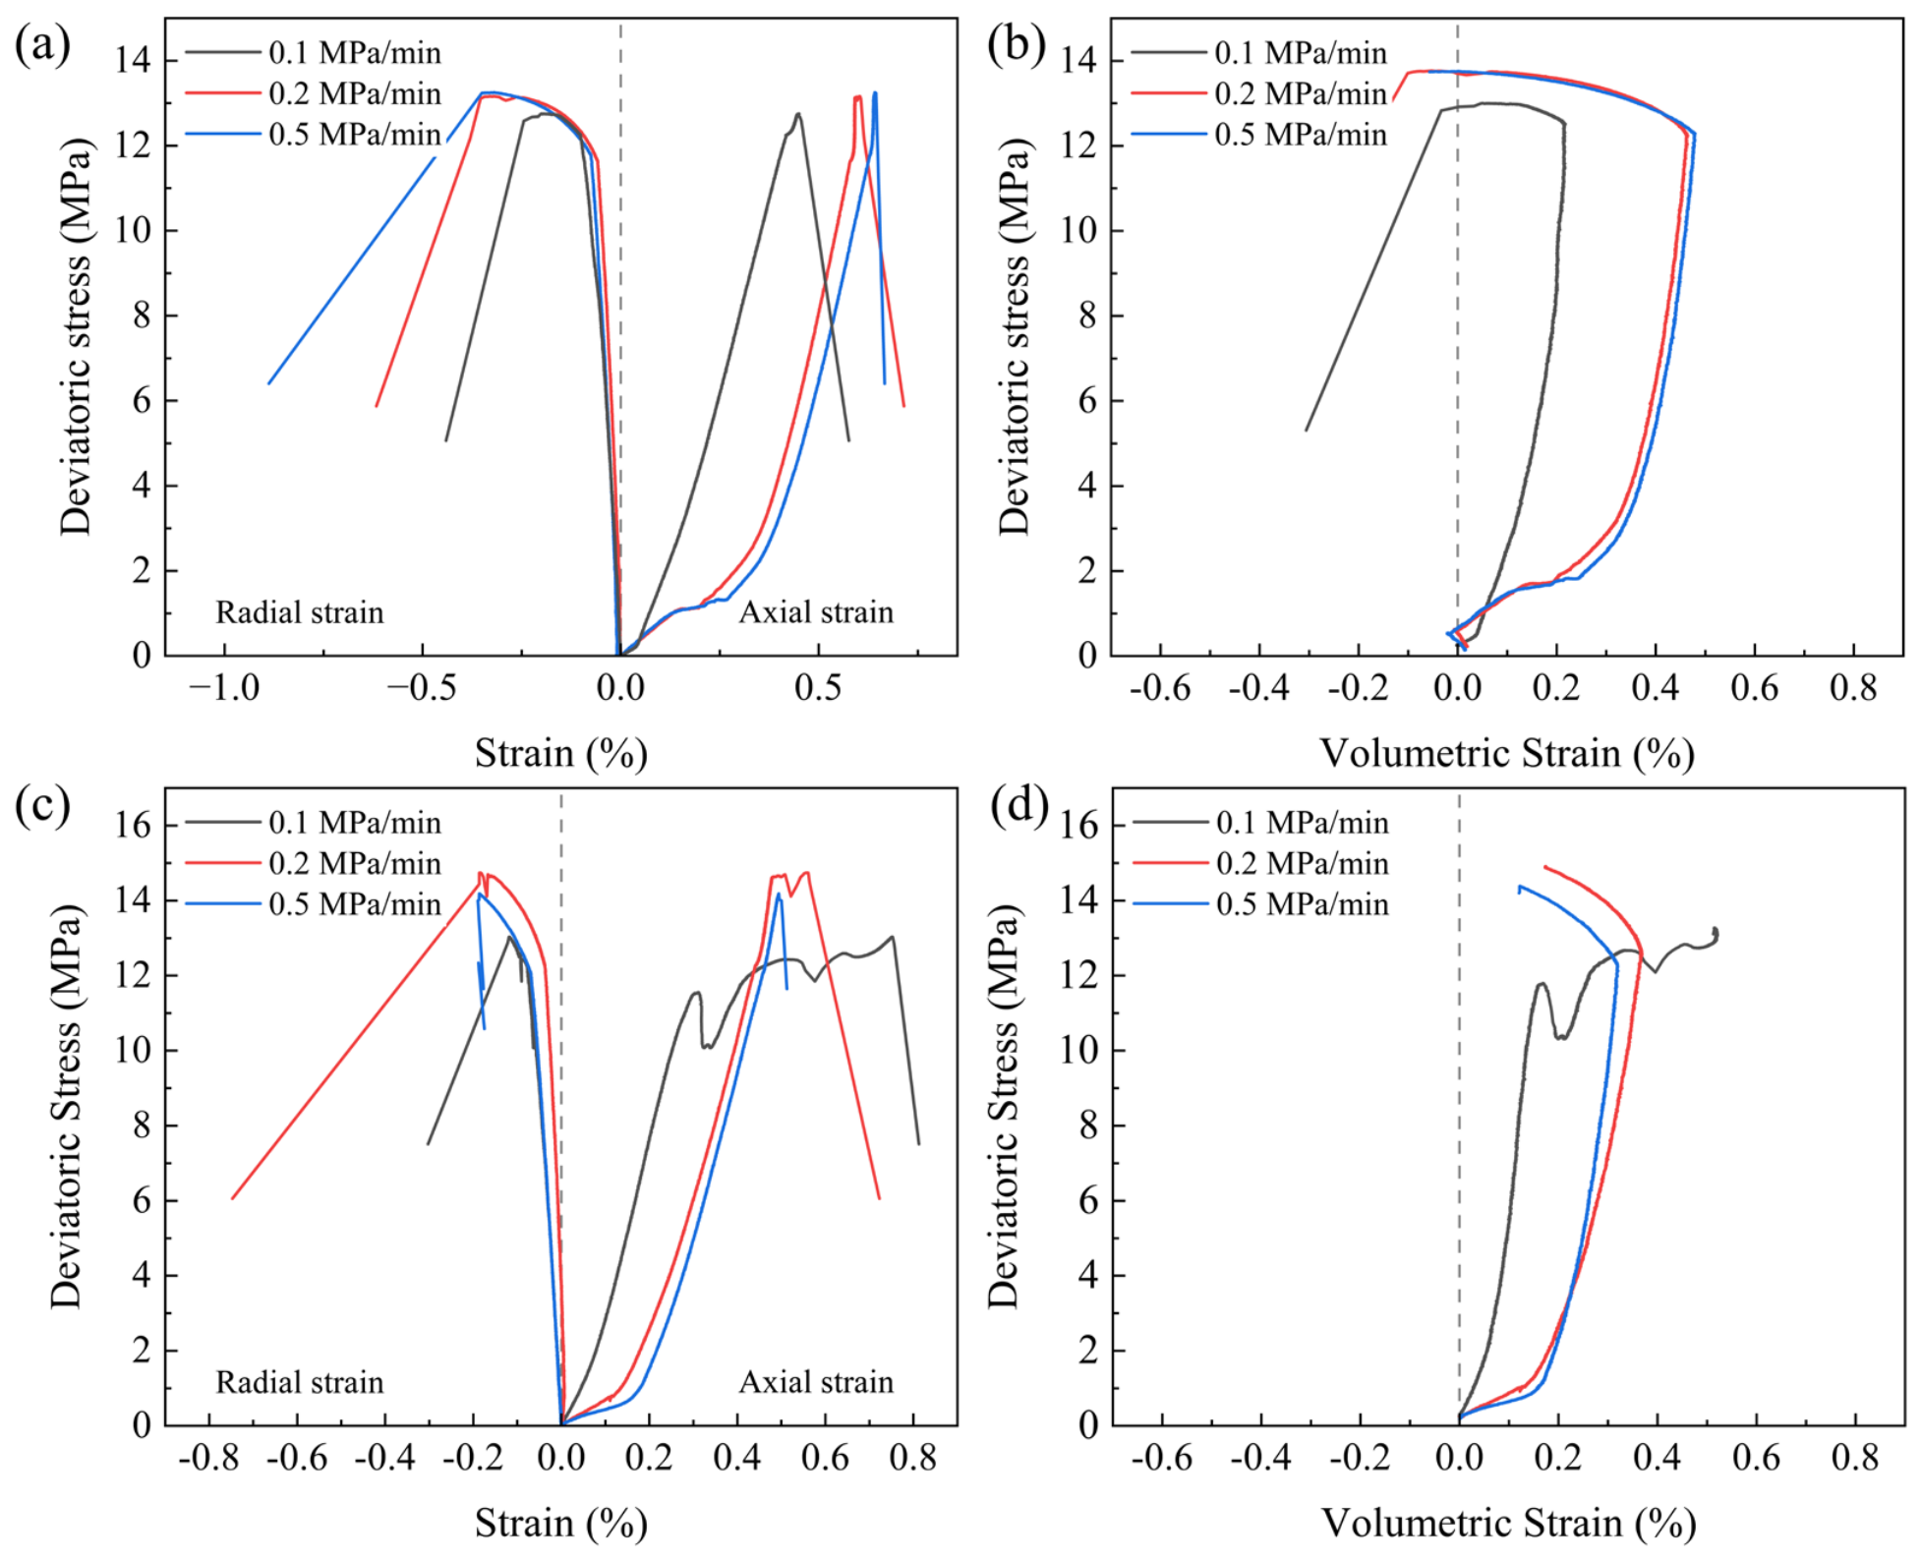
Under both unloading paths, the specimens exhibit a volumetric response that changes from compaction to dilatancy after entering the unloading stage, indicating that confining-pressure release markedly weakens the lateral constraint on the coral skeleton. In general, lateral deformation continues to increase during unloading, whereas axial deformation changes relatively slightly. This suggests that confining-pressure release directly promotes transverse expansion. Accordingly, during unloading, the specimens tend to release internal unstable deformation mainly through lateral expansion rather than continued axial compaction (
Table 5).
The 0.1 MPa/min group was excluded from the quantitative comparison because an early drop in deviatoric stress occurred at the onset of unloading, suggesting that the specimen had already entered a damaged or near-failure state before the unloading path was fully established. A comparison of the original curves shows that the overall stress–strain responses at unloading rates of 0.2 and 0.5 MPa/min are relatively similar, whereas the response at 0.1 MPa/min shows a certain deviation. Considering the limited number of specimens under each condition and the possibility that the deviation at 0.1 MPa/min may be affected by both rate effects and specimen-to-specimen variability, the quantitative comparison between unloading paths in this study mainly uses the results obtained at 0.2 and 0.5 MPa/min. The 0.1 MPa/min group is used only for phenomenological illustration. In other words, the following evaluation of path effects is based primarily on the two unloading-rate groups with relatively better comparability.
As shown in
Figure 7, a comparison of the original curves shows that the 0.1 MPa/min group deviates noticeably at the onset of unloading and is therefore used only for qualitative observation. For the two comparable unloading rates of 0.2 and 0.5 MPa/min, the mean absolute volumetric response index |Kv| avg is 510.05 for the CAP-UCP path and 1029.9 for the IAP-UCP path, indicating that the increasing axial pressure with unloading confining pressure path produces a much stronger dilatant response under the present test conditions.
These results suggest that, under the present test conditions, the difference in dilatancy response associated with a change in stress path appears to be more pronounced than that associated with increasing the unloading rate from 0.2 to 0.5 MPa/min within the same path. For the constant axial pressure with unloading confining pressure path, the change in unloading rate results in only about a 0.88% variation in the absolute slope. For the increasing axial pressure with unloading confining pressure path, this variation is also limited to 5.32%. By contrast, switching the stress path increases the overall volumetric strain evolution rate by approximately onefold. Therefore, compared with simple confining-pressure release, simultaneous confining-pressure reduction and deviatoric stress increase not only remove lateral constraint but also impose faster deviatoric stress accumulation, making the material more prone to rapid dilatancy and critical instability.
3.5. Lateral Deformation Acceleration and Criterion for Critical Instability
The relationship between confining pressure and lateral strain is shown in
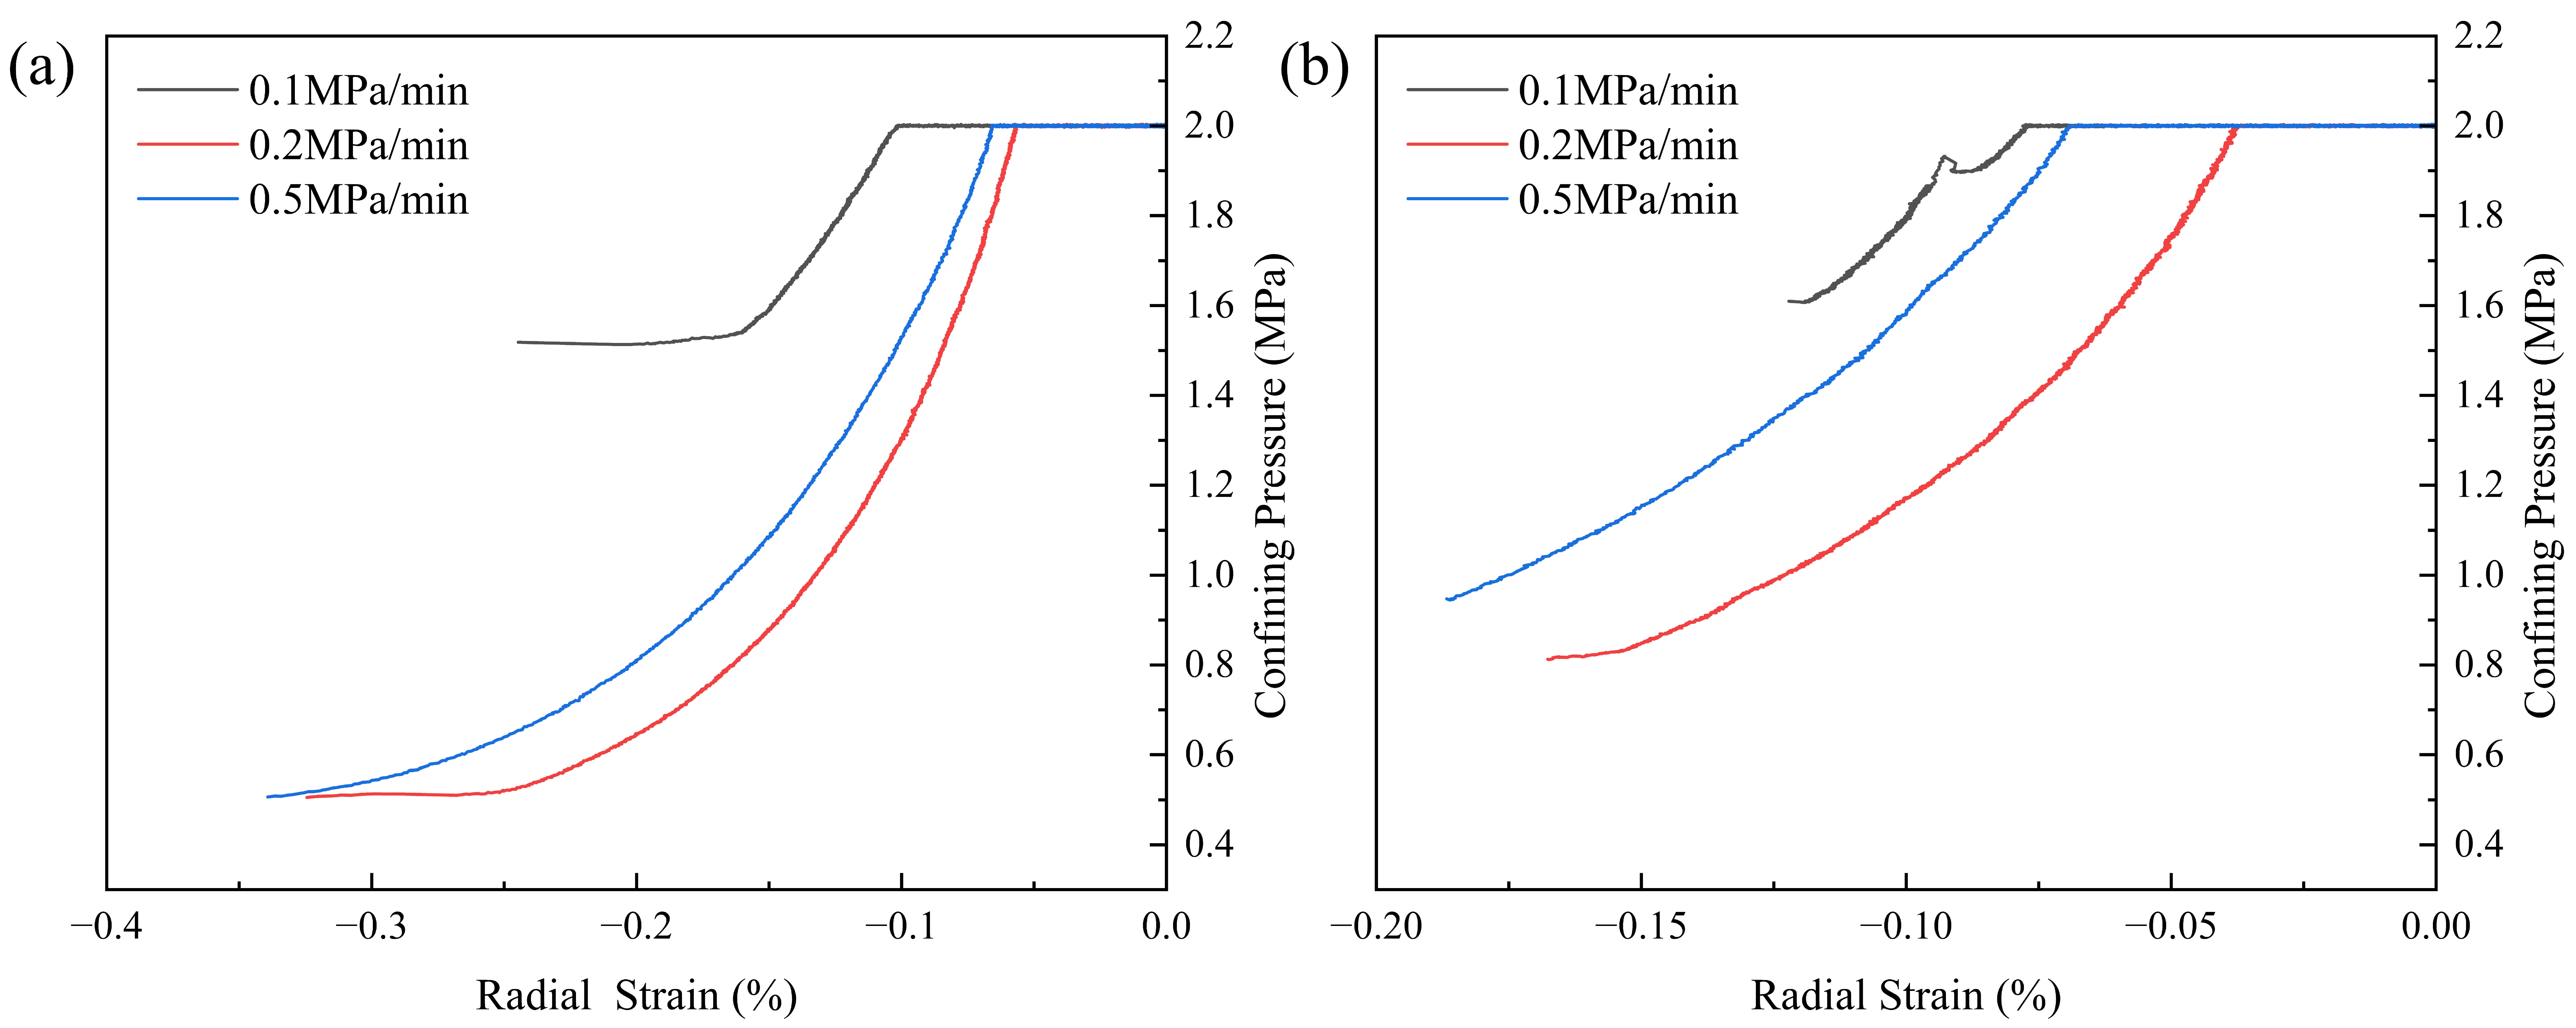
Figure 8. Under both unloading paths, the specimens exhibit a general trend of continuously increasing lateral strain as the confining pressure decreases after entering the unloading stage. However, the curve shapes show clear divergence as failure is approached. Under the constant axial pressure with unloading confining pressure path (
Figure 8a), lateral strain increases relatively slowly in the early stage, whereas the curve slope increases markedly shortly before failure, indicating a sudden acceleration of lateral expansion. Under the increasing axial pressure with unloading confining pressure path (
Figure 8b), although the overall lateral strain level is not high, a small change in confining pressure near instability corresponds to a pronounced increase in lateral deformation. This indicates that the specimens become more sensitive to confining-pressure release when deviatoric stress increases simultaneously. At the same time,
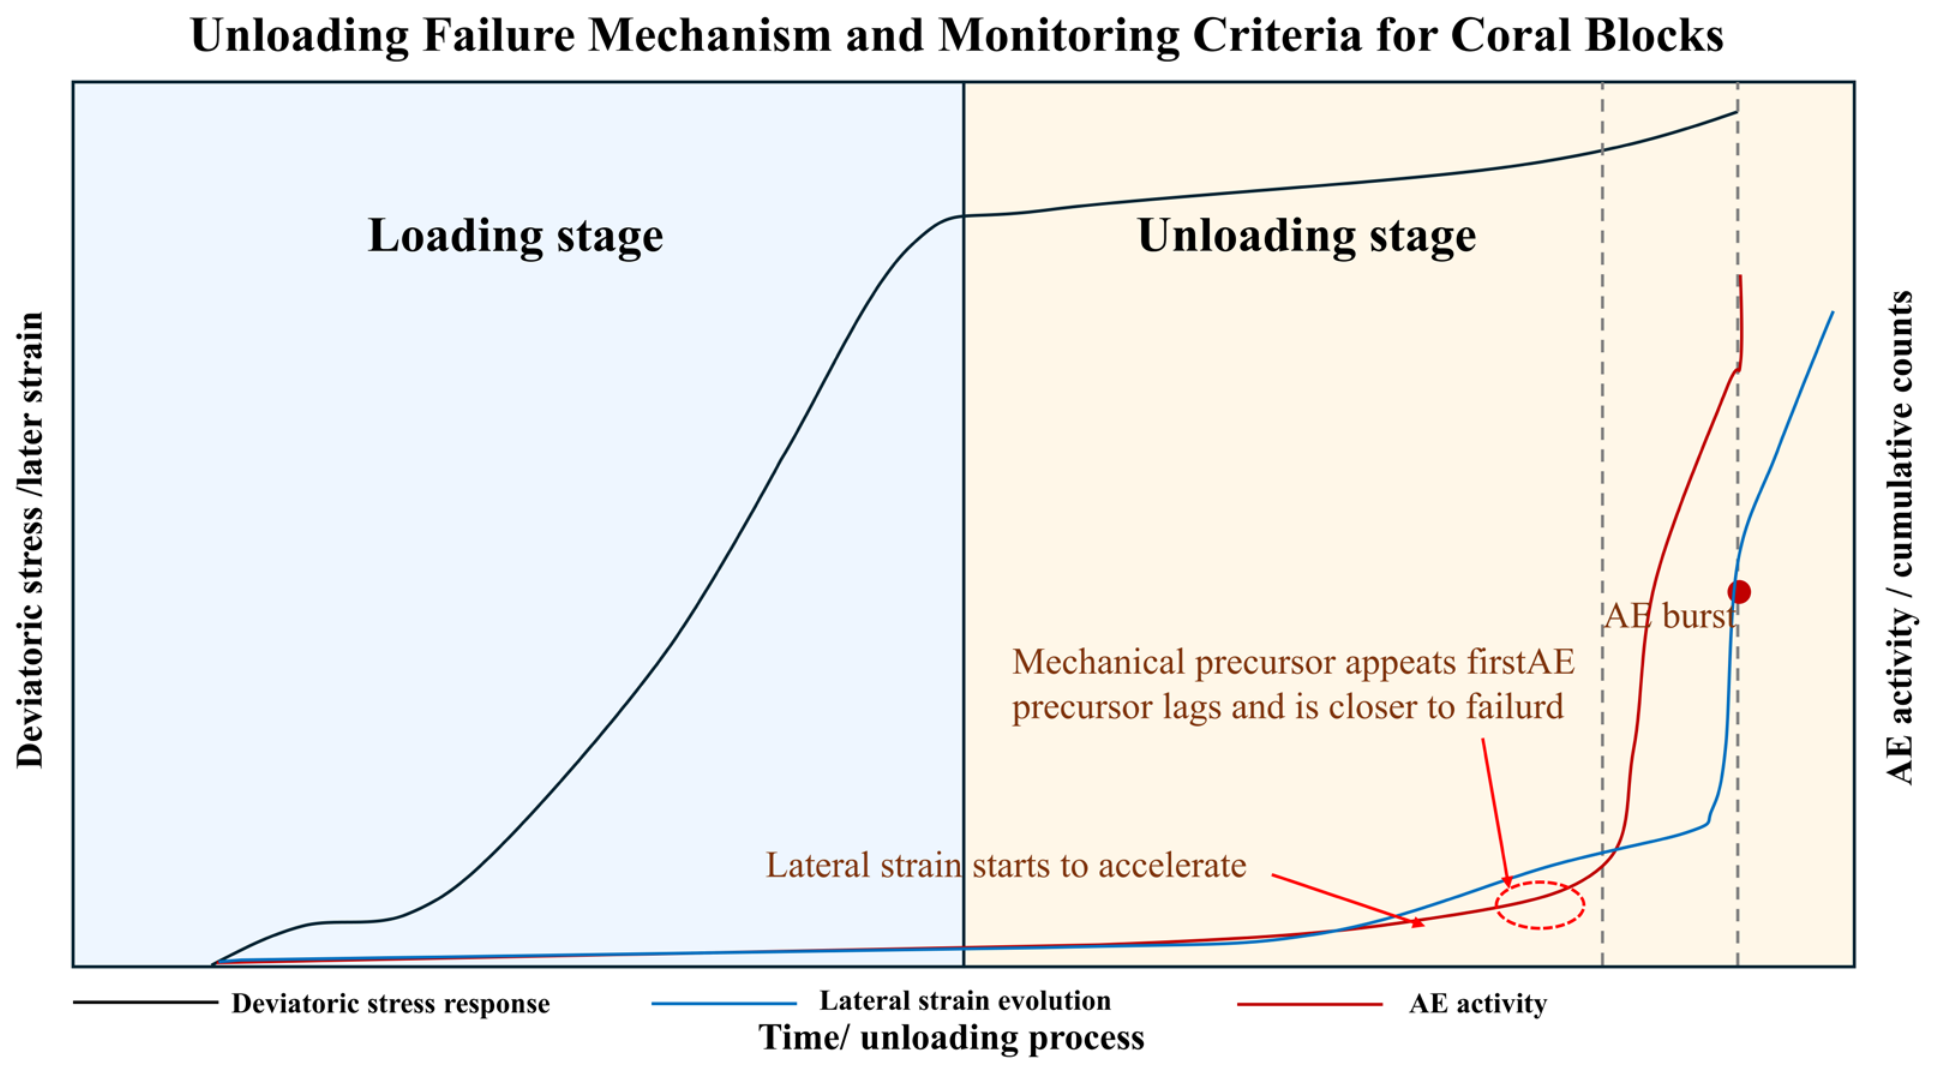
Figure 9 illustrates the direct relationship between the stress–strain response and AE activity.
4. Acoustic Emission Response Characteristics
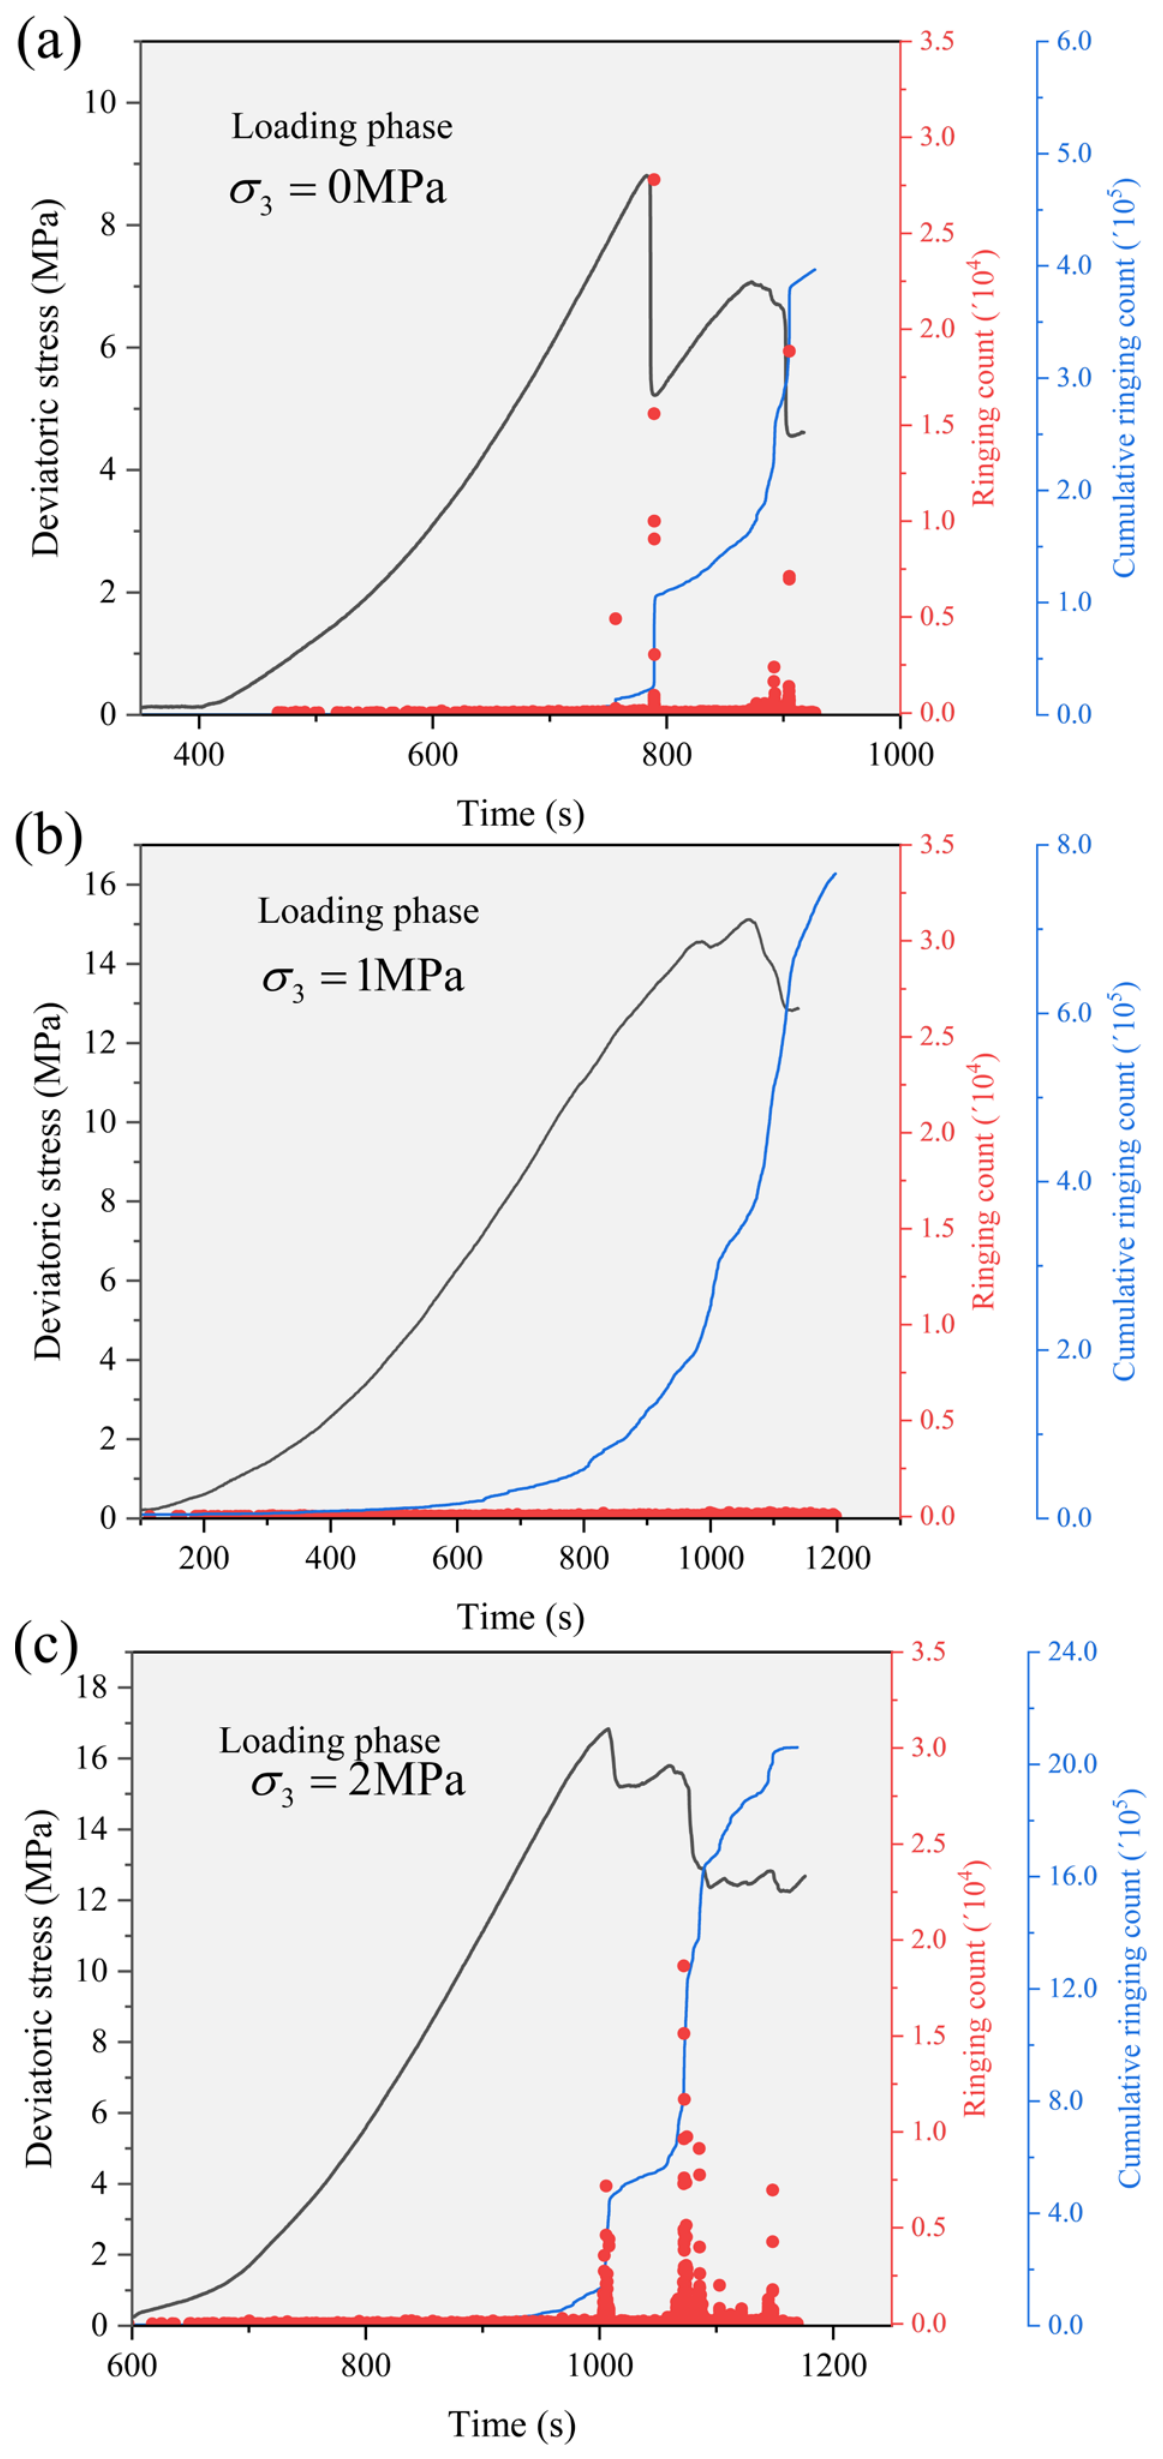
The AE response during conventional triaxial compression is shown in
Figure 10. The correspondence among ring-down counts, cumulative ring-down counts, and deviatoric stress over time indicates that AE activity generally evolves from a slow increase during the early loading stage to a pronounced enhancement around the peak stress. At the initial loading stage, the cumulative ring-down counts increase slowly, and the discrete AE events are relatively sparse, suggesting that pore compaction and local structural adjustment dominate within the specimens, while microcrack activity remains limited. As the deviatoric stress gradually approaches the peak value, local stress drops and fluctuations appear in the stress curve, accompanied by a marked increase in AE events. The cumulative ring-down counts then enter an accelerated growth stage, reflecting rapid crack propagation and progressive crack coalescence. This evolution is broadly consistent with the typical temporal progression of AE activity reported for rock compression failure [
31,
32,
33,
34]. However, because the present AE analysis is based mainly on ring-down counts, it should be interpreted as a phenomenological description of AE activity evolution rather than as a definitive identification of specific cracking stages [
32,
33,
34,
35].
Comparison of the different confining-pressure conditions in
Figure 10 shows that, although the AE response patterns vary among specimens, they generally share a common feature of “early-stage quietness, pre-peak enhancement, and concentrated activity near the peak”. In some cases, distinct local stress drops and clustered AE events occur around the peak stress, indicating a relatively progressive failure process. In other cases, although individual burst-type events are less pronounced, the cumulative ring-down counts continue to increase at an accelerated rate, suggesting that microdamage accumulates over a relatively long loading stage and eventually leads to overall failure. Overall, the AE characteristics shown in
Figure 10 indicate that, under conventional triaxial compression, coral blocks undergo progressive damage evolution rather than purely instantaneous instability. Accordingly, the AE results in this study are interpreted mainly in terms of temporal evolution and relative response characteristics within each test rather than as a strictly quantitative comparison of absolute AE activity among different specimens.
4.1. AE Response During Triaxial Unloading
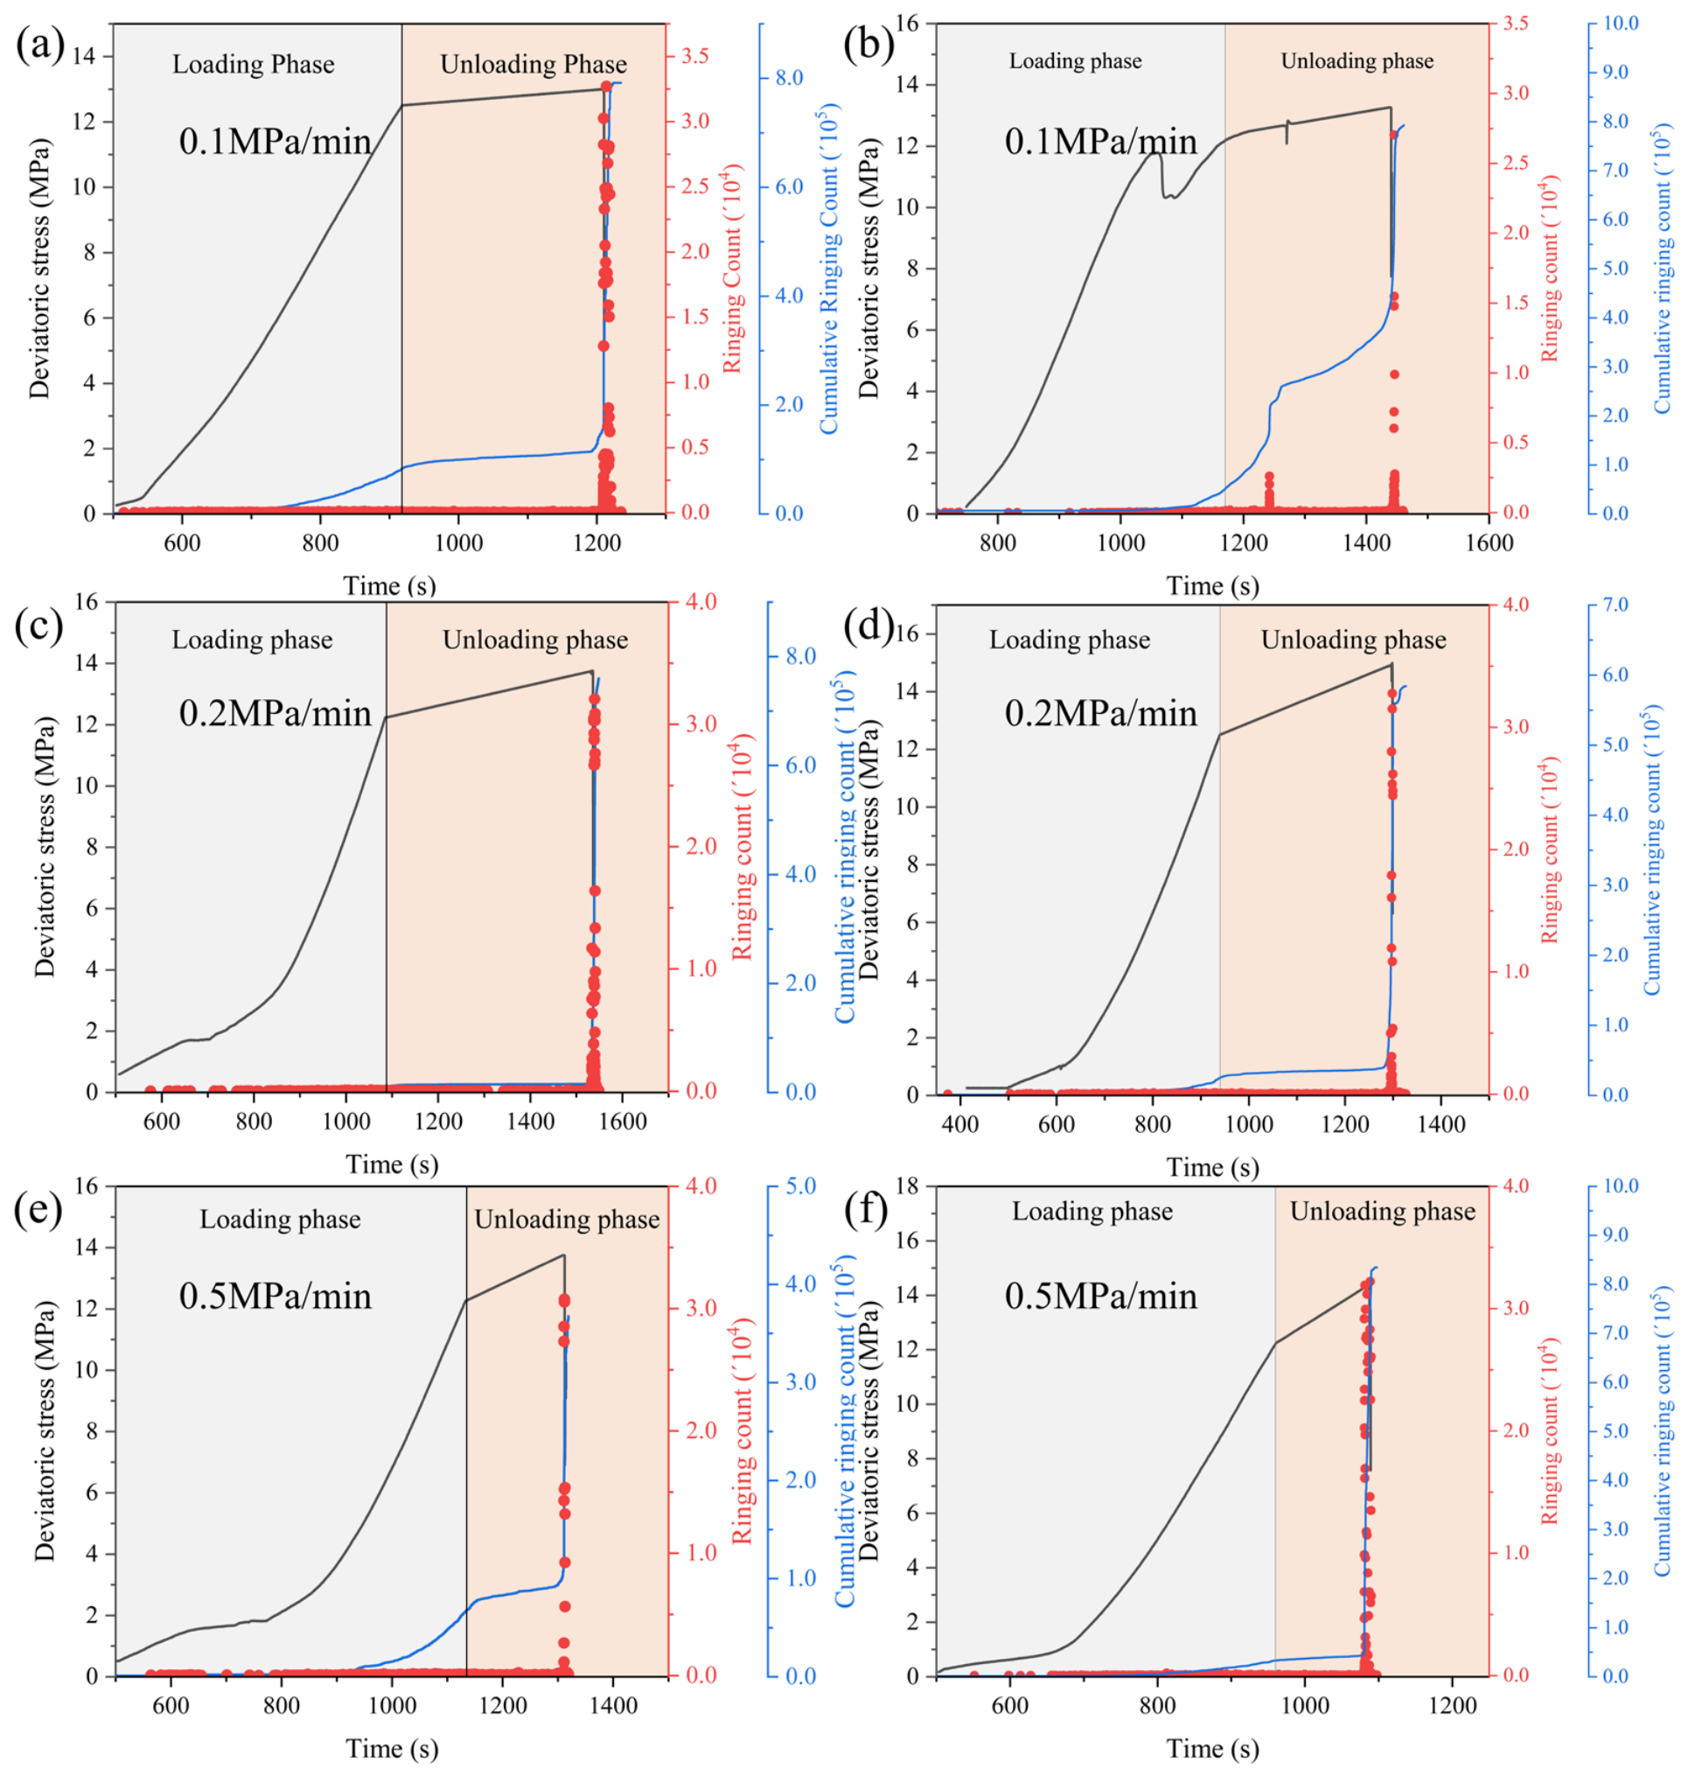
The AE response during unloading is shown in
Figure 11, where
Figure 11a,c, and e correspond to the constant axial pressure with unloading confining-pressure path, and
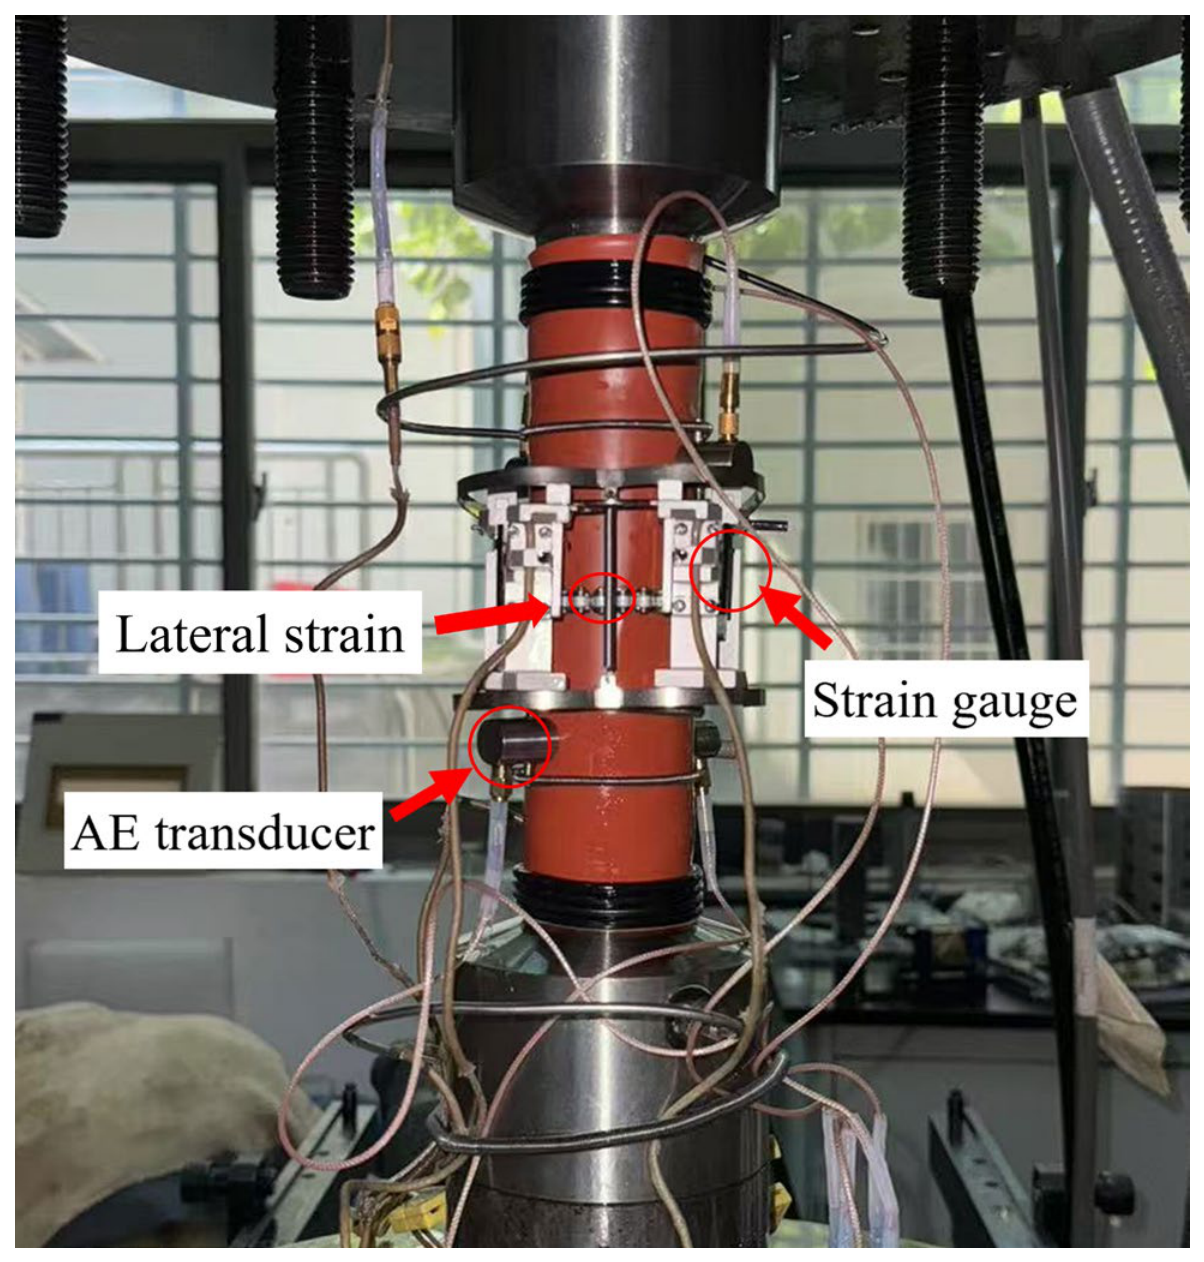
Figure 11b,d,f correspond to the increasing axial pressure with unloading confining-pressure path. Ring-down counts were used as the primary AE index because they provide a robust cumulative measure of threshold-crossing activity and are suitable for tracking the temporal evolution of microdamage under identical acquisition conditions. Unlike the progressive AE evolution observed during conventional triaxial compression in
Figure 10, most specimens in
Figure 11 show relatively few AE events during the loading stage and the early unloading stage, with only a slow increase in cumulative ring-down counts. As the unloading process approaches failure, however, AE events suddenly become concentrated within a short period, and the cumulative ring-down counts increase sharply, indicating a clear critical instability response. This phenomenon suggests that damage release under unloading paths is more staged and abrupt, which is consistent with a more abrupt AE release pattern during unloading-induced instability. However, because only ring-down counts and cumulative ring-down counts are analyzed here, the present results are not sufficient to identify failure mode or detailed damage mechanism directly [
36,
37].
As shown in
Figure 11, the main AE-active stage under both unloading paths occurs mainly in the late unloading stage and near macroscopic failure. This indicates that damage evolution under unloading tends to follow a process of “relative quietness in the early stage followed by rapid concentrated release in the late stage” rather than continuous accumulation and gradual enhancement over a long loading stage as observed under conventional triaxial compression. In particular, under the increasing axial pressure with unloading confining-pressure path, AE events are more concentrated before and after failure, suggesting that the coupling of confining-pressure release and deviatoric stress increase makes the specimens more prone to abrupt instability. It should be noted that the unloading tests were initiated after the specimens had been preloaded to approximately 80% of the peak strength obtained from conventional triaxial compression. Therefore,
Figure 11 does not represent the complete AE evolution from an initially intact and low-damage state, but rather reflects the response after the specimens had approached a critical damage state. Based on the present results, AE is more sensitive to detecting ongoing unloading instability, whereas its indication of long-term stable precursors is relatively limited.
4.2. Coupled Criterion Based on Lateral Deformation and AE
In this study, instability is identified qualitatively as the stage immediately preceding macroscopic failure, characterized by rapid lateral deformation acceleration and concentrated AE bursts. A comparison of
Figure 8 and
Figure 11 suggests a qualitative temporal sequence in which lateral deformation anomalies generally appear before concentrated AE bursts under the present test conditions. However, because the available AE records do not support a quantitative time-lag or stress-lag analysis, this ordering should be interpreted as a qualitative observation rather than a strict early-warning criterion.
Figure 8 reflects the accumulation of deformation anomalies before critical instability, whereas
Figure 11 mainly records the rapid increase in damage activity near failure. This temporal difference indicates that lateral deformation anomalies are more closely related to the approach of a critical state, while short-term AE bursts are more representative of the occurrence of macroscopic failure. Therefore, the monitoring logic summarized in
Figure 9 suggests that accelerated lateral deformation can be used as an early-warning signal, whereas concentrated AE bursts can be used as a failure-confirmation signal.
Because coral blocks contain abundant connected pores and weakly cemented skeletal structures, confining pressure unloading first weakens the lateral constraint and induces transverse expansion. AE is released intensively within a short period only after local skeletal collapse and crack coalescence develop to a certain extent. Therefore, accelerated lateral deformation is recommended as an early criterion for approaching instability, while concentrated AE bursts should be regarded as an indicator of failure occurrence or imminent failure. It is therefore not advisable to rely solely on AE ring-down counts for early warning.
5. Discussion
5.1. Confining-Pressure Sensitivity
Coral blocks exhibit a marked increase in strength within the low confining-pressure range, which reflects the high sensitivity of their skeletal structure to lateral confinement. Within a confining-pressure increase of only 0–2 MPa, the peak strength increases by 91.3%, whereas the axial strain at peak strength shows a nonmonotonic variation, increasing from 0.33% at 0 MPa to 0.63% at 1 MPa and then decreasing to 0.40% at 2 MPa. This indicates that, for highly porous coral skeletons, low confining pressure strongly affects strength, but its influence on deformation capacity is more complex than a simple monotonic increase. This observation is consistent with previous studies on coral reef limestone and porous carbonate rocks, which have shown that low-confinement mechanical behavior is highly structure-sensitive and strongly affected by pore collapse, skeletal rearrangement, and cementation type [
11]. In particular, Wang et al. [
38] reported that cementation type can significantly modify the strength characteristics of reef limestone, while Vajdova et al. [
12] showed that porous carbonate rocks may exhibit coupled compaction–dilatancy–failure transitions under low to moderate confinement. The present results further suggest that, for highly porous coral blocks, even a small change in confining pressure can lead to a disproportionately large change in strength and deformation response.
Unlike dense rocks, whose strength is mainly governed by crack propagation, highly porous coral blocks contain abundant connected pores and weakly cemented skeletal frameworks. Local collapse, skeletal rearrangement, and crack propagation may therefore occur simultaneously [
38,
39,
40,
41]. Under low confining pressure, even a slight increase in external confinement can significantly suppress pore collapse and rapid crack coalescence, resulting in high confining-pressure sensitivity. In other words, confining pressure not only increases the peak strength but also alters the rate and manner in which local instability evolves into macroscopic failure [
42,
43,
44].
The nonmonotonic variation in E further suggests that the deformation response of coral blocks under low confining pressure cannot be described by a simple monotonic stiffening trend. However, this observation should be interpreted with caution. Because E was extracted from the approximately linear segment of the pre-peak curve and only one specimen was tested at each confining pressure, the decrease from 0 to 1 MPa and the subsequent increase from 1 to 2 MPa may reflect a combined effect of porous structural adjustment, specimen heterogeneity, and parameter-extraction sensitivity rather than a uniquely identifiable material mechanism.
5.2. Relative Roles of Path Effect and Rate Effect
The unloading test results suggest that the stress path has an important influence on dilatant instability. At the unloading rates of 0.2 and 0.5 MPa/min, the absolute slope of volumetric strain evolution under the increasing axial pressure with unloading confining pressure path is nearly twice that under the constant axial pressure path. Under the present test conditions, this observation suggests that the path-related difference may be more pronounced than the rate-related difference within the tested range. However, because only one specimen was tested for each unloading condition and coral blocks are intrinsically heterogeneous, this result should be interpreted cautiously as a preliminary trend rather than as definitive evidence that the path effect dominates the rate effect [
24,
25,
26,
27].
It should therefore not be interpreted as statistically conclusive evidence of a strict hierarchy between path effect and rate effect. Because the number of specimens under different unloading-rate conditions is limited and the response of the 0.1 MPa/min group shows a certain deviation, the current evidence more appropriately supports the conclusion that, under the present test conditions, the path effect appears more pronounced than the unloading-rate effect alone.
5.3. Early-Warning Significance of Deformation Response and AE Response
From a monitoring perspective,
Figure 8,
Figure 10 and
Figure 11 collectively suggest that lateral deformation anomalies and concentrated AE bursts correspond to different stages of unloading-induced instability. The acceleration of lateral deformation generally occurs before macroscopic failure, whereas concentrated AE bursts are mainly observed near the final instability stage. This temporal sequence suggests that lateral deformation may provide earlier warning information than ring-down-count-based AE activity under the present test conditions. However, because the AE analysis is based only on ring-down counts and cumulative ring-down counts, the present results are not sufficient for rigorous failure-mode identification or detailed damage-mechanism interpretation [
31,
32,
33,
34].
Therefore, for highly porous coral blocks, the lateral deformation response is more suitable as an early indicator of approaching instability, whereas AE is more suitable as a confirmation signal for critical failure. This also suggests that engineering monitoring should not simply replace deformation monitoring with a single AE-based index. For biogenic rocks with highly developed pore skeletons and abrupt damage evolution, lateral deformation, volumetric dilatancy, and AE activity should be used jointly as complementary criteria for instability identification.
5.4. Engineering Implications and Limitations of This Study
The present results suggest that low confining pressure can markedly affect the load bearing and deformation behavior of coral blocks. From an engineering perspective, this implies that excavation-induced lateral stress release in coral reef strata may significantly amplify the instability tendency of tunnel sidewalls, cavern roofs, and excavation corners, especially when confining-pressure reduction is accompanied by continued deviatoric-stress increase. Such a coupled stress path condition may promote more rapid dilatancy and abrupt instability. In addition, for island-reef foundation engineering, local stress release or stress redistribution near foundation edges, excavation interfaces, or cavity-like defects may increase the instability risk of shallow, highly porous reef strata. From a monitoring perspective, the present results suggest that deformation-based observations may provide useful information for identifying unloading-sensitive zones in these scenarios.
Several limitations should also be noted. Variations in porosity and saturated P-wave velocity may influence AE attenuation and parameter comparability; because the AE threshold and gain were not individually calibrated, the AE analysis should be regarded as qualitative or semi-quantitative. First, the range of confining pressures tested was limited to 0–2 MPa; therefore, the Mohr–Coulomb fit and the derived equivalent cohesion and friction angle mainly represent the local low confining-pressure response of the tested specimens. They should not be regarded as a reliable general strength envelope or extrapolated directly to higher confining pressures. Second, only one specimen was tested for each unloading condition, and so the path/rate comparison remains preliminary and requires further validation through repeated tests with a larger sample set. Third, the AE analysis in this study is based mainly on ring-down counts and cumulative ring-down counts, without incorporating AE energy, frequency characteristics, RA-AF parameters, or event localization. Therefore, the present AE results are more suitable for describing temporal activity evolution and comparative response patterns than for rigorous failure-mode identification or detailed damage-mechanism interpretation.
6. Conclusions
In this study, conventional triaxial compression tests, two types of triaxial unloading tests, and synchronous acoustic emission (AE) monitoring were conducted on highly porous coral blocks from the South China Sea. The effects of confining pressure, unloading path, and monitoring response on strength, deformation, dilatancy, and instability behavior were analyzed. The variability of the measured physical properties was relatively limited, with coefficients of variation of 5.07%, 3.56%, 3.72%, and 5.77% for dry density, saturated density, porosity, and P-wave velocity, respectively, which provides a preliminary reference for comparing responses under different test conditions, although the influence of specimen heterogeneity cannot be fully excluded. Because only one specimen was tested for each unloading condition, the following conclusions should be regarded as preliminary trends under the present test conditions:
Coral blocks exhibit pronounced sensitivity to low confining pressure. As confining pressure increased from 0 to 2 MPa, peak strength increased from 8.81 to 16.85 MPa, whereas axial strain at peak strength changed from 0.33% at 0 MPa to 0.63% at 1 MPa and then decreased to 0.40% at 2 MPa, indicating a nonmonotonic deformation response. The Mohr–Coulomb parameters obtained from the three low-confining-pressure data points should be regarded only as equivalent approximations for this pressure range.
During triaxial unloading, all specimens showed a volumetric transition from compaction to dilatancy. At unloading rates of 0.2 and 0.5 MPa/min, the average absolute slope of volumetric strain evolution under the IAP-UCP path was 1029.9, approximately 2.02 times that under the CAP-UCP path. This suggests that coupled confining-pressure release and deviatoric-stress increase may induce stronger dilatant instability under the present test conditions.
The AE response differed between conventional compression and unloading. AE activity during conventional triaxial compression increased progressively around peak stress, whereas AE events during unloading were mainly concentrated near macroscopic failure, suggesting a relatively more abrupt instability process under unloading paths.
Lateral deformation anomalies generally appeared earlier than concentrated AE bursts. Therefore, accelerated lateral deformation appears to be more suitable for identifying the approach of critical instability, whereas short-term AE bursts are better interpreted as confirmation signals of imminent or ongoing macroscopic failure under the present test conditions.