


Abstract
Ship diesel engines are a significant source of aerosol particles and gaseous pollutants for the marine atmospheric boundary layer (MABL). To assess the environmental impact of maritime transport on the MABL, it is important to understand how aerosol particles are transported, dispersed and transformed in ship exhaust plumes. The dynamics of aerosol particle size distributions, ranging from 5 nm to 4 µm at a height of 1.5 m above sea level, were measured on board a boat behind cruising ships in German waters in the Baltic Sea. Exhaust plumes were measured at ages of 2–60 s at distances of 20–600 m from cruising ships; the number concentration of 5–340 nm particles increased about a hundred times in comparison with background levels, while the mass of supermicron particles increased only by 1–6% compared to background levels. Changes in aerosol particle number size distributions were mainly driven by plume expansion. However, in plumes aged 6–16 s at distances of 50–150 m, a sudden drop in number concentration by 30% for 20 nm particles was observed. Their scavenging followed by fast sedimentation with sea spray microdroplets generated by ship movement is a possible explanation for this. A significant reduction in the residence time of nanoparticles may imply extensive environmental consequences.
1. Introduction
Aerosol particles are solid, liquid or mixed phases of various sizes suspended in a gaseous atmosphere. They are a natural component of the atmosphere and play a key role in the balance of radiation on Earth. Aerosol particles scatter and absorb electromagnetic radiation and also act as cloud condensation nuclei or ice nuclei, on which water vapor condenses. These processes enable the formation of cloud systems and precipitation in the troposphere [1,2,3]. One of the major natural sources of atmospheric aerosol particles is the ocean surface, which covers approximately two-thirds of the Earth’s surface [4,5]. At the same time, maritime transport operates in this environment and represents a significant anthropogenic source of aerosol particles emitted into the marine atmospheric boundary layer through the combustion of marine fuels in ship diesel engines [6].
Maritime transport is one of the main pillars of the global economy and carries approximately 80% of global trade [7]. Although shipping contributes a relatively smaller fraction of global CO2 emissions compared to road transport, it still represents an important source of atmospheric pollution [8]. In contrast to fuels used in road and air transport, maritime transport commonly uses heavy fuel oils containing higher concentrations of sulfur, metals, and other undesirable components [9].
The combustion of heavy fuel oil in ship diesel engines produces not only CO2 but also significant amounts of NOx, SO2, and aerosol particles [6]. Nitrogen and sulfur oxides can be further transformed into secondary aerosol particles, which influence cloud microphysics, cloud albedo, and the hydrological cycle [2]. Ship emissions also contribute to marine ecosystem pollution, eutrophication, and acidification [10,11]. In addition, exhaust gas cleaning systems such as scrubbers discharge acidic wastewater containing heavy metals and PAHs directly into the sea [12,13]. Maritime transport therefore contributes to air quality deterioration and adverse health effects [14,15,16,17]. The complex environmental impacts of maritime transport highlight the need for emission mitigation measures [18]. One of these measures is the establishment of emission control areas requiring the use of low-sulfur fuels and technologies reducing NOx emissions [19]. The Baltic Sea is one such area and is also one of the busiest shipping regions in the world [20,21,22].
Understanding the formation, composition, dispersion, and transformation of aerosol particles emitted from ship diesel engines in the marine atmospheric boundary layer is important for assessing their effects on climate, atmospheric chemistry, and air quality [23,24,25]. These processes can be studied indirectly from coastal stations, in laboratory simulations, or by in situ measurements during ship or aircraft campaigns [26,27,28]. In particular, studying the dynamics of aerosol particle size distributions in ship exhaust plumes is essential for understanding particle transport, transformation processes, and deposition into the marine environment.
During exhaust plume dispersion, several processes occur simultaneously, including plume expansion, dilution due to turbulent mixing with ambient air, and particle transformation processes such as nucleation, condensation, and coagulation. These processes together are collectively referred to as exhaust plume aging [24,29]. Plume dilution is commonly characterized by decreasing concentrations of tracer gases such as CO2 together with decreasing particle number concentrations [30]. Despite previous studies [24,30,31], knowledge gaps remain in our understanding of exhaust plume aging from cruising ships in the marine atmospheric boundary layer, particularly in the near-field region of the exhaust plume and in the evolution of aerosol particle size distributions with increasing distance from the ship. This dynamic process represents a key factor determining the environmental impact of emissions from maritime transport, and improved understanding can contribute to the development of measures to reduce their environmental impact [32].
This study investigates the in situ dispersion and short-term aging of ship-borne diesel exhaust aerosols over the Baltic Sea by measuring particle size distributions and number concentrations. We hypothesize that turbulent mixing with ambient air drives an exponential decay in total particle concentration as distance from the vessel increases. Additionally, while different size fractions are assumed to disperse at similar rates, ultrafine particles are expected to concurrently undergo transformation processes, such as coagulation, during plume aging.
2. Materials and Methods
2.1. Measurement Campaign
The measurement campaign was conducted close to a major shipping route in the German waters of the Baltic Sea during the research cruise EMB 315 on research vessel Elisabeth Mann Borgese from 31 March–12 April 2023, focused on the environmental impacts of maritime transport on the marine environment. A boat-based measurement was conducted for marine background levels alongside the ship tracking experiment. Marine background measurements were recorded outside of ship exhaust plumes to determine ambient aerosol particle concentrations and size distributions (see Figure A1). For further analysis, only the experiments in which exhaust plumes from cruising ships were captured and measurements clearly corresponded to exhaust flow conditions were used. Several measurements of the marine background were taken as part of the measurement campaign.
2.2. Measurement Setup
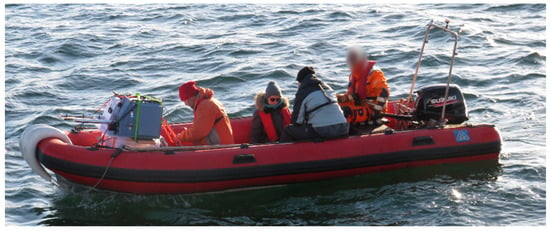
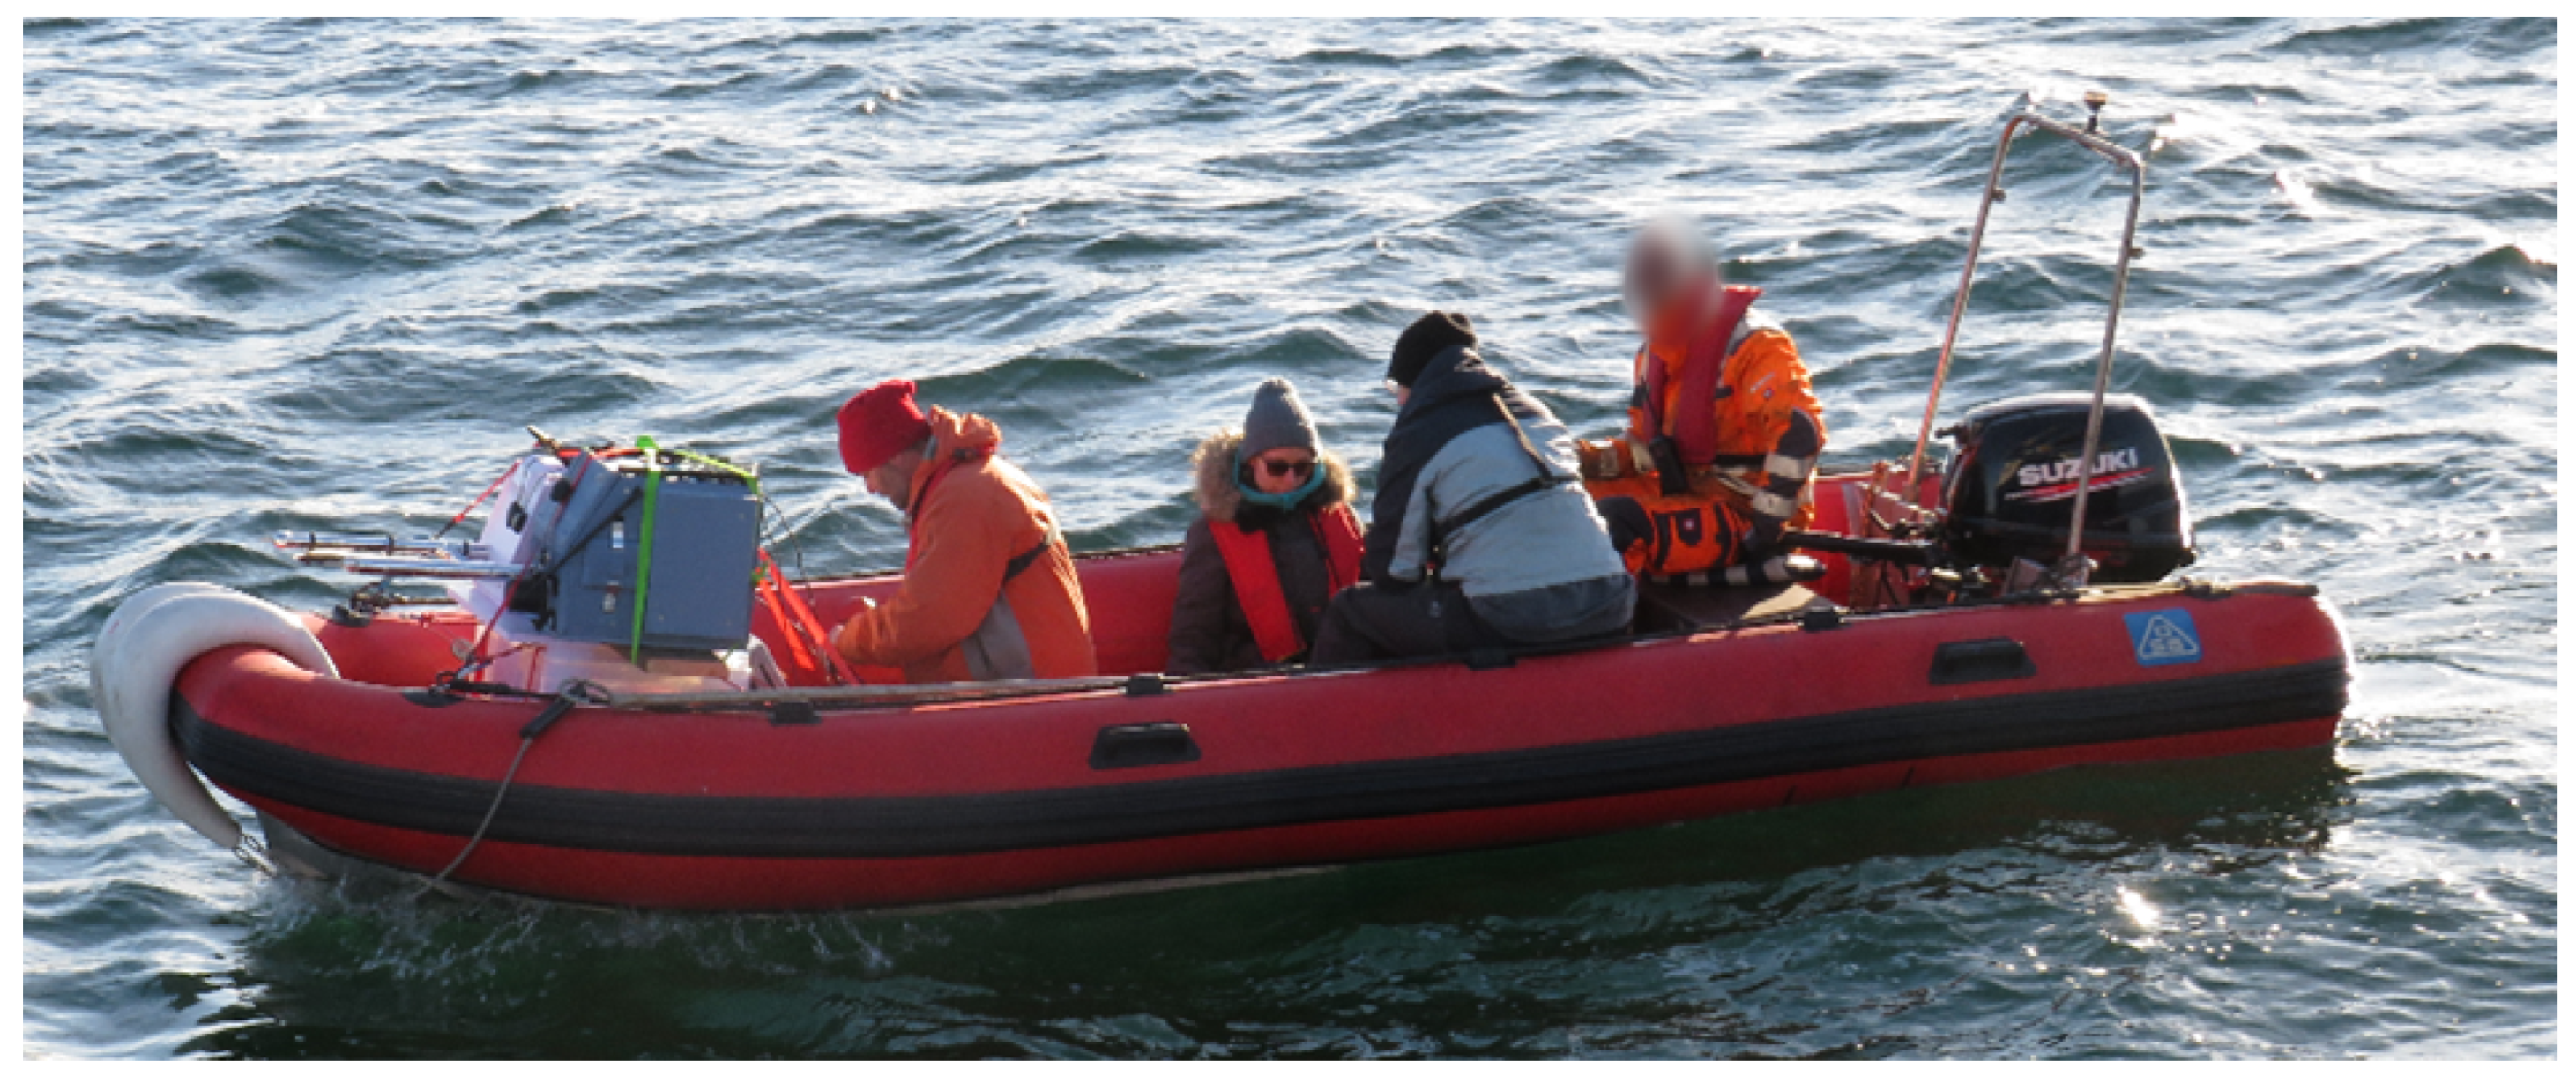
A gasoline-powered boat (Figure 1) was used as the measurement platform to transport the instruments. The instruments were installed in specially designed gondolas mounted on prow of the boat. The gondolas contained aerosol instruments and a computer system for data acquisition and remote communication (Table 1).
Figure 1.
The measurement boat with the gondolas with heated 25 cm long inlets and sheltering for the spectrometers.
Table 1.
Instrument setup.
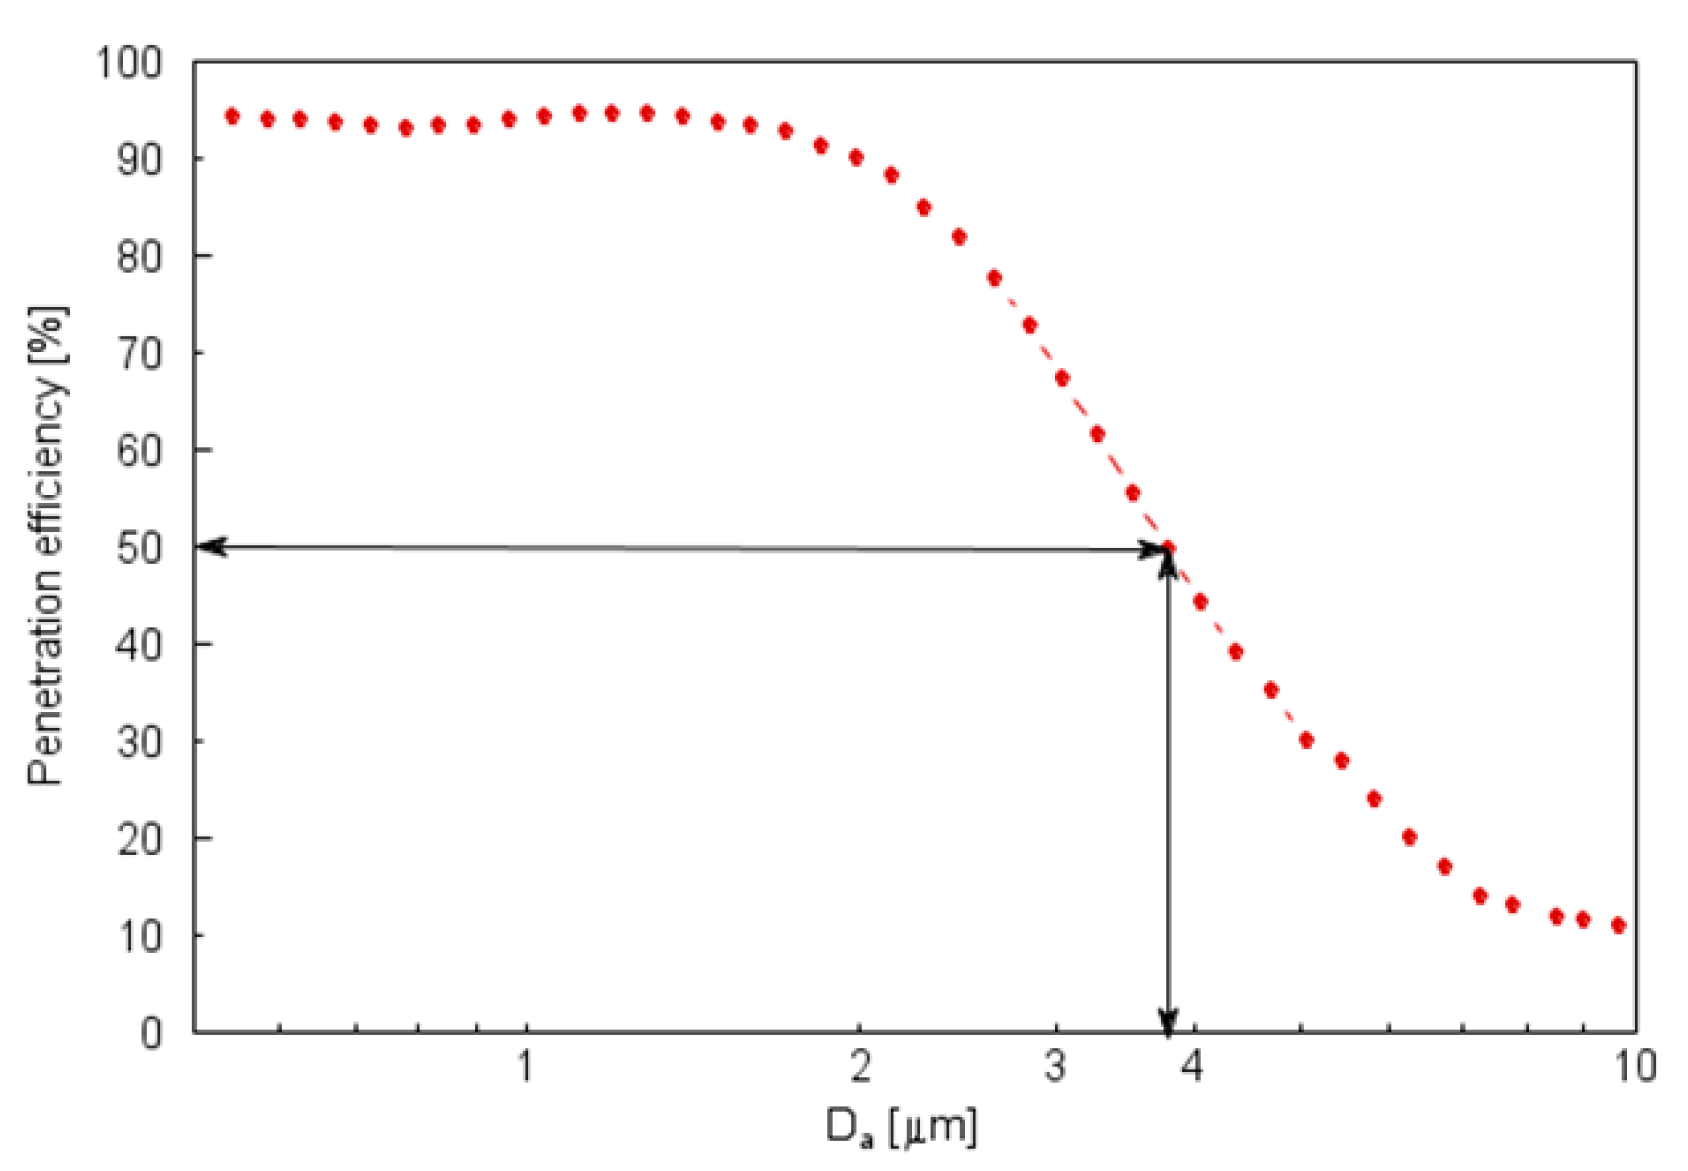
The gondolas were positioned on elastic pad to dampen vibration since the condensation particle counter is sensitive to vibration. The P-Trak was installed in a separate protective case. The instruments were powered by a portable power supply located in the boat. Air entered the aerosol instruments in the gondolas via a sampling inlet protruding horizontally from the front of the gondolas. The sampling inlet was designed to ensure isokinetic sampling and was positioned approximately 1.5 m above the water surface. The sampling inlet was heated to approximately 50 °C to prevent water vapor condensation and to reduce the influence of high relative humidity on the measurements. The cut-off diameter of the sampling inlet was approximately 4 µm (see Figure A2). For the P-Trak instrument, a manufacturer-provided inlet was used, mounted 0.5 m above the top edge of the rear wall of the gondola.
The measurement setup was designed to minimize influence from the boat engine and to ensure representative sampling of ambient air and ship exhaust plumes. The low standard deviation across repeated measurements of number size distributions measured for marine background levels proved the setup’s correctness.
2.3. Ship Tracking Experiment
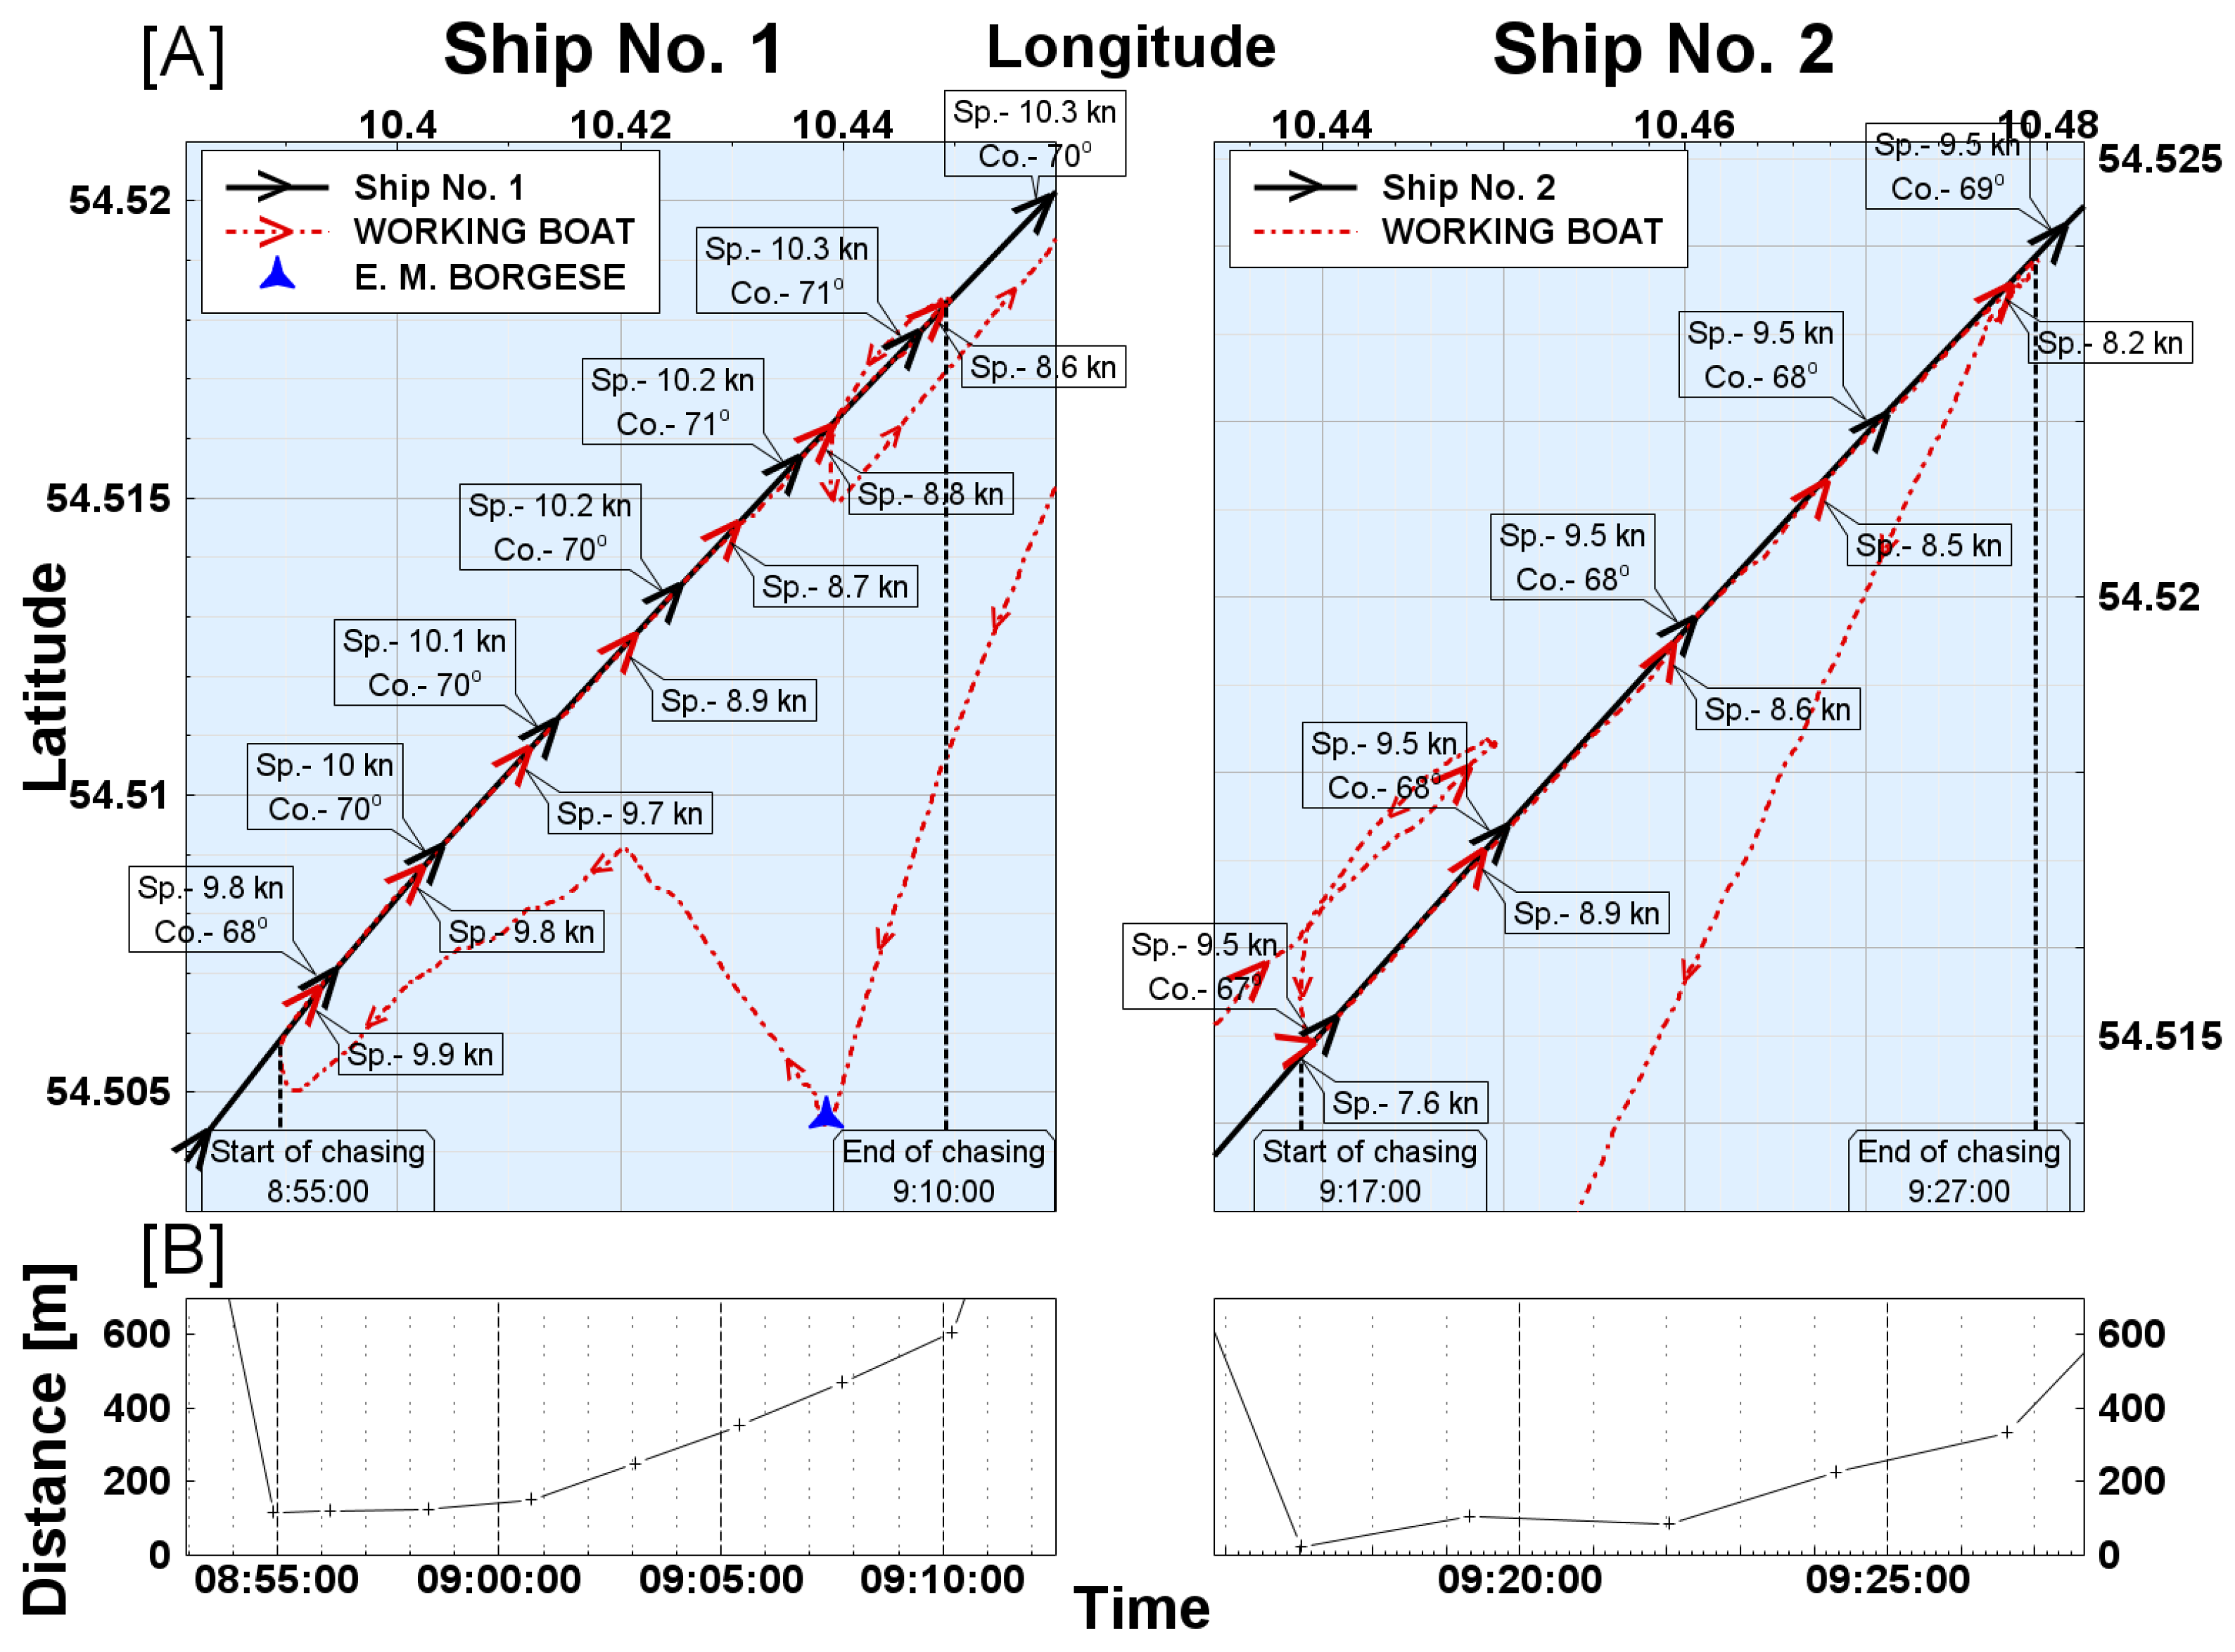
On 8 April 2023 the ship tracking experiment was performed (Table 2) by approaching two cruising ships (Table 3) and subsequently positioning the measurement boat in the downwind direction behind the ship (Figure 2). For exhaust plume encounters, identification used measurements of particle number concentrations together with the position of the measurement boat and wind direction.
Table 2.
Ship tracking experiment information.
Table 3.
Technical information of the tracked ships. EGCS = exhaust gas cleaning system, MDO = marine diesel oil, MGO = marine gas oil.
Figure 2.
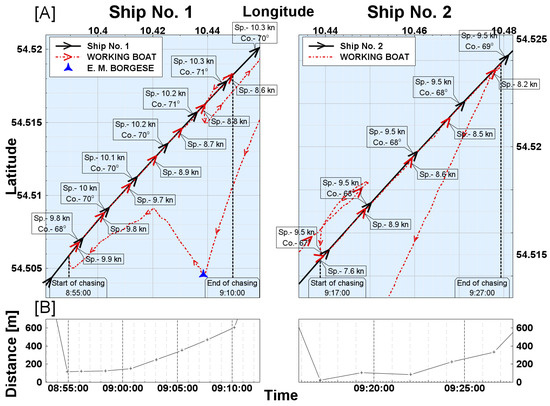
(A) Tracking maps on 8 April 2023—positions of Ships 1 and 2 and the working boat, together with speed (Sp.) and course (Co), recorded at two-minute intervals. (B) Temporal variations in the distance between the working boat and the tracked ships.
The positions of the tracked ships were obtained from the Automatic Identification System (AIS), which provides ship position data at regular intervals. These data were combined with GPS measurements from the gondola to calculate the distance between the measurement boat and the tracked ships throughout the ship tracking experiment. Ship positions between recorded AIS points were interpolated to achieve higher temporal resolution, allowing the calculation of the distance for each measurement time step.
2.4. Plume Age Calculation
Age of the plumes from the diesel engines of the tracked ships was estimated following an approach based on the distance between the measurement boat and the tracking ships and the velocity of the exhaust gas plume [32]. The ships were tracked against the wind; i.e., the velocity at which the exhaust plume receded is the sum of the wind speed and the measurement boat’s speed relative to the tracked ship’s speed.
3. Results
3.1. Marine Background
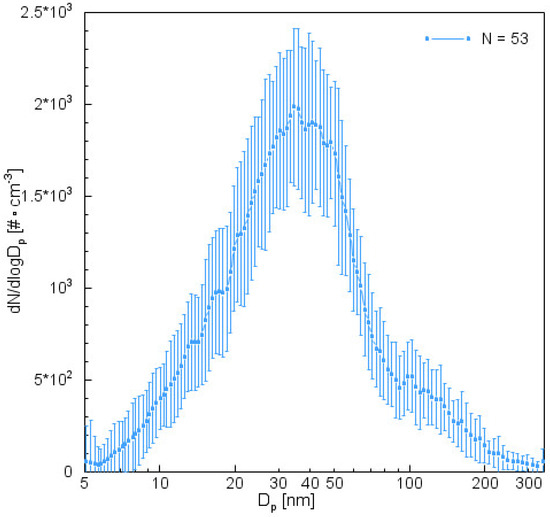
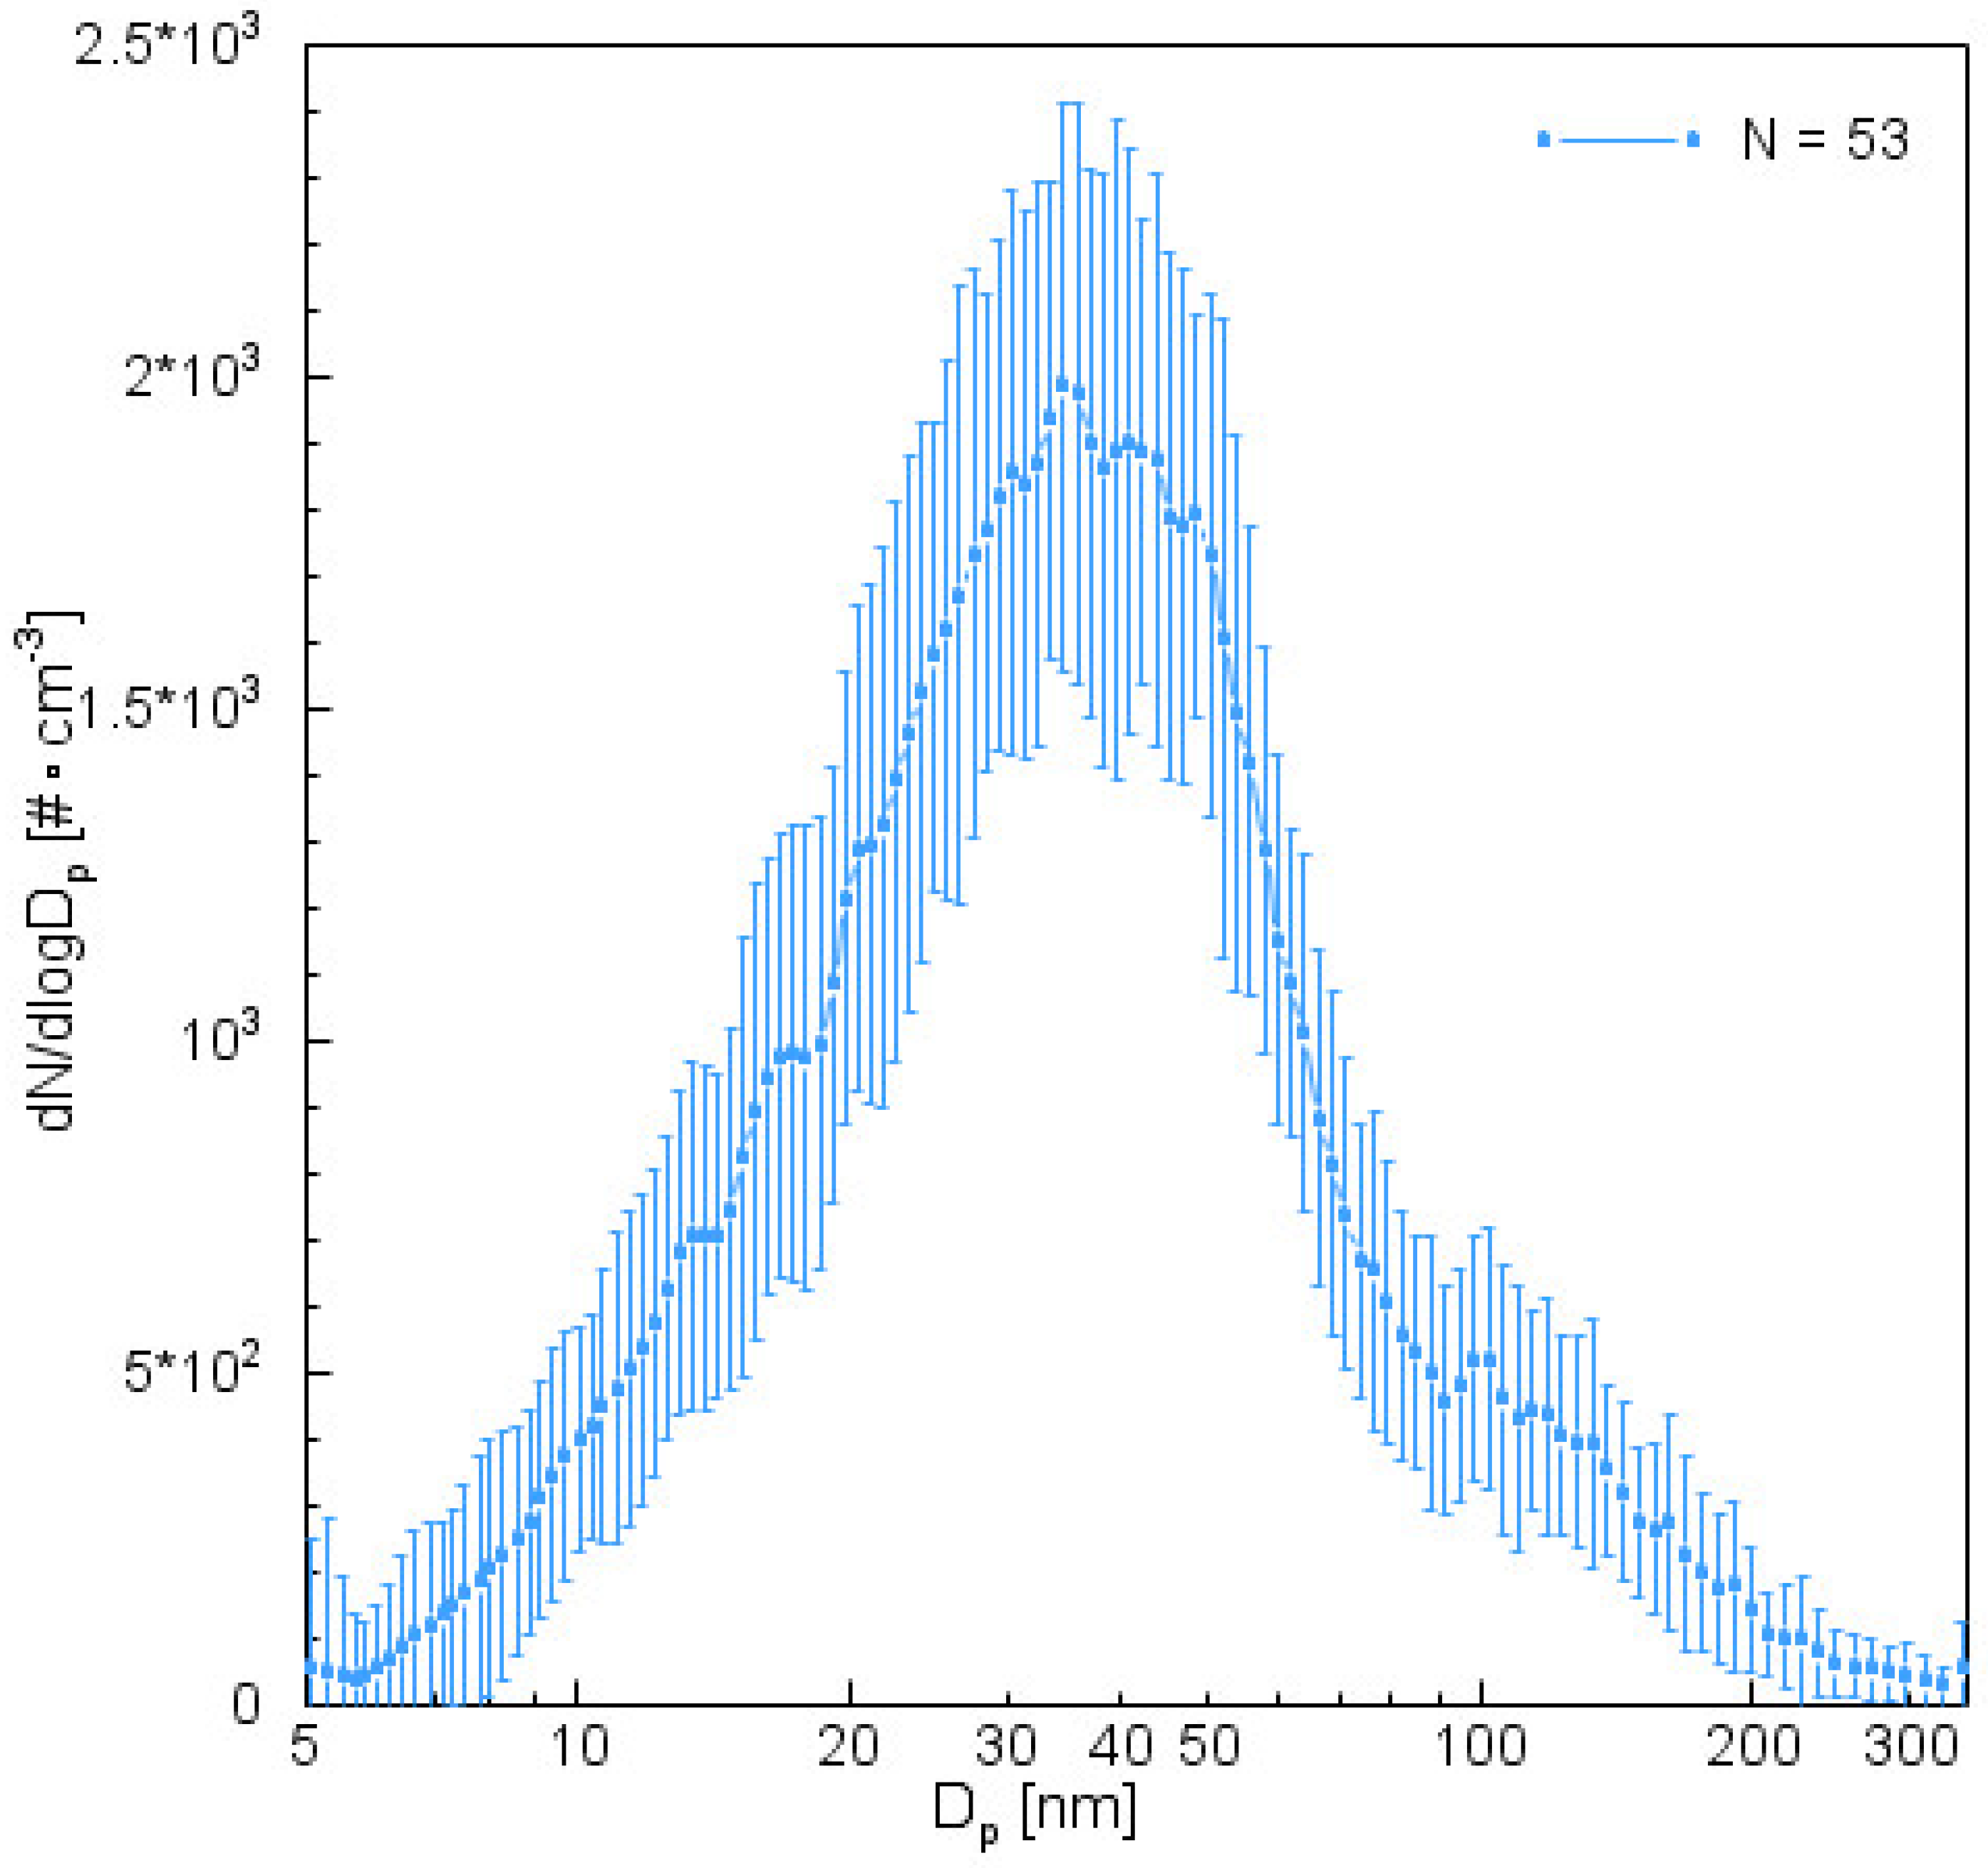
The campaign averages for the marine background aerosol size distribution was conducted both while the vessel was in motion and stationary with its engine turned off. This background average is characterized by standard deviations that are low, alongside particle concentrations approximately two orders of magnitude lower than those found in the ship plume—thereby validating the experimental setup (Figure 3). All plume aerosol size distributions discussed hereafter have been background-corrected.
Figure 3.
Average number size distribution of 53 size distributions from the marine background, with error bars representing the standard deviation; 4 April 2023 and 8 April 2023.
3.2. Dynamics of Aerosol Size Distribution in Exhaust Plume
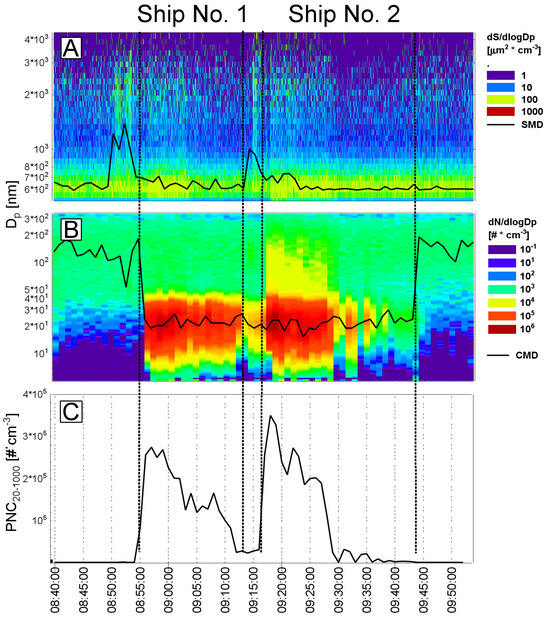
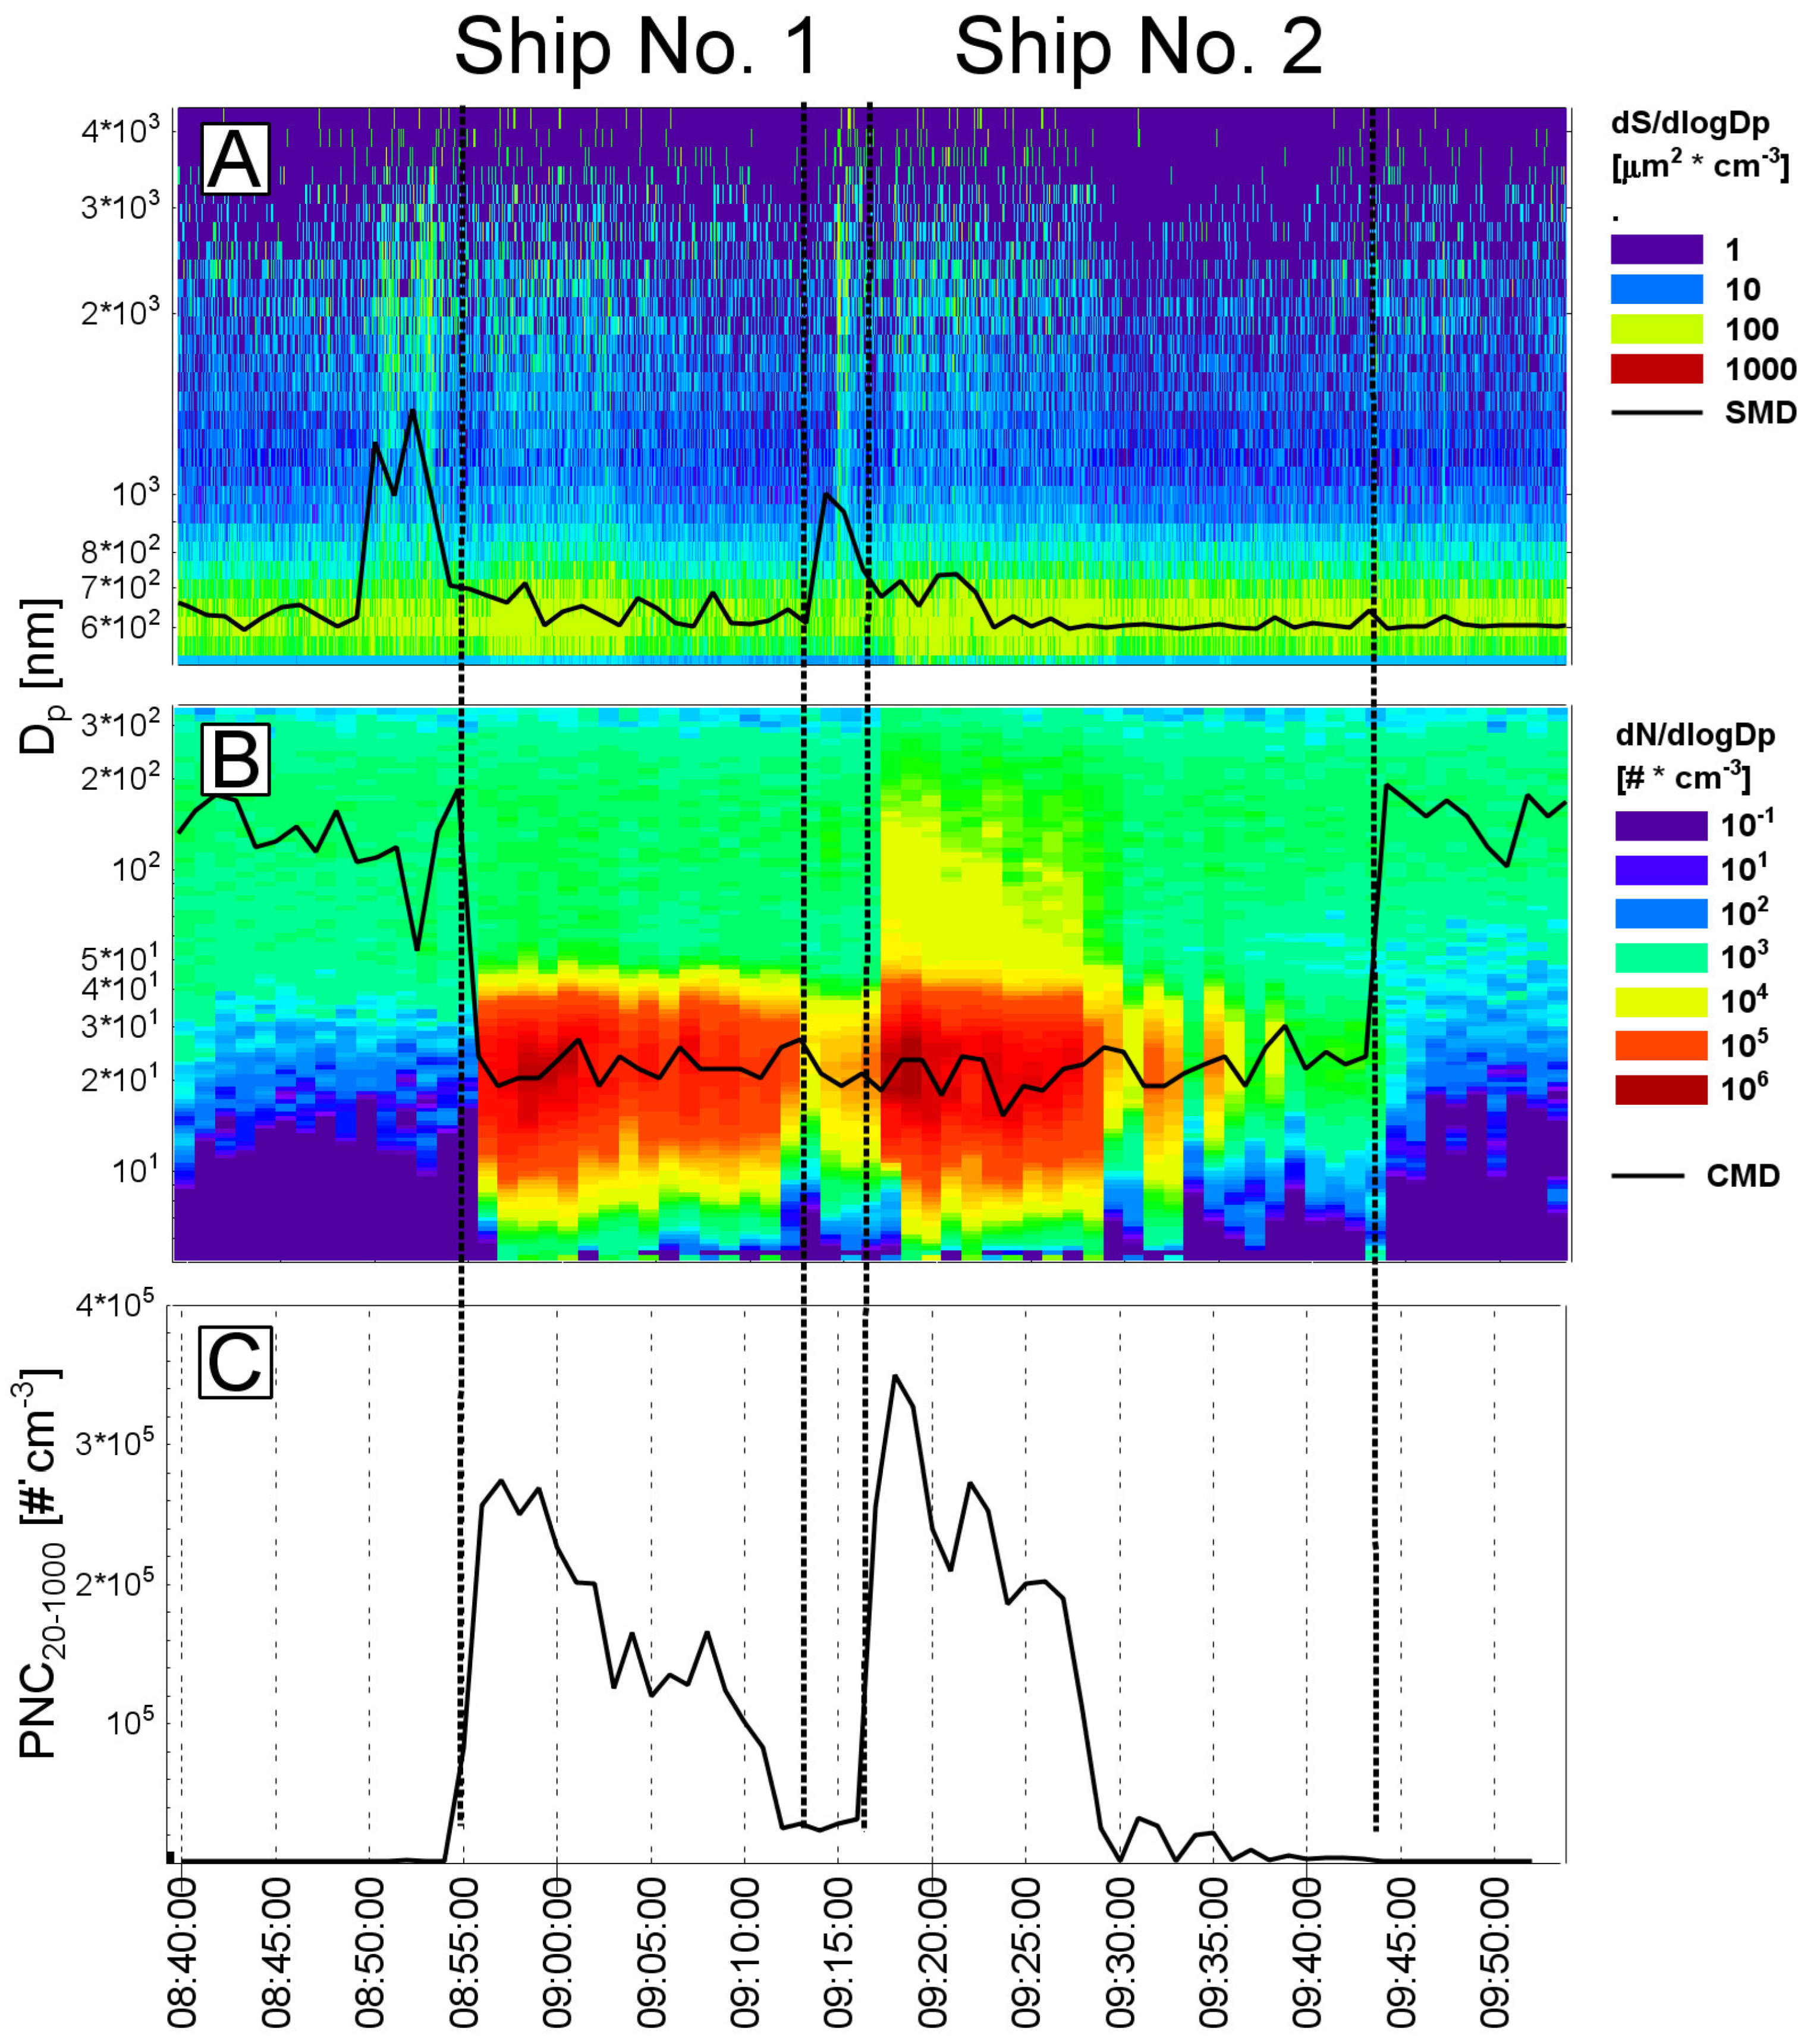
Exhaust plume encounters were identified by increases in PNC20–1000 (Figure 4). These episodes correspond to periods when the boat was located downwind of the tracked ships and inside the exhaust plume. The identification of exhaust plume conditions was further supported by the calculated distance between the measurement boat and the tracked ships, (Figure 2) which confirmed the relative position of the boat behind the ship during the measurements. In addition, photographic documentation recorded during the ship tracking experiment provided visual confirmation of plume interception.
Figure 4.
Time series of aerosol particle measurements for: (A) particle surface size distribution and Surface Median Diameter (SMD); (B) particle number size distribution and count median diameter (CMD); (C) particle number concentration (PNC20–1000), showing two episodes of elevated concentrations associated with ship plume events. Dashed vertical lines define time, when the boat was following Ship 1 or Ship 2.
During the ship plume tracking, the aerosol particle number size distributions were characterized by a rather stable CMD of 21 ± 1 nm and a geometric standard deviation g of 1.3–1.5 for Ship No. 1, and CMD of 20 ± 1 nm and g of 1.1–1.5 for Ship No. 2 (Figure 4).
3.3. Plume Dilution
To characterize diesel plume dilution and estimate aerosol residence time, the plume age was calculated from the inter-vessel distance, ship speed, and wind velocity vector. Because the measurement boat strictly remained downwind of the target ship (Figure 2), the observed plume age was capped at 60 s.
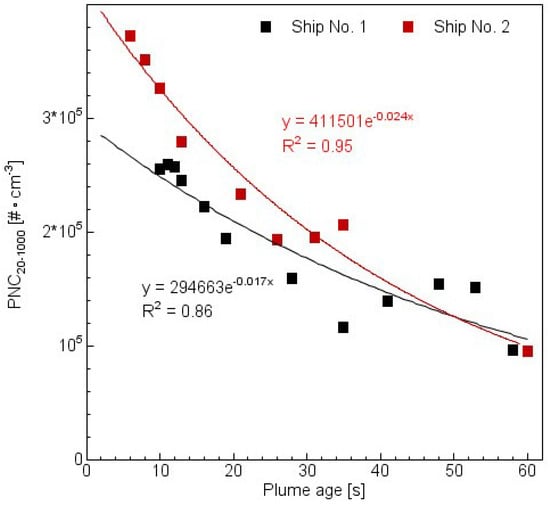
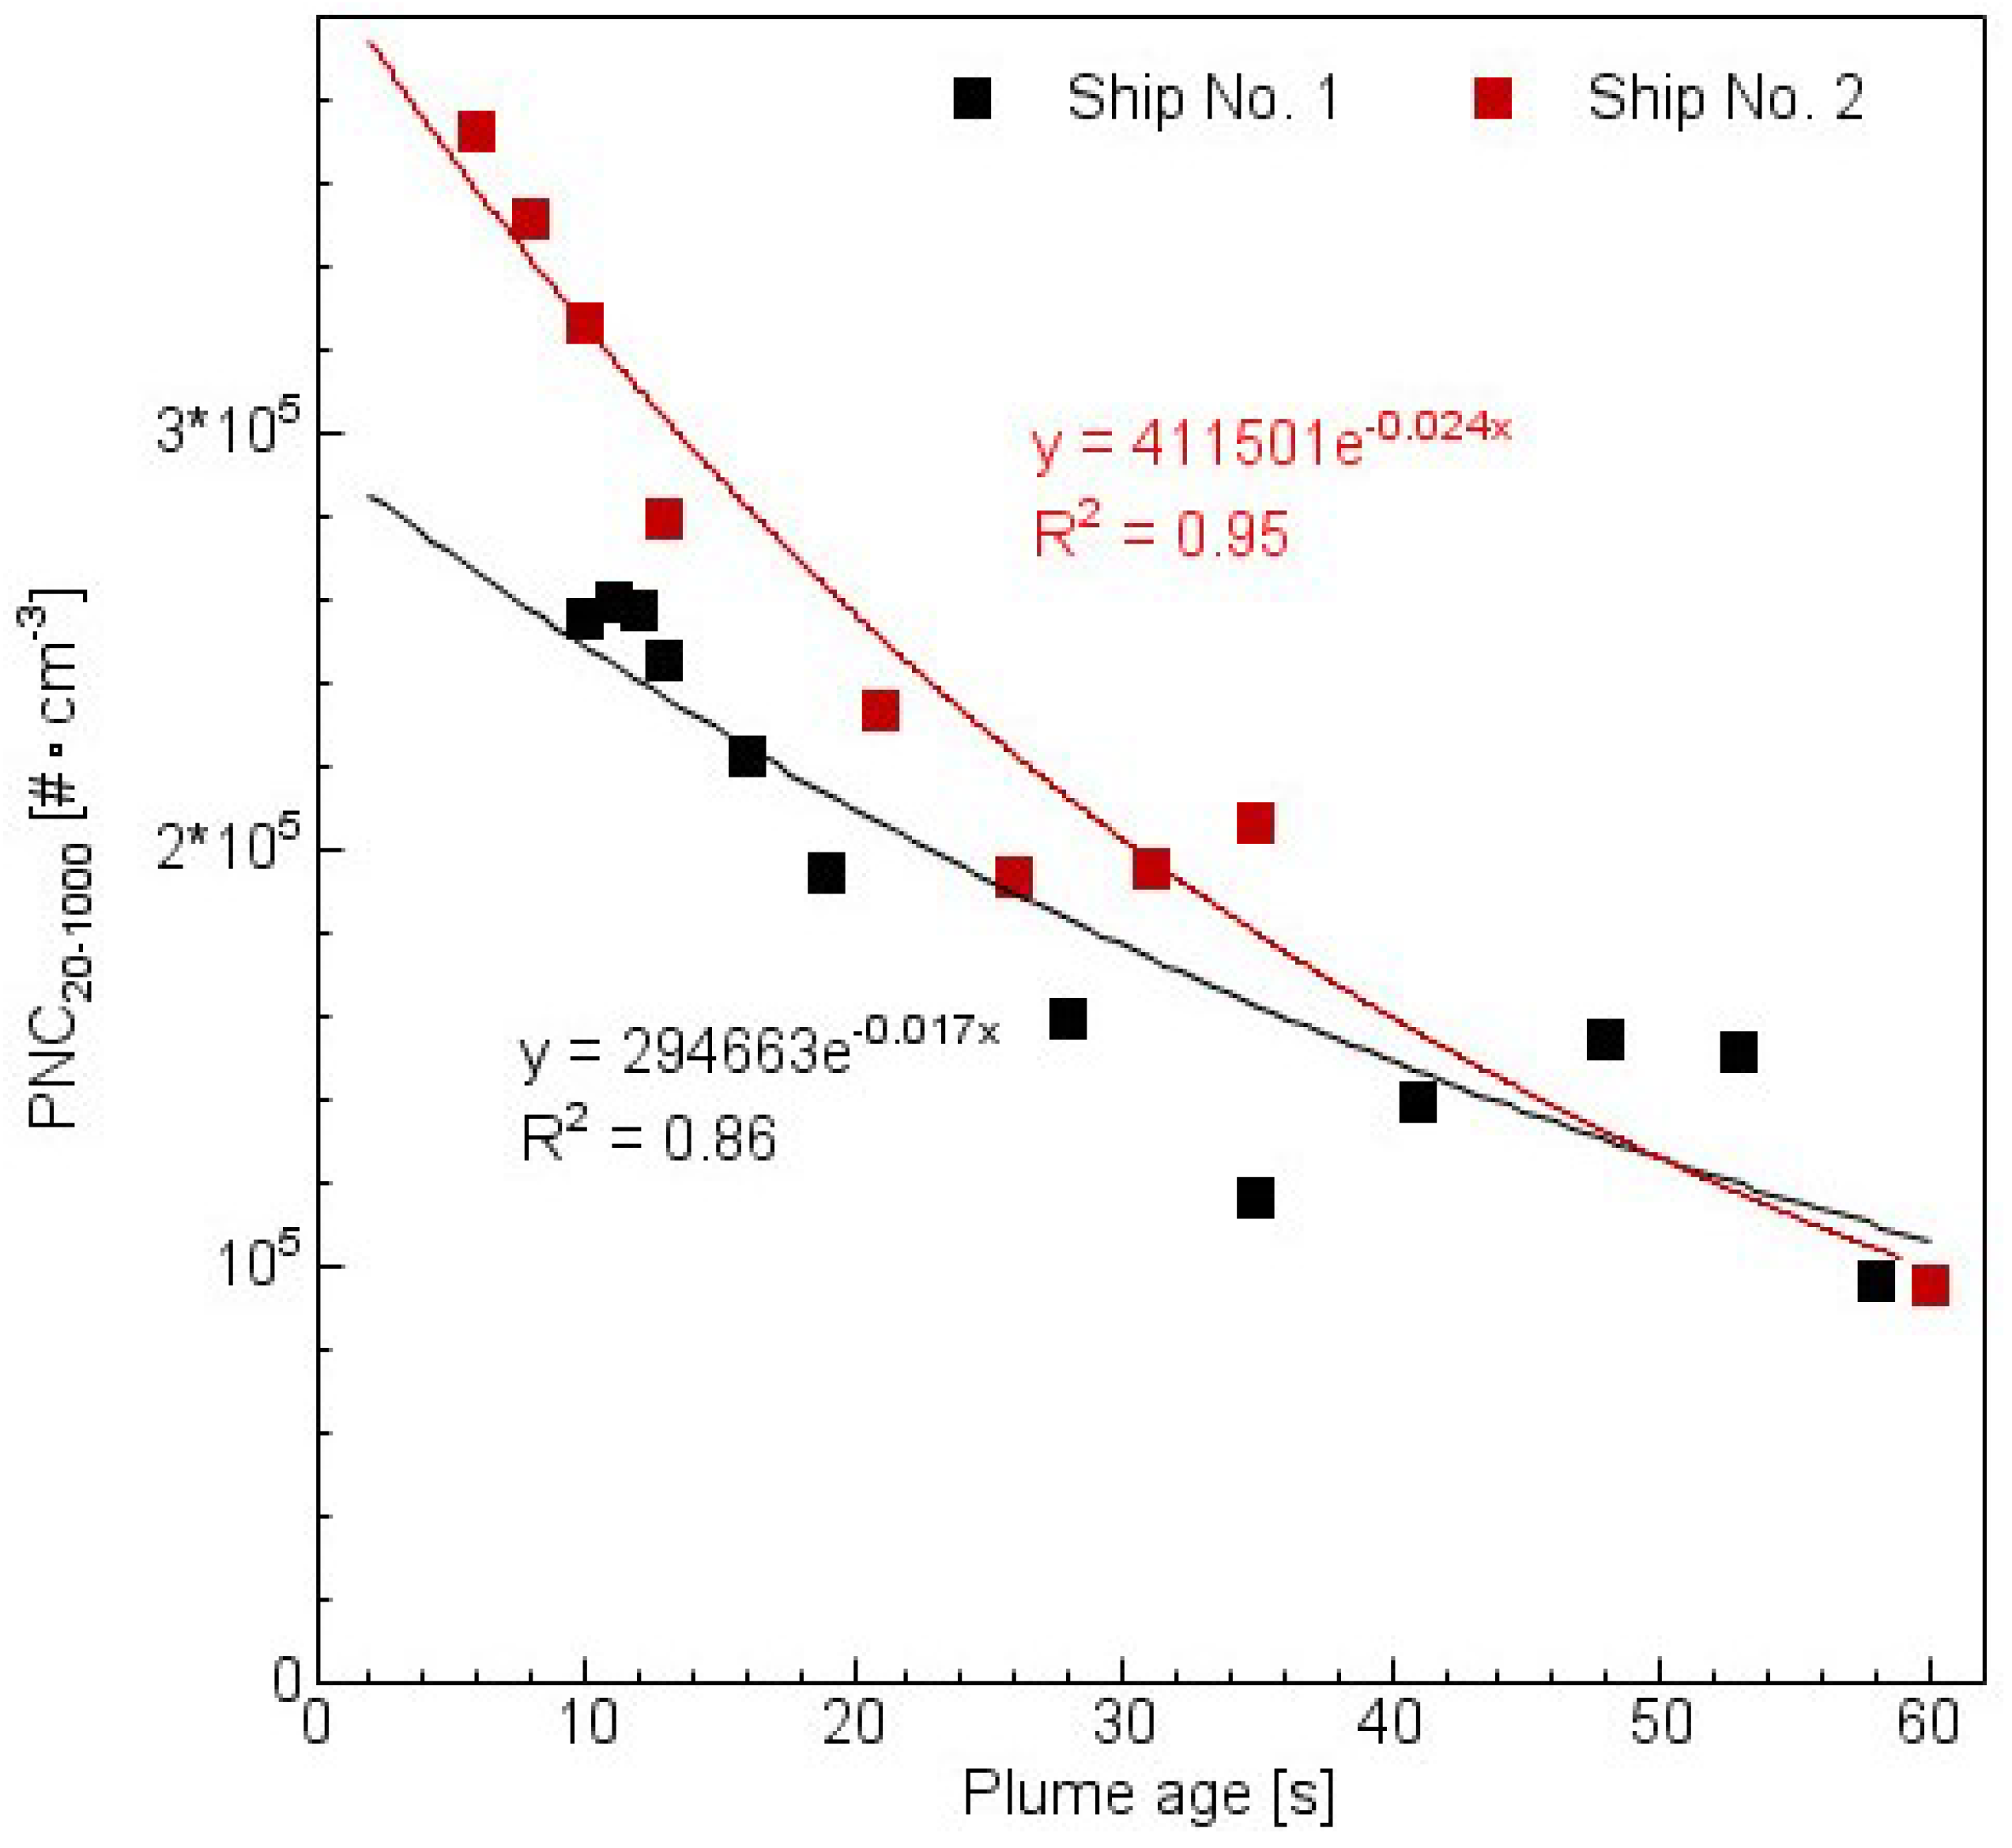
This corresponds to a distance of approximately 600 m from the source, with zero age established at the funnel exhaust. As expected, both ships exhibited an exponential decay in PNC as the plume aged. However, dilution occurred more rapidly for Ship 2 than for Ship 1, with both converging to a similar background PNC by the 60 s mark (Figure 5).
Figure 5.
The 1 min averages of PNC20–1000 values as functions of the exhaust plume age from Ship No. 1 and Ship No. 2.
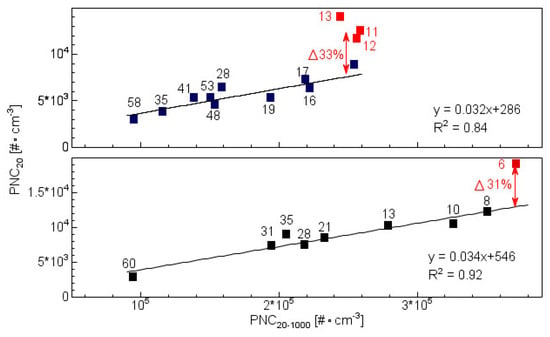
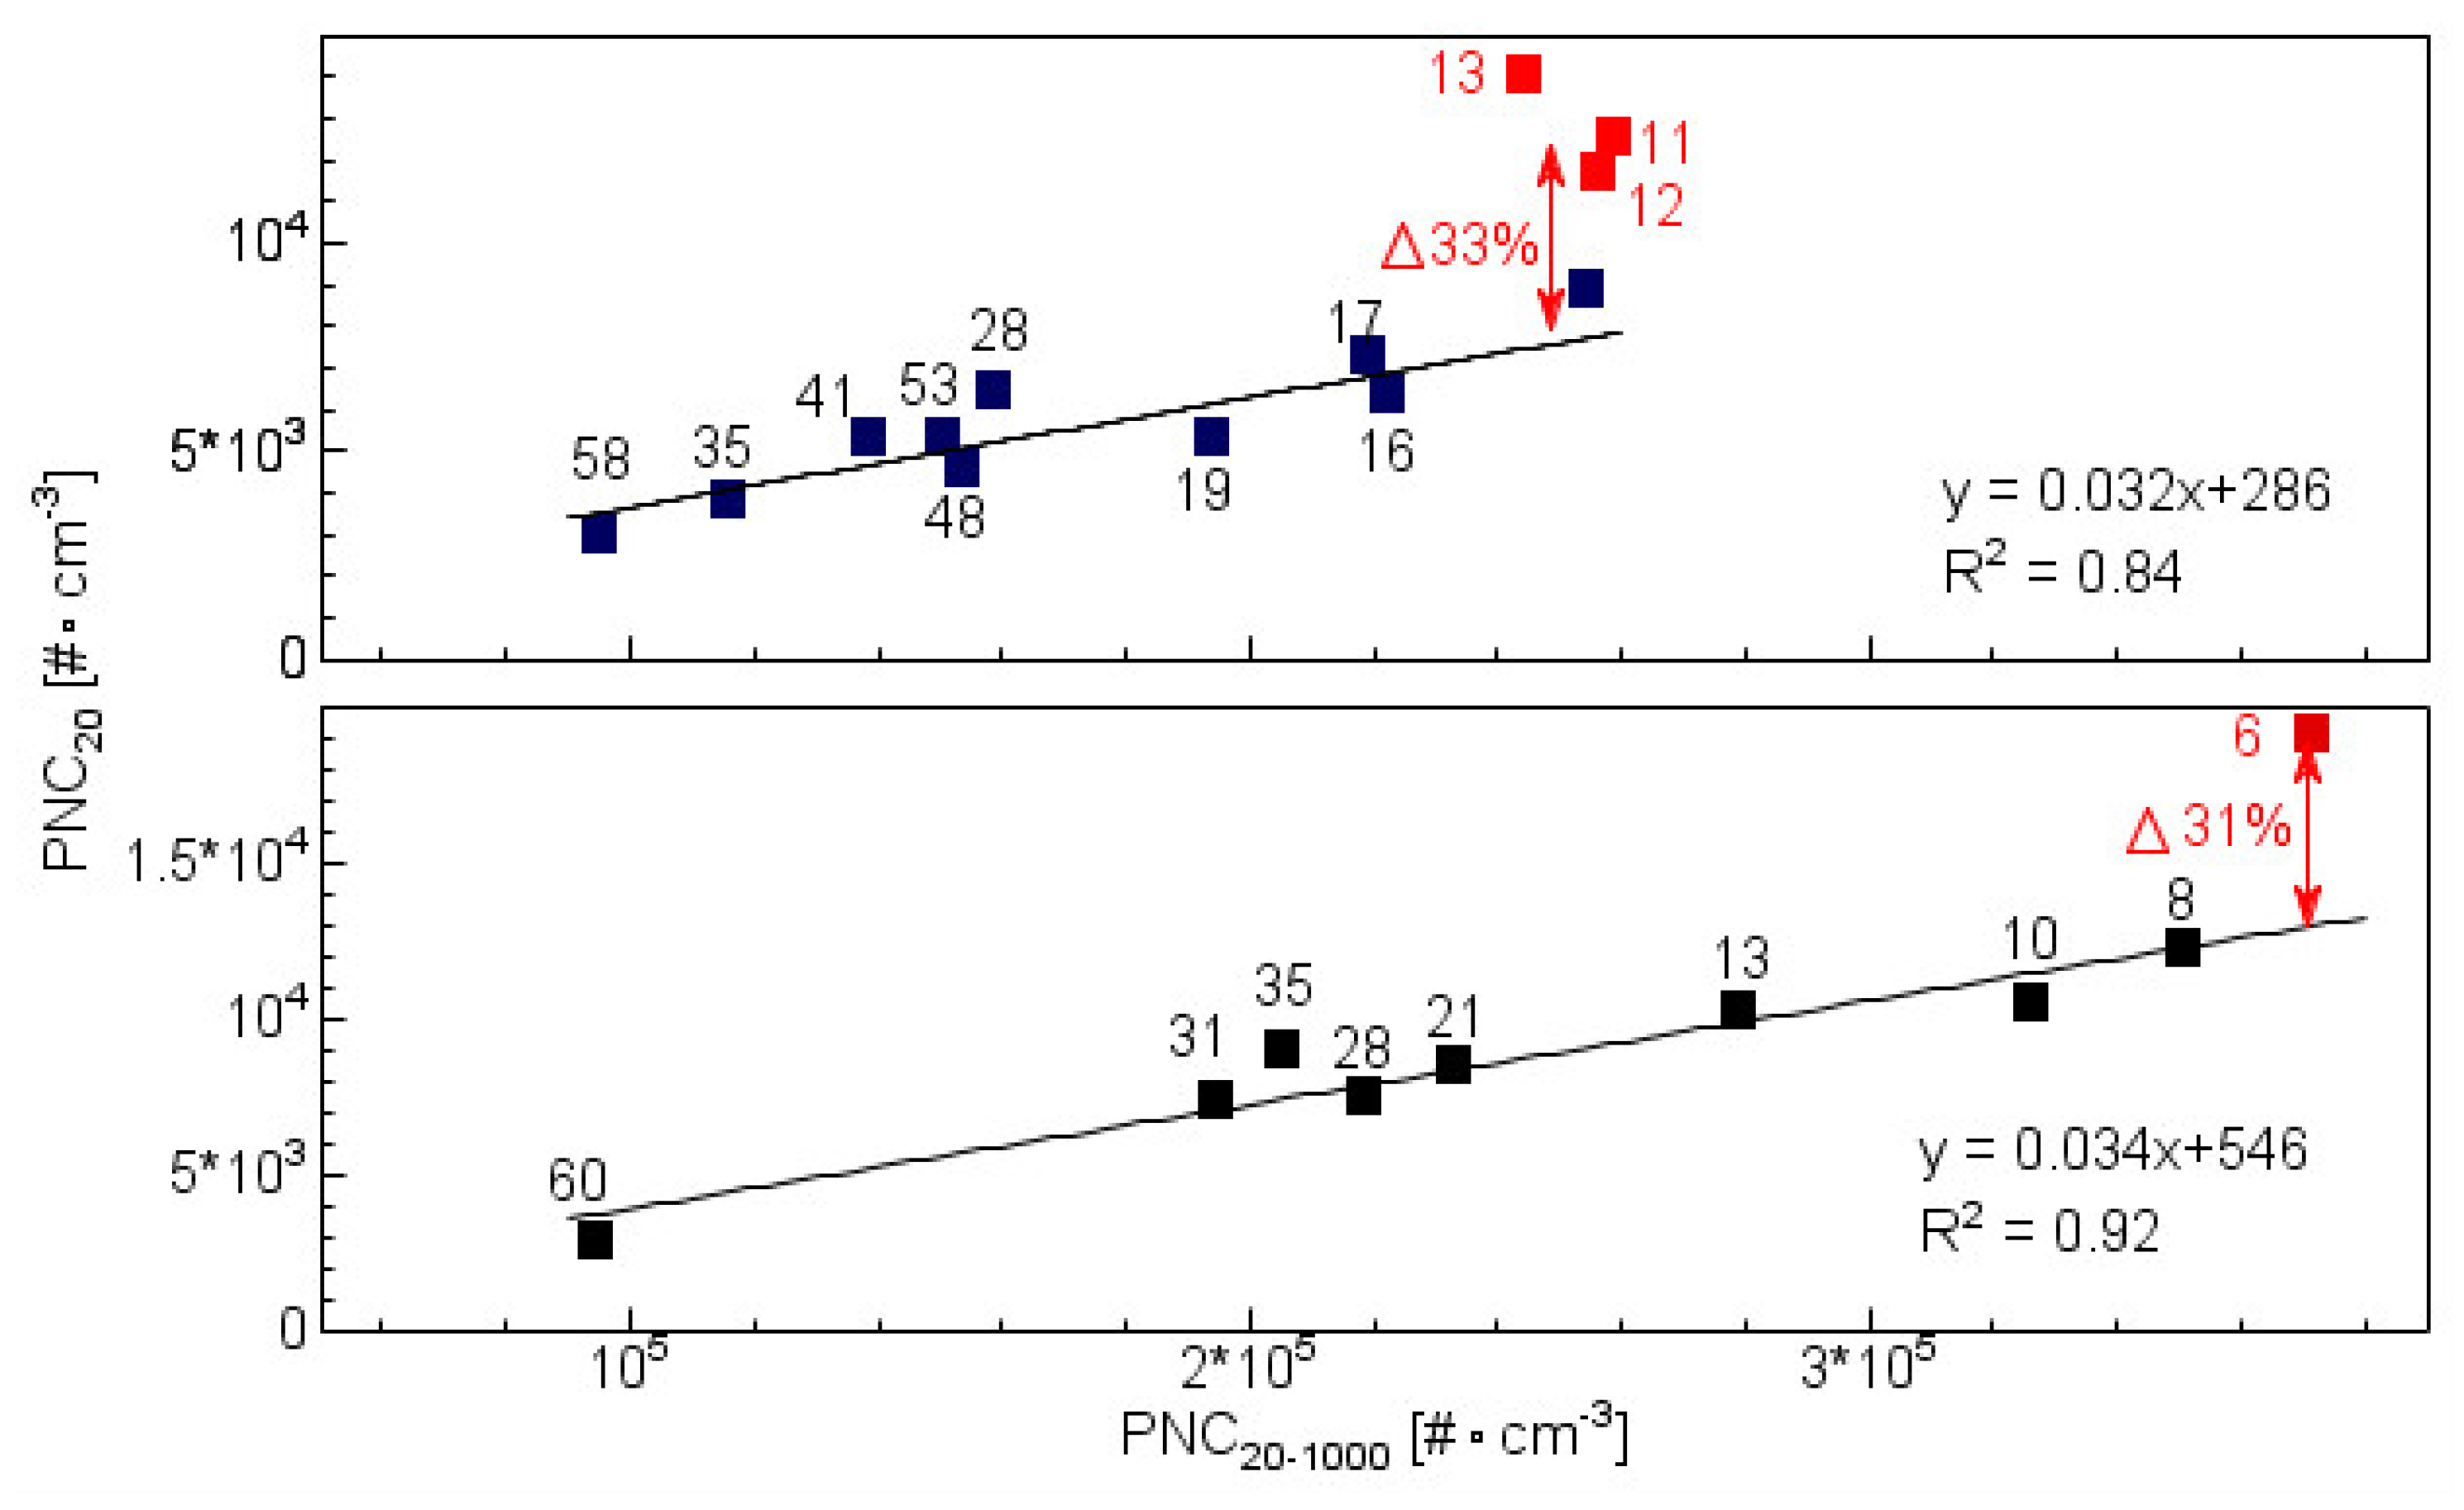
Because particles within the same plume disperse at identical rates, a strong linear relationship should exist between the number concentrations of different particle diameters at any given plume age. Of particular interest is the correlation between ultrafine particles at the count median diameter (CMD 20 nm; PNC20) and PNC20–1000. Strong linear regressions were observed between PNC20 and PNC20–1000 across most intervals, except at the earliest plume ages—specifically under 11 s for Ship 1 and under 6 s for Ship 2. At these early stages, a sudden drop in PNC20 by approximately one-third occurred at plume ages of 10–16 s (Ship 1) and 6–10 s (Ship 2), (Figure 6) corresponding to downwind distances of roughly 100–150 m and 50–100 m, respectively.
Figure 6.
Minute averages for PNC20 versus PNC20–1000 with numbers indicating plume age. Linear regression applies for black dots, while red dots are off-regression. Red arrows with percent numbers indicate relative sudden drop for PNC20 at very early plume ages. Tracking Ship No. 1 (top panel) and Ship No. 2 (bottom panel).
4. Discussion
4.1. Plume Dilution and Particle Size Distribution Stability
The observed decrease in PNC20–1000 with increasing plume age indicates that plume expansion and dilution driven by turbulent entrainment and mixing with the surrounding ambient air constitute the dominant processes governing the temporal evolution of the exhaust plume. Concurrently, the count median diameter (CMD) remained approximately constant at 20 nm during the initial phase of plume aging. This constancy in CMD implies that particle growth mechanisms—such as new particle formation via nucleation, vapour condensation onto pre-existing particles, and coagulation—were of limited importance under the investigated conditions. Consequently, dilution processes appear to have outweighed microphysical transformation processes in determining the evolution of the particle size distribution. Nevertheless, despite the apparent dominance of plume expansion and dilution, a pronounced and rapid decrease in the ultrafine particle number concentration (PNC20) was observed within the first 16 s of plume aging. This decline proceeded at a rate substantially greater than that attributable to expansion and dilution alone, thereby indicating the action of additional particle transformation processes selectively affecting the ultrafine particle fraction.
4.2. Coagulation Analysis
The decrease in the concentration of ultrafine particles can be attributed to transformation processes, such as coagulation processes. Coagulation of 20 nm particles can occur through self-coagulation or through interactions with larger particles present in the exhaust plume and marine background aerosol. Characteristic coagulation times were estimated for self-coagulation and for coagulation with Aitken, accumulation, and coarse-mode particles. The general equation for the decrease in the number of particles of size k over time, caused by the coagulation of particles of the same size (self-coagulation) and coagulation with the subsequently formed particles of size j, is given by Equation (1):
where Nk,j, k-j is the number of particles of a given size mode, and Kk is the self-coagulation coefficient, with Kk-j the coagulation coefficient between particles of different sizes [33]. In our case, 20 nm particles in the exhaust plume may simultaneously undergo self-coagulation and coagulation with other co-emitted particles and the marine aerosol (Table 4). The fastest coagulation rate for particles with a CMD of 20 nm can be expected with aerosol particle size modes that provide the largest surface area for coagulation, i.e., those in the surface median diameter (SMD).
Table 4.
CMD values and values of SMD with appropriate particle number concentrations for aerosol particles from diesel engines and marine aerosols during the monitoring of Ship No. 1.
Applying this to the general equation for the decrease in particle count due to coagulation, we can write
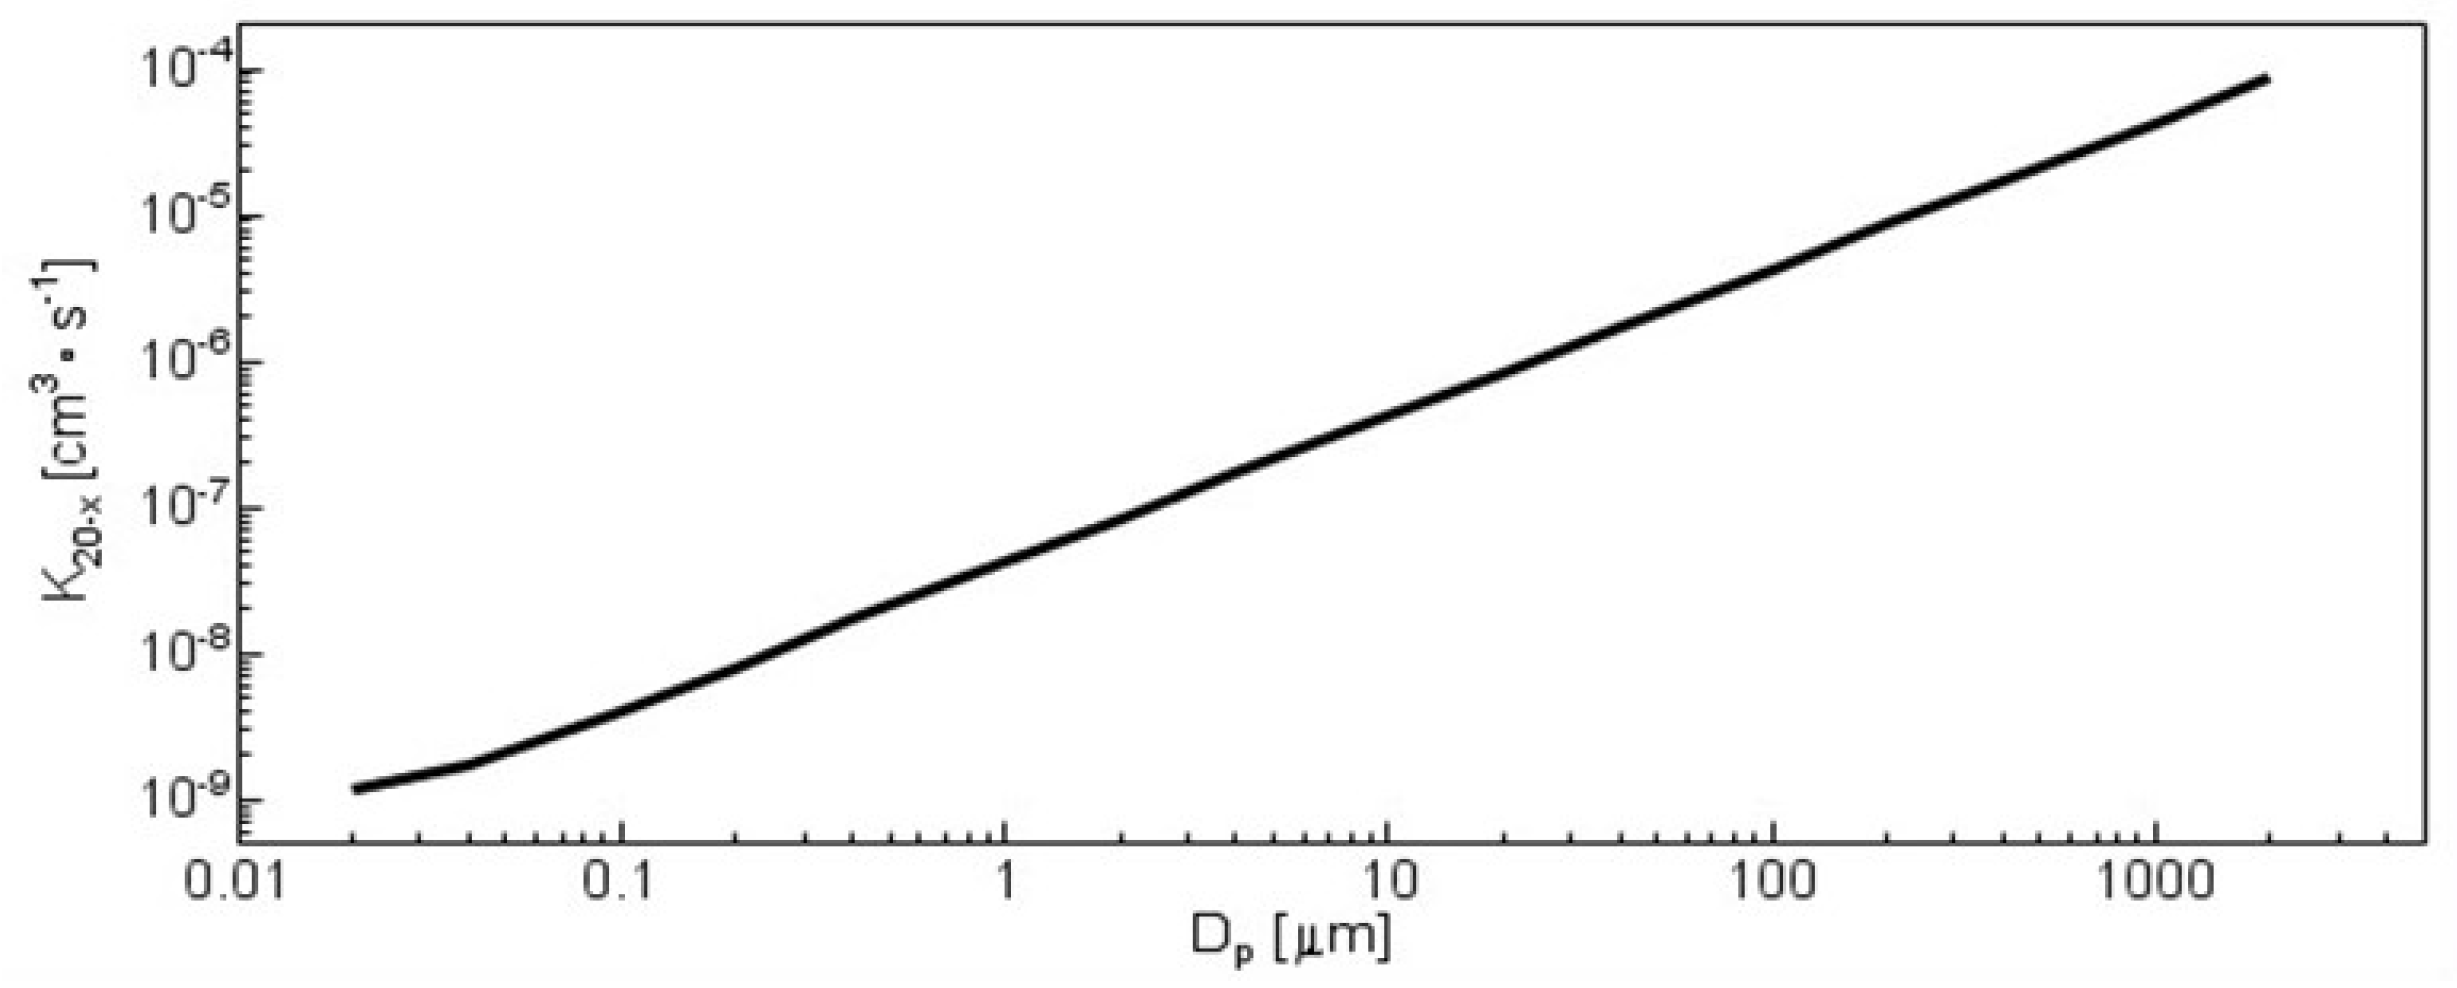
where N20, 65, 230 and 2000 are the number of particles in a given SMD mode, and K is the self-coagulation coefficient; specifically, K20-SMD is the coagulation coefficient between particles of different sizes (see Figure A3). By integrating the terms of Equation (2), one can express the characteristic times i of the decline of 20 nm particles due to individual types of coagulation. For the total residence time c for simultaneously occurring processes, the following generally holds:
If we choose the characteristic time during which PNC20 decreases by one-third in order to compare the characteristic coagulation times with the dynamics in the flue gas plume, then for 1, self-coagulation, we can write
with nd for the coagulation of particles of different sizes 2, 3 and 4; then
where NSMD is the number of particles in a given SMD mode and K is the self-coagulation coefficient, while K20-SMD is the coagulation coefficient between particles of different sizes. The results (Table 5) show that self-coagulation occurs on time scales on the order of hours, while coagulation with larger particles is even slower. These time scales are significantly longer than the observed decrease in PNC20 within a few tens of seconds. This indicates that conventional coagulation processes alone cannot explain the rapid decrease in ultrafine particle concentration observed in the near-field exhaust plume.
Table 5.
The residence times i for PNC20 to decrease by one-third due to the coagulation.
4.3. Interaction with Sea Spray Droplets
Sea spray represents a major natural source of aerosol particles in the marine atmosphere, generated by the interaction between wind and the ocean surface. This process initially leads to the formation of sea spray droplets with sizes ranging from Dd 0.5 to 500 µm [5,34,35]. Under laboratory conditions simulating the breaking of wave crests, droplets as large as 2 mm have been measured [36]. Some of these microdroplets can have an ejection velocity of up to 30 m·s−1 [37]. The natural mechanism of sea spray generation is also emphasized by the ship itself as it sails. It leaves behind a choppy and disturbed water surface, i.e., a wake. The wake represents a zone of visible disturbance of the sea surface and bursting air bubbles on the surface. These bubbles enter the water both through the disturbance of the surface caused by the movement of the ship’s hull and through the rotation of the ship’s propellers, which creates so-called cavitation bubbles [38]. We assume, and witnessed during the measurements, that a cruising ship generates behind it, in its vicinity above the wake, a “cloud” of droplets of similar sizes to those naturally generated by sea spray caused by the interaction of wind currents with the sea. Such a “cloud” of droplets would be characterized by a short-term duration, as the droplets, due to their size, settle rapidly. For example, a 100 µm droplet has a settling velocity of 26 cm·s−1 [4]. Sea spray droplets can span a wide size range, including droplets with diameters of tens to hundreds of micrometers [5]. Due to their large size, these droplets provide a highly efficient sink for ultrafine particles through coagulation. Moreover, their relatively high settling velocities lead to rapid removal of ultrafine particles from the plume. A hypothetical cloud of large droplets with a diameter of 500 µm at a concentration of 103 cm−3 above the ship’s wake could therefore lead to a rapid decrease by one-third in ultrafine particle concentration within 20 s. This is consistent with the observations in this study. Ultrafine particles in ship exhaust plumes may be removed by coagulation with large sea spray droplets generated in the ship’s wake [31]. However, verification of this mechanism requires simultaneous measurements of droplet size distributions and aerosol chemical composition.
4.4. Limitations
This study is based on a limited number of ship tracking experiments, and the results may be influenced by variability in meteorological conditions and ship operating parameters. The absence of direct measurements of sea spray droplets represents a key limitation in confirming the proposed mechanism.
5. Conclusions
In this study, in situ measurements of aerosol particle size distributions in ship exhaust plumes were performed in the marine atmospheric boundary layer. The results show that the early aging of the exhaust plume (t < 60 s) is primarily governed by plume expansion and dilution, while interactions with marine background aerosol have a limited influence on the particle size distribution. Nevertheless, a rapid decrease in ultrafine particle number concentration (PNC20) was observed very early (6–10 s) in the plume, at distances of approximately 50–150 m from the tracking ships. This decrease occurred faster than can be explained by expansion and dilution alone, indicating the presence of additional particle transformation processes. The results suggest that scavenging of ultrafine particles with large sea spray droplets generated in the ship’s wake may represent an efficient removal mechanism. This process is likely associated with the disturbance of the sea surface and the formation of droplets due to breaking of waves and propeller-induced cavitational bubbles. These findings improve our understanding of aerosol transformation processes in ship exhaust plumes, highlight the potential role of ship-induced sea spray in the removal of ultrafine particles, and suggest a previously underexplored pathway for the transfer of atmospheric pollution to the sea surface.
Author Contributions
Conceptualization, J.H.; methodology, J.H.; validation, J.H. and D.S.; formal analysis, D.S. and J.H.; investigation, D.S., J.H., S.K.P. and T.G.; resources, J.H., R.Z. and H.O.; data curation, D.S. and J.H.; writing—original draft preparation, D.S.; writing—review and editing, J.H., D.S., S.K.P., H.O. and R.Z.; visualization, D.S.; supervision, J.H.; project administration, H.O., J.H. and T.G.; funding acquisition, J.H., H.O. and R.Z. All authors have read and agreed to the published version of the manuscript.
Funding
The measurements were conducted as part of the bilateral Czech–German project “Dynamics and fate of ship emissions: From plume emission to the influx to the Baltic Sea” (PlumeBaSe), funded by the Czech Science Foundation (GA ČR, grant No. 22-03426L) and the German Research Foundation (DFG, grant No. 471841824).
Data Availability Statement
The original contributions presented in this study are included in the article. Further inquiries can be directed to the corresponding author.
Conflicts of Interest
The authors declare no conflicts of interest.
Appendix A
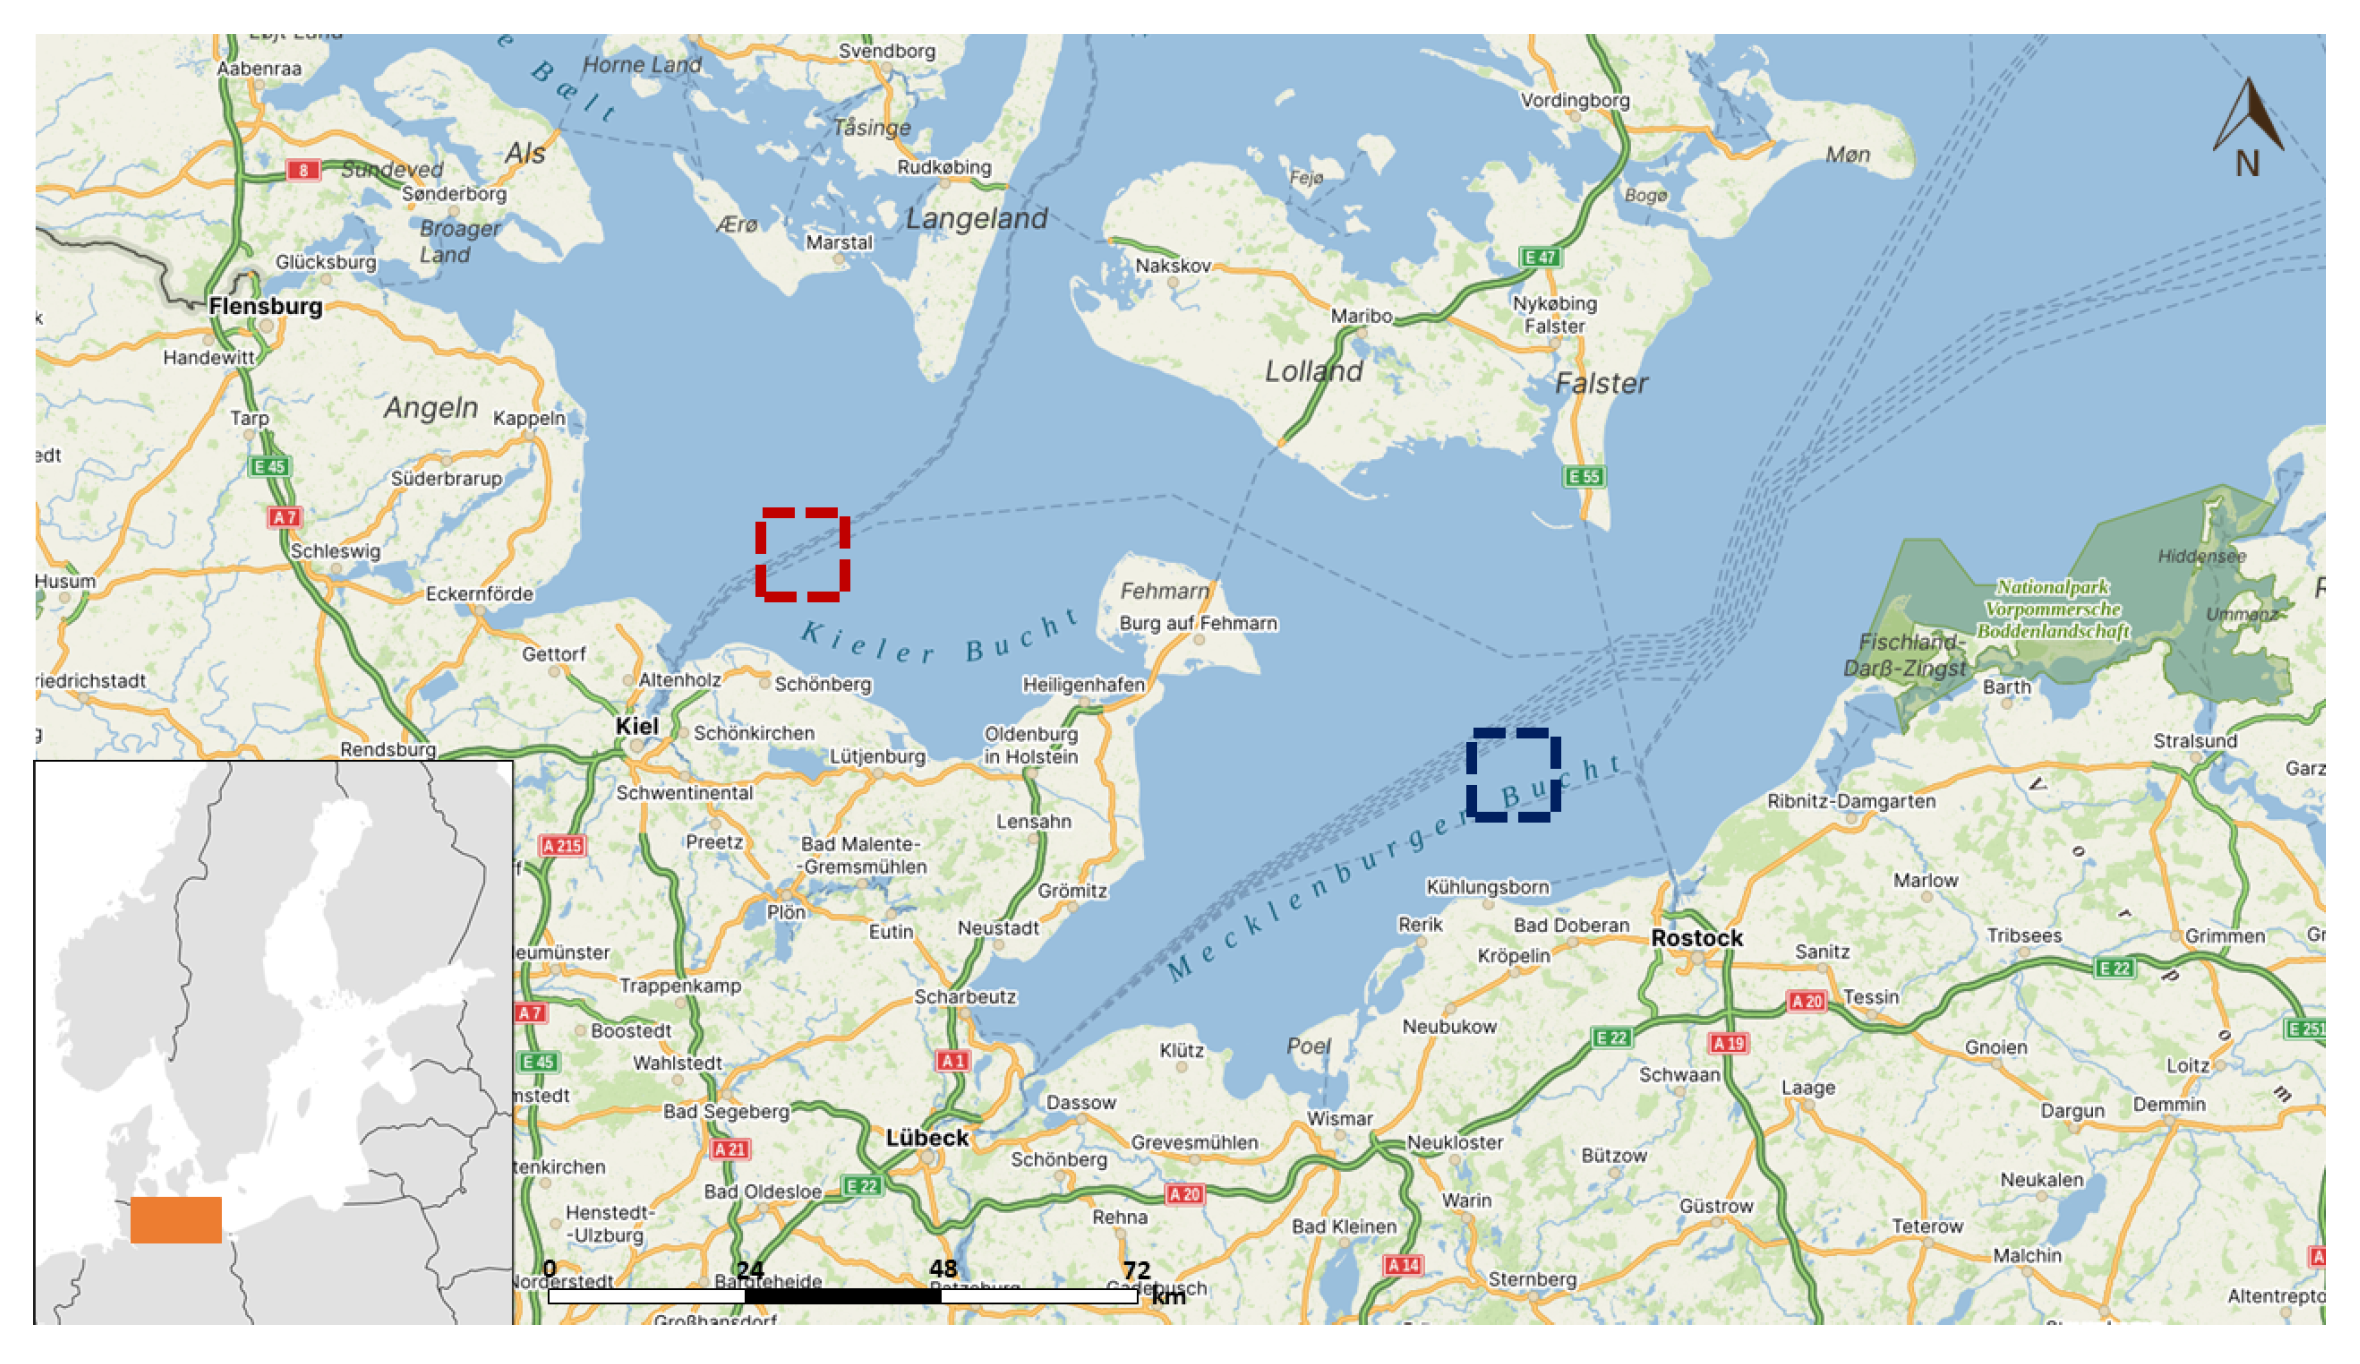
Figure A1.
Marked measurement areas during the cruises on 4 April 2023 (blue) and 8 April 2023 (red) (Table 2).
Appendix B
Figure A2.
Penetration curve at the sampling inlet with arrows pointing to cut-off diameter.
Appendix C
Figure A3.
Coagulation coefficient (K20-x) of 20 nm particles with particles of size x (Dp 0.02–2000 µm), according to [39].
References
- Eyring, V.; Isaksen, I.; Berntsen, T.; Collins, W.; Corbett, J.; Endresen, O.; Stevenson, D. Transport impacts on atmosphere and climate: Shipping. Atmos. Environ. 2010, 44, 4735–4771. [Google Scholar] [CrossRef] [Scilit]
- Gryspeerdt, E.; Smith, T.; O’Keeffe, E.; Christensen, M.; Goldsworth, F. The Impact of Ship Emission Controls Recorded by Cloud Properties. Geophys. Res. Lett. 2019, 46, 12547–12555. [Google Scholar] [CrossRef] [Scilit]
- Haywood, J.; Boucher, O. Estimates of the direct and indirect radiative forcing due to tropospheric aerosols: A review. Rev. Geophys. 2000, 4, 513–543. [Google Scholar] [CrossRef] [Scilit]
- Hinds, W. Aerosol Technology: Properties, Behavior, and Measurement of Airborne Particles, 2nd ed.; Wiley-Interscience: Hoboken, NJ, USA, 1999. [Google Scholar]
- Veron, F. Ocean Spray. Annu. Rev. Fluid Mech. 2015, 47, 507–538. [Google Scholar] [CrossRef] [Scilit]
- Eyring, V.; Köhler, H.W.; van Aardenne, J.; Lauer, A. Emissions from international shipping: 1. The last 50 years. J. Geophys. Res. 2005, 110, D17305. [Google Scholar] [CrossRef] [Scilit]
- IMO (International Maritime Organization). Introduction to IMO. 2019. Available online: http://www.imo.org/en/About/Pages/Default.aspx (accessed on 24 October 2023).
- IEA (International Energy Agency). CO2 Emissions in 2022. 2023. Available online: https://www.iea.org/reports/co2-emissions-in-2022 (accessed on 24 October 2023).
- IMO. Fourth IMO GHG Study 2020; International Maritime Organization: London, UK, 2021; Available online: https://www.imo.org/en/ourwork/environment/pages/fourth-imo-greenhouse-gas-study-2020.aspx (accessed on 8 March 2023).
- Endresen, Ø.; Sørgård, E.; Sundet, J.; Dalsøren, S.; Isaksen, I.; Berglen, T.; Gravir, G. Emission from international sea transportation and environmental impact. J. Geophys. Res. 2003, 108, 4560. [Google Scholar] [CrossRef] [Scilit]
- Hassellöv, I.-J.; Turner, D.; Lauer, A.; Corbett, J. Shipping contributes to ocean acidification. Geophys. Res. Lett. 2013, 11, 2731–2736. [Google Scholar] [CrossRef] [Scilit]
- Achten, C.; Marin-Enriquez, O.; Behrends, B.; Kupich, S.; Lutter, A.; Korth, R.; Andersson, J.T. Polycyclic aromatic compounds including non-target and 71 target polycyclic aromatic hydrocarbons in scrubber discharge water and their environmental impact. Mar. Pollut. Bull. 2024, 208, 116790. [Google Scholar] [CrossRef] [Scilit] [PubMed]
- Hermansson, L.; Hassellöv, I.-M.; Moldanova, J.; Ytreberg, E. Comparing emissions of polyaromatic hydrocarbons and metals from marine fuels and scrubbers. Transp. Res. Part D Transp. Environ. 2021, 97, 102912. [Google Scholar] [CrossRef] [Scilit]
- André, N. Air Pollution-Related Illness: Effects of Particles. Science 2005, 208, 804–806. [Google Scholar] [CrossRef] [Scilit] [PubMed]
- Pope, C., III; Burnett, R.; Thun, M.; Calle, E.; Krewski, D.; Ito, K.; Thurston, G. Lung Cancer, Cardiopulmonary Mortality, and Long-term Exposure to Fine Particulate Air Pollution. JAMA 2002, 9, 1132–1141. [Google Scholar] [CrossRef] [Scilit] [PubMed]
- Susanne, B.; Joleen, M.; Constantinos, S.; Flemming, S. Response of human alveolar macrophages to ultrafine, fine, and coarse urban air pollution particles. Exp. Lung Res. 2009, 29, 29–44. [Google Scholar] [CrossRef] [Scilit] [PubMed]
- Viana, M.; Hammingh, P.; Colette, A.; Querol, X.; Degraeuwe, B.; de Vlieger, I.; van Aardenne, J. Impact of maritime transport emissions on coastal air quality in Europe. Atmos. Environ. 2014, 90, 96–105. [Google Scholar] [CrossRef] [Scilit]
- Sofiev, M.; Winebrake, J.; Johansson, L.; Carr, E.; Prank, M.; Soares, J.; Corbett, J. Cleaner fuels for ships provide public health benefits with climate tradeoffs. Nat. Commun. 2018, 9, 406. [Google Scholar] [CrossRef] [Scilit] [PubMed]
- IMO (International Maritime Organization). IMO 2020—Cleaner Shipping for Cleaner Air. 2019. Available online: https://www.imo.org/en/MediaCentre/PressBriefings/pages/34-IMO-2020-sulphur-limit-.aspx (accessed on 5 December 2023).
- Andersen, J.; Cartensen, J.; Conley, D.; Dromph, K.; Fleming-Lehtinen, V.; Gustafsson, B.; Murray, C. Long-term temporal and spatial trends in eutrophication status of the Baltic Sea. Biol. Rev. 2017, 92, 135–149. [Google Scholar] [CrossRef] [Scilit] [PubMed]
- Brutemark, A.; Engström-Öst, J.; Vehmaa, A. Long-term monitoring data reveal pH dynamics, trends and variability in the western Gulf of Finland. Oceanol. Hydrobiol. Stud. 2011, 40, 91–94. [Google Scholar] [CrossRef] [Scilit]
- Omstedt, A.; Edman, M.; Claremar, B.; Rutgersson, A. Modelling the contributions to marine acidification from deposited SOx, NOx, and NHx in the Baltic Sea: Past and present situations. Cont. Shelf Res. 2015, 111, 234–249. [Google Scholar] [CrossRef] [Scilit]
- Gallo, F.; Sanchez, K.; Anderson, B.; Bennett, R.; Brown, M.; Crosbie, E.; Moore, R. Measurement report: Aerosol vertical profiles over the western North Atlantic Ocean during the North Atlantic Aerosols and Marine Ecosystems Study (NAAMES). Atmos. Chem. Phys. 2023, 23, 1465–1490. [Google Scholar] [CrossRef] [Scilit]
- von Glasow, R.; Lawrence, M.; Sander, R.; Crutzen, P. Modeling the chemical effects of ship exhaust in the cloud-free marine boundary layer. Atmos. Chem. Phys. 2003, 3, 233–250. [Google Scholar] [CrossRef] [Scilit]
- Zanatta, M.; Bozem, H.; Köllner, F.; Schneider, J.; Kunkel, D.; Hoor, P.; Herber, A. Airborne survey of trace gases and aerosols over the Southern Baltic Sea: From clean marine boundary layer to shipping corridor effect. Tellus B Chem. Phys. Meteorol. 2020, 72, 1695349. [Google Scholar] [CrossRef] [Scilit]
- Bouya, Z.; Box, G. Seasonal variation of aerosol size distributions in Darwin, Australia. J. Atmos. Sol.-Terr. Phys. 2011, 73, 2022–2033. [Google Scholar] [CrossRef] [Scilit]
- Flores, J.; Bourdin, G.; Altaratz, O.; Trainic, M.; Lang-Yona, N.; Dzimban, E.; Koren, I. Tara Pacific Expedition’s Atmospheric Measurements of Marine Aerosols across the Atlantic and Pacific Oceans. Bull. Am. Meteorol. Soc. 2020, 101, E536–E554. [Google Scholar] [CrossRef] [Scilit]
- Sellegri, K.; O’Dowd, C.; Yoon, Y.; Jennings, S.; de Leeuw, G. Surfactants and submicron sea spray generation. J. Geophys. Res. 2006, 111, D22215. [Google Scholar] [CrossRef] [Scilit]
- Kerminen, V.-M.; Wexler, A. The interdependence of aerosol processes and mixing in point source plumes. Atmos. Environ. 1995, 3, 361–375. [Google Scholar] [CrossRef] [Scilit]
- Celik, S.; Drewnick, F.; Fachinger, F.; Brooks, J.; Darbyshire, E.; Coe, H.; Paris, J.-D.; Eger, P.G.; Schuladen, J.; Tadic, I.; et al. Influence of vessel characteristics and atmospheric processes on the gas and particle phase of ship emission plumes: In situ measurements in the Mediterranean Sea and around the Arabian Peninsula. Atmos. Chem. Phys. 2020, 20, 4713–4734. [Google Scholar] [CrossRef] [Scilit]
- Fedorenko, M.; Hovorka, J. Spatial Distribution of PMx and Number Concentration of Submicron Aerosol Particles Behind Sailing Ships on the Vltava River. Inż. Miner. 2025, 3, 1–5. [Google Scholar] [CrossRef] [Scilit]
- Petzold, A.; Hasselbach, J.; Lauer, P.; Baumann, R.; Franke, K.; Gurk, C.; Weingartner, E. Experimental studies on particle emissions from cruising ship, their characteristic properties, transformation and atmospheric lifetime in the marine boundary layer. Atmos. Chem. Phys. 2008, 9, 2387–2403. [Google Scholar] [CrossRef] [Scilit]
- Seinfeld, J.; Pandis, S. Atmospheric Chemistry and Physics: From Air Pollution to Climate Change; Wiley: Hoboken, NJ, USA, 2016. [Google Scholar]
- Berny, A.; Popinet, S.; Séon, T.; Deike, L. Statistics of jet drop production. Geophys. Res. Lett. 2021, 48, e2021GL092919. [Google Scholar] [CrossRef] [Scilit]
- Hovorka, J.; Fedorenko, M.; Kozakova, O.; Šmok, D.; Piel, S.K.; Gröger, T. Number Size Distribution and Concentration of Droplets Generated by Sailing Ships. Inż. Miner. 2025, 3, 1–4. [Google Scholar] [CrossRef] [Scilit]
- Veron, F.; Hopkins, C.; Harrison, E.; Mueller, J. Sea spray spume droplet production in high wind speeds. Geophys. Res. Lett. 2012, 39, L16602. [Google Scholar] [CrossRef] [Scilit]
- Spiel, D. On the births of film drops from bubbles bursting on seawater surfaces. J. Geophys. Res. 1998, 103, 24907–24918. [Google Scholar] [CrossRef] [Scilit]
- Brennen, C. Cavitation and Bubble Dynamics; Oxford University Press: New York, NY, USA, 1995. [Google Scholar] [CrossRef] [Scilit]
- Fuchs, N.; Davies, C.; Daisley, R.; Fuchs, M. The Mechanics of Aerosols; Revised & Enlarged Edition; Dover Publications: lGarden City, NY, USA, 1989. [Google Scholar]

Disclaimer/Publisher’s Note: The statements, opinions and data contained in all publications are solely those of the individual author(s) and contributor(s) and not of MDPI and/or the editor(s). MDPI and/or the editor(s) disclaim responsibility for any injury to people or property resulting from any ideas, methods, instructions or products referred to in the content. |
© 2026 by the authors. Licensee MDPI, Basel, Switzerland. This article is an open access article distributed under the terms and conditions of the Creative Commons Attribution (CC BY) license.