Article

A Novel Logistical Approach for the Installation of Floating Wind Turbines

Centre for Marine Technology and Ocean Engineering (CENTEC), Instituto Superior Técnico, Universidade de Lisboa, 1049-001 Lisbon, Portugal
*
Author to whom correspondence should be addressed.
J. Mar. Sci. Eng. 2026, 14(11), 1009; https://doi.org/10.3390/jmse14111009
Submission received: 22 April 2026 / Revised: 16 May 2026 / Accepted: 22 May 2026 / Published: 29 May 2026

Abstract

This study presents a comparative assessment of two installation methodologies, i.e., a conventional towing-based approach and the Nordic Wind installation concept, where fully assembled wind turbine generators are transported and installed using a dedicated installation vessel. A simulation-based logistics framework is developed to evaluate installation performance under realistic metocean conditions, incorporating operational limits, weather downtime, and vessel utilisation. The methodology combines response-based operability criteria with long-term hindcast data to quantify installation duration across multiple percentiles (P20, P50, and P90). The results show that both methods are sensitive to weather variability, with installation duration increasing significantly from favourable to adverse conditions. The Nordic Wind method achieves a substantial reduction in installation duration, typically of the order of 40–60%, primarily due to reduced offshore exposure and more efficient utilisation of workable weather windows. Under more challenging environmental conditions, both methods exhibit increased variability; however, the Nordic Wind method maintains shorter overall campaign durations. A time-dependent cost model demonstrates that installation duration is the dominant cost driver. Accordingly, the reduced campaign duration achieved by the Nordic Wind method leads to lower installation costs in most scenarios, while remaining competitive under more severe conditions. The proposed framework enables a consistent comparison of installation strategies by integrating operability analysis, logistics simulation, and cost assessment, providing a basis for optimising installation approaches in floating offshore wind projects.

1. Introduction

Offshore wind energy is expected to play a central role in the global energy transition, with floating offshore wind enabling deployment in deep-water regions where bottom-fixed solutions are not feasible. Global offshore wind capacity has expanded rapidly in recent years, reaching more than 68 GW of installed capacity by 2023 and exceeding 80 GW by 2024, with continued strong growth expected toward 2030. Despite this progress, floating offshore wind remains at an early stage of commercial deployment, with global installed capacity still below 300 MW, highlighting the gap between technological potential and large-scale deployment [1,2].
The installation phase represents one of the most critical contributors to project cost and schedule risk. Industry and technical economic studies indicate that installation and commissioning activities account for approximately 10 to 20% of total project CAPEX, with vessel day rates and offshore operation duration representing the dominant cost drivers [3]. Recent cost assessments further show that floating offshore wind systems remain significantly more expensive than bottom-fixed systems, with total capital costs typically ranging between 5000 and 8000 USD/kW depending on project configuration and site conditions. Although the levelised cost of offshore wind energy has decreased by more than 40% over the past decade, cost reductions for floating wind remain limited due to installation complexity and immature supply chains [4]. Consequently, improving installation logistics is widely recognised as a key pathway toward reducing the levelized cost of energy for floating offshore wind projects.
A substantial body of research has been devoted to offshore wind installation logistics and planning. Poulsen and Hasager [5] demonstrated that improved logistics strategies can reduce installation costs through optimised vessel utilisation. Kaiser and Snyder [6] developed cost estimation approaches for offshore wind installation, while Thomsen [7] provided detailed descriptions of installation processes and logistical constraints. Simulation and optimisation-based approaches have further advanced installation planning, including decision support systems developed by Lange et al. [8] and optimisation frameworks proposed by Ait-Alla et al. [9]. Discrete-event simulation methods have also been applied to evaluate installation timelines and identify logistical bottlenecks under realistic operating conditions [10,11,12]. More recent studies have extended these approaches to floating offshore wind systems. Díaz and Guedes Soares [13] reviewed the state of offshore wind technology and highlighted the increasing importance of logistics for floating wind deployment. In subsequent work, Díaz and Guedes Soares [14] demonstrated that installation duration is highly sensitive to vessel configuration, transport distance, and logistics strategy. Complementary studies by Vis and Ursavas [15] and Maples et al. [16] emphasised the importance of supply chain design and pre-assembly strategies in improving installation efficiency.
More recently, Ivanov and Ma [17] investigated floater assembly and turbine integration strategies for large floating offshore wind turbines, highlighting the importance of port infrastructure, crane capacity, storage arrangements, and assembly location in determining the feasibility and cost-effectiveness of floating wind deployment.
Environmental conditions play a decisive role in offshore installation performance. Weather downtime (WDT) is a key factor governing installation schedules, as offshore operations are constrained by limits on wave height, wave period, wave heading, wind speed, and vessel motions. Previous studies have shown that weather-related delays can account for approximately 20–40% of total installation time, depending on site conditions and operation type [10,17]. Barlow et al. [18,19] demonstrated the sensitivity of installation duration to weather variability, while subsequent studies further confirmed the importance of incorporating environmental effects into logistics simulations. Weather window analysis remains a fundamental tool for evaluating offshore operability, as highlighted by Martins et al. [20], who showed that accurate metocean representation is essential for reliable prediction of offshore operations. Recent studies on floating offshore wind maintenance operations have similarly demonstrated that vessel dynamics, wave conditions, and floating-to-floating interaction effects can significantly constrain offshore lifting and component handling activities [21].
More recent research has advanced the representation of weather-dependent operability through the incorporation of probabilistic weather windows and forecast uncertainty into offshore operational planning. In particular, environmental variability has been shown to strongly influence installation scheduling, operational risk, and downtime, especially for activities constrained by strict motion limits and environmental thresholds [22,23,24].
In parallel, offshore engineering research has established methodologies for assessing operational limits in weather-restricted marine operations. Clauss and Riekert [25] defined motion-based criteria for offshore lifting operations, while Cozijn et al. [26] investigated hydrodynamic responses during offshore installation activities. More recent work using spectral wave analysis has demonstrated the importance of accurately capturing environmental loading for assessing structural response and operational limits in offshore operations [27]. Industry standards, such as DNV-RP-C205 [28], further define environmental loading and operational criteria, which directly influence installation planning and operability assessment.
Floating offshore wind installations introduce additional challenges compared to bottom-fixed systems, particularly due to the dynamic response of floating structures and the increased complexity of marine operations [29]. Recent review studies further highlight that installation logistics, vessel operations, and environmental constraints remain key challenges for large-scale deployment of floating wind farms [30]. Current installation practices are largely based on towing pre-assembled or partially assembled floating structures to offshore sites, followed by hook-up and commissioning operations. Recent studies on FOWT wet-towing operations have further highlighted the importance of towing dynamics, tugboat–floater interaction, forward-speed effects, and environmental loading in assessing the feasibility and safety of towing-based deployment strategies [31,32]. This approach has been successfully implemented in projects such as Hywind Scotland and Hywind Tampen [33,34], as well as semi-submersible concepts such as the WindFloat projects, which have demonstrated alternative installation and deployment strategies [35]. However, these approaches remain highly sensitive to weather conditions and dependent on suitable assembly locations and offshore operations. These constraints become increasingly significant for large-scale deployment and serial installation of floating wind turbines.
To improve installation efficiency, alternative installation concepts have been proposed. Jiang et al. [36] investigated innovative installation vessel concepts and demonstrated their potential to improve operational stability and reduce offshore lifting requirements. Broader assessments of offshore wind installation have shown that installation strategy has a direct influence on project duration and overall efficiency [37]. In this context, Hassan and Guedes Soares [38,39] introduced the Nordic Wind concept, which enables onshore assembly of wind turbines and reduces reliance on weather-sensitive offshore lifting operations through a motion-compensated transfer system. Additional studies have shown that improvements in installation strategy can significantly reduce installation time and enhance overall project performance [40,41,42].
Despite these developments, important gaps remain in the literature. Existing studies primarily address offshore wind installation from isolated perspectives, including logistics optimisation, vessel design, or the assessment of individual installation concepts. However, there is a lack of studies that systematically compare fundamentally different installation methodologies under consistent logistical, operational, and environmental assumptions. In particular, the influence of installation philosophy, such as towing-based strategies versus integrated installation concepts, on key performance indicators remains insufficiently understood.
Furthermore, while weather downtime (WDT) is widely recognised as a critical factor governing offshore operations, its role is often treated as an external constraint rather than a primary metric for comparing installation strategies. As a result, the relationship between installation methodology, weather-dependent operability, and overall installation duration has not been comprehensively quantified for floating offshore wind applications.
This limitation is particularly significant given that weather-related delays can account for a substantial portion of total installation time. In addition, although installation cost is known to be strongly influenced by vessel spread and offshore operation duration, there is limited work that explicitly links logistics efficiency and operability performance to quantifiable cost implications. In particular, the potential cost benefits associated with reducing offshore activities, minimising weather exposure, and enabling alternative installation sequences remain insufficiently assessed in the context of floating wind deployment.
In addition to installation efficiency, installation philosophy may also influence future operation and maintenance (O&M) strategies for floating offshore wind systems. Existing studies have highlighted the importance of tow-to-port and in situ maintenance approaches, weather-dependent accessibility, and vessel logistics in determining lifecycle operability and maintenance performance of floating offshore wind farms [41]. Although maintenance operations are outside the scope of the present study, the relationship between installation methodology and lifecycle maintenance strategy represents an important direction for future research. To address these gaps, the present study develops a simulation-based logistics framework to evaluate the impact of a novel installation method (Nordic Wind) as an alternative to conventional towing-based approaches. The proposed framework enables a direct and consistent comparison between installation methodologies by incorporating detailed logistics sequences, vessel operations, and environmental constraints. Unlike multi-criteria decision-making approaches, which typically rank alternatives using weighted evaluation criteria, the proposed methodology is based on a simulation-driven operational framework that explicitly models installation sequences, vessel activities, and weather-dependent operability to quantify installation performance metrics. The analysis explicitly quantifies weather downtime, total installation duration, and associated logistical performance across multiple case study locations. By comparing a novel installation methodology with current industry practice, this study provides new insights into how installation strategy can influence project duration, weather exposure, and ultimately the potential for cost reduction in floating offshore wind projects.

2. Installation Methodology

The installation of floating offshore wind turbines presents unique challenges due to the scale of components, reliance on marine operations, and sensitivity to environmental conditions. Current industry practices and emerging concepts differ significantly in how installation activities are distributed between onshore, nearshore, and offshore environments. In this study, the term installation method refers to the physical process by which the wind turbine and floating foundation are assembled, transported, and installed offshore. By contrast, logistics strategy refers to the sequencing, coordination, and resource allocation associated with the installation campaign, including vessel utilisation, port activities, transport cycles, and weather-dependent waiting periods. The Nordic Wind concept affects both aspects: it modifies the physical installation process through offshore float-over turbine integration and changes the logistics strategy by decoupling turbine assembly from the installation of the floating foundation. To assess the combined influence of installation method and logistics strategy on project performance, this study considers two distinct approaches:
  • The conventional towing-based installation method, which represents the current floating wind practice.
  • The Nordic Wind installation method, which introduces a float-over installation concept for offshore turbine integration.

2.1. Conventional Floating Wind Installation Method

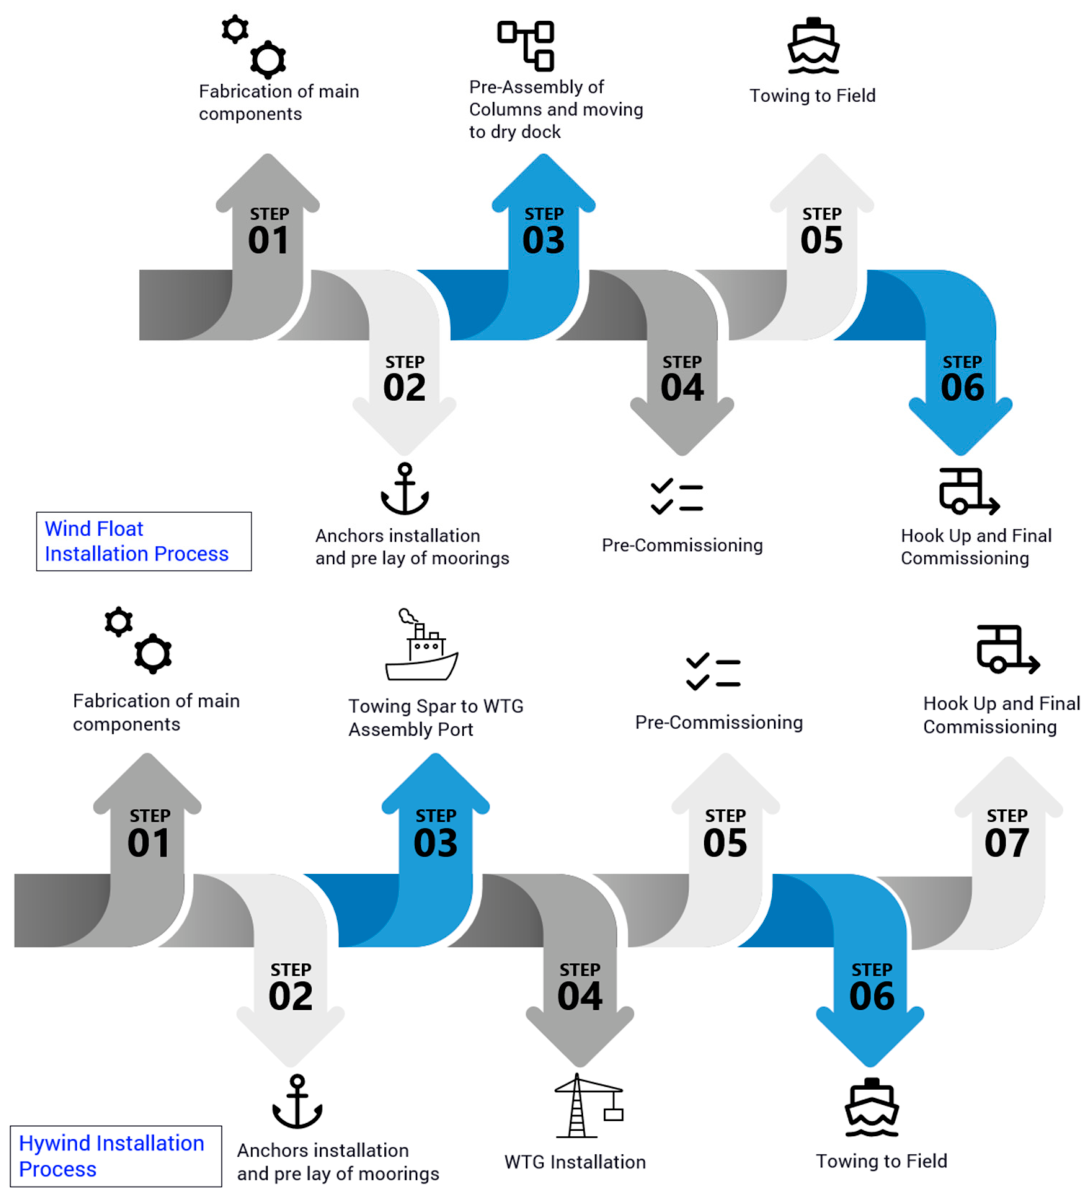
Existing floating offshore wind projects, including Hywind, WindFloat, and Kincardine, are primarily based on onshore or nearshore assembly followed by towing operations, rather than offshore installation in the traditional sense. The overall installation sequence associated with conventional floating wind deployment is illustrated in Figure 1, highlighting the key stages from fabrication and assembly to towing, hook-up, and commissioning.
In these projects, the floating substructure is first constructed and prepared, after which the wind turbine generator (WTG) is assembled using onshore cranes or, where suitable sheltered-water conditions and supporting infrastructure are available, integrated in protected coastal areas before offshore deployment. For semi-submersible concepts such as WindFloat, turbine integration is typically completed at quayside or in protected areas before the fully assembled unit is towed to the offshore site using anchor handling vessels [43]. Existing floating wind projects have also demonstrated both in situ and tow-to-port maintenance approaches depending on operational requirements, environmental conditions, and available infrastructure.
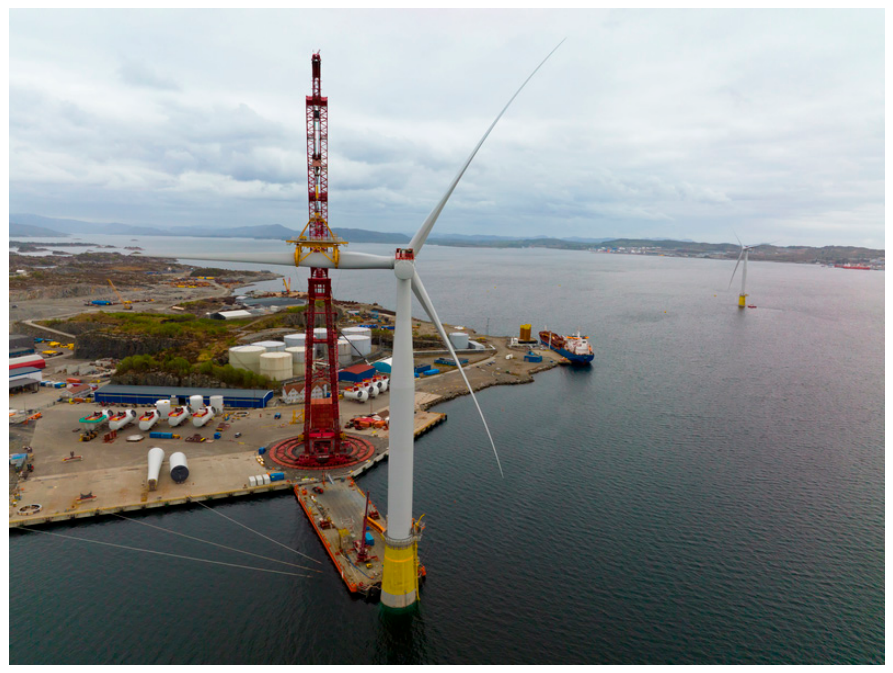
For spar-based concepts such as Hywind, the installation process involves additional steps, including upending the floating structure using ballasting operations in deep water. In Hywind Scotland, turbine integration was performed using a heavy-lift vessel offshore, whereas in Hywind Tampen, this operation was shifted to nearshore locations using a high-capacity onshore crane. Due to the significant draft of the spar substructure, a barge was installed at the quayside to provide sufficient water depth during turbine integration, as shown in Figure 2. Furthermore, the required crane capacity is not widely available and introduces additional logistical challenges, including large-scale transportation, assembly, and pre-assembly operations involving hundreds of components. In both cases, however, the fully assembled turbine foundation system is subsequently towed to the offshore site, where final hook-up and commissioning are carried out.
Therefore, the defining characteristics of the conventional installation method are the prior assembly of the WTG, transportation of the complete unit by towing, and a limited offshore installation scope primarily restricted to hook-up and commissioning activities. Despite avoiding full offshore assembly, this method presents several challenges, including the requirement for suitable deep-water assembly locations, constraints on installation sequencing and scalability, dependence on long-distance towing operations, and limited availability of high-capacity towing vessels. These factors contribute to increased installation duration and logistical complexity, particularly for large-scale deployment scenarios.

2.2. Nordic Wind Installation Method

The Nordic Wind installation method introduces an alternative approach to floating wind turbine deployment by combining onshore turbine assembly with offshore float-over installation onto a pre-installed floating foundation. In this concept, the wind turbine generator (WTG) is fully assembled onshore, independently of the floating foundation fabrication and installation schedule. The complete turbine assembly is subsequently loaded onto a dedicated installation vessel equipped with motion-compensated gripper and transfer systems.
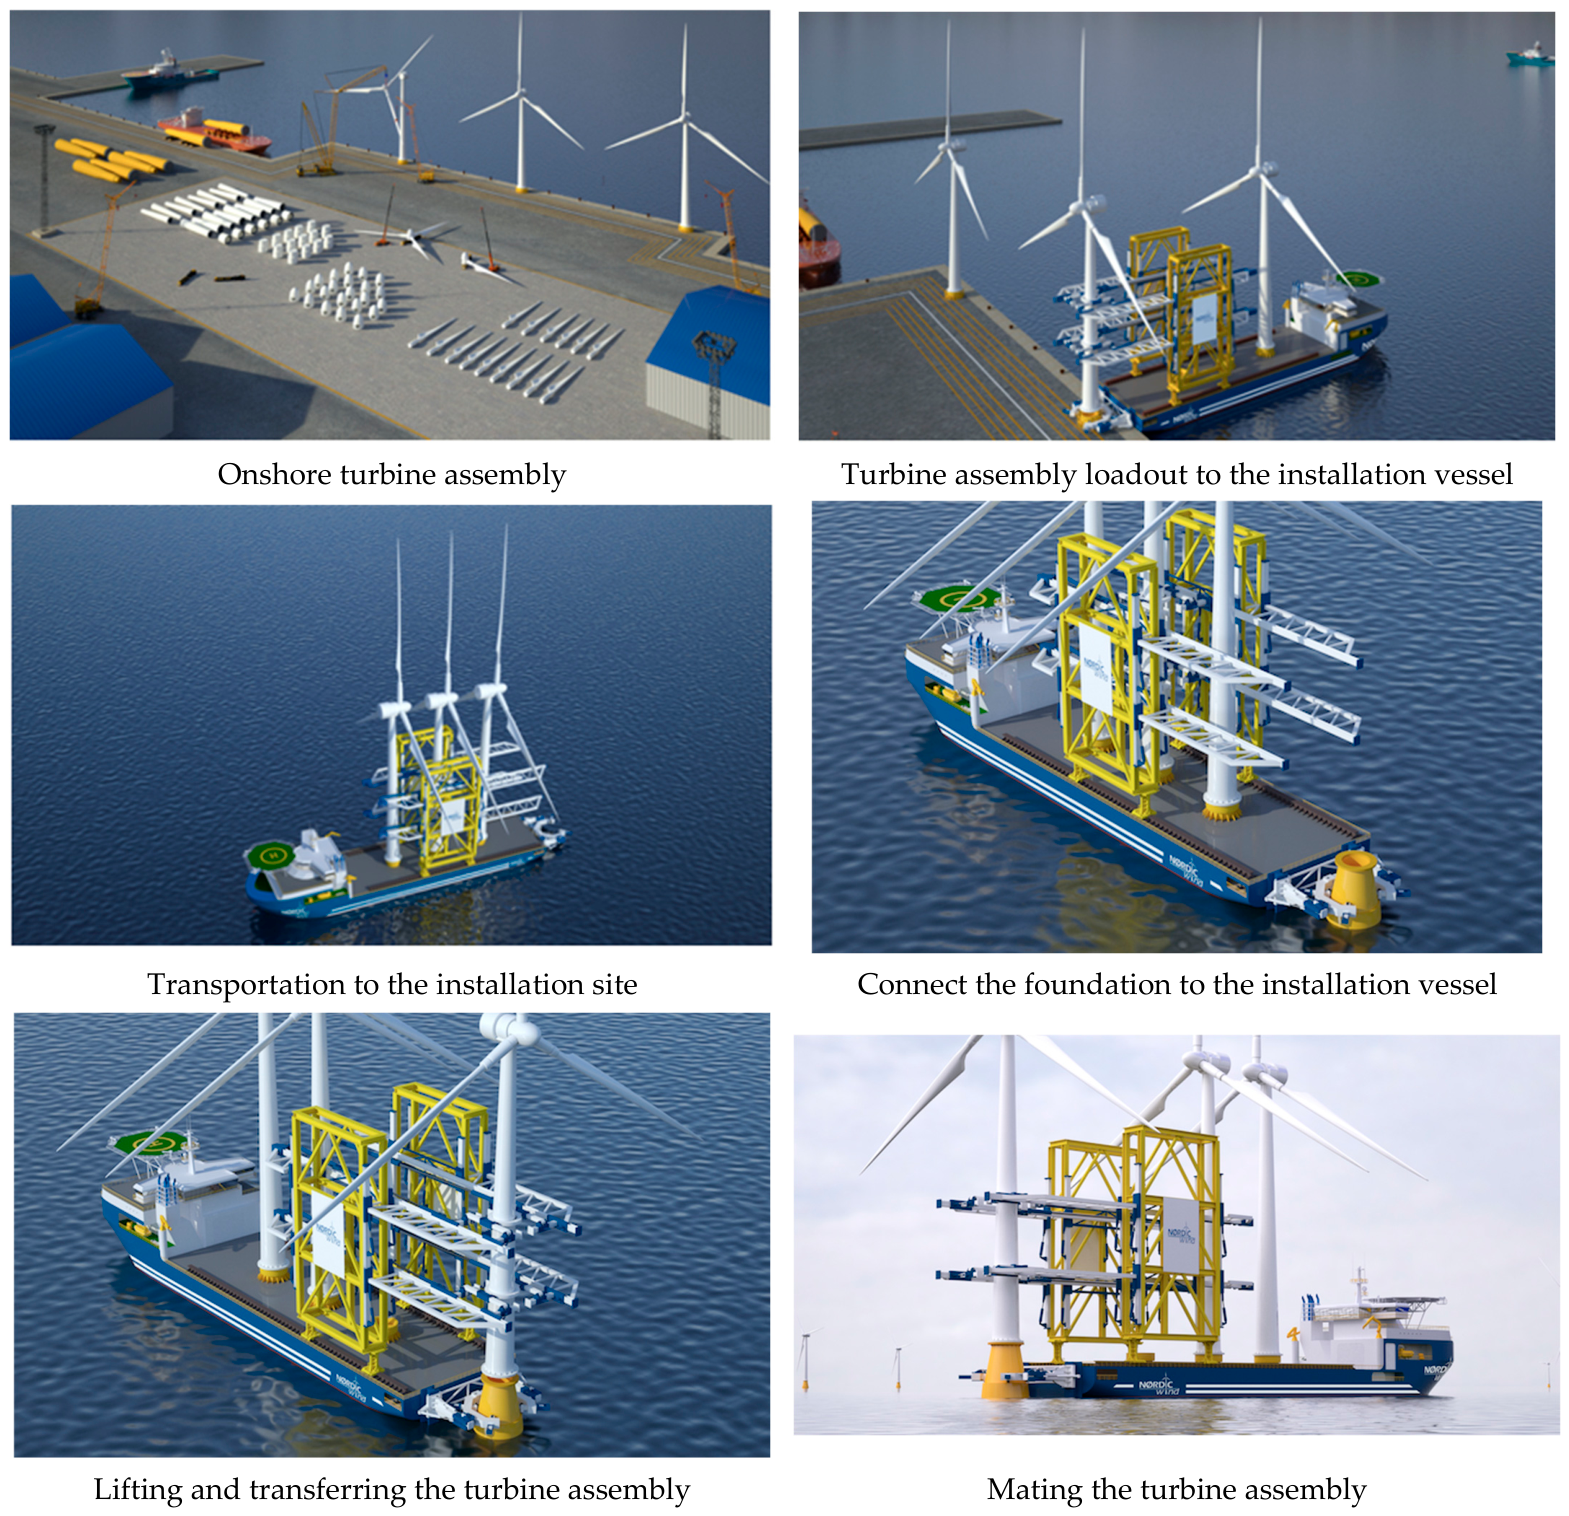
In contrast to conventional towing-based approaches, where the turbine and foundation are integrated prior to transportation, the floating foundation in the Nordic Wind method is installed offshore separately. The installation vessel then transports the fully assembled WTG to the offshore site, where installation is performed through a controlled float-over operation. This configuration removes the need for offshore heavy-lift crane operations during turbine installation. The installation sequence is illustrated in Figure 3 and can be summarised as follows:
  • Onshore full assembly of the WTG;
  • Loadout of the WTG onto the installation vessel;
  • Transportation to the offshore site;
  • Positioning of the installation vessel relative to the floating foundation;
  • Connection using a motion-compensated gripper system;
  • Float-over transfer and mating of the WTG onto the spar foundation.
The main distinguishing characteristics of the Nordic Wind method can be summarised as follows:
  • Separation of turbine and foundation installation processes;
  • Offshore integration of a fully assembled WTG;
  • Use of a motion-compensated gripper system for controlled connection;
  • Elimination of offshore heavy-lift crane dependency during installation.
Overall, the Nordic Wind method represents an alternative installation configuration that shifts the integration phase offshore, under controlled motion conditions, while maintaining flexibility in the sequencing of construction and installation activities. At present, the Nordic Wind method remains a conceptual installation approach that has not yet been commercially demonstrated at full scale; accordingly, its performance is evaluated in this study using a simulation-based logistics framework. Several enabling technologies required for the proposed approach, including motion-compensated handling systems, dynamic positioning vessels, and offshore float-over operations, are already established within the offshore oil and gas sector; however, their integrated application to floating wind turbine installation remains at a pre-commercial stage.

3. Case Study and Simulation Framework

To evaluate the implications of the installation methodologies described in Section 2, a case study-based simulation approach is adopted. The objective is to assess the performance of both conventional and Nordic Wind installation strategies under realistic project conditions, considering logistics, environmental constraints, and operational limitations. The analysis builds upon previous work addressing the dynamic behaviour of the Nordic Wind installation method and the definition of motion-based operational limits.
In the present study, these aspects are incorporated within a logistics simulation framework to enable the evaluation of installation duration, weather downtime, and operational sequencing across multiple project scenarios. The following subsections describe the case study definition, including site characteristics, environmental data, and vessel assumptions, as well as the simulation framework used to model installation activities.

3.1. Case Study Definition

The objective is to enable a consistent comparison between the conventional towing-based installation method and the Nordic Wind installation concept under equivalent logistical and environmental conditions. The case study considers a floating wind farm comprising multiple WTGs installed on spar-type floating foundations.
The selection of a spar-based configuration is motivated by its relevance to existing commercial-scale floating wind projects and its sensitivity to installation constraints related to draft, stability, and offshore operations.
The main project parameters, including turbine rating, number of units, water depth, and key logistical assumptions, are summarised in Table 1. These parameters are selected to be representative of current commercial-scale floating wind developments and are applied consistently across all simulation scenarios.

3.2. Environmental Conditions

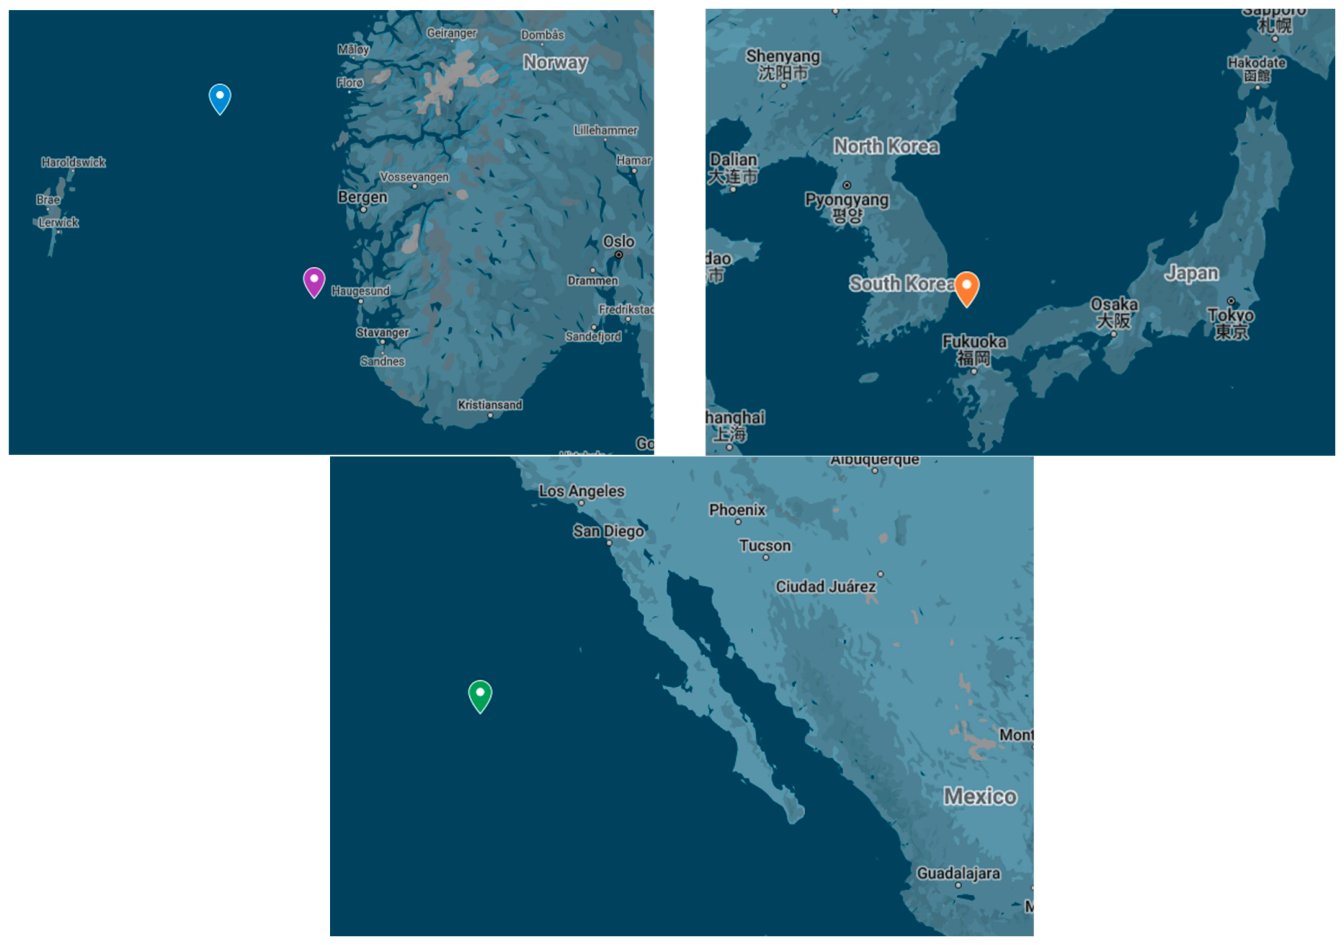
A set of geographical locations is considered to capture a range of environmental conditions relevant to floating offshore wind deployment. The selected locations, shown in Figure 4, represent different wave climates and operational environments, allowing for the assessment of installation performance under varying metocean conditions. The environmental conditions are incorporated into the analysis through the use of hindcast metocean datasets representing the selected case study locations.
The metocean dataset consists of 35 years of hourly hindcast time series. For each case study location, environmental parameters are extracted at the nearest available offshore data point and include the variables required for the operability assessment, namely wind speed, significant wave height Hs, peak wave period Tp, wind speed Vw, and current, where applicable. The use of a multi-decadal hourly hindcast dataset provides a consistent basis for evaluating weather windows, weather downtime, and seasonal operability across all selected locations. These time series are used directly in the discrete-event simulation to determine whether the environmental conditions at each time step satisfy the operational limits defined for each installation activity.
Wave-heading effects are not recalculated explicitly at each time step within the logistics simulation. Instead, their influence is incorporated through the response-based operational limits adopted from the preceding dynamic analysis study. In that analysis, allowable installation conditions were derived by considering the response of the installation system under different wave headings and defining operability envelopes in terms of allowable Hs-Tp combinations for the critical installation phases. Therefore, the present simulation applies these Hs-Tp-based limits to determine activity feasibility and weather downtime, with the influence of wave heading already embedded in the adopted operational criteria.
Rather than relying on simplified environmental parameters, the analysis adopts a time-dependent approach in which installation activities are evaluated continuously against predefined operational limits. Weather downtime is therefore quantified based on periods during which environmental conditions exceed the allowable limits for specific installation operations. The environmental parameters are thus used to evaluate weather-dependent operability and quantify weather downtime during installation operations.

3.3. Marshalling Port Selection

In addition to environmental inputs, logistical parameters related to marshalling port selection are explicitly defined, as they represent a key factor influencing installation efficiency. Port selection is based on criteria including proximity to the wind farm, available water depth, quay capacity, and infrastructure suitability for assembly and loadout operations. These parameters directly affect transportation time, vessel utilisation, and installation sequencing.
To ensure a consistent and unbiased comparison between installation methodologies, the same marshalling port is assumed for both the conventional and Nordic Wind installation approaches in this study. This assumption allows the analysis to isolate the impact of installation methodology on logistics performance and weather downtime, without introducing additional variability associated with port selection.
For conventional installation methods, port selection is typically constrained by the requirement for deep-water access and heavy-lift capabilities to support the integration of the floating foundation and turbine. In contrast, the Nordic Wind installation method offers greater flexibility in port selection, as turbine assembly is decoupled from the floating foundation and can be performed independently of foundation availability. The distance between the selected port and the installation site is incorporated as a key input parameter in the simulation model. This distance directly influences transportation duration and contributes to the overall installation timeline.
The representative marshalling port-to-site transit distances adopted for each case study are reported in Table 1 and are used to calculate transit durations for towing and installation vessel operations. For the conventional towing method, a loaded tow-out speed of 3 knots is adopted for the fully assembled floating turbine system, while a return transit speed of 10 knots is assumed for the towing vessel or AHTS when returning without tow. For the Nordic Wind method, a representative transit speed of 10 knots is adopted for the dedicated installation vessel for both loaded and return transits. These assumptions are applied consistently across all case studies to provide a transparent and comparable basis for estimating transit-related installation time.

3.4. Simulation Model

The installation process is modelled using a time-series-based discrete event simulation (DES) framework, in which the overall installation campaign is represented as a sequence of discrete time-dependent activities. This approach follows established practice for weather downtime and operability assessment, where installation operations are evaluated against time-varying environmental conditions derived from hindcast datasets.
The simulation is driven by met-ocean time series corresponding to the selected case study locations, with environmental conditions defined at discrete time intervals Δt. At each time step t, the feasibility of executing a given installation activity is evaluated by comparing the environmental conditions with pre-defined operational limits.
An activity is considered feasible when the environmental constraints are satisfied, which can be expressed as:
f t = 1 ,   i f   E c t E l i m i t ,
f t = 0 ,   o t h e r w i s e
where f(t) is a binary feasibility function, Ec(t) represents the time-dependent environmental conditions, and Elimit defines the operational limits for the considered activity.
The progress of installation activities is governed by this feasibility condition. When f(t) = 1, the activity proceeds and contributes to active operational time. When f(t) = 0, the activity is temporarily halted, and the corresponding time increment is recorded as weather downtime. The total weather downtime is therefore expressed as
T W D T = t × 1 f t ,
while the active operational time is defined as
T a c t i v e = t × f t ,
and the total installation duration is therefore given by
T t o t a l = T a c t i v e + T W D T
In the DES implementation, each installation methodology is represented as an ordered sequence of activities:
A = a 1 ,   a 2 , , a n
where each activity ai is assigned a required execution duration di and a set of limiting environmental criteria Li. At each simulation time step Δt, the environmental state vector E(t), including the relevant metocean parameters for the active activity, is compared with the corresponding operational limits Li. The feasibility of activity ai is therefore defined as:
f i t = 1 ,   E t   L i 0 , E t > L i
where f i t   indicates that the activity can proceed and f i t = 0   indicates that the activity is weather-restricted. The accumulated progress of each activity is updated as:
p i t + t = p i t + t f i t
where p i t is the accumulated execution time of activity ai. Once p i t di, the activity is considered completed, and the simulation advances to the next activity in the predefined installation sequence. This procedure is repeated until all activities required for the installation campaign are completed.
The continuity classification assigned to each activity determines how weather interruptions are treated in the simulation. For interruptible activities, accumulated progress is retained when environmental limits are exceeded, and the activity resumes from the same progress state once suitable conditions return. For continuous activities, the specified duration represents the minimum uninterrupted weather window required for safe execution. If environmental limits are exceeded before the activity is completed, the activity is considered interrupted and must restart when a new suitable weather window becomes available. This distinction is applied to reflect the practical difference between operations that can be paused, such as port-side preparation or assembly activities, and marine operations that require continuous execution, such as towing, offshore hook-up, transit, or mating operations.
For each installation methodology, the process is defined as a sequence of events including loadout, transportation, positioning, connection and installation operations. The base duration for each activity is defined using representative engineering values derived from published offshore installation studies, reported marine operations practices and information from commercial-scale floating wind deployment. The effective execution time is determined by the availability of suitable weather conditions. In practice, these durations and limiting operational criteria can vary significantly depending on turbine rating, floater configuration, vessel capabilities, and site-specific environmental conditions, all of which influence offshore operability, handling complexity, and allowable weather limits. The full definition of activities, durations, and corresponding limiting environmental criteria adopted in this study is summarised in Table 2. The installation sequence differs between the two methods considered. In the conventional towing-based method, the floating structure is assembled and towed from the marshalling port to the offshore site, followed by hook-up and commissioning operations. In contrast, the Nordic Wind method decouples turbine and foundation installation, where the floating foundation is installed separately, and the WTG is transported and installed offshore using a float-over operation.
Vessel configuration and fleet composition are defined for each installation method. The conventional method typically requires multiple tug vessels to perform towing operations, whereas the Nordic Wind method relies on a dedicated installation vessel equipped with a motion compensation system. Vessel speeds, operational capacities, and availability are assumed constant throughout the simulation.
The operational limits adopted in Table 2 are based on motion-based criteria derived from the dynamic analysis presented in Hassan and Guedes Soares [44], where allowable environmental conditions were established for key installation phases of floating spar wind turbine installation. These limits are applied consistently within the simulation framework to evaluate activity feasibility under time-varying environmental conditions.
To ensure consistent and unbiased comparison, identical environmental conditions, port location, and project configuration are applied to both installation methods. Consequently, differences in installation performance are attributed solely to the installation methodology and associated operational sequences. The simulation is repeated for all selected case study locations and scenarios. The resulting output includes total installation duration, weather downtime, vessel utilisation, and transportation time. These outputs form the basis for the costs assessment and comparative analysis presented in the following sections.

4. Installation Cost Assessment Methodology

4.1. Cost Modelling Approach

The installation cost assessment is performed using a time-based methodology in which total cost is directly linked to the duration of installation activities and vessel utilisation. This approach is consistent with established technical and economical frameworks for offshore wind installation, where vessel day rates and operational time represent the dominant cost drivers. The total installation cost is expressed as:
C t o t a l = i = 1 N ( R i × T i ) +   C m o b + C d e m o b
where Ri is the daily rate of the vessel i, and Ti is the total utilisation time of vessel i, including weather downtime. Cmob and Cdemob represent mobilisation and demobilisation cost, respectively. The operation time Ti is obtained from the simulation framework described in Section 3, in which installation activities are evaluated against time-series environmental conditions. As a result, weather downtime is explicitly captured and directly influences vessel utilisation and total cost, consistent with previous studies on offshore installation planning.

4.2. Vessel Cost

Representative vessel day rates are selected based on values reported in recent offshore wind installation studies and industry assessments [3,44,45,46]. These studies indicate that installation costs are largely governed by vessel type and operational requirements. Typical day rates adopted in this study are:
  • Towing vessels (tugs/AHTS): 50,000 EUR/day;
  • Offshore installation vessels (heavy lift or specialised units): 250,000 EUR/day;
  • Auxiliary and support vessels: 30,000 EUR/day.
These values are consistent with ranges reported in techno-economic analyses and industry reports, where vessel costs are identified as a primary contributor to overall installation expenditure. For the conventional towing method, multiple towing vessels are required for each operation, including primary towing units and supporting vessels for positioning and mooring activities. In contrast, the Nordic Wind installation method relies on a dedicated installation vessel equipped with motion-compensated systems, reducing dependence on large towing spreads during offshore operations.

4.3. Mobilisation and Demobilisation Costs

Mobilisation and demobilisation costs are included to account for the preparation, transit, and contractual initiation of offshore installation vessels prior to and following the execution of installation activities. In contrast to operational costs, which are time-dependent, mobilisation and demobilisation costs are typically treated as fixed lump-sum values per vessel, independent of installation duration. Accordingly, the total mobilisation and demobilisation cost is expressed as:
C m o b / d e m o b =   i = 1 N C m o b , i + C d e m o b , i
where Cmob,i is the mobilisation cost of vessel i, Cdemob,i is the demobilisation cost of vessel i, and N is the number of vessels involved in the installation campaign.
For the purpose of this study, representative mobilisation and demobilisation costs are assigned based on vessel type, reflecting differences in vessel size, operational complexity, and deployment requirements. High-capacity offshore installation vessels, such as the Nordic Wind installation vessel concept, are associated with higher mobilisation costs due to specialised equipment, mobilisation logistics, and transit distances.
Accordingly, a combined mobilisation and demobilisation cost of approximately 2.0 million EUR is assumed for the installation vessel.
For the conventional towing method, mobilisation costs are distributed across multiple vessels within the towing spread. A combined mobilisation and demobilisation cost of 0.3 million EUR is assumed for the primary towing vessel, while auxiliary and assisting vessels are assigned a representative value of 0.2 million EUR per vessel.
These values are consistent with ranges reported in offshore installation cost studies and reflect typical differences between large offshore construction vessels and smaller support units [44,46]. The adopted values are intended to provide a realistic yet generalised representation of mobilisation effort and are applied consistently across all case studies.

4.4. Integration of Weather Downtime

Weather downtime is a critical factor influencing installation cost and is directly incorporated into the cost model through the simulation-derived operation durations. The effective operation time is defined as:
T e f f = T o p e r a t i o n + T d o w n t i m e
where Teff is the planned duration of installation activities, and Tdowntime represents delays caused by environmental conditions exceeding operational limits. This formulation ensures that cost variations between installation methods are directly linked to their respective sensitivity to environmental conditions.

4.5. Campaign-Based Cost Evaluation

The installation cost is evaluated at the project level by considering the full installation sequence across all turbines within each case study. The total project cost is therefore expressed as:
C p r o j e c t = j = 1 M C t u r b i n e , j
where M is the number of turbines in the project. The simulation framework accounts for operational dependencies between turbines, including vessel availability, sequencing constraints, and return cycles for towing vessels. This is particularly relevant for the conventional installation method, where towing vessels must return to port before subsequent operations can proceed. By contrast, the Nordic Wind method enables a more continuous installation sequence, as turbine assembly and offshore installation are decoupled, reducing idle time and improving vessel utilisation.

5. Results and Discussions

5.1. Performance Assessment Framework

This section presents the results of the simulation-based assessment of the two installation methodologies described in Section 2, namely the conventional towing-based approach and the Nordic Wind installation concept. The analysis evaluates installation performance across the defined case study locations (Projects A to D), considering key performance indicators including total installation duration, weather downtime (WDT), and average installation time per turbine. The results are obtained using the time-series-based discrete event simulation framework described in Section 3, in which installation activities are continuously evaluated against site-specific environmental conditions and predefined operational limits. As a result, the influence of metocean variability on installation performance is explicitly captured, enabling a realistic representation of weather-dependent operability.
In order to systematically assess the impact of environmental variability, the results are presented using three representative weather risk levels, defined as P20, P50, and P90 conditions. These percentiles are derived from the statistical distribution of hindcast metocean data and represent different levels of environmental severity. The P20 condition corresponds to relatively favourable weather scenarios with limited exceedance of operational limits, resulting in reduced weather downtime. The P50 condition represents median environmental conditions and provides an estimate of typical installation performance. The P90 condition reflects more adverse weather scenarios, where environmental limits are exceeded more frequently, leading to increased weather downtime and reduced operability.
This percentile-based representation allows the sensitivity of each installation methodology to environmental conditions to be evaluated, providing insight into both expected performance and associated operational risk. In addition, a baseline case excluding weather downtime is included to isolate the intrinsic efficiency of each installation method independent of environmental constraints.
For each project, the analysis includes a comparison of installation duration and efficiency under varying weather risk levels, followed by an assessment of seasonal operability based on monthly installation progress.

5.2. Installation Performance Results

5.2.1. Project A—North Sea

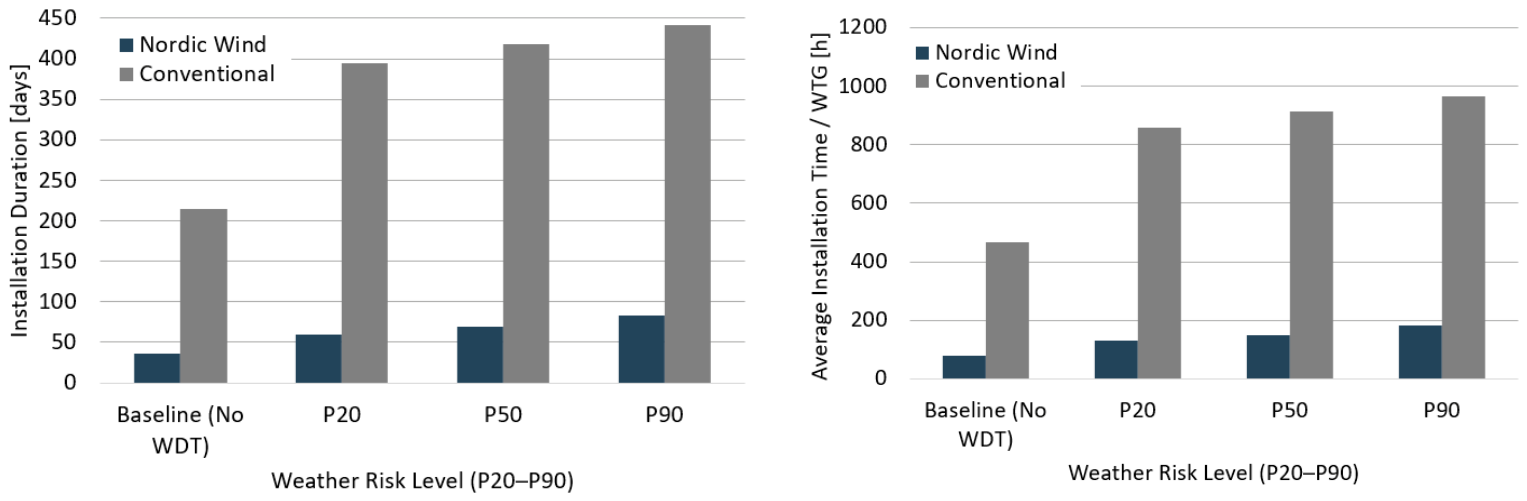
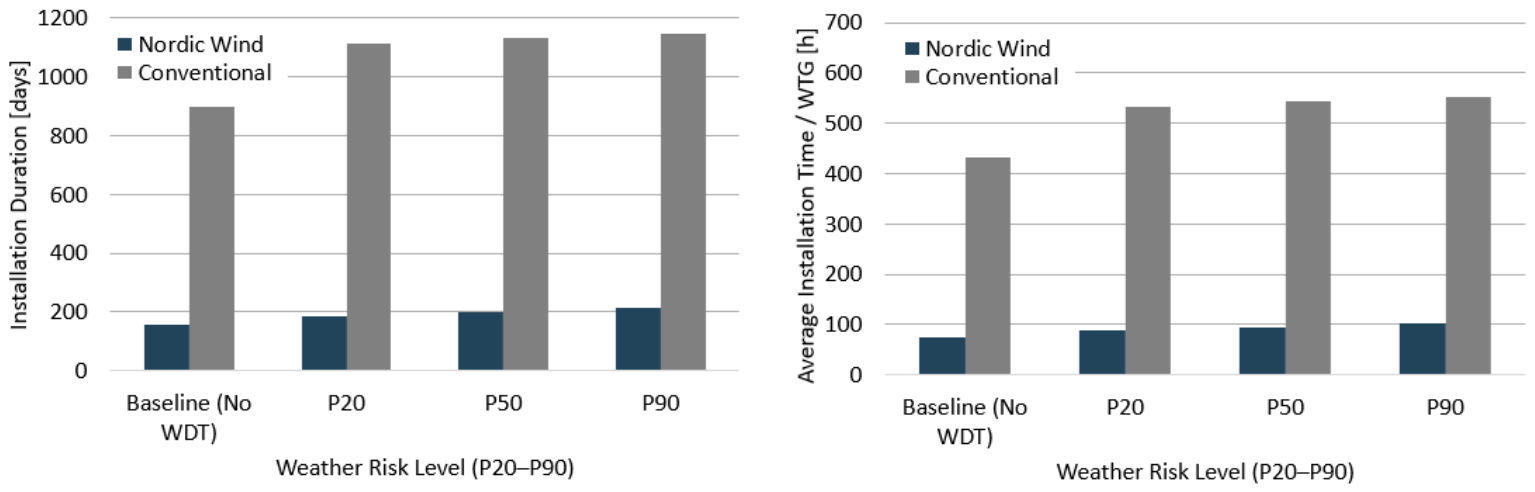
Project A represents a small-scale floating wind development in the North Sea, comprising 11 turbines (88 MW) at water depths of 260 to 300 m and a distance of 140 km from shore. These characteristics result in a combination of transportation effort and exposure to offshore environmental conditions that influence installation performance. The installation performance under varying weather risk levels is presented in Figure 5.
Both installation methods exhibit sensitivity to environmental conditions, as reflected by the increase in installation duration from P20 to P90 scenarios. This behaviour is driven by the need to satisfy operational limits related to wave height, wind speed, and vessel response during critical offshore activities. The observed differences between the methods are therefore not due to the presence or absence of weather sensitivity, but rather to how environmental constraints interact with the respective installation sequences.
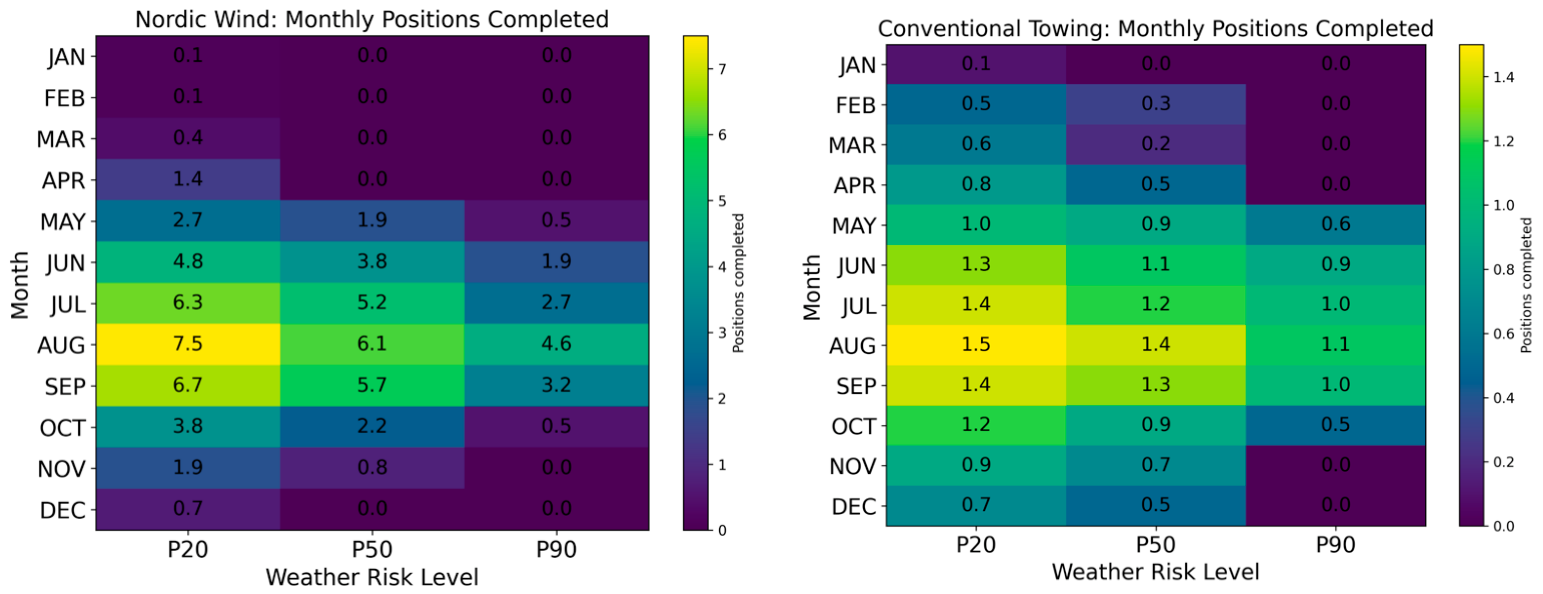
In the conventional towing method, weather limitations affect multiple stages of the operation, including towing, positioning, and offshore hook-up, each of which must be completed sequentially. In the Nordic Wind method, environmental constraints primarily influence specific offshore operations such as connection and mating, while other activities are less directly exposed to offshore conditions. As a result, the impact of weather variability is reflected differently in the overall installation duration for each method. The seasonal operability is illustrated in Figure 6.
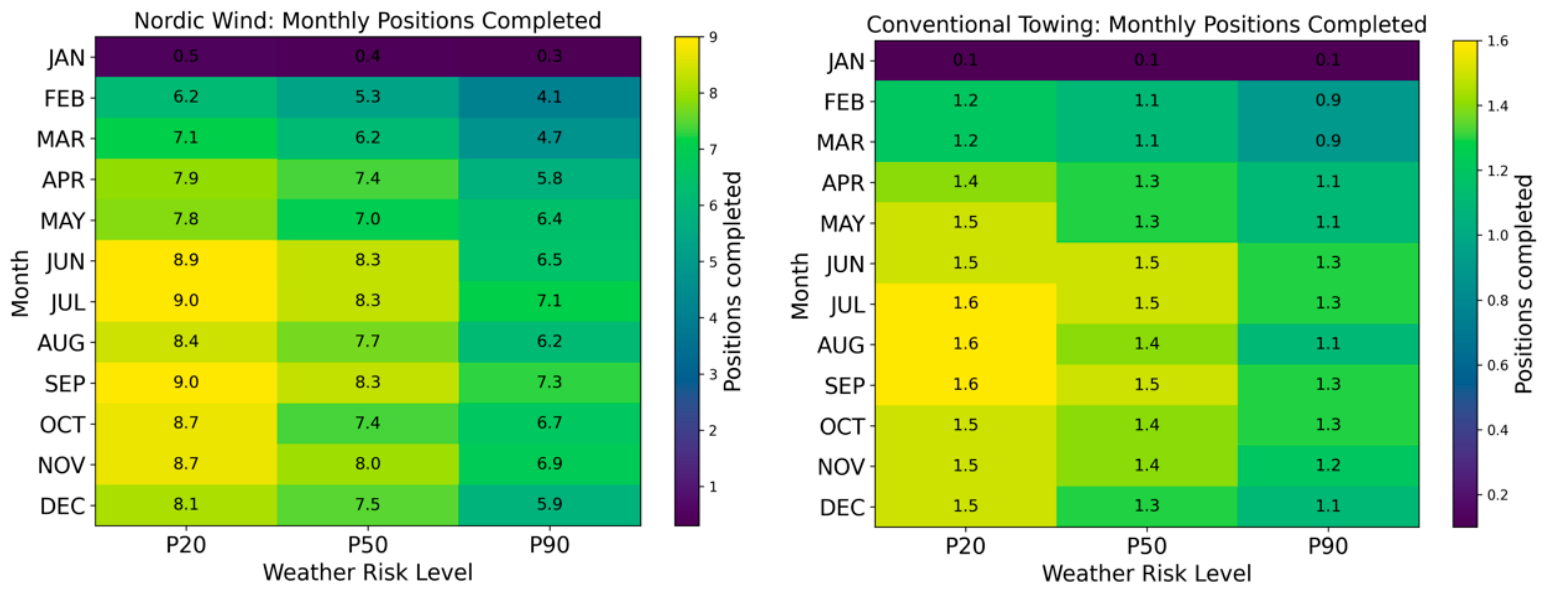
The monthly results indicate clear seasonal variability, with higher operability during summer months and reduced activity during winter. The Nordic Wind method shows more concentrated installation activity during favourable periods, while the conventional method exhibits a more distributed but lower installation rate throughout the year. Overall, the results for Project A highlight the influence of both environmental conditions and installation sequence on project performance, with differences between methods primarily driven by their operational structure and exposure to weather-dependent activities.

5.2.2. Project B—North Sea (Intermediate Scale)

Project B represents an intermediate-scale floating wind development in the North Sea, comprising 25 turbines with a total capacity of 375 MW. Compared to Project A, the reduced distance to shore (32 km) decreases transportation time, while the increased number of turbines leads to a longer installation campaign. The installation performance under varying weather risk levels is presented in Figure 7. The results show an increase in total installation duration from P20 to P90 conditions for both methods, reflecting the influence of environmental constraints on offshore operations. This behaviour is associated with the increasing frequency of exceedance of operational limits under more severe weather conditions, leading to higher weather downtime. Compared to Project A, the larger number of turbines results in a longer installation campaign, increasing cumulative exposure to environmental variability. As a result, weather-related delays occurring during individual installation cycles contribute to variability in overall project duration. The seasonal operability for Project B is illustrated in Figure 8.
The monthly results indicate a clear seasonal pattern, with higher installation activity during periods of favourable environmental conditions and reduced operability during winter months.
The extended campaign duration results in installation activities being distributed over a wider time window, increasing the likelihood of encountering both favourable and adverse weather conditions. These results indicate that installation performance is influenced by both environmental variability and project scale, with longer campaigns increasing cumulative exposure to weather downtime.

5.2.3. Project C—South Korea

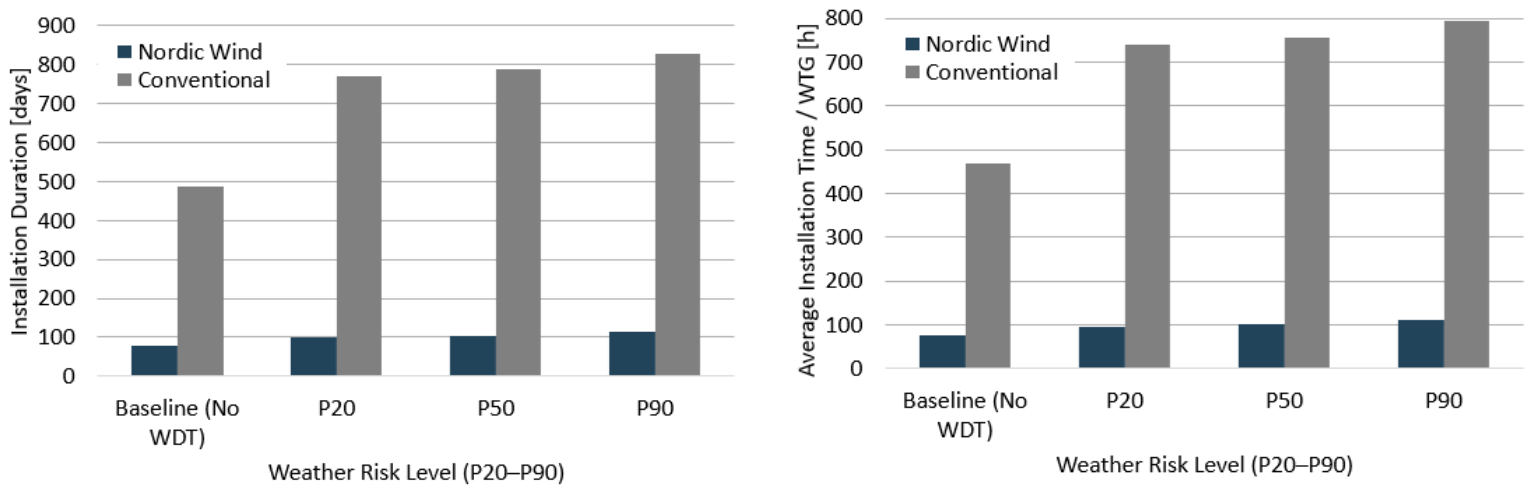
Project C represents a large-scale floating wind development comprising 50 turbines. In contrast to Project B, the results are primarily influenced by the increased project scale rather than a significant change in environmental severity. The installation performance under varying weather risk levels is presented in Figure 9. The results show an increase in total installation duration from P20 to P90 conditions for both installation methods, reflecting the influence of environmental constraints on offshore operations.
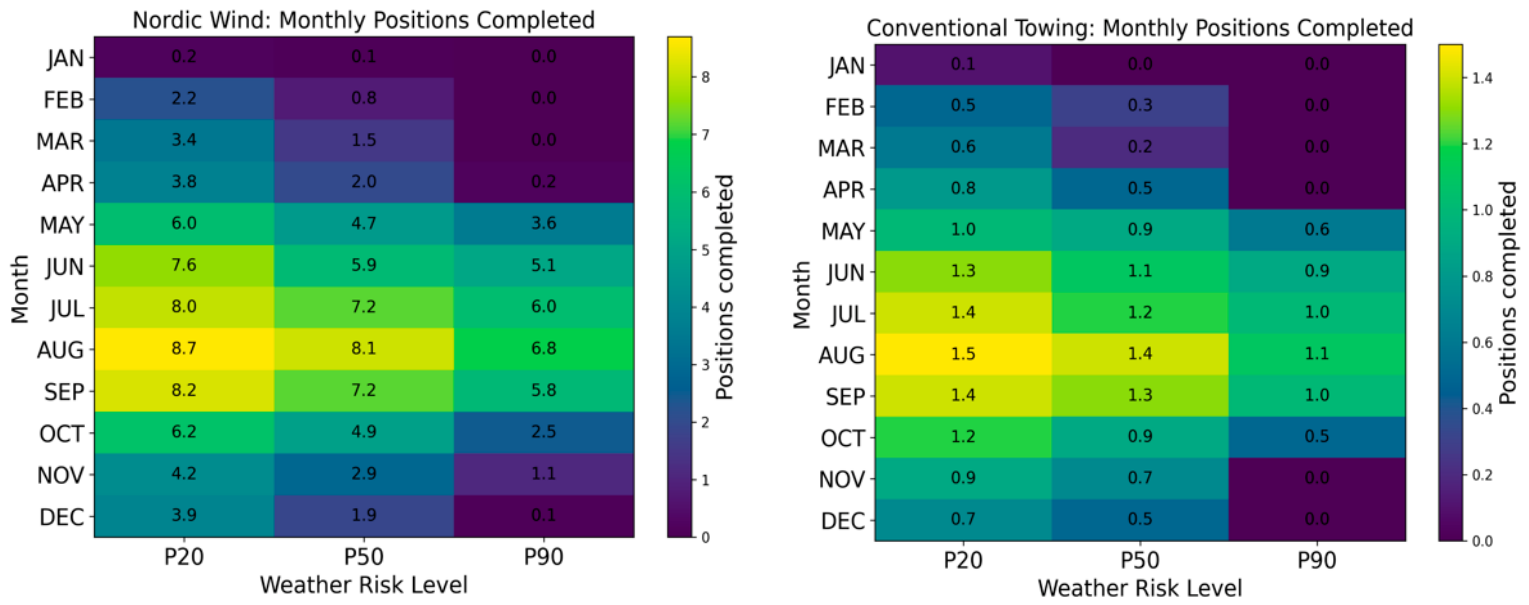
However, when compared to Project B, the increase in total duration is largely attributable to the higher number of turbines rather than a proportional increase in weather-related delays. When normalised per turbine, the installation duration remains comparable or lower than that observed for Project B, indicating that installation performance is not significantly degraded by environmental conditions at this site. Instead, the results suggest that installation efficiency is maintained despite the increased project scale. The seasonal operability for Project C is illustrated in Figure 10. The monthly results indicate that installation activities are distributed over an extended campaign duration due to the larger number of turbines. This leads to increased exposure to seasonal variability; however, the underlying operability remains comparable to Project B, suggesting that environmental conditions are not the dominant limiting factor in this case.

5.2.4. Project D—U.S. West Coast

Project D represents a large-scale installation scenario comparable in size to Project C in terms of the number of turbines; however, it is characterised by more challenging metocean conditions. In particular, the site is influenced by long-period swell, which can induce significant low-frequency motions and impose additional constraints on critical offshore operations such as mating and gripper connection phases.
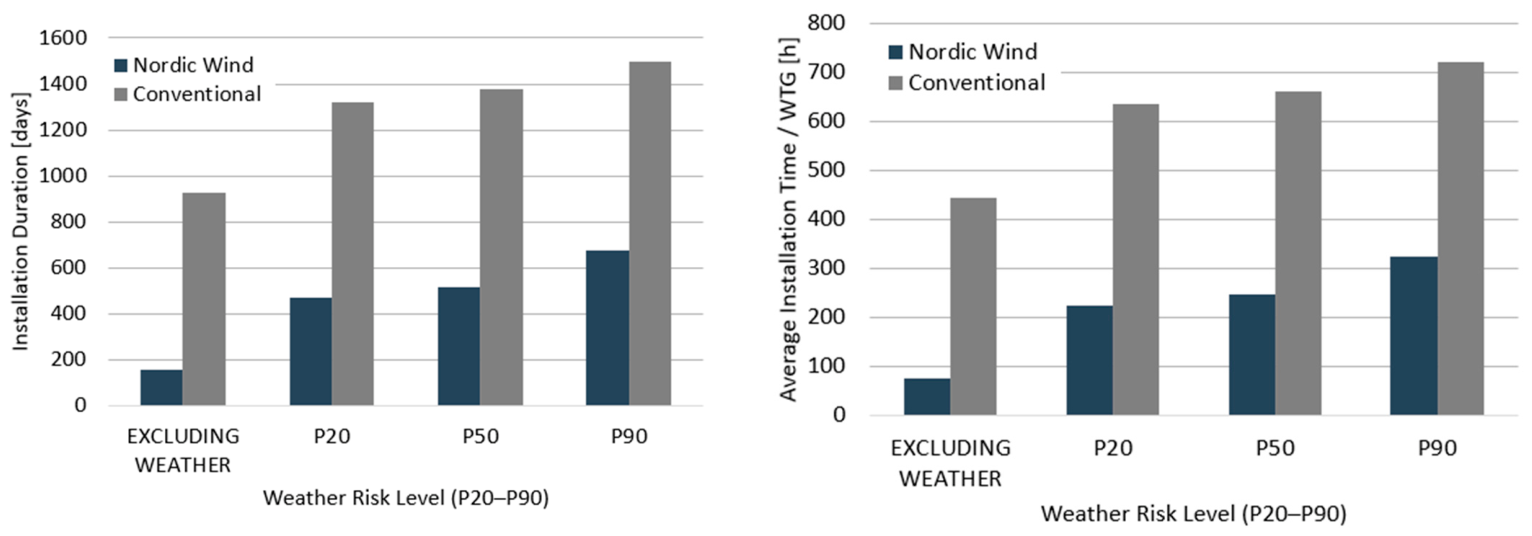
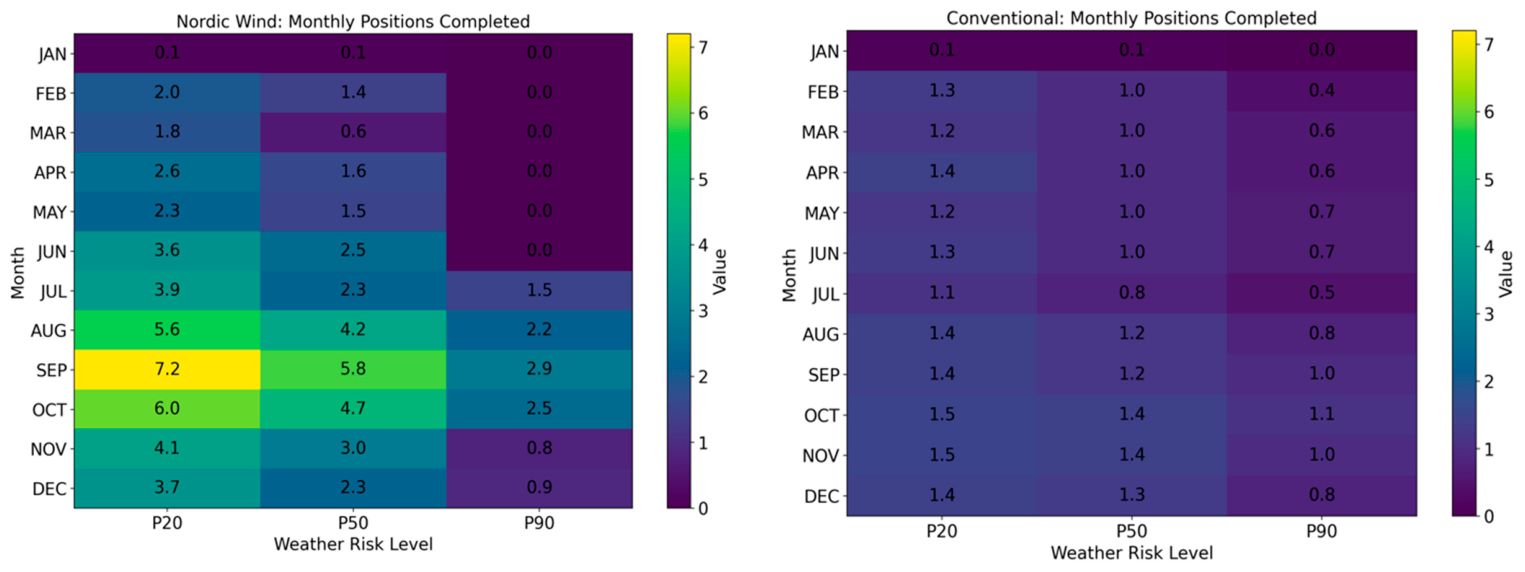
As such, Project D provides a more demanding environment for evaluating installation performance. The results presented in Figure 11 and Figure 12 indicate that both the Nordic Wind and conventional towing methods are sensitive to these environmental conditions, with campaign durations increasing progressively from the baseline case to more conservative weather scenarios.
Despite these challenges, the Nordic Wind method maintains a consistently shorter installation duration compared to the conventional towing approach across all scenarios. For example, under P50 conditions, the campaign duration is reduced from approximately 1375 days for the conventional method to approximately 514 days for the Nordic Wind method.
The difference in performance can be attributed to the fundamentally different installation sequences. While the Nordic Wind method relies on more constrained offshore operations, it benefits from reduced overall exposure time offshore and higher installation rates during favourable weather windows. In contrast, the conventional towing approach, although less sensitive to individual operational constraints, involves significantly longer cumulative offshore durations, which results in consistently extended campaign timelines. The monthly distribution of completed positions further supports this interpretation.
The Nordic Wind method exhibits higher productivity during favourable seasonal periods, particularly in summer months, whereas the conventional method maintains a more uniform but lower installation rate throughout the year. This indicates that the Nordic Wind concept leverages favourable weather windows more effectively, even in environments characterised by long-period swell. Overall, Project D demonstrates that although more challenging environmental conditions introduce additional constraints, particularly for precision offshore operations, the Nordic Wind method remains competitive and achieves shorter overall installation durations. This highlights the importance of considering both operational sensitivity and total offshore exposure when evaluating installation strategies under demanding metocean conditions.

5.3. Cost Analysis Results

The installation cost results are derived directly from the campaign durations presented in Section 5.2, using the cost model defined in Section 4. The installation cost results are therefore directly linked to the cumulative vessel utilisation time obtained from the simulation framework, including weather-related delays and operational waiting periods. As the cost formulation is based on vessel day rates and total utilisation time, the resulting cost trends closely follow those observed for installation duration, with weather downtime acting as the primary driver of cost variability.
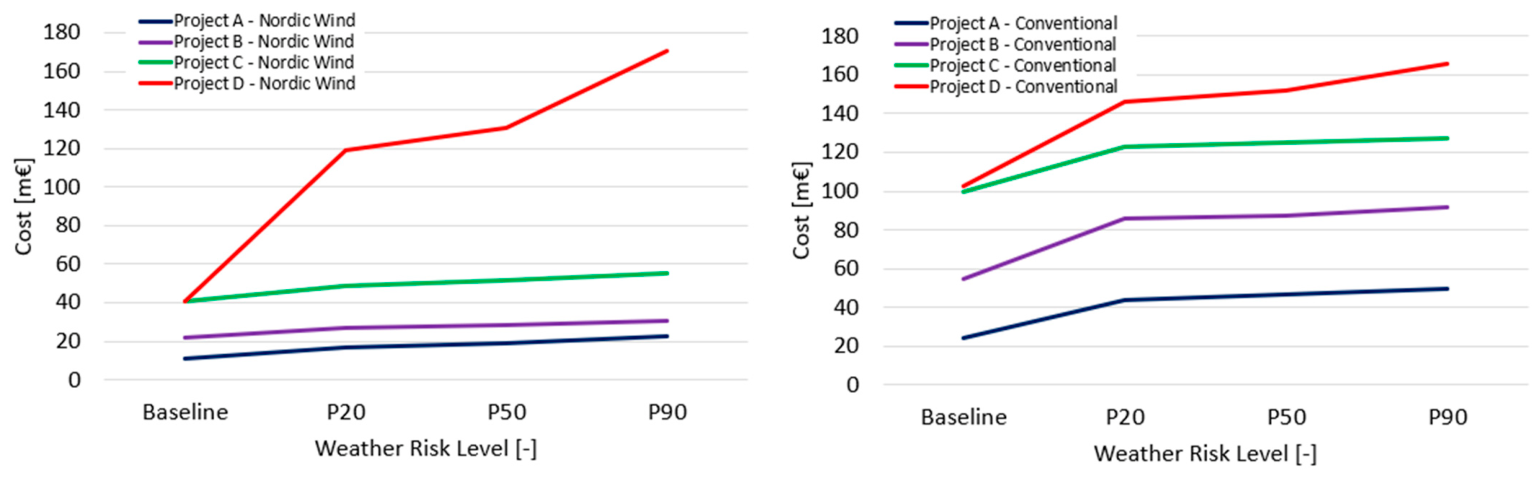
To provide an overview of cost behaviour across all case studies, Figure 13 presents the variation in total installation cost with increasing weather risk levels for both the Nordic Wind and conventional towing methods. Across all projects, total installation cost increases progressively from the baseline case (excluding weather downtime) to more conservative weather scenarios (P20, P50, and P90). This behaviour reflects the increasing frequency of exceedance of operational limits under more severe environmental conditions, leading to extended vessel utilisation time.
However, the magnitude and rate of cost increase differ between the two installation methods. The conventional towing method exhibits a relatively gradual increase in cost across the different weather scenarios, whereas the Nordic Wind method shows a more pronounced cost escalation, particularly for larger projects and under more severe environmental conditions. As illustrated in Figure 13, this difference becomes more evident for Project D, where the cost increase for the Nordic Wind method is significantly steeper compared to the other case studies. This behaviour is directly linked to the underlying cost structure of each installation approach. The Nordic Wind method relies on a high-capacity installation vessel with a significantly higher daily rate, making the total cost highly sensitive to increases in campaign duration. In contrast, the conventional towing method distributes cost across multiple lower-rate vessels, resulting in a more moderate increase in total cost for each additional day of operation.

5.3.1. Cost Performance Across Projects A–C

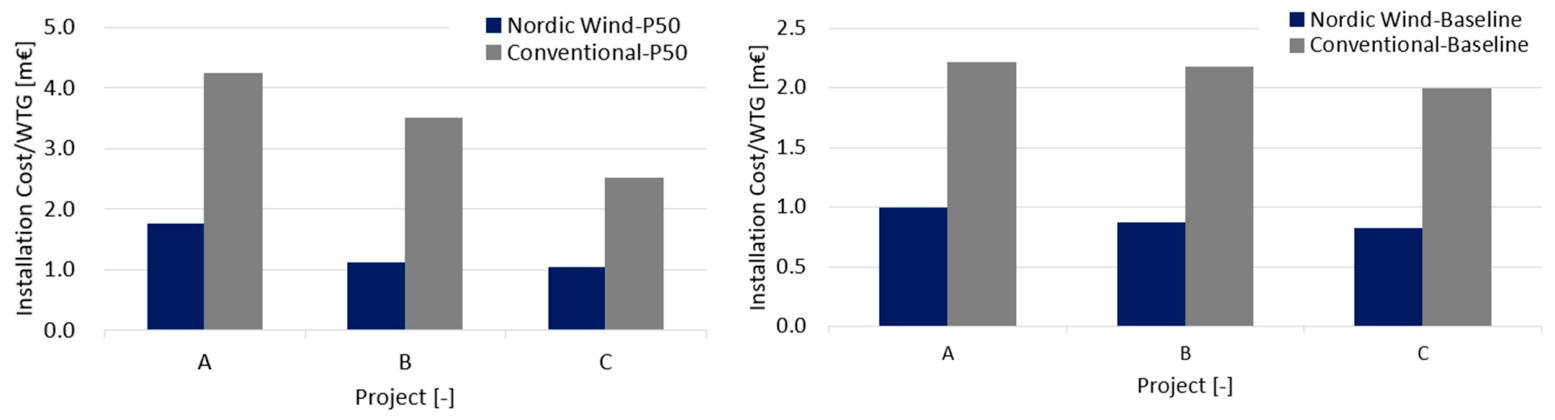
For Projects A, B, and C, the Nordic Wind method consistently results in lower installation costs across all evaluated conditions. This trend is clearly demonstrated in Figure 14, which presents the installation cost per turbine under both baseline and P50 conditions. The reduced cost is primarily driven by the shorter campaign durations identified in Section 5.2. In these projects, the more efficient installation sequence of the Nordic Wind method leads to reduced overall vessel utilisation, which offsets the higher daily rate of the installation vessel.
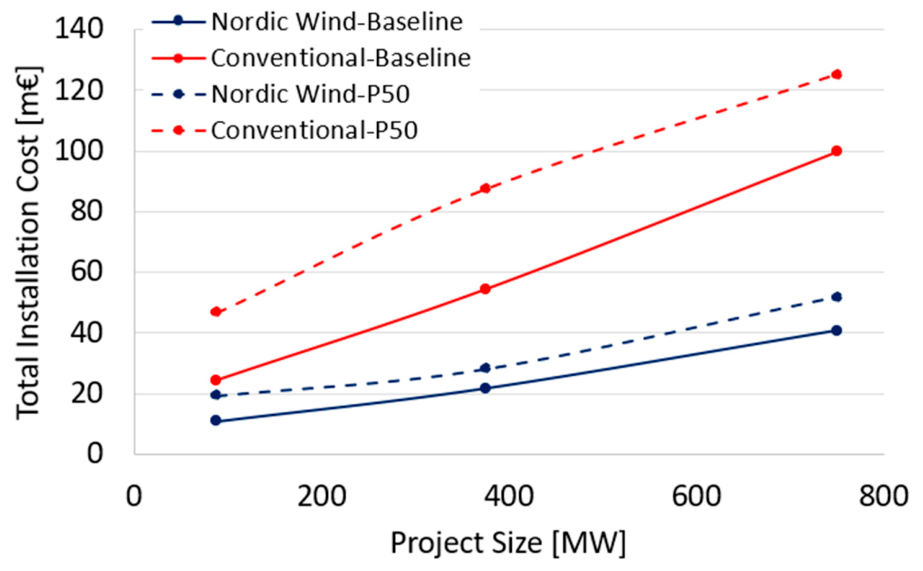
In Project A, the relatively small scale of the development limits cumulative weather exposure, allowing the efficiency gains of the Nordic Wind installation concept to translate directly into cost savings. As shown in Figure 14, the cost difference between the two methods is most pronounced on a per-turbine basis, indicating that operational efficiency is the dominant driver under limited exposure conditions. In Project B, the increase in the number of turbines leads to a longer campaign duration; however, the cost advantage of the Nordic Wind method is maintained. This behaviour indicates that the method scales effectively under moderate environmental conditions, with installation efficiency continuing to govern total cost. This scaling behaviour is further illustrated in Figure 15, where total installation cost increases with project size for both methods, while maintaining a consistent cost gap in favour of the Nordic Wind approach.
In Project C, the project scale increases further, but the cost behaviour remains consistent with that observed for Project B. As shown in Figure 15, the increase in total installation cost is primarily associated with the larger project size rather than a disproportionate increase in weather-related delays. Consequently, the relative cost difference between the two methods remains largely governed by differences in installation duration rather than environmental sensitivity.

5.3.2. Cost Performance in Project D

Project D exhibits a distinct cost behaviour compared to Projects A to C due to the more challenging metocean conditions associated with this location. As discussed in Section 5.2.4, the presence of long-period swell introduces additional constraints on offshore operations, particularly for activities requiring controlled motion such as connection and mating.
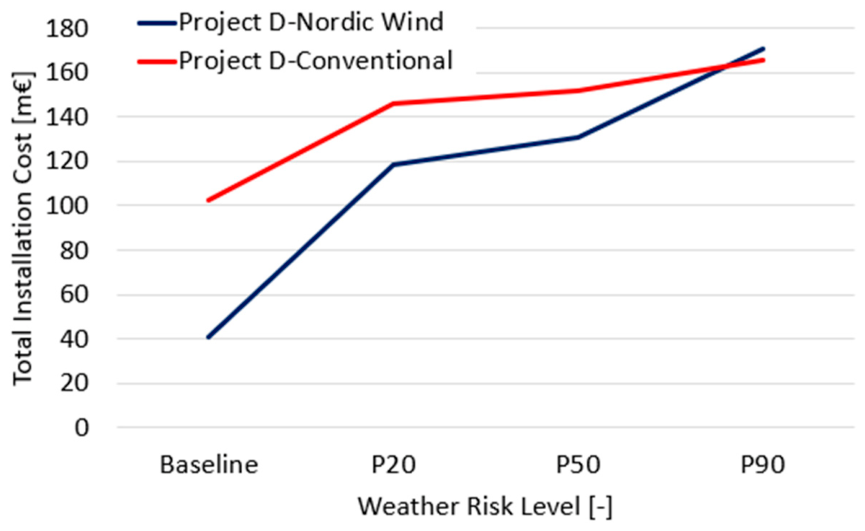
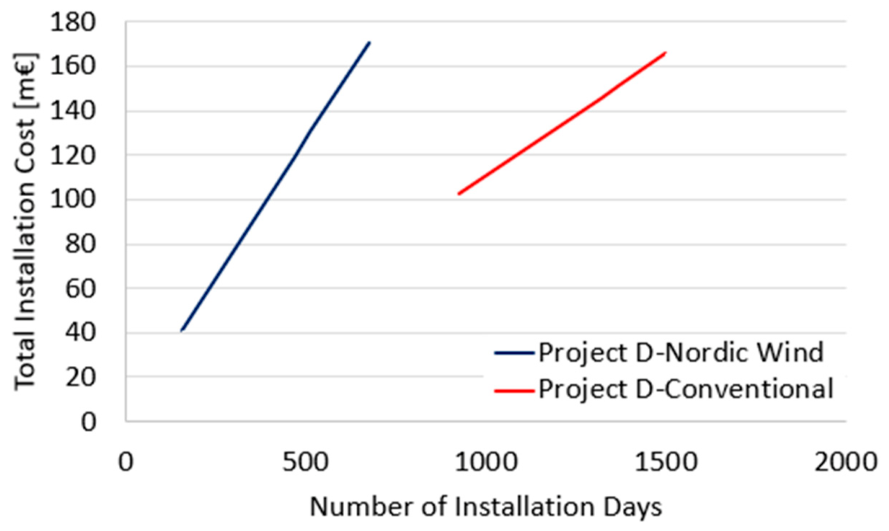
The resulting impact on installation cost is illustrated in Figure 16. Under baseline conditions, the Nordic Wind method maintains a significantly lower total installation cost due to its shorter campaign duration. However, as weather severity increases from baseline to P20, P50, and P90 conditions, the cost difference between the two installation methods is progressively reduced. This trend reflects the increasing influence of environmental constraints on offshore operations, particularly for the Nordic Wind method. This behaviour is directly linked to the corresponding increase in campaign duration. Based on the results presented in Section 5.2, the Nordic Wind installation campaign increases from approximately 155 days under baseline conditions to 514 days (P50) and 675 days (P90). In comparison, the conventional towing method increases from approximately 925 days (baseline) to 1375 days (P50) and 1500 days (P90).
While both methods experience a substantial increase in duration, the relative increase is significantly larger for the Nordic Wind method. The relationship between campaign duration and installation cost is further illustrated in Figure 17. Due to the higher daily rate of the installation vessel, the Nordic Wind method exhibits a steeper cost increase with increasing duration, indicating a higher sensitivity to weather-induced delays. In contrast, the conventional towing method demonstrates a more moderate cost escalation despite longer overall campaign durations.
Despite this increased sensitivity, the Nordic Wind method maintains shorter campaign durations across all scenarios, which limits the extent of cost convergence between the two methods. As shown in Figure 16, although the cost gap narrows under severe weather conditions, it is not fully eliminated. The results therefore indicate that while environmental severity reduces the relative cost advantage of the Nordic Wind method, it does not negate the overall benefit associated with reduced offshore exposure.

6. Conclusions

This study evaluates two installation methodologies for floating offshore wind turbines: the conventional towing-based approach and the Nordic Wind installation concept. A simulation-based logistics framework was developed to evaluate installation performance under realistic environmental conditions, explicitly accounting for weather downtime, operational constraints, and vessel utilisation. The analysis was applied across four case study projects (A to D), representing different scales and metocean environments.
The results demonstrate that installation performance is strongly governed by the interaction between environmental conditions, project scale, and installation methodology. Across all projects, both methods exhibit sensitivity to weather conditions, with installation duration increasing from favourable (P20) to more severe (P90) scenarios. This reflects the inherent dependence of offshore installation activities on metocean limits and available weather windows.
For Projects A–C, which represent mild to moderate environmental conditions and increasing project scale, the Nordic Wind method consistently achieves shorter installation durations compared to the conventional towing approach. This behaviour is primarily attributed to reduced offshore exposure and more efficient utilisation of favourable weather windows. As project scale increases, these advantages become more pronounced, highlighting the importance of installation efficiency for large-scale developments.
Project D represents a more challenging installation environment, characterised by long-period swell conditions that introduce additional constraints during critical offshore operations such as connection and mating. Under these conditions, both methods experience increased installation durations and greater variability. The Nordic Wind method shows higher sensitivity to these environmental constraints; however, it maintains shorter overall campaign durations across all scenarios, demonstrating that reduced offshore exposure remains a key advantage even in more demanding environments.
The cost assessment confirms that installation duration is the dominant driver of total installation cost. For Projects A to C, the Nordic Wind method consistently results in lower total installation costs due to reduced campaign durations.
In Project D, the cost difference between the two methods decreases under more severe weather scenarios, reflecting the increased sensitivity of offshore operations to environmental conditions. Nevertheless, the Nordic Wind method remains competitive across all evaluated scenarios. Overall, the results highlight a fundamental trade-off between operational efficiency and environmental sensitivity. The Nordic Wind method improves installation efficiency by reducing offshore exposure, while the conventional towing approach provides more stable operability across a wider range of conditions. The selection of the installation strategy should therefore consider both project characteristics and environmental conditions.
Future work should extend the present framework to include the full installation logistics chain and expand the cost assessment to account for full wind farm development elements, such as subsea cables and supporting infrastructure, which would enable a more comprehensive evaluation of project-level economics.


Author Contributions

M.H.: Methodology, formal analysis, visualisation, writing—original draft. C.G.S.: writing—review, Supervision. All authors have read and agreed to the published version of the manuscript.

Funding

This research was funded by [Fundação para a Ciência e Tecnologia] grant number [UID/00134/2025].

Data Availability Statement

The study is based on environmental hindcast wave data, project-specific input parameters, and numerical simulation results generated by the authors. The hindcast data are obtained from established metocean datasets, while the simulation results were produced using the numerical modelling framework described in this manuscript. Due to confidentiality constraints, certain project-specific input data cannot be made publicly available. However, the modelling methodology and assumptions are described in sufficient detail to allow reproducibility of the results.

Acknowledgments

This work contributes to the Strategic Research Plan of the Centre for Marine Technology and Ocean Engineering (CENTEC), which is financed by the Portuguese Foundation for Science and Technology (Fundação para a Ciência e Tecnologia—FCT) under contract UID/00134/2025 (https://doi.org/10.54499/UID/00134/2025).

Conflicts of Interest

The authors declare no conflicts of interest.

Nomenclature

AHTSAnchor Handling Tug Supply
CAPEXCapital Expenditures
DESDiscrete Event Simulation
DPDynamic positioning
FOWTFloating offshore wind turbine
MWMegawatt
Nordic WindName of novel installation method
WDTWeather Downtime
WTGWind turbine generator
HsSignificant wave height
TpPeak wave period
θWave heading
VwWind Speed
tTime index
ΔtTime step interval
f(t)Binary feasibility function
Ec(t)Time-dependent environmental condition
ElimitOperational environmental limit
TdowntimeWeather downtime
CmobMobilisation cost
RiDaily rate of vessel i
TiTotal utilisation time of vessel i

References

  1. National Renewable Energy Laboratory (NREL). Offshore Wind Market Report: 2024 Edition; NREL: Golden, CO, USA, 2024. [Google Scholar]
  2. International Renewable Energy Agency (IRENA). Renewable Power Generation Costs in 2023; IRENA: Abu Dhabi, United Arab Emirates, 2024. [Google Scholar]
  3. Carbon Trust. Floating Offshore Wind: Market and Technology Review; Carbon Trust: London, UK, 2015. [Google Scholar]
  4. Offshore Renewable Energy (ORE) Catapult. Floating Offshore Wind: Cost Reduction Pathways to Subsidy-Free; ORE Catapult: Glasgow, UK, 2021. [Google Scholar]
  5. Poulsen, T.; Hasager, C.B. How expensive is expensive enough? Opportunities for cost reductions in offshore wind energy logistics. Energies 2016, 9, 437. [Google Scholar] [CrossRef]
  6. Kaiser, M.J.; Snyder, B. Offshore Wind Energy Installation and Decommissioning Cost Estimation in the U.S. Outer Continental Shelf; Energy Research Group: Baton Rouge, LA, USA, 2010. [Google Scholar]
  7. Thomsen, K.E. Offshore Wind: A Comprehensive Guide to Successful Offshore Wind Farm Installation; Academic Press: Cambridge, MA, USA, 2014. [Google Scholar]
  8. Lange, K.; Rinne, A.; Haasis, H.D. Planning maritime logistics concepts for offshore wind farms: A newly developed decision support system. Lect. Notes Comput. Sci. 2012, 7555, 142–158. [Google Scholar]
  9. Ait-Alla, A.; Quandt, M.; Lütjen, M. Simulation-based aggregate installation planning of offshore wind farms. Int. J. Energy 2013, 7, 23–30. [Google Scholar]
  10. Muhabie, Y.T.; Petcu, C.; Rigo, P.; Caprace, J.D. Weather downtime analysis for offshore wind farm installations. PIANC Year 2016, 162–169. Available online: https://orbi.uliege.be/bitstream/2268/198019/1/Weather%20down%20time%20analysis_Yohannes%20MUHABIE.pdf (accessed on 21 May 2026).
  11. Paterson, J.; D’Amico, F.; Thies, P.R.; Kurt, R.E.; Harrison, G. Offshore wind installation vessels: A comparative assessment. Ocean Eng. 2018, 148, 637–649. [Google Scholar] [CrossRef]
  12. Boulougouris, E. Simulation and optimization for offshore wind farm installation logistics. In Proceedings of the NORCOWE Conference, Bergen, Norway, 14–16 September 2016. [Google Scholar]
  13. Díaz, H.; Guedes Soares, C. Review of the current status, technology, and future trends of offshore wind farms. Ocean Eng. 2020, 209, 107381. [Google Scholar] [CrossRef]
  14. Díaz, H.; Guedes Soares, C. Approach for installation and logistics of a floating offshore wind farm. J. Mar. Sci. Eng. 2023, 11, 53. [Google Scholar] [CrossRef]
  15. Vis, I.F.A.; Ursavas, E. Assessment approaches to logistics for offshore wind energy installation. Sustain. Energy Technol. Assess. 2016, 14, 80–91. [Google Scholar] [CrossRef]
  16. Maples, B.; Saur, G.; Hand, M.; van de Pietermen, R.; Obdam, T. Installation, Operation, and Maintenance Strategies to Reduce the Cost of Offshore Wind Energy; National Renewable Energy Laboratory: Golden, CO, USA, 2013. [Google Scholar]
  17. Ivanov, G.; Ma, K.-T. Floater Assembly and Turbine Integration Strategy for Floating Offshore Wind Energy: Considerations and Recommendations. Wind 2024, 4, 376–394. [Google Scholar] [CrossRef]
  18. Barlow, E.; Öztürk, D.T.; Revie, M.; Boulougouris, E.; Day, A.H.; Akartunali, K. Exploring the impact of innovative developments to the installation process for an offshore wind farm. Ocean Eng. 2015, 109, 623–634. [Google Scholar] [CrossRef]
  19. Barlow, E.; Tezcaner Öztürk, D.; Revie, M.; Akartunali, K.; Day, A. Simulation-based modeling of installation logistics for offshore wind farms. Ocean Eng. 2017, 131, 24–35. [Google Scholar]
  20. Martins, D.; Muraleedharan, G.; Guedes Soares, C. Weather window analysis of a site off Portugal. In Maritime Technology and Engineering; Taylor & Francis: London, UK, 2015; pp. 1329–1338. [Google Scholar]
  21. Ramsay, A.; Vaziri, V.; Snee, S.; Kapitaniak, M. De-Risking Utilising a Floating Crane for Floating Offshore Wind Turbine Maintenance. Mar. Struct. 2026, 107, 104000. [Google Scholar] [CrossRef]
  22. Guachamin-Acero, W.; Gao, Z.; Moan, T. Methodology for Assessment of the Allowable Sea States during Installation of an Offshore Wind Turbine Transition Piece Structure onto a Monopile Foundation. J. Offshore Mech. Arct. Eng. 2017, 139, 061901. [Google Scholar] [CrossRef]
  23. Natskår, A.; Moan, T.; Alvær, P.Ø. Uncertainty in forecasted environmental conditions for reliability analyses of marine operations. Ocean Eng. 2015, 108, 636–647. [Google Scholar] [CrossRef]
  24. Wu, W.; Gao, Z.; Zhao, Y. Assessment of allowable sea states for offshore wind turbine blade installation using time-domain numerical models and considering weather forecast uncertainty. Ocean Eng. 22022, 260. [CrossRef]
  25. Clauss, G.F.; Riekert, T. Operational limits for floating crane vessels. In Proceedings of the OMAE Conference, Lisbon, Portugal, 5–9 July 1998. [Google Scholar]
  26. Cozijn, J.L.; Uittenbogaard, R.E.; Brake, E.T. Hydrodynamic aspects of offshore lifting operations. In Proceedings of the Offshore Technology Conference (OTC), Houston, TX, USA, 1–4 May 2006. [Google Scholar]
  27. Del Guzzo, A.; Gaggiotti, F.; Rossetti, C.; Di Tomaso, F.; Bruschi, R. Application of 2D Wave Spectra Time Series for Pipelaying Vessel Stinger Structural Assessment. In Proceedings of the MARINE VII: Proceedings of the VII International Conference on Computational Methods in Marine Engineering 2017, Nantes, France, 15–17 May 2017. [Google Scholar]
  28. DNV. Environmental Conditions and Environmental Loads; Recommended Practice DNV-RP-C205; DNV: Høvik, Norway, 2021. [Google Scholar]
  29. Ramachandran, R.; Desmond, C.; Judge, F.; Serraris, J.; Murphy, J. Floating wind turbines: Marine operations challenges and opportunities. Wind Energy Sci. 2022, 7, 903–924. [Google Scholar] [CrossRef]
  30. Hong, S.; Zhang, H.; Nord, T.S.; Halse, K.H. Advances in offshore wind installation and logistics: A review. Ocean Eng. 2024, 290, 116123. [Google Scholar]
  31. Tang, Y.; Chen, M.; Ye, J.; Jiang, X.; Chen, Y.; Ren, Z.; Choo, Y.S. Advancing Floating Offshore Wind Turbine Construction from the Perspective of Wet Towing Using a Tugboat with Autonomous Control. Mar. Struct. 2026, 106, 103973. [Google Scholar] [CrossRef]
  32. Chen, M.; Tang, Y.; Ye, J.; Jiang, X.; Chen, Y.; Ren, Z.; Choo, Y.S. A Constant Parameter Time-Domain Simulator for a Tugboat with Forward-Speed Dependent Hydrodynamics and Speed Control. J. Mar. Eng. Technol. 2026, 25, 220–234. [Google Scholar] [CrossRef]
  33. Equinor. Hywind Scotland Project. Available online: https://www.equinor.com/energy/hywind-scotland (accessed on 20 November 2023).
  34. Equinor. Hywind Tampen Project. Available online: https://www.equinor.com/energy/hywind-tampen (accessed on 13 December 2023).
  35. Principle Power. WindFloat® Technology Overview and Projects. Available online: https://www.principlepower.com (accessed on 5 April 2026).
  36. Jiang, Z.; Li, L.; Gao, Z.; Halse, K.H.; Sandvik, P. Dynamic response analysis of a catamaran installation vessel during positioning of wind turbine assemblies. Mar. Struct. 2018, 61, 1–24. [Google Scholar] [CrossRef]
  37. Jiang, Z. Installation of offshore wind turbines: A technical review. Renew. Sustain. Energy Rev. 2021, 139, 110576. [Google Scholar] [CrossRef]
  38. Hassan, M.; Guedes Soares, C. Dynamic analysis of a novel installation method of floating spar wind turbines. J. Mar. Sci. Eng. 2023, 11, 1373. [Google Scholar] [CrossRef]
  39. Hassan, M.; Guedes Soares, C. Installation of pre-assembled floating wind turbines using a floating vessel. In Developments in Renewable Energies Offshore; Taylor & Francis: London, UK, 2021. [Google Scholar]
  40. Sarker, B.R.; Faiz, T.I. Minimizing transportation and installation costs for offshore wind turbines. Renew. Energy 2017, 101, 667–679. [Google Scholar] [CrossRef]
  41. McMorland, J.; Collu, M.; McMillan, D.; Carroll, J. Operation and Maintenance for Floating Wind Turbines: A Review. Renew. Sustain. Energy Rev. 2022, 163, 112499. [Google Scholar] [CrossRef]
  42. Arántegui, R.; Yusta, J.M.; Navarro, A. Offshore wind installation: Analysing improvements in installation time. Renew. Sustain. Energy Rev. 2018, 92, 133–145. [Google Scholar] [CrossRef]
  43. Cruz, J.; Atcheson, M. Floating Offshore Wind Energy; Springer International Publishing: Cham, Switzerland, 2016. [Google Scholar]
  44. Hassan, M.; Guedes Soares, C. Assessment of Allowable Operational Limits for Floating Spar Wind Turbine Installations. J. Mar. Sci. Eng. 2026, 14, 723. [Google Scholar] [CrossRef]
  45. McAuliffe, F.D.; Judge, F.M.; Murphy, J. Modelling the Installation of Next Generation Floating Offshore Wind Farms. Appl. Energy 2024, 374, 124001. [Google Scholar] [CrossRef]
  46. Castro-Santos, L.; Diaz-Casas, V. Life-Cycle Cost Analysis of Floating Offshore Wind Farms. Renew. Energy 2014, 66, 41–48. [Google Scholar] [CrossRef]
Figure 1. Schematic representation of conventional floating offshore wind installation processes, including fabrication, pre-assembly, towing, and offshore hook-up operations (based on WindFloat and Hywind concepts).
Jmse 14 01009 g001
Figure 2. Hywind Tampen WTG mating using a heavy lift onshore crane.
Jmse 14 01009 g002
Figure 3. Nordic Wind installation process.
Jmse 14 01009 g003
Figure 4. Overview of floating wind project’s locations.
Jmse 14 01009 g004
Figure 5. Project A: Installation Duration and Efficiency Comparison between Nordic Wind and Conventional Towing under Varying Weather Risk Levels.
Jmse 14 01009 g005
Figure 6. Project A: Monthly Installation Operability (Positions Completed) for Nordic Wind and Conventional Towing under Varying Weather Risk Levels.
Jmse 14 01009 g006
Figure 7. Project B: Installation Duration and Efficiency Comparison between Nordic Wind and Conventional Towing under Varying Weather Risk Levels.
Jmse 14 01009 g007
Figure 8. Project B: Monthly Installation Operability (Positions Completed) for Nordic Wind and Conventional Towing under Varying Weather Risk Levels.
Jmse 14 01009 g008
Figure 9. Project C: Installation Duration and Efficiency Comparison between Nordic Wind and Conventional Towing under Varying Weather Risk Levels.
Jmse 14 01009 g009
Figure 10. Project C: Monthly Installation Operability (Positions Completed) for Nordic Wind and Conventional Towing under Varying Weather Risk Levels.
Jmse 14 01009 g010
Figure 11. Project D: Installation Duration and Efficiency Comparison between Nordic Wind and Conventional Towing under Varying Weather Risk Levels.
Jmse 14 01009 g011
Figure 12. Project D: Monthly Installation Operability (Positions Completed) for Nordic Wind and Conventional Towing under Varying Weather Risk Levels.
Jmse 14 01009 g012
Figure 13. Installation Cost Comparison between Nordic Wind and Conventional Towing under Varying Weather Risk Levels.
Jmse 14 01009 g013
Figure 14. Comparison of Installation Cost per Turbine for Projects A–C under Baseline and P50 Conditions.
Jmse 14 01009 g014
Figure 15. Scaling of Total Installation Cost with Project Size for Nordic Wind and Conventional Towing Methods.
Jmse 14 01009 g015
Figure 16. Total installation cost variations with weather severity for Project D, comparing Nordic Wind and conventional towing methods.
Jmse 14 01009 g016
Figure 17. Relationship between campaign duration and total installation cost for Project D, highlighting the sensitivity of each installation method to extended offshore exposure.
Jmse 14 01009 g017
Table 1. Projects descriptive data.
IDLocationMarshalling Port to Site Distance [km] 1Water Depth [m]Project Size [MW]Number of Turbines [-]
ANorth Sea140260–3008811
BNorth Sea32220–28037525
CSouth Korea70200–25075050
DUS West Coast95500–1200140050
1 Marshalling port-to-site distance represents the assumed distance between the representative marshalling port and the offshore wind farm location used for transit-time calculations in the simulation.
Table 2. Operational Definition of Installation Activities for Simulation Input.
Activity No.DescriptionDuration [h]Continuous
Operation 1
Limiting Parameter(s)
Conventional Method—Towing
1Prepare floating substructure for WTG assembly24noWind speed
2Inshore WTG assembly240NoWind speed
3Transfer to pre-commissioning quay24Yes-
4Pre-commissioning and completion216NoWind speed
5Prepare for towing24Yes-
6Towing assembly to field* 2YesWind speed, significant wave height, current
7Offshore hook up72YesWind speed, significant wave height, current
8AHTS transit back to port* 2No-
Nordic Wind Method
1Inshore WTG assembly168NoWind speed
2IV port entry and mooring2NoWind speed
3Loading preparations3NoWind speed
4Loading WTG assembly (assumed: Two WTG per trip)36NoWind speed
5Sea-fastening/Finishing works4No-
6Transit to field* 2YesWind speed, significant wave height
7DP Trials4NoWind speed, significant wave height
8Installation preparations4NoWind speed, significant wave height
9Connect gripper to floating substructure4NoWind speed, significant wave height, wave period
10Transfer WTG assembly to floating substructure and mating24YesWind speed, significant wave height, wave period
Notes: 1 The duration represents the minimum uninterrupted execution time required for each activity. Continuous activities must be completed without interruption once initiated. 2 * Transit duration is calculated from the representative port-to-site distance reported in Table 1 and the vessel transit speed assumptions described in Section 3.3.
Disclaimer/Publisher’s Note: The statements, opinions and data contained in all publications are solely those of the individual author(s) and contributor(s) and not of MDPI and/or the editor(s). MDPI and/or the editor(s) disclaim responsibility for any injury to people or property resulting from any ideas, methods, instructions or products referred to in the content.