Article

Modelling of the Present Oceanographic Situation of the Gulfs of Patras and Corinth

by
Basile Caterina
1,*,
Aurélia Hubert-Ferrari
1,
Alexander Barth
2 and
Jean-Marie Beckers
2
1
SPHERES, Department of Geography, University of Liège, 4000 Liège, Belgium
2
GHER, Department of Oceanography, University of Liège, 4000 Liège, Belgium
*
Author to whom correspondence should be addressed.
J. Mar. Sci. Eng. 2025, 13(9), 1827; https://doi.org/10.3390/jmse13091827
Submission received: 20 August 2025 / Revised: 17 September 2025 / Accepted: 19 September 2025 / Published: 21 September 2025
(This article belongs to the Section Physical Oceanography)

Abstract

In our study we investigated the hydrodynamic circulation of the Gulfs of Patras and Corinth through modelling. To this end, ROMS was used to numerically calculate the parameters of the waters for these peculiar semi-enclosed basins. Several oceanographic forcings were used with an emphasis on the tides and the winds. With several simulations, each focusing on a specific element, we were able to describe more accurately the dynamics under the surface to complete what was previously done. The high velocity currents (0.6 m/s at the Patraic end of the strait) were validated through ADCP and satellite data, proving that modelling can be trusted to fill the gap in the in situ data over these two gulfs. Our simulations, mainly based on the month of May 2023, allowed us to understand the importance of the tides, especially in the Rio–Antirio Strait. There, the bottom currents are the strongest while the center of the Corinthian Gulf remains quiet. The surface dynamics were observed to be sensitive to the tides, the winds and the season, but general patterns were still highlighted for the oceanographic circulation of the gulfs.

1. Introduction

The ocean dynamics in the Patraic and Corinthian Gulfs are important since they affect their environmental impacts. These two gulfs separate continental Greece from the Peloponnesus. Even though they are considered as gulfs, they display a very enclosed morphology that plays an important control over their oceanographic dynamics [1,2,3]. For a long time, the Gulf of Corinth has been studied by geologists due to its fault network and active seismicity [4,5,6,7,8,9]. Despite significant study on the geology of the Corinthian Gulf, its oceanography is not yet fully understood and well described. Old studies of this peculiar oceanography were conducted by Lascaratos et al. in 1989 [2] and by Poulos et al. in 1996 [10], featuring early stages of satellite images in the first and in situ CTD data from 1983 for the second. The techniques and the methodology have evolved since then and having a new look over this important area might bring light over key features of the dynamics in the gulf.
Since 2000, no publicly available in situ data has been evidencing the whole oceanographic circulation of the Gulfs of Patras and Corinth. To counter this lack of in situ data, a recent study has been published by analyzing satellite data over a 14 year period by Caterina and Hubert-Ferrari in 2025 [1]. This study was useful in describing the surface dynamics and only presented a hypothesis for the bottom circulation. The use of modeling, which would give information over the whole water column for any given time, is therefore a great interest in understanding the dynamics. Modelling efforts have already been conducted for the Gulf of Patras [11,12], over the Rio–Antirio Strait [3] which connects the two gulfs, as well as the Gulf of Corinth itself [13], but these were more focused on the causes of the dynamics rather than the description of the circulation and its 3D complexity.
Getting to understand the complexity of the hydrodynamics over the whole water column with an emphasis over the surface and the bottom phenomena appears to be the key to assess any geomorphological or geological interpretation made in the Corinthian Gulf. Moreover, it has already been assessed that the Rio–Antirio Strait plays a crucial role over the control of the dynamics [1,3,14] and the impact over the geomorphologies and the biodiversity [14,15]. Being able to see its impact over the whole Corinthian Gulf is one of the reasons that modelling this area is important.
In this paper, we aim to model the hydrodynamic circulation of the Gulfs of Patras and Corinth to address the current lack of understanding regarding the circulation of the water at depth, as well as the consequences of the seasonality of the winds over these basins. This will be achieved mainly using ROMS modelling complemented by scarce in situ data and satellite imagery.

2. Settings of the Corinthian Gulf

The Gulf of Corinth separates continental Greece from the Peloponnesus. Its western connection to the Patraic Gulf is the Rio–Antirio Strait, while at the east, the connection with the Aegean Sea is a small, manmade one through the Corinth Canal. The Gulf of Corinth is considered as elongated since it is 120 km long and 40 km wide at maximum (Figure 1). Its deepest point lies at around 900 m deep, and the gulf presents steep slopes, particularly in the south. The Patraic Gulf is smaller, almost circular, since it is 20–25 km wide. This Gulf is also shallower (120 m deep). The connection between these two gulfs is the 18 km Rio–Antirio Strait area, which plays a very important role in the hydrodynamics of the basins. The strait’s bathymetry deepens from west to east, from ~50 m depth to ~100 m depth [14,16].
Previous studies about the general oceanographic phenomena in the Gulfs of Patras and Corinth evidenced surface dynamics with the presence of several eddies and upwellings based on sea surface temperature (SST) [1,2]. The main eddies are a cyclonic gyre in the Patraic Gulf and, for the Corinthian Gulf, an anticyclonic gyre in front of the Bay of Itea and a cyclonic gyre in front of the Bay of Antikyra (locations on Figure 1; [1]). The main inferred upwellings are located at the exit of the Rio–Antirio Strait in the Corinthian Gulf and in the smaller Gulf of Alkyonides. These upwellings appear on the northern coast of the Gulf of Corinth, while the main surface flow seems to travel close to its southern coast from the strait towards Corinth center.
Regarding the winds over the Gulf of Corinth, they appear to be mostly easterly 70% of the time and stronger in winter [17]. The Rio Strait area is dominated by stronger eastern winds while the dominant wind direction near the eastern end of the Corinthian Gulf is from northwest [17]. Winds are considered as a key factor for the hydrodynamics of both the Patraic and Corinthian Gulfs [2,11,13].

3. Materials and Methods

3.1. Regional Ocean Modeling System

The model Regional Ocean Modeling System (ROMS) was used to perform all the simulations [18]. This model was used due to its strength regarding resolution of coastal areas since the Corinthian Gulf is narrow enough to be considered as a coastal area in terms of modelling. Also, it seems ROMS performs well in strait areas and enclosed basins, as already been shown by several studies [19,20].
One of the key features required for these simulations is the terrain-following approach [18] since the dynamics near the seabed were the focus of this study. ROMS’s approach of vertical levels with σ-coordinates allowed us to get less numerical errors than z or s grids near the bottom.
The horizontal spatial resolution of the model was, for this study, fixed by the bathymetry dataset from GEBCO with a resolution of ~450 m (15 arc-second). The bathymetry was computed to build a ROMS initial grid with manual corrections for the low bathymetries before interpolating the initial conditions. First, a smoothing of the bathymetry was made (rmax = 0.8; strength of the smoothing) to conserve hydrostatic consistency and avoid large bottom gradient due to the sigma system construction of the model [21,22]. Then, the manual corrections were mainly focused on low bathymetries over the whole domain. They consisted in the addition of +5 m for each point between 0 m and 10 m, +10 m for each point between 10 m and 30 m, and +5 m for each point between 30 and 35 m. Points deeper than 35 m were observed as correct in the shallower area of the gulf. These variations were based on the high resolution bathymetry of the strait presented in Rubi et al. (2022) [14].
For the borders, the grid was built to only consider one open connection, at the far west of the area, between the Ionian Sea and the Gulf of Patras. All other borders were considered closed, even the Corinth Canal opening, since with its shallow depth and 30 m width it is not considered as a proper oceanographic connection [23]. The specific ROMS parameters of the grid were specified to be: Tcline (width (m) of surface or bottom boundary layer in which higher vertical resolution is required during stretching) = 50, θs = 5 (S-coordinate surface control parameter, 0 ≤ θs ≤ 10), θb = 4 (S-coordinate bottom control parameter, 0 ≤ θb ≤ 4), nlevels = 32 (number of vertical adaptative layers). The equation chosen for the vertical transformation was the improved formulation of Shchepetkin (2005) (Equation (2) in [24], extracted from [22]) and the one for vertical stretching was the Shchepetkin (2009) improved double stretching function (Equation (2.3) in [25] for the surface and Equation (2.4) in [25] for the bottom).
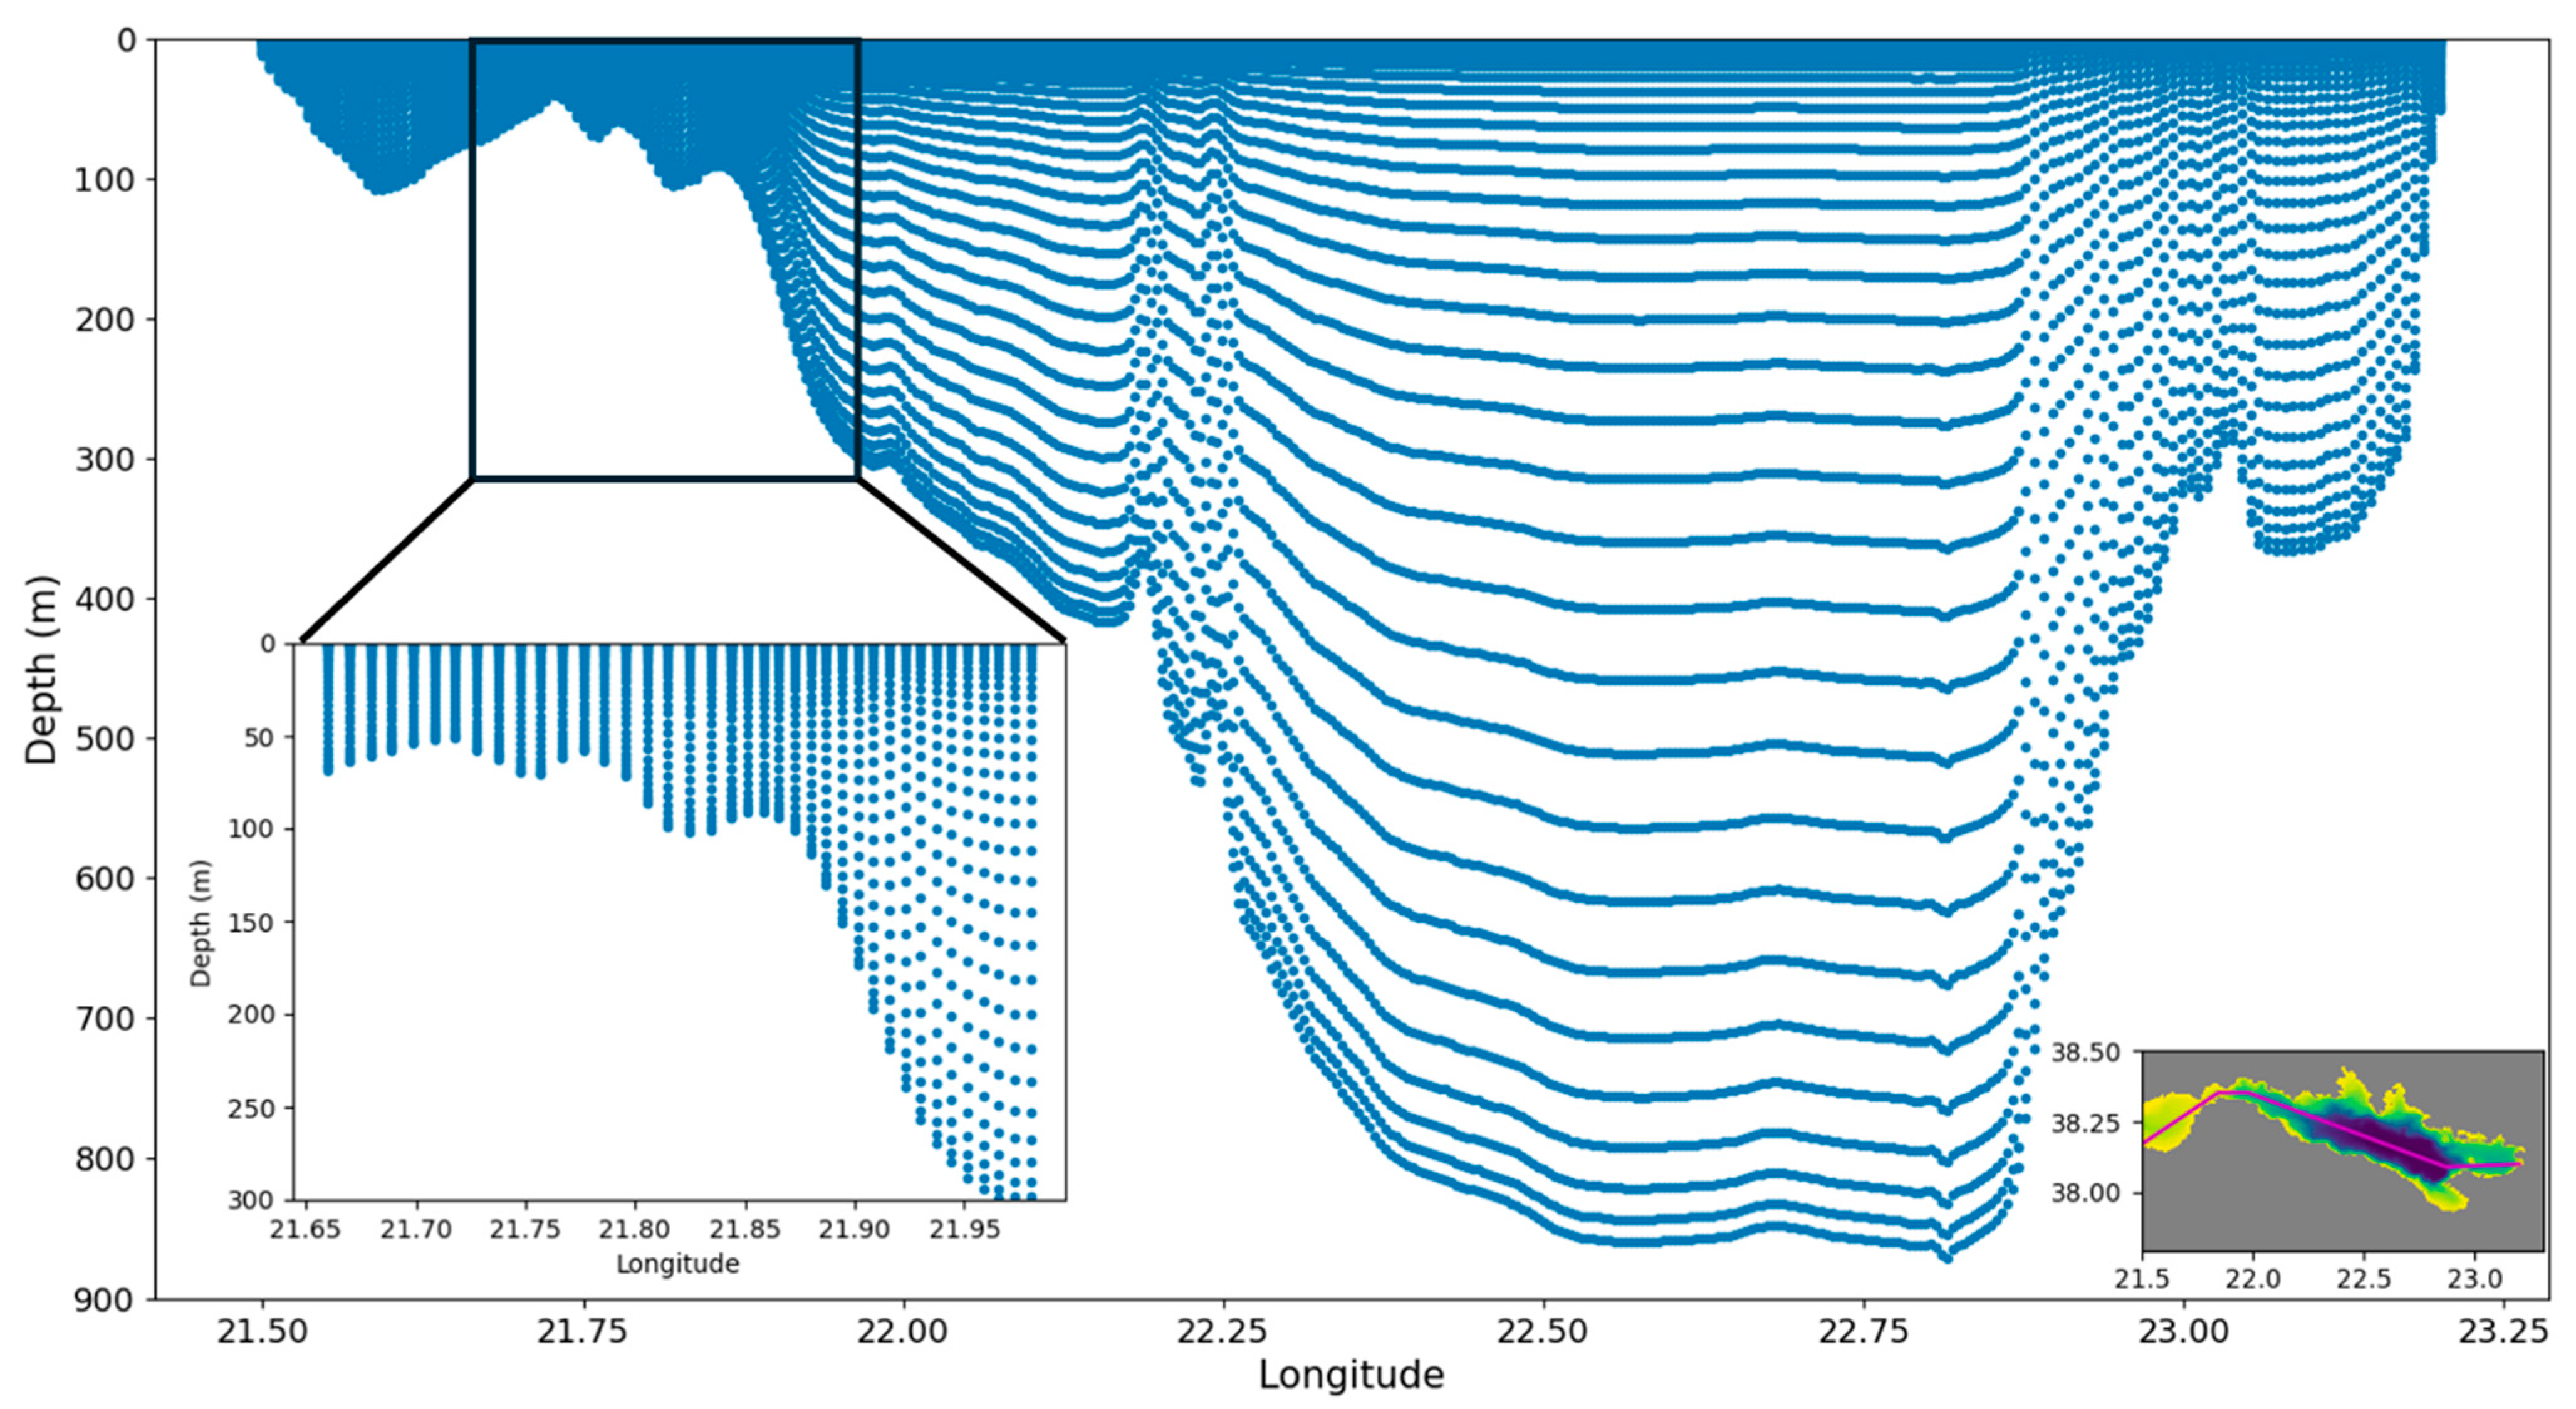
Therefore, the vertical repartition of the levels is focused on the surface and the bottom. Preliminary tests indicated that surface and bottom refinement were necessary to achieve accurate simulations. Given that near-bottom dynamics were a focus of this study, maximum refinement (θb = 4) was applied for the bottom [25]. This translates to a repartition of the 32 levels, as shown in Figure 2, for the entirety of the modelled domain.
Finally, the preparation of the initial grid was made using Julia scripts [21] where all the inputs are retrieved from the CMEMS [26] or the ECMWF for the winds. From the CMEMS, we retrieved modelled data for the temperature, the salinity, the sea surface elevation, and u and v movements. In order to force the tides in the model, as we suspect them to have a strong influence over the dynamics [14], we used data from the TPXO Tidal Model [27,28]. From this model, the parameters of the tides (velocity of the currents, amplitude and phases) were exported over the whole domain to serve as tidal boundary conditions. The open boundary conditions were set at the extremity of the grid between the Patraic Gulf and the Ionian Sea; the rest of the boundaries were considered closed. This calibration was done by setting the west border of the model as open under “RadNud” conditions for the 3D velocity, and the temperature and the salinity in the “roms.in” initiation script [21,22]. “RadNud” implies radiation boundary condition with nudging [22].
To analyze different outcomes, several setups were tested with different time periods or forcing fields. The final time periods were the months of January 2023 (winter case), May 2023 (reference time), and September 2023 (summer case). Each month was simulated separately due to model running time and available memory storage. Having three seasons modelled allowed us to see the different impacts of the stratification of the thermocline since we expected it to be stronger in summer than in spring and stronger than in winter. The initial conditions for the 3 different months were roughly the same: the bathymetry stayed identical in the 3 simulations; only the dates for the initial oceanographic conditions retrieved from CMEMS [26], the winds from ECMWF, and the initial date for the TPXO Tidal Model [27,28] changed according to the month simulated (1 January to 31 January 2023, 1 May to 31 May 2023, and 1 September to 1 October 2023).
May 2023 was selected and after used as reference for this study since we collected in situ data that could help us with the validation of the model.
To assess the impact of the wind on the hydrodynamic circulation, three cases were considered for different simulations of the month of May 2023. First, the baseline case where the winds are not modified from the ECMWF model. Second, the case where the wind was neglected by setting its velocity to 0. Third, a stronger-wind case where the wind velocity was multiplied by √3 (to increase shear-stress by 3), resulting in a threefold increase in surface shear stress. This increase is set to this value to not exaggerate the shear stress and to fit to maximal wind velocities observed by Koletsis et al. (2014) [17]. This increase will also affect other parameters such as sensible heat and latent heat, like real atmospheric changes would.
For all these simulations, the spin-up time of ROMS with our external data as initial conditions was around 7 to 8 simulated days. Therefore, the output analysis started on the 9th day for the simulations. The main outputs on which the simulations focused were the temperature, the salinity, the currents (u and v), and the sea surface elevation. These outputs were chosen to have a good overview of the current dynamics at a very high resolution.

3.2. Data for the Validation of the Model

Acoustic Doppler Current Profiler (ADCP) data were collected in collaboration with Oceanus-Lab [29] from the University of Patras (Greece) during a marine campaign extending from 12 May 2023 to 19 May 2023. ADCP data were collected and calibrated with sound velocity profiles on the water column using a Valeport MiniSVS-P. Then, the ADCP data were temporally linked with Patras tidal curves for the measured period [30] and analyzed with Ocean Data View (ODV 5.6.2) software [31] to be displayed as “real-time” sections through area of interest to cross-validate the model. They provide direct in situ measurements of currents throughout the water column, enabling validation of both surface and near-bottom circulation in the model.
In addition, model outputs were compared to L3 level satellite data coming from the CMEMS Database [26,32]. These data were downloaded for the month of May 2023 as NetCDF files and spatially analyzed through Julia language as daily maps. Their resolution was 0.01 degrees (36 arc-second) which is 2.4 coarser than the model output (GEBCO data source, 15 arc-second = ~450 m). This difference in resolution can provide inaccurate quantitative comparison of the dataset without using an interpolation tool. Thus, to overcome this resolution difference, only semi-qualitative general patterns and a mean of the SST satellite data were used to validate the model. Moreover, sea surface temperature (SST) from L3 satellite data is our only available satellite dataset to compare it to the model since neither salinity nor water height are measured or calculated for the Corinthian Gulf through CMEMS L3 or L4 levels database.
Tidal gauge data from the Flanders Institute of the Sea (VLIZ) [33] were used to verify the Sea Surface Height (SSH) of the ROMS output model. These data were also used to be certain of the high and low tide periods to understand flow directions under the tide influence.

4. Results

4.1. Model Validation

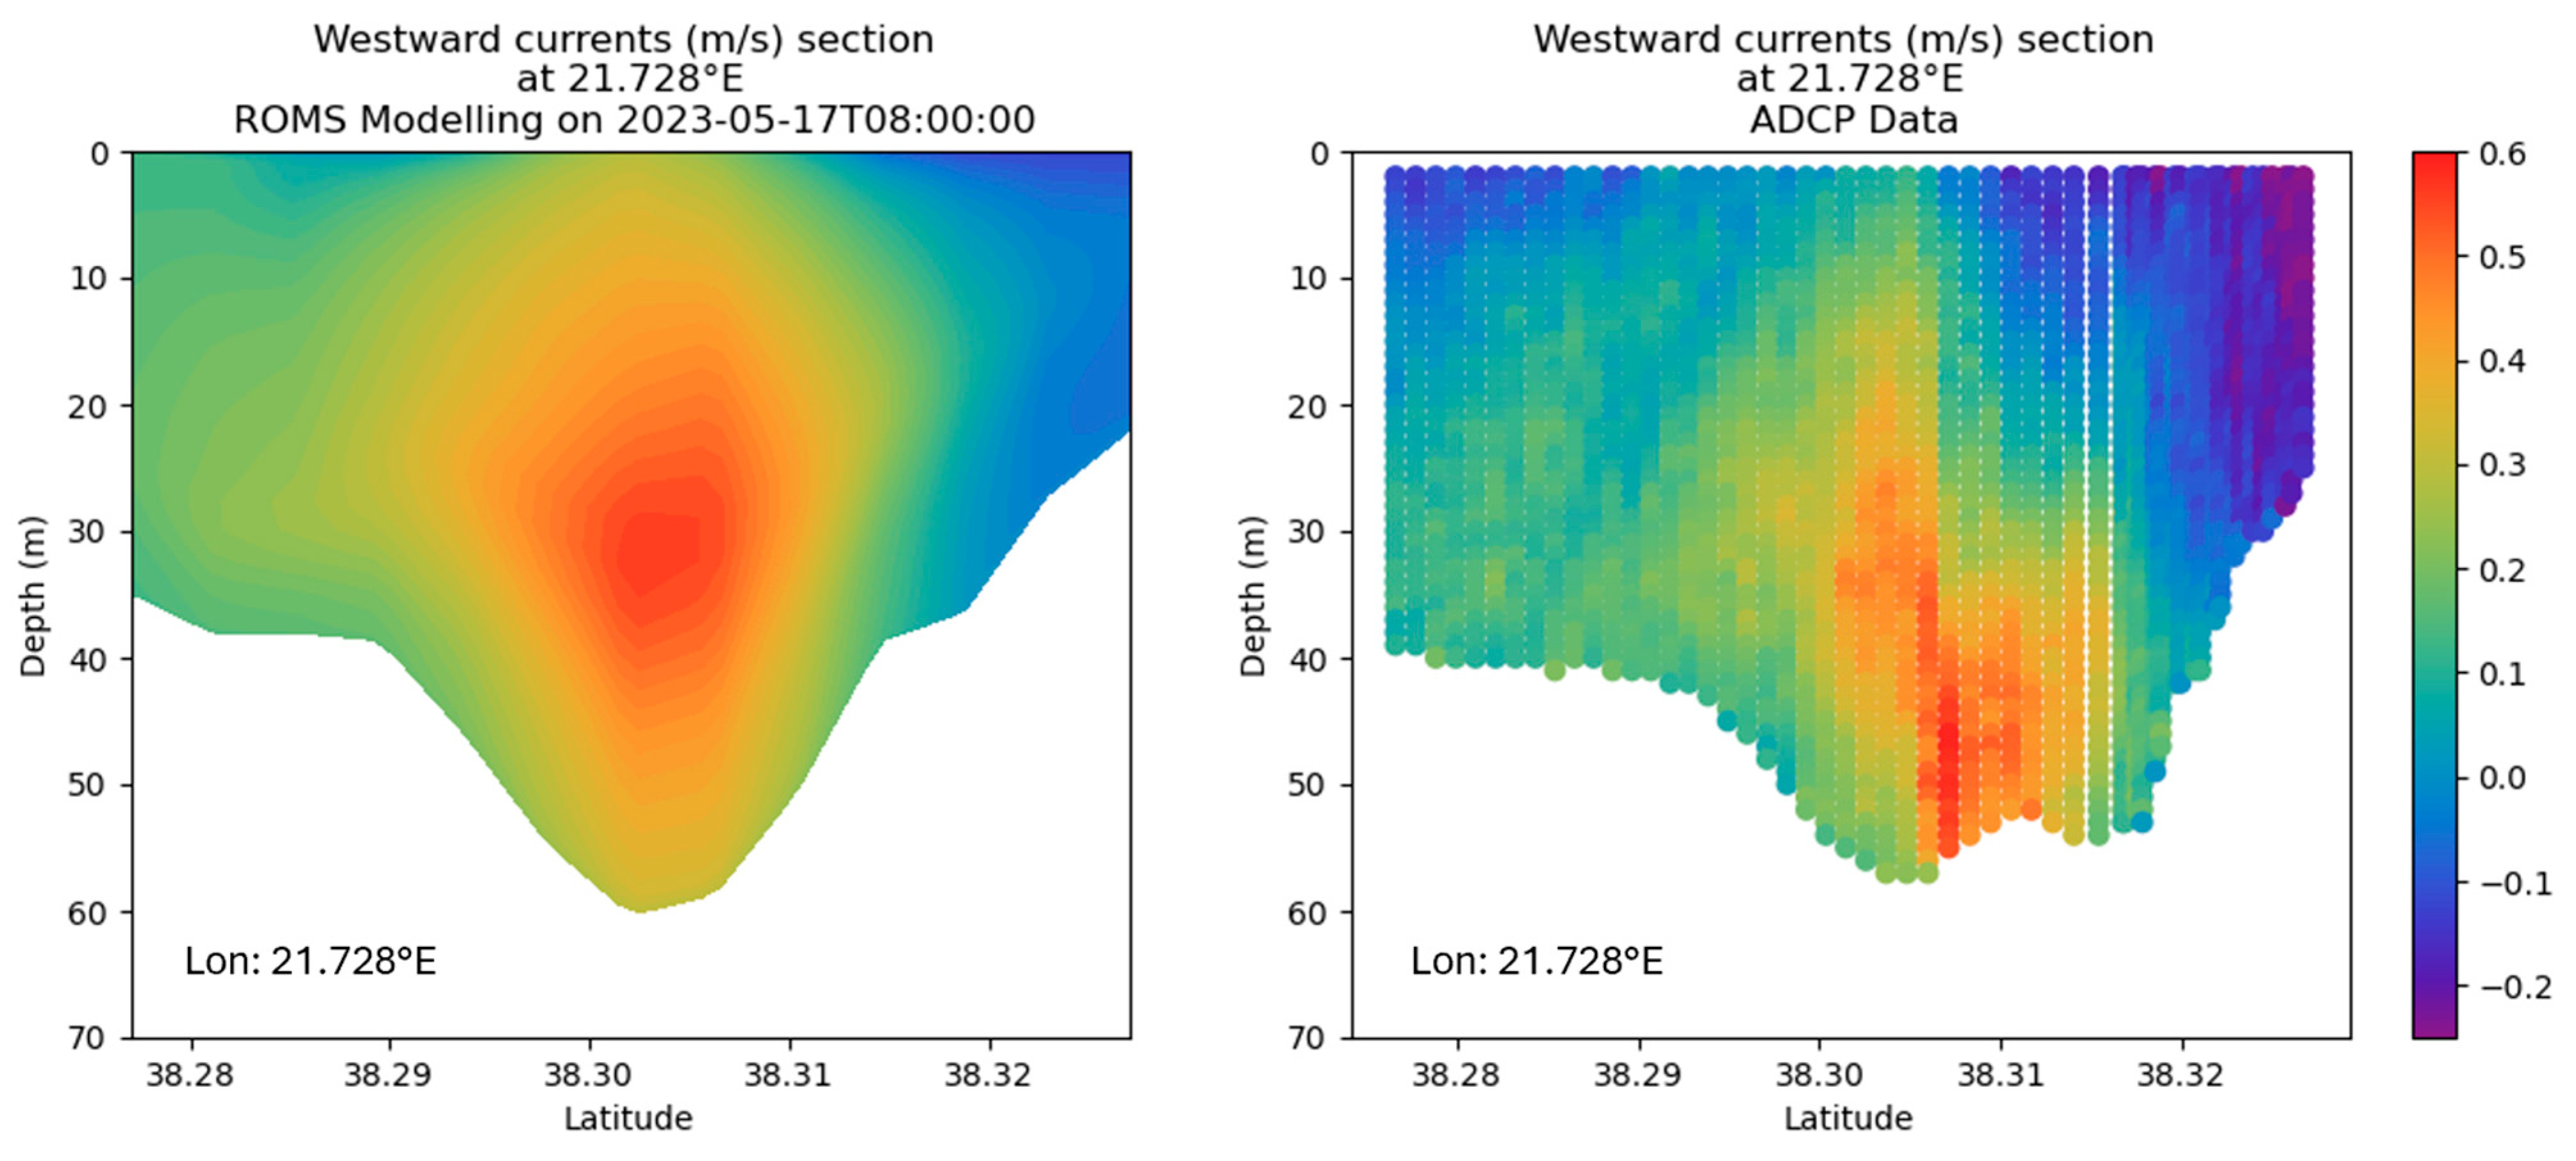
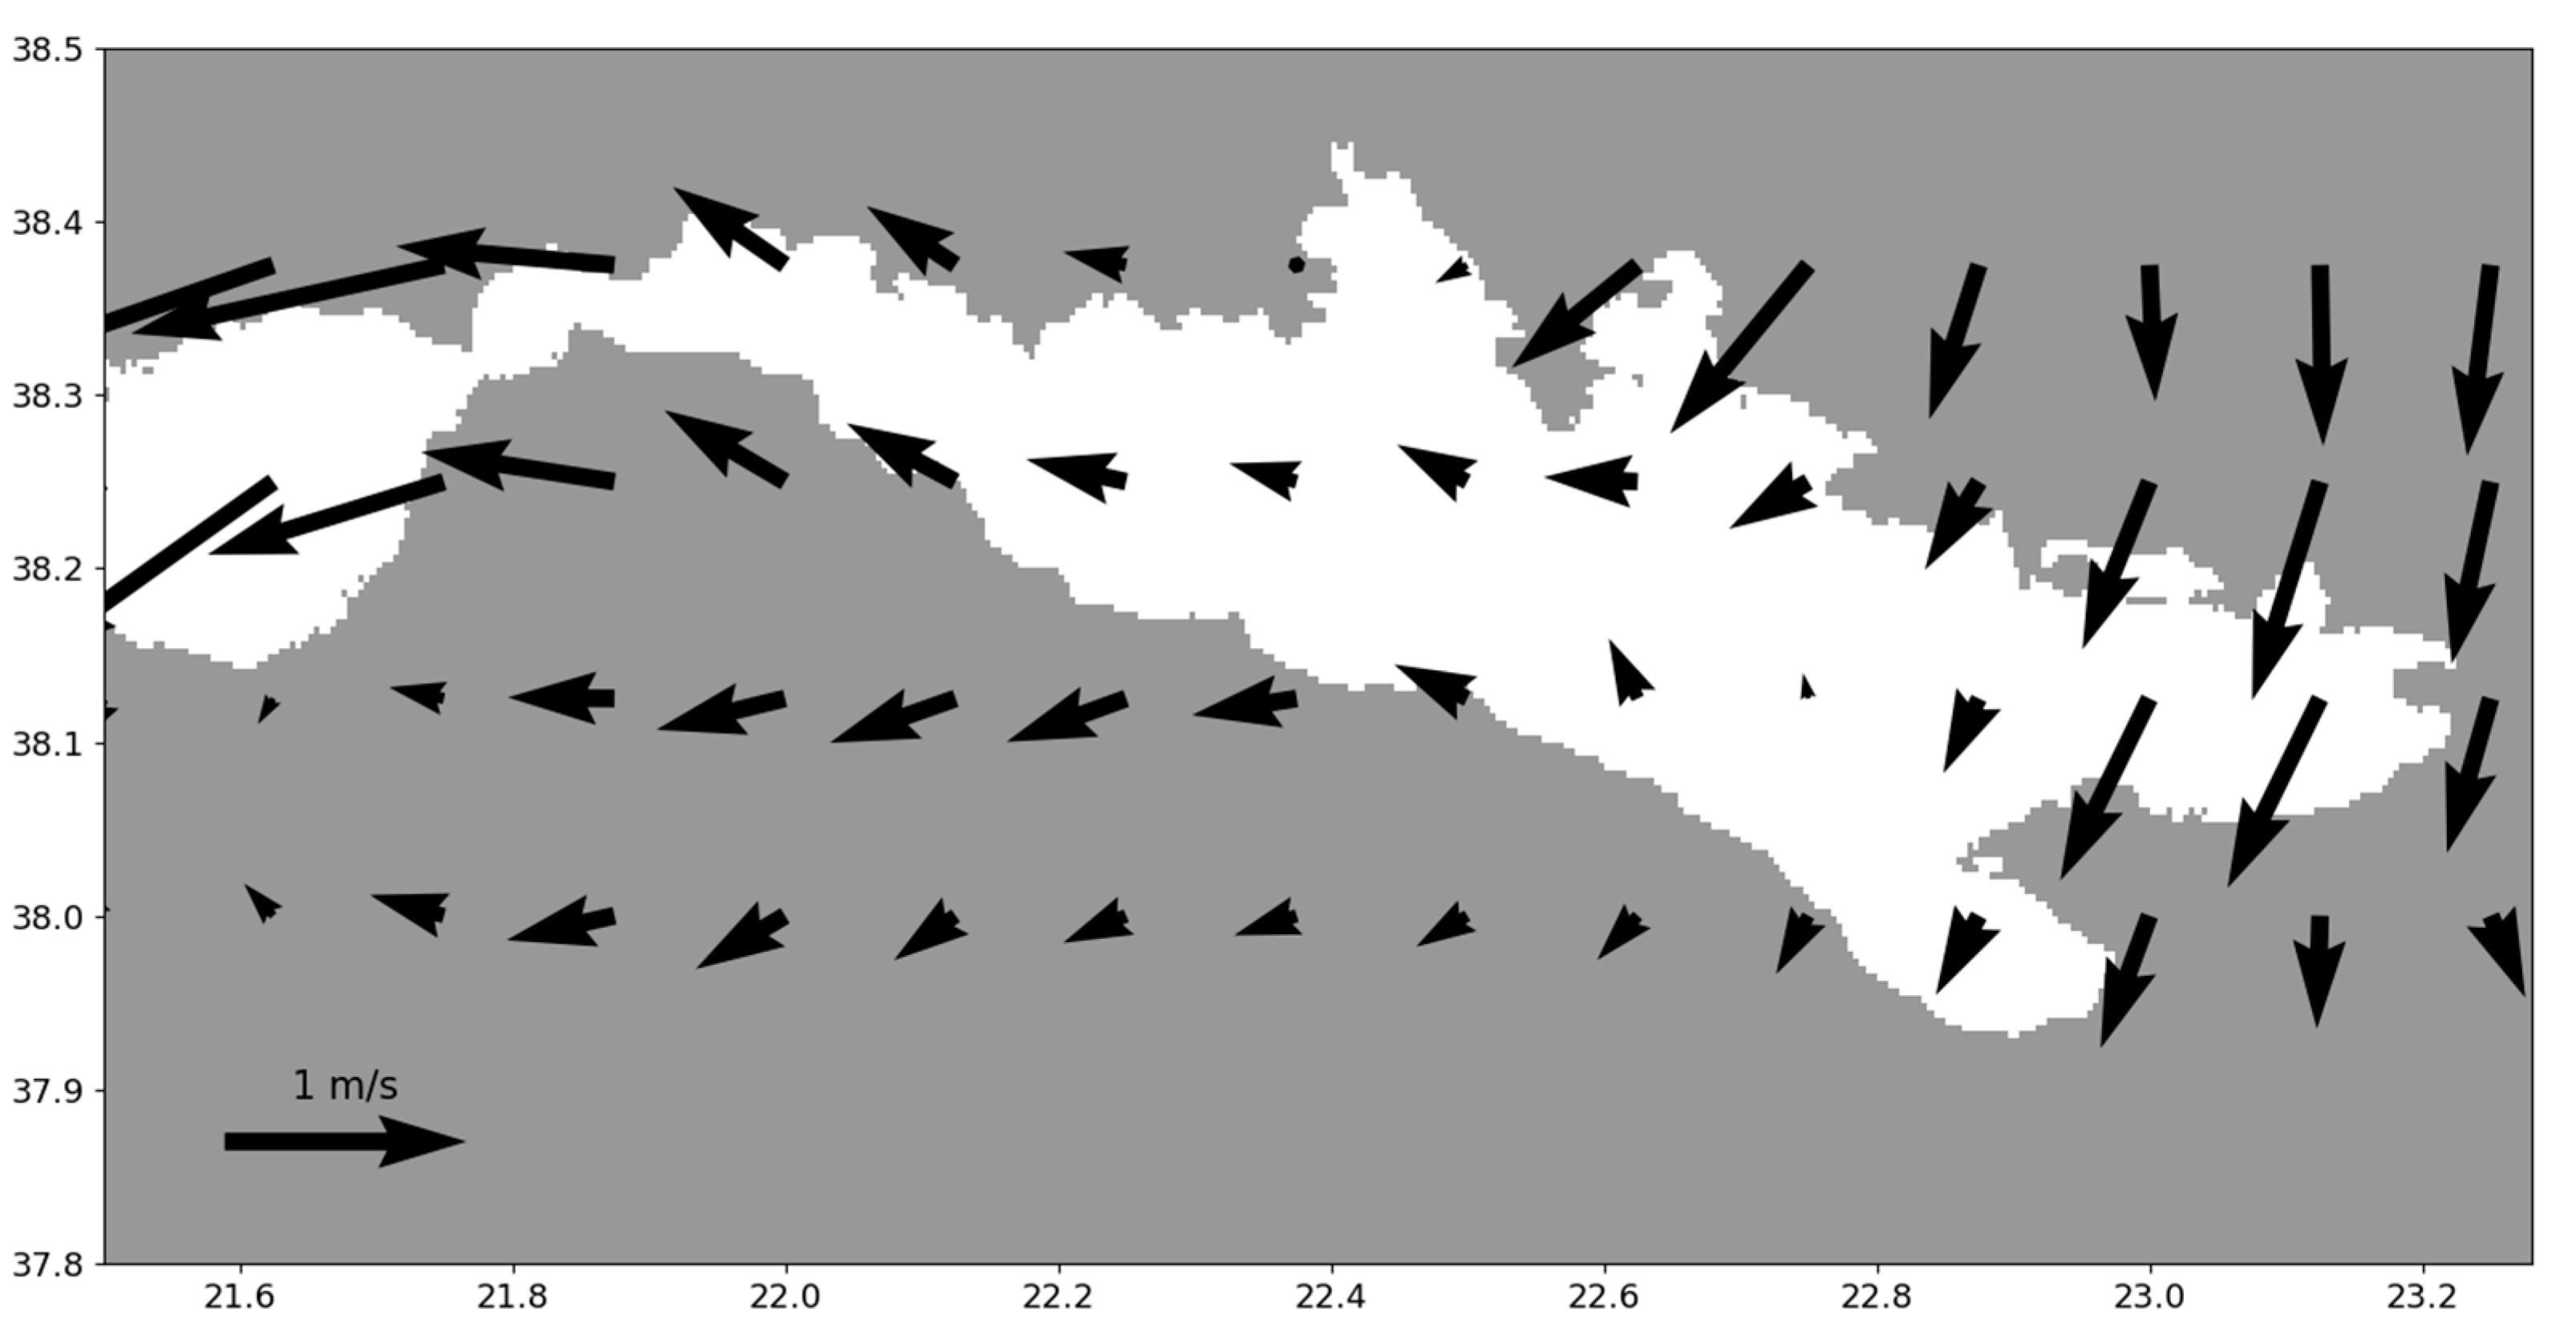
Due to the section location, we were able to compare the westward current velocities from the ADCP data to the model output from the 17 May of 2023 between 8 a.m. and 9 a.m. (local time). When visually comparing the two sections, from the model and from the ADCP, the same dynamics can be observed (Figure 3). At the time and location of the section, a strong westward current (0.5 m/s) is observed at the middle of the water column and near the bottom. Eastwards currents are present in the north part of the section (on the right hand) with a smaller velocity (0.2 m/s). The velocity range computed by the model is the same as the one collected by the ADCP. On the ADCP section, there is a rough “jump” in the effective depth of the data regarding the high velocity westward currents “patch”. Even with this kind of variation in the ADCP data, the model can be validated at least to the location of the section.
In addition to the ADCP data, model results were compared to satellite-derived SST fields to evaluate surface temperature accuracy. Using a map of the temporal average SST from the satellite data we were able to compare it with an interpolated map for the temporal mean modelled temperature at the subsurface (1 m below sea level) for the same month (Figure 4). To get to these averages, a mean over every time steps was done for both datasets to get only one map for the mean. Differences in a few areas may be attributed to gaps in satellite data due to cloud cover, which limits the number of available time steps contributing to the monthly average. Also, the model overestimates SST by approximatively 1 °C in the central basin. Temperature discrepancies may also result from the difference in measurement methods: satellites retrieve sea surface temperature (SST), whereas the model provides bulk temperature, which can exhibit slight deviations even when sampled at approximately the same depth. Overall, modelled SST patterns are consistent with satellite observations.

4.2. General Circulation Patterns

4.2.1. Patraic Gulf

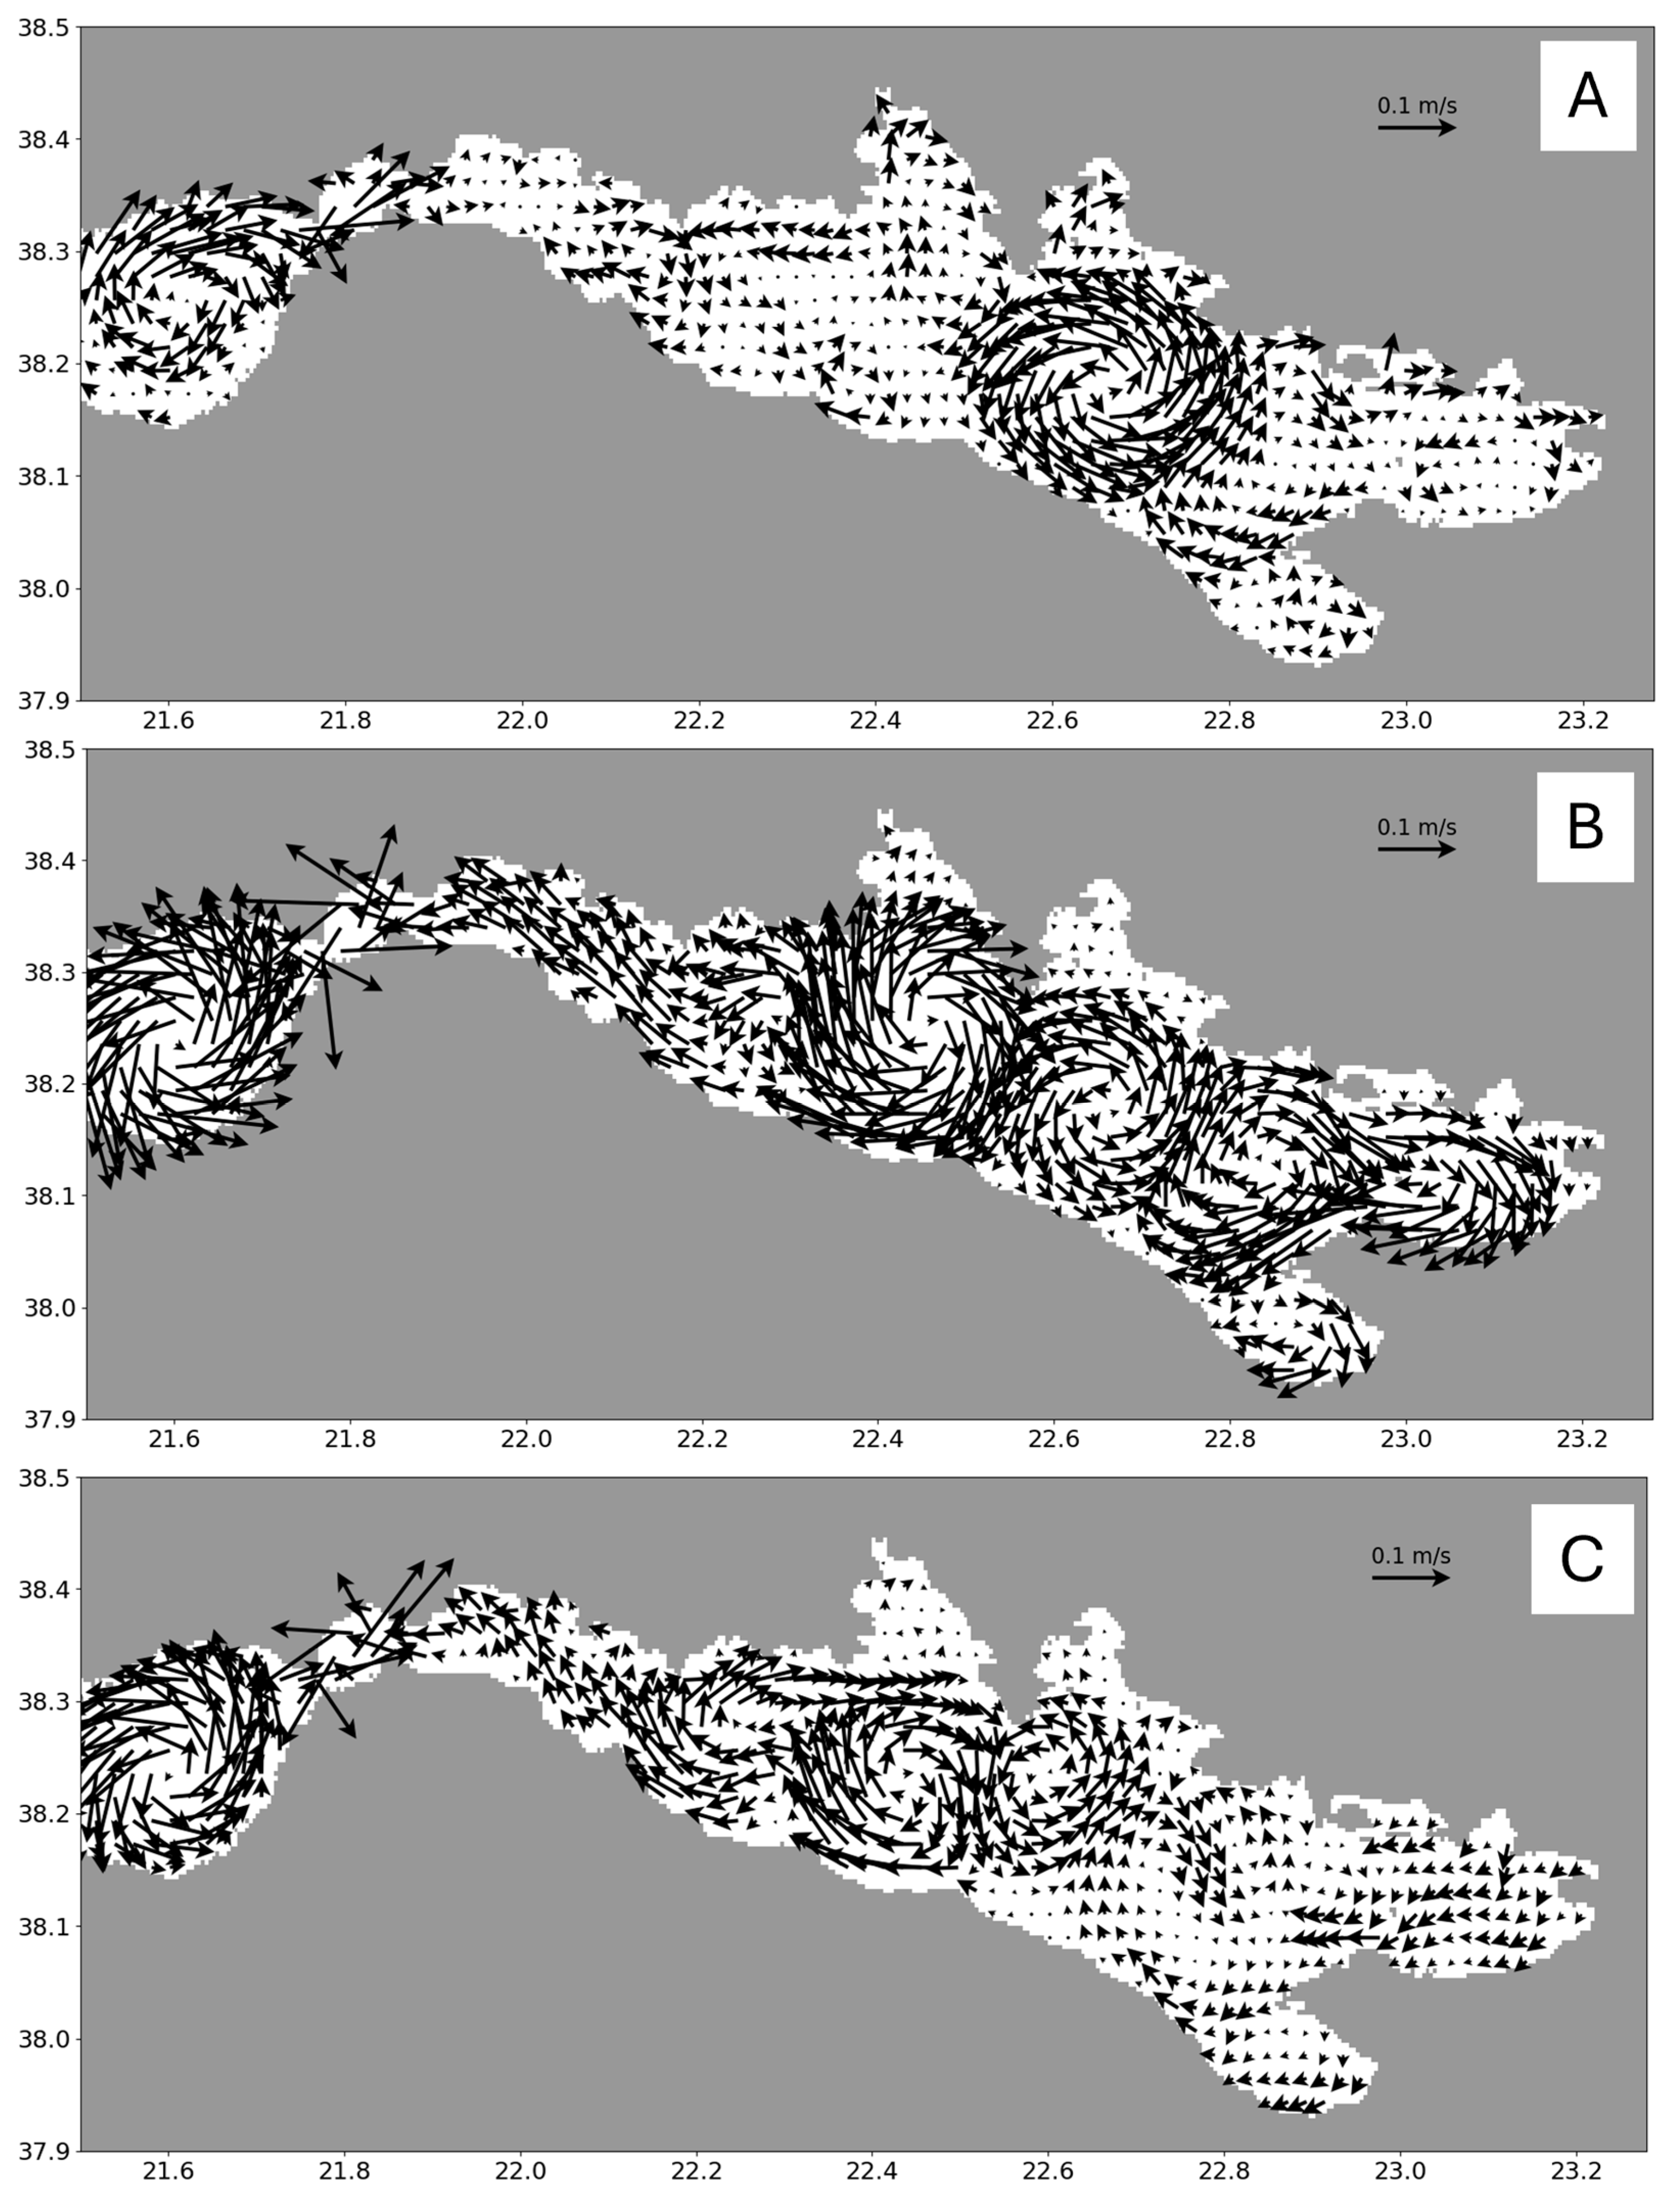
Using a model of the hydrodynamics allowed us to observe continuous events both in space and in time. By looking at the SST, the Patras gyre can be identified. According to the seasonal simulations, the Patras gyre varies in direction and intensity depending on the month of the year (Figure 5). On average for the month of May and September the gyres is cyclonic and with strong velocities like it was previously described [1,2,11,12,13]. During the month of January 2023, the gyre appears to be anticyclonic, with stronger average velocities near the northern coast of the Patraic Gulf.
The inflow of the warm Ionian waters in the gyre follows the south coast of the Patraic Gulf while the cold waters are mainly along the northern coast (Figure 4). The northern part of the Gulf seems to be always dynamic, even in winter, possibly due to the influence of the Rio–Antirio Strait. Exchanges with the Rio–Antirio Strait are also evidenced with alternate flow roughly every 6 h according to the tides (Figure 6). Waters coming to Patras through the strait are often colder than the surface Patras waters. Corinth exiting’s waters follow the north coast of the Patraic Gulf, being captured by the gyre movement. Tidal amplification appear to be the strongest in the Rio–Antirio Strait, and this impacts the SSH of the Patraic Gulf that rises according to the tides that are more evidenced in Corinth (Figure 6), suggesting another parameter controlling the high connectivity of the two gulfs.

4.2.2. Corinthian Gulf

The gyre in front of the Bay of Itea, already observed through satellite data [1], is also observable and consistent for the month of May 2023 (Figure 5B). A smaller cyclonic gyre is observed near the Cape of Akrata. This gyre might be formed due to the bathymetric influence of the cape that serves as a direction guide or a gutter for the water flow. The gyres in front of the Bay of Antikyra appears to be more complex in terms of position and amplitude than what was previously described using only satellite images [1]. The main gyre in front of the Bay of Antikyra always appears cyclonic for the modelled periods. During the month of May, its extension is smaller than during winter or summer (Figure 5). Also, during the month of May, this gyre is less strong and is divided into smaller gyres. These patterns are validated trough satellite data as all of these features were already described [1,2]. The circulation in the Alkyonides area seems to be still on average during winter and spring while in summer the surface circulation goes clockwise in the bay and seems to be an extension of the Antikyra gyre (Figure 5C).
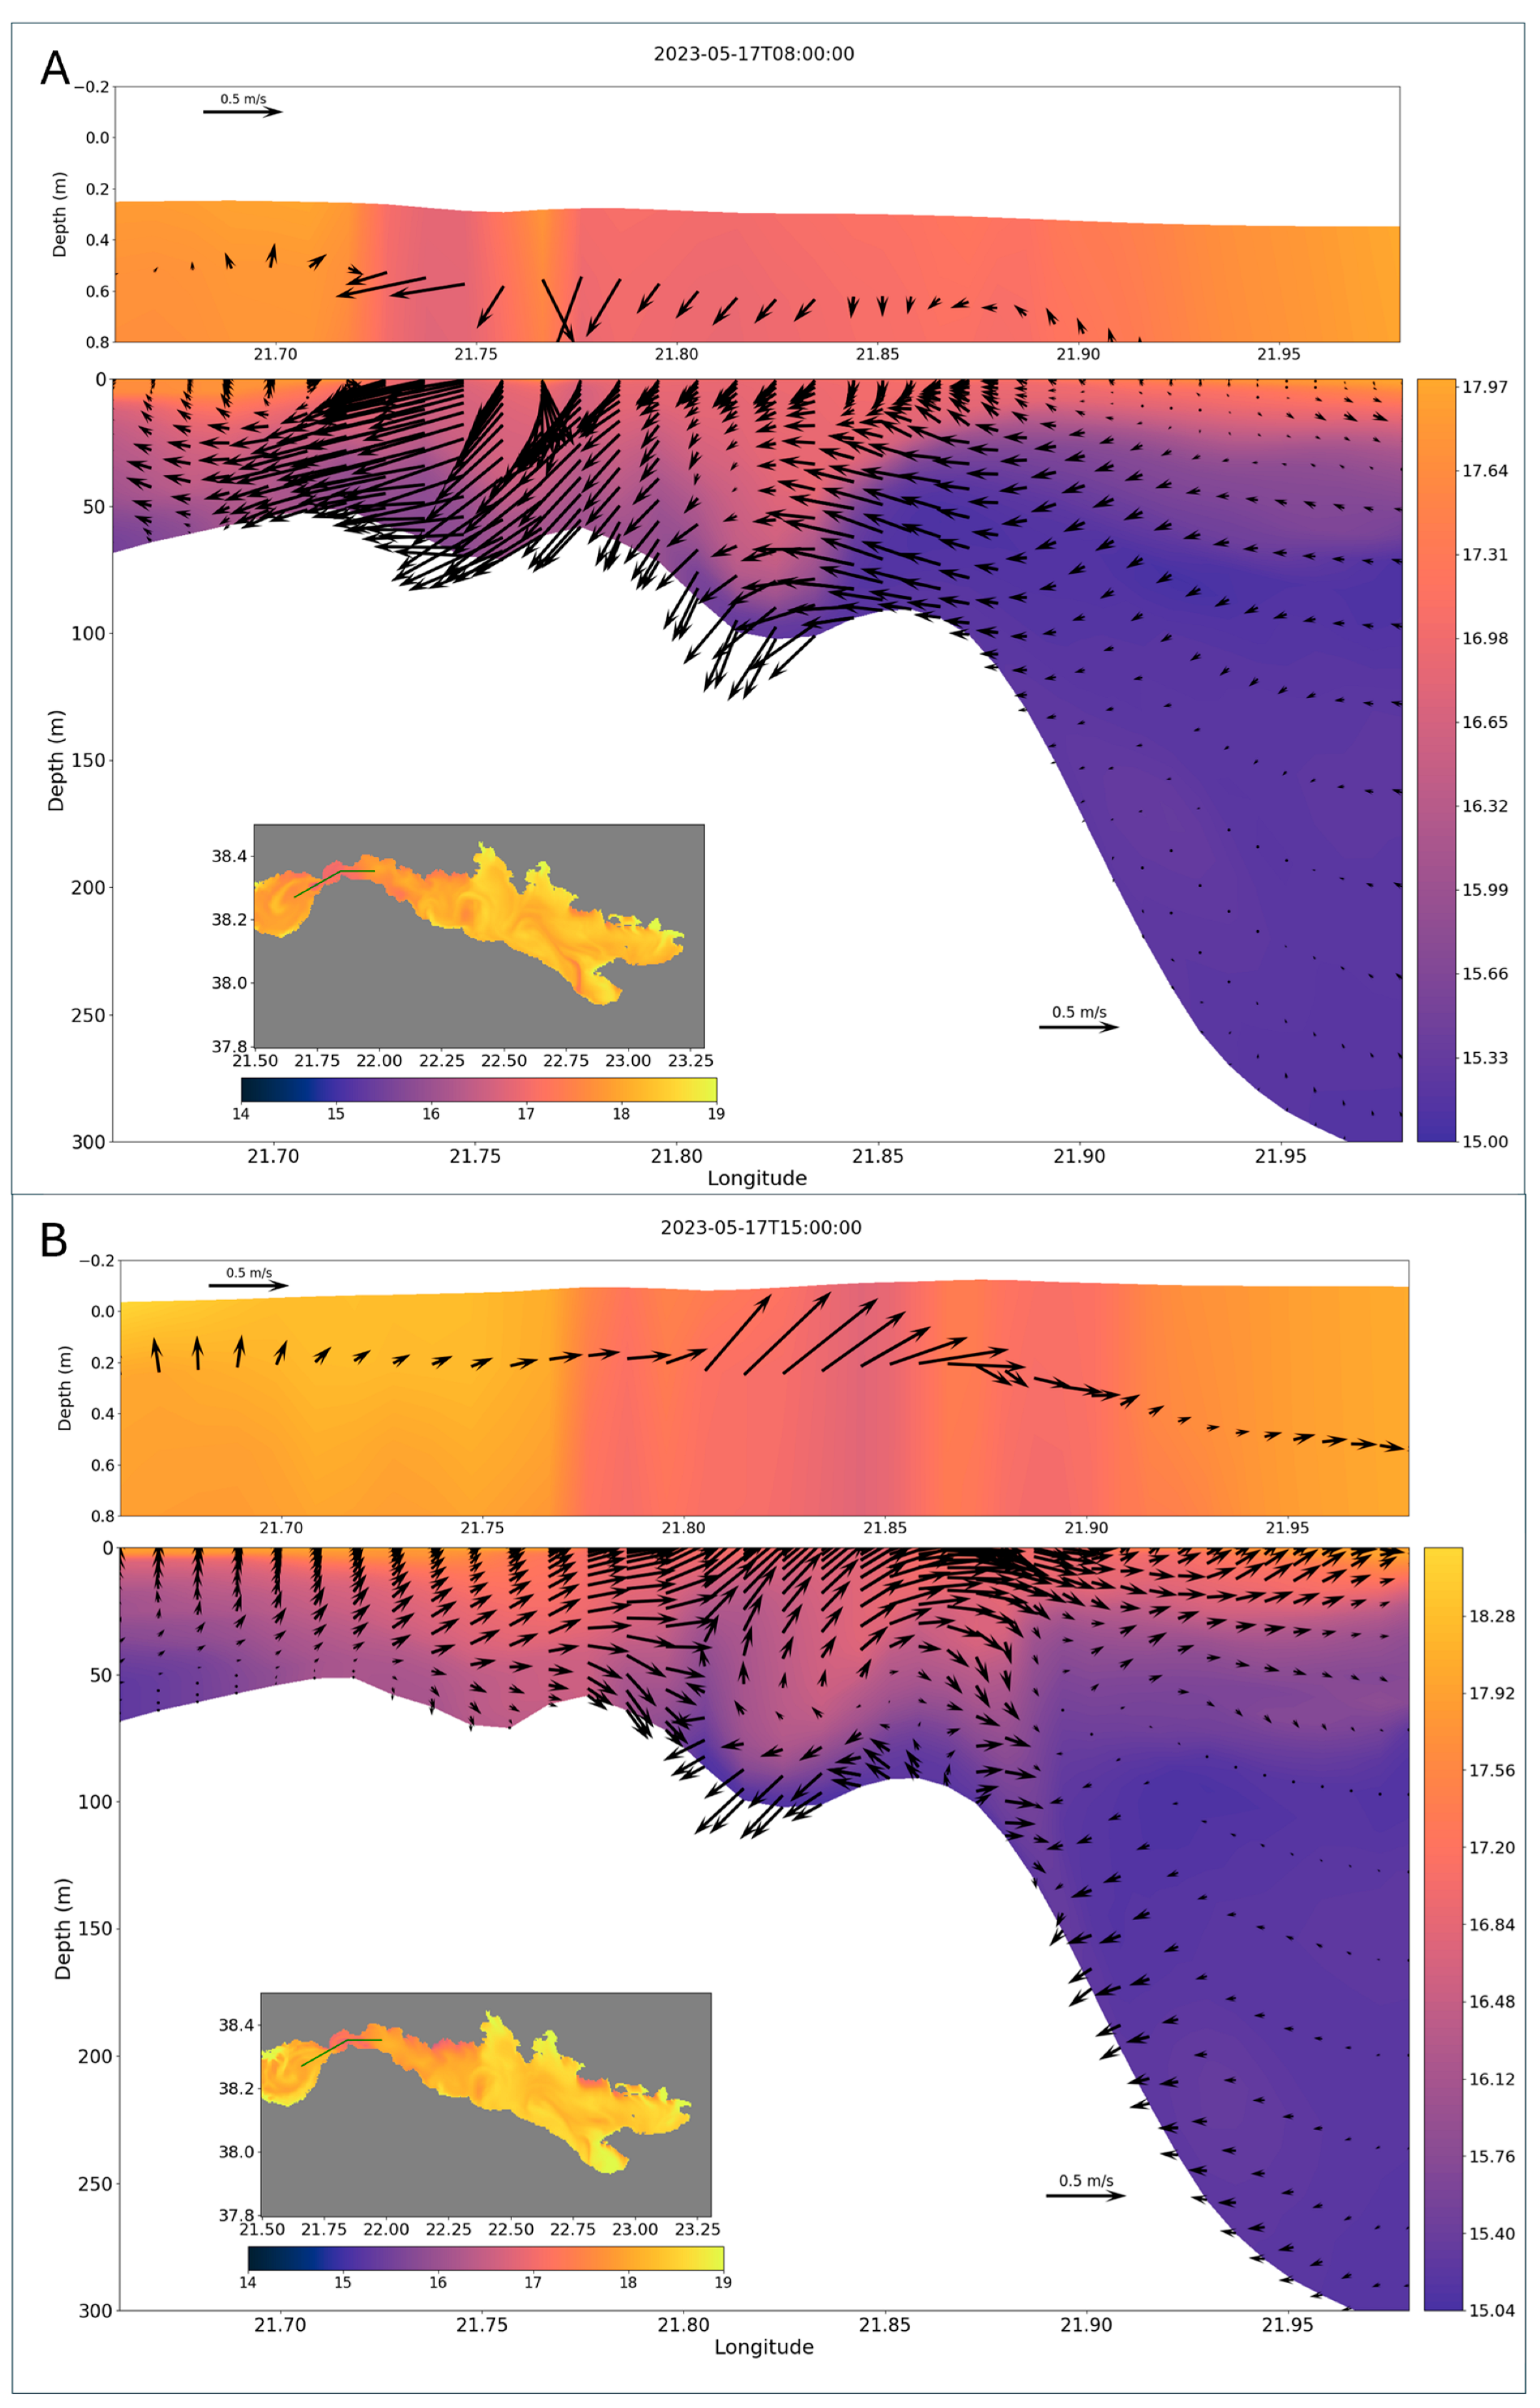
The entrance of the Corinth Gulf (the Rio–Antirio Strait area) remains the coldest area of the domain in terms of SST (Figure 4) [1]. The modelled phenomenon occurring in this area explains what was deduced before [1,14]. By doing a vertical section through the strait (Figure 7), it appears that, according to the phase of the tide (Figure 6), the deep and cold water coming from the Gulf of Corinth does not always cross the strait. With the upsloping due to the steep rise in bathymetry, the bottom currents reach the subsurface. If the surface current flows towards the Patraic Gulf, which is the case during ebb tide (Figure 6), the whole water column can be displaced towards the west with strong bottom current entering the Patraic Gulf. If the surface current is going towards the Corinthian Gulf (during flood tide; Figure 6), the bottom currents are then brought to the surface and reflected to the Corinthian Gulf. In this second case, cold water reaches the surface which lowers the SST near the East of the Rio–Antirio Strait.
The behavior of the internal wave generated by the density difference of the waters and the interaction between the surface and the bottom currents can be associated to the tides and their directions (Figure 6 and Figure 7). This conclusion is supported by the observation of a shift in current direction every 6 h (Figure 6 and Figure 7), consistent with the tidal phases at this location [14,33,34]. Since the Rio–Antirio Strait lies in a microtidal context [3,13,34,35,36], as part of the Mediterranean Sea, the maximal tidal amplitude observed is less than 30 cm (Figure 7) [30,33] which appears irrelevant compared to the depth of the adjacent basins. In this case, the tide impact is more reflected by the presence of an internal tide due to the bathymetric variations of the strait [3,14], rather than the small amplitude of the waves (Figure 7).

4.3. Wind Impact over the Patras and Corinthian Gulf

To answer the question about the wind being one important factor over the surface dynamics in the Gulfs of Patras and Corinth we observed three situations.
For the Patraic Gulf, the wind plays an important role as in the “no wind” situation, the waters along the northern coast stay still on average (Figure 8). Thus, when no easterly winds are present over the gulf—easterly winds being present over the month of May 2023 (Figure 9)—only the southern part of the Patras waters is dynamic overall. When the easterly winds are enhanced, the Patras gyre velocities are therefore enhanced. With these observations, the Patras gyre can be considered as wind-driven since it disappears when there is no wind and is enhanced when the wind is enhanced. Regarding SST, increasing the wind will decrease the temperature by around 2 °C on average. The “no-wind” case will result in a 2 °C increase for the average SST of the Patraic Gulf (Figure 8).
At the Rio–Antirio Strait location, it appears that winds have few effects other than changing the water temperature (Figure 8). Water movement does not change despite the wind being absent or enhanced. This information is relevant to identify that the rising from the colder bottom waters from the Corinthian Gulf is due to an upsloping or an upslope flow (Figure 7), rather than a wind-driven upwelling [37]. Indeed, the cold surface waters are still present even in a “no-wind” case.
In the Gulf of Corinth, the gyres have different behavior depending on the wind intensity. The gyre in front of the Bay of Itea appears less strong in the “no-wind” situation. This might be due to the general direction for the wind over the month of May 2023 that would have induced a movement of the surface waters towards the west. Despite not being a clear gyre movement, anticyclonic circulation can still be observed in front of the Bay of Itea (Figure 8). In the enhanced wind simulation, the gyre is larger, anticyclonic, and has less interactions with the waters in front of the Bay of Antikyra.
Still in the enhanced wind simulation, the dynamic in front of the Bay of Antikyra appears on average less circular but still with a cyclonic movement. The cyclonic movement in a big and unique gyre is present in front of the Bay of Antikyra in the “no-wind” simulation (Figure 8).

4.4. Dynamics at the Bottom

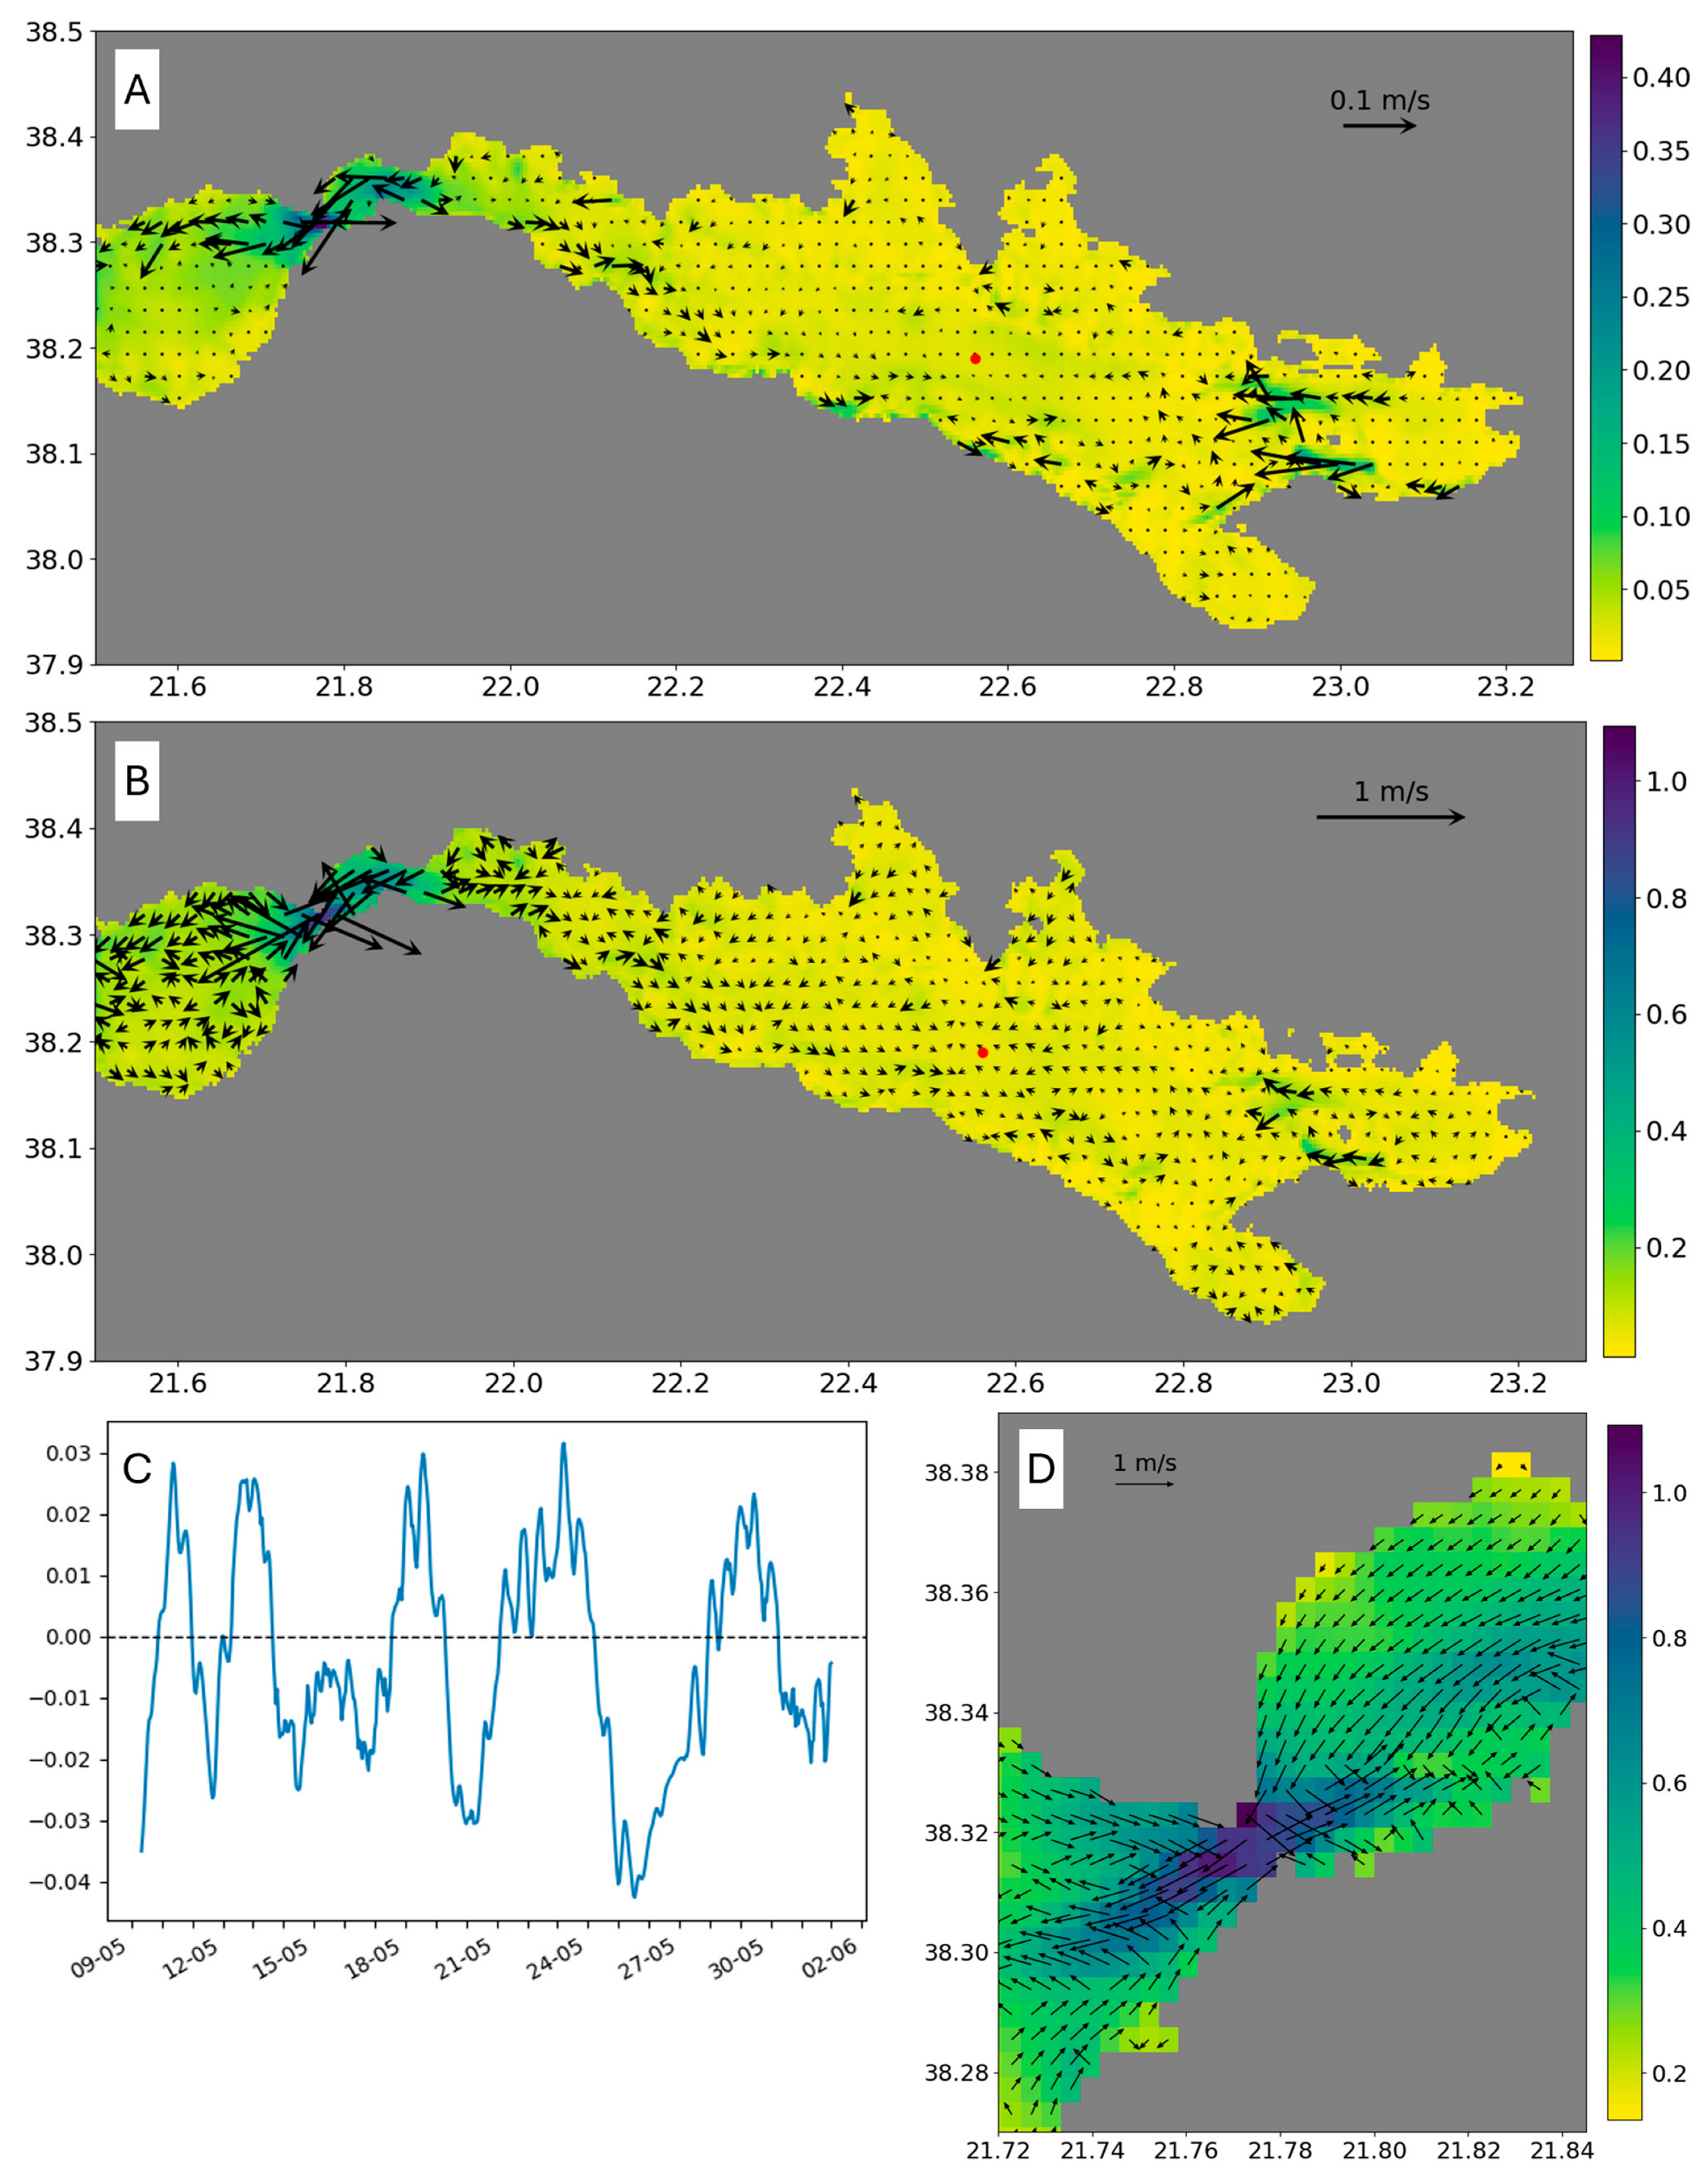
While surface dynamics have been described several times for the Corinthian Gulf [1,2,11,13], evidence of bottom dynamics is sparse in the center of the Corinthian Gulf [10] or focused on the Rio–Antirio Strait [14]. ROMS simulations provide new insights into bottom dynamics. With an overview of the mean velocities at the bottom of the Corinthian Gulf, three main regions can be observed: the Rio–Antirio Strait, the deep Corinth Basin and the surroundings of the Zoodochos Island (Figure 10).
The Rio–Antirio Strait is the most energetic area of the gulf. The high-velocities bottom currents of the strait have already been investigated [14] but the modelling offers a new perspective for their origins (Figure 10D). It seems the origin of these high velocities is the bathymetric constriction that the strait presents. Indeed, the bathymetric constriction between the deep Corinthian Gulf and the Rio–Antirio Strait (350 m in 45 km; Figure 1 and Figure 2) forces bottom waters to flow upslope, accelerating as they approach the narrower and shallower sections of the strait. The slope becomes steeper in front of the Mornos Delta where bottom velocities start reaching a maximum of 0.5 m/s. In the strait sensu-stricto, maximum velocities of 1.3 m/s are found near the most constricted area. The strongest currents, on average, are the ones that exit the Corinthian Gulf through the bottom of the strait to reach the Patraic Gulf (Figure 10A).
From the strait to the center of the Corinthian Gulf, the velocities at the bottom decrease as the depth increases. Some higher local velocities can be found near the steep depth increases, mostly along the southern coast of the gulf. In the center of the Corinthian Gulf, the average speed for the bottom current velocity is close to 0.01 m/s. The maximum velocities in the area can reach up to 0.25 m/s but it seems that these velocities are located near the slopes of the basin. A near 0 m/s average velocity indicates that there are variations in the directions of the currents indicating the presence of different directions flow (Figure 10C). This observed shift in direction was already evidenced by in situ data from Poulos et al., 1996 [10] with a shift every 2 to 3 days. This flow seems to reach at maximum around 0.05 m/s, which is very slow compared to the strait area velocities. By looking at their directions during the month of May 2023 (Figure 10B), the bottom currents in the central part of the Corinthian Gulf follow a cyclonic circulation with the stronger currents following the southern coast of the gulf.
The bathymetric rise from the deep Corinth basin to the shallower Alkyonides basin presents an area where bottom currents are stronger than the average ones in other parts of the Gulf (except in the Rio–Antirio Strait; Figure 10). The currents near the Alkyonides are unidirectional as they are mainly going towards the west. They follow the bathymetric depression through the canyons in the area going towards the deep Corinth Basin, exiting the enclosed bay of the Alkyonides. Due to the presence of the Zoodochos Island and the relatively steep bathymetric rise, the Alkyonides Gulf appears separated from the main Corinthian Gulf body. The presence of the island creates a local dynamic with very low velocities on average (Figure 11). Also, the bottom waters from the Alkyonides appear to leave this gulf by cascading at the bottom, through the canyons, towards the Corinthian Gulf.

4.5. Influence of the Tide

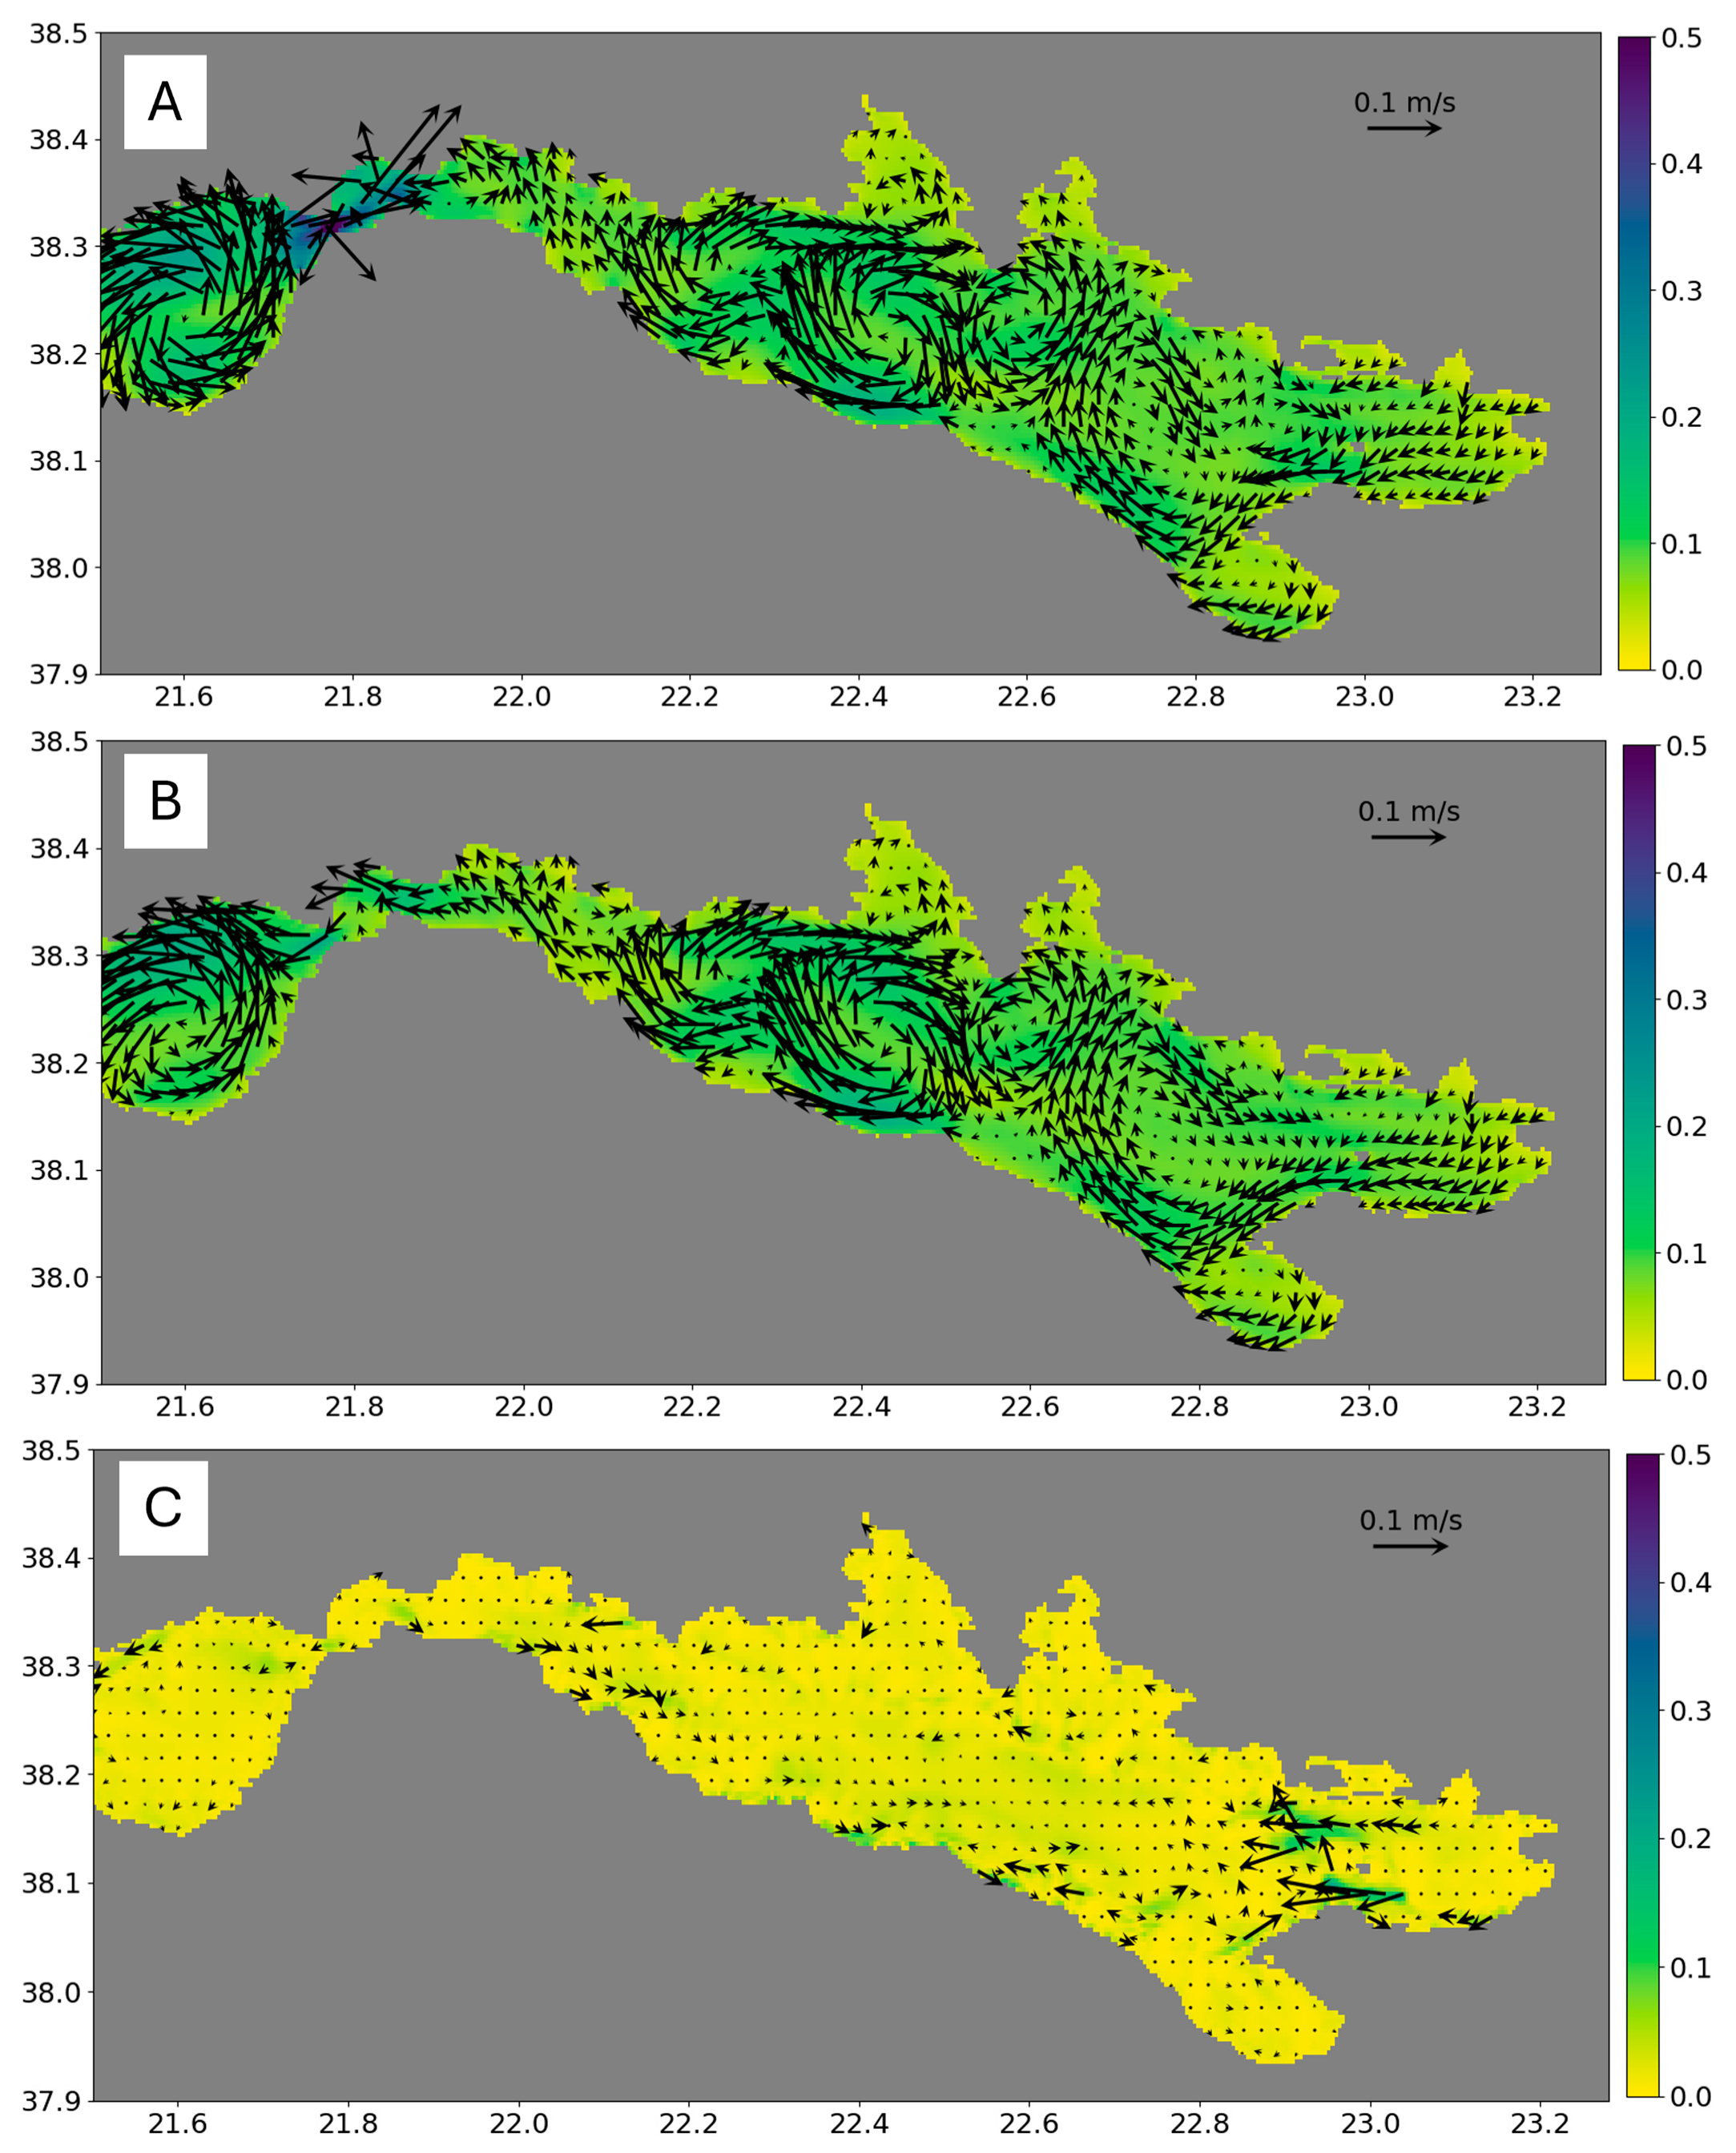
The influence of the wind previously discussed was mainly observable for the surface dynamics. For a specific simulation, we did not use any tidal forcing to determine the importance of the tidal forcing compared to the wind forcing. On one hand, the enhancement or the negation of the wind mainly affected surface dynamics and not that much the bottom (Figure 8). On the other hand, negating the tides results in differences in the whole water column dynamics, particularly near the Rio–Antirio Strait (Figure 12). The Patraic Gulf appears to be affected by the neglection of the tides but with a smaller range of modifications.
The fact that these areas are more sensitive to the tides might be linked to two factors. First, the tides are forced at the boundaries of the grid which in our case corresponds to the western part of the Patraic Gulf. Second, these areas are the shallowest of the domain, particularly the Rio–Antirio Strait. Therefore, the tidal amplitude (even if it stays in the microtidal range; Figure 6 and Figure 7) appears relatively stronger in those areas rather than in the deep Corinthian Gulf. Nevertheless, not accounting the tide in the simulations does not provide velocities strong enough to be compared to what is observed through in situ data near the Rio–Antirio Strait (Figure 3) [14]. Due to its bathymetry, the deep Corinthian Gulf is less affected by the tides (Figure 12), the differences between the two simulations being very close to 0. This also indicates that surface phenomenon in the center part of the Corinthian Gulf is more wind driven than tide driven. The difference between the simulations resides in the fact that the Corinthian Gulf is considered microtidal [3,14,34,35,36], therefore tides have low impact over the general circulation. The only place where the impact is higher is in the Rio–Antirio Strait due to the tidal amplification associated to straits [36,38,39,40,41,42,43,44,45]. There, even if the tidal amplitude is very low (less than 30 cm [30,33]) the tidal currents affect the whole water column, particularly the bottom, due to the presence of an internal wave (Figure 6, Figure 7, Figure 10 and Figure 12).

5. Discussion

5.1. Genreal Circulation Patterns

From West to East, the surface circulation is similarly modelled to what was already described [1,2]. The Patras gyre is well represented, regardless of the season or the wind influence. New insights are for the Rio–Antirio Straight area. The strait area still appears as the coldest of the region (Figure 4 and Figure 8) and the vertical sections and the analysis of the currents at depth allow to understand the impacts of the circulation over the surface temperature. Near the strait, what was interpreted as upwellings [1,2] now appear more like upsloping. The water coming from the depth of the Corinth Basin is forced to move upwards due to the steep bathymetric rise from the center of the gulf to the Mornos Delta. More variations of the bathymetry are located near the strait sensu-stricto, causing the colder waters to move faster near the bottom due to the shallowing of the bathymetry (Figure 7).
Going towards the center of the gulf, the surface gyres previously described are also present in the numerical simulations. The intensity and location of the gyres change according to the wind intensity (Figure 8) and the seasons (Figure 5), but overall they remain at the same location. Regarding the bottom circulation in the center of the Gulf, few descriptions were previously made by Poulos et al., 1996 [10]. With our model we were able to better understand the patterns of the bottom circulation. The center of the Corinthian Gulf can be described as quiet with maximal velocities not exceeding 0.1 m/s. Also, it appears that the direction of the currents is shifting every 2 to 3 days (Figure 10C), similar to what was observed through in situ data by Poulos et al. in 1996 [10].
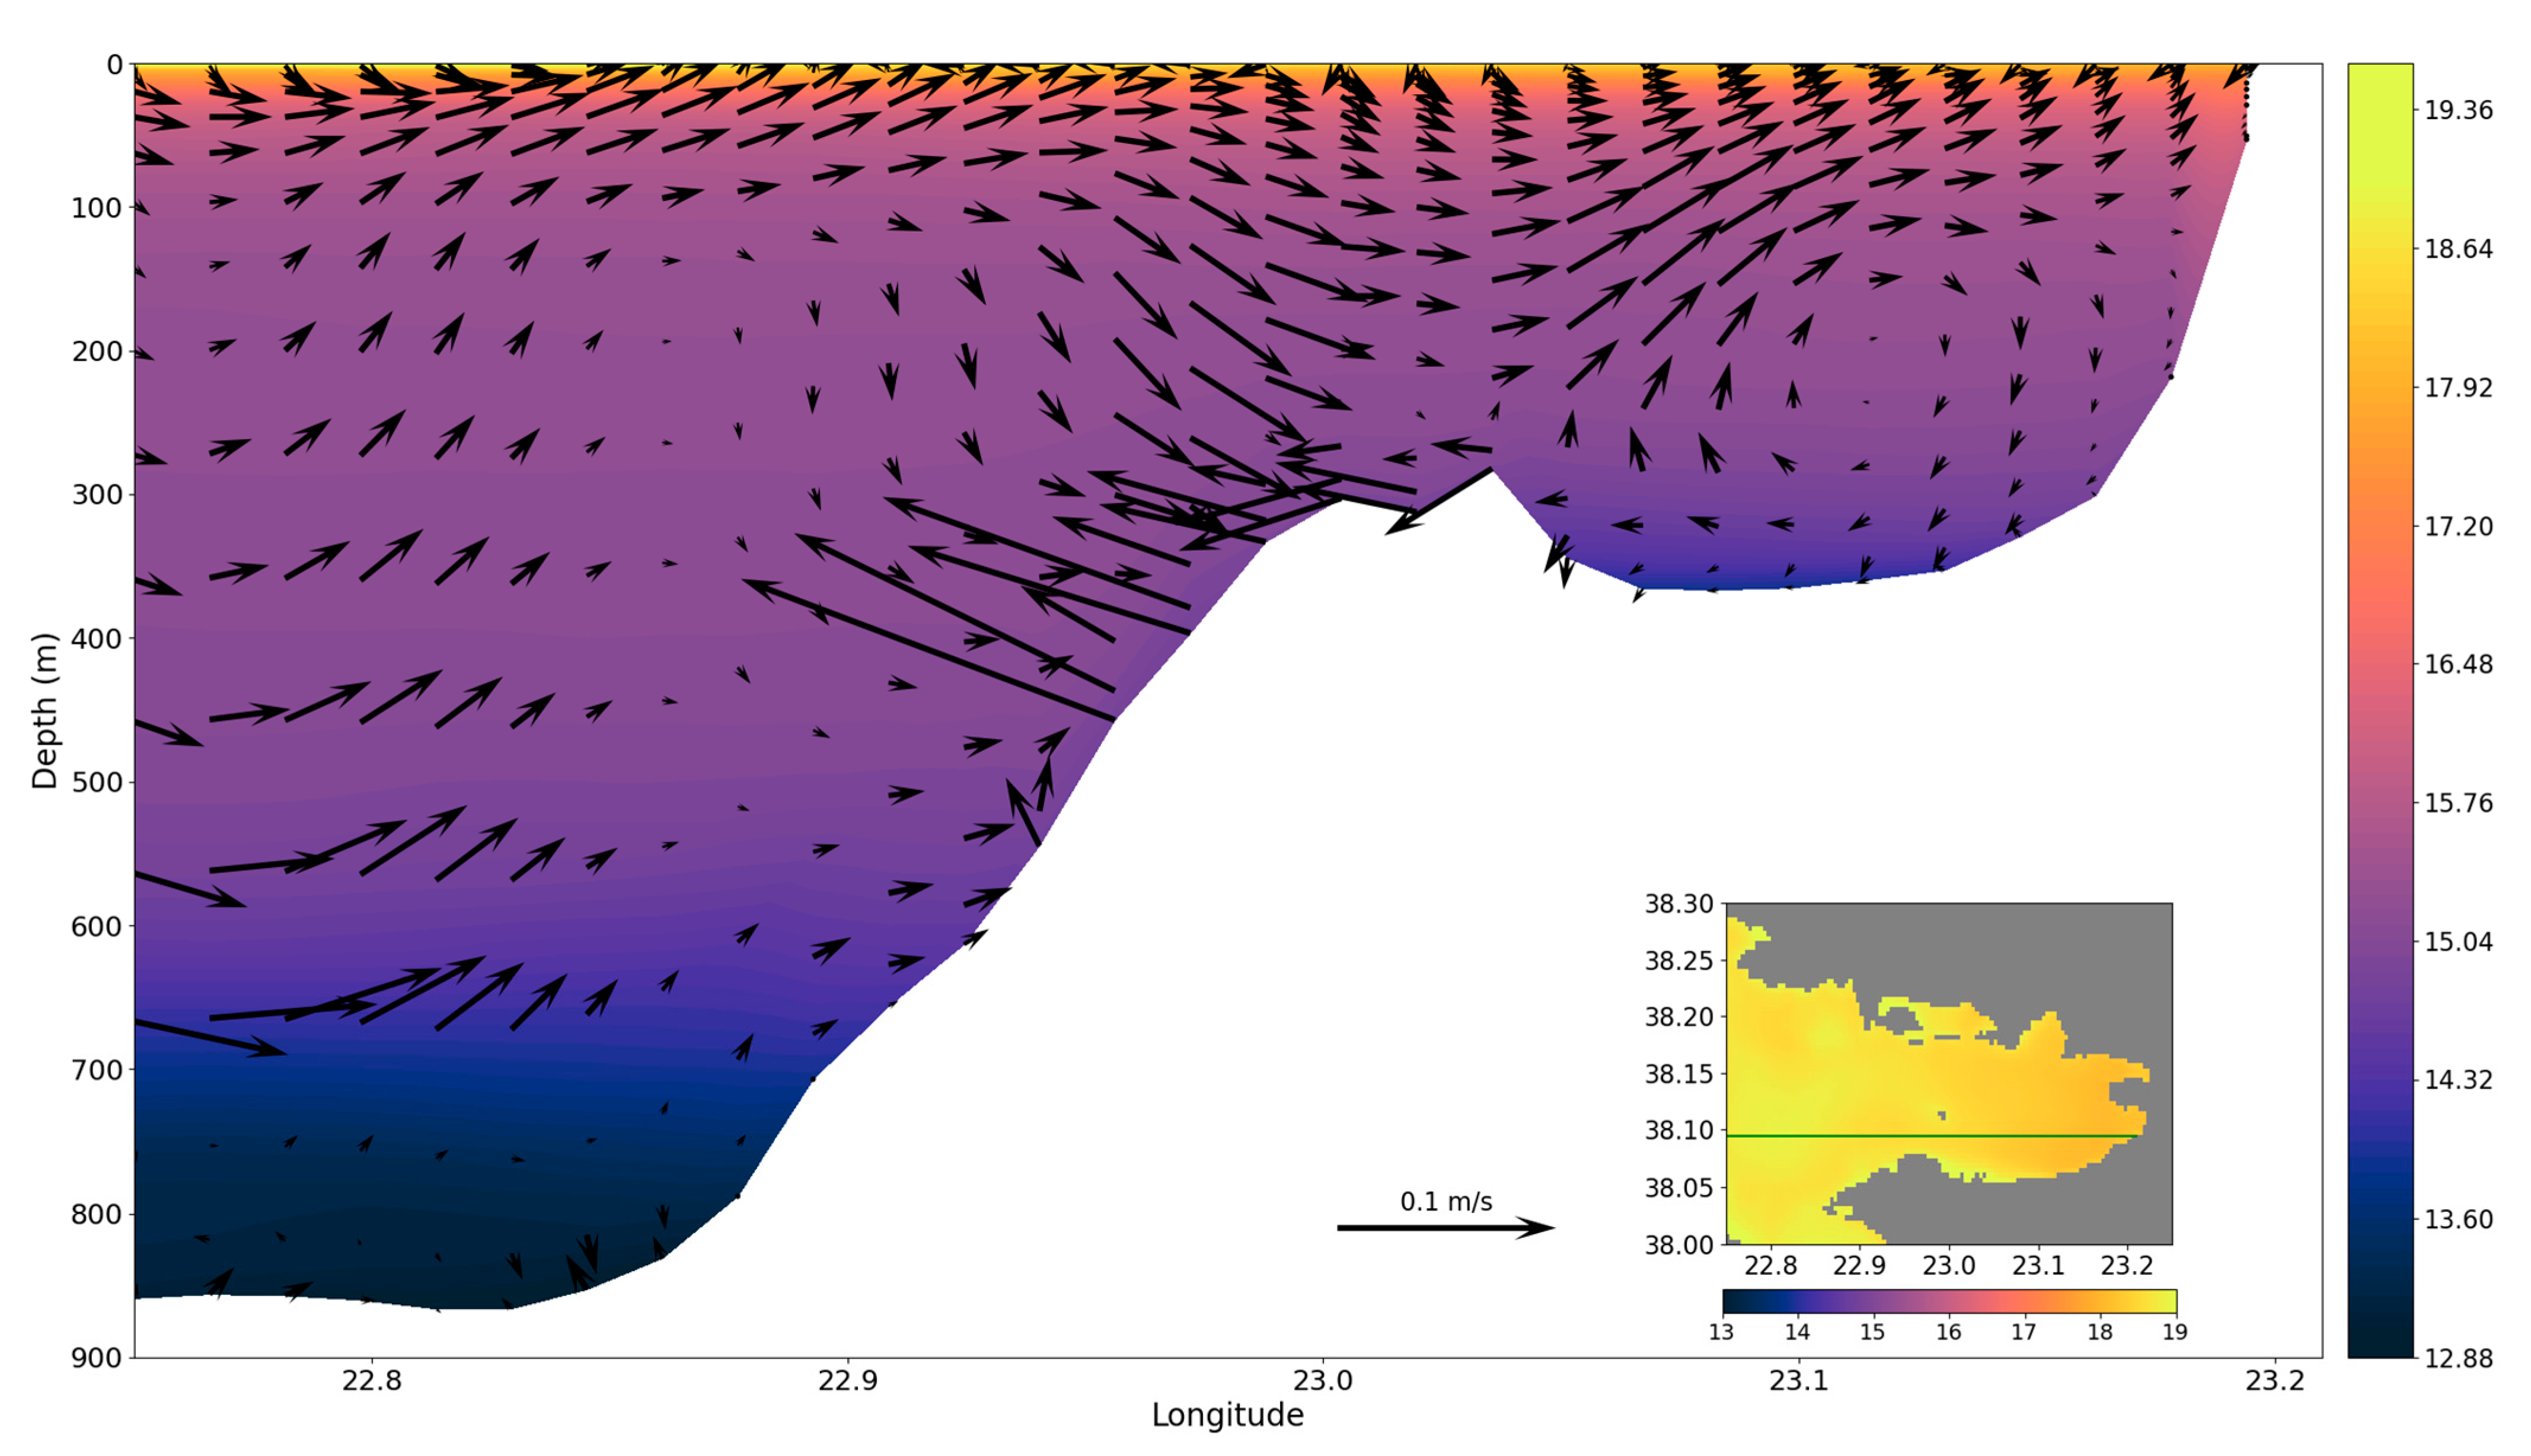
In the Alkyonides Gulf, the waters seem to be trapped in an enclosed basin due to the presence of the Zoodochos Island. During the months of May and September 2023 (Figure 5), an anticyclonic circulation is observable at the surface, allowing the waters to circulate back towards the Corinthian Gulf. By observing the average behavior for the currents for the month of May 2023, high velocity flows are found at the bottom of the canyons from the Alkyonides to the Corinthian Gulf (Figure 11). With the modelling, no clear evidence of the suspected upwellings [1] in the Alkyonides was found. The closest phenomenon to an upwelling was the internal dynamics of the Alkyonides due to the presence of the Zoodochos Island increasing the local bathymetry, constraining the waters in the small gulf. Despite the presence of currents going upwards (Figure 11), no significative temperature flows can be observed to qualify this phenomenon as upwelling.

5.2. Main Forcings for the Hydrodynamic Circulation

With our simulations we explored the effect of enhancing the winds as well as negating it and the tides. With the winds, mainly the surface circulation was affected (Figure 8). The Patraic Gulf appears quite steady regardless of the wind intensity if this wind is blowing to the west, as was the case for May 2023. The size, intensity, or even direction of the gyres in the Corinthian Gulf also depend on the wind.
For the tides, the center of the Corinthian Gulf, at least at the bottom, is not affected by their presence or absence since the surface modification of the dynamics does not reach the deepest part of the gulf. The Patraic Gulf, by being shallower, seems to have its bottom dynamics affected by the non-inclusion of the tide forcing. The water still moves following a cyclonic circulation but with lower velocity (Figure 12).
The critical region under the influence of both winds and tide is the Rio–Antirio Strait area and the waters in front of the Mornos Delta. In this area, tidal currents are needed to generate the observed velocities (Figure 3, Figure 6 and Figure 12) [14]. Without the tides, dynamics in the whole water column are observed to be quieter around the strait. In a “no wind” scenario, tidal dynamics overcomes the movement induced by the winds and dynamics are still present. Tidal dynamics are prevalent over the Rio–Antirio Strait, particularly when it regards the overflow of the strait from the deep Corinth waters. Under ebb tide, bottom waters are going towards the Patraic Gulf (Figure 6), overflowing the strait (Figure 7). Under flood tide, the deep-water Corinth’s flow is not crossing the strait and is then flowing back towards the Corinthian Gulf (Figure 6 and Figure 7). This dynamic related to the tide is observed to be the opposite of what was previously described [14] but appears to be very consistent with the observed current direction and SSH (Figure 6 and Figure 7). Our observations of the changes in the current direction at this location suggest a different origin from what was already observed by Aspioti and Fourniotis (2025) [13]. In their study, the direction towards the Patraic Gulf occurs under the influence of a 4 m/s NE wind and the flood tide, while the flow going to the Corinthian Gulf was observed under ebb tide and 4 m/s SW wind conditions [13]. In our study, we associate these movements more likely to the tides rather than the winds, classifying the strait as a tidal strait in a microtidal context [14,36,43]. Indeed, when the tides are negated, no evidence of strong movement are observed (Figure 12) and movement towards the Patraic Gulf appear during ebb tide (Figure 6). The role of the tide or the winds could be investigated further to understand in which proportion they affect the current direction near the Rio–Antirio Strait.

6. Conclusions

Our study presented a description of a numerical point of view over the hydrodynamics circulation of the Patraic and Corinthian Gulfs. The combined forcing of the winds and the tide over the model proved that they both are needed to study the oceanographic dynamic. Both the Patraic and Corinthian Gulfs are sensitive to the winds but are even more dependent on the tide, particularly for the bottom dynamics. Over all the seasons observed (January 2023, May 2023, and September 2023), the dynamics appear to be steady in time with the presence of surface gyres in the Patraic and Corinthian Gulfs.
The most sensitive location of the area in terms of dynamics is the Rio–Antirio Strait where the most energetic sea area is observed. Very high bottom velocities, up to 1.3 m/s can be found and related to the tidal influence in a relatively shallow area. The tidal induced movement over the bottom water is controlling the exchanges between the two gulfs, allowing the overflow, or not, of the deep Corinth waters over the Rio–Antirio Strait to the Patraic Gulf. While in shallow waters the dynamics are strong, in the deep center of the Corinthian Gulf, bottom velocities appear to close to 0 m/s, making the central part of this basin very quiet.

Author Contributions

Conceptualization, B.C. and A.H.-F.; methodology, B.C. and A.B.; software, B.C. and A.B.; validation, B.C., A.H.-F., A.B. and J.-M.B.; formal analysis, B.C.; investigation, B.C.; resources, A.H.-F. and J.-M.B.; data curation, B.C.; writing—original draft preparation, B.C.; writing—review and editing, B.C., A.H.-F., A.B. and J.-M.B.; visualization, B.C.; supervision, A.H.-F. and J.-M.B.; funding acquisition, B.C. and A.H.-F. All authors have read and agreed to the published version of the manuscript.

Funding

This publication is funded within the support of the French Community of Belgium with the FRIA/FNRS grant PDR R.FNRS.5472.

Institutional Review Board Statement

Not applicable.

Informed Consent Statement

Not applicable.

Data Availability Statement

The data used as forcing for the model are available on their respective websites. GEBCO Bathymetry: https://www.gebco.net/data-products/gridded-bathymetry-data (accessed on 28 December 2023); CMEMS model: https://doi.org/10.25423/CMCC/MEDSEA_MULTIYEAR_PHY_006_004_E3R1 (accessed on 28 December 2023); TPXO model: https://www.tpxo.net/ (accessed on 28 December 2023); ECMWF: https://www.ecmwf.int/en/forecasts/dataset/operational-archive (accessed on 28 December 2023). The ROMS code is available on https://www.myroms.org/ (accessed on 28 December 2023) and the code used to start the configuration and the runs of the model are available on https://alexander-barth.github.io/ROMS.jl/dev/ (accessed on 28 December 2023) [21].

Acknowledgments

The authors would like to thank Evgeny Ivanov for his help with the ROMS’s first steps and the adaptation of the tidal forcing files.

Conflicts of Interest

The authors declare no conflicts of interest.

References

  1. Caterina, B.; Hubert-Ferrari, A. Using 14 Years of Satellite Data to Describe the Hydrodynamic Circulation of the Patras and Corinth Gulfs. J. Mar. Sci. Eng. 2025, 13, 623. [Google Scholar] [CrossRef]
  2. Lascaratos, A.; Salusti, E.; Papageorgaki, G. Wind-Induced Upwellings and Currents in the Gulfs of Patras, Nafpaktos and Korinthos, Western Greece. Oceanol. Acta 1989, 12, 159–164. [Google Scholar]
  3. Fourniotis, N.T. Effect of Internal Waves on the Hydrodynamics of a Mediterranean Sea Strait. J. Mar. Sci. Eng. 2024, 12, 532. [Google Scholar] [CrossRef]
  4. Ori, G.G. Geologic History of the Extensional Basin of the Gulf of Corinth (?Miocene-Pleistocene), Greece. Geology 1989, 17, 918–921. [Google Scholar] [CrossRef]
  5. Rohais, S.; Eschard, R.; Ford, M.; Guillocheau, F.; Moretti, I. Stratigraphic Architecture of the Plio-Pleistocene Infill of the Corinth Rift: Implications for Its Structural Evolution. Tectonophysics 2007, 440, 5–28. [Google Scholar] [CrossRef]
  6. McNeill, L.C.; Shillington, D.J.; Carter, G.D.O.; Everest, J.D.; Gawthorpe, R.L.; Miller, C.; Phillips, M.P.; Collier, R.E.L.; Cvetkoska, A.; De Gelder, G.; et al. High-Resolution Record Reveals Climate-Driven Environmental and Sedimentary Changes in an Active Rift. Sci. Rep. 2019, 9, 3116. [Google Scholar] [CrossRef]
  7. Nixon, C.W.; McNeill, L.C.; Bull, J.M.; Bell, R.E.; Gawthorpe, R.L.; Henstock, T.J.; Christodoulou, D.; Ford, M.; Taylor, B.; Sakellariou, D.; et al. Rapid Spatiotemporal Variations in Rift Structure during Development of the Corinth Rift, Central Greece. Tectonics 2016, 35, 1225–1248. [Google Scholar] [CrossRef]
  8. Beckers, A.; Hubert-Ferrari, A.; Beck, C.; Bodeux, S.; Tripsanas, E.; Sakellariou, D.; De Batist, M. Active Faulting at the Western Tip of the Gulf of Corinth, Greece, from High-Resolution Seismic Data. Mar. Geol. 2015, 360, 55–69. [Google Scholar] [CrossRef]
  9. Beckers, A.; Beck, C.; Hubert-Ferrari, A.; Tripsanas, E.; Crouzet, C.; Sakellariou, D.; Papatheodorou, G.; De Batist, M. Influence of Bottom Currents on the Sedimentary Processes at the Western Tip of the Gulf of Corinth, Greece. Mar. Geol. 2016, 378, 312–332. [Google Scholar] [CrossRef]
  10. Poulos, S.E.; Collins, M.B.; Pattiaratchi, C.; Cramp, A.; Gull, W.; Tsimplis, M.; Papatheodorou, G. Oceanography and Sedimentation in the Semi-Enclosed, Deep-Water Gulf of Corinth (Greece). Mar. Geol. 1996, 134, 213–235. [Google Scholar] [CrossRef]
  11. Fourniotis, N.T.; Horsch, G.M. Three-Dimensional Numerical Simulation of Wind-Induced Barotropic Circulation in the Gulf of Patras. Ocean Eng. 2010, 37, 355–364. [Google Scholar] [CrossRef]
  12. Fourniotis, N.T.; Horsch, G.M. Baroclinic Circulation in the Gulf of Patras (Greece). Ocean Eng. 2015, 104, 238–248. [Google Scholar] [CrossRef]
  13. Aspioti, A.G.; Fourniotis, N.T. Numerical Study of Barotropic Circulation in the Gulfs of Patras and Corinth System. Oceans 2025, 6, 10. [Google Scholar] [CrossRef]
  14. Rubi, R.; Hubert-Ferrari, A.; Fakiris, E.; Christodoulou, D.; Dimas, X.; Geraga, M.; Papatheodorou, G.; Caterina, B. Hydrodynamics and Sedimentary Processes in the Modern Rion Strait (Greece): Interplay between Tidal Currents and Internal Tides. Mar. Geol. 2022, 446, 106771. [Google Scholar] [CrossRef]
  15. Paramana, T.; Karditsa, A.; Petrakis, S.; Milatou, N.; Megalofonou, P.; Dassenakis, M.; Poulos, S. Ecosystem-Based Blue Growth: The Case of the Semi-Enclosed Embayment of the Inner NE Ionian Sea and Adjacent Gulfs. Water 2023, 15, 2892. [Google Scholar] [CrossRef]
  16. Ferentinos, G.; Brooks, M.; Doutsos, T. Quaternary Tectonics in the Gulf of Patras, Western Greece. J. Struct. Geol. 1985, 7, 713–717. [Google Scholar] [CrossRef]
  17. Koletsis, I.; Kotroni, V.; Lagouvardos, K. A Model-Based Study of the Wind Regime over the Corinthian Gulf. Nat. Hazards Earth Syst. Sci. 2014, 14, 459–472. [Google Scholar] [CrossRef]
  18. Moore, A.M.; Arango, H.G.; Broquet, G.; Powell, B.S.; Weaver, A.T.; Zavala-Garay, J. The Regional Ocean Modeling System (ROMS) 4-Dimensional Variational Data Assimilation Systems. Prog. Oceanogr. 2011, 91, 34–49. [Google Scholar] [CrossRef]
  19. Nagy, H.; Di Lorenzo, E.; El-Gindy, A. The Impact of Climate Change on Circulation Patterns in the Eastern Mediterranean Sea Upper Layer Using Med-ROMS Model. Prog. Oceanogr. 2019, 175, 226–244. [Google Scholar] [CrossRef]
  20. Mujiasih, S.; Beckers, J.-M.; Barth, A. Implementation and Validating of the Regional Ocean Model System (ROMS) for the Sunda Strait Connecting the Java Sea to the Indian Ocean. In Proceedings of the EGU General Assembly 2021, Online, 19–30 April 2021. [Google Scholar]
  21. Barth, A. ROMS.Jl. Available online: https://alexander-barth.github.io/ROMS.jl/dev/ (accessed on 18 March 2025).
  22. Shchepetkin, A.F.; McWilliams, J.C. The Regional Oceanic Modeling System (ROMS): A Split-Explicit, Free-Surface, Topography-Following-Coordinate Oceanic Model. Ocean Model. 2005, 9, 347–404. [Google Scholar] [CrossRef]
  23. Caterina, B.; Rubi, R.; Hubert-Ferrari, A. Stratigraphic Architecture, Sedimentology and Structure of the Middle Pleistocene Corinth Canal (Greece). Geol. Soc. Lond. Spec. Publ. 2022, 523, 279–304. [Google Scholar] [CrossRef]
  24. WikiROMS. Vertical S-Coordinate. Available online: https://www.myroms.org/wiki/Vertical_S-coordinate (accessed on 9 September 2025).
  25. Shchepetkin, A.F.; McWilliams, J.C. Correction and Commentary for “Ocean Forecasting in Terrain-Following Coordinates: Formulation and Skill Assessment of the Regional Ocean Modeling System” by Haidvogel et al., J. Comp. Phys. 227, pp. 3595–3624. J. Comput. Phys. 2009, 228, 8985–9000. [Google Scholar] [CrossRef]
  26. Buongiorno Nardelli, B.; Tronconi, C.; Pisano, A.; Santoleri, R. High and Ultra-High Resolution Processing of Satellite Sea Surface Temperature Data over Southern European Seas in the Framework of MyOcean Project. Remote Sens. Environ. 2013, 129, 1–16. [Google Scholar] [CrossRef]
  27. Egbert, G.D.; Bennett, A.F.; Foreman, M.G.G. TOPEX/POSEIDON Tides Estimated Using a Global Inverse Model. J. Geophys. Res. Ocean. 1994, 99, 24821–24852. [Google Scholar] [CrossRef]
  28. Egbert, G.D.; Erofeeva, S.Y. Efficient Inverse Modeling of Barotropic Ocean Tides. J. Atmos. Ocean. Technol. 2002, 19, 183–204. [Google Scholar] [CrossRef]
  29. Oceanus-Lab. Oceanus-Lab. Available online: https://www.oceanus-lab.gr/ (accessed on 24 March 2025).
  30. Tideschart. Rio Tide Times. Available online: https://www.tideschart.com/Greece/West-Greece/Nomos-Achaias/Rio/ (accessed on 11 September 2025).
  31. Schlitzer, R. Ocean Data View. 2021. Available online: https://odv.awi.de (accessed on 24 March 2025).
  32. CMEMS. Mediterranean Sea—High Resolution and Ultra High Resolution L3S Sea Surface Temperature. Available online: https://data.marine.copernicus.eu/product/SST_MED_SST_L3S_NRT_OBSERVATIONS_010_012/description (accessed on 24 March 2025).
  33. Flanders Marine Institute (VLIZ). Sea Level Station Monitoring Facility. Available online: https://www.ioc-sealevelmonitoring.org (accessed on 17 September 2025).
  34. Tsimplis, M.N. Tidal Oscillations in the Aegean and Ionian Seas. Estuar. Coast. Shelf Sci. 1994, 39, 201–208. [Google Scholar] [CrossRef]
  35. Horsch, G.M.; Fourniotis, N.T. Wintertime Tidal Hydrodynamics in the Gulf of Patras, Greece. J. Coast. Res. 2017, 33, 1305–1314. [Google Scholar] [CrossRef]
  36. Aspioti, A.G.; Fourniotis, N.T. A Brief Review of Hydrodynamic Circulation in the Mediterranean Gulfs. Dynamics 2024, 4, 873–888. [Google Scholar] [CrossRef]
  37. Deleersnijder, E.L. Upwelling and Upsloping in Three-Dimensional Marine Models. Appl. Math. Model. 1989, 13, 462–467. [Google Scholar] [CrossRef]
  38. Barnard, P.L.; Hanes, D.M.; Rubin, D.M.; Kvitek, R.G. Giant Sand Waves at the Mouth of San Francisco Bay. Eos 2006, 87, 285–289. [Google Scholar] [CrossRef]
  39. Bouilloux, A.; Valet, J.-P.; Bassinot, F.; Joron, J.-L.; Dewilde, F.; Blanc-Valleron, M.-M.; Moreno, E. Influence of Seawater Exchanges across the Bab-El-Mandeb Strait on Sedimentation in the Southern Red Sea during the Last 60 Ka. Paleoceanography 2013, 28, 675–687. [Google Scholar] [CrossRef]
  40. Keller, G.H.; Richards, A.F. Sediments of the Malacca Strait, Southeast Asia. J. Sediment. Petrol. 1967, 37, 102–127. [Google Scholar]
  41. Lamarche, G.; Lurton, X.; Verdier, A.-L.; Augustin, J.-M. Quantitative Characterisation of Seafloor Substrate and Bedforms Using Advanced Processing of Multibeam Backscatter—Application to Cook Strait, New Zealand. Cont. Shelf Res. 2011, 31, S93–S109. [Google Scholar] [CrossRef]
  42. Longhitano, S.G. Between Scylla and Charybdis (Part 1): The Sedimentary Dynamics of the Modern Messina Strait (Central Mediterranean) as Analogue to Interpret the Past. Earth-Sci. Rev. 2018, 185, 259–287. [Google Scholar] [CrossRef]
  43. Longhitano, S.G.; Chiarella, D. Tidal Straits: Basic Criteria for Recognizing Ancient Systems from the Rock Record; Elsevier B.V.: Amsterdam, The Netherlands, 2020; ISBN 9780444641342. [Google Scholar]
  44. Baines, P.G.; Garnek, H. Hydraulic Models of Deep Stratified Flows over Topography. In The Physical Oceanography of Sea Straits; Pratt, L.J., Ed.; Springer: Dordrecht, The Netherlands, 1990; p. 318. ISBN 978-94-010-6789-8. [Google Scholar]
  45. Shanmugam, G. Modem Internal Waves and Internal Tides along Oceanic Pycnoclines: Challenges and Implications for Ancient Deep-Marine Baroclinic Sands. Am. Assoc. Pet. Geol. Bull. 2013, 97, 799–843. [Google Scholar] [CrossRef]
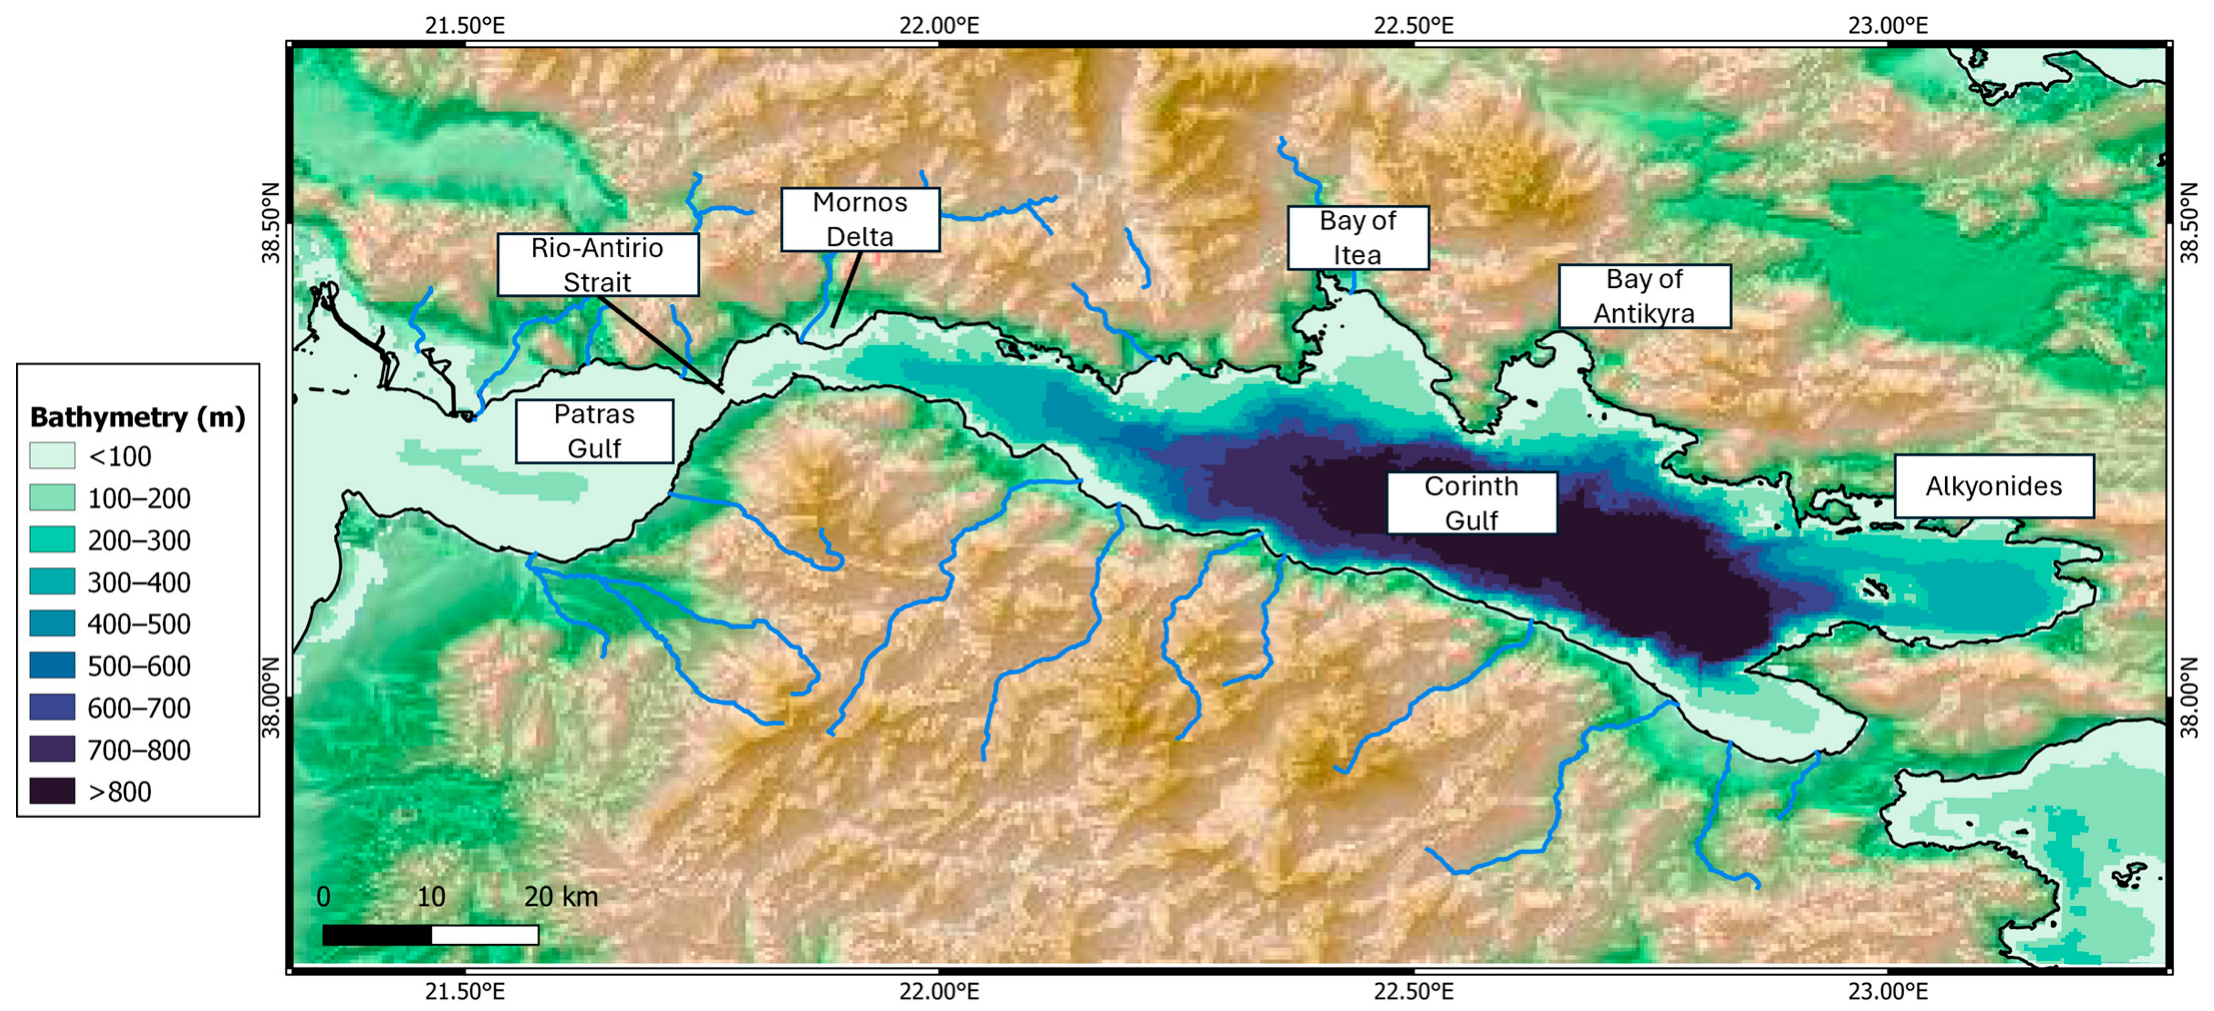
Figure 1. Bathymetry map of Patraic and Corinthian Gulfs with identification of specific locations of the area.
Jmse 13 01827 g001
Figure 2. Repartition of 32 vertical adaptive levels over a section cutting through the whole domain. The colored map represents the bathymetry of the Gulfs.
Jmse 13 01827 g002
Figure 3. Qualitative comparison for validation of model with ADCP data from 21.728° E south to north section at entrance of strait from Patraic Gulf.
Jmse 13 01827 g003
Figure 4. Mean temperature for subsurface of May 2023 represented by (A) ROMS output and (B) satellite data.
Jmse 13 01827 g004
Figure 5. Mean velocities in m/s modelled at surface. (A) January 2023; (B) May 2023; (C) September 2023.
Jmse 13 01827 g005
Figure 6. Impacts of tides over currents and Sea Surface Height (SSH). (A) Distribution of u and v (m/s) at bottom for strait area according to tidal slope taken at Aigio [33]. (B) SSH (m) at green dot location in center of strait showing high and low tides for 17th of May 2023 from ROMS output. (C) SSH (m) map at low tide (17 May 2023 at 9 am). (D) SSH (m) map at high tide (17 May 2023 at 3 pm).
Jmse 13 01827 g006
Figure 7. Section of modelled strait displaying temperature (°C, colors) of water and current direction and intensity (m/s, arrows) under two different tidal dynamics. A zoom on SSH variation is displayed over each section. (A) Section during low tide and (B) section during high tide according to SSH and tidal gauge data [33].
Jmse 13 01827 g007
Figure 8. Comparison of effects of winds for May 2023. Left: mean SST maps (the scale is in °C), right: mean velocities at the surface (m/s). (A) Normal winds, (B) no winds (velocities set to 0), (C) enhanced winds (shear stress multiplied by 3).
Jmse 13 01827 g008
Figure 9. Mean wind direction and velocity for May 2023.
Jmse 13 01827 g009
Figure 10. Maps of bottom current magnitudes (colors; in m/s) and directions (arrows) over May 2023. (A) Mean for May 2023, (B) maxima for May 2023, (C) U-velocities at red dot location (center of the deep Corinthian Basin) over simulated time, (D) zoom on maximal velocities at bottom of Rio–Antirio Strait.
Jmse 13 01827 g010
Figure 11. Vertical section over Alkyonides Gulf of average temperature (colors, °C) and currents (arrows, m/s) for May 2023.
Jmse 13 01827 g011
Figure 12. Comparison between (A) direction and intensity (m/s) of mean surface currents under influence of tidal forcing, (B) direction and intensity (m/s) of mean surface currents without tidal forcing and (C) direction and intensity (m/s) of mean bottom currents without tidal forcing.
Jmse 13 01827 g012
Disclaimer/Publisher’s Note: The statements, opinions and data contained in all publications are solely those of the individual author(s) and contributor(s) and not of MDPI and/or the editor(s). MDPI and/or the editor(s) disclaim responsibility for any injury to people or property resulting from any ideas, methods, instructions or products referred to in the content.