Article

Factors Controlling the Formation and Evolution of the Beach Zone in a Semi-Enclosed Tideless Embayment: The Case of the North Coast of the Messiniakos Gulf (Eastern Mediterranean)

by
Serafeim E. Poulos
1,2,*,
Stelios Petrakis
3,
Aikaterini Karditsa
4,
Sylvia-Vasiliki Koumpou
1 and
Vasileios Kapsimalis
3
1
Laboratory of Physical Geography, Section of Geography and Climatology, Department of Geology and Geoenvironment, National and Kapodistrian University of Athens, Panepistimioupolis-Zografou, 15784 Athens, Attiki, Greece
2
Institute of Applied and Computational Mathematics, Foundation for Research and Technology—Hellas, Nikolaou Plastira 100, Vassilika Vouton, 70013 Heraklion, Crete, Greece
3
Institute of Oceanography, Hellenic Centre for Marine Research, 46.7 km Athens Sounio Ave., 19013 Anavyssos, Attiki, Greece
4
Department of Port Management and Shipping, National and Kapodistrian University of Athens, 34400 Psachna, Evia, Greece
*
Author to whom correspondence should be addressed.
J. Mar. Sci. Eng. 2025, 13(9), 1810; https://doi.org/10.3390/jmse13091810
Submission received: 24 July 2025 / Revised: 1 September 2025 / Accepted: 2 September 2025 / Published: 18 September 2025
(This article belongs to the Section Coastal Engineering)

Abstract

This study examines the evolution of a beach formed along the coastline of a semi-enclosed, essentially tideless, embayment in the eastern Mediterranean Sea. The analysis revealed that the primary factors influencing its recent evolution are the terrestrial sediment influxes, current nearshore oceanographic conditions, and the existence of coastal constructions. The beach zone is exposed to waves approaching from the south with extreme values of height and period of 7 m and 4.3 s, respectively. Associated morphodynamic characteristics include a closure depth of 7 m, a breaking depth of 4.3 m, and a maximum run-up of 2.4 m. Since the mid-1900s, the shoreline has evolved through an accretional phase from 1960 to 1988, followed by a retreating phase from 1989 to 1997, except in the central part, where progradation has continued. The most recent period (1998–2017) has been relatively stable, though with a slight retreating trend. During storm events, changes to the beach are not uniform along-shore. Gross estimates of beach retreat due to sea level rise induced by climate change threaten the existence of the entire beach (for moderate and extreme IPCC Special Report Emissions Scenarios); however, this does not seem to be the case if riverine sediment influx continues.

1. Introduction

Beaches—made up of unconsolidated sediment (terrestrial and/or biogenic) and occasionally including beachrock formations—act as a transitional (buffer) zone between the land and the sea. They are found in front of erodible coastal cliffs or low-lying alluvial coastal plains, along deltaic coasts, and depositional formations, such as cuspate forelands and coastal barriers. The formation and evolution of any beach is a complex process involving both natural and human factors. Natural factors include those related to morphology, relative sea-level changes, nearshore hydrodynamics and the sediments that make up the beach [1,2,3]. The anthropogenic factors include retaining sediment behind dams, changing in artificial structures such as groins, sea walls and port breakwaters. Climate change, which accelerates sea level rise and changes storm frequency, can also be regarded as an indirect form of human intervention. Due to the variability of these factors, beaches are recognized as some of the most dynamically changing and vulnerable coastal landforms, being prone to erosion and inundation [4,5,6].
Beach ecosystems are rich in biodiversity and provide essential ecosystem services [7] with reference to: (i) supporting a variety of flora and fauna, including beach grasses such as Ammophila and nesting birds and reptiles; (ii) nutrient cycling through the decomposition of organic matter; (iii) dissipating wave energy to protect inland areas from erosion and flooding; and (iv) providing breeding and nursery grounds, which are particularly important for sea turtles and fish. At the same time, beaches have significant socio-economic value as they support the tourism industry, particularly according to the ‘Sun, Sea and Sand’ (3S) tourism model [8,9].
On the other hand, beaches face multiple human-induced threats, the most pronounced of which is beach erosion [10,11]. This leads to the loss of tourism revenue, damage to property and infrastructure, and even community displacement (especially in island nations), phenomena already well pronounced in Greek coast [4,12,13,14,15]. Other threats are related to climate change, pollution (e.g., marine litter, sewage and oil spills), overdevelopment (construction of hotels, seawalls, ports and roads) and sand and gravel mining. Therefore, knowledge and sustainable management of beach development and future evolution may contribute to sustainable coastal (backshore) development within the ‘3Ps’ framework (protection, preservation, and ensuring public access). The latter is part of coastal zone management (CZM), which attempts to balance the often-competing needs of economic development, environmental conservation, and public enjoyment of coastal areas [5,16,17].
Considering the existing geological background of the broader coastal area, the present study investigates the morphometric, sedimentological and oceanographic factors that control the formation and evolution of a beach zone along the coast of an active seismic embayment. The embayment is essentially tideless and is hydrodynamically governed by waves approaching only from southerly directions. The investigation encompasses two distinct temporal periods: (i) the recent period (since the mid-19th century), taking into account the prevailing hydrodynamic conditions; and (ii) the future period, extending to the year 2100, with projections of beach retreat due to sea level rise caused by climate change.

2. Study Area

The coastal zone under investigation extends along the entire northern coastline of the semi-enclosed Messinian Gulf, being about 21.3 km long and roughly oriented east–west (Figure 1). Morphologically, it belongs to the category of attached to shoreline beaches [18]. At its eastern end, the city of Kalamata, which has a population of approximately 50,000 people and a port with the same name. Outside the urban area of Kalamata, the landscape is used for farming and olive cultivation (particularly at its east end). Tourist facilities have been developed mainly along the coast and in some areas to the west, such as Mpoukas and Velika. In addition, the city of Kalamata hosts the homonymous port, whose construction was completed in the beginning of the 19th century. It has an operational depth of about 10 m and is “protected” by two piers directed to the south and southeast, with lengths of 1100 m and 395 m, respectively.
The beach zone is the natural boundary (transitional zone) of a low-lying coastal plain made up of marine sediment (e.g., sandstones and polymictic conglomerates) from the Upper Pleistocene-Holocene period, and recent terrestrial deposits, including red-colored siliceous formations and alluvium [20,21]. The area belongs to the Kyparissia-Kalamata tectonic depression [22], which has evolved due to two E-W and NW-SE fault systems [21]. The region is located within an active geodynamic regime, primarily due to its proximity to the subduction zone (less than 200 km away), where the African plate converges beneath the Eurasian plate. Notably, between 1901 and 1990, the region experienced nine seismic events with a magnitude exceeding 4.5 on the Richter scale. The most significant of these was the 13/9/1986 earthquake, which had a magnitude of 6.2. This seismic event caused the collapse of multiple buildings, resulting in rockfalls and landslides and causing 21 fatalities.
The inflow of several streams and small ephemeral rivers is a significant factor in determining the sediment budget of the beach zone. The formation of these river networks is attributable to profound deep erosion, a consequence of the uplift of the hinterland area [21]. The region is characterized by seven streams and four minor rivers that traverse it from west to east. The streams are Korias, Tyflo, Mourtia, Mpouka, Vathi, Lagadi and Kserila, and the rivers are the Pamissos (567.6 km2), Nedontas (146.1 km2), Aris (203 km2) and Velikas (149.4 km2). The total area of the hinterland that drains into the northern coast of the Messinian Gulf is 1380 km2.
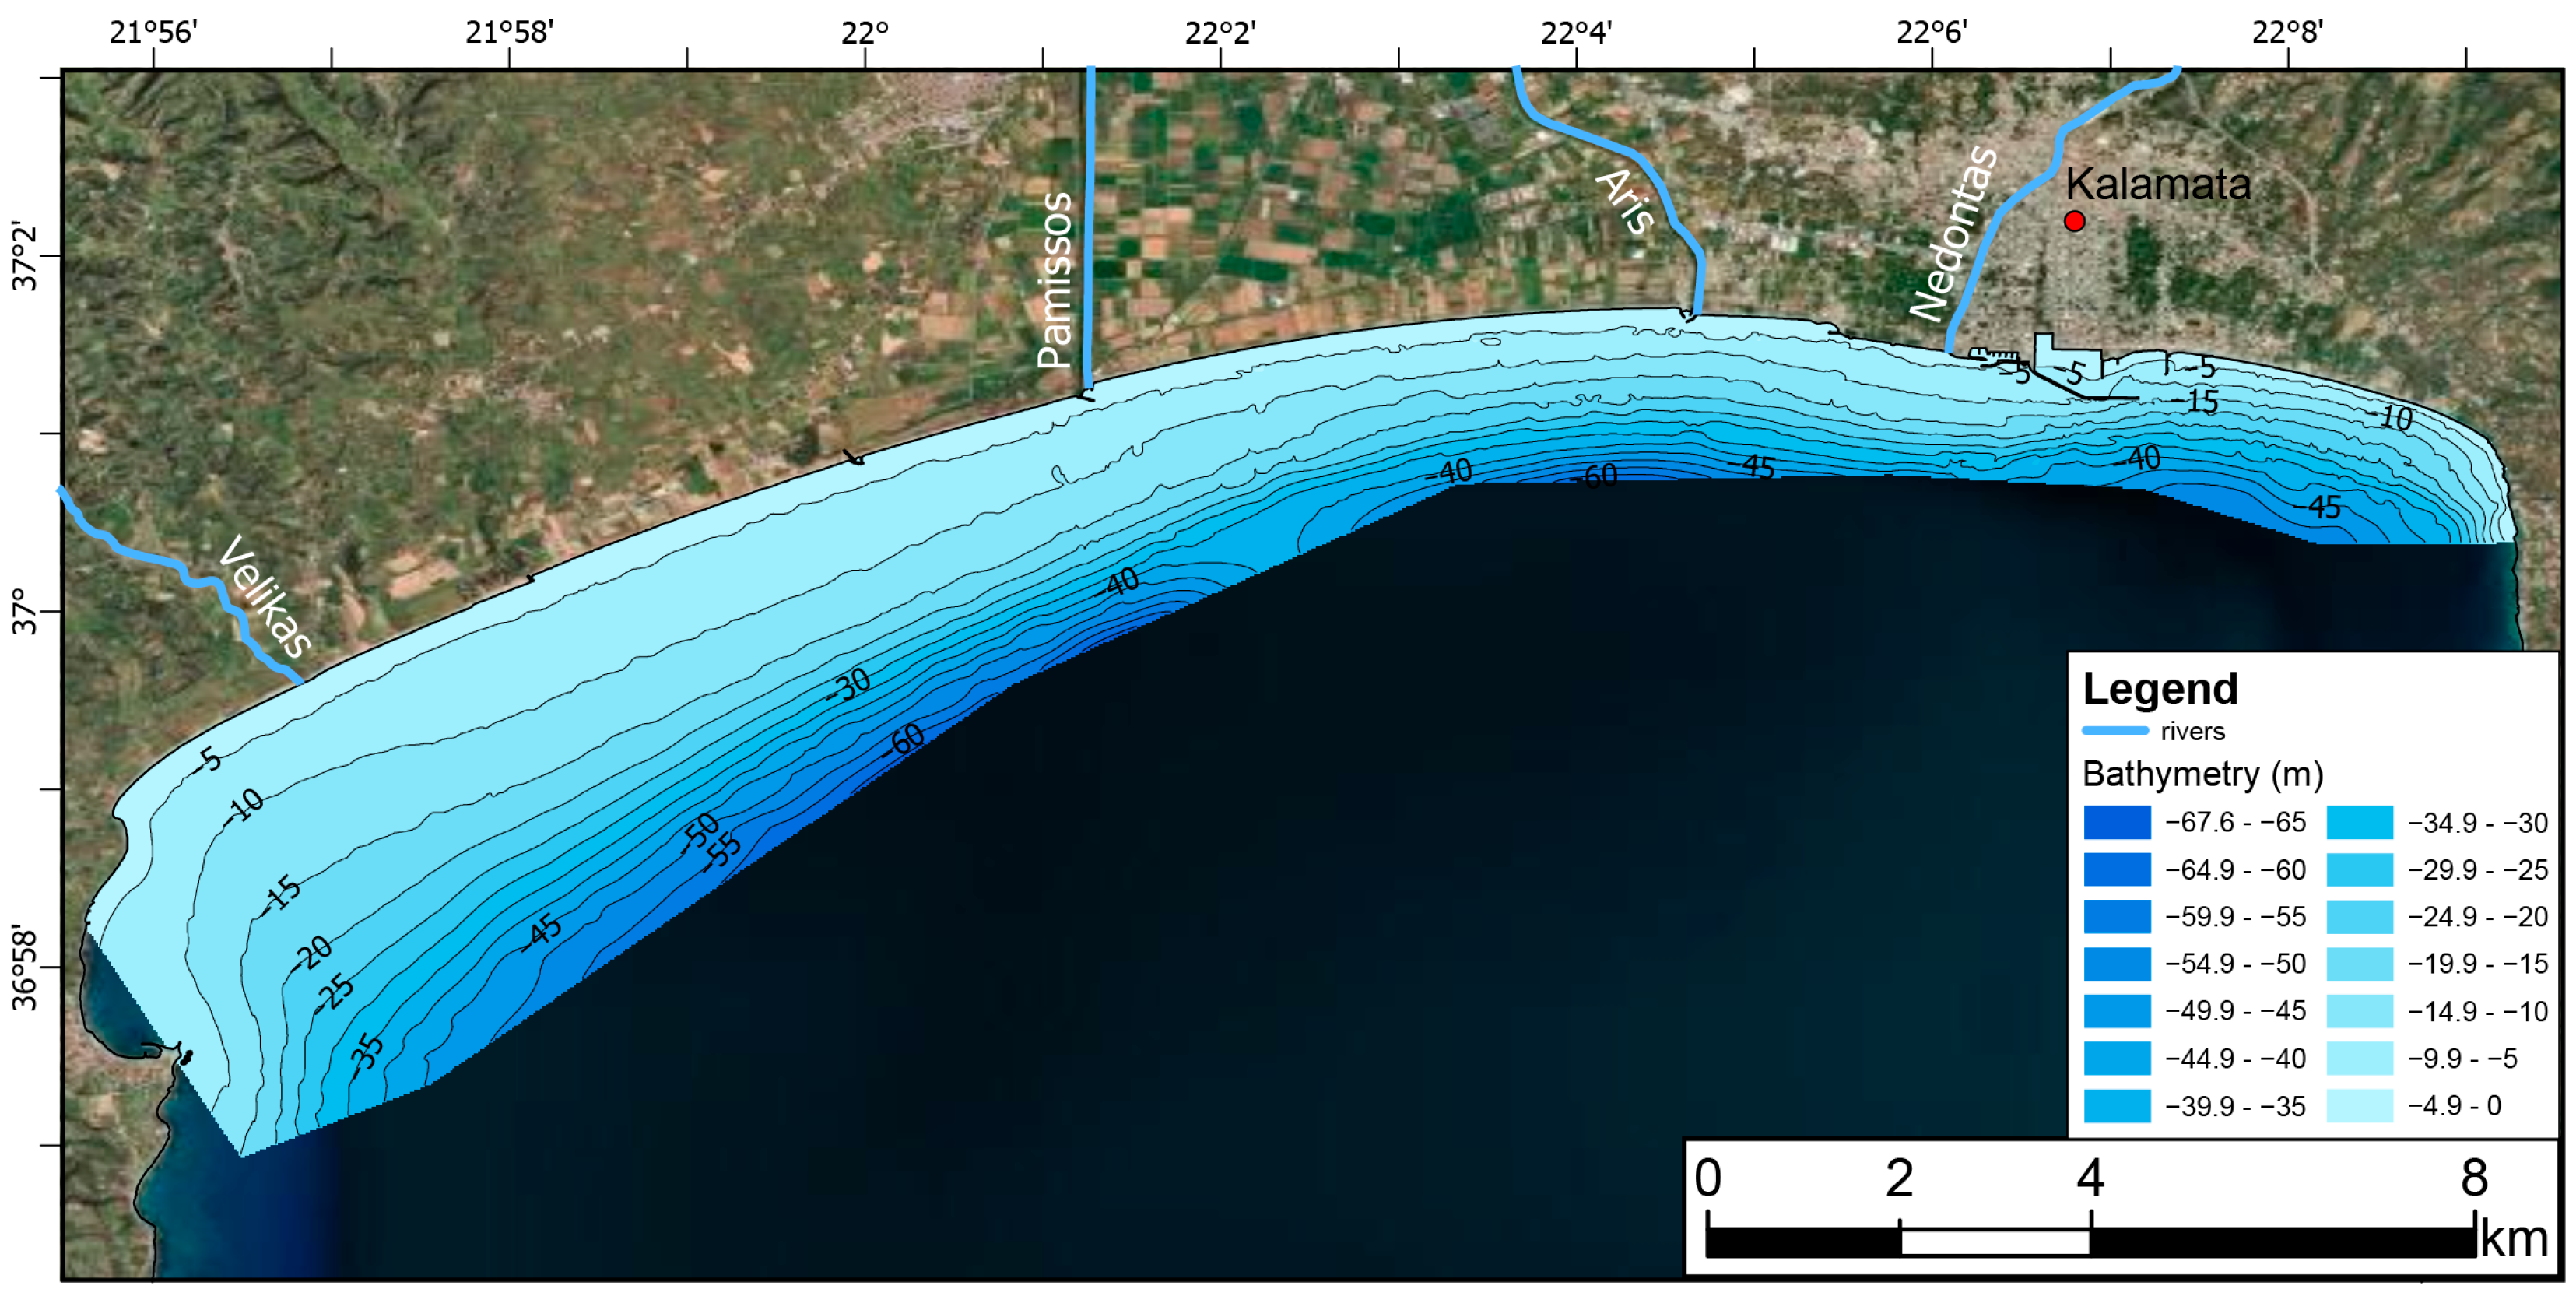
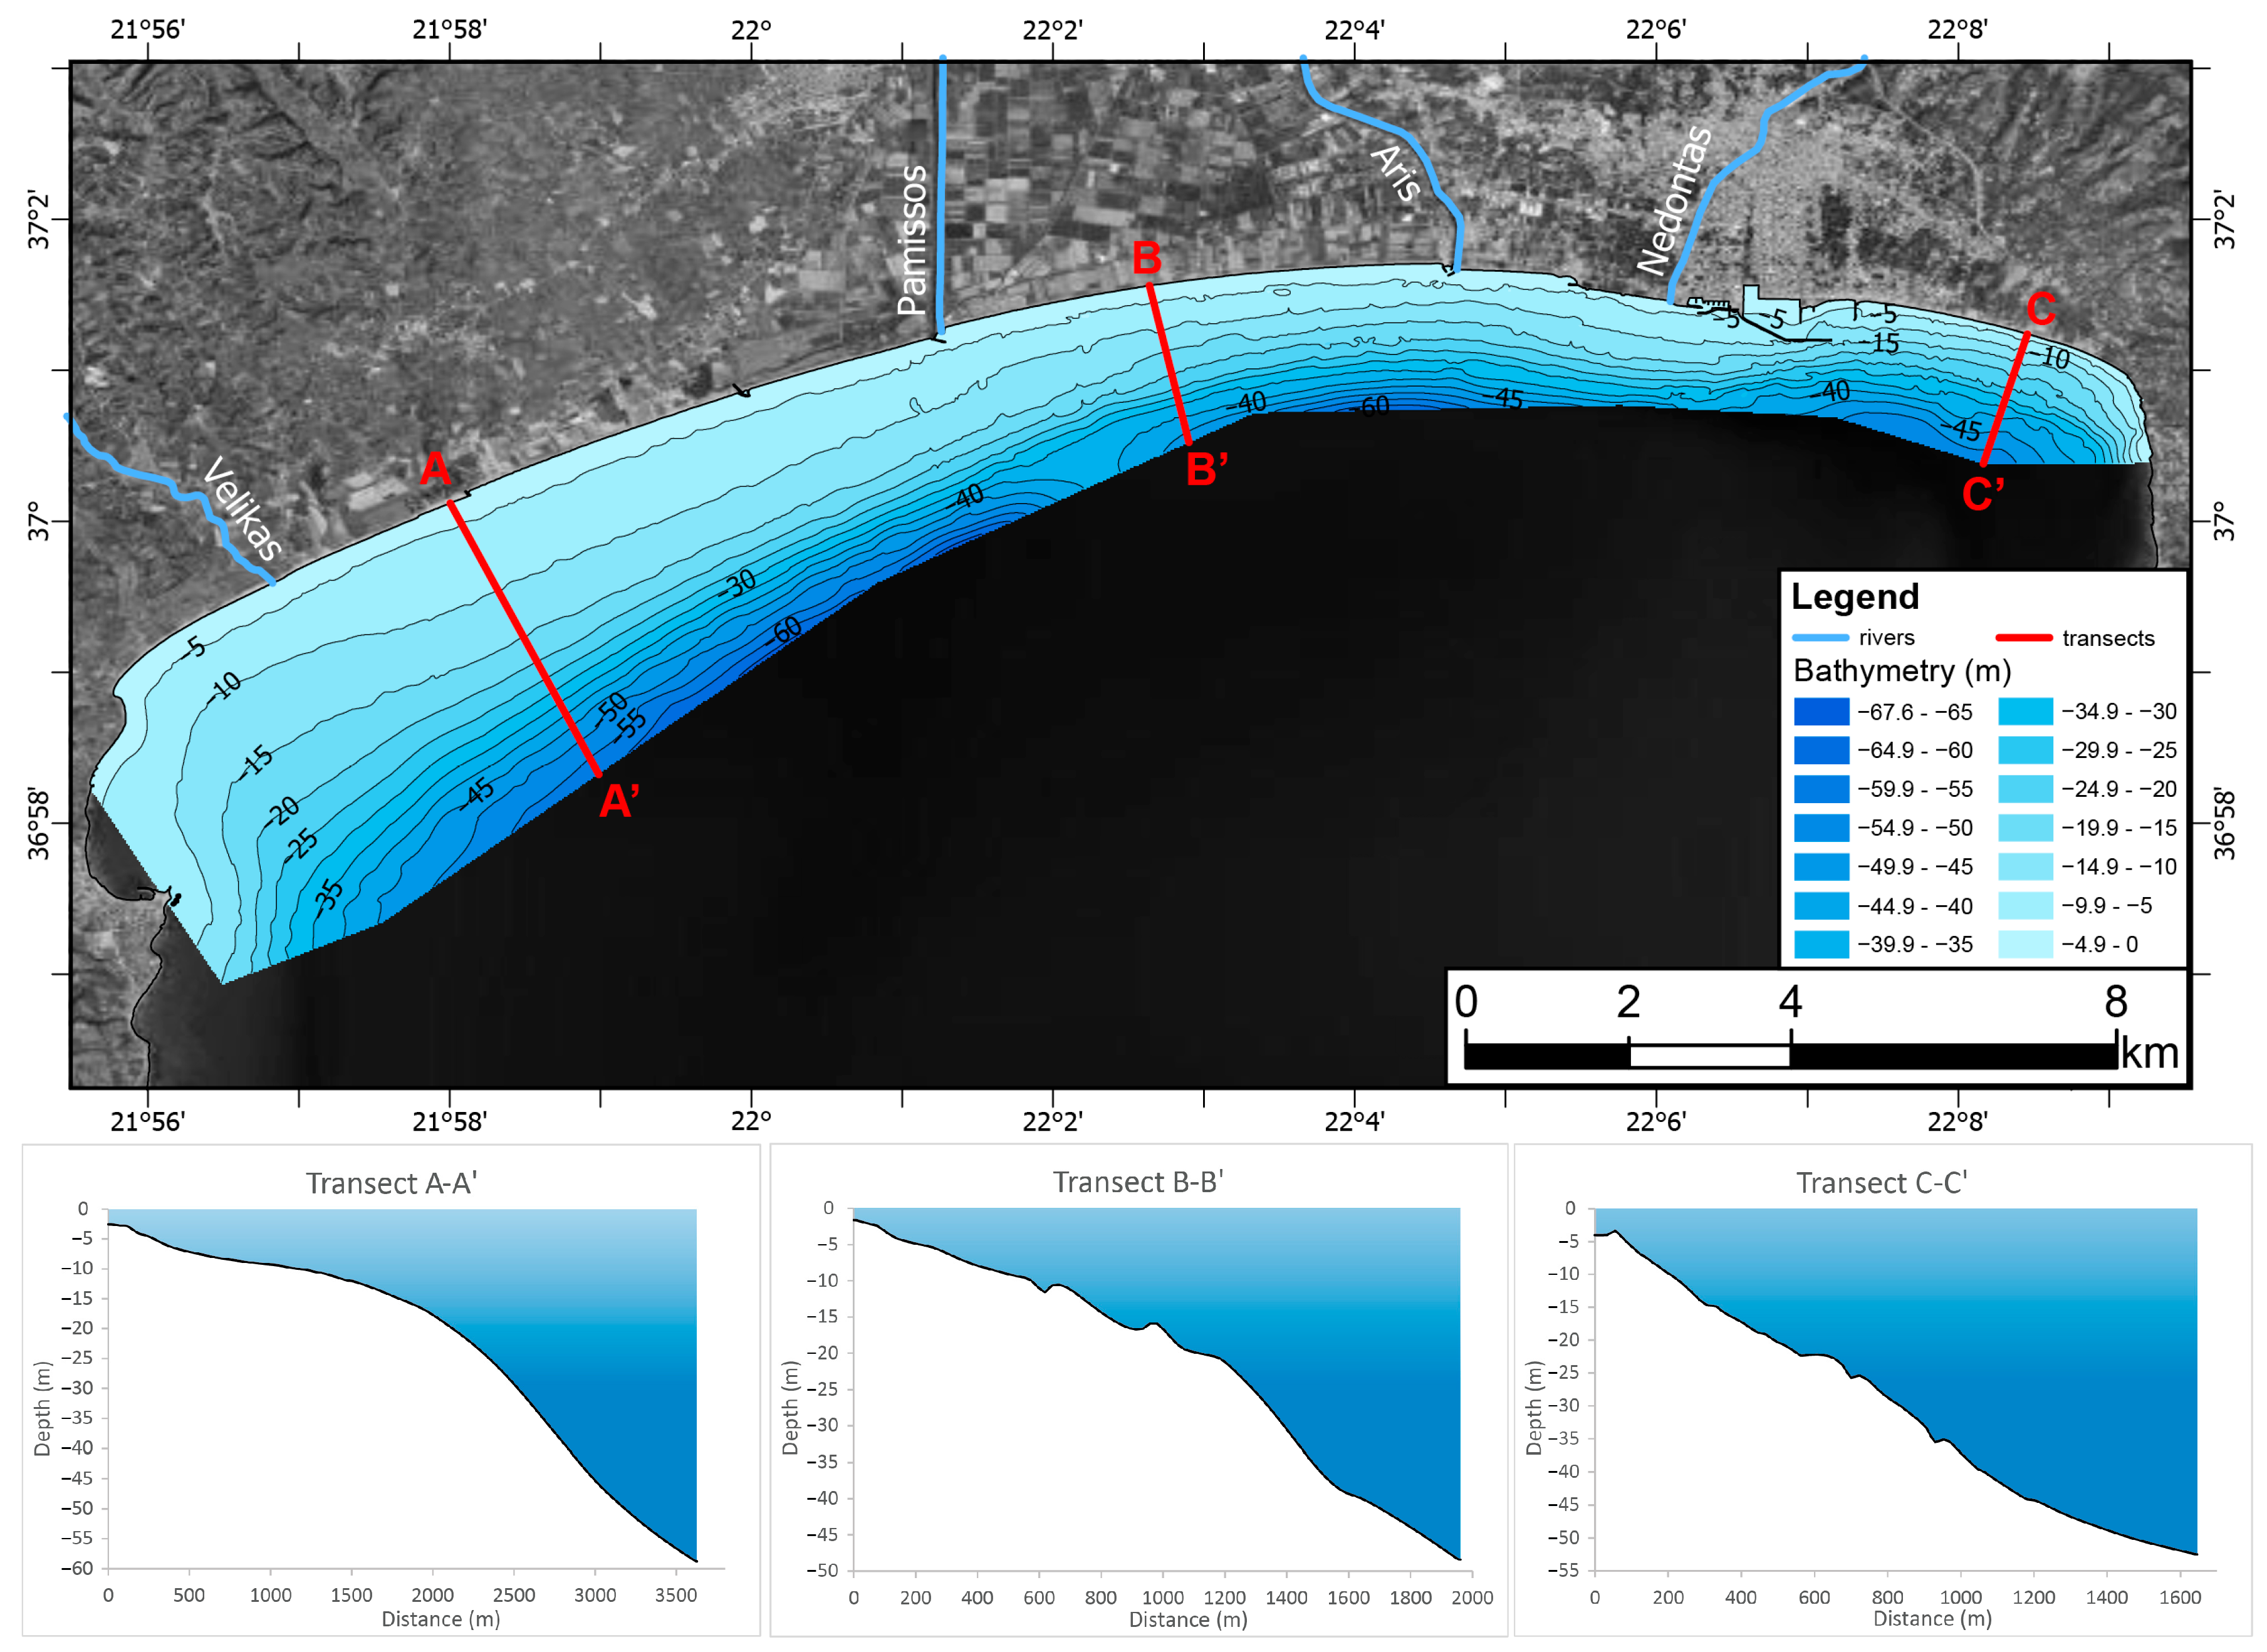
The continental shelf along the northern coast of the Messinian Gulf extends to water depths of 100–120 m (shelf break). The continental shelf on the western side is more than twice as wide as that on the eastern side. The incline of the shelves is not uniform; the western shelf has a gradient of less than 2%, while the eastern shelf has a gradient of over 4% [23]. The disparities in both width and slope gradient are ascribed to elevated tectonic uplift along the eastern coast of the Messinian Gulf [21]. Figure 2 presents a detailed bathymetric map of the inner shelf, i.e., the area shallower than 50 m.
The climate of Kalamata is characterized by a temperate Mediterranean climate, with hot and dry summers and relatively cooler and wetter winters. The mean temperature recorded at the Kalamata meteorological station for the period 1971–2010 was 5.3 °C in February and 31.4 °C in August. The total mean annual rainfall is 77.6 mm. The predominant winds are from the north direction (on average, 30.1% of the year). However, in terms of wave generation, the prevailing winds of significant blow are from the south approximately 17.23% of the time. The most prevalent wind speeds are 2 B (6.43%) and 3 B (6.21%), with the fastest speed being 8 B, though this is an extremely rare occurrence (0.2%).
As stated in the Wind and Wave Atlas of the Greek Seas [24], the northern Messiniakos coast experiences an average annual significant wave height (Hs) of less than 0.5 m and a peak wave period (Tp) of under 3 s. These particularly low values are due to the semi-protected nature of the area, which is essentially exposed to incoming waves from the south, whose average annual characteristics are Hs > 1 m and Tp > 5 s. Nevertheless, the study of the wave regime is an essential component of this publication.
The astronomical tide has been recorded as being less than 10 cm [25,26], thus classifying the study area as a tideless environment. Nevertheless, with respect to meteorological tides (storm surges) reach sea level appears to reach 0.7 m, as indicated by the records obtained from the Kalamata port tide gauge for the period 1990–2012. This substantial temporal rise in sea level is attributable to the accumulation of water mass within the bay during southern storms.

3. Data Collection and Analysis

3.1. Data Collection

The data collection encompasses the morphological characteristics of the subaerial and subaqueous beach zone, the nearshore hydrodynamics and associated morpho-dynamics and the spatio-temporal changes in the position of the shoreline.

3.1.1. Morphological Characteristics

Nineteen shore normal profiles were conducted (see Figure 3), with a mean distance of approximately 1 km between them. The land survey was conducted utilizing a Leica laser distance meter and a Topcon satellite system (GPS), while the bathymetric recording of the shallow waters (up to approximately 3 m) was facilitated using a HONDEX PS-7 portable depth sounder. A single-beam echo sounder from Humminbird was used for larger depths.
Along the 19 shore normal profiles, a total of 116 surficial samples (upper 2 cm) were collected, 69 of which were subaerial and 47 subaqueous. Samples of shallow water were collected by means of diving, whereas samples from water depths greater than 5 m were collected using a van Veen grab sampler. The elevations and water depths are given in Table A1 (see Appendix A).

3.1.2. Shoreline Position

To assess changes in the shoreline over time, vertical aerial photographs taken in 1960, 1997 and 2007 at a scale of 1:10,000 were obtained from the Orthophoto Viewing Service of EKXA S.A. (National Cadastre & Mapping S.A., Athens, Greece). Furthermore, satellite imagery from Google Earth was collected at a scale of 1:25,000 (eye level 602 m) for the years 07/2003, 08/2013 and 04/2017.

3.1.3. Wave Data

To determine the prevailing wind-generated wave conditions within the Messiniakos Gulf, open sea hourly metadata set obtained from the Copernicus database refer to the period 1/1/1993–31/12/2022, and include the following time series:
VTM01_WW: Spectral moments (0.1) wind wave period (Τm01)
VTPK:       Wave period at spectral peak/peak period (Tp)
VMDR_WW:  Mean wind wave direction (Dir)
The point at which the wave data is reported is located at the entrance to the Gulf of Messiniakos, with coordinates: 36°45′0.00 N and 22°6′0.00 E. The assimilation is based on the inherent data assimilation scheme of WAM Cycle 4.5.4 model, on a grid of 1/24°. The simulations of the significant wave height, considering the entire Mediterranean Sea, yielded a root mean square error (RMSE) of 0.21 m and a bias is −0.03 m (3.7%) when the model was compared to in situ observations, and a bias of −0.06 (5.5%) when it was compared to satellite observations [27].

3.2. Data Analysis

This section includes the following topics: firstly, the granulometric analysis of the superficial sediment samples; secondly, the procedure for the shoreline spatial changes based on aerial photographs and satellite imagery; thirdly, the determination of the nearshore wave regime on the basis of offshore data; and finally, the estimation of future beach retreat due to climate change.

3.2.1. Grain Size Analysis

Sediment samples with a size greater than 62.5 μm were subjected to dry sieving using sieves with a diameter of 0.5 mm, while samples with a size less than 62.5 μm were analyzed with a SEDIGRAPH micrometer using X-rays (type III PLUS). The statistical parameters of the sediments (i.e., graphical mean grain size (Mz), the median grain size (D50), and the graphical standard deviation (σΙ)) were calculated using the cumulative curve (arithmetic ordinate: 0–100%) according to Folk [28]. The samples were also classified according to their percentages of gravel (G), sand (S) and mud (M) content. All the results are presented in Table A3 (Appendix C).

3.2.2. Shoreline Spatial Changes

The temporal displacement of the coastline was investigated, and its rate of change was estimated by utilizing the Digital Shoreline Analysis System (DSAS v5.0) in an ArcMap (10.4) environment. The selected coordinate system was UTM WGS 84 Zone 34N.
The georeferencing of the analogue aerial photographs and satellite images was conducted in a common projection system (WGS 84) using ArcGIS 10. The images were imported in tif format and projected onto the same projection system and datum. In order to achieve the highest possible accuracy, ground control points with known geodetic coordinates were identified. The distribution of the control points for each set of images was conducted in a uniform manner, with a range of 20 to 25 points, and an error (Root Mean Square Error—RMSE) of approximately 0.1 to 0.6 m. Subsequent to this, the coastlines were subjected to the process of digitization.
The digitized coastlines were then processed in the Digital Shoreline Analysis System (DSAS v5.0) [29]. The general operation of DSAS comprises the following: (a) the creation of a baseline; (b) the establishment of transects originating from the baseline, and perpendicular to the digitized historical coastlines. The distance between the transects (transect spacing) was set at 50 m and their length (transect length) was determined so that they intersect all coastlines of different chronology. The rate of change is expressed in meters per year (m/y).
The transects delineate the western and central regions of the beach, are numbered sequentially from A1 (west end) to A332 (east end), while those demarcating the eastern part (situated to the east of the port) are numbered from B1 (west end) to B54 (east end). In addition, the river mouths of the minor streams have been delineated in conjunction with the DSAS transects, as outlined below: Korias (A18–A20), Velika (A41–A46), Tyflo (A55–A57), Mourtia (A83–A87), Mpouka (A141–A146), Pamissos (A183–A188), Aris (A284–A289), and Nedontas (A326–A332), Vathi Laggadi (B11–B13) and Kserila (B47–B49).

3.2.3. Elaboration of Wave Data

In order to ascertain the percentage of calm sea conditions, the proportion of hourly values corresponding to both VHM0 < 0.064 m and VTM01 < 1 s is calculated from the total hourly values. Subsequently, the value parameters (VHM0, VTM01, VTPK, VMDR) are selected for the directional arc (i.e., 115–250 degrees) to which the north coast of the Messiniakos Gulf is exposed with respect to offshore incoming wind-generated waves.
Subsequently, the significant wave height Hs (H1/3) and peak period Tp are calculated as the average of all values. However, in the case of the direction of wave propagation (DIR), the median value is to prefer over the average, as the former more accurately represents the central tendency of directional data. Nevertheless, it is important to acknowledge that there is only a negligible discrepancy between the two; the values are only marginally different.
The calculation of the wave characteristics corresponding to the highest 1/10 and 1/100 of the wave dataset is achieved according to the methodology described most recently by Poulos et al. [29]. The relationships between the H1/3, H1/10 and H1/100 are given by equations [30,31]:
H1/10 ≈ 1.27·Hs
H1/100 ≈ 1.67·Hs
The T1/10 and T1/100 values are calculated using the relationship [32]:
T1/10 ≈ T1/100 ≈ 1.2·Tmean (Tm0.1)
The frequency of occurrence is calculated on the basis of the number of waves that correspond to 1/3, 1/10, and 1/100 of the highest waves divided by the total number of waves (S(N)).
Furthermore, the extreme values of the significant wave heights and periods were calculated from the largest 0.137% of the hourly values (Hsext; Tsext).
The equations utilized to calculate the wave characteristics (C: phase velocity (Equation (A1)); L: wavelength (Equation (A2)) of incoming waves in deep water conditions according to Ayre’s linear theory are provided in Appendix A.
The depth (d) at which waves propagate deep, intermediate, and shallow water conditions is calculated based on the classic depth/wave height relationships (Equation (A3) presented in Appendix A).
The calculation of wave run-up is performed using the most recent relationship provided by Conlin et al. [33] with a land slope of 0.1–0.25% for beaches consisting of mixed material (Equation (A4)).
The calculation of the inner closure depth is performed by utilizing the original formula devised by Hallemeyer [34] (Equation (A5)).
The estimation of wave height at breaking is achieved through the consideration of the submarine slope within the breaking/surf zone, utilizing the empirical relationship proposed by Rattanapitikon and Shibayama [35] (Equation (A6)). The corresponding breaking depth is calculated based on the breaking index (γb), which is derived from the relationship developed by Kraus and Larson [36] (Equation (A7)). This relationship is, in turn, a function of the surf similarity parameter at breaking (ξb) (see Equation (A8)). The hydrodynamic characterization of the beach is determined with the use of the parameter (Ω) [37] (Equation (A9)), which depends on settling velocity (wS) (Equation (A10) [38]) of the grains (D50). Consequently, beaches with Ω < 1 are regarded as reflective, those with 1 < Ω < 6 are of intermediate state, and those with Ω > 6 are classified as reflective.
The potential long-shore sediment transport rate was calculated using formula (Equation (A11) [39]). The formula is based on the significant wave height at breaking, the slope of the surf/breaking zone, its grain size and the breaking angle (ab), that is approached by the Snell’s relationship (Equation (A12)).

3.2.4. Beach Retreat Due Storm Surge and Sea Level Rise

The estimation of coastline retreat due to storm surge is performed using the equation A13 [40], which is based on the wedge-shaped removal of material from the front and its subsequent deposition up to the point of breaking. The equation utilizes the breaking characteristic, whilst the temporarily elevated sea level above the average level is measured at the maximum registered level at the tide gauge in the port of Kalamata.
In order to ascertain the long-term change (recession) of the coastline due to the gradual rise in sea level, the most common used method of Brunn [41] was selected (Equation (A14)); the latter considers the maximum depth of mobilization of bottom sediments (hc-closure depth). The various sea-level scenarios proposed by the IPCC-2021 [42] and provided by the NASA sea level projection tool (https://sealevel.NASA.gov/ipcc-ar6-sea-level-projection-tool, accessed on 24 June 2025) specifically for the tide gauge at Kalamata Port were utilized in this study.

4. Results

The estimation of the various hydrodynamic and morphodynamic parameters is facilitated by dividing the beach zone under investigation into five sectors (S1–S5). This division is primarily based on shoreline orientation, with beach morphology being a secondary criterion. As shown in Figure 3, the 19 shore-normal profiles are allocated to the five sectors, i.e., S1 (profiles A–C), S2 (profiles D and E), S3 (profiles F–J), S4 (profiles K–O) and S5 (profiles P–S).

4.1. Beach Material and Morphology

The main morphological and granulometric characteristics of the 19 profiles (A–S) are gathered in Table A2 (in Appendix B).
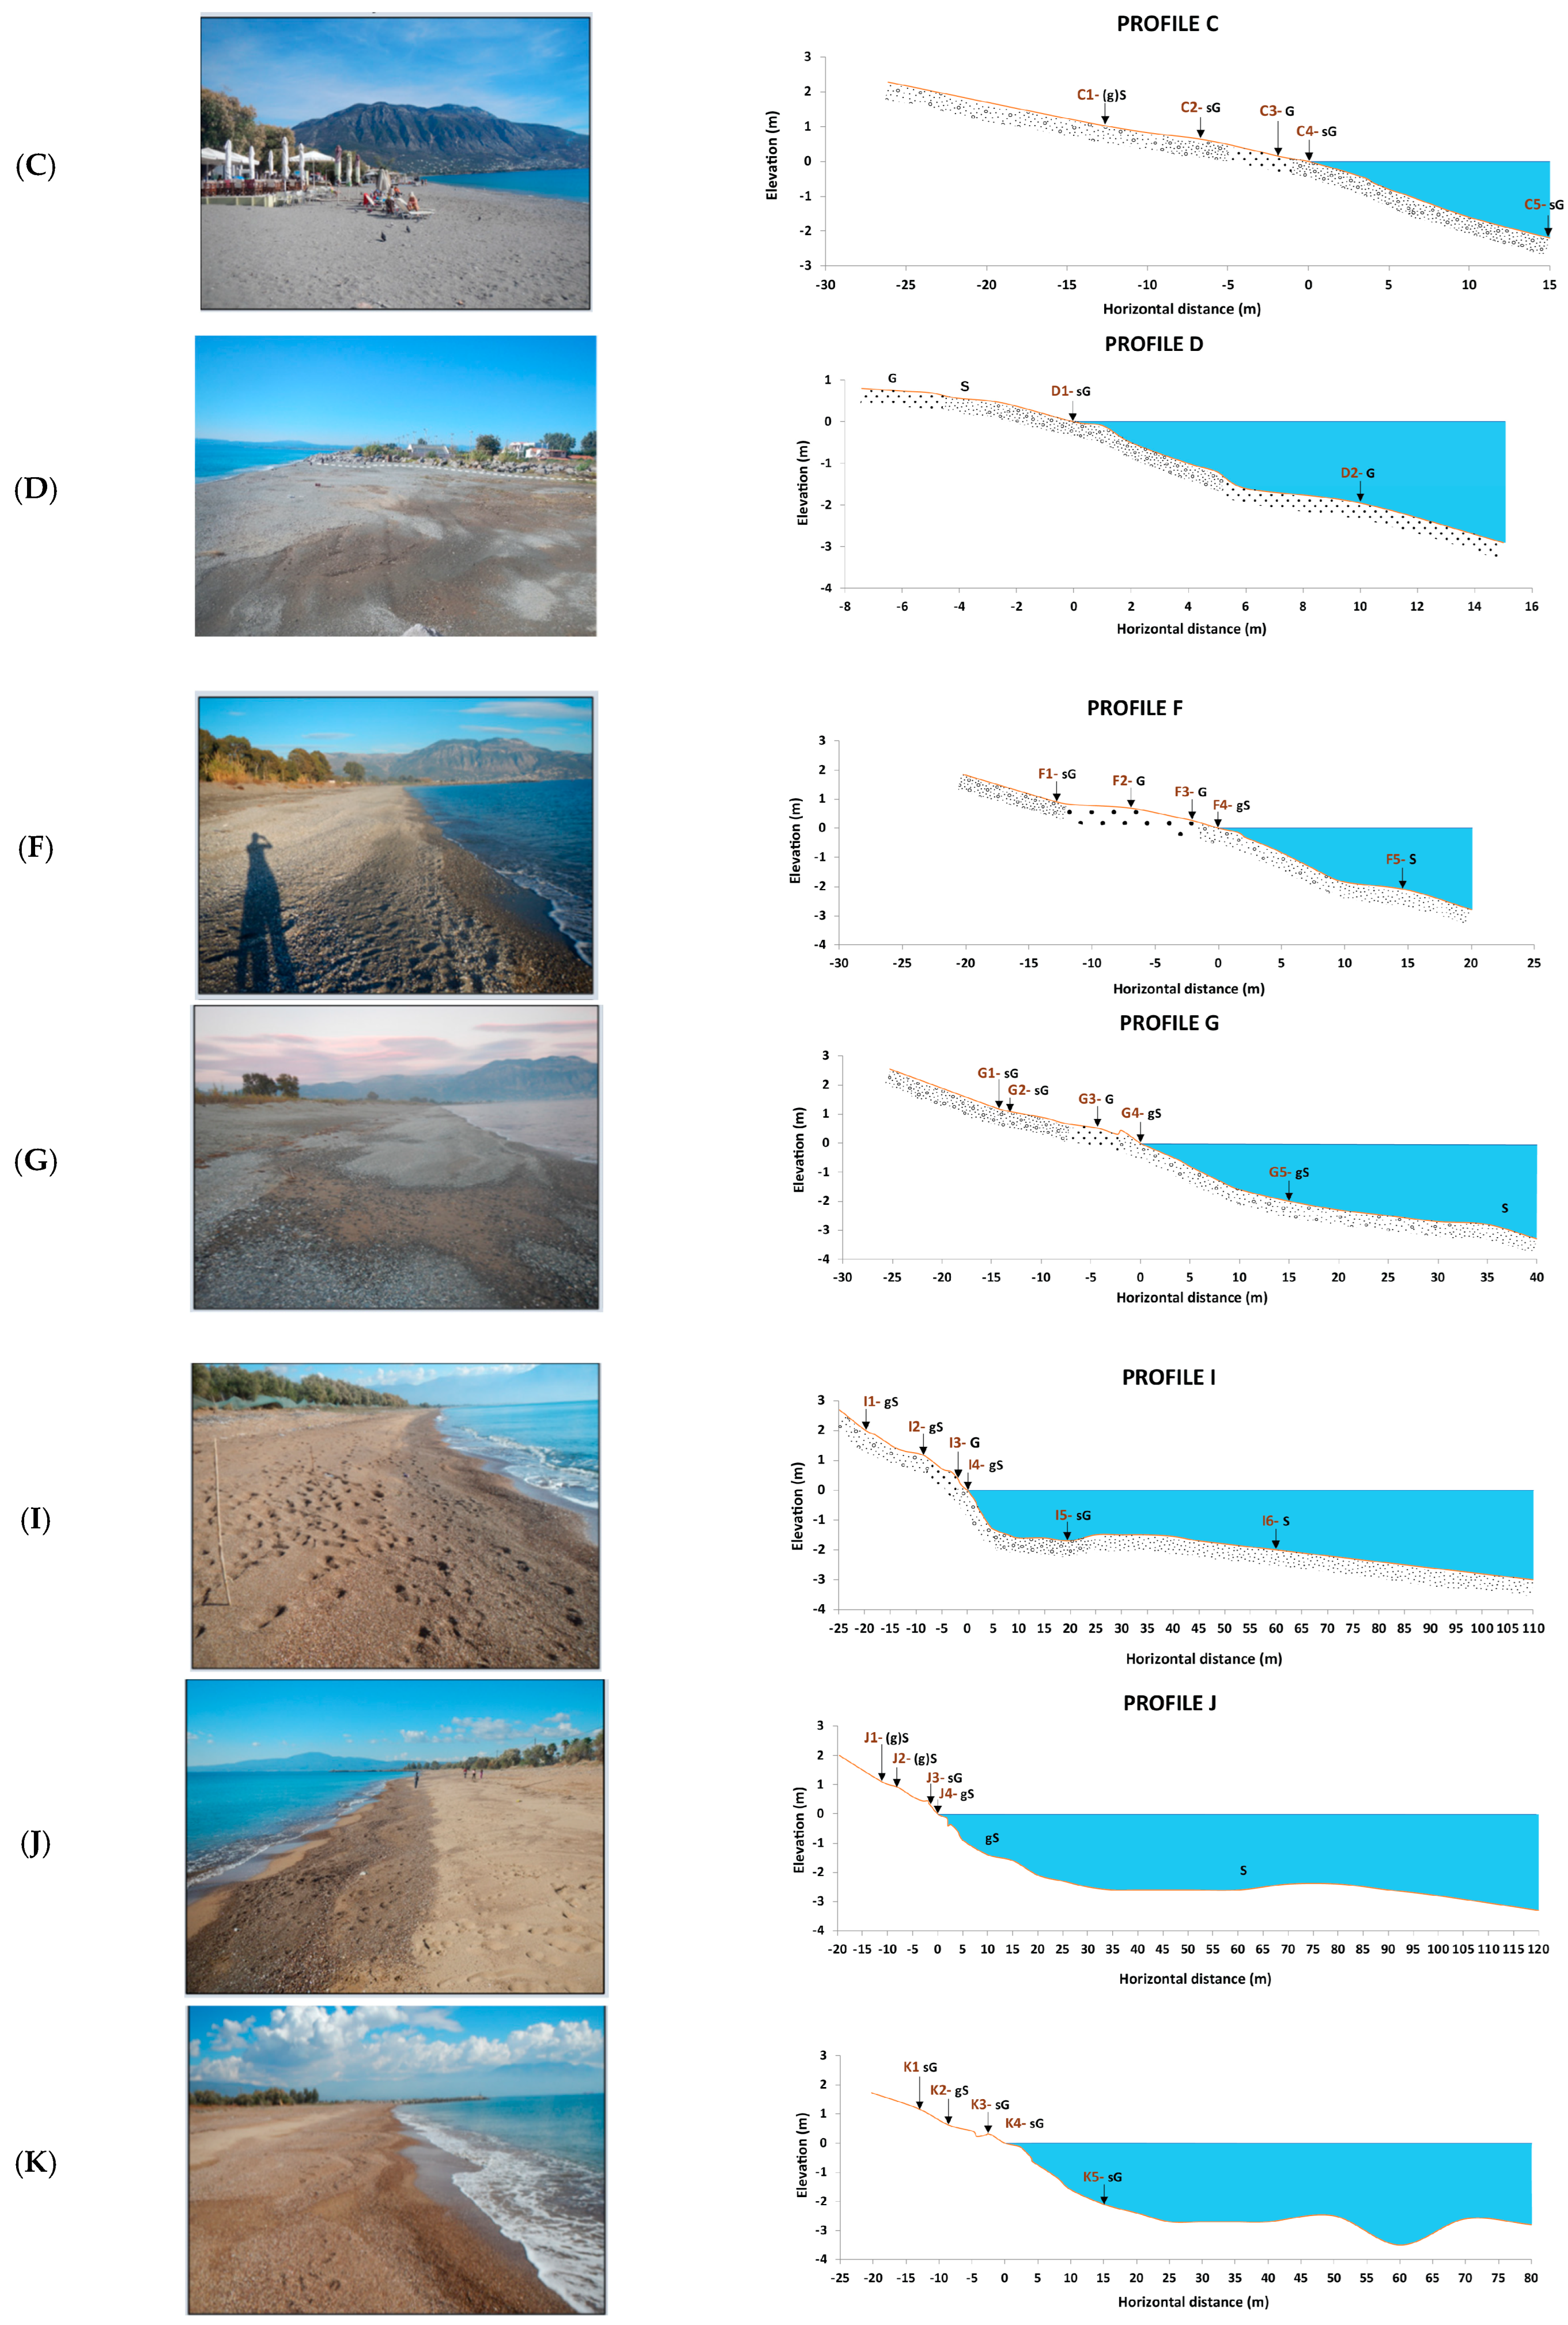
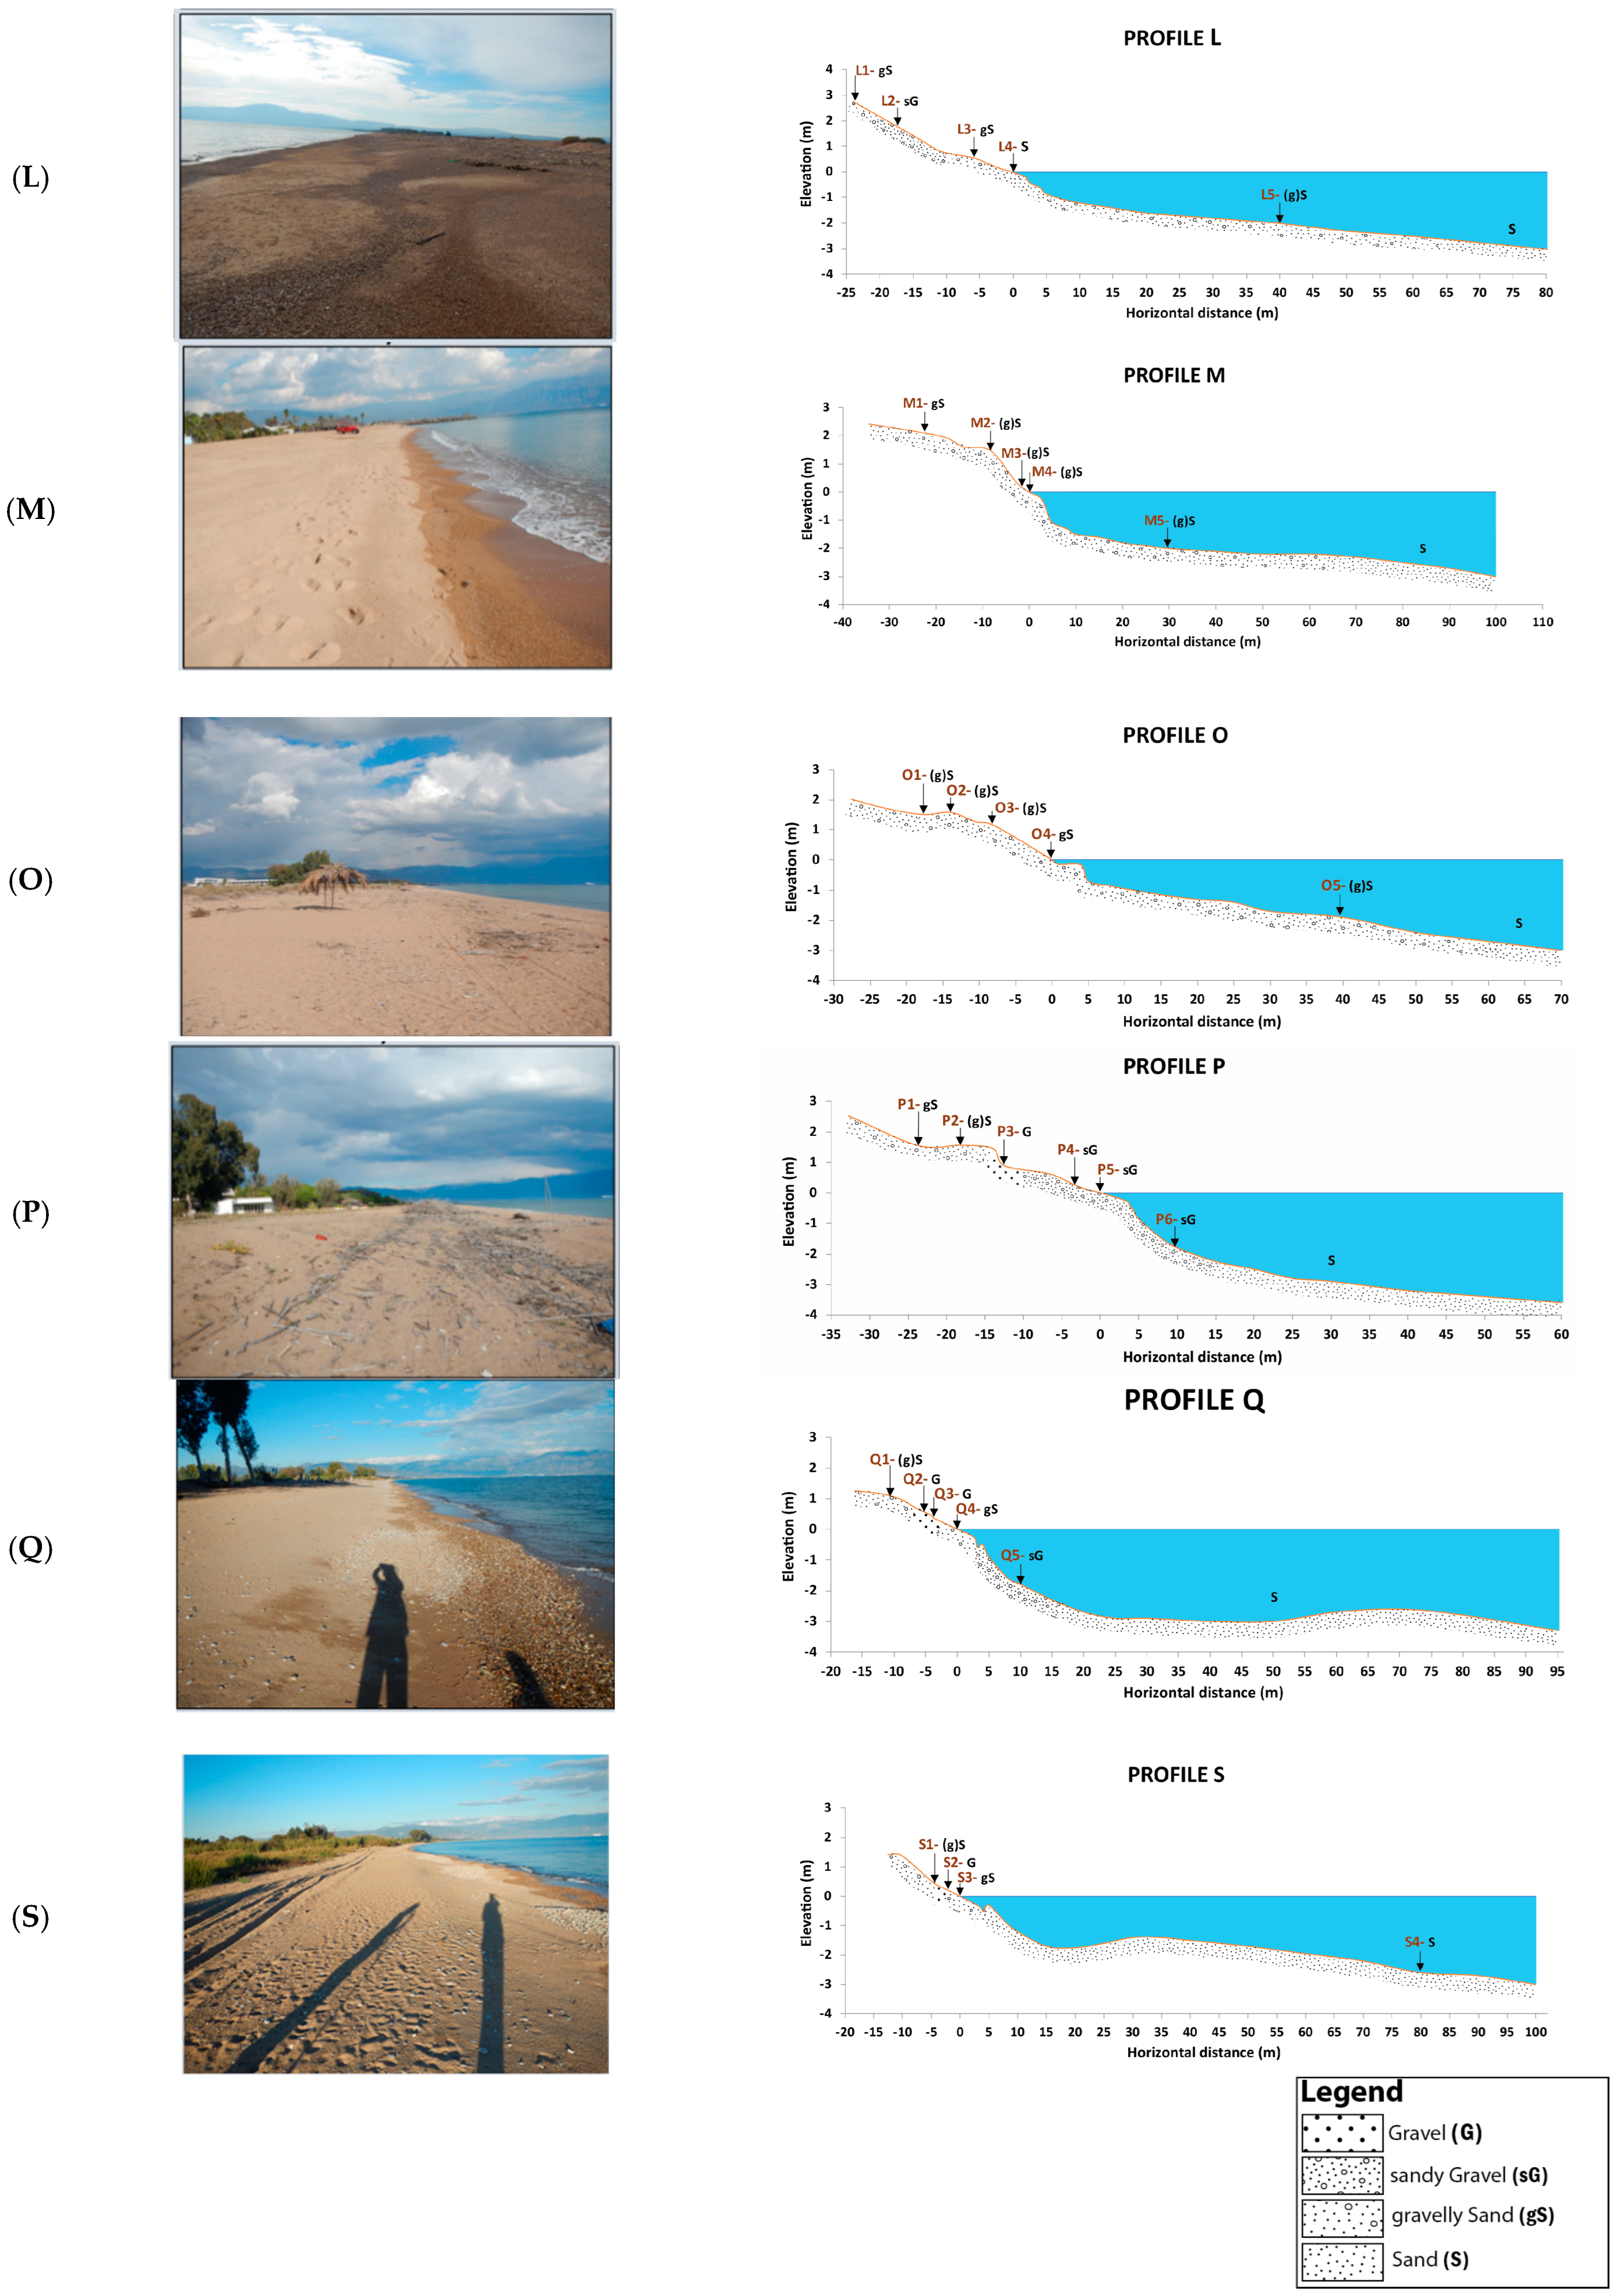
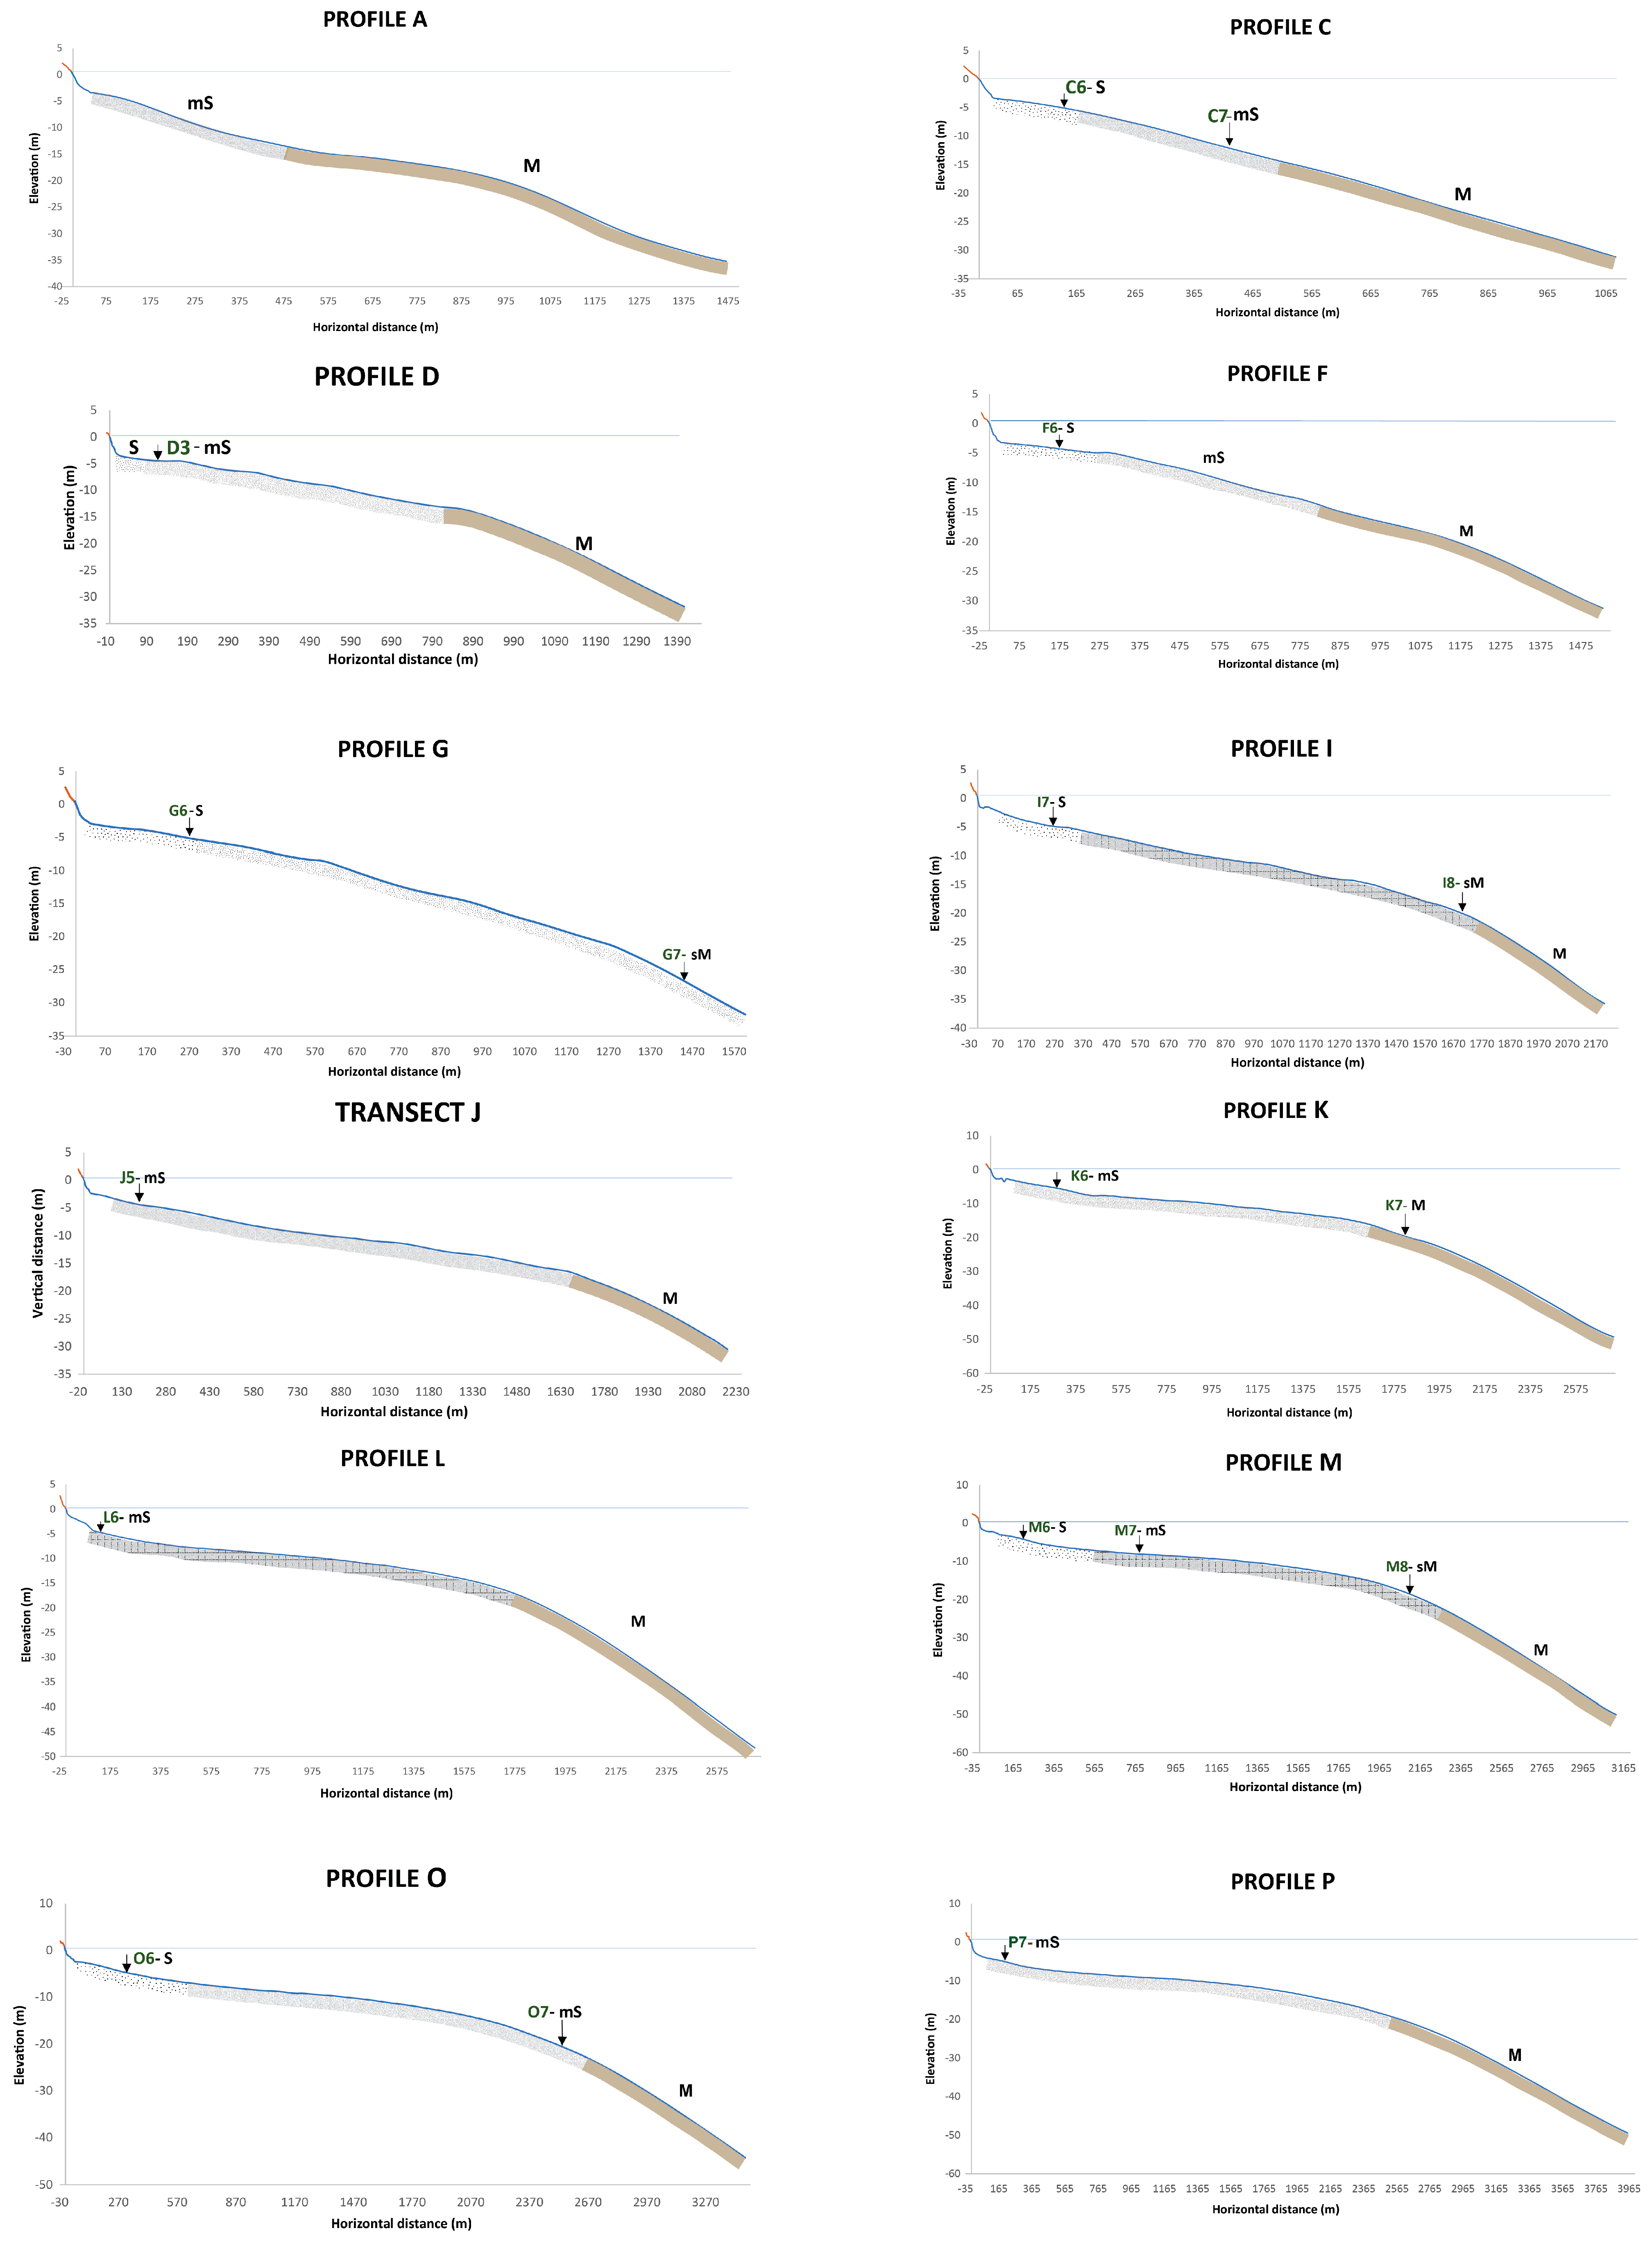
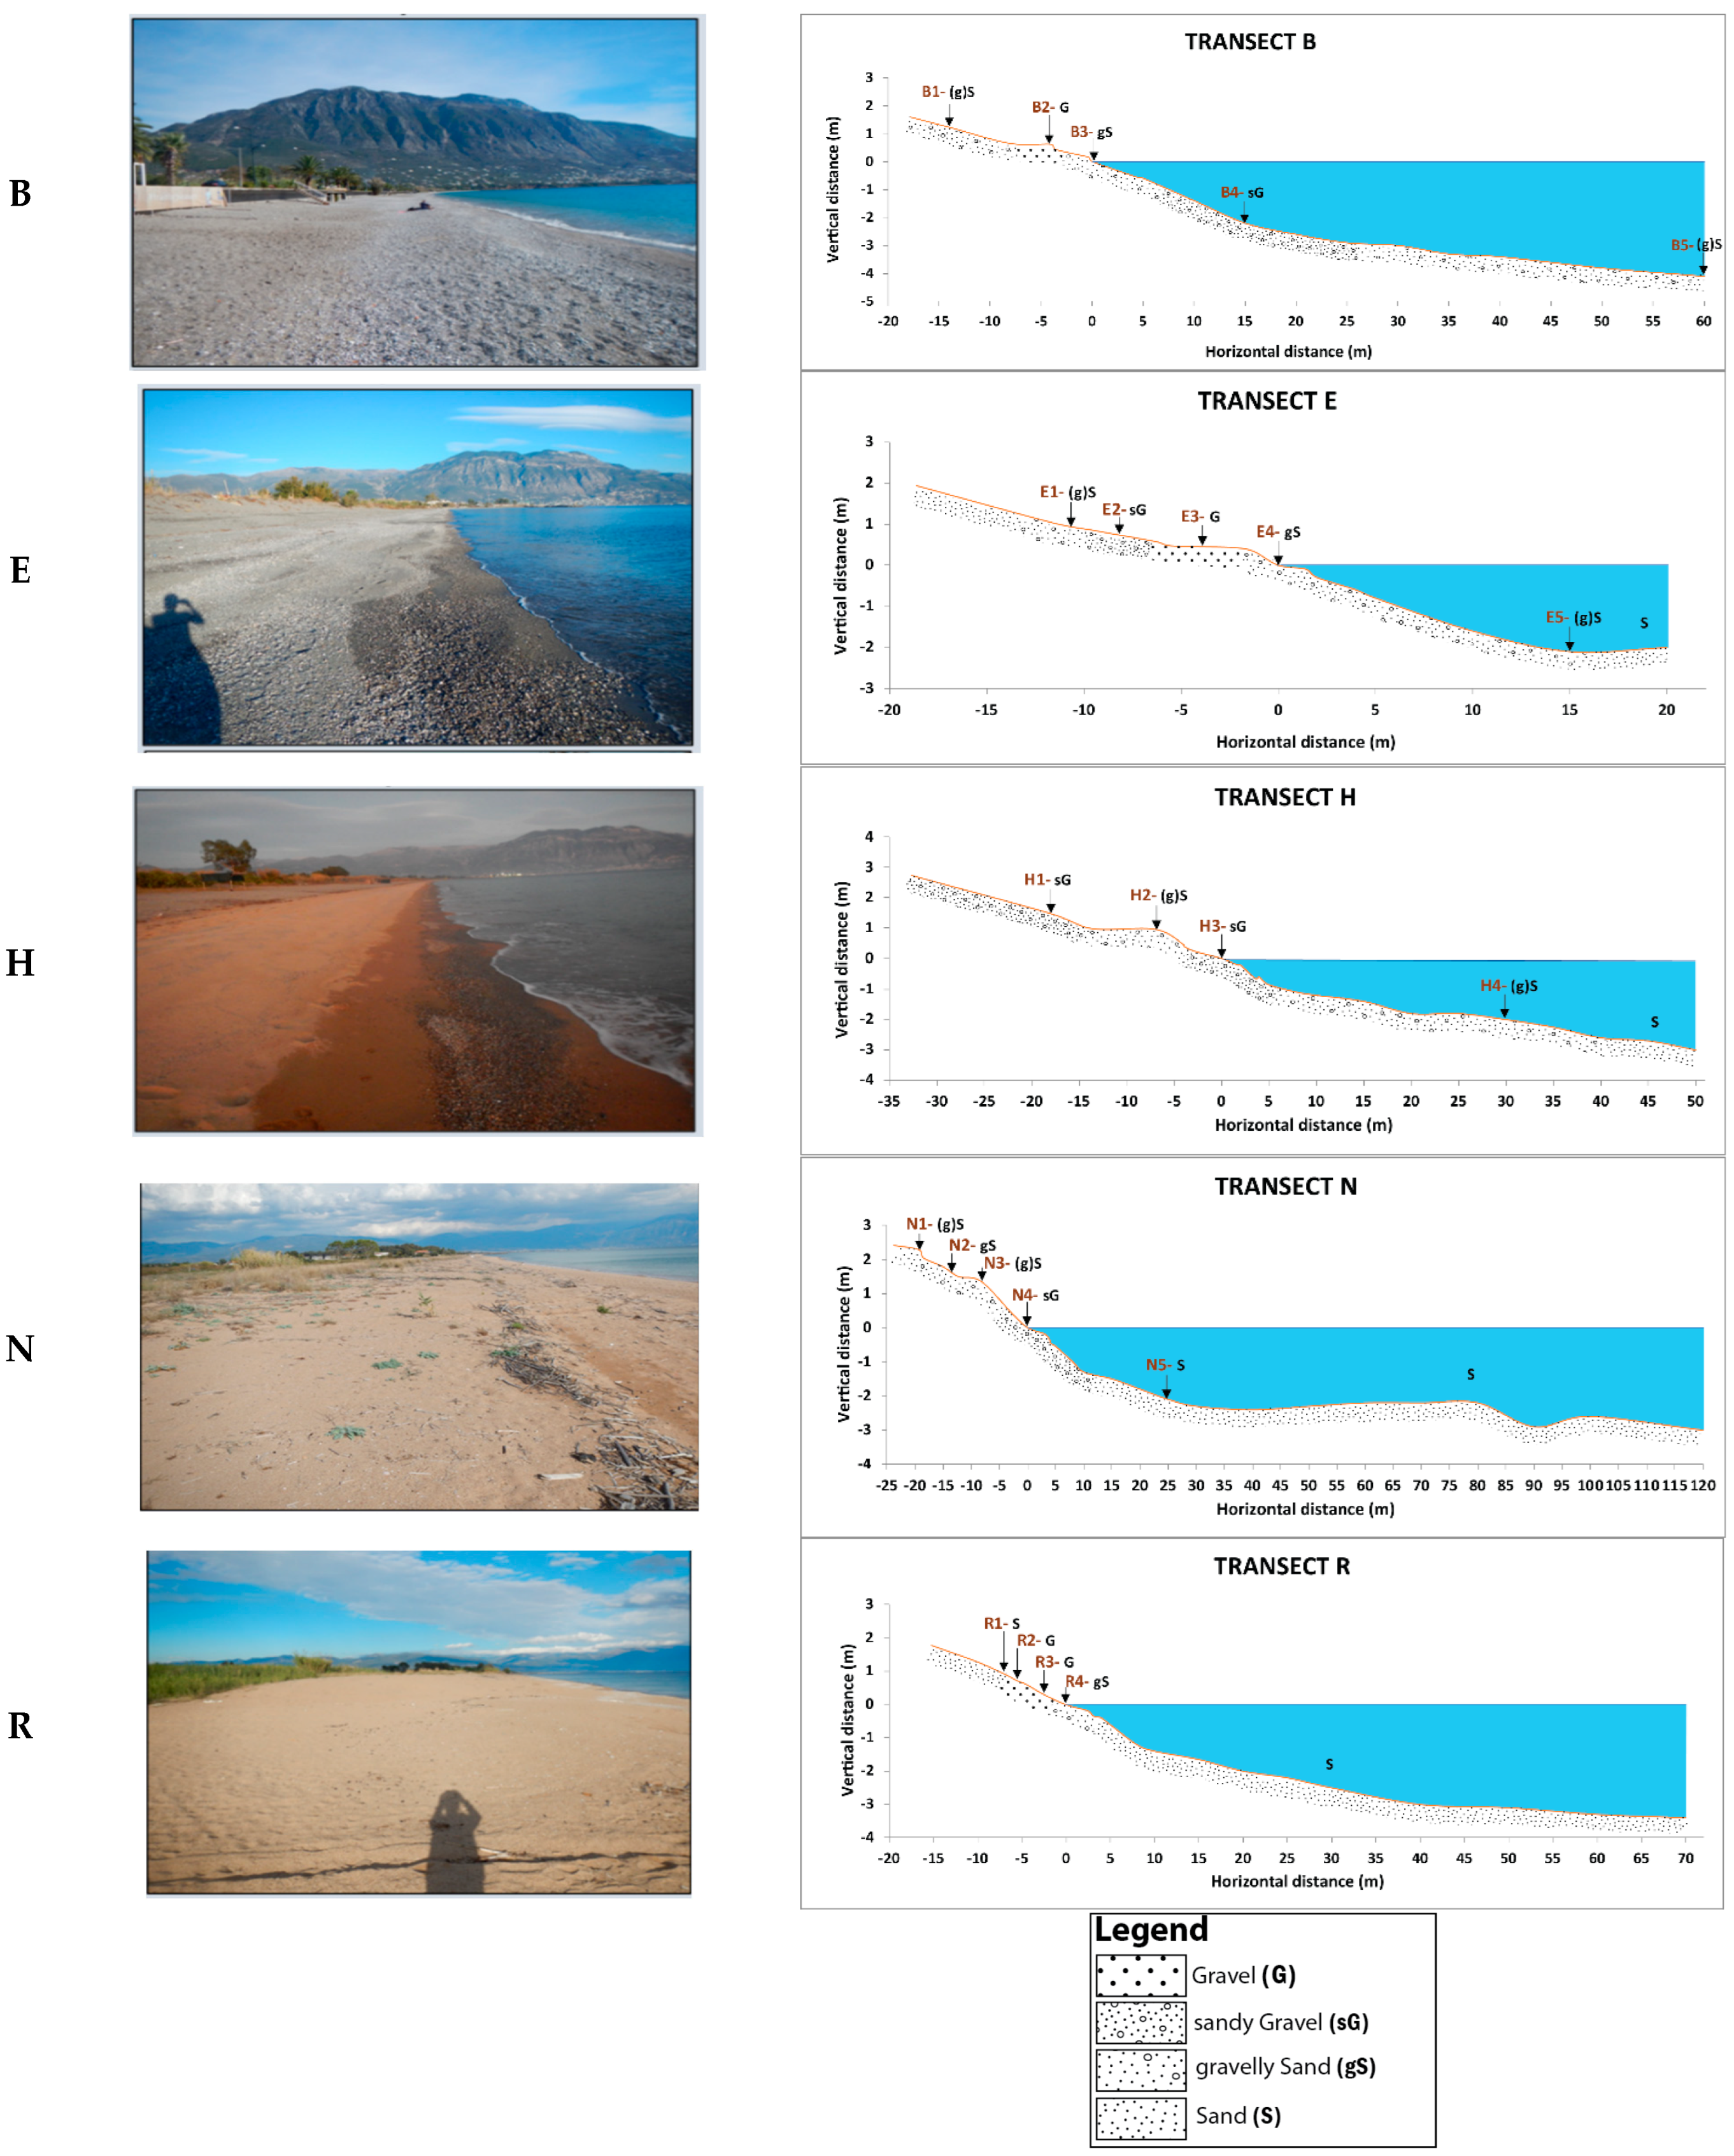
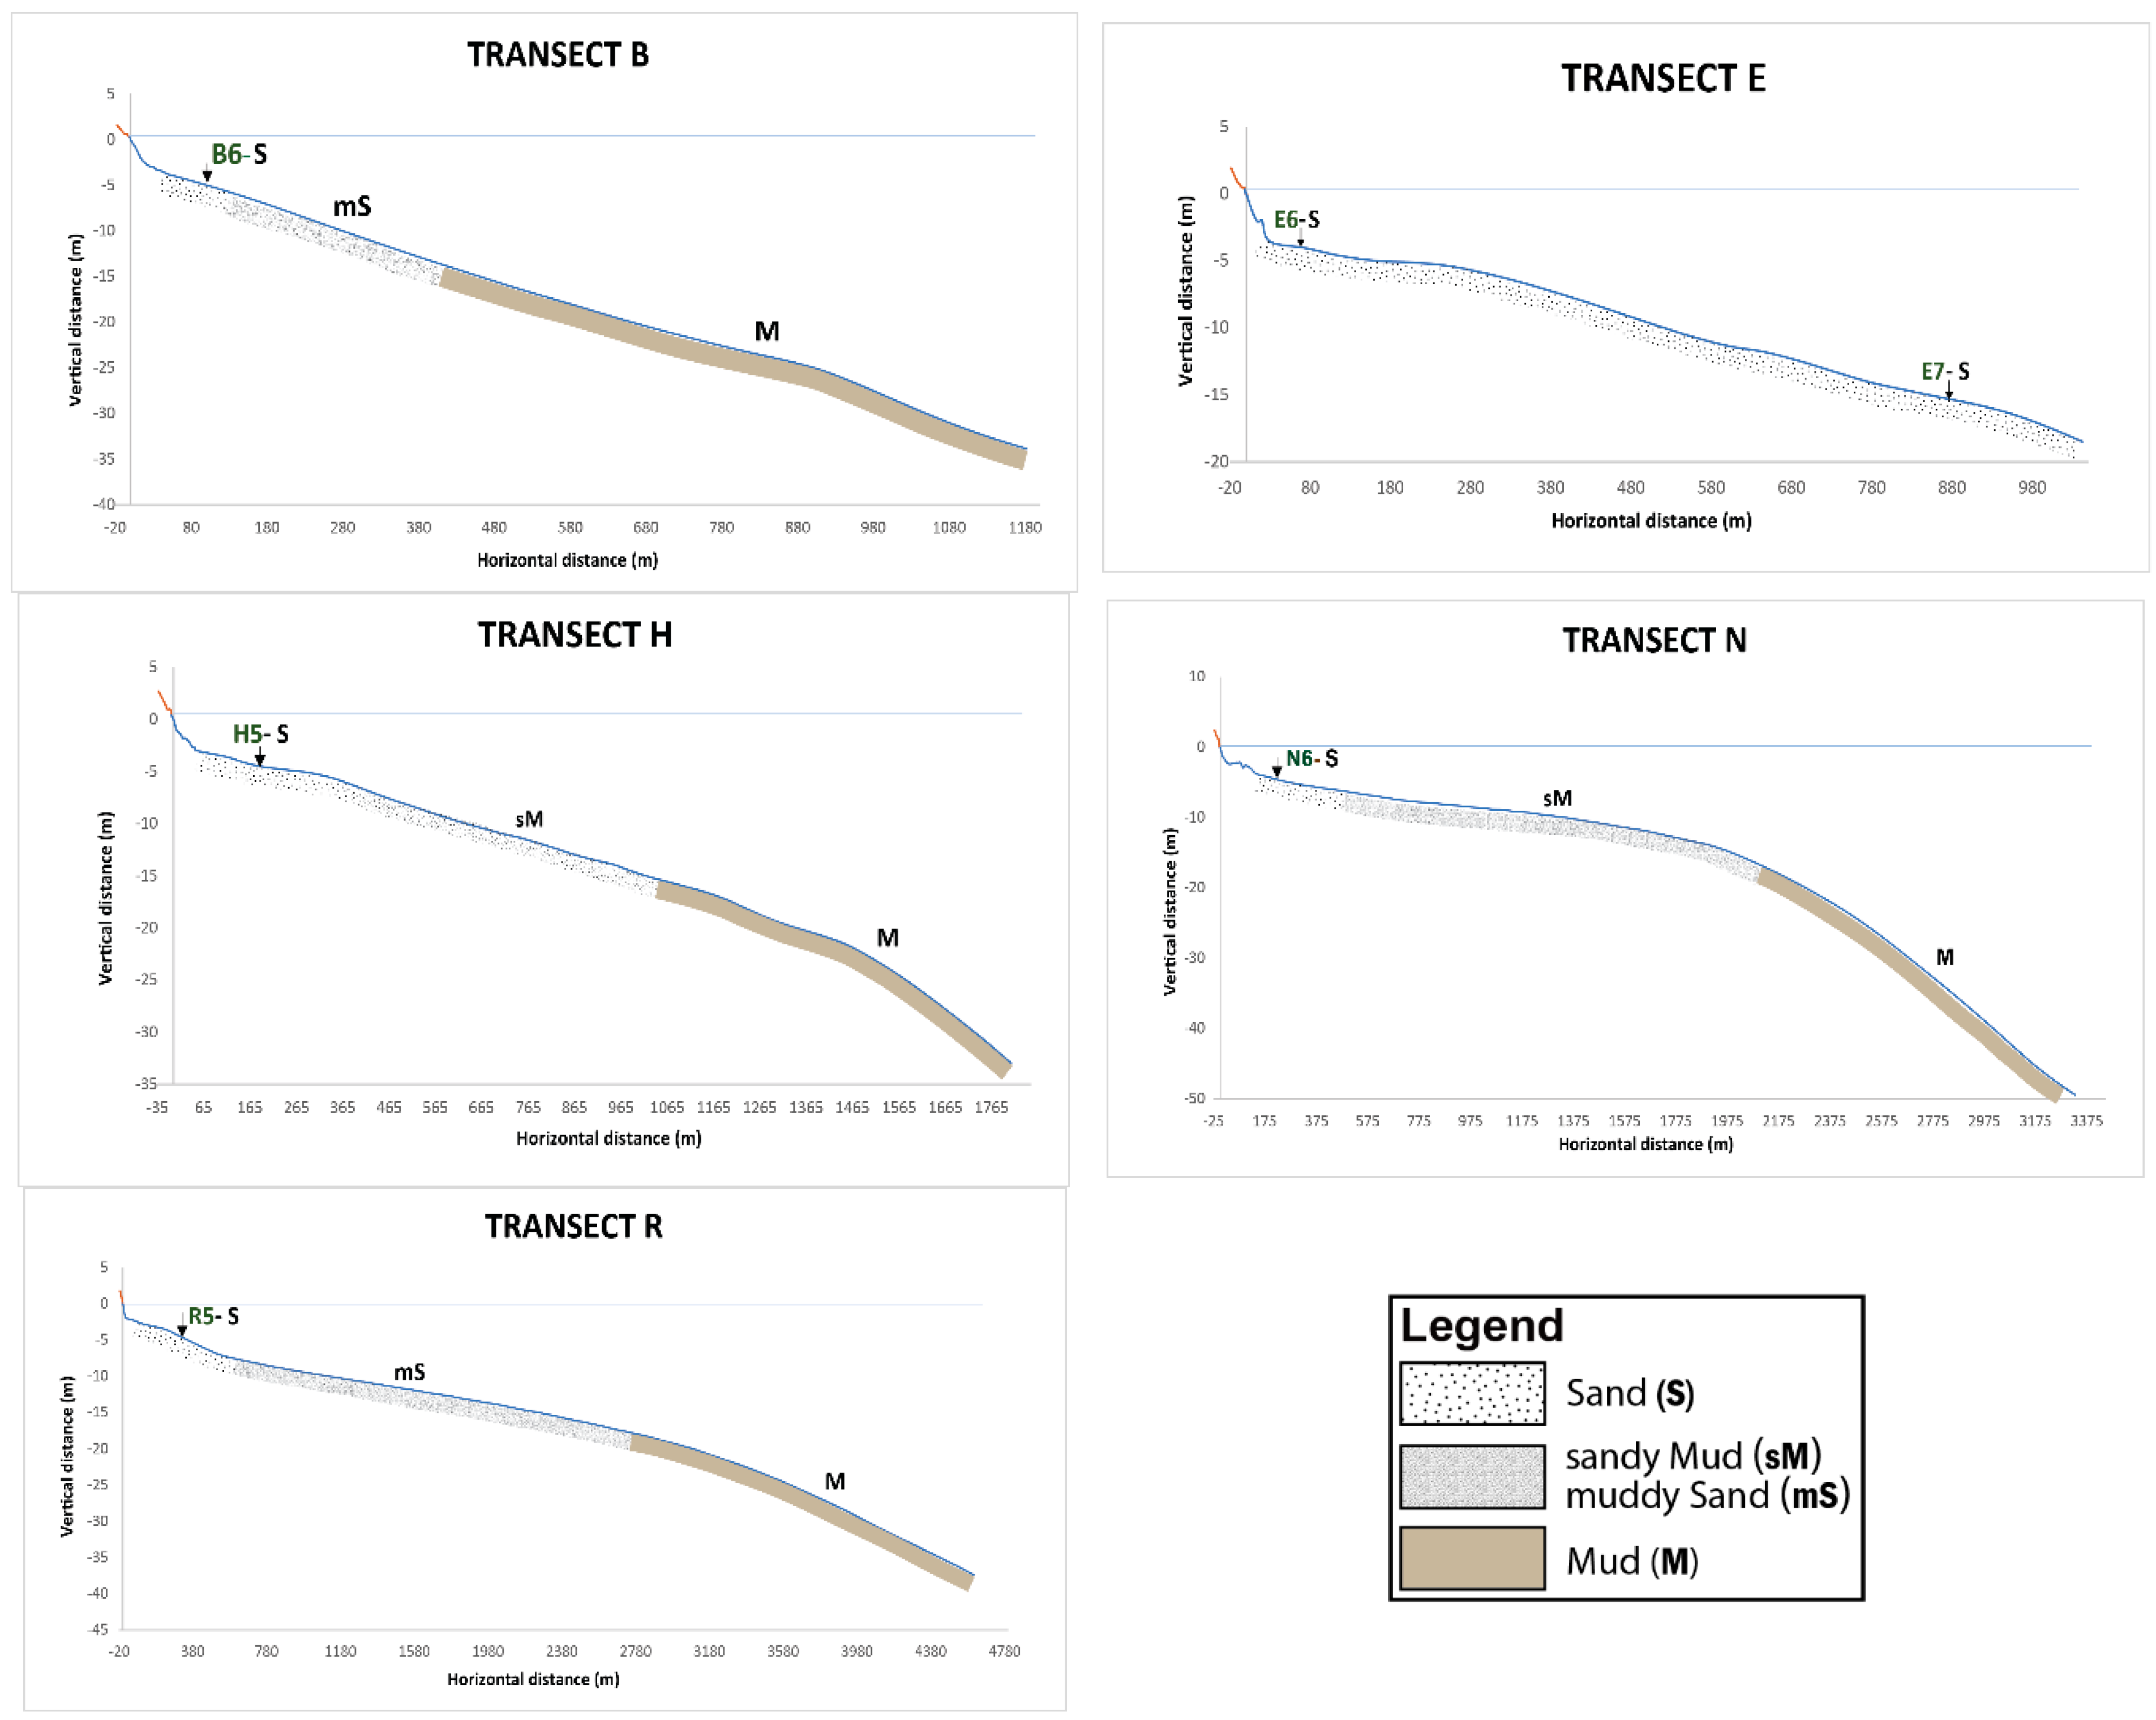
The subaerial part of the beach exhibits a maximum elevation of 2.5 m while its width varies from 15 to 35 m with the larger values occurring in the central sectors (S3 and S4); this is demonstrated by the 19 shore normal profiles shown in Figure A1 in Appendix B). As shown in Figure 4 and all the profiles in Figure A2 (Appendix B), the subaqueous part of the beach extends to water depths of up to 4 m.
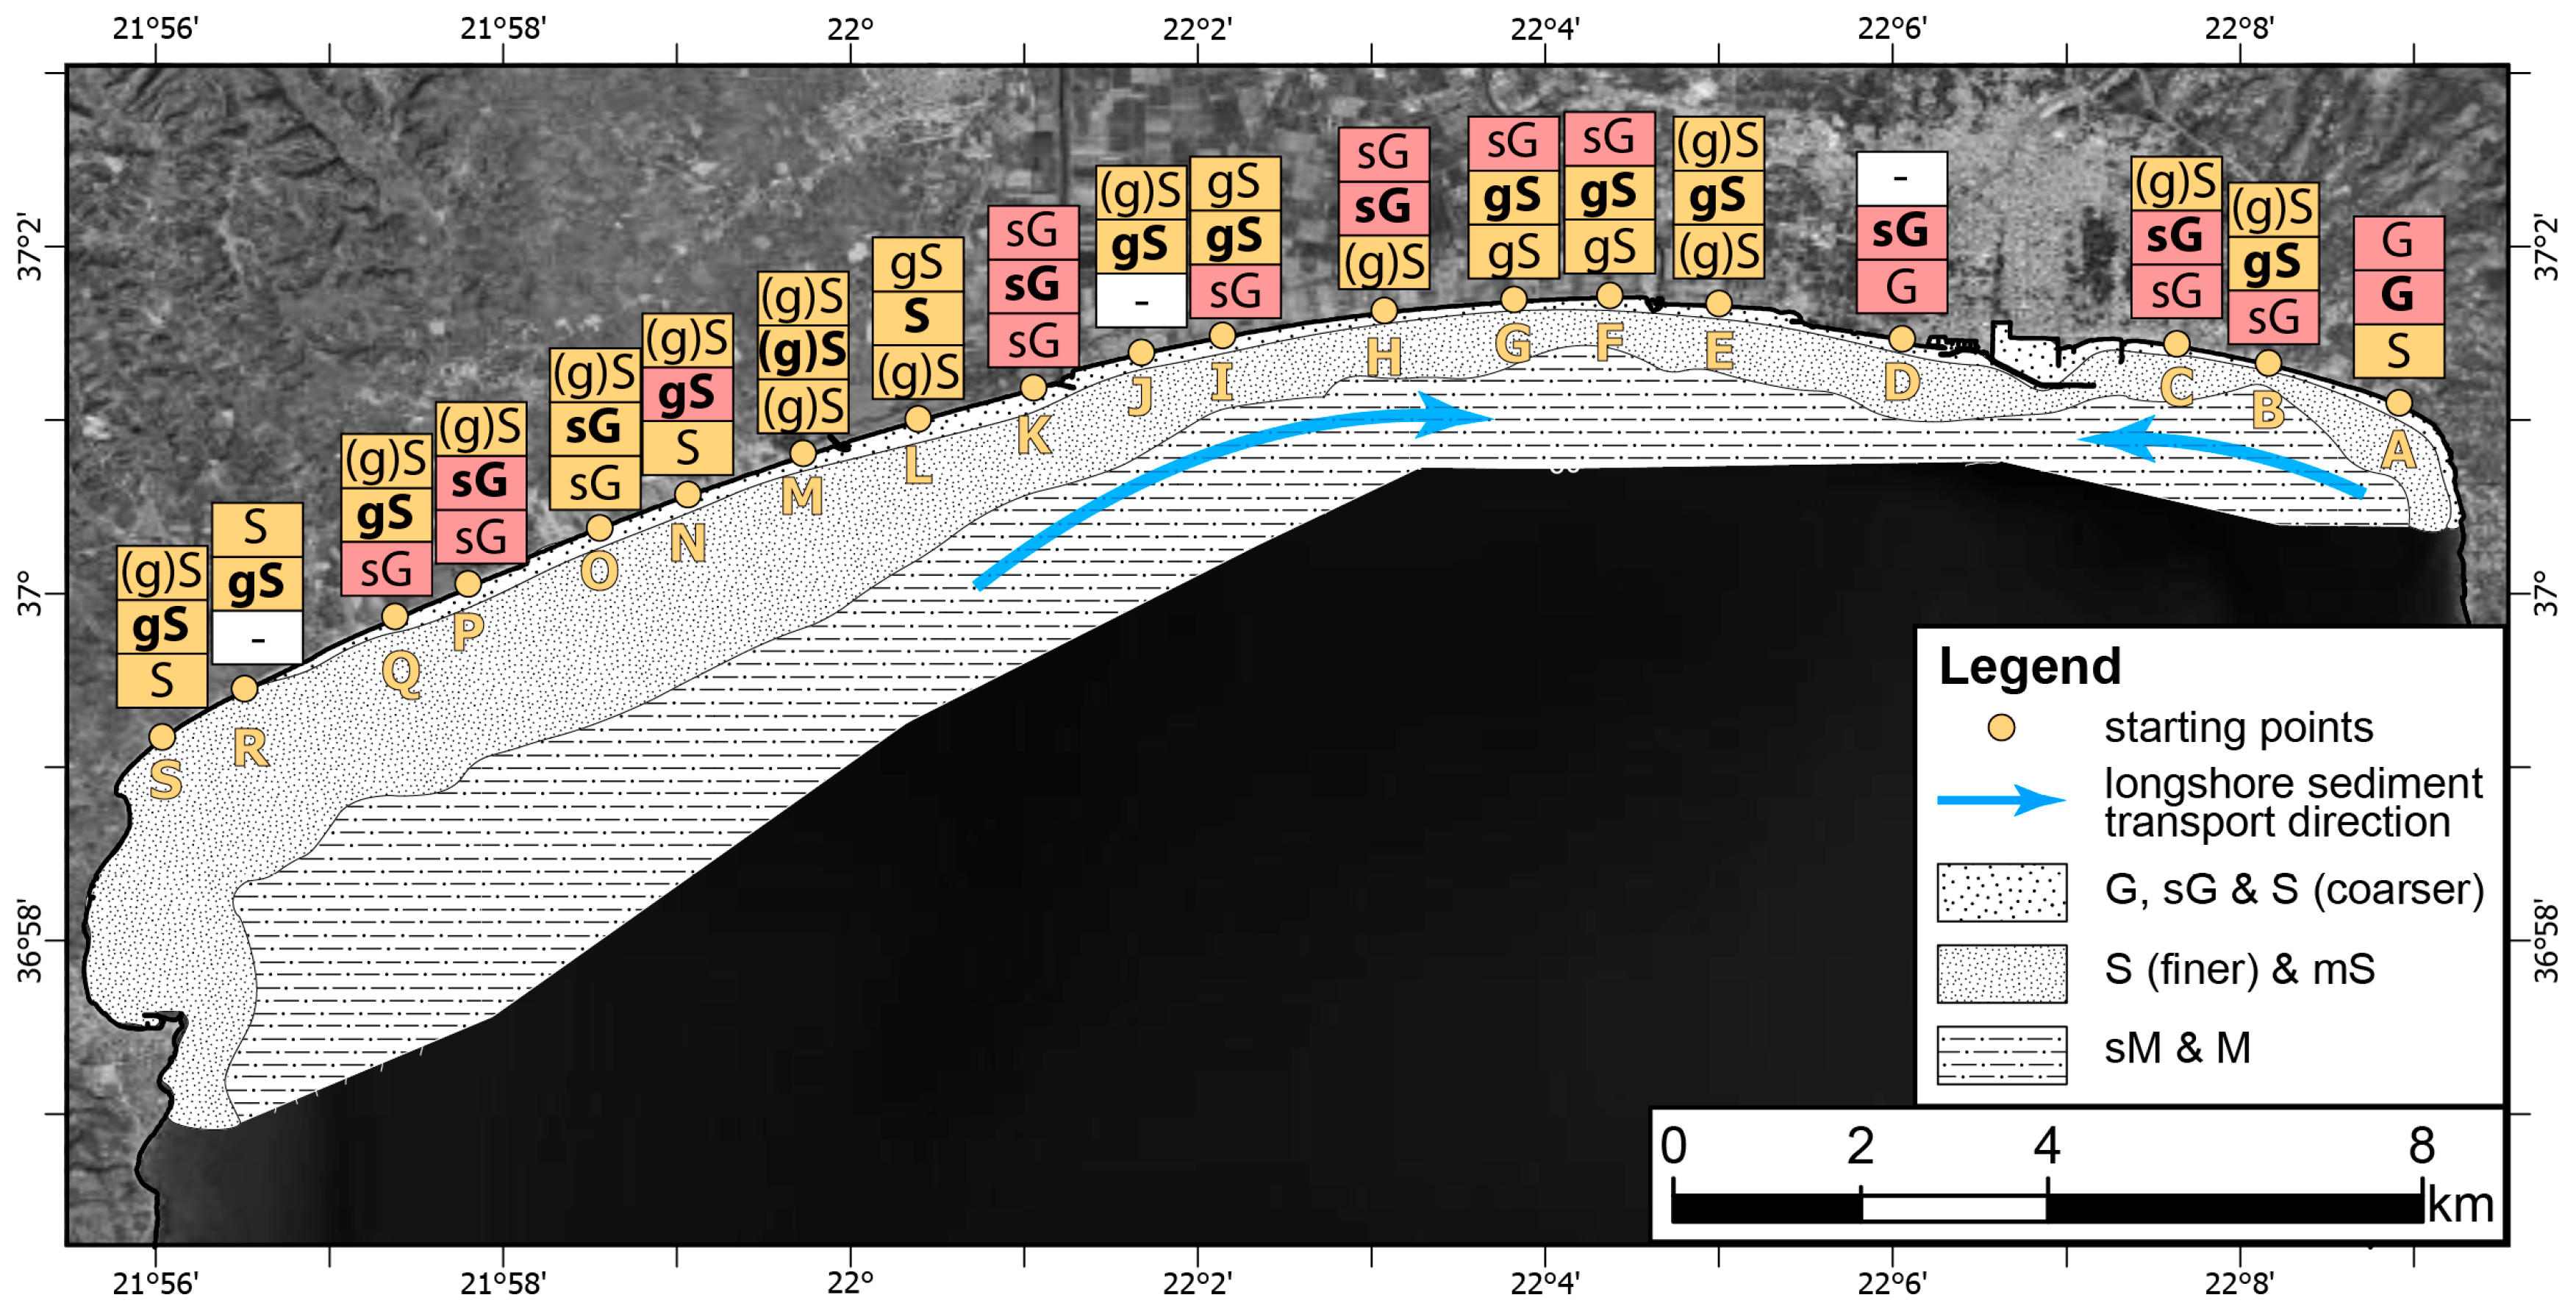
As demonstrated in Figure 4 and Figure 5, and as evidenced by the grain size analysis results presented in Table A3 (Appendix C), the subaerial beach material comprises a mixture of gravel and sand. The eastern part of the beach (S1) is characterized by a prevalence of gravel, while gravel material significantly contributes to the beachface in the western part (S2–S5). The subaqueous grain sizes are dominated by sandy material up to depths of approximately 15 m. Beyond this depth, the prevalence of muddy deposits becomes evident, which envelop the seabed. It is noteworthy that Posidonia meadows have not been observed in the nearshore or offshore areas (water depths < 40 m).
The beachface exhibits slopes ranging from 12% to 20%, while the subaqueous region features nearshore slopes with a maximum of 2%. In deeper waters (i.e., >25 m), the seabed becomes more sloping (i.e., 2.5–3.5%), apart from its western part (S5). Moreover, the presence of bars with heights less than 1 m has been observed along the various profiles, situated at differing distances from the shoreline. The initial bars were observed in close proximity to the shoreline (depths < 1.5 m). The next and most persistent bars were observed at water depths of 2–3 m and a distance of <60 m, and at a water depth of 4–5 m and at distances up to 315 m.

4.2. Hydrodynamics/Morphodynamics

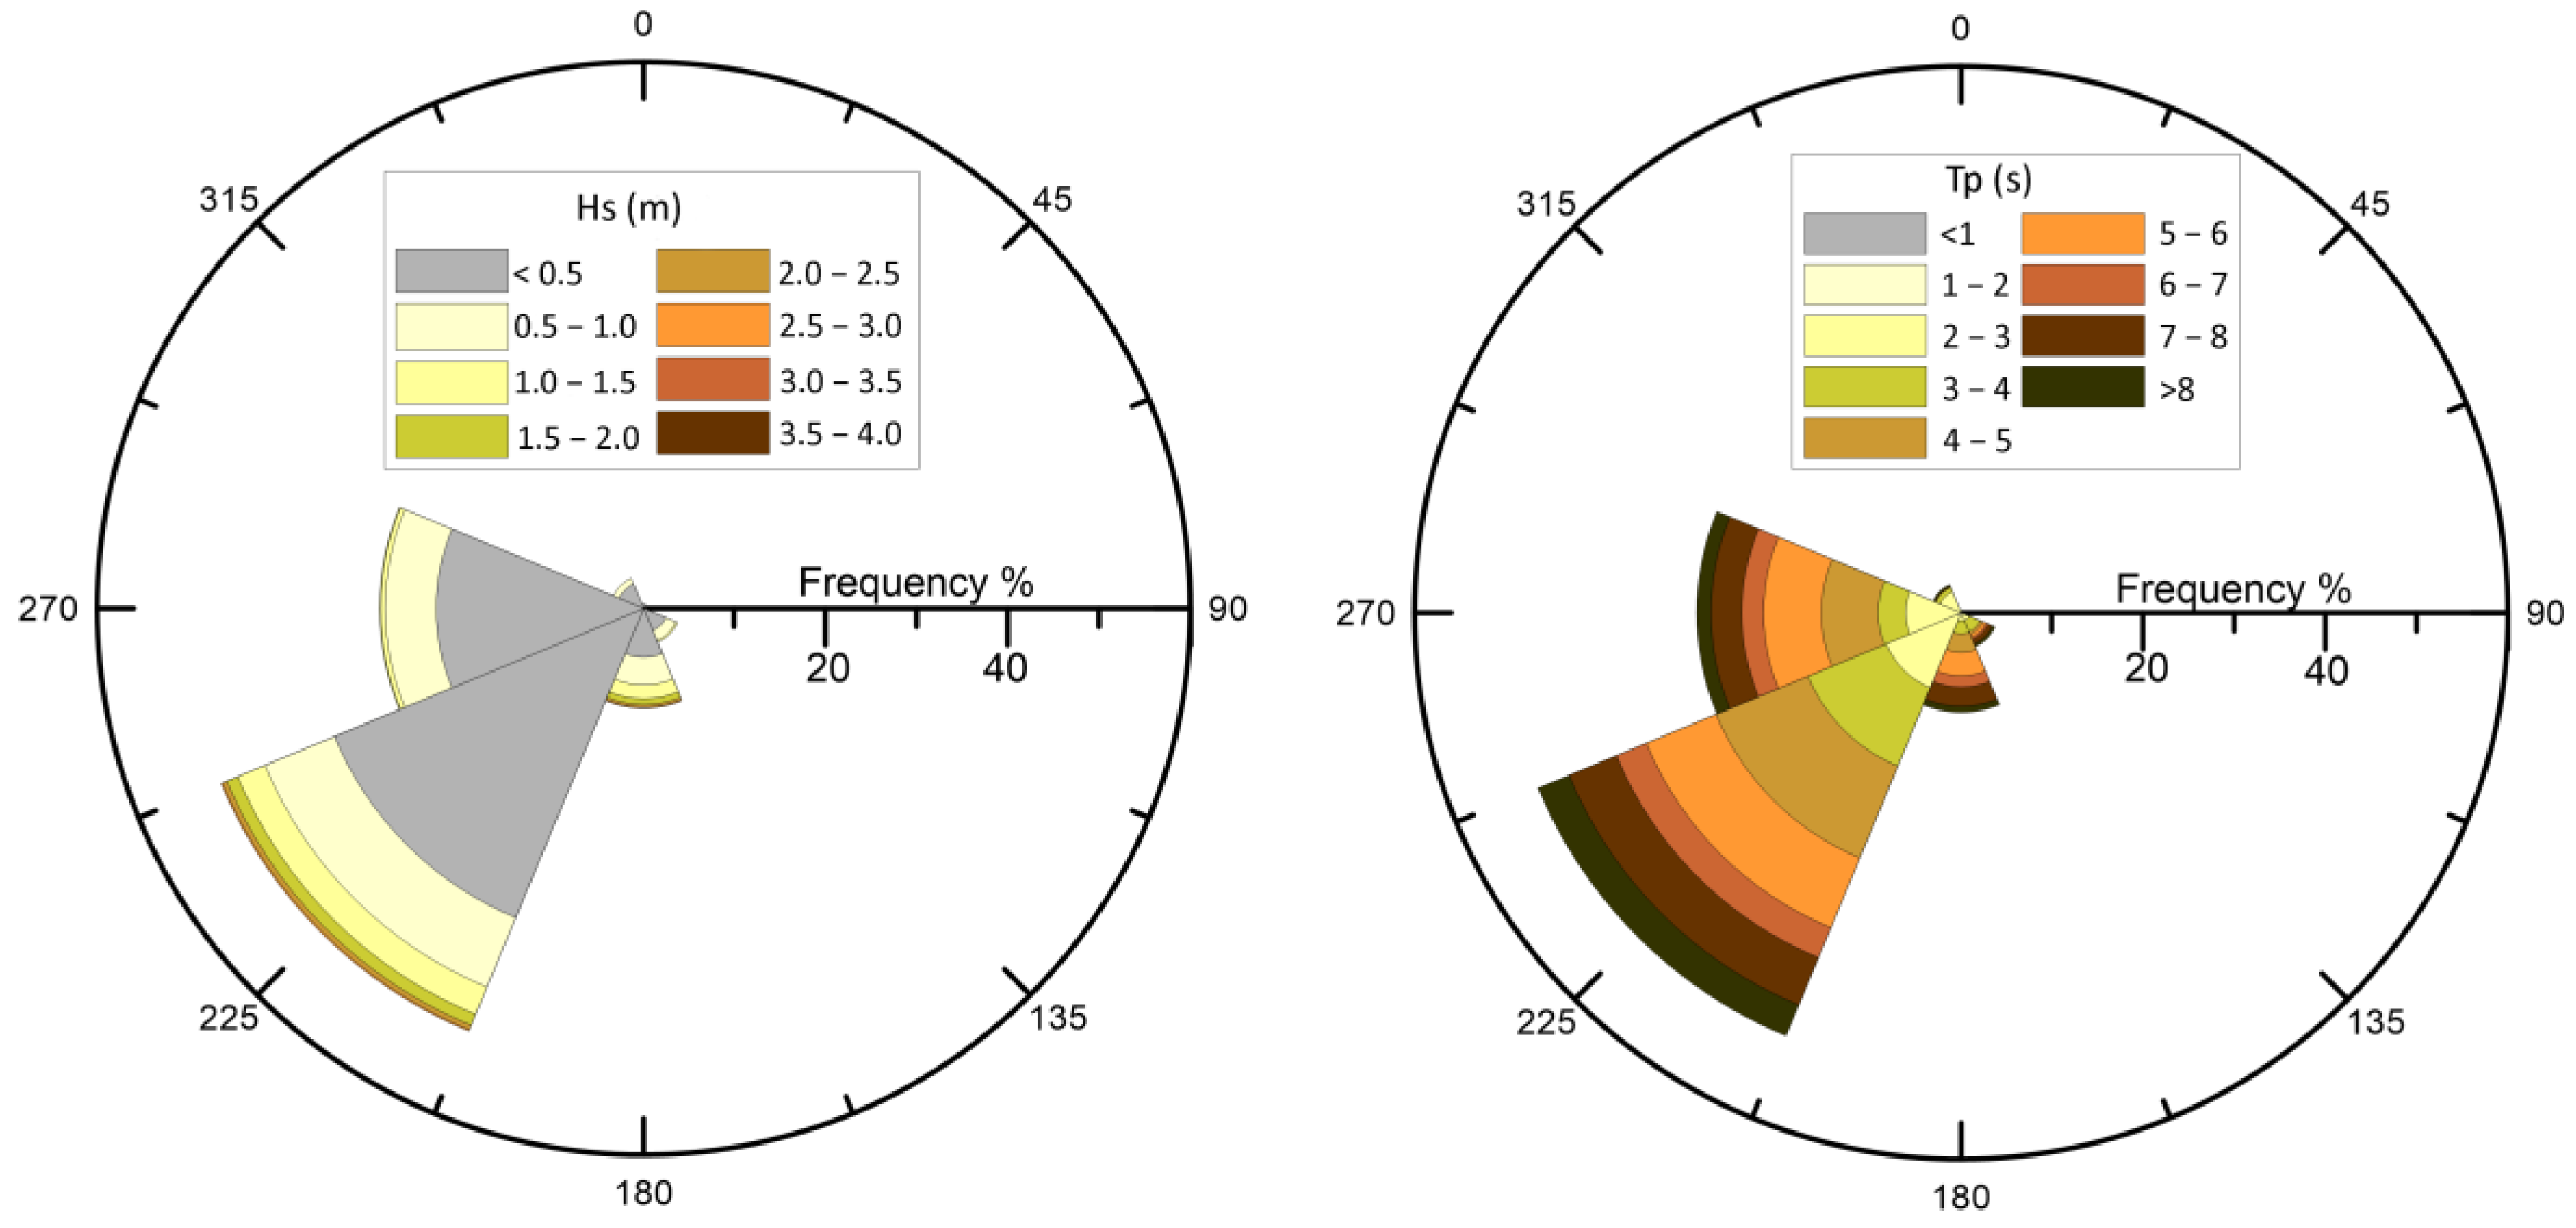
The wave regime in the Messiniakos Gulf, as illustrated in Figure 6, is dominated by the waves approaching from the South-southwesterly directions, with the annual frequency of occurrence from the north and northeasterly direction to be <1% (i.e., N (0.61%), NE (0.12%) and E (0.54%)). The present analysis refers to the fetch directions to which the north coast of Messiniakos Gulf is exposed, i.e., 155–215 degrees. Thus, Table 1 shows the calculated main wave characteristics (height, peak period, direction) and their annual frequency of occurrence for the largest 1/3, 1/10 and 1/100 waves. Additionally, the values of the extreme significant waves, i.e., those that occur for 12 h per year (0.137%), are provided, as they are involved in certain hydrodynamic equations.
Incoming offshore waves approach from southern directions with a median direction varying from 173° (H1/3) to 179° (H1/10). The heights and periods of the largest 1/3 (significant waves) are H = 0.6 m and T = 5.3 s; for the usual maximum waves (largest 1/10), H = 2 m and Tp = 7.4 s; and for the extreme high waves (largest 1/100), H = 4.2 m and Tp = 8.4 s. Based on these characteristics, the closure depth (i.e., the subaqueous limit of the active beach profile) is defined at 7 m, while the maximum run-up is set at 1.3–2.4 m (see Table 2). This wave regime commences interaction with the seabed in water depths of less than 60 m. In water depths of less than 6 m, the depth exerts a governing influence on wave characteristics (height, length and phase velocity). Moreover, the aforementioned wave conditions, when considered in conjunction with the shoreface slope and the grain size of the seabed, result in values for the parameter Ω < 1, indicating the presence of a dissipative type of beach, which may be accompanied by the formation of bars, as is the case here.
As demonstrated in Table 3, the breaking heights of the largest 1/3, 1/10 and 1/100 waves are 0.8 m (maximum for the largest 1/3), around 2 m (maximum for the largest 1/10) and greater than 4 m, respectively. These values correspond to water depths (db) of 0.7 m, 2.2–3.2 m, and 6–6.4 m, respectively.
Table 4 provides a gross estimate of the potential longshore transport rate of sediment at representative profiles (B, E, H, N and R) from the five beach sectors (S1–S5), along with the expected ratio of suspended load to bed load. The average annual rate of longshore transport is estimated to range from 25 to 35 × 103 tons across all sectors. The ratio between SL (suspended load) and BL (bed load) exhibits variability, ranging from 1/0.07 (S2 and S3) to 1/0.30 (±0.5) across the remaining sectors (S1, S4, and S5).
Table 5 shows the estimated shoreline retreat in the event of a storm surge of 0.7 m (the largest value recorded at Kalamata’s port gauge station) and 0.35 m (the most common value along the Greek coast [43]. The estimates were based on the maximum significant wave heights Hmax (1/3) (i.e., those that took place within 12 h per year), the slope of the beachface and its grain size (D50). In the event of moderate storm conditions, the shoreline could retreat by 0.6–2.1 m, while in the event of maximum storm surge, the retreat could be 1.3–4.6 m.

4.3. Shoreline Displacement

The investigation of the spatial evolution of the shoreline is divided into two successive periods: (a) the past 60 years (1960–2017), for which the analysis was based on aerial photographs and satellite images; and (b) future estimates of shoreline retreat induced by sea level rise (SLR) due to climate change.

4.3.1. Past 60 Years (1960–2017)

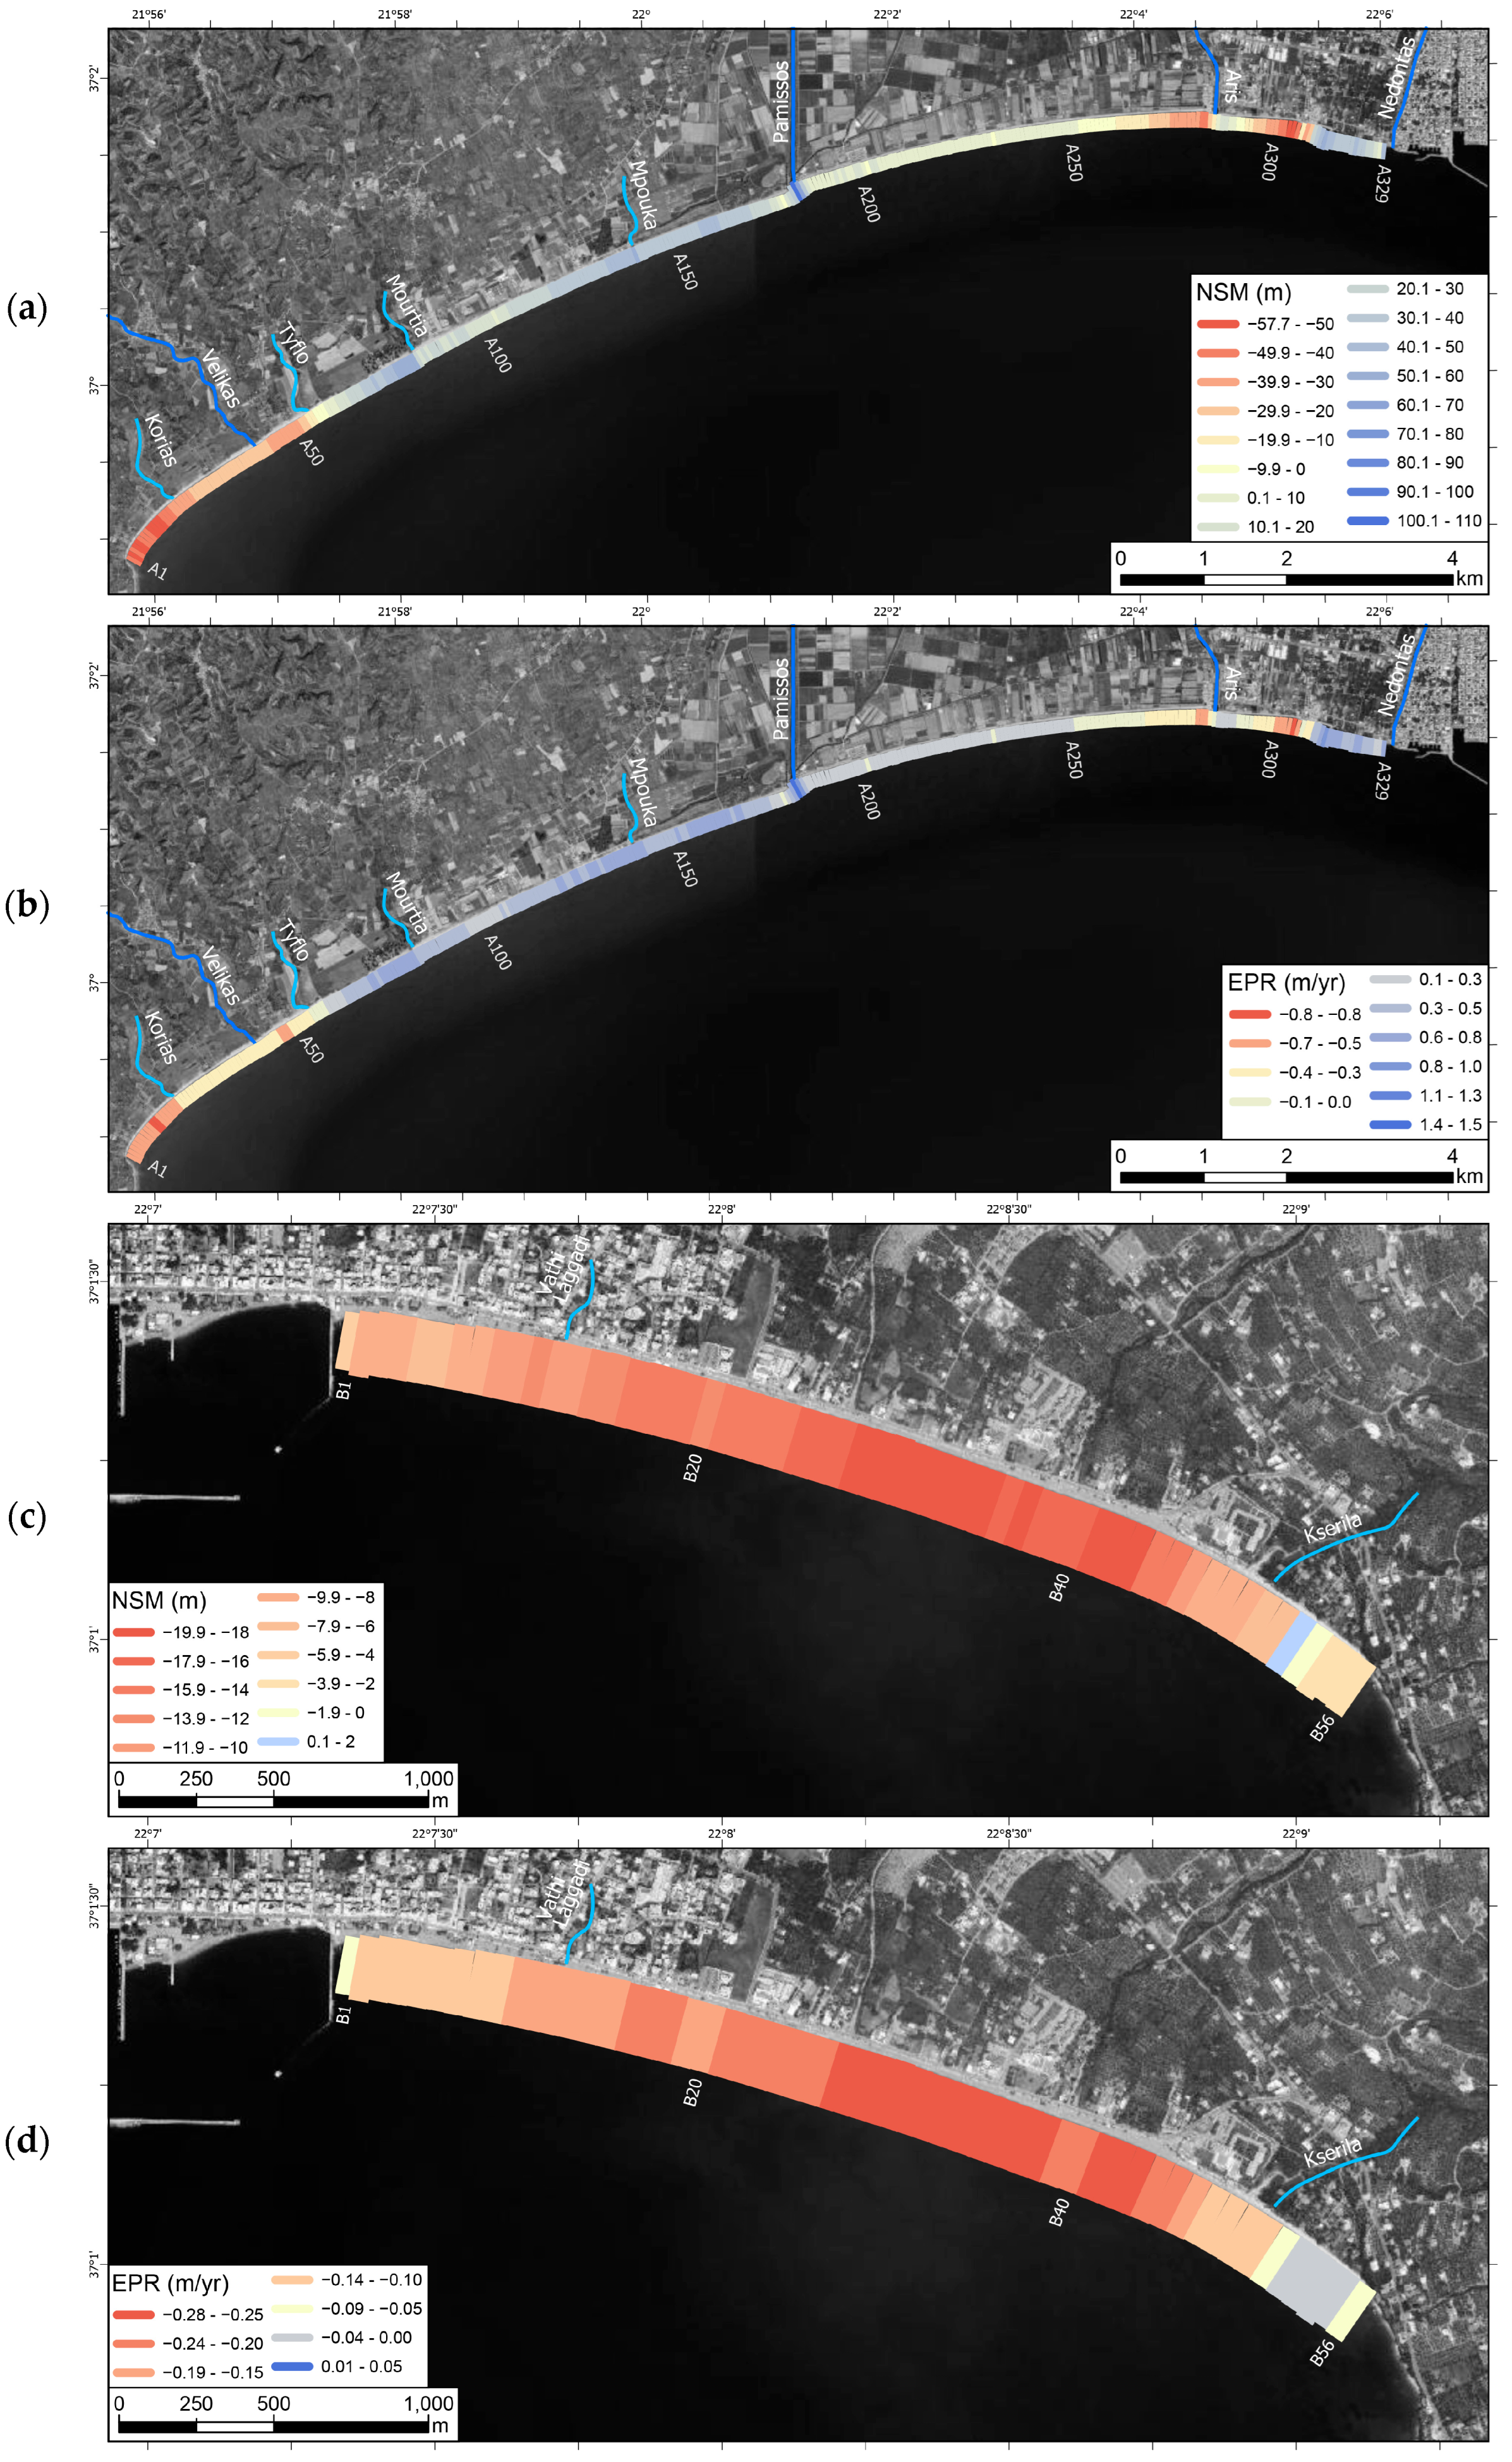
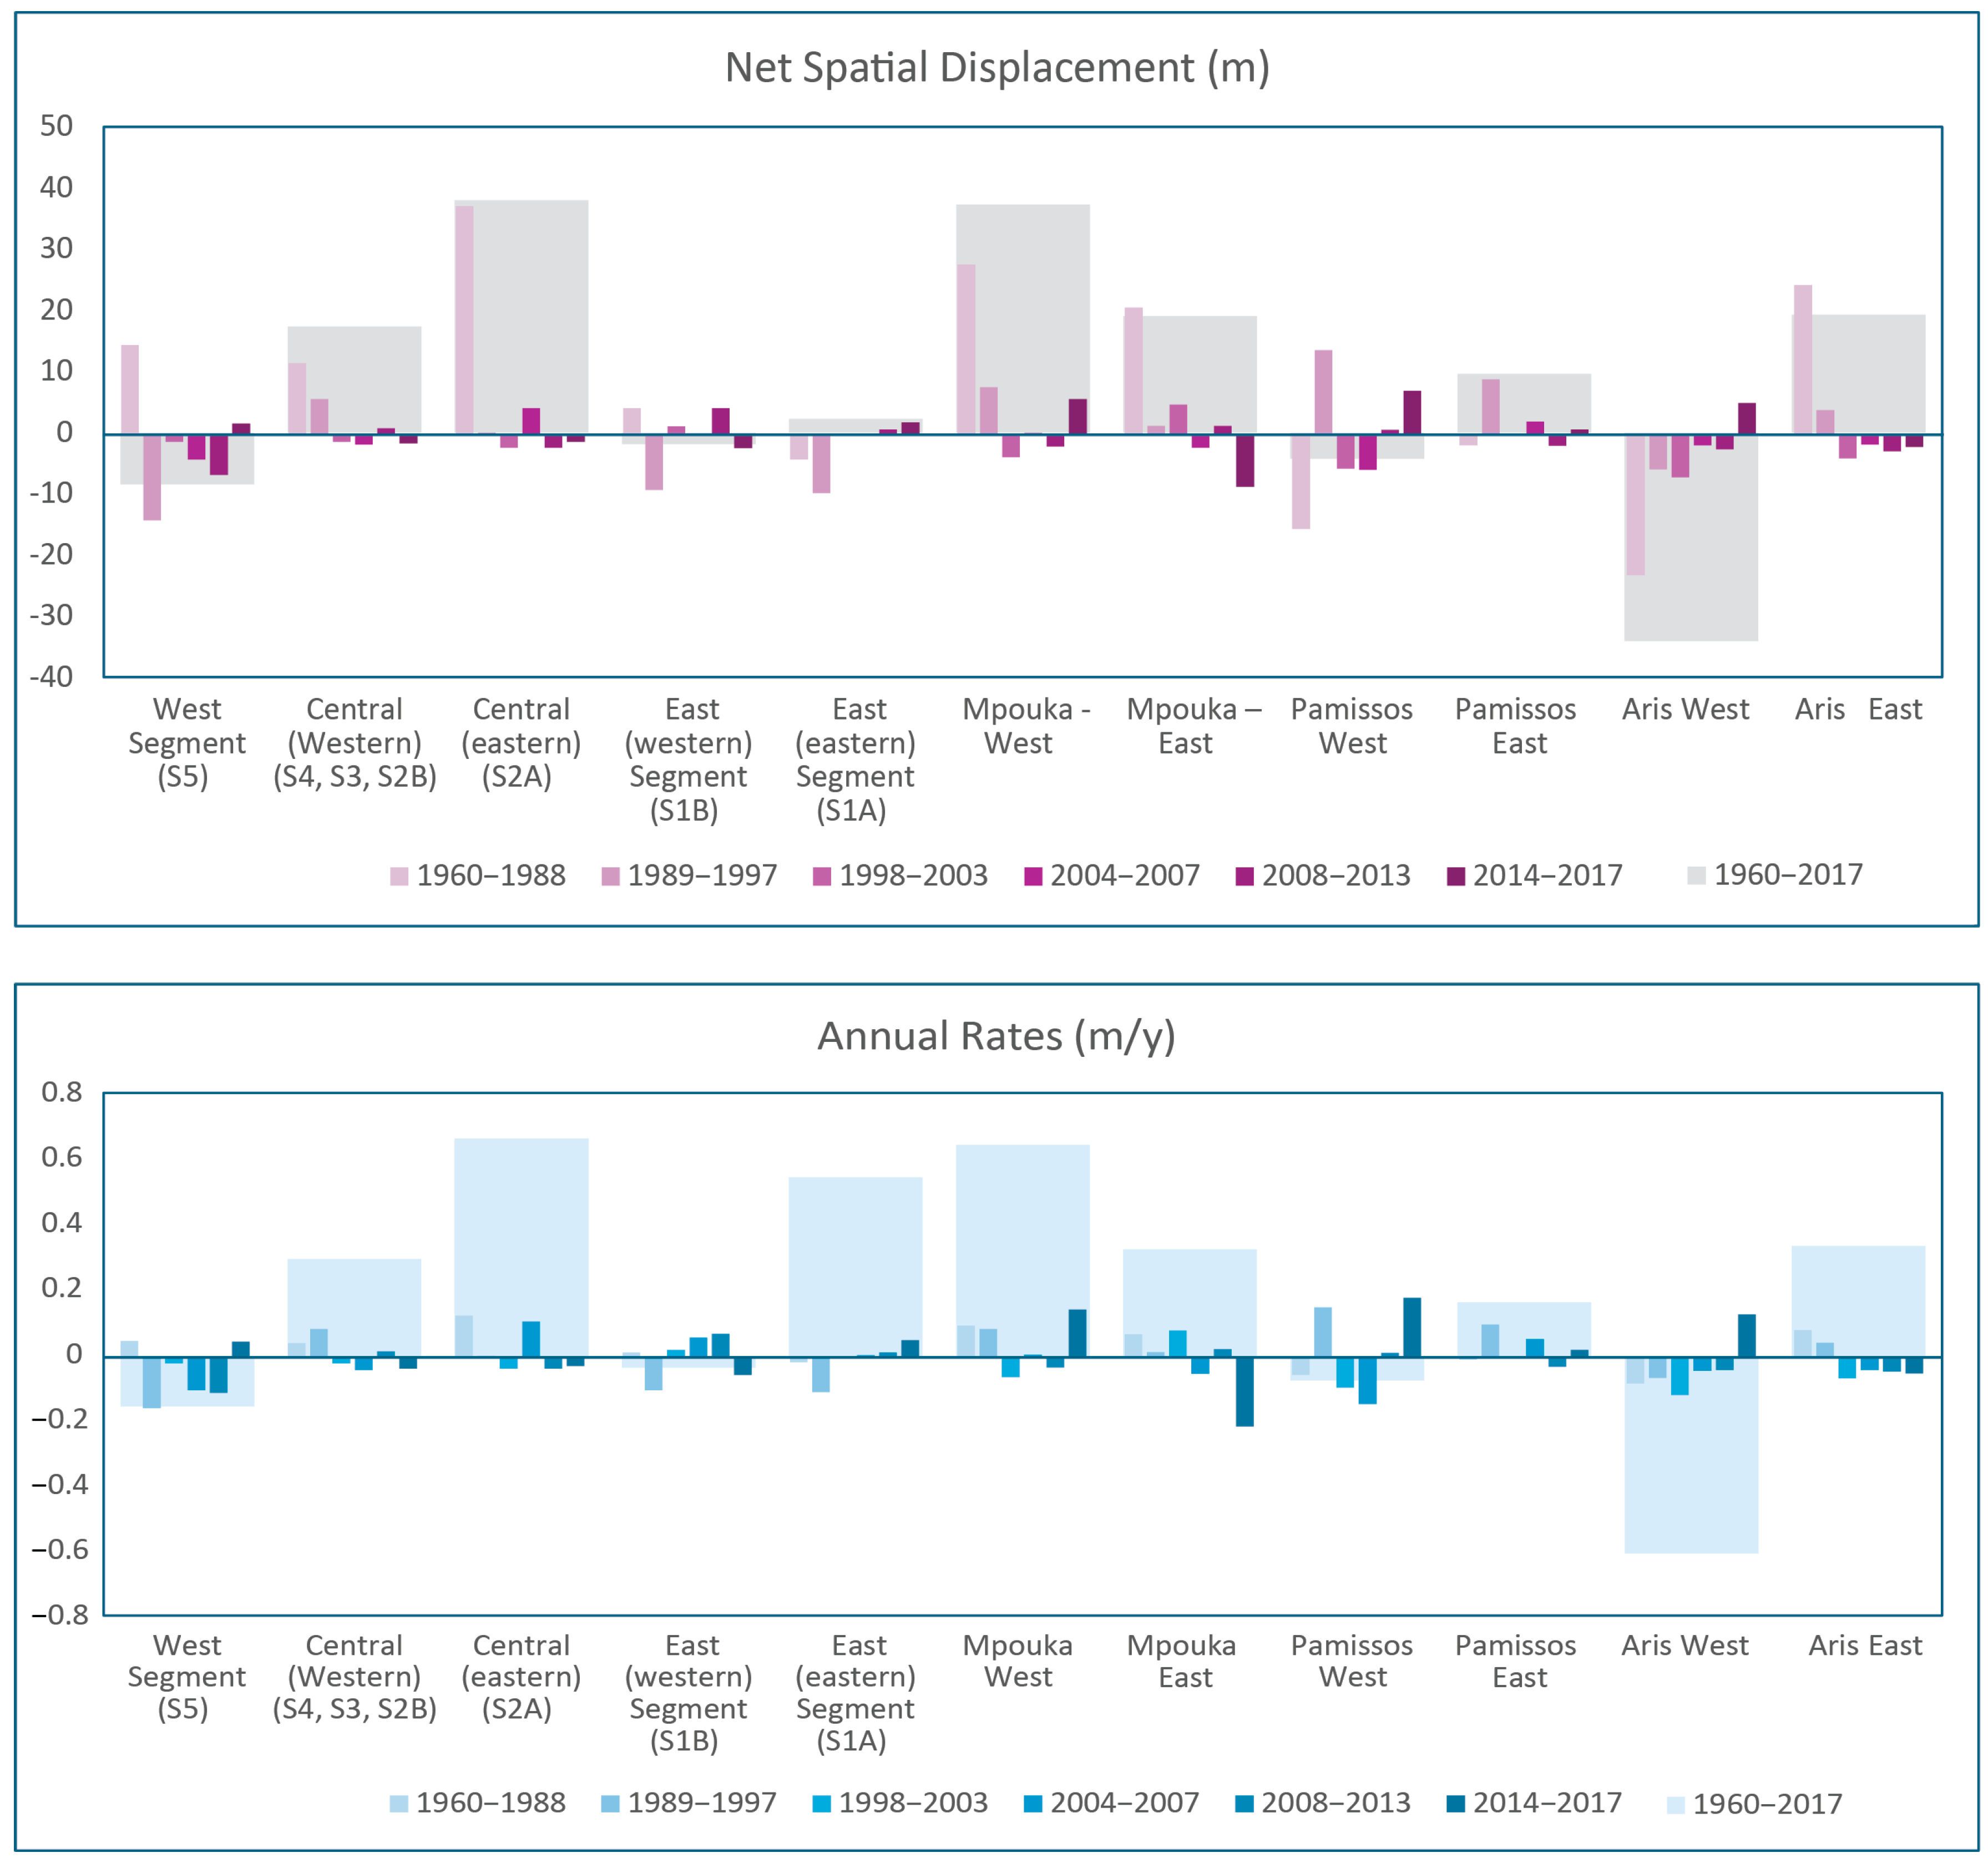
The estimation of the net spatial displacement (NSD, meters) and the associated average annual rates (Rat., m/y) of shoreline position changes for the various time periods are presented for its total length in Figure 7 and Figure 8, respectively. Moreover, Table A4 (Appendix D) presents the estimated values of NSD and Rat for the various beach sectors (S1–S5) and selected river mouths (delineated) across diverse time spans; these values are illustrated in Figure 7.
In the western beach sector (S5; DSAS sections: A1–A59), the Net Shoreline Movement (NSM) was calculated at 15 m for the period 1960 to 1988 (annual rate = 0.5 m/y), while retreat was estimated at 14 m for the subsequent period 1989–1997 (annual rate = 1.6 m/y). Since 1998, the shoreline has undergone a progressive retreat, with a mean decrease of several meters in each successive period. However, during the most recent four-year period (2013–2017), the shoreline underwent a net progradation of 2 m (see Figure 7a,b).
In the western part of the central sector (S4, S3 and S2B; DSAS sections: A60–A285), extending from approximately 1.5 km east of the Tyflos mouth to about 1.5 km west of the mouth of R. Aris (DSAS sections A60–A285), the NSM increased by approximately 12 m between 1960 and 1988 (corresponding to an annual rate of 0.45 m/y). The rate of shoreline advances accelerated until 1997, reaching an average of 0.9 m/y. Subsequently, the shoreline began to exhibit a general retreating trend, with erosion rates ranging from 0.2 to 0.4 m/y, except for the period between 1998 and 2003, when progradation of 1 m (0.2 m/y) was recorded (Figure 7a,b).
In the easternmost part of the central sector (S2A; DSAS sections: A286–A332), the shoreline underwent a progressive erosion of 38 m over the period 1960–1988, at a rate of 1.3 m/y. However, from 1989 to 1997, this rate decreased significantly to 0.02 m/y. Since then, the shoreline has been retreating at an annual rate of 0.35 m/y, except during the period 2004–2007 when substantial progradation of 4.5 m was recorded (Figure 7a,b). This localized shoreline advance may be linked to the proximity of the area to the mouth of the River Nedontas and the presence of the Kalamata port.
In the eastern sector (S1), the shoreline of the western part (DSAS sections B54–B26) prograded by an average of 4.5 m between 1960 and 1988, while the eastern part (DSAS sections: B25–B1) exhibited a comparable retreat of 4 m. Interestingly, the eastern sector (S1) experienced shoreline retreat during the period 1998–2003, with an average rate of approximately 1 m/y (see Figure 7c,d). During the subsequent periods 1998–2003, 2004–2007 and 2008–2013, the sector showed signs of progradation. However, the western part (S1B) demonstrated a greater degree of progradation (1–2 m) than the eastern part (<1 m). Between 2014 and 2017, however, a shift in this dynamic evolution became evident, marked by the eastern part demonstrating signs of progradation, while the western part exhibited retreat. Nevertheless, the absence of data hinders further investigation of this change.
The aforementioned shoreline displacements are significantly higher at both sides of the river mouth. As shown in Table A4 (Appendix D), the river mouths of Mourtia, Pamissos and Aris have undergone shoreline changes ranging from 15 to 20 m, with annual rates exceeding 5 m/y. The observed discrepancy in the morphology of the river mouths on either side of the river mouth can be attributed to the direction of longshore sediment transport, which is from west to east in the case of the Mourtia and Mpouka Rivers and from east to west in the case of the Aris River, in association with the presence of groins.

4.3.2. Future Trend

The future trend of shoreline retreat has been estimated using representative profiles from the five beach sectors (S1–S5) and the different Shared Socioeconomic Pathways (SSP) climate scenarios for sea level rise due to climate change [42] are presented in Table 6. In general, it is evident that sector S1 has the lowest potential beach retreat values (9.6–18.2 m), while sector 5 has the highest values (32–26 m) for all the SSP scenarios. Sectors S2 and S3 are characterized by intermediate retreat values of 19–39 m, while beach retreat in sector S4 falls between the values observed in sectors S2 and S3 (i.e., 32–62 m).

5. Discussion

The area’s geological structure is significant, as the main courses of all rivers (running from north to south) align with the primary axis of the north–south fault zones (see Figure 1). Seismotectonic activity is also considered an important factor, but on much larger geological scales. The most recent earthquake, which occurred on 13 September 1986 and had a magnitude of 6.2 on the Richter scale, was produced by a listric normal fault striking in an NNE–SSW direction, parallel to the eastern coast of the Messiniakos Gulf and dipping to the WNW [44]. Based on leveling data from 1963 to 1986/87, vertical land movements were in order of a few centimeters, while the Kalamata tide gauge recorded no signs of relative sea-level change throughout the seismic sequence [45].
It is also important to consider that, as with the other coastal zones in the Mediterranean Sea, the formation of the Messiniakos coastal zone commenced 4–5 millennia ago, when the mean rate of sea level rise, from >1 cm/y reduced to less than 1 mm/y [46,47,48]. This alteration presented an opportunity for terrestrial processes to counteract hydrological processes, resulting in the formation of new Upper Holocene depositional formations. In this context, an estimated total of 117,000 tons of riverine sediments are discharged into the northern Messiniakos coast each year, 41.3% of which is contributed by the Pamissos River. This value is derived from the measured annual sediment flux of the Evrotas river basin (85 tones/km2) [49], which is discharged into the adjacent Lakonikos Gulf and exhibits analogous hydro-geological conditions.
Tectonic activity has also impacted on the submarine part of the coastal zone. The overall seabed bathymetry of the inner continental shelf clearly shows a systematic change in underwater slopes, with both distance (D) and water depth (WD) increasing from west to east. This is illustrated in Figure 9, which demonstrates the following relationships: D = 1 km WD = 20 m (section A–A’); D = 2 km WD = 22–23 m (section B–B’); and D = 2 ± 0.25 km WD = 15–20 m (section C–C’). Similar morphological change are also observed across the three sections in water depths between 40 and 60 m, with increasing distance from the coastline and corresponding depths from east to west (i.e., D = 4 km and WD = 55 m at section A–A’; D = 2 km and WD = 40 m at section B–B’; and D = 1.7 km and WD = 50 m at section C–C’). These morphological changes are most likely associated with the subaqueous extension of the fault zone (Figure 1c) on the western coast that runs from west to east, in conjunction with the tectonic uplift of the eastern mountainous Messiniakos coast [19].

5.1. Morphodynamic Characteristics

The subaqueous part of the beach zone (water depths < 10 m) has been found to exhibit increased slope gradients and a narrower shelf in the eastern sectors (S1 and S2) compared to the central (S3 and S4) and eastern (S5) sectors (Figure 5). For example, the 5 m isobath (assuming a closure depth of −7 m) is located at a distance of 90–100 m in the eastern segment, whereas in the central and western sectors it is located 180–200 m from the coastline This configuration may be associated with the broader geotectonic evolution of the inner shelf (as previously discussed) and the substantial riverine sediment influx observed in sectors S3 and S4.
The beach zone along the north coastline of the Messiniakos Gulf is exposed to offshore waves approaching from the south. The hydrodynamic limit to the landward side of the beach is defined by the wave run-up (1.3–2.4 m) and storm surge (0.35–0.7 m), which in conjunction reach elevations greater than 2.5 m. The seaward limit of the beach, as defined by the closure depth, is at a depth of 7 m. The entire subaqueous zone is characterized as dissipative (Ω < 1) with the presence of bars. The depth of these bars is commensurate with the wave-breaking depths, which are 0.7 m (for the largest 1/3), 2.7 ± 0.5 m (for the largest 1/10) and 5.9 ± 0.5 m (for the largest 1/100).
The beach to the east of the port is impacted by anthropogenic activities (i.e., a coastal road reinforced by a retaining wall and the development of tourist settlements). The beach material exhibits a transition from a mixed composition of sand and gravel with a preponderance of sand in the vicinity of the port (S1B), to a coarse gravelly terrain to the east part (S1A). The increased presence of fine-grained (sandy) material near the port (S1b) is favored by longshore sediment transport from east to west (Table 4).
To the west of the port, a sandy beach extends from the mouth of the R. Aris to the mouth of R. Nedontas ending to the west of the port (S2B). The beach is clearly influenced by the influx of the Rivers Aris and Nedontas (S3A), the eastward longshore sediment transport, and the presence of the port breakwater that acts as a terminal barrier.
The beach, which extends between the mouths of the two main rivers, Pamissos (west) and Aris (east), has a width of up to 25 m and is primarily composed of mixed grain sizes, with gravel being predominant in sector 3A and sand in 3B. The increased contribution of sand in sector 3B is associated with its proximity to the R. Pamissos mouth. The backshore is characterized by the presence of low dunes, which serve to delineate the backshore from the adjacent, predominantly flat arable land.
To the west of the mouth of R. Pamissos and to the east of the mouth of Velika ephemeral stream, the beach is about 25 m wide, fed by the Mpouka and Mourtia ephemeral streams, consisting of a mixture of materials, mostly sand, and hosting low dunes on the backshore. It is noteworthy that at the easternmost end of sector S4 (profile K–M), there is a marshy area that is presumably sustained by water from the Pamissos River during periods of increased flow.
The westernmost part of the beach (west of the Velika stream) is the narrowest (less than 15 m wide) and is composed of a mixture of grain sizes (predominantly sand). The beach’s narrow width is most likely a consequence of the limited availability of land-derived sediment in association with the eastward longshore sediment transport. Notably, sand is transported along the coast from east to west. The terrain beyond the backshore is marshy and subject to intermittent inundation from local streams, such as the Tyflo and the Kormos.
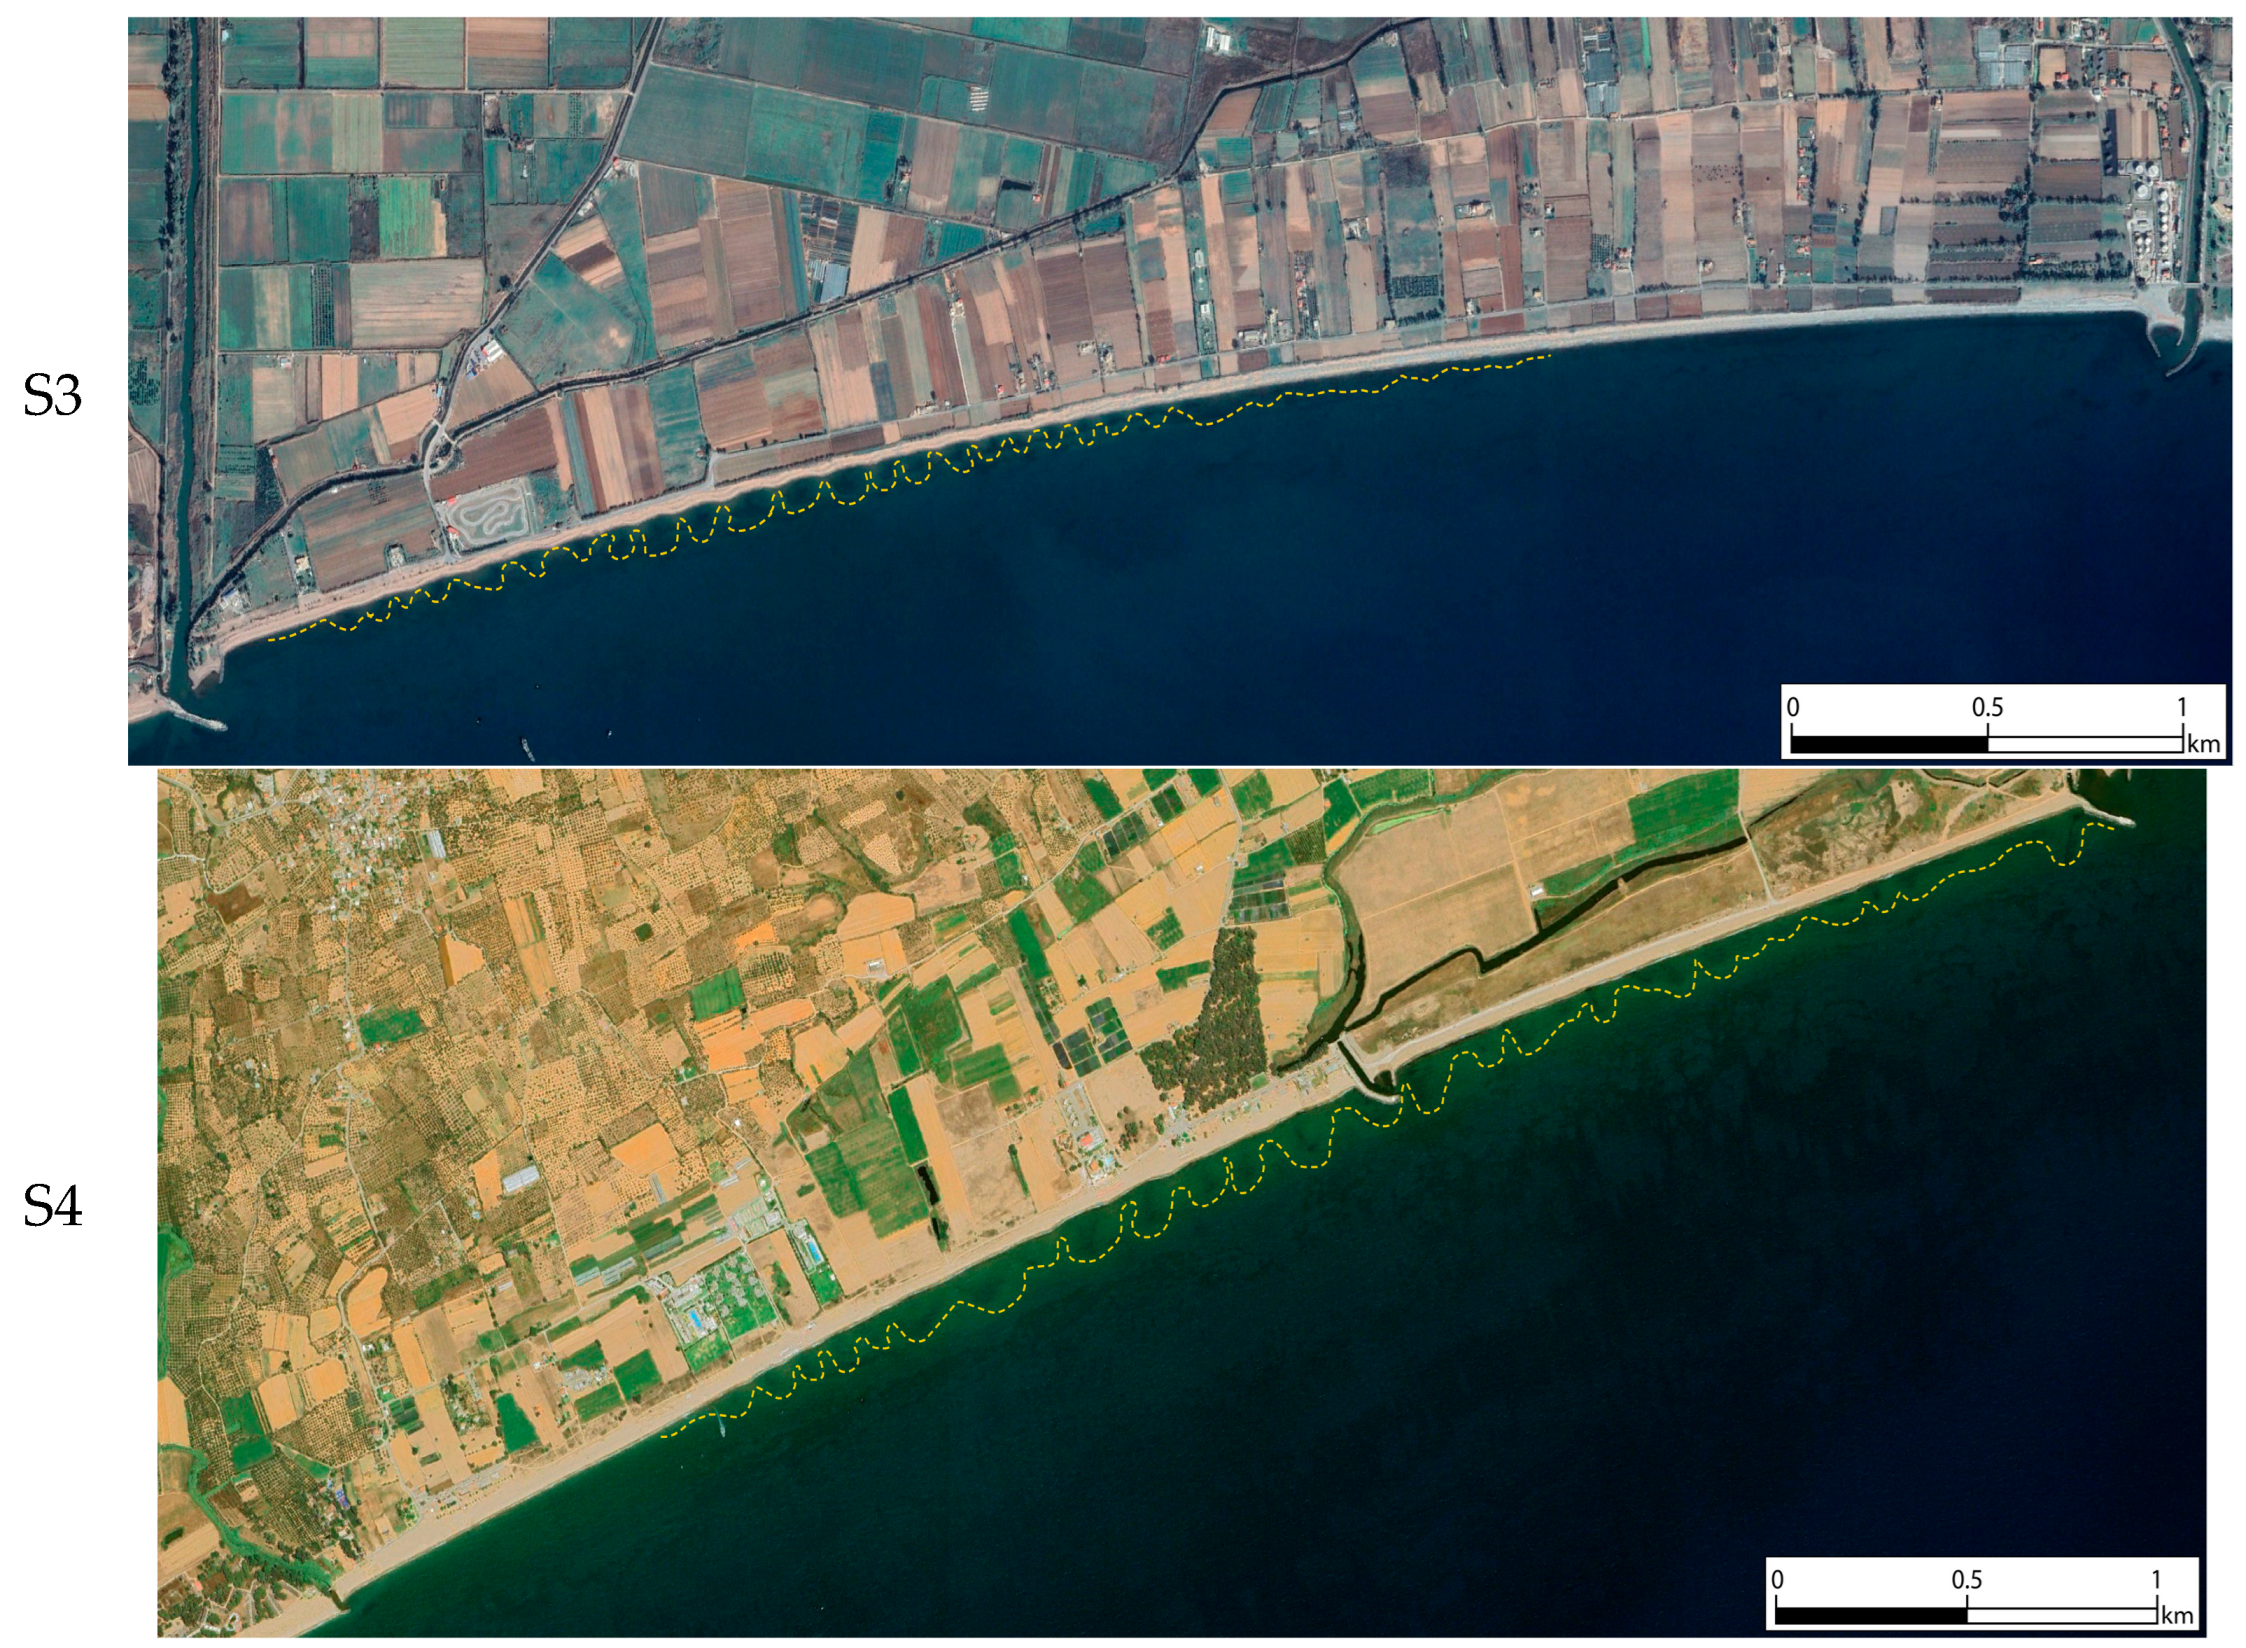
The nearshore zone in sectors S3 and S4 is characterized by the presence of crescentic welded bars, which have been observed at water depths shallower than the breaking depth of extreme waves (5.4–6 m), as illustrated in Figure 10. The formation of these structures is the result of complex interactions between nearshore hydrodynamics (i.e., waves and currents), sediment transport (along and cross-shore), and morphodynamic feedback [50,51].
Figure 11 shows a generalized distribution of surface grain sizes across the subaerial and subaqueous parts of the beach. There is a marked contrast between these two distinct areas. The subaerial beach consists of a mixture of gravel and sand, whereas the subaqueous beach consists predominantly of medium-fine sand, which gradually transitions to mud seawards. Thus, sand predominates at depths of 5–6 m or less, while the mud content gradually increases at greater depths, up to approximately 15 m. At depths greater than 20 m, mud becomes the predominant constituent, with the sand fraction present in minimal percentages. This boundary is also confirmed by the availability of side scan soundings to one of the authors (V.K.). The zonal distribution of the surficial seabed sediments (see Figure 9) is closely associated with the prevailing hydrodynamic conditions. The presence of a sandy bottom coincides with the shallow wave propagation and in depths smaller than the inner closure depth (about 7 m). Furthermore, the boundary between muddy-sand and sand coincides with the limit of wave propagation from intermediate to shallow water conditions (i.e., d < L/2 ≈ 20 m) in the case of significant wave heights (H1/3).
Regarding grain size sorting (see Table A3 in Appendix C), subaerial beach sediments demonstrate moderate to moderately good sorting, whereas beach face sediments show moderate to poor sorting, which is indicative of greater variability in hydrodynamic conditions. In contrast, subaqueous sediments beyond the closure depth exhibit poor to very poor sorting, suggesting the least hydrodynamic influence.

5.2. Beach Retreat Due to Storm Surge

The maximum registered sea level along the coast is 0.73 m, while the most common value appears to be 0.35 m [43]. A gross estimate of shoreline retreat at representative profiles from the five beach sectors (S1–S5) varies from 1.3 m to 4.6 m in the case of a storm surge of 0.7 m, and approximately half of this (0.6–2.1 m) for a storm surge of 0.35 m.
It can be hypothesized that the observed retreat rates are likely to be overestimated and should, in fact, be considerably lower. This is due to the limitations of the Kriebel and Dean formula [40], which is only applicable to beaches consisting exclusively of medium-sized sand grains and does not consider other sediment influxes, such as riverine or longshore sediment transport. Consequently, it is recommended that these values be regarded as indicative.
As demonstrated in the study by Koumpou et al. [52], a storm of this nature occurred on 17 November 2017, with a maximum height of 3.4 m and a period of 10 s. During this event, the western part of the sector underwent a retreat of 7.6 m, while the western portion of the central sector procreated by 6.9 m. Concurrently, the eastern sector advanced by an average of 3.4 m. Conversely, the beach to the east of the Port of Kalamata retreated by 7.8 m. These observations demonstrate that the beach zone does not respond uniformly to storm events, instead exhibiting a combination of accretion and erosion. The role of long-shore transport in this dynamic environment appears to be significantly influenced by the presence of artificial structures such as groins and breakwaters. Furthermore, the influx of riverine sediment prior to and during such events may also affect shoreline displacement, at least in certain areas. Moreover, it is widely accepted that storm beach erosion does not necessarily have a permanent effect, as most of the sediment is returned to the beach during mild wave conditions [53,54].

5.3. Shoreline Evolution

As previously mentioned, the present investigation concerns two distinct periods: the past, which commenced in the mid-1990s, and the future, with a projected date of 2100.

5.3.1. Past Period (1960–2017)

To enhance understanding of changes in shoreline position, Table 7 presents the mean annual rates of positive (progradation) and negative (retreat) displacement for the five beach sectors and selected river mouths.
The historical evolution of the shoreline can be characterized by rates of positive or negative displacement, as outlined in Table 7. This evolution can be subdivided into three distinct periods: The initial period (1960–1988) is characterized by an overall progradation. This period (1960–1988) is indicative of ongoing natural processes that appear to have accommodated port construction (early 19th century) and works related to the river’s course and mouths, most of which took place before 1960. The subsequent period (1989–1997) is characterized also by accelerated rates of retreat, except in the central part, where progradation continues to occur. This is most likely due to increased riverine fluxes and longshore sediment transport generally directed eastwards, although transport in the opposite direction may also occur on some occasions (this was not identified in this study). Unfortunately, there is a lack of data concerning riverine sediment fluxes. The most recent period (1998–2017) represents a rather stable phase (considering the accuracy of the method; ±1 m) or a slightly retreating phase, the latter of which might be explained by the ongoing sea level rise (>3 mm/y), caused by climate change (IPCC-2021) [42].

5.3.2. Future Retreat Due to Climate Change

In accordance with Bruun’s rule [41] (see Equation (A13) in Appendix A), the projected shoreline retreat under the most conservative scenarios is estimated to be less than 12 m for the easternmost part of the study area (S1; profile B). Given an average beach width of 22.5 m, this suggests that a reduction of more than 51.8% in beach width can be expected. The remaining sections (S2–S5) demonstrate a retreat of 40–48 m, indicating a high susceptibility to complete beach erosion, as their current widths do not exceed 30–35 m.
However, it should be noted that this retreat is likely overestimated, as the equation used assumes a fixed sediment budget. In other words, the model does not account for sediment inputs from river inflows or alongshore sediment transport, even though these contributions may be significant and should not be disregarded. To illustrate this, consider an average beach profile (height of 2.5 m and width of 25 m) that is predicted to retreat by 20 m by 2100 (time span 75 m). This would result in the removal of approximately 265 × 103 tons of sediment from the subaerial beach along the 16 km of shoreline (S3–S5). When expressed on an annual basis, this equates to approximately 14.13 × 10³ tons/year, representing only 29.3% of the estimated natural fluvial sediment input from the R. Pamisos alone (48,280 tons/year). Furthermore, the potential magnitude of the longshore sediment transport should not be overlooked, as it is estimated to be in the order of 40–50 103 tones/year along the S3, S4 and S5 beach sectors (see Table 4). Therefore, in the absence of a modification to the river sediment supply, the estimated retreat, as determined by Brunn’s rule, is likely to be substantially overestimated, by a margin that significantly exceeds 30%.

6. Synopsis and Conclusions

The primary factors that have played a significant role in the formation and evolution of the beach zone along the north coast of the semi-enclosed Messiniakos Gulf, which is essentially tideless, since the mid-1900s can be categorized into the following five groups: (i) geological background; (ii) morphological setting; (iii) sedimentological characteristics; (iv) oceanographic conditions; and (v) anthropogenic (including sea level rise due to climate change) interventions.
The geological background includes the tectonic setting, which encompasses seismicity, lithology of the broader coastal zone, as well as relative sea level rise that has occurred at a rate of less than 1 mm/y over the past 6000 years. Nevertheless, the most recent seismic events have exhibited an insignificant impact on vertical displacement along the coastline.
The morphological setting refers to both the broader coastal zone and the beach zone. The hinterland is characterized by a mountainous topography, with a significant portion of its catchment—spanning over 1300 km2—draining along the northern coastline. The inner continental shelf, characterized by its wider expanse and comparatively reduced gradient in the western region relative to the eastern sector. The subaerial segment of the beach exhibits a width that does not exceed 25 m, with a maximum elevation of less than 3 m. The backshore is connected to a low dune field in the central area. Furthermore, the subaqueous part is characterized by a relatively flat topography, exhibiting dissipative characteristics with respect to incoming waves, resulting in crescent-shaped bars forming along the shoreline.
The category of sedimentology refers to the modern (upper Holocene) sediments that form the subaerial and subaqueous part of the beach zone and the continental shelf. The nature of beach sediment is such that most of it is of terrestrial origin. In terms of their grain size, beach (subaerial) sediment consists of a mixture of sand and gravel (mostly grains and pebbles), while fine sands cover the nearshore zone and muds exist in deeper waters (>20 m).
The near-shore oceanographic conditions are governed by incoming waves from southerly directions with H1/3 = 0.6 m and T1/3 = 5.3 s, and H1/100 = 4.2 m and T1/100 = 8.34 s. In addition, the maximum storm surge, caused by the piling up of water masses transferred by southerly winds and wave breaking, reaches 0.7 m at the Kalamata Port gauge station. Wave-induced morphodynamic conditions determine a closure depth of approximately 7 m, breaking depths of 0.8 m and 4.3 m for H1/3 and H1/100 respectively, and a maximum wave runup of between 1.2 m and 2.4 m. Longshore sediment transport is directed eastward at its central and western sectors and to opposite direction at its eastern sector (to the east of the port).
Anthropogenic involvement includes the construction of dams to regulate water flows, interventions in the dune field and in the nearby hinterland (e.g., changes in land use), and the various coastal works with most pronounced the construction of the Kalamata port (in the beginning of the 19th century). There is also ongoing sea level rise (at a rate of >3 mm/y) due to climate change caused by the man.
The historical evolution of the shoreline is characterized by an accretional phase from 1960 to1988, followed by a period of retreat (1989–1997) except its central part where progradation still occurred. The most recent period (1998–2017) has been relatively stable with a slight retreating trend continuing since then. This change could be interpreted as a signal of the ongoing sea level rise, due to climate change.
According to the IPCC’s 2021 SRES climate scenarios (4.5, 7.0, and 8.5), the shoreline could retreat so much by the year 2100 that its very existence would be threatened. However, it should be noted that this estimate assumes a fixed sediment balance, which is not the case here due to the inflowing river sediments and longshore sediment transport.
Based on the aforementioned factors, it appears that the geological background, the terrestrial (riverine) influx of sediment, and the nearshore, wave-induced hydrodynamics play the primary role in the formation and evolution of such a beach zone. Of course, anthropogenic interventions could drastically alter the coastal sediment budget and nearshore sediment transport. Furthermore, shoreline retreat due to sea level rise is expected to be substantially smaller than predicted by models due to terrestrial sediment influxes, which may counteract the wave-induced erosion to some extent.

Author Contributions

Conceptualization, S.E.P.; methodology, S.E.P., S.-V.K., S.P., A.K. and V.K.; formal analysis, S.-V.K. and S.P.; investigation, S.E.P., S.-V.K., S.P., A.K. and V.K.; resources, S.E.P. and V.K.; data curation, S.-V.K., S.E.P., S.P. and A.K.; writing—review and editing, S.E.P., S.P. and A.K. All authors have read and agreed to the published version of the manuscript.

Funding

This research received no external funding.

Data Availability Statement

The original contributions presented in this study are included in the article. Further inquiries can be directed to the corresponding author.

Conflicts of Interest

The authors declare no conflict of interest.

Appendix A

Table A1. The equations used for the calculation of near-shore hydrodynamic and morphodynamic parameters.
C = 1.56   T o (m/s)(A1)
L = g T 0 2 π (m)(A2)
d > 0.5 Lo (deep waters)(a)(A3)
0.5 Lo > d > 0.05 Lo (intermediate waters)(b)
d < 0.05 Lo (shallow waters)(c)
Rmax = 1.3·[(0.92·m·Hs0.7·Lo0.3) + (0.5·(1.28 + 3·m·Hs)] (m)(A4)
hc = (2.28·He) − 68.5·(He2/(9.81·Te)2) (m)(A5)
Hb = (−0.57 m2 + 0.31·m + 0.58)·Lo (Ho/Lo)0.83 (m)(A6)
γb = 1.1·ξb0.167(m)(A7)
ξ = m/(H/Lo)0.5 & ξb = m/(Hb/Lo)0.5(A8)
Ω = Hb/Tp·ws(A9)
D ≤ 0.1 mm w s = s 1   g   D 2 18   v (m/s)(a)(A10)
0.1 < D < 1 mm w s =   10   v D 1 + 0.01   s 1 g   D 3 v 2 0.5 1 (m/s)(b)
D ≥ 1 mm w s = 1.1   [ s 1 g   D ] 0.5 (m/s)(c)
where (D) is the grain diameter (diameter of the sieve holes), (s) the specific gravity (ρs/ρw: sediment density/seawater density) (s≌2.65) and (v) the kinematic viscosity (≌10−6 m2/s)
Qt,i = 2.27 · H s , b 2 · T p 1.5 · m 0.75 · D 50 0.25 · s i n 0.6 ( 2 · α b ) (kg/s)(A11)
Cb/Co = αb/ao (m/s)
when Cb = (g* db)0.5
(A12)
R E = a   W b   d b m o B + d b α 2 (m)
when, w b =   d b A 3 2 and A’ = 2.25 (ws2/g)1/3
(A13)
where db is the breaking depth of the 0.137% highest incoming H(1/3) waves, Wb is the horizontal distance of the point of the breaking depth from the shoreline, mo is the beach face slope and ws the settling velocity of the beachface material (D50)
R E = W h   α d C + Β (m)(A14)
where (a) is the sea level rise, (dC) is the maximum depth of bottom sediment mobilization for the 0.137% of the H(1/3) waves approaching annually, (Wh) is the horizontal distance of (dC) from the shoreline, and (B) is the height of the berm (in practice the upper beach limit).

Appendix B

Figure A1. Photographs, morphometry and grain size along the subaerial part of the 14 shore normal profiles (not including those presented in Figure 4) (for location see Figure 3).
Jmse 13 01810 g0a1aJmse 13 01810 g0a1bJmse 13 01810 g0a1c
Figure A2. Morphometry and grain size of the subaqueous part of 19 shore normal profiles (not including those presented in Figure 5), (for location see Figure 3).
Jmse 13 01810 g0a2aJmse 13 01810 g0a2b
Table A2. The primary morphological characteristics of the 19 shore-normal profiles include the type of the backshore area, the elevation of the landward upper beach limit (B), beach width (W), the dominant grain size type of the subaerial part (GS-B), the slope (mo, %) and grain size (GS-bf) grain-size characterization of the beach face, the slopes (Sl, %) of the nearshore zone (5–15 m) and offshore (>25 m), and the depth and distance of the identified bars.
Landward ZoneSubaerial BeachBeach FaceSubaqueous Beach
B (m)W (m)GS-Bmo (%)GS-bfBars
(Depth/Distance)
Near-Shore Sl (%)Off-Shore SL (%)
AHotel2.223.6Gravels16G2.5/20, 3/35; 3.5/472.23.3
BPedestrian road1.617.8Gravels15gS2.7/27; 3/40; 5/920/?2.42.8
CPedestrian road2.326.0Mixed13sG---2.62.8
DRiver mouth0.87.4Mixed (gravely)21sG2/10; 4.5/190; 7/3301.52.5
ELow dunes1.918.6Mixed (gravely)19gS2/25; 3,5/75; 4.5/2201.72.5
FLow dunes1.820.2Mixed (gravely)11gS2/15; 4.5/2601.52.8
GLow dunes2.625.3Mixed (gravely)17sG2.7/35; 4.5/18; 0 7/6001.73.3
HAgricultural land2.732.6Mixed15sG1.4/15; 1.8/30; 2.7/45;
4/150; 5/330
1.253.3
IAgricultural land2.724.9Mixed (sandy)20gS1.5/25–40; 5/3151.32.5
JLow dunes2.019.7Mixed (sandy)20gS1.5/15; 2.4/75; 5/3200.82.5
KLow dunes1.720.3Mixed (gravely)13sG2.5/50; 2.7/72; 5/3000.72.25
LAlluvial plain2.824.0Mixed (sandy)12S0.6/4; 3/300.653.0
MAlluvial plain2.434.5Mixed (sandy)19(g)S1.6/15; 2.2/60; 3.3/1300.62.7
NAlluvial plain2.423.8Mixed (sandy)15sG1.5/15; 2.2/80; 2.9/1001.02.5
OLow dunes2.027.5Mixed (sandy)11gS1.5/22; 1.9/40; 3/65; 5/1300.52.5
PLow dunes2.53.7Mixed (sandy)8sG2.5/20; 2.9/30; 5/2100.351.25
QAlluvial plain1.216.2Mixed (sandy)14gS1.8/10; 2.8/30–35; 2.7/65–750.50.7
RAlluvial plain1.815.2Mixed (sandy)16gS1.6/15; 2.2/25; 3/500.61.25
SAlluvial plain1.412.5Mixed (sandy)11gS0.5/6; 1.5/30–35; 2.6/900.41.25

Appendix C

Table A3. The Mean grain size (Μz, in mm), the characterization with respect to their Sand-Mud-Gravel content, the median (Md = d50, in mm), the values of the inclusive standard deviation (σΙ: sorting) and their characterization in terms of sorting for l the surficial sediment samples along the 19 (A–S) shore-normal profiles.
Elevation (±m)Distance
(m)
Grain SizeσΙ
TextureMz (Φ)D50 (mm)Type(φ)Sorting
A11.5−13.2G−5.1828.895P0.55m.s
A20.8−4.5G−3.3513.420P0.84m.s
A30.00.0G−2.687.053P0.93m.s
A4−2.115.0S2.990.128f.S0.63m.s
A5−3.960.0S3.500.088v.f.S0.48w.s
Β11.2−14.0(g)S0.550.693G1.05m.s
Β20.6−4.1G−1.903.713G0.73m.s
Β30.00.0gS−0.421.393v.c.S1.19p.s
Β4−2.215.0sG0.590.271c.S2.66v.p.s
Β5−4.158.0(g)S2.720.160f.S0.70m.w.s
Β6−5.185.0S3.200.095v.f.S0.68m.s
C11.0−12.5(g)S0.810.592c.S1.20p.s
C20.6−6.7sG−1.191.906G.1.12p.s
C30.2−1.8G−1.873.992G0.83m.s
C40.00.0sG−1.142.216G0.81m.s
C5−2.215.0sG0.690.227c.S2.76v.p.s
C6−4.7160.0S3.400.093v.f.S0.60m.s
C7−11.0425.0mS5.210.071mS2.60v.p.s
D10.00.0sG−0.841.715v.c.S0.78m.s
D2−2.010.0G−2.395.730P1.34p.s
D3−4.3115.0S3.340.093v.f.S0.80m.s
E10.9−11.6(g)S0.960.520c.S1.02p.s
E20.7−9.6sG−1.314.953G1.79p.s
E30.45−3.8G−2.104.651P0.68m.w.s
E40.00.0gS0.530.980c.S1.45p.s
E5−2.115.0(g)S2.440.179f.S0.76m.s
E6−4.280.0S3.45−0.445v.f.S0.57m.s
E715.4890.0S3.330.095v.f.S1.48p.s
F11.1−12.8sG−0.010.647v.c.S2.01p.s
F20.7−7.0G−2.435.402P0.82m.s
F30.3−2.0G−2.175.036P0.76m.s
F40.00.0gS0.590.776c.S1.43p.s
F5−2.215.0S2.930.134f.S0.64m.s
F6−4.3175.0S3.290.096v.f.S0.70m.s
G11.2−14.5sG−0.270.941v.c.S2.02v.p.s
G21.0−13.3sG−1.520.392G2.14v.p.s
G30.5−4.2G−2.084.503P0.64m.s
G40.00.0gS0.221.109c.S1.82p.s
G5−1.915.0gS0.900.176c.S2.76v.p.s
G64.9270.0S3.380.093v.f.S0.65m.s
G7−26.41450.0sM6.800.022f.Z2.84v.p.s
H11.4−18.1sG−0.742.463v.c.S1.75p.s
H20.9−6.9(g)S1.830.295G0.74m.s
H30.00.0sG−0.141.692v.c.S1.80p.s
H4−2.232.0(g)S2.110.221f.S0.73m.s
H5−4.4175.0S3.270.097v.f.S0.71m.s
I12.1−19.7gS0.670.607c.S0.97m.s
I21.2−8.5gS−0.771.569v.c.S0.76m.s
I30.4−1.8G−1.913.590v.c.S0.61m.s
I40.00.0gS−0.281.281v.c.S0.71m.s
I5−1.44.8sG−1.282.487G1.17p.s
I6−2.220.0S1.900.266m.S0.75m.s
I7−4.860.0S3.240.098v.f.S0.74m.s
I8−19.6270.0sM6.750.023m.Z2.90v.p.s
J11.2−11.1(g)S0.760.627c.S0.75m.s
J20.9−8.1(g)S1.540.345G0.53m.s
J30.4−1.8sG−0.853.562v.c.S2.00p.s
J40.00.0gS0.310.808c.S1.73p.s
J5−5.1220.0mS3.290.097v.f.S1.75p.s
K11.2−13.2sG0.070.941c.S1.85p.s
K20.6−8.6gS1.070.246m.S1.84p.s
K30.3−2.6sG−0.612.762v.c.S1.88p.s
K40.00.0sG−0.262.102v.c.S2.09v.p.s
K5−1.912.0sG0.550.362c.S2.24v.p.s
K6−4.4325.0mS5.820.079m.Z3.40v.p.s
K7−19.41850.0mS6.910.017m.Z2.84v.p.s
L11.4−14.5gS0.071.143c.S1.32p.s
L21.1−12.2sG0.011.519c.S1.66p.s
L30.4−4.6gS1.440.229m.S1.47p.s
L40.00.0S1.910.253m.S0.71m.s
L5−2.240.0(g)S2.310.190f.S0.71m.s
L6−4.91875.0mS5.990.069m.Z3.37v.p.s
M12.434.0gS0.001.081v.c.S0.87m.s
M21.8−8.3(g)S1.060.411m.S1.03p.s
M30.6−4.2(g)S1.440.365m.S0.71m.s
M40.00.0(g)S0.890.509c.S0.87m.s
M5−2.130.0(g)S2.110.217f.S0.71m.s
M6−4.2200.0S2.950.130f.S0.71m.s
M7−8.1780.0mS3.590.088v. f.S1.62p.s
M8−18.72100.0sM6.530.028m.Z3.14p.s
N12.5−20.2(g)S1.000.469c.S0.85m.s
N21.8−12.7gS1.030.394m.S1.37p.s
N31.5−8.8(g)S1.760.310m.S0.76m.s
N40.00.0sG−0.201.187v.c.S2.24v.p.s
N5−2.125.0S2.150.212f.S0.71m.s
N6−4.7190.0S6.040.080m.Z3.38v.p.s
O11.6−14.0(g)S1.160.429m.S1.02p.s
O21.2−8.5(g)S1.780.307m.S0.71m.s
O30.00.0gS0.880.441c.S1.40p.s
O42.145.0(g)S2.090.219f.S0.69m.w.s
O5−4.6310.0S3.080.111v.f.S0.72p.s
O6−20.52600.0mS5.290.066m.Z2.60v.p.s
P11.6−24.2gS0.970.484c.S1.14p.s
P21.6−18.1(g)S1.060.461m.S0.71p.s
P31.2−12.9G−2.455.451P0.72m.s
P40.4−4.5sG−1.021.702G1.06p.s
P50.00.0sG−0.571.535v.c.S0.93m.s
P6−1.810.0sG−0.400.846v.c.S2.08v.p.s
P7−5.1170.0mS3.540.086v.f.S0.71m.s
Q11.2−12.5(g)S0.450.720c.S0.76m.s
Q20.9−7.4G−1.622.989G0.79m.s
Q30.4−3.9G−2.165.214P1.41p.s
Q40.00.0gS−0.231.234v.c.S0.74m.s
Q5−1.810.0sG−1.943.887G1.72p.s
Q65.15210.0mS5.640.020m.Z3.48v.p.s
Q7−13.12060.0sM6.010.015m.Z3.15v.p.s
R11.1−8.1S1.370.410m.S0.96m.s
R20.7−5.5G−2.294.711m.S1.10p.s
R30.3−2.5G−2.475.524P0.50w.s
R40.00.0gS0.640.727m.S1.63m.s
R5−4.8380.0S3.340.099c.S0.71m.s
S10.5−4.5(g)S1.120.453P0.86m.s
S20.2−2.2G−2.817.215c.S0.83p.s
S30.00.0gS0.130.696f.S1.60m.s
S4−2.580.0S2.500.175f.S0.87m.s
S5−4.7390.0sM3.330.095v.f.S0.64v.w.s
S6−11.51670.0M7.710.005f.Z3.03v.p.s
Key 1. G: gravel; S: sand; M: mud; (g)S: slightly gravelly sand; gS: gravelly Sand; sG: sandy gravels; sM: sany mud; mS: muddy sand; m.: moderately; v.w.s: very well sorted; w.s: well sorted; m.w.s: moderately well sorted; m.s: moderately sorted; p.s: poorly sorted; v.p.s: very poorly sorted; P: pebbles; v.c.S: very coarse sand; c.S: coarse sand; m.S: medium sand; f.S: fine sand; v.f.S: very fine sand; m.Z: medium silt; f.Z: fine silt. Key 2. 1–2 φ: poorly sorted; 0.35–0.50 φ: well sorted; 2–4 φ: very poorly sorted; 0.50–0.70 φ: moderately well sorted; 0.7–1.0 φ: moderately sorted.

Appendix D

Table A4. The net spatial displacement (NSD, meters) and the corresponding annual rates (Rat., m/y) and of shoreline position for the different beach sectors and time spans.
Time Period West Segment (S5);
DSAS Sections: (A1–A59)
Central (Western) (S4, S3, S2B);
DSAS Sections: A60–A285
Central (Eastern) (S2A);
DSAS Sections: A286–A328
East (Western) Segment (S1B)
DSAS Sections: B1–B26
East (Eastern) Segment (S1A)
DSAS Sections: B26–B54
Mpouka—West.
DSAS Section: A139–A141
Mpouka—East.
DSAS Section: A142–145
Pamissos—West.
DSAS Section: A182–A185
Pamissos—East.
DSAS Section: A186–A190
Aris—West.
DSAS Section: A284–A286
Aris—East.
DSAS Section: A287–A290
1960–1988NSD+15.0+12.0+38.0+4.5−4.0+28.3+21.2−15.5−1.6−23.1+24.9
Rat.+0.53+0.45+1.31+0.16−0.14+1.00+0.73−0.53−0.06−0.80+0.86
1989–1997NSD−14.0+6.00+0.50−9.00−9.50+8.00+1.60+14.19.3−5.60+4.20
Rat.−1.56+0.89+0.06−1.00−1.060.89+0.18+1.57+1.03−0.62+0.47
1998–2003NSD−1.0−1.00−2.00+1.50+0.20−3.60+5.10−5.50.3−6.90−3.80
Rat.−0.17−0.17−0.33+0.25+0.03−0.60+0.85−0.92+0.05−1.15−0.63
2004–2007NSD−4.00−1.50+4.502.50+0.30+0.40−2.0−5.70+2.3−1.60−1.50
Rat.−1.00−0.38+1.13+0.63+0.08+0.10−0.50−1.43+0.58−0.40−0.38
2008–2013NSD−6.50+1.2−2.004.50+1.00−1.80+1.6+0.9−1.7−2.30−2.60
Rat.−1.08+0.20−0.330.75+0.17−0.300.27+0.15−0.28−0.38−0.43
2014–2017NSD+2.00−1.30−1.00−2.10+2.20+6.00−8.50+7.40+1.00+5.40−1.90
Rat.+0.50−0.33−0.25−0.530.55+1.50−2.13+1.85+0.25+1.35−0.48
1960–2017NSD−8.517.3+38.0−1.90+2.20+37.3+19.0−4.30+9.6−34.1+19.3
Rat.−0.15+0.30+0.67−0.03+0.55+0.65+0.33−0.07+0.17−0.60+0.34

References

  1. López, M.; López, I.; Aragonés, L.; Serra, J.C.; Esteban, V. The Erosion on the East Coast of Spain: Wear of Particles, Mineral Composition, Carbonates and Posidonia oceanica. Sci. Total Environ. 2016, 572, 487–497. [Google Scholar] [CrossRef]
  2. Zuo, L.; Roelvink, D.; Lu, Y.; Li, S. On Incipient Motion of Silt-Sand under Combined Action of Waves and Currents. Appl. Ocean Res. 2017, 69, 116–125. [Google Scholar] [CrossRef]
  3. Boretto, G.M.; Rouzaut, S.; Cioccale, M.; Gordillo, S.; Benitez, Y. Dinámica Costera y Antropización En Playas Uruguayas. Un Análisis Integrado Para Su Conservación. Rev. Mex. Cienc. Geol. 2018, 35, 291–306. [Google Scholar] [CrossRef]
  4. Vousdoukas, M.I.; Ranasinghe, R.; Mentaschi, L.; Plomaritis, T.A.; Athanasiou, P.; Luijendijk, A.; Feyen, L. Sandy Coastlines under Threat of Erosion. Nat. Clim. Chang. 2020, 10, 260–263. [Google Scholar] [CrossRef]
  5. Phillips, J.D. Environmental Gradients and Complexity in Coastal Landscape Response to Sea Level Rise. Catena 2018, 169, 107–118. [Google Scholar] [CrossRef]
  6. Di Paola, G.; Aucelli, P.P.C.; Benassai, G.; Rodríguez, G. Coastal vulnerability to wave storms of Sele littoral plain (southern Italy). Nat. Hazards 2014, 71, 1795–1819. [Google Scholar] [CrossRef]
  7. Bush, D.M.; Young, R. Coastal features and processes. In Geological Monitoring; Young, R., Norby, L., Eds.; Geological Society of America: Boulder, CO, USA, 2009; pp. 47–67. [Google Scholar]
  8. Mestanza-Ramón, C.; Pranzini, E.; Anfuso, G.; Botero, C.M.; Chica-Ruiz, J.A.; Mooser, A. An attempt to characterize the “3S” (Sea, Sun, and Sand) parameters: Application to the Galapagos Islands and continental Ecuadorian beaches. Sustainability 2020, 12, 3468. [Google Scholar] [CrossRef]
  9. Phillips, M.R.; Jones, A.L. Erosion and tourism infrastructure in the coastal zone: Problems, consequences and management. Tour. Manag. 2006, 27, 517–524. [Google Scholar] [CrossRef]
  10. Luijendijk, A.; de Vries, S. Global beach database. In Sandy Beach Morphodynamics; Elsevier: Amsterdam, The Netherlands, 2020; pp. 641–658. [Google Scholar]
  11. Bozzeda, F.; Ortega, L.; Costa, L.L.; Fanini, L.; Barboza, C.A.; McLachlan, A.; Defeo, O. Global patterns in sandy beach erosion: Unraveling the roles of anthropogenic, climatic and morphodynamic factors. Front. Mar. Sci. 2023, 10, 1270490. [Google Scholar] [CrossRef]
  12. Monioudi, I.N.; Karditsa, A.; Chatzipavlis, A.; Alexandrakis, G.; Andreadis, O.P.; Velegrakis, A.F.; Marinos, E. Assessment of vulnerability of the eastern Cretan beaches (Greece) to sea level rise. Reg. Environ. Chang. 2016, 16, 1951–1962. [Google Scholar] [CrossRef]
  13. Poulos, S.; Karditsa, K. Socio-Economic Assessment of the Impact of the Anticipated Sea Level Rise on Peloponnese Coast (Eastern Mediterranean). SSRN 2023. [Google Scholar] [CrossRef]
  14. Karditsa, A.; Niavis, S.; Paramana, T.; Monioudi, I.; Poulos, S.; Hatzaki, M. Is the insular coastal tourism of western Greece at risk due to climate induced sea level rise? Ocean Coast. Manag. 2024, 251, 107088. [Google Scholar] [CrossRef]
  15. Velegrakis, A.F.; Monioudi, I.; Tzoraki, O.; Vousdoukas, M.I.; Tragou, E.; Hasiotis, T.; Andreadis, O. Coastal Hazards and Related Impacts in Greece. In The Geography of Greece: Managing Crises and Building Resilience; Springer International Publishing: Cham, Switzerland, 2024; pp. 353–370. [Google Scholar]
  16. Cheston, E.M. An Overview and Analysis of the Consistency Requirement Under the Coastal Zone Management Act. Univ. Balt. J. Environ. Law 2002, 10, 135. [Google Scholar]
  17. Garten, L. The coastal zone management act: A mixed success. Consilience 2016, 16, 1–13. [Google Scholar]
  18. Haslett, S. Coastal Systems; Routledge: Oxfordshire, UK, 2008. [Google Scholar]
  19. Fountoulis, I.; Mariolakos, I.; Ladas, I. Quaternary basin sedimentation and geodynamics in SW Peloponnese (Greece) and late-stage uplift of Taygetos Mt. Boll. Geofis. Teor. Appl. 2014, 55, 303–324. [Google Scholar]
  20. Mariolakos, I.; Fountoulis, I.; Kranis, H. Paleoseismic events recorded in Pleistocene sediments in the area of Kalamata (Peloponnesos, Greece). J. Geodyn. 1996, 24, 241–247. [Google Scholar] [CrossRef]
  21. Mariolakos, I.; Fountoulis, I.; Logos, E.; Lozios, S. Surface faulting caused by the Kalamata, Greece earthquake of 13 September 1986. Tectonophysics 1989, 163, 197–203. [Google Scholar] [CrossRef]
  22. Mariolakos, H.; Fountoulis, I. Neotectonic macro-folds in the area of Filiatron (Western Messinia, Peloponnese). Bull. Hellenic Geol. Soc. 1991, XXV, 19–38. (In Greek) [Google Scholar]
  23. Pavlakis, P.; Papanikolaou, D.; Chronis, G.; Lykoussis, B.; Anagnostou, E. Geological structure of inner Messiniakos Gulf. Bull. Geol. Soc. Greece 1989, 23, 333–347. [Google Scholar]
  24. Soukissian, T.; Hatzinaki, M.; Korres, G.; Papadopoulos, A.; Kallos, G.; Anadranistakis, E. Wind and Wave Atlas of the Hellenic Seas; Hellenic Centre for Marine Research Publications: Athens, Greece, 2007. [Google Scholar]
  25. Tsimplis, M.N. Tidal oscillations in the Aegean and Ionian Seas. Estuar. Coast. Shelf Sci. 1994, 39, 201–208. [Google Scholar] [CrossRef]
  26. Sannino, G.; Carillo, A.; Pisacane, G.; Naranjo, C. On the relevance of tidal forcing in modelling the Mediterranean thermohaline circulation. Prog. Oceanogr. 2015, 134, 304–329. [Google Scholar] [CrossRef]
  27. Ravdas, M.; Zacharioudaki, A.; Korres, G. Implementation and validation of a new operational wave forecasting system of the Mediterranean Monitoring and Forecasting Centre in the framework of the Copernicus Marine Environment Monitoring Service. Nat. Hazards Earth Syst. Sci. 2018, 18, 2675–2695. [Google Scholar] [CrossRef]
  28. Folk, R.L. Petrology of Sedimentary Rocks; Hemphill Publishing Company: Austin, TX, USA, 1974. [Google Scholar]
  29. Himmelstoss, E.A.; Henderson, R.E.; Kratzmann, M.G.; Farris, A.S. Digital Shoreline Analysis System (DSAS) Version 5.1 User Guide; Open-File Rep. 2021–1091; U.S. Geological Survey: Reston, VA, USA, 2021.
  30. Poulos, S.E.; Lesioti, S.; Karditsa, A. Insights to estimate the largest 1/3, 1/10, 1/100 of offshore wave heights and periods under fetch-limited conditions in the central Aegean Sea. Water 2025, 17, 1499. [Google Scholar] [CrossRef]
  31. Bretschneider, C.L. The Ash Wednesday East Coast Storm, March 5–8, 1962: A hindcast of events, causes, and effects. In Coastal Engineering 1964; ASCE: Reston, VA, USA, 1964; pp. 617–659. [Google Scholar]
  32. Goda, Y. Random Seas and Design of Maritime Structures, 2nd ed.; World Scientific Publishing: Singapore, 2000. [Google Scholar]
  33. Conlin, M.P.; Wilson, G.; Bond, H.; Ardağ, D.; Arnowil, C. Predicting wave runup on composite beaches. Coast. Eng. 2025, 199, 104743. [Google Scholar] [CrossRef]
  34. Hallemeier, R.J. A profile zonation for seasonal sand beaches from wave climate. Coast. Eng. 1981, 4, 253–277. [Google Scholar] [CrossRef]
  35. Rattanapitikon, W.; Shibayama, T. Breaking wave formulas for breaking depth and orbital-to-phase velocity ratio. Coast. Eng. J. 2006, 48, 395–416. [Google Scholar] [CrossRef]
  36. Kraus, N.C.; Larson, M. Prediction of initial profile adjustment of nourished beaches to wave action. In Proceedings of the 1988 National Conference on Beach Preservation Technology, Gainesville, FL, USA, 23–25 March 1988; Florida Shore & Beach Preservation Association: Tallahassee, FL, USA; pp. 125–137. [Google Scholar]
  37. Gourlay, M.R.; Meulen, T. Beach and Dune Erosion Tests (I). Deltares (WL); Delft Hydraulics Laboratory: Delft, The Netherlands, 1968. [Google Scholar]
  38. van Rijn, L.C. Sediment Transport by Currents and Waves; Rep. H461; Delft Hydraulics: Delft, The Netherlands, 1989. [Google Scholar]
  39. Kamphuis, J.W. Closure to “Alongshore Sediment Transport Rate”. J. Waterw. Port Coastal Ocean Eng. 1993, 119, 346–349. [Google Scholar] [CrossRef]
  40. Kriebel, D.L.; Dean, R.G. Convolution method for time-dependent beach-profile response. J. Waterw. Port Coastal Ocean Eng. 1993, 119, 204–226. [Google Scholar] [CrossRef]
  41. Bruun, P. Sea Level Rise: A Cause of Shore Erosion. J. Waterw. Harb. Div. 1962, 9, 117–130. [Google Scholar] [CrossRef]
  42. Allan, R.P.; Arias, P.A.; Berger, S.; Canadell, J.G.; Cassou, C.; Chen, D.; Cherchi, A.; Connors, S.L.; Coppola, E.; Cruz, F.A.; et al. Intergovernmental Panel on Climate Change (IPCC). Summary for Policy-Makers. In Climate Change 2021: The Physical Science Basis. Contribution of Working Group I to the Sixth Assessment Report of the Intergovernmental Panel on Climate Change; Cambridge University Press: Cambridge, UK, 2023; pp. 3–32. [Google Scholar]
  43. Krestenitis, Y.; Makris, C.; Androulidakis, Y.; Kombiadou, K.; Baltikas, V. Storm Surge Simulations in the Greek Coastal Zone Under Climate Change. Available online: https://www.researchgate.net/publication/283089485 (accessed on 22 June 2025).
  44. Stiros, S.; Kontogianni, V. Modelling of the 1986 Kalamata (SW Greece) Earthquake Faulting Using Geodetic Data. J. Appl. Geod. 2008, 2, 179–185. [Google Scholar] [CrossRef]
  45. Papazachos, B.; Kiratzi, A.; Karacostas, B.; Panagiotopoulos, D.; Scordilis, E.; Mountrakis, D.M. Surface Fault Traces, Fault Plane Solution and Spatial Distribution of the Aftershocks of the September 13, 1986 Earthquake of Kalamata (Southern Greece). Pure Appl. Geophys. 1988, 126, 55–68. [Google Scholar] [CrossRef]
  46. Lambeck, K. Sea-Level Change and Shore-Line Evolution in Aegean Greece since Upper Palaeolithic Time. Antiquity 1996, 70, 588–611. [Google Scholar] [CrossRef]
  47. Lambeck, K.; Purcell, A. Sea-Level Change in the Mediterranean Sea since the LGM: Model Predictions for Tectonically Stable Areas. Quat. Sci. Rev. 2005, 24, 1969–1988. [Google Scholar] [CrossRef]
  48. Poulos, S.E.; Ghionis, G.; Maroukian, H. Sea-Level Rise Trends in the Attico–Cycladic Region (Aegean Sea) during the Last 5000 Years. Geomorphology 2009, 107, 10–17. [Google Scholar] [CrossRef]
  49. Gamvroudis, C.; Nikolaidis, N.P.; Tzoraki, O.; Papadoulakis, V.; Karalemas, N. Water and Sediment Transport Modeling of a Large Temporary River Basin in Greece. Sci. Total Environ. 2015, 508, 354–365. [Google Scholar] [CrossRef] [PubMed]
  50. de Swart, R.L.; Ribas, F.; Simarro, G.; Guillén, J.; Calvete, D. The Role of Bathymetry and Directional Wave Conditions on Observed Crescentic Bar Dynamics. Earth Surf. Process. Landf. 2021, 46, 3252–3270. [Google Scholar] [CrossRef]
  51. Southgate, H.N.; Wijnberg, K.M.; Larson, M.; Capobianco, M.; Jansen, H. Analysis of Field Data of Coastal Morphological Evolution over Yearly and Decadal Timescales. Part 2: Non-Linear Techniques. J. Coastal Res. 2003, 19, 776–789. [Google Scholar]
  52. Koumpou, S.V.; Petrakis, S.; Karditsa, K.; Kapsimalis, V.; Poulos, S.E. Near-Shore Hydrodynamic Processes Related to Shoreline Retreat due to Sea Level Rise Induced by Climate Change, along the Northern Coast of Messiniakos Gulf (Ionian Sea). In Proceedings of the Marine and Inland Waters Research Symposium 2022, Porto Heli, Greece, 16–20 September 2022; pp. 57–62. [Google Scholar]
  53. Carter, R.W.G. Coastal Environments: An Introduction to the Physical, Ecological and Cultural Systems of Coastlines; Academic Press: London, UK, 1988. [Google Scholar]
  54. Komar, P.D. Beach Processes and Sedimentation, 2nd ed.; Prentice-Hall: Englewood Cliffs, NJ, USA, 1998. [Google Scholar]
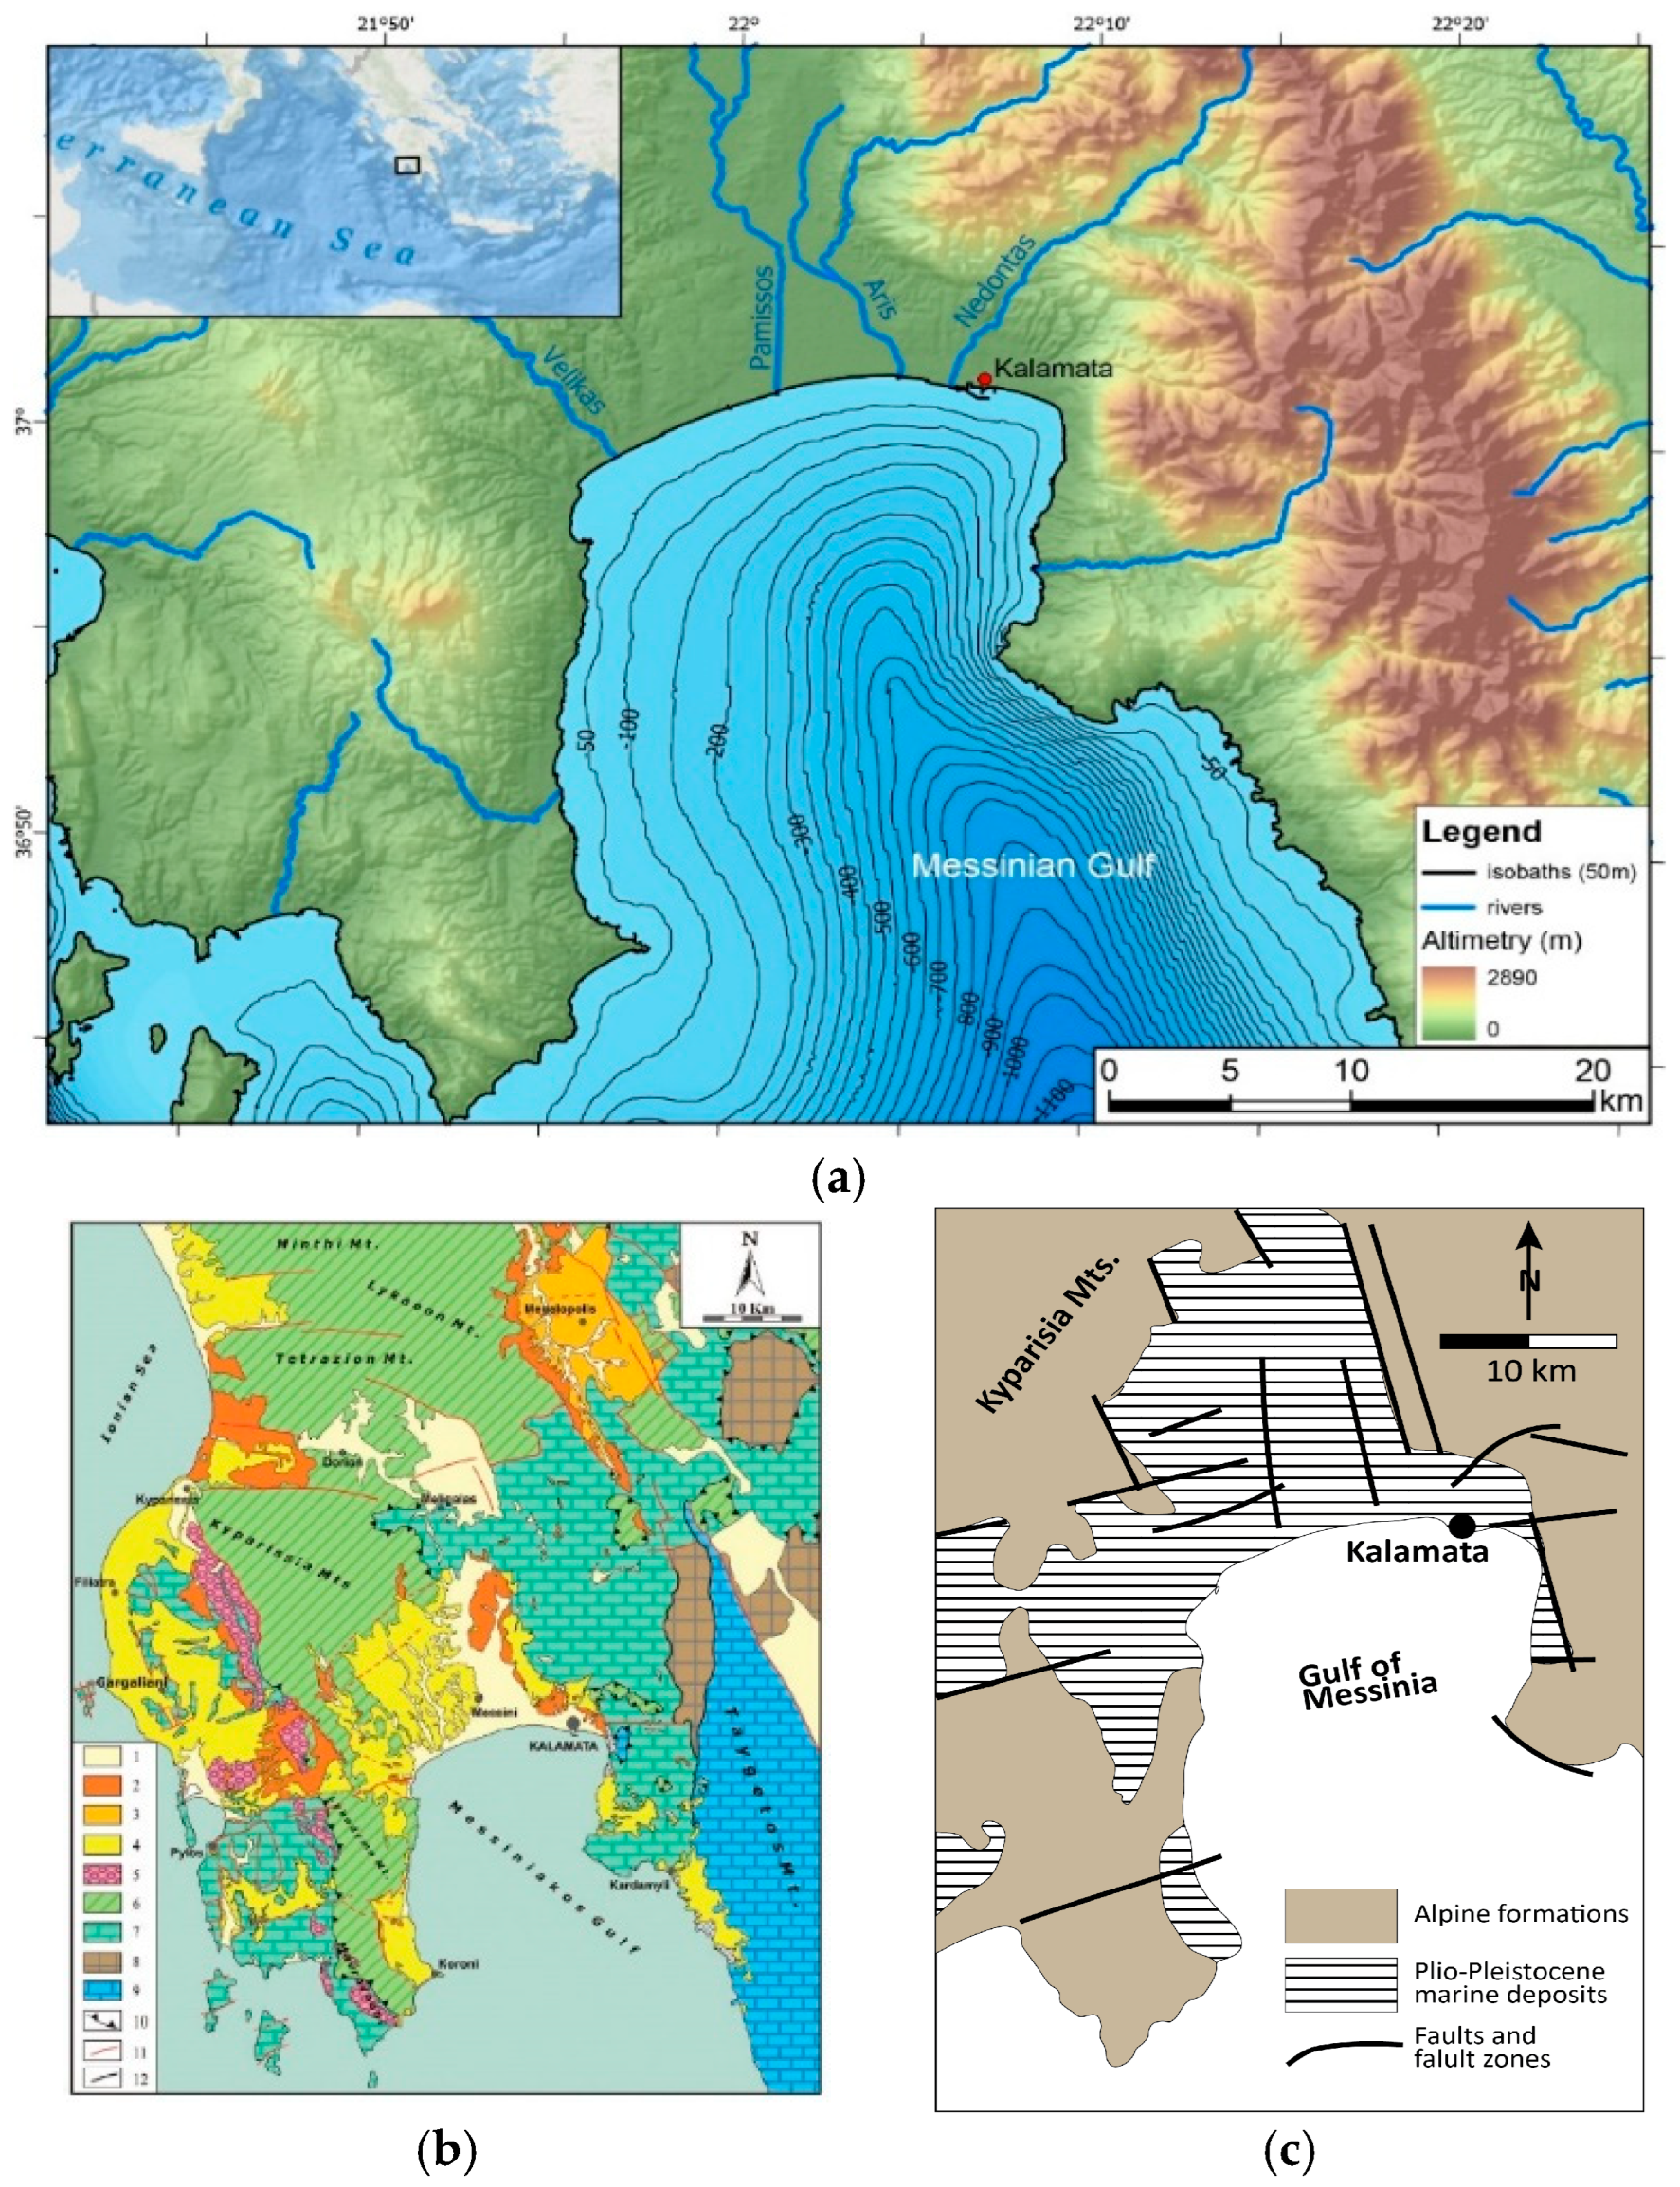
Figure 1. (a) Submarine and terrestrial morphology the broader study area; (b) Geotectonic units and pre-Alpine deposits of the southwestern Peloponnese (map scale 1:100,000) [19] (Key 1: Holocene deposits; 2: terrestrial deposits; 3: marine deposits; 4: lake deposits; 5: Messinian conglomerate (molasse); 6: Pindus unit; 7: Gavrono-Tripoli unit; 8: Arna unit; 9: Mani unit; 10: thrust fault base; 11: fault zone; 12: detached fault zone); and (c) Alpine and meta-Alpine formations and tectonism of the study area [20].
Jmse 13 01810 g001
Figure 2. Bathymetric map of the inner shelf of the north Messiniakos Gulf.
Jmse 13 01810 g002
Figure 3. The positions of the 19 shore-normal topographic profiles (A–S) with their seaward extension and the spatial extend of the 5 beach sectors (S1–S5).
Jmse 13 01810 g003
Figure 4. Photographs, morphometry and grain size along the subaerial part of the 19 shore normal profiles (for location see Figure 3).
Jmse 13 01810 g004
Figure 5. Morphometry and grain size of the subaqueous part of 19 shore normal profiles, (for location see Figure 3).
Jmse 13 01810 g005
Figure 6. Rose diagrams presenting the mean annual frequency of occurrence of the significant wave heights (Hs) and their corresponding peak periods (Tp).
Jmse 13 01810 g006
Figure 7. The net spatial displacement (in meters) (a,c) and the corresponding annual rates (m/year) (b,d) of shoreline position for the western part A (S2, S3, S4 and S5) and the eastern part B (S1) of the Messiniakos northern beach zone from 1960 to 2007.
Jmse 13 01810 g007
Figure 8. The estimation of the Net Spatial Displacement (NSD, meters) and the associated average annual rates (Rat., m/y) of shoreline position changes for the various time periods [Key. A1–A59: West Segment (S5); A60–A285: Central (Western) Segment (S4, S3, S2B); A286–A328: East (western) Segment (S1B); B1–B26: East (eastern) Segment (S1A); B26–B54: Mpouka-West; A139–A141: Mpouka-East: A142–145; A182–A185: Pamissos-West; A186–A190: Pamissos-East; A284–A286: Aris-West; A287–A290: Aris-East.
Jmse 13 01810 g008
Figure 9. Inner shelf bathymetry and subaqueous topographic profiles along with their slopes.
Jmse 13 01810 g009
Figure 10. Crescentic welded bars along the nearshore zone of the sectors S3 and S4 as revealed in the Google earth 2006 satellite image).
Jmse 13 01810 g010
Figure 11. Generalized grain size distribution on the subaerial and subaqueous parts of the beach. (G: gravel; S: sand; sG: sandy gravel; mS: muddy sand; sM: sandy mud; M: mud).
Jmse 13 01810 g011
Table 1. Wave characteristics (H: height; Tp: peak period; Ts; significant period; Dir: Direction of wave propagation; f, %: mean annual frequency of occurrence; L: wavelength).
°HTpDirTsHmTmf (%)L/2L/20
(1/3)0.625.26173.234.990.394.4712.8721.582.16
(1/10)2.007.39179.017.021.256.283.8642.604.26
(1/100)4.228.36177.467.942.647.110.3954.515.45
(1/3)ext3.128.72168.828.281.957.540.13759.315.93
Note: (1/3)ext refers to the extreme values of the significant waves occur for 12 h/year (0.137%).
Table 2. The maximum runup (Rmax), the inner closure depth (hc) and the parameter (Ω) for the 5 beach sectors (S1–S5).
ΩRmax (m) hc
S10.451.977.02
S20.822.40
S30.801.65
S40.761.36
S50.801.27
Table 3. The breaking wave height (Hb), the breaking parameters (γb), the surf similarity parameters (ξb), the breaking depth (db) and the breaking angle (ab) for the five beach sectors.
°Hbξbγbdbab
T1(1/3)0.781.301.150.68−5.07
(1/10)2.200.060.693.18−5.01
(1/100)4.280.050.676.39−6.06
T2(1/3)0.791.631.190.66−2.66
(1/10)2.290.611.012.26−1.34
(1/100)4.290.090.735.88−1.93
T3(1/3)0.781.041.110.703.98
(1/10)2.230.190.832.683.00
(1/100)4.320.150.805.383.63
T4(1/3)0.770.821.060.728.20
(1/10)2.210.090.742.988.66
(1/100)4.290.080.725.9910.48
T5(1/3)0.770.751.050.7311.22
(1/10)2.200.060.693.1813.12
(1/100)4.280.050.676.3915.88
Table 4. The estimated potential longshore transport rate of the immersed mass (Qt,i) and the corresponding dry mass (Qt,m), and the ratio between the suspended load (SSL) and the bed load (BL) (The minus sign indicates a westward direction, while the positive sign denotes an eastward direction of the long-shore transport).
S1 (B)S2 (E)S3 (H)S4 (N)S5 (R)
Qt,i (103 t/y)−34.23−24.46025.2531.1236.10
Qt,m (103 t/y)−55.79−48.0141.1650.7258.84
BL/SSL0.30/10.07/10.07/10.25/10.33/1
Table 5. The temporal shoreline retreat (TSR) at representative profiles (B, E, H, N, R) from the 5 beach sectors (S1–S5) are given together with the parameters considered (i.e., mo: beachface slope; beachface D50; breaking depth (db), horizontal distance of the breaking depth from the shoreline (wb), the parameter An which depends on settling velocity (wS).
S1 (B)S2 (E)S3 (H)S4 (N)S5 (R)
Storm Surge = 0.701.304.503.403.704.60
Storm Surge = 0.350.602.101.061.702.10
db (m)4.903.504.104.604.90
wb (m)46.6850.1764.7373.0184.30
mo (%)0.140.180.120.120.11
D50 (mm)3.551.101.101.201.10
wS (m/s)0.230.120.120.130.12
An0.400.260.260.270.26
Table 6. Estimates of shoreline retreat (RE) due to sea level rise (SLR) for the different SRES scenarios (IPCC-2021) are derived using the Brunn rule [41], together with the parameters involved (i.e., hc: closure depth, Wh: horizontal distance of the hc from the shoreline and B: berm height).
SLR *S1 (B)S2 (E)S3 (H)S4 (N)S5 (R)
0.439.619.320.427.932.4
0.5211.623.3724.633.739.2
0.6314.028.329.840.947.5
0.7316.232.834.647.455.1
0.8218.236.938.853.261.9
Berm (B)2.01.92.52.251.75
hc (1/3)max7.07.07.07.07.0
Wh200400450600660
(*) values abstracted from the NASA tool (https://sealevel.nasa.gov/ipcc-ar6-sea-level-projection-tool? (accessed on 6 June 2025)) for the Kalamata gauge station.
Table 7. The rates of shoreline displacement (+: progradation; −: retreat) during the time periods1960–1988, 1989–1998 and 1999–2017.
1960–19881989–19971998–20171960–2017
West Segment (S5);
DSAS sections: (A1–A59)
+0.52−1.56−0.33−0.15
Central (western) Segment (S4, S3, S2B); DSAS sections: A60–A285+0.45+0.89−0.09+0.30
Central (eastern) Segment (S2A);
DSAS sections: A286–A328
+1.31+0.06−0.02+0.67
East (western) Segment (S1B);
DSAS sections: B1–B27
+0.16−1.00+0.22−0.03
East (eastern) Segment (S1A);
DSAS sections: B28–B54
−0.14−1.06+0.13+0.55
Disclaimer/Publisher’s Note: The statements, opinions and data contained in all publications are solely those of the individual author(s) and contributor(s) and not of MDPI and/or the editor(s). MDPI and/or the editor(s) disclaim responsibility for any injury to people or property resulting from any ideas, methods, instructions or products referred to in the content.