Abstract
To address the trade-off between acoustic stealth and hydrodynamic efficiency in underwater glider design, this study proposes a coupled multi-physics parametric design framework for acoustic matching structures. Using the “Dolphin” glider as a case, geometric effects on acoustic scattering were analyzed by comparing spherical, capsule, and ellipsoidal structures under acoustic incidence. The ellipsoid configuration showed a superior performance and was further optimized through parameterized Myring profiles with length-to-diameter ratios (1.8–1.875) and sharpness factors (n = 1–5). Integrated CFD-BEM simulations revealed that the optimal design (ratio 1.875, n = 2) reduces the scattering sound pressure level by 1.8 dB at 1 kHz and drag coefficient by 14.2%. At 3 m/s, bow-direction target strength decreased by 6 dB, with 4.4 dB flow noise reduction. This methodology effectively resolves acoustic–fluid conflicts, advancing low-noise underwater vehicle design.
1. Introduction
With the rapid development of marine resource exploitation and underwater detection technologies, underwater gliders, as a new type of autonomous underwater vehicle (AUV), are characterized by low power consumption, long endurance, and high stealth. These features have enabled their widespread application in marine environmental monitoring, military reconnaissance, and target detection. However, a growing conflict has emerged between the scattering effects of the acoustic matching structures and the hydrodynamic performance of underwater gliders when performing acoustic detection tasks. As the interface between hydrophones and the external environment, acoustic matching structures must ensure both efficient acoustic signal transmission and high reception sensitivity, while also maintaining low hydrodynamic drag to prolong operational endurance. Achieving a synergistic improvement of acoustic performance and hydrodynamic efficiency through structural optimization has become a key challenge limiting the overall performance of underwater gliders [1,2,3].
The research on the structural improvement of acoustic matching structures for underwater vehicles mainly involves the following four key technical aspects. (1) Construct a multi-objective assessment mathematical model based on operational requirements; (2) Employ parametric modeling techniques to realize the digital representation of geometric shapes. (3) Accurately determine hydrodynamic characteristic parameters through numerical simulation. (4) Utilize intelligent optimization algorithms to perform multi-parameter collaborative optimization. Both domestic and international research organizations have carried out extensive studies in this area. Researchers from the Shenyang Institute of Automation, Chinese Academy of Sciences, employ surrogate models to achieve collaborative optimization of wing parameters, significantly improving the lift–drag ratio and reducing the pitch moment [4]. Based on a baseline model with the total length of 900 mm and the maximal diameter of 40 mm, the team from Northwestern Polytechnical University developed three different front profiles using the Granville streamlined equation to confirm that the front profile has a significant regulatory effect on cavitation behavior [5,6]. Bangtao Zheng conducted numerical simulations to compare the cavitation characteristics of flat-nose, smooth-nose, and conical-nose designs, finding that blunt-nose designs are prone to bubble attachment due to flow separation [7]. In the field of optimization algorithms, the team led by Chunya Sun integrated the Kriging surrogate model with a genetic algorithm, achieving a 19% improvement in the lift–drag ratio of the Blended-Wing-Body [8]. Dongbo Hou et al. investigated a 575 mm supercavitating vehicle and reveal the hydrodynamic characteristics of its elastic trailing edge at a flow velocity of 8 m/s [9]. CFD studies by Ovins et al. indicated that rectangular wings can improve glider stability by 15% [10]. In the field of shape optimization, Peng Dai of South China University of Technology develops a novel high-performance vehicle by constructing a multi-objective model based on the Myring equation [11]. Yuanhui Zhao of Huazhong University of Science and Technology applies the NSGA-II algorithm to optimize the streamlined body, resulting in a 21% reduction in energy consumption and a 34% increase in endurance [12]. The Myring-type rotational body drag prediction model developed by Zheng et al. provides a useful tool for shape optimization across multi-speed models [13]. Yichen Jiang et al. conduct segmental collaborative optimization of the vehicle using the Myring equation with flow noise and drag as dual objectives [14]. The above studies indicate that the shape optimization of underwater vehicles requires a systematic integration of modeling, simulation, and algorithmic techniques. However, most existing research remains confined to a single discipline, and acoustic–fluid coupling optimization still presents significant challenges.
Conventional acoustic matching structural designs often focus on optimizing a single performance metric, such as reducing acoustic scattering using spherical or capsule-shaped structures. However, the associated high drag significantly constrains the maneuverability and endurance of gliders. In recent years, streamlined acoustic matching structures, such as the Myring profile, have attracted considerable attention due to their advantage of parametric tunability. However, the acoustic–fluid coupling mechanisms and multi-objective assessments remain underexplored. Existing studies largely rely on empirical designs or local parameter adjustments, making it difficult to establish quantitative relationships between broadband acoustic responses and complex flow field characteristics. Consequently, the numerical improvement results are notably limited.
In this study, we propose an acoustic matching structural parametric design framework based on multi-disciplinary design and acoustic–fluid coupling strategy. Firstly, through numerical simulations comparing the scattering characteristics of spherical, capsule-shaped, and ellipsoidal bodies under horizontal and vertical acoustic incidence, this study reveals how geometric asymmetry affects acoustic responses and establishes the ellipsoid as the baseline configuration. Subsequently, the Myring equation is introduced to construct a multi-dimensional design space defined by length-to-diameter (L/D) ratios and sharpness factors. By combining computational fluid dynamics (CFD) and the acoustic boundary element method (BEM), the influence of structural parameters on the drag coefficient and scattered sound pressure level is systematically analyzed. Additionally, a multi-objective collaborative optimization of acoustic performance and fluid dynamic characteristics is achieved using a normalized weighted comprehensive evaluation model in combination with the analytic hierarchy process. Finally, a full-scale computational model is established based on the International Towing Tank Conference (ITTC) standard to validate the effectiveness of the optimized scheme in flow noise suppression and target strength reduction for enhanced acoustic stealth.
2. Parametric Design Framework for Acoustic Matching Structures
2.1. Underwater Glider Model and Geometric Constraints
As the basis for optimization, the “Dolphin” underwater glider is selected as the computational model, with its streamlined profile shown in Figure 1. The bow section of underwater glider is equipped with an acoustic sensor module, where a vector hydrophone is mounted via a connecting rod. The main body is fitted with two carbon fiber wings positioned aft. A pair of vertically symmetric tail rudders is installed at the rear, along with a communication antenna. The platform has a total length of 4.5 m (with a manufacturing tolerance of ±0.5%), a parallel midsection length of 2.1 m, a maximum diameter of 240 mm, and a total mass not exceeding 100 kg. The design meets the hydrodynamic requirements corresponding to a Reynolds number of . The acoustic workspace reserved for the vector hydrophone is validated using SolidWorks (2019 SP0) 3D modeling, confirming a cylindrical envelope with a radius of 48 mm and a length of 200 mm, which satisfies the boundary condition requirements for multi-disciplinary coupling.
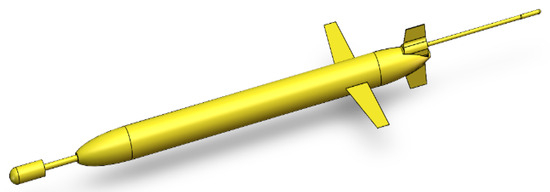
Figure 1.
The “Dolphin” underwater glider model.
2.2. Governing Equations and Dominant Models
To ensure the optimization analysis has sufficient theoretical support, this study employs the governing equations of fluid dynamics and the acoustic field in multi-disciplinary coupled calculations. The flow–acoustic coupling model is used for their collaborative solution. This model can simultaneously capture fluid load variations and acoustic radiation characteristics, serving as the foundation for subsequent shape optimization and performance evaluation.
2.2.1. Fluid Governing Equations and Turbulence Model
The fluid dynamics governing equations are mathematical formulations of the conservation laws that fluids follow during motion, including the mass conservation law, momentum conservation law, and energy conservation law.
Mass Conservation Equation:
where represents the medium density, and are the velocity components of the medium in the directions, respectively.
Momentum Conservation Equation:
where is the pressure, is time, represents the viscous shear stress, and are the components of the generalized source term for the fluid momentum conservation equation in the directions. Turbulence closure is achieved using the SST model. This model combines the accuracy of the model in near-wall regions with the stability of the model in free-stream regions through a blending function, enabling accurate prediction of fluid motion in both near-wall and far-field regions. The specific expression reads
where is the turbulent kinetic energy, is the turbulent frequency, is the fluid density, is the dynamic viscosity, is the turbulent viscosity, and are the turbulent Prandtl numbers corresponding to and , represents the turbulent kinetic energy production term due to mean velocity gradients, and are model coefficients, is a model constant (commonly referred to as the momentum equation or equation of motion), and is an additional cross-diffusion term.
2.2.2. Acoustic Governing Equation and Scattering Simulation
The steady-state acoustic field satisfies the Helmholtz equation:
where is the acoustic pressure, is the wavenumber, is the acoustic wave frequency, and is the speed of sound in water.
This study employs the boundary element method (BEM) to discretize and solve this equation. By utilizing boundary conditions on the object’s surface, the infinite domain problem is transformed into a boundary integral equation, effectively reducing the computational scale and avoiding the complexity of applying artificial absorption conditions at the computational domain boundaries. The outer surface of the hull is treated as a rigid boundary, with the boundary condition being zero normal velocity. In the acoustic scattering problem, the incident wave can be a plane wave or a point source wave. The BEM solution yields the acoustic pressure distribution at any external field location.
2.2.3. Flow-Induced Noise Prediction (Curle’s Equation)
To evaluate the broadband flow noise radiation of the hull under flow excitation, this study introduces Curle’s equation:
where is the perturbed acoustic pressure, is the instantaneous pressure on the hull surface at the retarded time , is the reference static pressure, is the surface normal component, is the outer surface of the hull, and is the retarded time.
Curle’s equation originates from Lighthill’s acoustic analogy theory and is specifically used for modeling flow-generated sound radiation in the presence of solid boundaries. It reflects the contribution of dipole sound sources through surface pressure fluctuations and is suitable for noise prediction of underwater vehicles at low Mach numbers where the solid surface scale is significantly larger than the acoustic wavelength.
In this study, the unsteady pressure data on the hull surface obtained from CFD simulations is used as the input for Curle’s equation. The sound pressure level (SPL) and its spectral distribution are then calculated in the far field (monitoring radius approximately 10 times the characteristic length of the hull).
2.2.4. Flow–Acoustic Coupling Strategy
Coupling between the flow field calculation and the acoustic calculation is achieved through the following interface conditions:
Here, surface velocity and pressure data from the flow field serve as boundary inputs for the acoustic field, realizing a one-way coupling between CFD and BEM/Curle. This strategy is applicable when the influence of acoustic feedback on the flow is negligible, offering high computational efficiency. This model provides a unified physical and numerical computational framework for subsequent shape parametric optimization, ensuring the comparability and credibility of multi-objective evaluation metrics such as drag and sound pressure level.
2.3. Scattering Analysis Under Horizontal and Vertical Acoustic Incidence
As an essential component of the underwater glider’s detection system, the acoustic matching structure serves to shield the hydrophone from external environmental interference while ensuring efficient transmission of acoustic signals. However, the acoustic scattering caused by the structure itself is non-negligible in real-world scenarios and can potentially degrade the detection system’s performance. To better understand the acoustic scattering characteristics of the sonar dome, we conduct simulations of sound scattering for three structural shapes. Table 1 presents the physical parameters of the three structural shape models.

Table 1.
Physical parameters for numerical simulation of three structural shape models.
2.3.1. Horizontal Incidence of a Plane Wave
The horizontal incidence of a plane wave aims to analyze the scattering and reception behavior of the acoustic matching structure when exposed to acoustic waves incident along the positive x-axis direction. The incident frequency is initially set to 1000 Hz, and the acoustic wave is modeled as a plane wave input into the system. The X-Y plane distribution and level of scattered sound pressure under horizontal incidence of a plane wave, which are obtained through numerical simulation, can effectively highlight the characteristics of acoustic wave propagation. Figure 2 presents the simulation results. For an isotropic spherical structure, its axisymmetric property leads to negligible influence of the plane wave’s incident direction on the acoustic scattering characteristics. In contrast, for asymmetric geometries, the incident direction significantly alters the acoustic response. When a plane wave propagates along the major axis of an ellipsoid, the equivalent acoustic path differs from that of incidence along the minor axis, resulting in a noticeable shift of the characteristic frequency toward higher values. For the capsule-shaped body, consisting of two hemispherical ends joined by a central cylindrical section, horizontal incidence leads the acoustic wave to sequentially interact with regions of abrupt curvature change, resulting in complex wave mode conversions. Specifically, the front hemispherical region primarily induces specular reflection, the central cylindrical section supports waveguide modes, and the rear hemisphere generates a diffracted wave field. The presence of geometric discontinuities results in a significantly heterogeneous spatial distribution of acoustic energy, with the scattered sound pressure level exceeding that of an isotropic structure of approximately 4–6 dB.
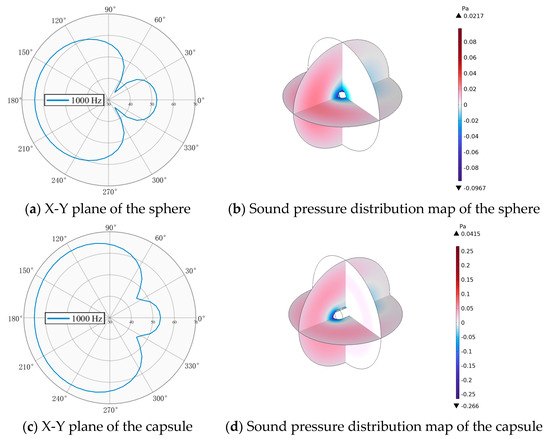
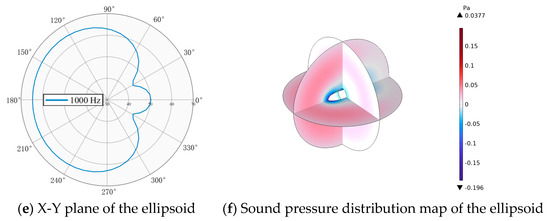
Figure 2.
Acoustic scattering results for horizontal incidence of a plane wave.
2.3.2. Vertical Incidence of a Plane Wave
The vertical incidence of a plane wave aims to analyze the scattering and reception behavior of the acoustic matching structure when exposed to acoustic waves incident along the positive y-axis direction. The X-Y plane distribution and level of scattered sound pressure under vertical incidence of a plane wave, which are obtained through numerical simulation, can effectively highlight the characteristics of acoustic wave propagation. The simulation results are shown in Figure 3. For an isotropic spherical structure, the inherent axisymmetric characteristics ensure that the direction of plane wave incidence has no significant influence on the acoustic scattering behavior. When a plane wave propagates along the minor axis of the ellipsoid, the equivalent acoustic path is longer than that under major-axis incidence, leading to significant spectral broadening and a shift of the characteristic frequency toward lower values. The observed frequency shift is attributed to the equivalent feature scale defined by the minor semi-axis b, which introduces a steeper acoustic impedance gradient, thereby intensifying energy reflection and promoting complex wave mode transformations. Under vertical plane wave incidence, the capsule body experiences direct wave interaction on the side surface of the cylindrical segment, leading to quasi-planar surface reflections. Unfortunately, the abrupt geometric transitions at the cylinder–hemisphere interfaces induce prominent edge diffraction. The geometric discontinuities result in spatial heterogeneity in the acoustic energy distribution, with the scattered sound pressure level increasing by approximately 7–12 dB compared to isotropic structures.
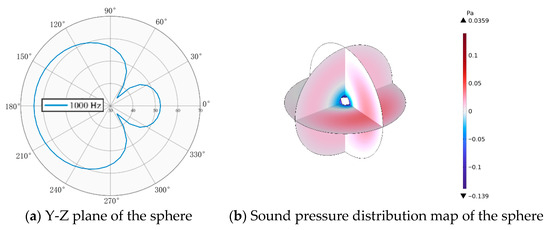
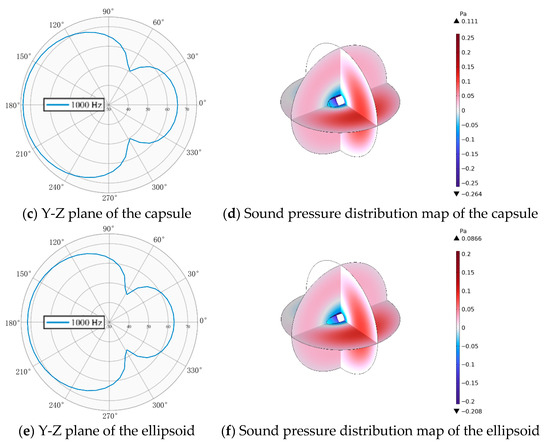
Figure 3.
Acoustic scattering results for vertical incidence of a plane wave.
To summarize, although spherical structures offer ideal acoustic performance, their relatively high hydrodynamic drag limits practical applications. It is necessary to strike a balance between hydrodynamic performance and acoustic design in real-world scenarios.
2.4. Myring Profile Parameter Optimization
According to the previous analysis, the Myring profile is selected as the foundational model for the acoustic structure of the underwater glider. We conduct an in-depth parametric optimization to achieve a conformal integration of the vector hydrophone and the glider’s main body.
In addition, the Myring profile offers distinctive benefits due to its well-defined parametric equations, which allow for precise shape control. This advantage can allow researchers to precisely modify the hull’s fore and aft sections by varying specific parameters. Such capability greatly benefits the optimization of hull shape and contributes to enhanced design flexibility and improved performance metrics. Meanwhile, it effectively supports the optimization objectives in the design of shape control, high-speed performance, and long-range endurance [15,16,17]. The equation for the bow section is as follows:
where d denotes the diameter of the hull, a is the length of the bow section, and n is the sharpness factor to head geometry [18].
2.4.1. Parametric Design Scheme
Generally, the theoretical optimal range of L/D ratios for the bow fairing of underwater vehicles lies between 0.75 and 2 [19]. Considering the geometric constraints of the vector hydrophone and its mounting structure, the L/D ratios of the forward fairing on the “Dolphin” platform are set in the range of 1.8 to 1.875, corresponding to lengths of 432 mm to 450 mm, as shown in Table 2. Meanwhile, under the constraint of a fixed total length, a series of fairing configurations with continuously varying sharpness factors n from 1 to 5 is constructed, as illustrated in Figure 4.

Table 2.
Length-to-diameter ratio matrix of acoustic matching structures.
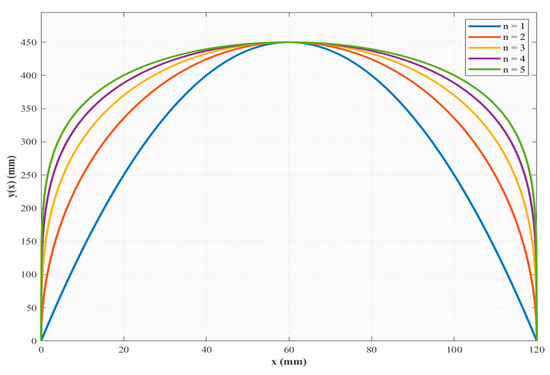
Figure 4.
Sharpness factor evolution curve.
2.4.2. Parametric Analysis of Acoustic Performance
According to the acoustic structural models with varying L/D ratios listed in Table 2, simulation models are established to evaluate the structural scattering sound pressure levels under plane wave excitation at 200 Hz, 500 Hz, 1000 Hz, and 2000 Hz, for both horizontal and vertical incidence directions. The simulation results are presented in Figure 5. Numerical simulations of four Myring-type acoustic receivers with different L/D ratios reveal important characteristics of their acoustic responses. We find that within the low-frequency range, all models exhibit excellent scattering sound pressure-level characteristics, with receiving sensitivity showing a positive correlation with the L/D ratios. When the frequency is below 1000 Hz, the difference in sound pressure levels among models with different L/D ratios is less than 1.5 dB, indicating that geometric parameters have a minimal impact on the reception performance within this frequency range. As the frequency increases, the acoustic response exhibits a pronounced frequency dispersion effect. The phenomenon of scattered beam broadening causes an increase in the beamwidth of the lateral receiving channels under horizontal incidence. Moreover, the main lobe widening angle correspondingly increases with the L/D ratios. For further analysis, although beam broadening occurs in the high-frequency range, the main lobe directional deviation of all models consistently stays within ±1.8°, validating the broadband directional robustness of the proposed acoustic structure.
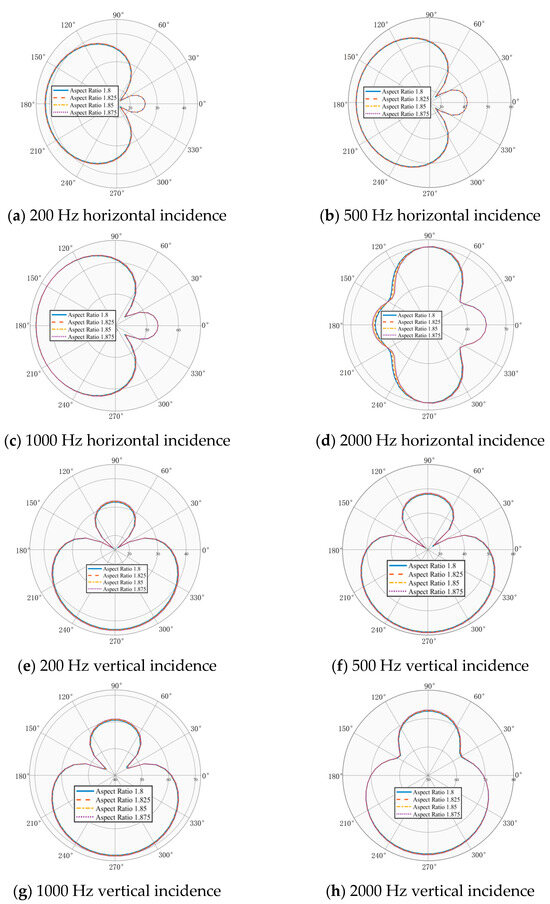
Figure 5.
Variation in scattered sound pressure level in the X-Y plane with length-to-diameter ratio for the acoustic matching structure.
Numerical simulations are conducted using the sharpness factor models defined in Figure 4, with the results shown in Figure 6. The analysis demonstrates that the sharpness factor significantly influences the beamforming behavior of the acoustic matching structure under horizontal wave incidence. A higher sharpness factor enhances the focusing capability of the fairing. As a result, the receiving beamwidth is broadened, leading to improved target resolution and greater accuracy in azimuth localization. At a sharpness factor of 1, the receive beam reaches its minimum width. Nevertheless, multi-target detection experiments show that under this condition, the azimuthal resolution error between adjacent targets increases by 15%, indicating that an overly narrow beam may lead to spatial aliasing issues in practical applications, hindering accurate target localization. Under high-frequency horizontal incidence, increasing the sharpness factor reduces the sidelobe level, which greatly enhances the sonar system’s anti-interference capability in complex environments. This reduces the likelihood of false detections caused by interference received through sidelobes, thereby improving the overall reliability and accuracy of the sonar system.
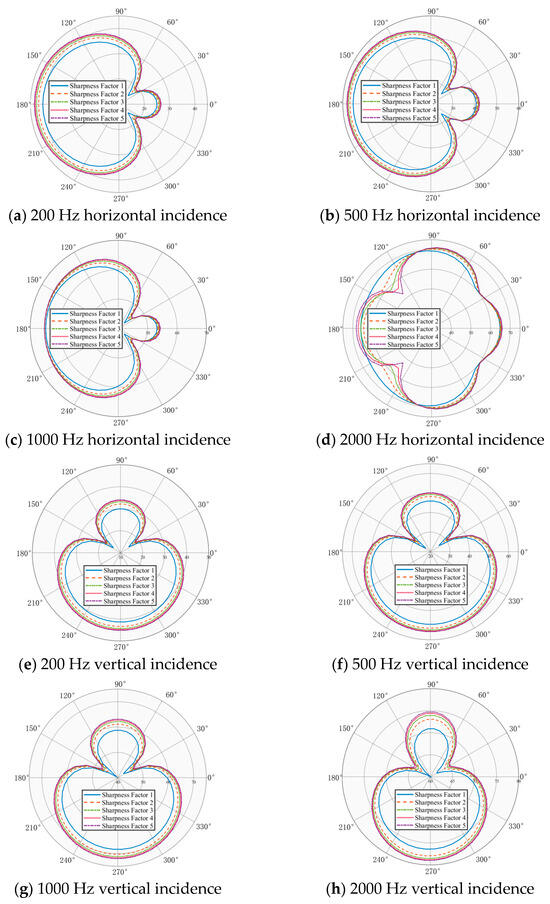
Figure 6.
Variation in scattered sound pressure level in the X-Y plane with sharpness factor for the acoustic matching structure.
2.4.3. Flow Field Analysis
Based on the parametric design results in Table 3, a differentiated bow configuration model system is established using three-dimensional geometric reconstruction techniques. Computational fluid dynamics (CFD) simulations are conducted to investigate the hydrodynamic resistance characteristics under a cruising speed of 1 m/s. The simulation results are shown in Figure 7, where the x-axis denotes L/D ratios, and the y-axis corresponds to the dimensionless drag coefficient. This visualization illustrates the distribution patterns of flow resistance across different bow design schemes, along with the effect of the L/D ratios of the acoustic matching structure on the drag characteristics of the underwater glider. The total drag coefficient exhibits a nonlinear variation with increasing L/D ratios, reaching a minimum within the range of 1.85 to 1.875. That phenomenon indicates that this range represents an optimized region for hydrodynamic performance. When the L/D ratio is less than 1.83, the increase in total drag coefficient is primarily driven by a significant rise in the pressure drag coefficient. When the L/D ratio exceeds 1.85, the skin friction coefficient becomes the dominant factor. The total drag and friction drag of the underwater vehicle decrease progressively, whereas the pressure drag demonstrates an upward trend.

Table 3.
Pairwise comparison matrix in analytic hierarchy process.
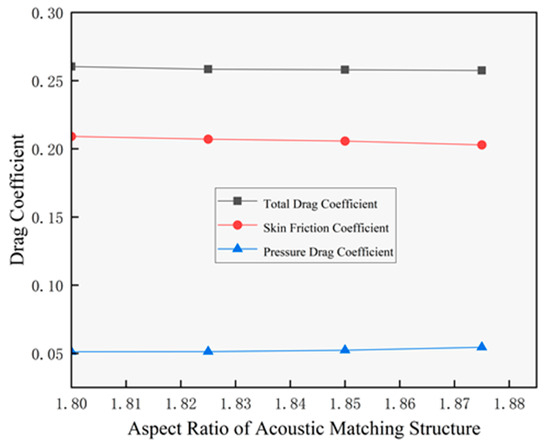
Figure 7.
Variation in drag coefficient of the acoustic matching structure with length-to-diameter ratio.
To systematically investigate the effects of different streamlined parameters on hydrodynamic characteristics, this study employs parametric simulation analysis using CFD methods. Compared with conventional experimental approaches, CFD offers a more cost-effective way to obtain visualized data of complex flow fields. It overcomes the limitations of physical experiments regarding the range of parameter adjustments and measurement accuracy. Consequently, CFD facilitates the elucidation of the underlying fluid dynamic principles involved in optimizing streamlined structures.
The simulation results are shown in Figure 8. When the fairing length is 450 mm, a larger sharpness factor, indicating a fuller streamlined shape, corresponds to a lower skin friction coefficient. The pressure drag exhibits a non-monotonic behavior, first decreasing and then increasing, with its turning point at n = 3 closely related to the critical state of flow separation. The total drag coefficient reaches its minimum at n = 2.
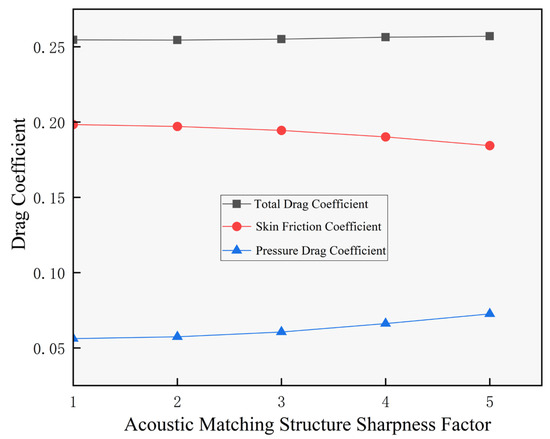
Figure 8.
Variation in the drag coefficient of the acoustic matching structure with the sharpness factor.
2.4.4. Structural Optimization Selection Based on Drag and Acoustic Performance
In the multi-objective collaborative optimization process, a quantitative trade-off relationship between the drag coefficient and the scattered sound pressure level needs to be established. In this study, a normalized weighted comprehensive evaluation approach is utilized, wherein dimensionless performance indicator functions are introduced to formulate the bi-objective optimization problem mathematically:
where Cd represents the drag coefficient of the current design, and Cd0 denotes the baseline drag value of the initial model (taken as 9.664 N). represents the average scattered sound pressure level under the 1 kHz horizontal incidence condition. SPL0 refers to the reference sound pressure level, taken as 152.6 dB at a L/D ratio of 1.8. and represent the weighting coefficients for hydrodynamic and acoustic performance, respectively, and must satisfy the normalization constraint .
Parameter sensitivity analysis reveals that when the weighting coefficient increases from 0.5 to 0.7, the total drag coefficient decreases by up to 12.4%, while the sound pressure-level attenuation rate reaches 0.83 dB per 0.1 increment. Conversely, when the weighting coefficient increases from 0.5 to 0.7, the sound pressure level improves by 2.1 dB, while the drag coefficient increases by 8.6%. Considering the long-endurance operational requirements of the glider and the sonar detection threshold, the analytic hierarchy process (AHP) is employed to determine the weight allocation. The pairwise comparison matrix is shown in Table 3. After consistency verification (CR = 0.032 < 0.1), the calculated weights are and . Under this weight configuration, the structural parameter domain corresponding to the non-dominated solutions on the Pareto front of the optimized objective function is primarily distributed over the L/D ratio range of 1.85–1.875 and the sharpness factor range of 2–3.
Through numerical simulation and multi-objective assessment analysis, the key parameters of the acoustic matching structure are determined. The final selected combination consists of an L/D ratio of 1.875 (total length 450 mm) and a sharpness factor n = 2. Compared to the initial design, this configuration achieves a 14.2% reduction in total drag coefficient and an increase of 1.8 dB in the scattered sound pressure level under 1 kHz horizontal incidence. The numerical improvement results validate the effectiveness of the weight allocation strategy. While ensuring sonar detection sensitivity, the approach significantly improves the hydrodynamic efficiency of the glider, meeting the long-endurance operational requirements for both low drag and high acoustic detection performance. The optimized underwater glider model is shown in Figure 9.

Figure 9.
Three-dimensional schematic diagram of the optimized underwater glider model.
3. Acoustic Performance Verification
3.1. Pre- and Post-Optimization Computational Model Setup
3.1.1. Geometric Model and Computational Domain
The coordinate systems for the underwater glider pre- and post-optimization are established using the internationally recognized ITTC standard coordinate system. The origin O of the coordinate system is defined at the glider’s buoyancy center. The glider’s central axis is designated as the X-axis, with the positive direction aligned with the glider’s forward navigation direction. The Y-axis is horizontal and perpendicular to the X-axis, with its positive direction pointing toward the glider’s starboard side. The direction of the Z-axis is determined according to the right-hand rule. The underwater glider’s platform is divided into the forward wet compartment, the fore cabin, the mid cabin, the aft cabin, and the rear wet compartment. Except for the forward wet compartment, all flooded compartments are connected using rib rings with the same diameter as those employed in the mid cabin. The forward wet compartment is mainly configured with the acoustic measurement unit and environmental monitoring unit. The fore cabin mainly contains the attitude adjustment unit and part of the energy supply unit. The mid cabin accommodates another portion of the energy supply unit along with the navigation and control unit. The after cabin is primarily equipped with the buoyancy-driven propulsion unit. The rear wet compartment is mainly configured with the emergency ballast-release unit, along with other supporting components. Each compartment also features relatively small protrusions and structural openings, such as drainage holes and screw holes. During the finite element modeling process, a computation-guided simplification strategy was applied to the geometric configuration of the underwater glider, wherein local geometrical details, such as functional surface apertures and ring stiffeners, are omitted. The idealized treatment effectively enhanced computational efficiency without compromising the mesh convergence requirements. The underwater glider fuselage model is shown in Figure 10a,b.
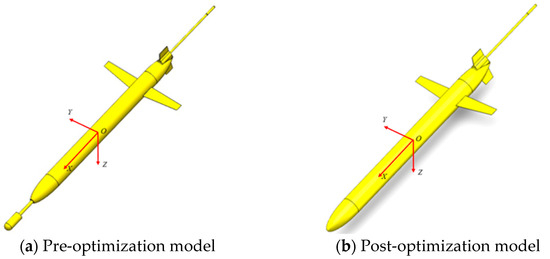
Figure 10.
The underwater glider fuselage model.
The underwater glider has a characteristic length of 4.5 m and a fuselage diameter of 240 mm. After optimization, the characteristic length is reduced to 4.2 m, while the diameter remains 240 mm. According to the recommended guidelines of the ITTC, the pre-optimization computational domain for the underwater glider’s acoustic field adopts a rectangular cuboid structure with an axial length of 9L1 (comprising 3L1 in front of the head and 5L1 behind the tail) and lateral and vertical spans of 3L1 each. This design precisely captures the boundary-layer development by shortening the front region to 3L1, while extending the rear region to 5L1 to fully simulate the wake vortex evolution, thereby ensuring a comprehensive resolution of the flow field characteristics. The optimized computational domain division follows the same principle as the previous model, as illustrated in Figure 11.

Figure 11.
Flow field computational domain. (a) Pre-optimization. (b) Post-optimization.
3.1.2. Mesh Division and Parameter Settings
The discretization accuracy of the acoustic field mesh is determined by the wavelength of the sound wave. To ensure numerical interpolation accuracy of the acoustic pressure field, at least six linear elements or three quadratic elements must be allocated within each shortest wavelength. Compared to the flow field mesh, the resolution requirements for the acoustic field mesh are significantly lower. This is because acoustic calculations primarily focus on the macroscopic distribution of sound pressure, without the need to capture small-scale fluctuating structures as precisely as turbulence simulations. This approach can ensure computational accuracy while reducing the mesh generation time by approximately 65%. In addition, the boundary-layer mesh configuration ensures accurate resolution of the wall acoustic pressure gradient. The values ranging from 30 to 120 are suitable for broadband acoustic calculations. The mesh layout is shown in Figure 12.

Figure 12.
Schematic diagram of the mesh division. (a) Pre-optimization. (b) Post-optimization.
In the numerical simulation, the fluid medium is modeled as an incompressible fluid, with the reference pressure set to standard atmospheric pressure. The SST turbulence model is employed, which combines the robustness of the model in the far field with the accuracy of the model near the wall. It is particularly suitable for simulating separated flows and adverse pressure gradient conditions. The Navier–Stokes equations are discretized and solved using the finite volume method. The time step is set to s to ensure a maximum Courant number below 1.0, thereby satisfying numerical stability requirements. Detailed parameters are listed in Table 4.

Table 4.
Computational parameters.
3.2. Analysis and Comparison of Hull Flow Noise
Acoustic calculations are conducted using the acoustic analogy method. After the flow field reaches a fully stabilized state, flow data from 15,000 time steps are collected for noise analysis. To fully capture the radiated noise characteristics of the underwater glider, 36 monitoring points are arranged in circular arrays on both the mid-transverse and mid-longitudinal planes, as shown in Figure 13. The monitoring radius is configured at 20 m, roughly ten times the characteristic length, to meet far field acoustic measurement conditions. With a 10° interval between each monitoring point, the variation in sound pressure with circumferential angle of the glider can be captured [20]. The locations OZH9/OZZ9 and NZH9/NZZ9 are selected as characteristic points for analyzing the patterns of sound pressure-level spectral patterns, where OZZ9 and OZH9 share the same position, as do NZZ9 and NZH9. This arrangement not only enables accurate capture of the radiation characteristics of the primary noise sources but also effectively assesses the acoustic directivity of the glider.
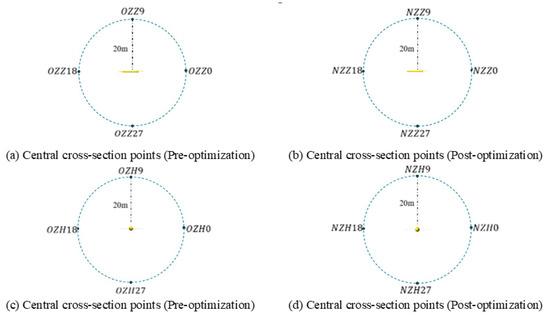
Figure 13.
Locations of monitoring points on the underwater glider’s mid-transverse and mid-longitudinal planes.
(The notations “OZH9”, “OZZ9”, “NZH9”, “NZZ9”, “OZZ9”, “OZH9”, “NZZ9”, and “NZH9” exclusively designate special reference positions 20 m from the glider.)
As shown in Figure 14, within the characteristic frequency band of 100 to 1000 Hz, the sound pressure-level curve of the original configuration exhibits typical broadband turbulence noise features. The energy peak appears around 400 to 800 Hz, which corresponds to the dominant frequency of pressure fluctuations caused by boundary-layer transition near the glider’s nose. After conformal optimization, the flow separation characteristics were significantly improved. At a speed of 1 m/s, the sound pressure level at the 650 Hz frequency decreased from 60.2 dB in the pre-optimization configuration to 57.7 dB after optimization, representing a reduction of 2.5 dB. Additionally, in the one-third multiple frequencies analysis, noise reduction exceeding 3 dB is observed within the 0–1500 Hz frequency range, which confirms that the curvature optimization of the hull effectively suppresses turbulent burst phenomena. As the cruising speed increases to 3 m/s, the low-frequency noise spectrum shifts overall toward higher frequencies, with the dominant frequency moving to 850 Hz. This phenomenon is consistent with the St number scaling law, where the vortex shedding characteristic frequency f is linearly and positively correlated with the cruising speed U. The bow optimization shifts the boundary-layer transition aft by 15% of the chord length, delaying the generation of turbulent fluctuations and achieving an 8.4 dB noise reduction at 850 Hz. Further analysis indicates that the streamlined bow after optimization reduces the magnitude of the spatial derivative of the surface pressure gradient, which directly decreases the intensity of the quadrupole source term in the FW-H equation.
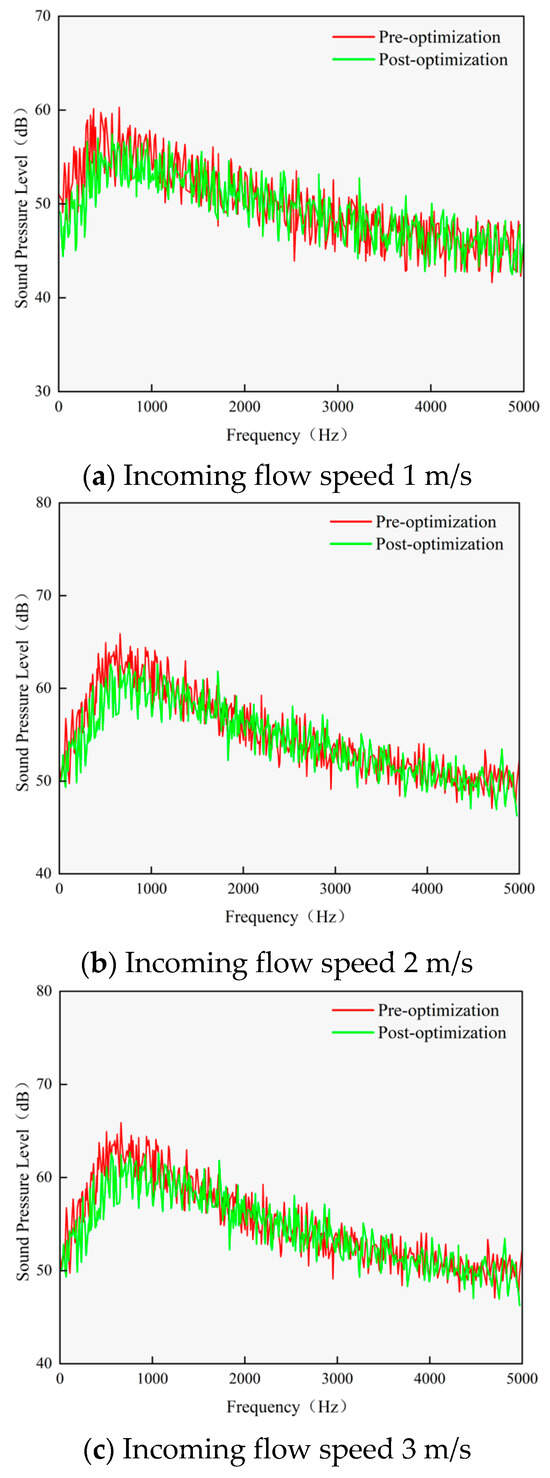
Figure 14.
Sound pressure-level spectral distribution at key monitoring points.
The acoustic response analysis in the high-frequency range (1–5 kHz) shows that noise reduction effects remain at 2.9 dB (at 1 m/s) to 2.3 dB (at 3 m/s) at 1 kHz. However, beyond 2 kHz, the noise reduction decreases to less than 1 dB. This is mainly attributed to two underlying mechanisms. Firstly, high-frequency noise corresponds to small-scale turbulent fluctuations that are less affected by the bow’s geometric parameters. Their acoustic radiation efficiency decreases with increasing frequency. Secondly, the flow stabilization effect induced by bow optimization has a more pronounced impact on large-scale vortex structures. Moreover, the variation in sound pressure level with increasing speed shows marked nonlinear trends. At 3 m/s, the sound pressure level reaches 68.6 dB at 100 Hz, which is 10.7 dB higher than the 57.9 dB measured at 1 m/s. This result is consistent with the trend predicted by classical Lighthill’s acoustic power theory.
The total sound pressure level integrates the contributions from different frequency components and represents the overall magnitude of the flow-induced noise across the entire frequency range [21]. The equation for the total pressure level is given by
where , , , represent the sound pressure levels at different frequencies, respectively. The total sound pressure levels at key nodes for different speeds are calculated based on the OSPL. The results are presented in Table 5. The total sound pressure levels at various monitoring points on the mid-transverse and mid-longitudinal planes are calculated, which results in the sound pressure directivity patterns shown in Figure 15.

Table 5.
Results of sound pressure-level calculations at characteristic points.
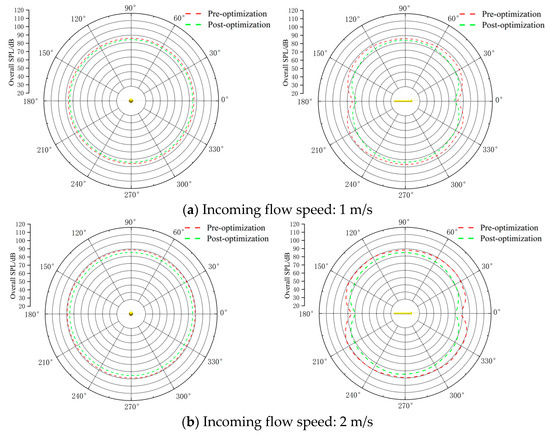
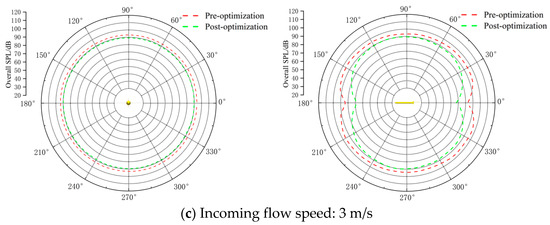
Figure 15.
Directivity of total sound pressure level.
It can be observed that the sound pressure levels of the glider decrease by 1 to 4 dB in different directions on the mid-transverse plane, with the directivity pattern exhibiting a nearly circular shape. In contrast, the mid-longitudinal plane exhibits a figure-of-eight-shaped directivity pattern. The bow optimization, by delaying flow separation, alters the longitudinal acoustic radiation pattern, resulting in a 4 to 8 dB reduction in total sound pressure level along the 180° direction on the mid-longitudinal plane. The optimization scheme reduces the directional index across the entire spatial field under all three operating conditions, while the radiation efficiency factor shows improvement compared to the pre-optimization state. This study confirms that the conformal design of the glider’s bow, by suppressing three-dimensional flow separation, achieves the dual objectives of broadband noise reduction and acoustic directivity optimization.
3.3. Comparative Analysis of Underwater Target Strength
Target strength is a key parameter for evaluating the characteristics of underwater targets, directly reflecting their detectability under acoustic sensing. In recent years, with the advancement of sonar technology, the acoustic stealth performance of underwater gliders has garnered widespread attention. Conformal design of the acoustic matching structure, as an effective method for drag reduction and noise suppression, shows great potential in enhancing the acoustic performance of underwater gliders. The calculation of target strength is presented as follows:
where is the acoustic scattering cross-sectional area of targets. is the reference cross-sectional area. In this study, we utilize the boundary element method (BEM) to investigate the target strength characteristics of underwater targets at a depth of 100 m. The BEM discretizes the Helmholtz integral equation to achieve accurate computation of the acoustic scattering field for targets with complex geometries. Compared to the finite element method, the BEM offers distinct advantages in handling acoustic problems in infinite domains, making it well-suited for studying the target strength characteristics of underwater objects. The computational parameters are listed in Table 6.

Table 6.
Computational parameters.
3.3.1. Analysis and Comparison of Azimuth Influence
The azimuth angle is a fundamental parameter to describe the spatial characteristics of acoustic scattering from underwater gliders. Its dynamic variation is directly associated with differences in target detectability under varying observation angles, which arise from the interaction mechanisms between the target’s geometric shape and the incident acoustic waves. The study focuses on the role of conformal design in enhancing the omni-directional acoustic stealth performance of gliders at an incident frequency of 1000 Hz. Considering the symmetry of the glider’s structure, we systematically analyze the distribution pattern of target strength over the incident angle range from 0° to 180°.
The preferred configuration exhibits lower echo strength across multiple angles, with the scattered sound pressure-level distribution appearing more uniform compared to the pre-optimization configuration. A more uniform scattering pattern indicates that the reflected signals from the target are relatively weak across different directions, resulting in reduced echo strength. This demonstrates that the design optimization effectively enhances the target’s acoustic stealth. By comparing the variations in target strength at different incident angles before and after the optimization, the following conclusions can be drawn:
Under Forward Incidence (0° and 180°)
When the incident wave arrives from the bow or stern direction, the target strength is primarily dominated by specular reflection from the main body of the glider. The conformal design optimizes the acoustic adaptation structure, resulting in a smoother target strength curve and reducing localized strong scattering points. This makes the target less detectable at the bow and stern, indicating enhanced stealth performance in both the front and rear regions relative to the detector. Consequently, the conformal design leads to a broader spatial distribution of reflected energy under forward incidence, causing the peak target strength to decrease by about 2 to 4 dB, as shown in Figure 16.
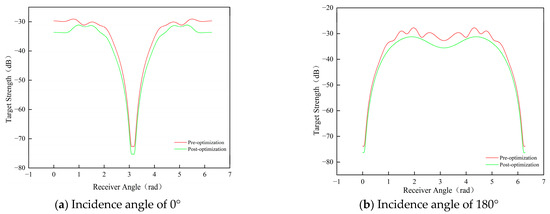
Figure 16.
Comparison of target strengths under forward incidence.
Under Lateral Incidence (90°)
This angular range corresponds to the direction of the glider’s maximum cross-sectional area. The original design with non-streamed acoustic units and distinct angular edges on the main structures causes the superposition of edge diffraction and corner reflection effects, resulting in a significant scattering enhancement region. By eliminating structural discontinuities, the conformal design achieves reduced fluctuations of target strength at the 90° incident angle, which enhances the stability of the stealth performance. Although the average echo strength under lateral incidence is inherently low, the preferred configuration further reduces the echo intensity. The target strength decreases by approximately 2 to 8 dB across different receiving angles. Figure 17 illustrates a comparison of target strength under lateral incidence, validating the effectiveness of the conformal design in mitigating high-frequency scattering caused by geometric discontinuities.
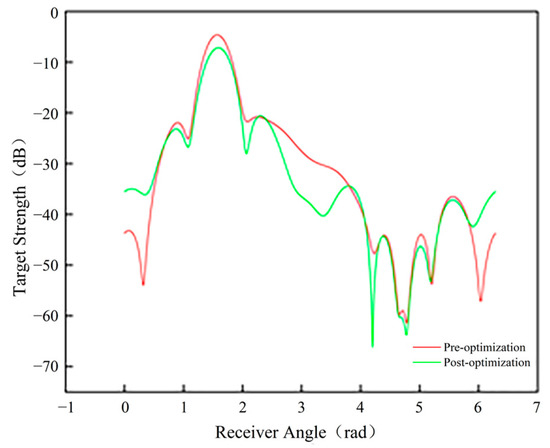
Figure 17.
Comparison of target strengths under lateral incidence.
Within Transition Region (30°, 60°, 120°, and 150°)
In this region, the target strength exhibits nonlinear variations, with the scattering mechanism transitioning gradually from specular reflection to creeping wave scattering. By enhancing the continuity of surface curvature, the conformal design disrupts the propagation of creeping waves along the structural surface, leading to a deflection in the re-radiation direction of the scattered energy. Compared with the pre-preferred configuration, the target strength is reduced by approximately 1 to 5 dB across various receiving angles. Overall, it is approximately 20 dB higher than the peak value observed under forward incidence. Therefore, the acoustic stealth optimization of underwater gliders should focus on enhancing defense capabilities against lateral incident angles. It is advisable to integrate azimuth–frequency coupling characteristics into navigation strategies, enabling the glider to adjust its motion posture to avoid high-risk combinations of detection frequencies and angles. The simulated comparison of target strength in the transition region is shown in Figure 18.
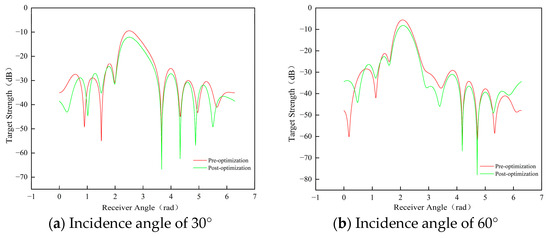
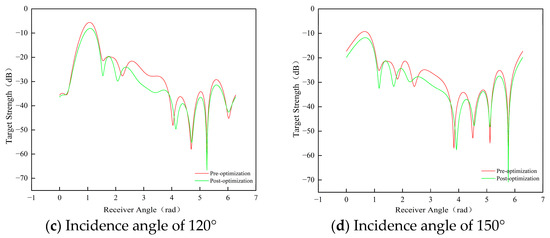
Figure 18.
Comparison of target strength within transition regions.
3.3.2. Frequency Characteristic Analysis
The 0° normal incidence is a typical working condition for sonar detection of underwater targets. The target strength under this condition directly reflects the stealth performance of the glider’s bow. The target strength of underwater gliders exhibits significant frequency dependence, closely related to the scale effects between the acoustic wavelength and the structural features. In this section, we analyze the acoustic scattering frequency response of the underwater glider under normal incidence and focus on revealing the mechanism by which the conformal design regulates scattering energy in critical frequency bands. Though geometric optimization, the conformal structure achieves a substantial reduction in scattering intensity over the entire frequency range. A comparative analysis of target strength across various driving frequencies, before and after the implementation of the conformal design, leads to the following conclusions:
Low-Frequency Range (200 Hz–400 Hz)
At low frequencies, the long-wavelength acoustic waves tend to produce specular reflections from the main body of gliders. According to numerical results in Figure 19, the pre-optimized acoustic structure of the underwater gliders produces a peak strength of −34 dB at 500 Hz. After conformal and streamlined optimization, the peak is reduced to −40 dB by dispersing the reflected energy, achieving a 6 dB reduction. As the frequency increases to 2000 Hz, the connecting rod of the pre-optimized underwater glider exhibits a local rise in target strength due to resonance effects. The conformal design weakens the resonant structures, effectively suppressing such abnormal scattering.
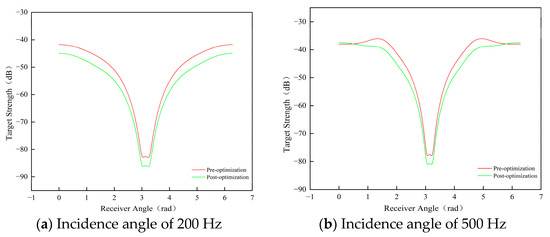
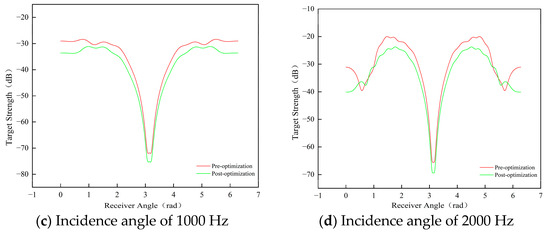
Figure 19.
Comparison of target strength in the low-frequency range.
Mid-to-High-Frequency Range (4000 Hz–20,000 Hz)
According to the numerical results in Figure 20. In the mid-to-high range, the acoustic wavelength gradually becomes comparable to the sizes of local details of the glider, such as the fairing and wings, resulting in a shift of the scattering mechanism from global reflection to localized diffraction. The sharp edges of the glider induce significant diffraction effects in the 4–20 kHz frequency range, resulting in rises in target strength, with a peak value of −10 dB at 8 kHz. The conformal optimization weakens geometric discontinuities, effectively suppressing target strength fluctuation and keeping it consistently below −16 dB across the specified frequency band. When the frequency exceeds 15 kHz, the peak target strength shows little variation. Meanwhile, the target strength exhibits a decreasing trend with increasing frequency. As a result, 15 kHz is referred to as the critical frequency. The conformal design reduces the effective scattering cross-section, resulting in a more pronounced decrease in target strength beyond the critical frequency, with reductions ranging from 7 to 19 dB. Therefore, the glider achieves enhanced acoustic stealth within the 15–20 kHz band under 0° incidence, offering valuable guidance for designing against high-frequency sonar detection. It is commended to leverage the high-frequency stealth advantage at the normal incidence by optimizing the glider’s navigation posture to minimize sonar detection risk.
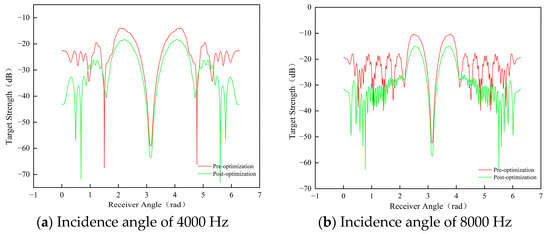
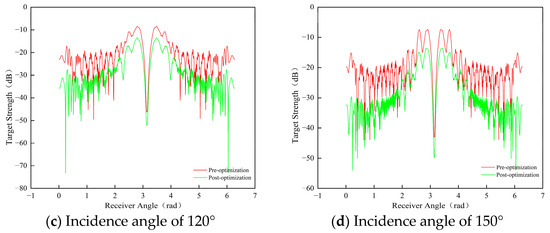
Figure 20.
Comparison of target strengths within transition regions.
4. Conclusions
In this study, we focus on the acoustic matching structural optimization of underwater gliders with respect to the coupled acoustic–flow field. Based on the multi-disciplinary collaborative design concept, a systematic study was conducted encompassing shape parameter optimization, scattering characteristic analysis, flow noise suppression, and target strength stealth performance. Consequently, a comprehensive parametric design framework for acoustic adaptation structures was developed. The main conclusions are as follows:
- (1)
- Though a comparison of scattering behaviors for spherical, capsule-shaped, and ellipsoidal bodies under both horizontal and vertical acoustic incidence, it was found that the acoustic response of asymmetric geometries exhibits significant directional dependence. Under horizontal incidence, the ellipsoid exhibits an upward shift in characteristic frequency due to an optimized equivalent acoustic path length, resulting in a 4–6 dB reduction in scattered sound pressure level compared to the sphere. The capsule exhibits significant heterogeneity in acoustic energy distribution due to wave mode conversion caused by curvature discontinuities. Considering fluid drag characteristics, the ellipsoid configuration exhibits an integrated advantage in acoustic behavior and hydrodynamic streamlining, providing a basis for further Myring streamline optimization.
- (2)
- Based on the Mrying streamline equation, we construct a multi-dimensional design space defined by L/D ratios (1.8–1.875) and sharpness factors (n = 1–5). The influence of these parameters on coupled acoustic and flow performance is investigated via integrated CFD and BEM analyses. With an L/D ratio of 1.875 (total length of 450 mm) and a sharpness factor n = 2, the proposed design reduces the scattered sound pressure level by 1.8 dB at a 1 kHz horizontal incidence and the total drag coefficient by 14.2%. The results confirm the effectiveness of the normalized weighted comprehensive evaluation model and the analytic hierarchy process in optimizing the trade-off between acoustic stealth and hydrodynamic performance.
- (3)
- The post-optimized glider exhibits a reduction in total flow noise sound pressure level by 2.5 to 4.4 dB at speeds ranging from 1 to 3 m/s, accompanied by a transformation of the mid-longitudinal acoustic radiation directivity from a figure-of-eight to a more uniform distribution. The analysis of target strength reveals a 6 dB decrease in peak intensity at 1 kHz under 0° normal incidence and a 50% reduction in intensity fluctuation amplitude at 90° lateral incidence. Therefore, it is demonstrated that the conformal design significantly enhances omnidirectional stealth by suppressing flow separation and geometric discontinuities. It is important to note that the current experimental validation phase has focused on simulations assessing the impact of shape optimization on flow noise and target strength characteristics. To rigorously validate these simulated findings under real hydrodynamic conditions, the implementation of hydrophone array measurements on physical prototypes in controlled tank tests or open-water trials will be a critical focus of our subsequent experimental work.
The optimized acoustic matching structure successfully achieves a synergistic improvement in sonar detection sensitivity and glider endurance, which provides a theoretical basis and technical support for the design of highly stealthy underwater detection platforms. In the future, we will further explore the integrated application of asymmetric Myring profiles, smart materials (such as acoustic metasurfaces), and active noise reduction technologies to address broadband acoustic detection challenges in complex marine environments. This roadmap includes the essential next step of conducting hydrophone-equipped experiments to empirically confirm the predicted noise reduction.
Author Contributions
L.Z.: conceptualization, data curation, formal analysis, methodology. B.C.: experiment, formal analysis, data curation, writing—original draft. P.L.: data curation, writing—review and editing, investigation. S.Z.: data curation, investigation. Q.S.: data curation, formal analysis. All authors have read and agreed to the published version of the manuscript.
Funding
This work was jointly supported by the Programs for National Key R&D Plan (Grant No. 2021YFC3100903) and Shandong Key R&D Plan (Grant No. 2021CXGC010708).
Data Availability Statement
Data will be made available on request.
Conflicts of Interest
The authors declare that they have no known competing financial interests or personal relationships that could have appeared to influence the work reported in this paper.
References
- Davis, R.E.; Eriksen, C.C.; Jones, C.P. Autonomous buoyancy-driven underwater gliders. Technol. Appl. Auton. Underw. Veh. 2002, 28, 37–58. [Google Scholar]
- Merckelbach, L.M.; Briggs, R.D.; Smeed, D.A.; Griffiths, G. Current measurements from autonomous underwater gliders. In Proceedings of the 2008 IEEE/OES 9th Working Conference on Current Measurement Technology, Charleston, SC, USA, 17–19 March 2008; pp. 61–67. [Google Scholar] [CrossRef]
- Song, B.W.; Guang, P.; Yu, Y.; Ti, W.L.; Do, H.C. Development trend and key technologies of autonomous underwater vehicles. Chinese J. Ship Res. 2022, 17, 27–44. [Google Scholar] [CrossRef]
- Gu, H.T.; Li, Y.; Hu, Z.Q.; Yu, J.C. Surrogate Models Based optimization methods for the Design of Underwater Glider Wing. Mech. Eng. 2009, 45, 7–14. [Google Scholar] [CrossRef]
- Zhang, B.; Zhang, Y.W.; Li, W.Z.; Yang, W.G.; Fan, H. Experimental Study on Effect of Profile of Supercavitating Vehicle’s Front Part on Generation Speed of Cavity. J. Northwestern Polytech. Univ. 2008, 26, 540–544. [Google Scholar]
- Zhang, B.; Zhang, Y.W.; Sun, Z.Y.; Liu, J. Exploring Effect of Diameter Size of Supercavitation of Ventilation Device on Supercavitation Shape. J. Northwestern Polytech. Univ. 2010, 28, 834–839. [Google Scholar]
- Zheng, B.T. Numerical simulation on underwater vehicles of different head nose crossing through gas bubble. J. Ship Mech. 2015, 19, 757–764. [Google Scholar]
- Sun, C.; Song, B.; Wang, P. Parametric geometric model and shape optimization of an underwater glider with blended-wing-body. Int. J. Nav. Archit. Ocean Eng. 2015, 7, 995–1006. [Google Scholar] [CrossRef]
- Hou, D.; Wang, C.; Xia, W.; Li, Y.; Zhao, J. Experimental Investigation into the Cavity Shape and Pressure Characteristics of Supercavitating Vehicle with Elastic Trailing Edge. Acta Armamentarii 2020, 41, 534541. [Google Scholar] [CrossRef]
- Javaid, M.Y.; Ovinis, M.; Hashim, F.B.; Maimun, A.; Ahmed, Y.M.; Ullah, B. Effect of wing form on the hudrodynamic characteristics and dynamic stability of an underwater glider. Int. J. Nav. Archit. Ocean Eng. 2017, 9, 382–389. [Google Scholar] [CrossRef]
- Dai, P. Research on Multi-Objective Optimal Design of Three-Body Combined Autonomous Underwater Vehicle Based on Parameterization; South China University of Technology: Beijing, China, 2020. [Google Scholar] [CrossRef]
- Zhao, Y.H.; Li, B.R.; Gao, L. Optimal Configuration for Underwater Glider Hydrodynamic Performance. J. Wuhan Univ. Technol. (Transp. Sci. Eng.) 2016, 40, 505–508+513. [Google Scholar]
- Zheng, G. Studies of the resistance optimization of underwater vehicle based on multiple-speed approximate model. In Proceedings of the MATEC Web of Conferences, EDP Sciences, Tianjin, China, 13 March 2019; Volume 272, p. 01029. [Google Scholar]
- Jiang, Y.; Zhao, Y.; Xiong, J.; Yang, Y.; Zhang, G. Comprehensive influence of underwater vehicle hull shape on resistance and flow noise. J. Harbin Eng. Univ. 2022, 43. [Google Scholar] [CrossRef]
- Min, Z. Optimizing and Kinetic Study of Underwater Glider; Zhejiang University: Zhejiang, China, 2007. [Google Scholar]
- Huang, F.; Meng, Q.; Cao, L.; Wan, D. Wakes and free surface signatures of a generic submarine in the homogeneous and linearly stratified fluid. Ocean. Eng. 2022, 250, 111062. [Google Scholar] [CrossRef]
- Ma, J.; Lan, F.X.; You, H. Research on biomimetic shape design and drag numerical prediction of high-speed UUV. Appl. Sci. Technol. 2024, 51, 158–165. [Google Scholar] [CrossRef]
- Lungu, A. A DES-based study of the flow around the self-propelled DARPA Suboff working in deep immersion and beneath the free-surface. Ocean. Eng. 2022, 244, 110358. [Google Scholar] [CrossRef]
- Wu, Q.Y.; Liu, F. Hydrodynamics of Hybrid–Driven Underwater Vehicle at AUV Mode. Comput. Simul. 2013, 30, 311–314. [Google Scholar]
- Yang, C.; Arcondoulis, E.J.; Yang, Y.; Guo, J.; Maryami, R.; Bi, C.; Liu, Y. Active control of airfoil turbulent boundary layer noise with trailing-edge blowing. J. Acoust. Soc. Am. 2023, 153, 2115. [Google Scholar] [CrossRef] [PubMed]
- Trembois, N.P.; Jacobellis, G. Broadband Noise Prediction from Leading Edge Turbulence Quantities. J. Test. Eval. 2023, 44, 1–9. [Google Scholar]
Disclaimer/Publisher’s Note: The statements, opinions and data contained in all publications are solely those of the individual author(s) and contributor(s) and not of MDPI and/or the editor(s). MDPI and/or the editor(s) disclaim responsibility for any injury to people or property resulting from any ideas, methods, instructions or products referred to in the content. |
© 2025 by the authors. Licensee MDPI, Basel, Switzerland. This article is an open access article distributed under the terms and conditions of the Creative Commons Attribution (CC BY) license (https://creativecommons.org/licenses/by/4.0/).