Article

The Numerical Evaluation of Hydrate Saturation in Marine Sediment During the Injection Process of Self-Heat Generating Fluid

1
Key Laboratory of Marine Mineral Resources, Ministry of Natural Resources, Guangzhou Marine Geological Survey, China Geological Survey, Guangzhou 511458, China
2
National Engineering Research Center for Gas Hydrate Exploration and Development, Guangzhou 511458, China
*
Author to whom correspondence should be addressed.
J. Mar. Sci. Eng. 2025, 13(9), 1772; https://doi.org/10.3390/jmse13091772
Submission received: 4 July 2025 / Revised: 10 September 2025 / Accepted: 11 September 2025 / Published: 13 September 2025

Abstract

Marine gas hydrates are recognized as a promising offshore energy resource. Self-heat fluid injection is an innovative thermal-enhanced gas recovery technique for hydrate exploitation engineering. This study numerically investigates hydrate saturation during the self-heating reagent injection process in a sub-sea hydrate reservoir, decoupled from gas production interference. This process employs two consecutive stages: reactive chemical flow stage followed by non-reactive flow stage. The simulation output parameters encompass reservoir temperature, fluid saturation, thermal conductivity, and heat flow rate. The base case demonstrates that fluid injection elevates reservoir temperature from 13.0 °C to 29.3 °C and reduces hydrate saturation from 0.40 to 0.21 through coupled heat–mass transfer mechanisms during the reactive flow stage. In the consequent non-reactive flow stage, hydrate saturation decreases to zero. Sensitivity analysis reveals that initial permeability variation governs the hydrate saturation and temperature during the non-reactive phase. The permeability range of less than 15 mD is the optimal threshold preventing hydrate reformation during fluid injection. 55–70 mD permeability triggers severe secondary hydrate generation, which decreases the fluid application feasibility. Fluid flooding demonstrates superior hydrate dissociation efficacy compared to in situ thermal stimulation. This study develops a novel simulation approach to characterize marine hydrate saturation dynamics.

1. Introduction

Natural gas hydrates (NGHs) have been acknowledged as a significant future clean energy source in marine sediment due to their enormous reserves, high energy density, and low-pollution dissociation products [1,2,3]. Alternating hydrate formation environment has emerged as a viable gas recovery strategy through affecting the hydrate dissociation efficiency [4]. The predominant technical challenge in the hydrate exploitation field arises from the secondary hydrate formation during the dissociation phase [5]. With the help of heat transfer in the reservoir porous media, the thermal-assisted gas production enhancement method (abbreviated as thermal stimulation method) has been widely proposed to solve the secondary hydrate generation problem through thermal compensation mechanism [6,7,8], which is a common issue encountered in conventional depressurization approaches, stemming from inadequate thermal energy replenishment around the wellbore region [9,10]. Following thermal fluid injection into the formation, the coupled thermo-hydrodynamic process within porous media manifests as two distinct yet interconnected phases: the heat injection followed by the gas production. From the perspective of energy exchange, heat carrier input primarily functions as supplementing sensible heat within the marine sediment [11], and the gas production predominantly involves the thermochemical endothermic process triggered by post-stimulation hydrate dissociation in reservoirs [12].
The continuum-scale multiphysics coupling that persists throughout both heat injection and gas production phases necessitates the systematic identification of key parameters governing each phase during thermal stimulation. This comprehensive parameter analysis enables coherent interpretation of system evolution from the initial heat generation phase through to the terminal gas production stage [13,14]. As the dominant fluid parameter dictating hydrate occurrence morphology and pore-scale characteristics in gas hydrate-bearing reservoirs, hydrate saturation exerts multiple control: modulating marine sedimentary mechanical properties, governing gas–water relative permeability [15,16], and serving as a thermal efficiency indicator for hydrate decomposition [17,18]. Therefore, it is crucial to assess hydrate saturation levels during both energy injection and gas production operational phases of the thermal stimulation process to ensure reservoir characterization.
From the perspective of simultaneously reducing heat loss and improving energy utilization efficiency, thermal stimulation methods have been explored with different heat carriers under various heat injection systems [19,20,21]. Recently, an innovative thermal-based production enhancement approach, self-heat generating fluid method (abbreviated as self-heat injection method), has been proposed to enhance the hydrate reservoir exploitation efficiency [22,23]. The key mechanism of the self-heat injection method entails thermal energy liberation from chemical heating systems to stimulate secondary hydrate dissociation within marine sediments [24]. Beyond thermal dissociation enhancement, exothermic reaction byproducts (notably saline) effectively suppress hydrate reformation [25]. While these advantages exist, the method’s effectiveness fundamentally depends on initial hydrate saturation. Such dependence arises because initial hydrate saturation functions as an important petrophysical parameter that simultaneously regulates gas production capacity, thermal efficiency, and operational conditions. One example includes determining calcium-oxide-based fracturing fluid concentration in thermal stimulation [26], with higher saturation levels demonstrably extending gas production duration in marine sediment experiments [27]. However, two research gaps exist in self-heat injection methodologies: (i) the hydrate saturation evolution during the energy injection stage remains poorly characterized despite its thermo–mass–velocity coupling significance throughout the hydrate dissociation process [28,29,30]; and secondary hydrate reformation risks caused by localized wellbore thermal depression lack quantitative constraints during the thermal carrier injection process [31]. The absence of hydrate saturation monitoring during the thermal injection period results in uncontrolled secondary hydrate formation. This directly induces near-wellbore permeability impairment during injection, ultimately compromising the feasibility of hydrate management strategies [32].
This study bridges these gaps by establishing a hydrate saturation prediction model to: (i) quantify hydrate saturation dynamics during the self-heat fluid injection process, and (ii) develop phase equilibrium constraints against secondary hydrate nucleation in the near-wellbore area. The effects of thermal stimulation on hydrate saturation evolution, reservoir temperature distribution, and associated reservoir properties are systematically examined across baseline and sensitivity analysis cases. The NaNO2-NH4Cl exothermic system is utilized as the self-heating agent, benefiting from its thermal performance and chemical stability under hydrate-bearing sediment conditions [33]. This study emphasizes the assessment of intrinsic permeability characteristics and injection protocols on hydrate saturation patterns in marine sediments. Sensitivity analysis identifies initial permeability (1.5–100 mD) and thermal injection mode as key parameters, given permeability’s dominant role in controlling thermal front advancement in hydrate reservoirs [34,35]. Additionally, in situ heating and fluid flooding constitute alternative thermal stimulation strategies for the reservoir heat loss mitigation, necessitating comparative analysis in hydrate-bearing sediments [36].
This work quantifies hydrate saturation evolution during self-heating fluid injection in gas hydrate reservoirs, employing numerical multiphysics models during the non-production period to decouple saturation estimation from produced gas flow. The injection process utilizes a vertical well within a hydrate reservoir, with porous media properties referenced from Shenhu area, South China Sea [37]. The numerical evaluation of the base case reveals a 16.3 °C average reservoir temperature increase during the “Reactive chemical flow stage” (defined in Section 2.1), induced by chemical self-heating fluid injection, while hydrate saturation declines from 40% to 21%. The self-heat generating method demonstrates superior applicability in reservoirs possessing permeability below 15 mD; however, this method exhibits limited efficacy in porous media with 55–70 mD initial permeability. The fluid flooding technique surpasses the in situ heating approach.

2. Materials and Methods

2.1. Defining Two Stages in Reservoir Energy Stimulation

This study employs numerical modeling to analyze vertical well injection systems for sodium nitrite solutions in marine hydrate reservoirs. During the initial injection phase, hydrate decomposition heat arises from two primary mechanisms: sensible heat conduction through the reservoir, and thermal convection of reactive fluids generated by the working reagent’s exothermic reaction [38]. As heat and mass transfer propagate through the porous media, hydrate dissociation initiates gas–aqueous phase transitions. The dynamic evolution of three-phase saturation (gas/water/hydrate) serves as a direct indicator of thermal–fluid coupling between the heat generation system and the sedimentary reservoir. The thermochemical stimulation process involves concurrent exothermic chemical reactions and hydrate phase transformations, leading to progressive reservoir temperature increase accompanied by hydrate saturation decline. Upon completion of the exothermic period, the reservoir reaches peak temperature. The synchronous process of the chemical reaction and phase transition is described as the “reactive chemical flow stage”, abbreviated as Stage 1. Equation (1) characterizes exothermic and endothermic chemical reactions for Stage 1.
N a N O 2 + N H 4 C l H + N a C l + N 2 + 2 H 2 O C H 4 ( H 2 O ) 5.75 C H 4 + 5.75 ( H 2 O )
Upon cessation of Stage 1, the reactive chemical flow terminates while the temperature difference between the hydrate zone and the non-hydrate zone dominates the sensible heat towards hydrate decomposition within the porous media, and thus the process after Stage 1 is defined as “non-reactive flow stage” (abbreviated as Stage 2). In this stage, thermal energy influx from Stage 1 progressively attenuates due to endothermic hydrate dissociation, thereby inducing average temperature decline within the marine sediment; meanwhile, reservoir pressure dynamics exhibit complex characterization under the combined influence of injection pressure and hydrate decomposition, wherein stochastic hydrate saturation trajectories emerge: hydrates may either decompose or regenerate; consequently, their saturation within the reservoir porous media may change randomly.

2.2. Simulation Tool Introduction

COMSOL Multiphysics 5.4® is a finite element method-based software that enables the simulation of coupled physical processes, including sedimentary fluid flow, heat transfer, and hydrate phase transition within marine sediments containing gas hydrates [39]. Therefore, COMSOL Multiphysics® is employed as the numerical tool to develop the self-heating fluid injection simulation model. The assumptions and model construction are introduced as follows.

2.3. Model Construction

As shown in Figure 1, a self-heat generating fluid injection well is located in a hydrate reservoir of the South China Sea, and the well has been operated with casing perforation. The 2D simulation domain (2 m × 1 m) features initial hydrate saturation homogeneously distributed in a unilateral wellbore configuration. The sediment condition and fluid initial properties are listed in Table 1.

2.4. Model of Reactive Chemical Flow Stage (Stage 1)

In Stage 1, the governing equations for flow momentum, heat transfer, and mass conservation are formulated in Equations (2)–(4). The initial parameters of Stage 1 are shown in Table 2. In this stage, the combined effects of the exothermic reaction of the self-heating system and the endothermic reaction of hydrate dissociation are evaluated. By integrating the chemical reactions with the convection–dispersion equation, the mass of water released from hydrate dissociation and the corresponding changes in hydrate saturation have been calculated. During the process of correlating chemical reactions with fluid heat transfer, the heat exchange between the endothermic reaction of hydrate dissociation and the formation environment has been considered.
  • Momentum conservation equation
The momentum conservation equation (Equation (2)) describes the flow situation of the heat generation system during the injection process of self-heat injection fluid in the reservoir porous media. The definitions of the parameters in Equation (2) are listed in Table 2.
ρ c d V c d t = ρ c g p + μ c 2 V c ρ c t + ( ρ c V c ) = 0
where ρc is the chemical reagent fluid density, kg/m3; VC is the chemical reagent fluid velocity, m/s; μc is the chemical reagent fluid dynamic viscosity, Pa·s; g is force per unit volume of fluid, m/s2.
The momentum conservation is expressed by the simultaneous formulation of the Navier–Stokes equation in the first line and the continuity equation in the second line, where the Navier–Stokes equation describes the dynamic behavior of the fluid velocity field V evolving over time. This set of equations embodies the balance of forces (inertial, body, pressure, and viscous forces) acting on the element of injected chemical reagent fluids.
ρ c d V c d t represents the inertial force per unit volume of the fluid; ρ c g is the body force per unit volume acting on the fluid, where g is the gravitational force; in this study, gravitational force is ignored. p represents the pressure gradient force per unit volume, with p being the pressure and ∇ is the gradient operator, μ c 2 V c is the viscous force per unit volume of fluid, describing the viscous dissipation and momentum transfer within the fluid.
  • Heat transfer equation at hydrate interface
Equation (3) quantifies hydrate-induced thermal variations during Stage 1 heat injection. Table 2 summarizes hydrate thermal properties and Equation (3) parameter definitions. Equation (3) is used to describe the heat transfer of hydrates considering heat convection and conduction in the reservoir porous media.
ρ G C G u G T + q G = Q G q G = k G T
where ρG is the hydrate density, kg/m3; CG is the hydrate heat capacity, J/(kg·K); kG is the hydrate thermal conductivity, W/(m·K); uG is hydrate velocity, m/s; qG is the heat flux by conduction, W/m2; QG is the external heat source for hydrate, W/m3; Di is the diffusion coefficient of injected fluid molecules in porous media, m2/s.
The equations presented describe the heat transfer process in hydrate reservoirs. This set of equations is used to analyze the temporal and spatial distribution of the temperature field in hydrate reservoirs. In the first line equation (energy equation), the term ρ G C G u G T incorporates heat transfer (convective term) resulting from hydrate movement. The term q G accounts for the heat change due to thermal conduction, QG is the external heat source for hydrate. The second line equation is Fourier’s law of heat conduction; this equation relates the heat flux vector qG to the temperature gradient ∇T. By substituting Fourier’s law into the energy equation, a hydrate-reservoir heat transfer governing equation that incorporates convection, conduction, and heat sources can be derived.
  • Mass conservation equation
The mass conservation equation governs Stage 1 aqueous-phase solute concentration distribution and porous-media reactions. The convection dispersion equation is formulated based on Fick’s law Equation (4), where c represents the volume concentration (mol/m3) of the heat generation system in the liquid phase; Vc represents the convective flow velocity (m/s); Di represents the diffusion coefficient (m2/s) of self-heat fluid molecules in porous media; and Ri refers to the chemical reaction rate (mol/(m3·s)). Detailed parameters’ meanings are shown in Table 2.
c i t + ( D i c i + c i V c ) = R i
where c is the volume concentration of the heat generation system in the liquid phase, mol/m3; Vc represents the convective flow velocity, m/s; Di refers to the diffusion coefficient of self-heat fluid molecules in porous media, m2/s; and Ri is the chemical reaction rate, mol/(m3·s).
The equation presented describes the mass transfer process of chemical fluid i (chemical reagent fluid) in hydrate reservoirs. It is in the form of a convection–diffusion–reaction equation. This equation comprehensively integrates diffusive, advective, and source/sink effects, serving as a governing equation for analyzing coupled mass transfer and multi-phase flow in hydrate-bearing reservoirs.
The term c i t represents the local rate of change in the concentration ci of fluid i. The divergence term ( D i c i + c i V c ) characterizes the total mass flux of fluid i; D i c i denotes the diffusive flux driven by concentration gradients, and c i V c represents the advective flux induced by the bulk flow of the fluid phase. The term Ri is the source/sink term, which accounts for the mass production or consumption of fluid i due to hydrate dissociation within the reservoir.
As shown in Equations (2)–(4) and Table 2, the momentum conservation constitutive parameters encompass thermally generated fluid density, viscosity, and volumetric flux during Stage 1 operational dynamics. The heat transfer equation incorporates hydrate properties including specific heat capacity and thermal conductivity. Equation (5) dynamically characterizes real-time water saturation determination through its porosity–saturation correlation [40,41].
S w _ 1 = c w 5.75 M w ρ w ϕ
where Sw_1 is the instantaneous water saturation; cw is the hydrate water (5.75·H2O) concentration; Mw is water molar mass, g/mol; ρw is water density, g/cm3; φ is porosity. By combing the instantaneous water saturation with the initial water saturation (Swi), the water saturation during the hydrate dissociation process can be calculated using Equation (6).
Δ S w = S w _ 1 S w i
R s = Δ S g h Δ S w = Δ c g h Δ c w M g h ρ g h φ 5.75 M w ρ w φ
S g h _ 1 = S g h i R s Δ S w
where ∆Sw in Equation (6) is the decomposed water saturation involved in Stage 1. The instantaneous hydrate saturation can be calculated based on Equations (7) and (8). Rs is the ratio of hydrate saturation to the decomposed water saturation involved in Stage 1; subscript gh represents the hydrate while w refers to the water. Mgh is molar mass of hydrate, which equals to 119.5 g/mol. Symbol represents the difference in the water or hydrate phase involved in Stage 1. Sghi refers to the initial hydrate saturation. ∆Sgh quantifies hydrate saturation differential throughout its dissociation dynamics. Sgh_1 is the instantaneous hydrate saturation in the porous media.

2.5. Model of Non-Reactive Flow Stage (Stage 2)

In Stage 2, the decomposition–water saturation results obtained from Stage 1 are used to describe the decomposition–water mass increment via Darcy’s law, and the iterative evolution of the mass increment is triggered based on the temperature field’s phase transition due to temperature differences. During the iterative calculation of decomposition–water saturation, by tracking the real-time temperature’s contour map, the corresponding hydrate temperature map evolution values can be derived. This enables the quantification and analysis of hydrate saturation changes through the temperature field mapping of hydrate areas.
The thermodynamic evolution during Stage 2 is quantitatively determined through continuous monitoring of phase transition temperatures and corresponding latent heat fluxes within the sedimentary porous media. The momentum conservation framework for this stage is mathematically expressed by Equation (9), with initial boundary conditions defined in Table 3. This formulation is derived from Darcy’s law, incorporating two principal parameters: (1) the intrinsic permeability of the reservoir, and (2) the average linear velocity of the aqueous phase at the end of Stage 1. The heat transfer equation maintains continuity with the Stage 1 model Equation (3). Critical parameters of Equation (3) include phase change latent heat, the prescribed temperature differential of 1 K for phase transition, and other thermophysical properties.
  • Momentum conservation equation
( ρ w u w ) = Q m u w = k por μ w ( ρ w ) Q m = S w _ s t e p 2 ϕ ( ρ G ρ w ) S w t S w _ s t e p 2 = S w _ r e s + ( 1 S w _ r e s ) F F = 1 T T p c 0 T < T p c
where ρw is the water dynamic density, kg/m3; uw is water velocity, m/s; Qm is the water mass increase due to hydrate phase change, W/m3; μw is the water dynamic viscosity, Pa·s.

2.6. Boundary Condition and Key Parameters Descriptions

2.6.1. Boundary Condition Description

Stage 1: The boundary conditions for Stage 1 are detailed as follows. At AC inlet boundary, the initial chemical reagent fluid concentration is defined as 2000 mol/m3, while the volume flow rate is 0.19 m/s. This boundary condition is used to define the initial concentration and injection velocity of reactants to provide the primary driving condition for reactant transport in the mass and flow fields, coupled calculations with the energy field, thereby simulating the dynamic process of reactant migration from the injection point into the reservoir interior. The injection velocity of the chemical reagent is 0 at reservoir upper and lower boundaries (AB and CD shown in Figure 1). In addition, AB and CD serve as isothermal flow boundaries so as to provide stable thermodynamic constraints for the energy field, preventing solution divergence caused by fluctuating thermal boundary conditions, particularly in temperature-sensitive processes such as hydrate phase transitions. In addition, the initial chemical reagent fluid concentration in the reservoir is 0 mol/m3 since the reservoir is initially free of reactive components. The reservoir initial temperature is set to 286.2 K (13 °C) to reflect the ambient reservoir conditions prior to fluid injection (Table 4).
Stage 2: The boundary conditions for Stage 2 are outlined below. A pressure of 20 MPa is applied at the AC boundary for chemical reagent injection while the outlet pressure is set at BD boundary with 5 MPa. The pressure gradient drives the chemical reagent flow in the reservoir, serving as the dynamic basis for coupling the energy and flow fields. The AC boundary temperature is set as the average reservoir temperature at the end of Stage 1, ensuring continuity with the initial reservoir temperature at the start of Stage 2. BD is the outlet boundary of porous heat conduction. AB and CD are isothermal flow boundaries. The initial hydrate temperature is set as 278.7 K (5.6 °C).

2.6.2. Key Parameters Description

(1)
The explanation for the heat capacity
The hydrate heat capacity corresponds to the fluid-phase heat capacity in Stage 2, matching its value during the exothermic reaction period (Stage 1), while differing from the value of liquid water. The reason is as follows.
In the thermal decomposition process of hydrate reservoirs, the governing equations describe the critical state where hydrates transform into liquid water. At this critical state, hydrates remain the dominant component, with heat primarily consumed for temperature changes and latent heat absorption during phase transition. Since the equations focus on the critical transition stage, the thermal properties of hydrates dominate the system’s energy balance. Hence, adopting the specific heat capacity of hydrates accurately characterizes the thermal properties under this critical condition, ensuring that the governing equations provide a relatively precise simulation of the hydrate dissociation process.
(2)
The explanation for the velocity of reagent and water
The macroscopic heat transport of the working fluid in porous media is primarily considered during Stage 1, so the macroscopic average flow velocity across the porous media’s cross-sectional area (0.19 m/s) has been adopted. In Stage 2, the influence of reservoir properties on flow is mainly considered. To ensure that the selection of velocity parameters in the temperature field control equation matches the physical mechanisms described by Darcy’s law, the Darcy velocity (average 1.96 × 10⁻⁸ m/s) has been used to define the water flow velocity describing the physical process of fluid seepage and heat transfer during the hydrate–water phase transition.
(3)
Phase transition latent heat
Phase transition latent heat (Lpc) refers to the energy absorbed during hydrate-to-water phase transformation at constant temperature. In this study (Table 3), Lpc adopts the value from reference [42], which is a validated thermodynamic parameter for methane hydrate decomposition. This reference is specifically selected because of the following: (1) It addresses similar engineering scenarios involving wellbore temperature gradients and hydrate decomposition fronts, and both studies focus on near-wellbore heat transfer during hydrate dissociation. (2) The analytical solutions of this reference’s thermal field model have been verified through numerical solutions.

2.7. Mesh Configuration, Convergence Criteria and Solver Settings

Using COMSOL’s automatic grid creation function to execute grid refinement for Stages 1 and 2. Resultant datasets (such as post-Stage 1 reservoir temperature) embedded as initialization parameters in the equation formulation of Stage 2. The simulation solver settings and mesh design are introduced as follows.

2.7.1. Convergence Criteria

For both Stages 1 and 2, the termination condition for iterative calculations is that the relative tolerance for calculations is maintained at 1 × 10⁻⁴. The maximum number of iterations is limited to 200.

2.7.2. Solver Settings

Stage 1: Steady-state computational solver is employed for Stage 1 equilibrium analysis. For solver selection in parameter solving, the MUMPS (Multi-frontal Massively Parallel sparse direct Solver) solver is used to solve the pressure, while the PARDISCO (Parallel Direct Sparse Solver Interface) is employed for solving fluid flow variables, concentration, and heat transfer variables.
Stage 2: Steady-state computational solver and transient solver are employed in Stage 2. In the transient solver settings, the implicit solution method using Backward Differentiation Formulas (BDF) is employed. To ensure the solver strictly adheres to the requested output time steps and selects appropriate step sizes, minimizing numerical differences in the solved variables and improving solution stability, the transient solver uses the “strict” step size selection level instead of intermediate. For solving parameters, the MUMPS solver is used to solve pressure and temperature.

2.7.3. Mesh Configuration

Mesh configuration is shown in the validation part (Section 3.5), which represents the basic case numbered Test 1-1 in Table 5. Mesh design details will be introduced in that section where multiple grid refinement conditions are compared with each other.

3. Results and Discussions

3.1. Base Case

3.1.1. Reactive Chemical Flow Stage (Stage 1)

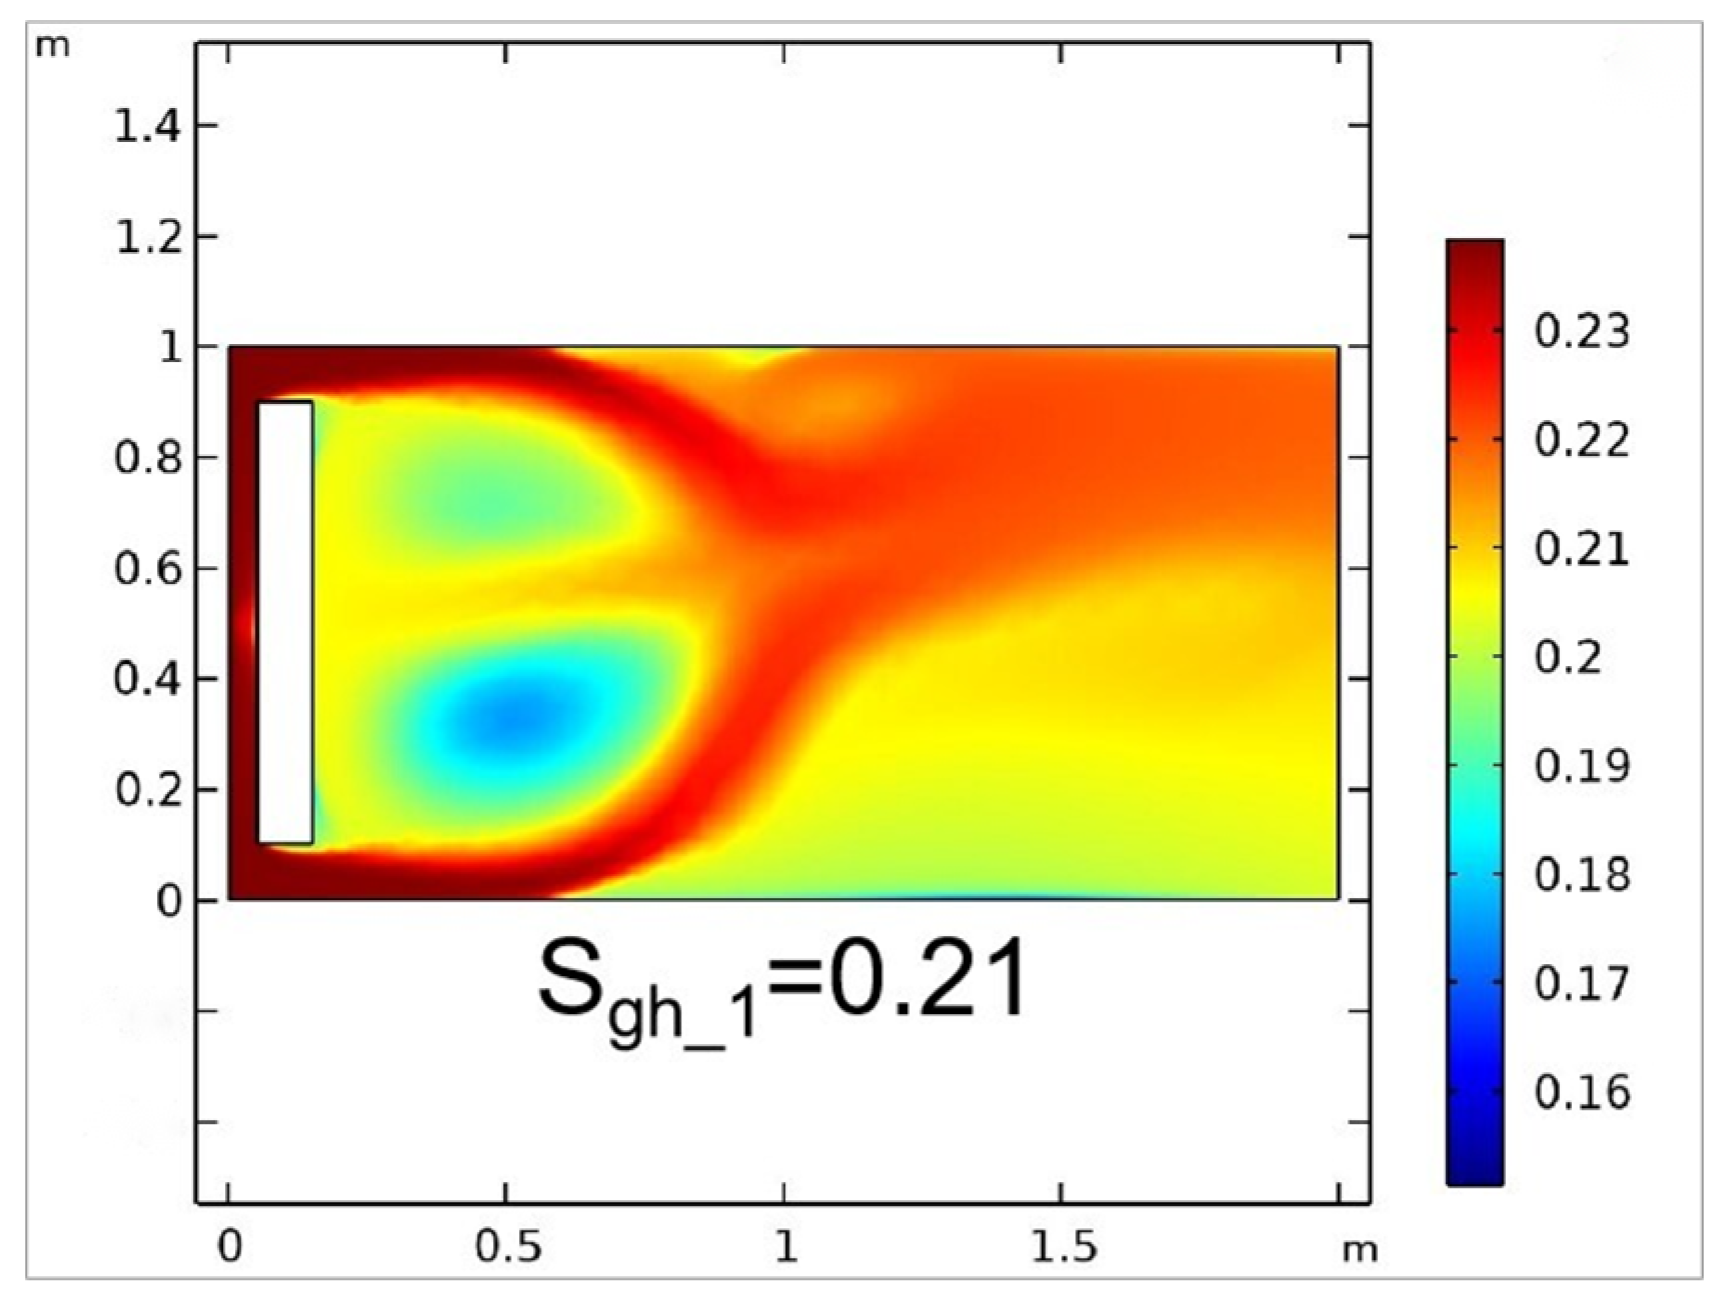
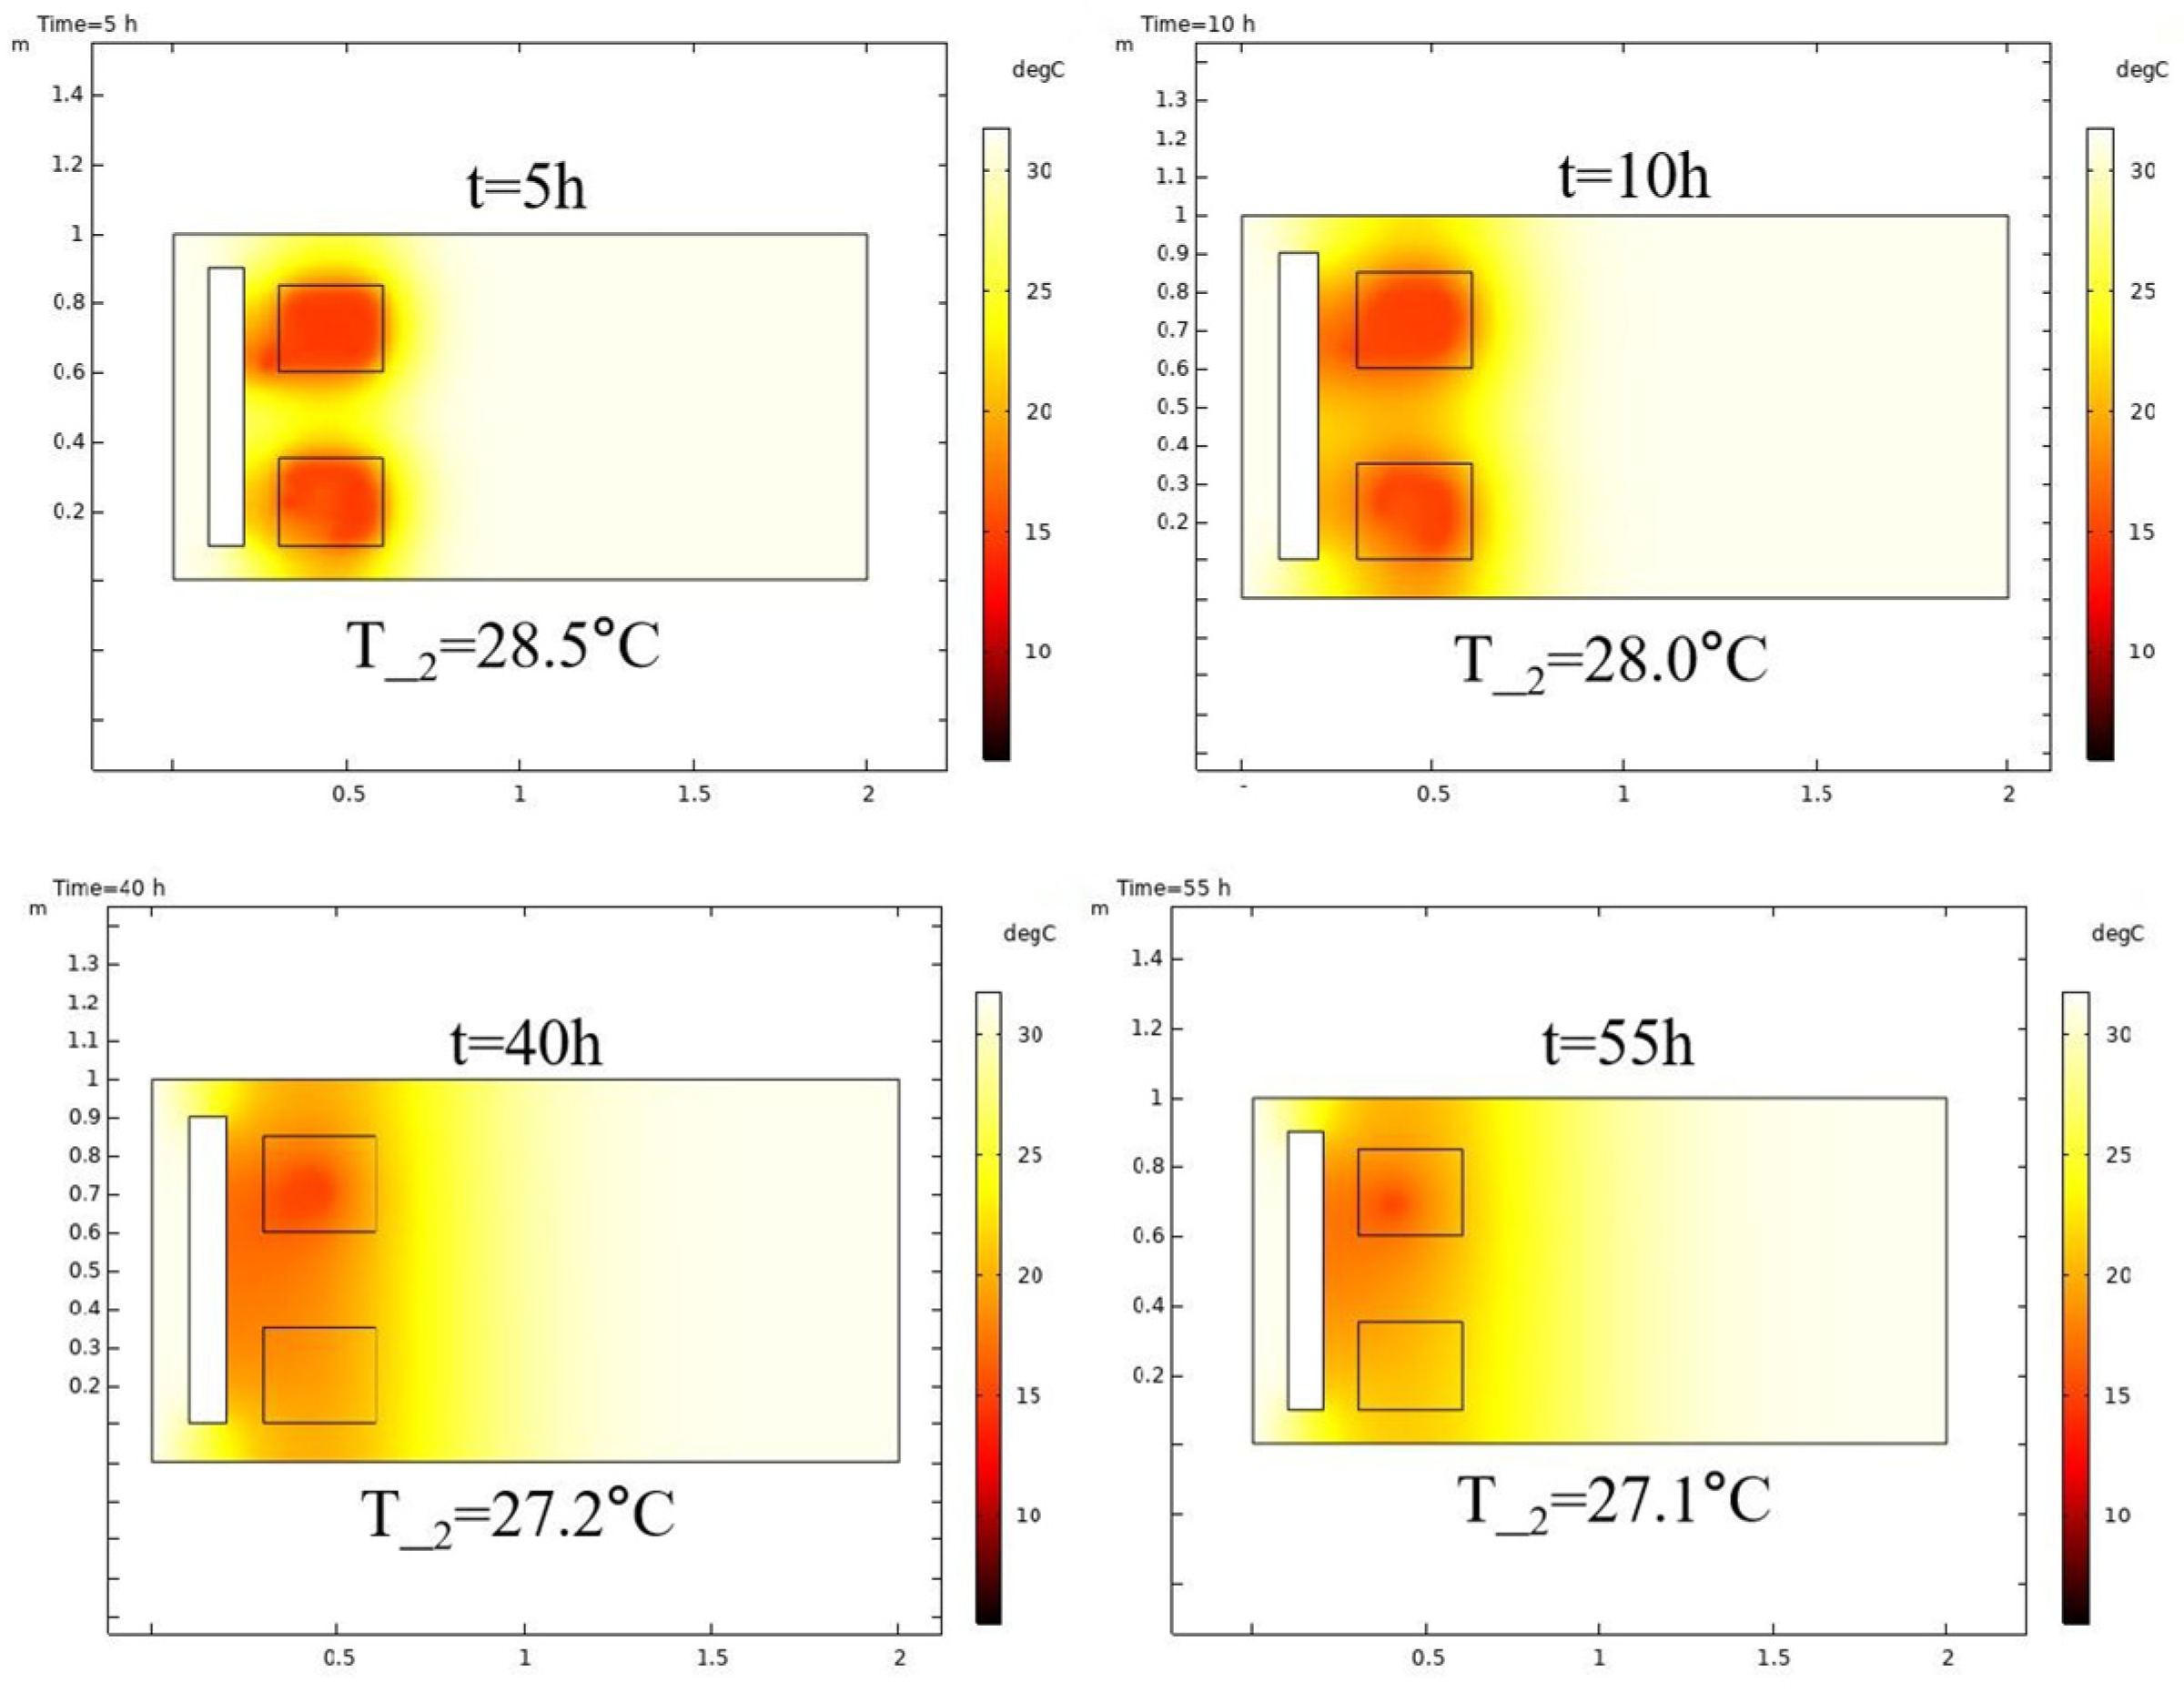
In Stage 1, simulation outputs comprise reservoir temperature and three-phase saturation within the marine sediment. Hydrate saturation declines as the average reservoir temperature rises throughout Stage 1. At the end of Stage 1, the final distribution of hydrate saturation and the average value (Sgh_1) are shown in Figure 2, average hydrate saturation within the reservoir declines from 0.40 to 0.21 (47.5% reduction) during Stage 1. The water saturation increases from 0.55 to 0.65, while the saturation of methane climbs from residual gas saturation of 0.05 to 0.14. Average reservoir temperature rises from initial 13.0 °C to 29.3 °C (T_2 in Figure 3).

3.1.2. Non-Reactive Flow Stage (Stage 2)

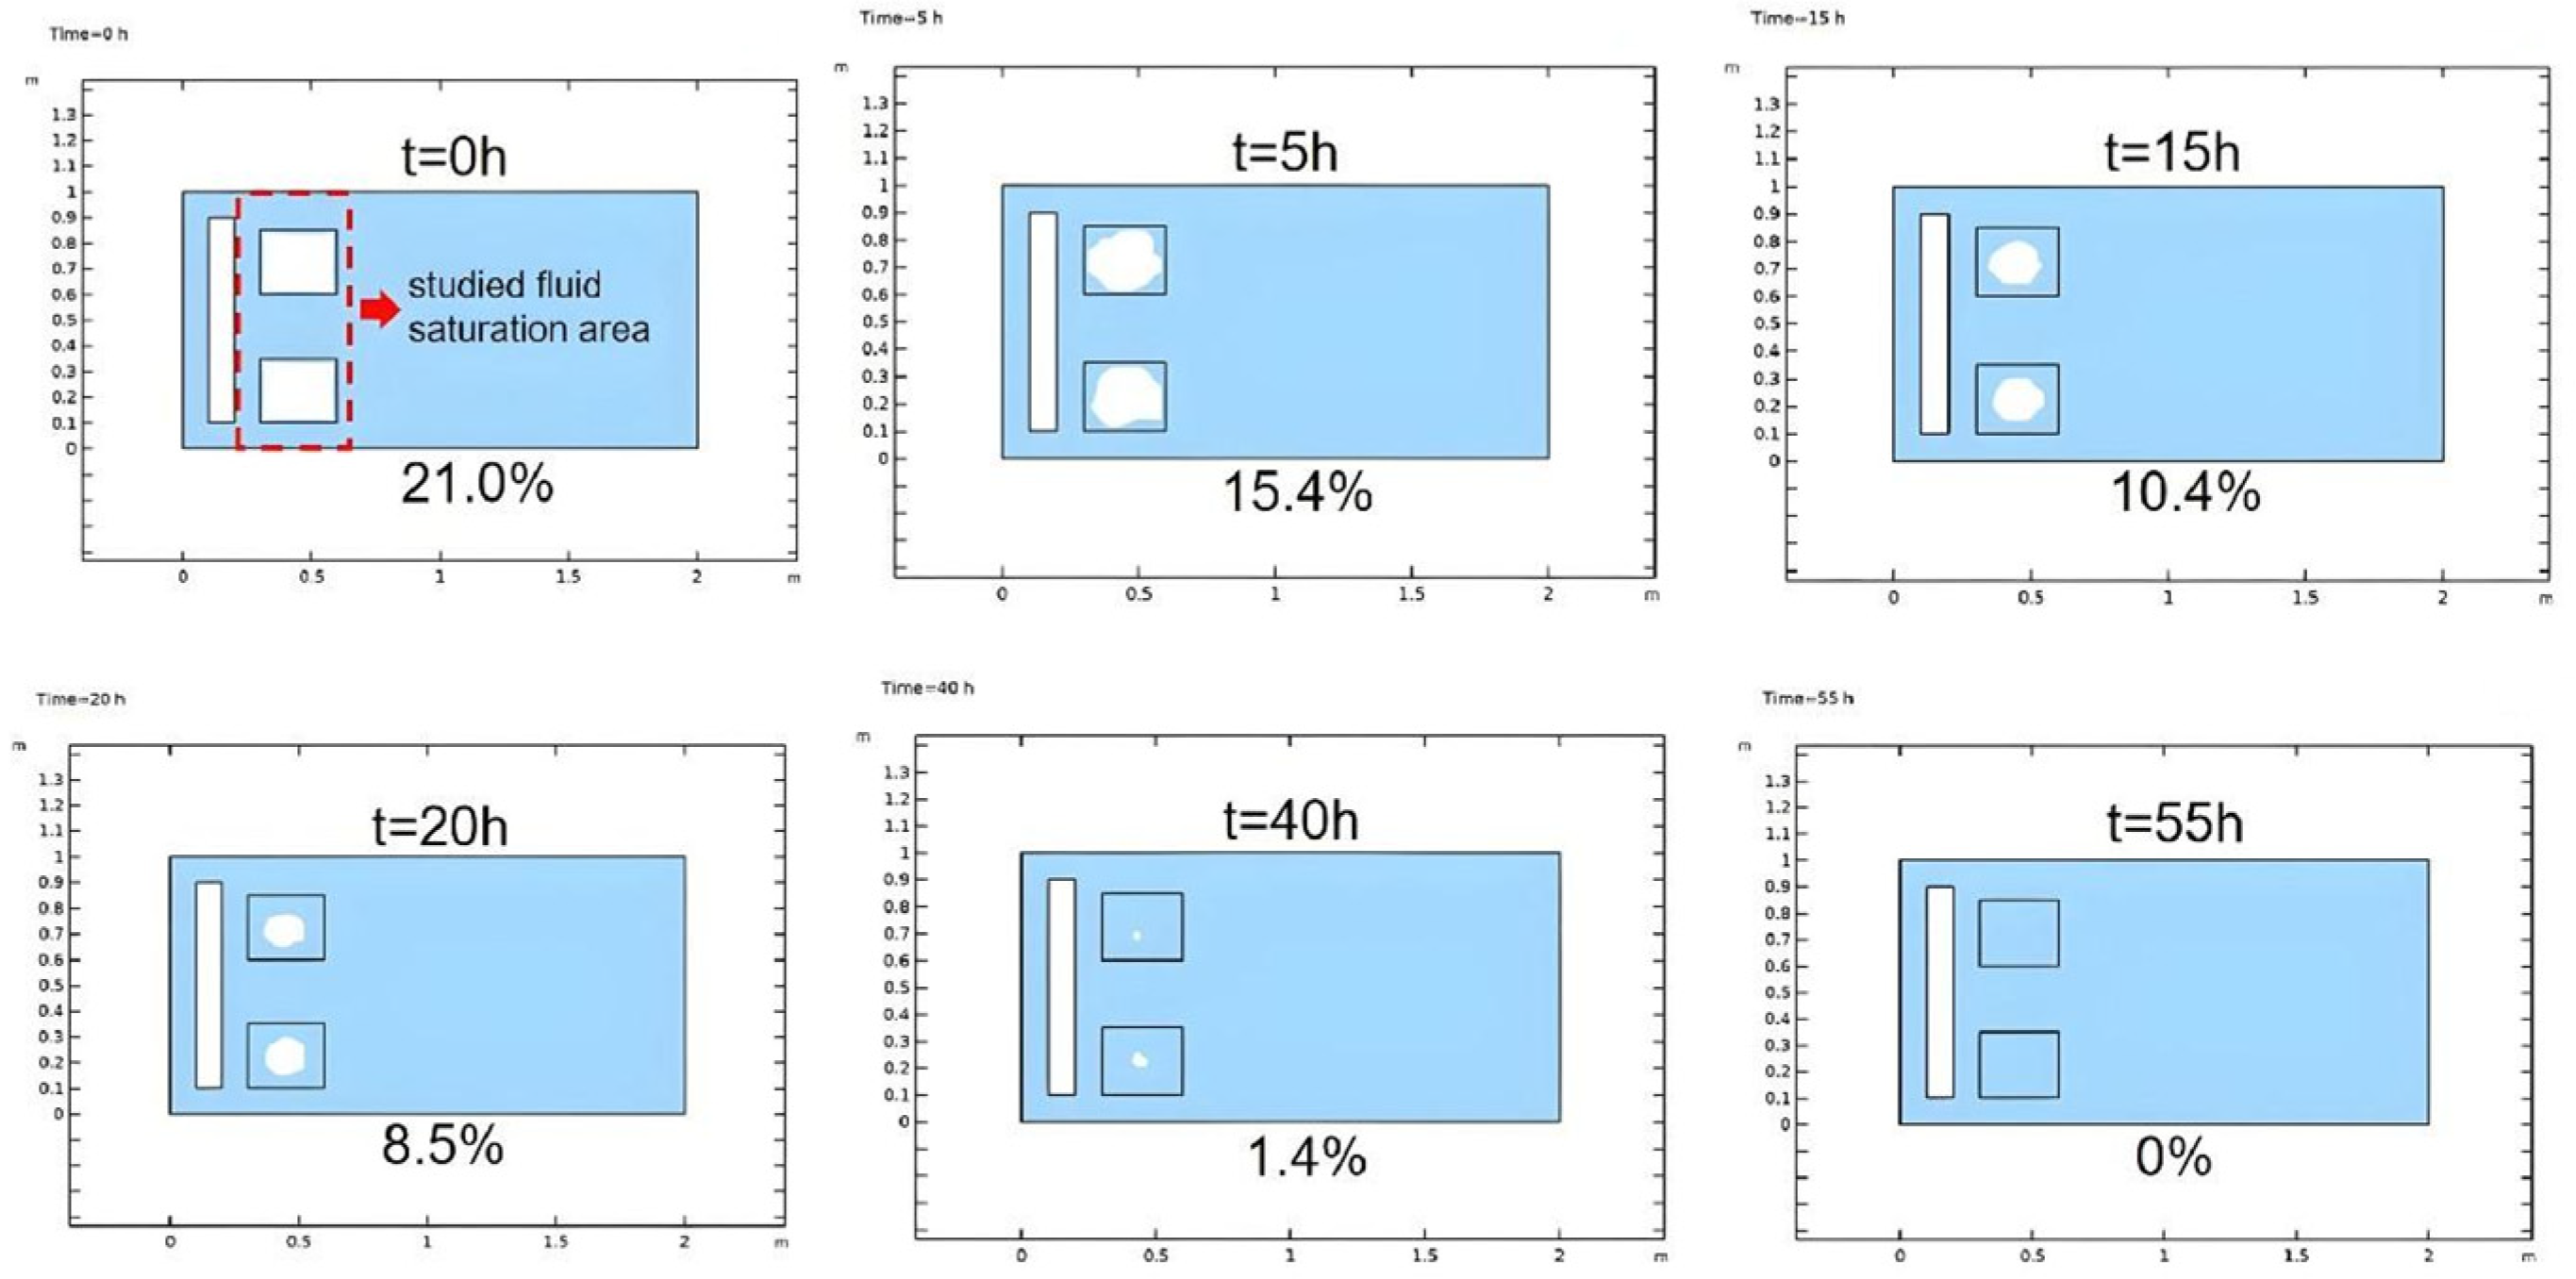
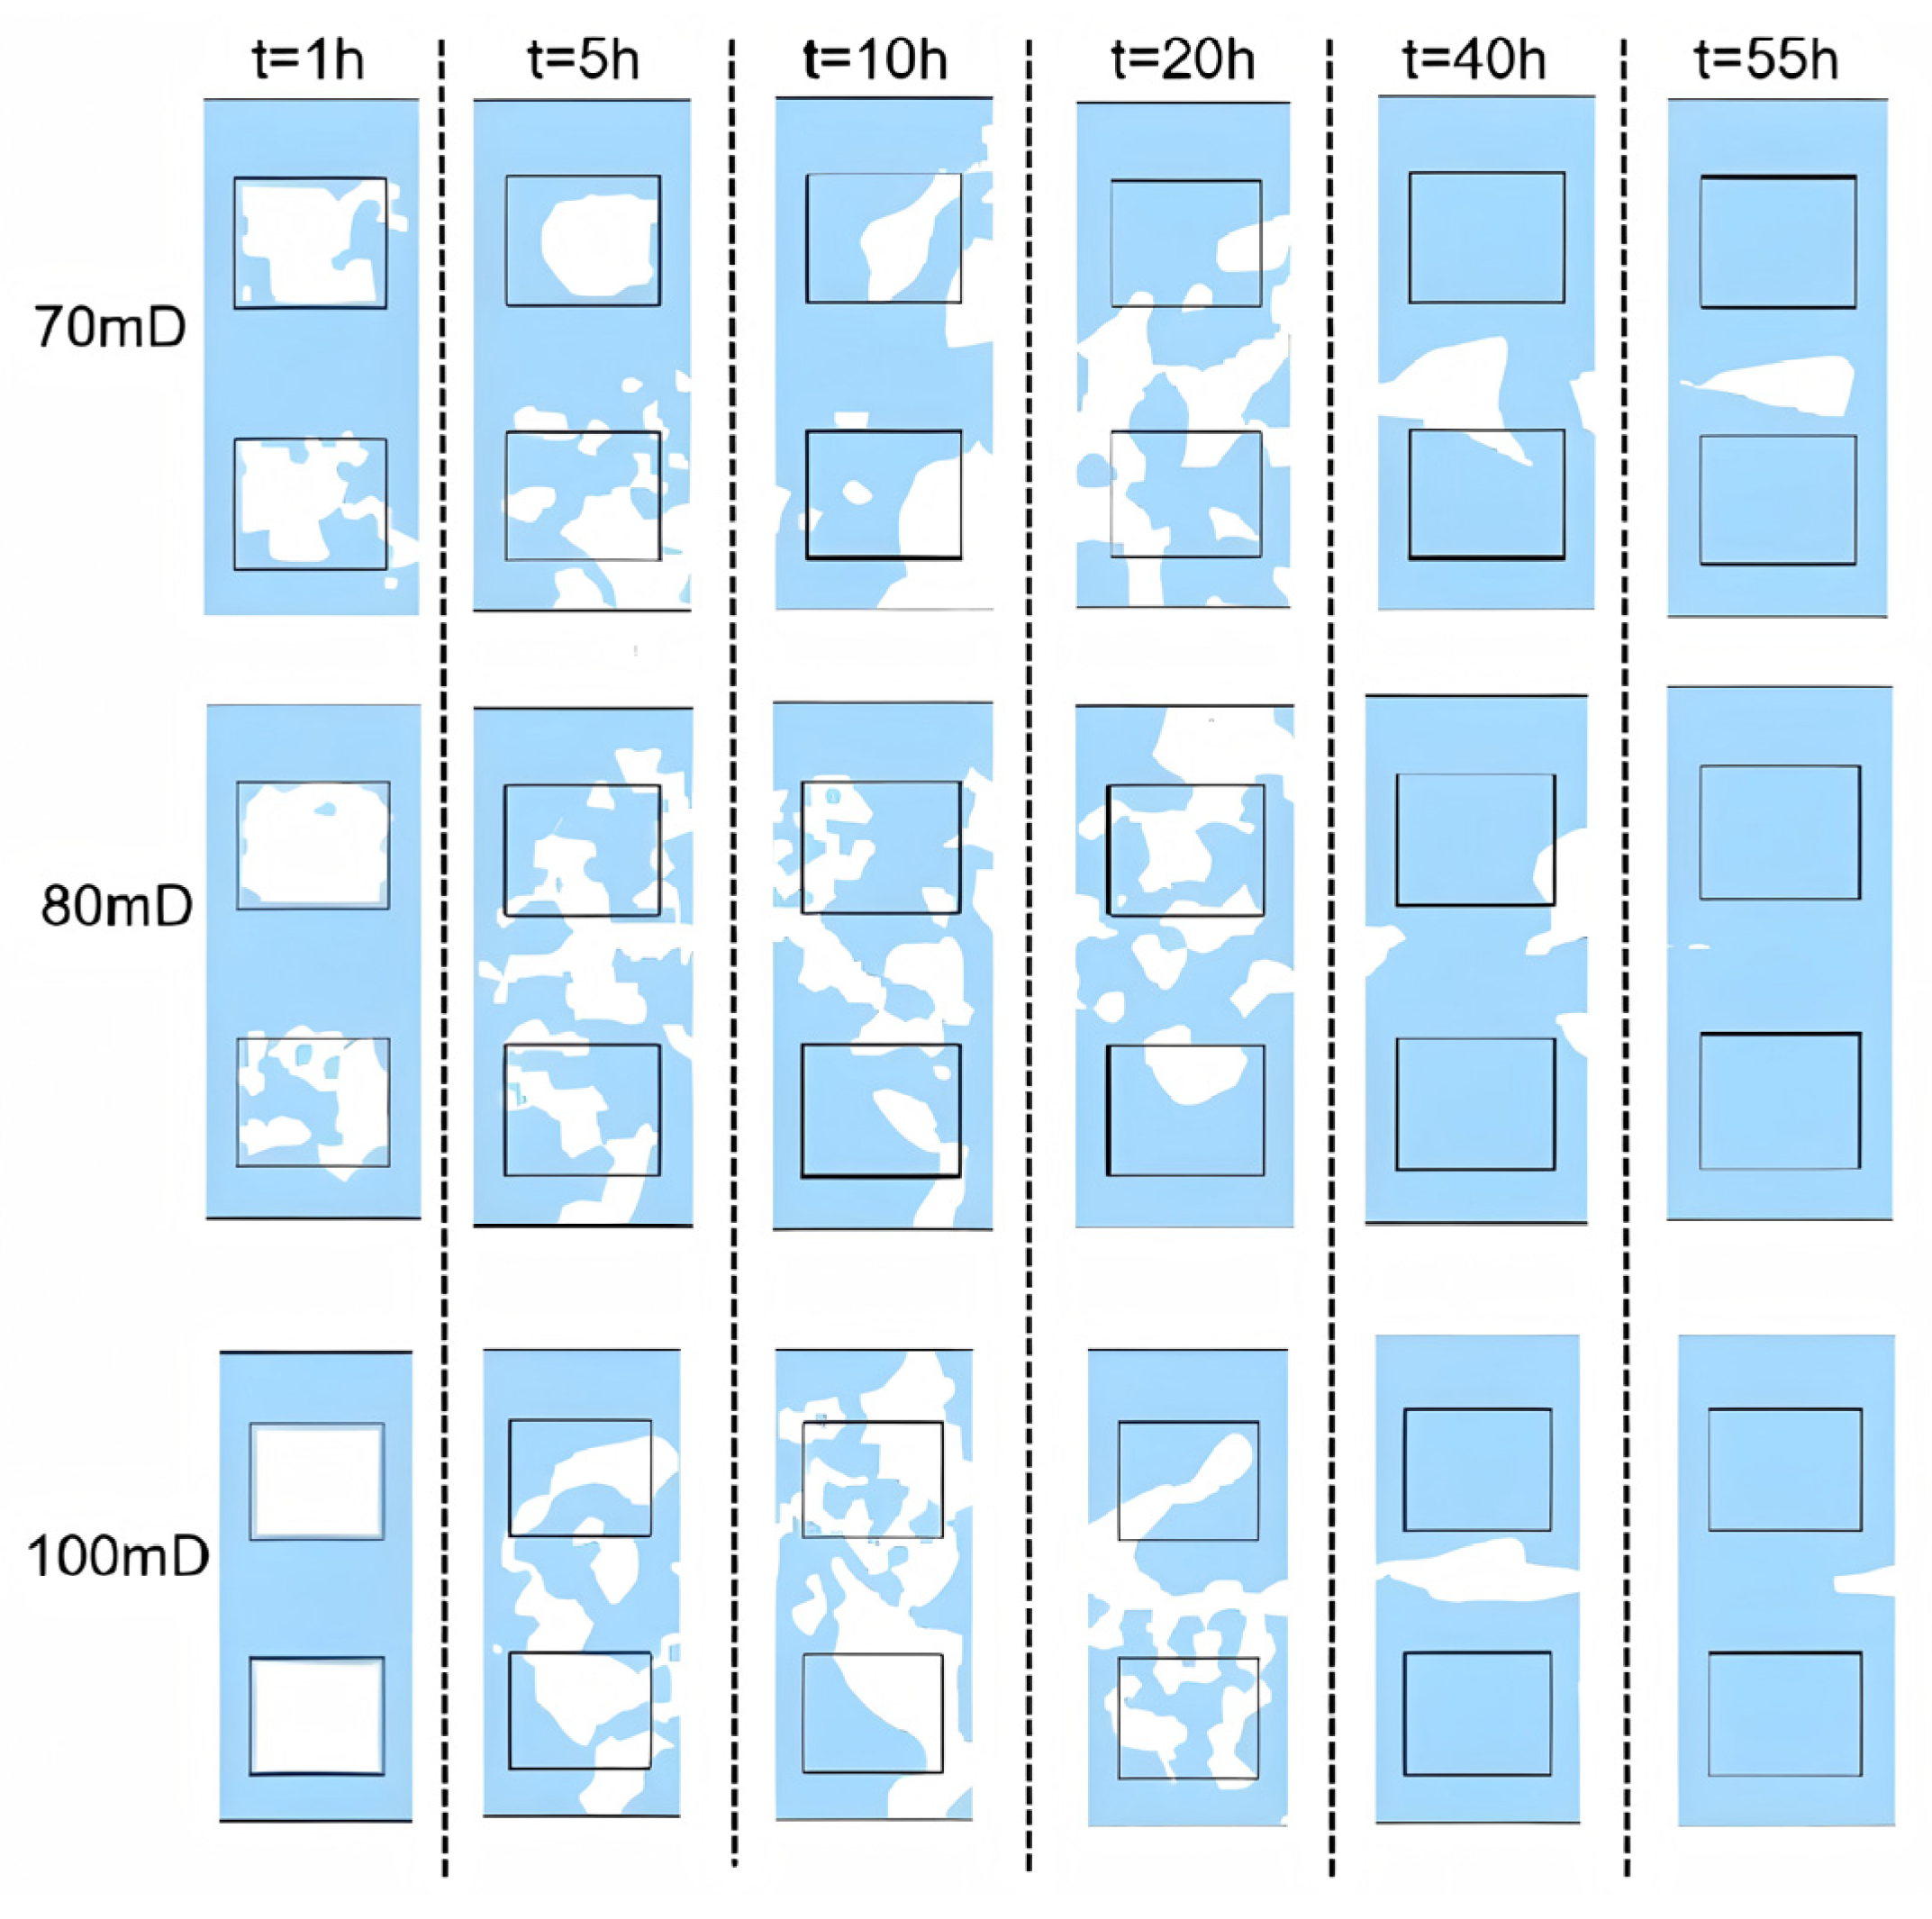
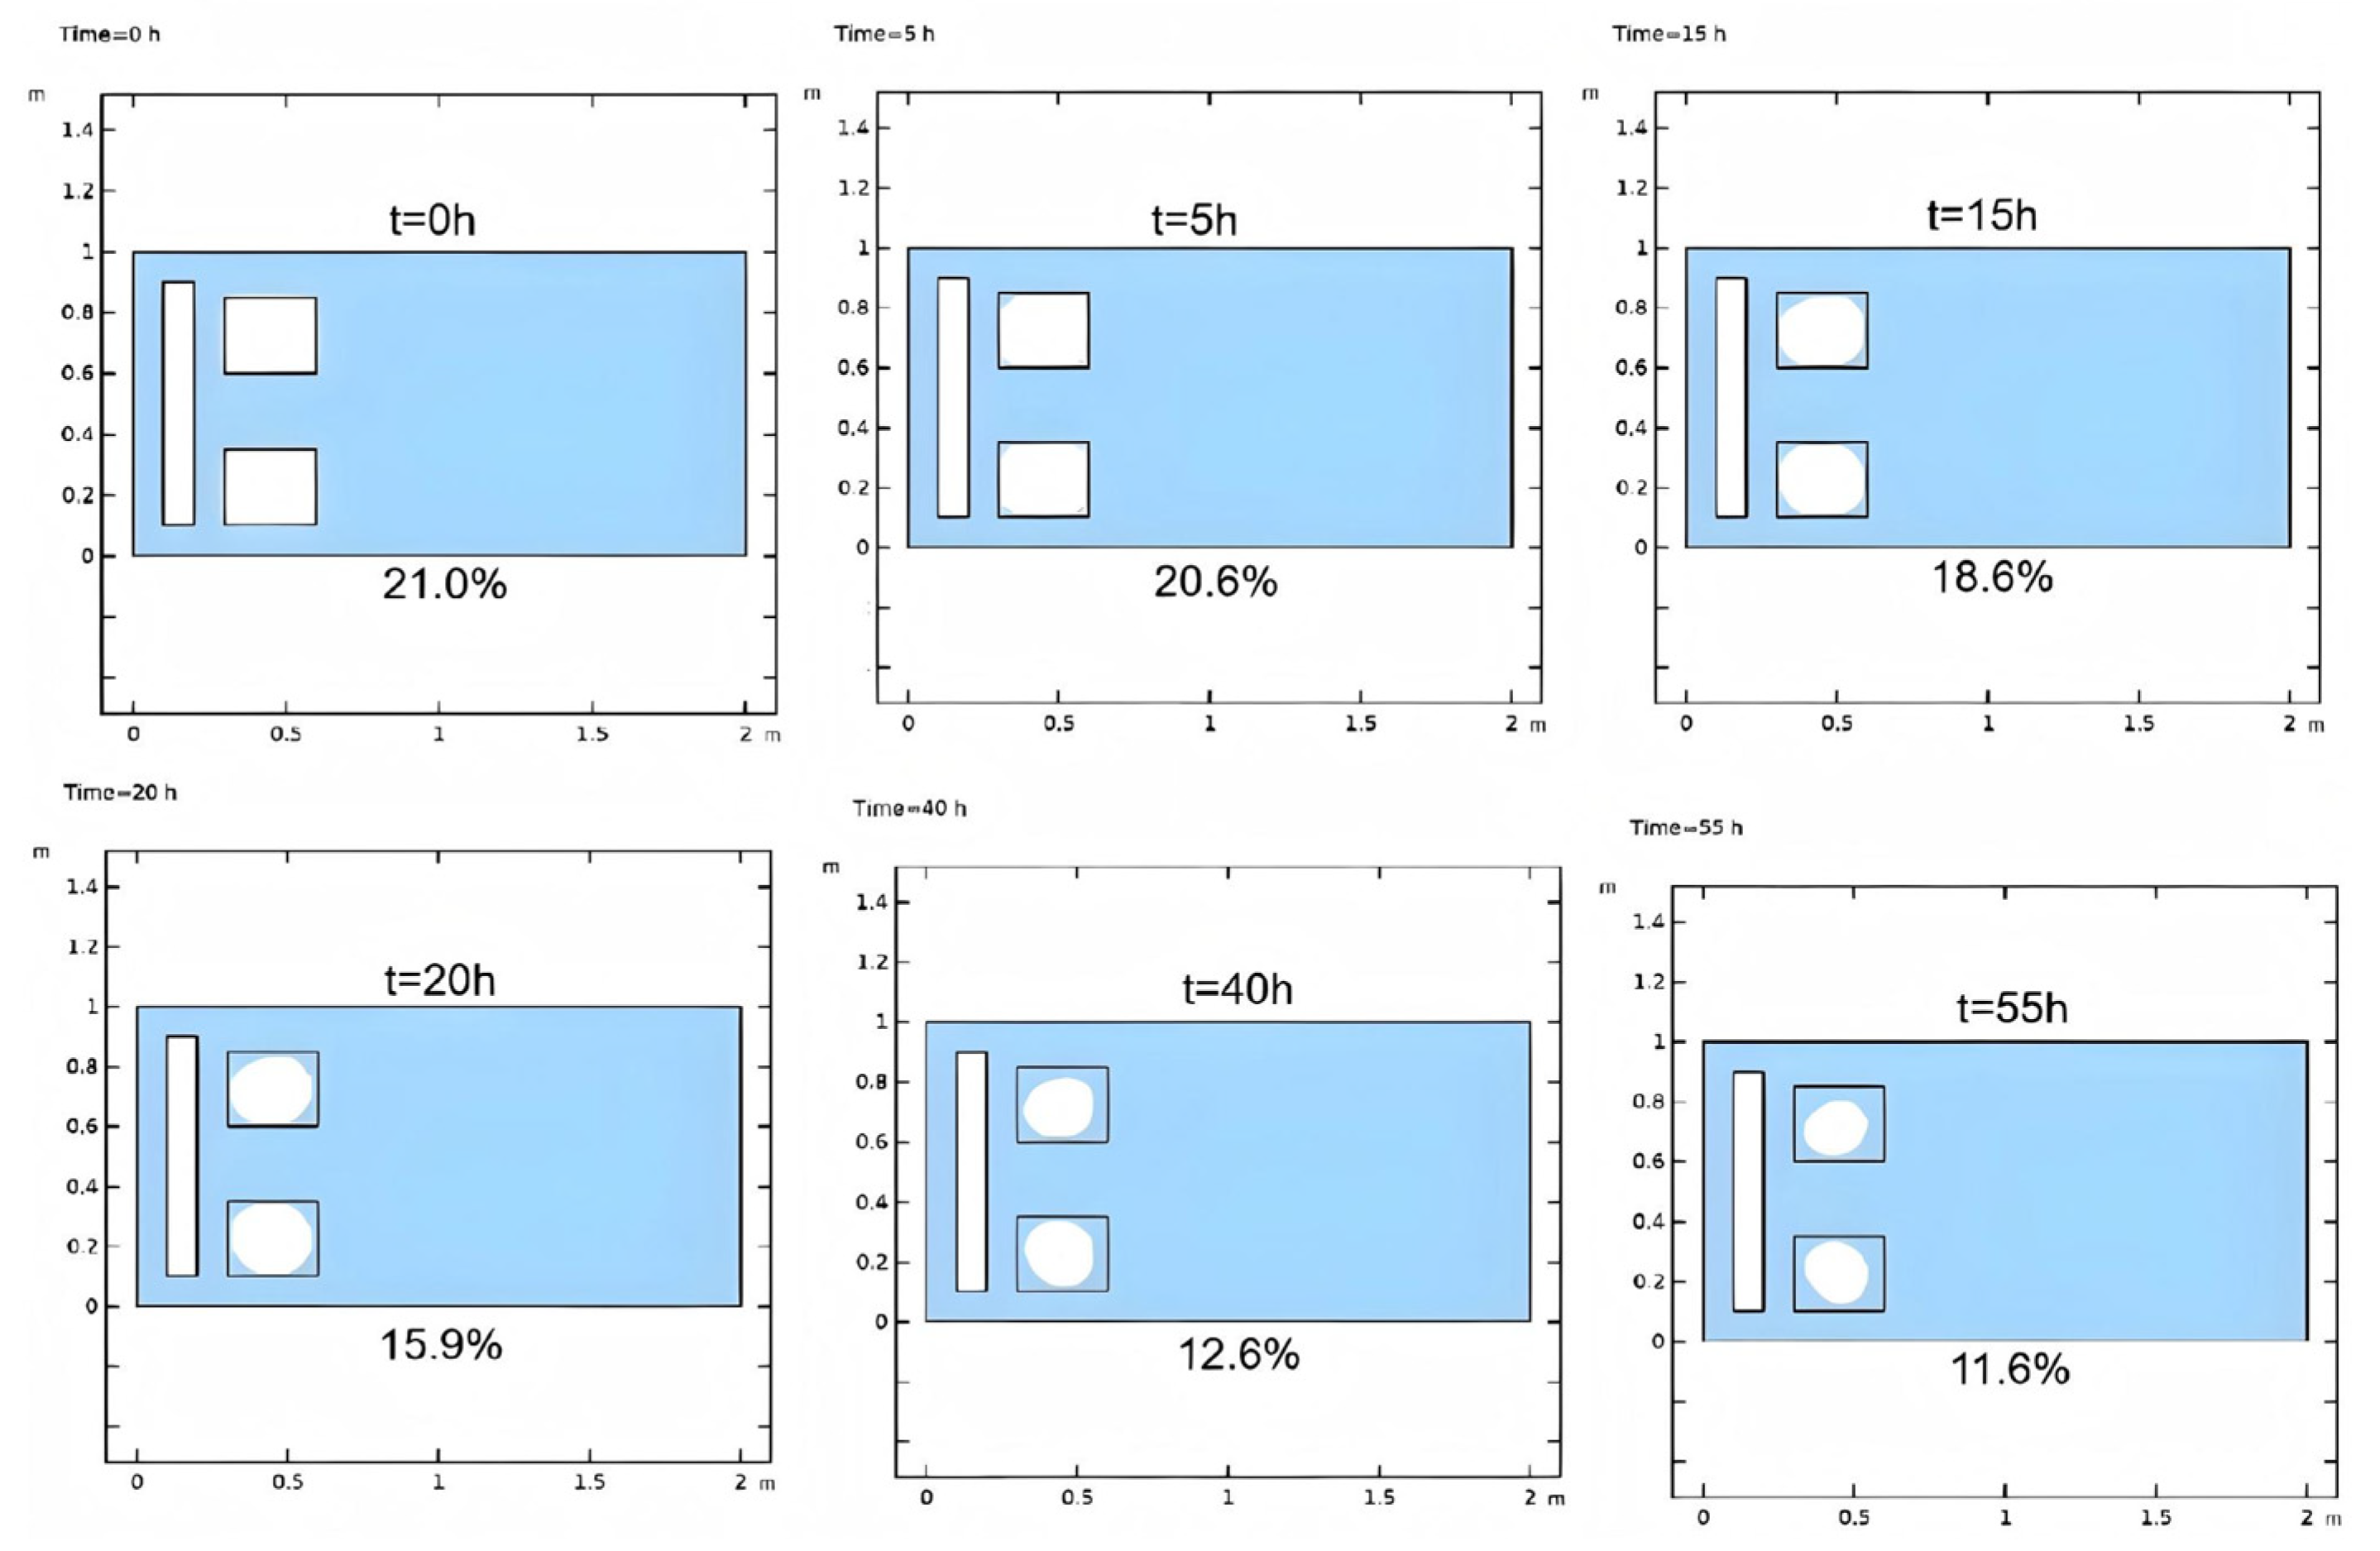
The initial temperature and saturation conditions for Stage 2 are inherited from Stage 1 simulation outputs. Hydrate saturation exhibits continuous decay throughout Stage 2 (Figure 4), indicating full dissociation of hydrates. Correspondingly, the reservoir average temperature decreases from 29.3 °C to 27.2 °C, demonstrating strong coupling with hydrate saturation dynamics. The fluid saturation study area is delineated by the red line zone in Figure 4 (t = 0), encompassing six saturation profiles specifically designed to monitor secondary hydrate formation near the wellbore. Within this domain, white areas visualize hydrate distribution, whereas blue color maps aqueous phase saturation. The white regions inside the boundary correspond to initial hydrate saturation, whereas peripheral white areas indicate secondary hydrate accumulation.
In Stage 1, the reservoir’s thermal behavior reveals that the coupled effect of fluid heat release and hydrate decomposition causes the rising average temperatures and declining hydrate saturation. During Stage 2, hydrate saturation follows an accelerated dissociation rate after 5 h compared to the 0–5 h period. This hydrate–water phase transition drives thermal absorption, resulting in slight temperature reduction.

3.2. Sensitivity Analysis

This section examines how initial absolute permeability (K) and injection modes affect hydrate saturation, reservoir temperature, and other related parameters. The sensitivity analysis indicates that, during Stage 2, both reservoir permeability and working fluid’s injection mode significantly impact hydrate saturation patterns, reservoir thermal profile, hydrate-zone conductivity, and hydrate surface endothermic flux. The detailed sensitivity analysis is articulated as follows.

3.2.1. Initial Absolute Permeability

Comparative analysis of nine reservoir permeability cases (1.5–100 mD) reveals negligible impacts of initial absolute permeability on hydrate saturation and reservoir temperature in Stage 1; Stage 2, however, demonstrates pronounced permeability control over hydrate saturation distribution and temperature patterns, as detailed in Section Non-Reactive Flow Stage (Stage 2).
  • Permeability Study: Non-Reactive Flow Stage (Stage 2)
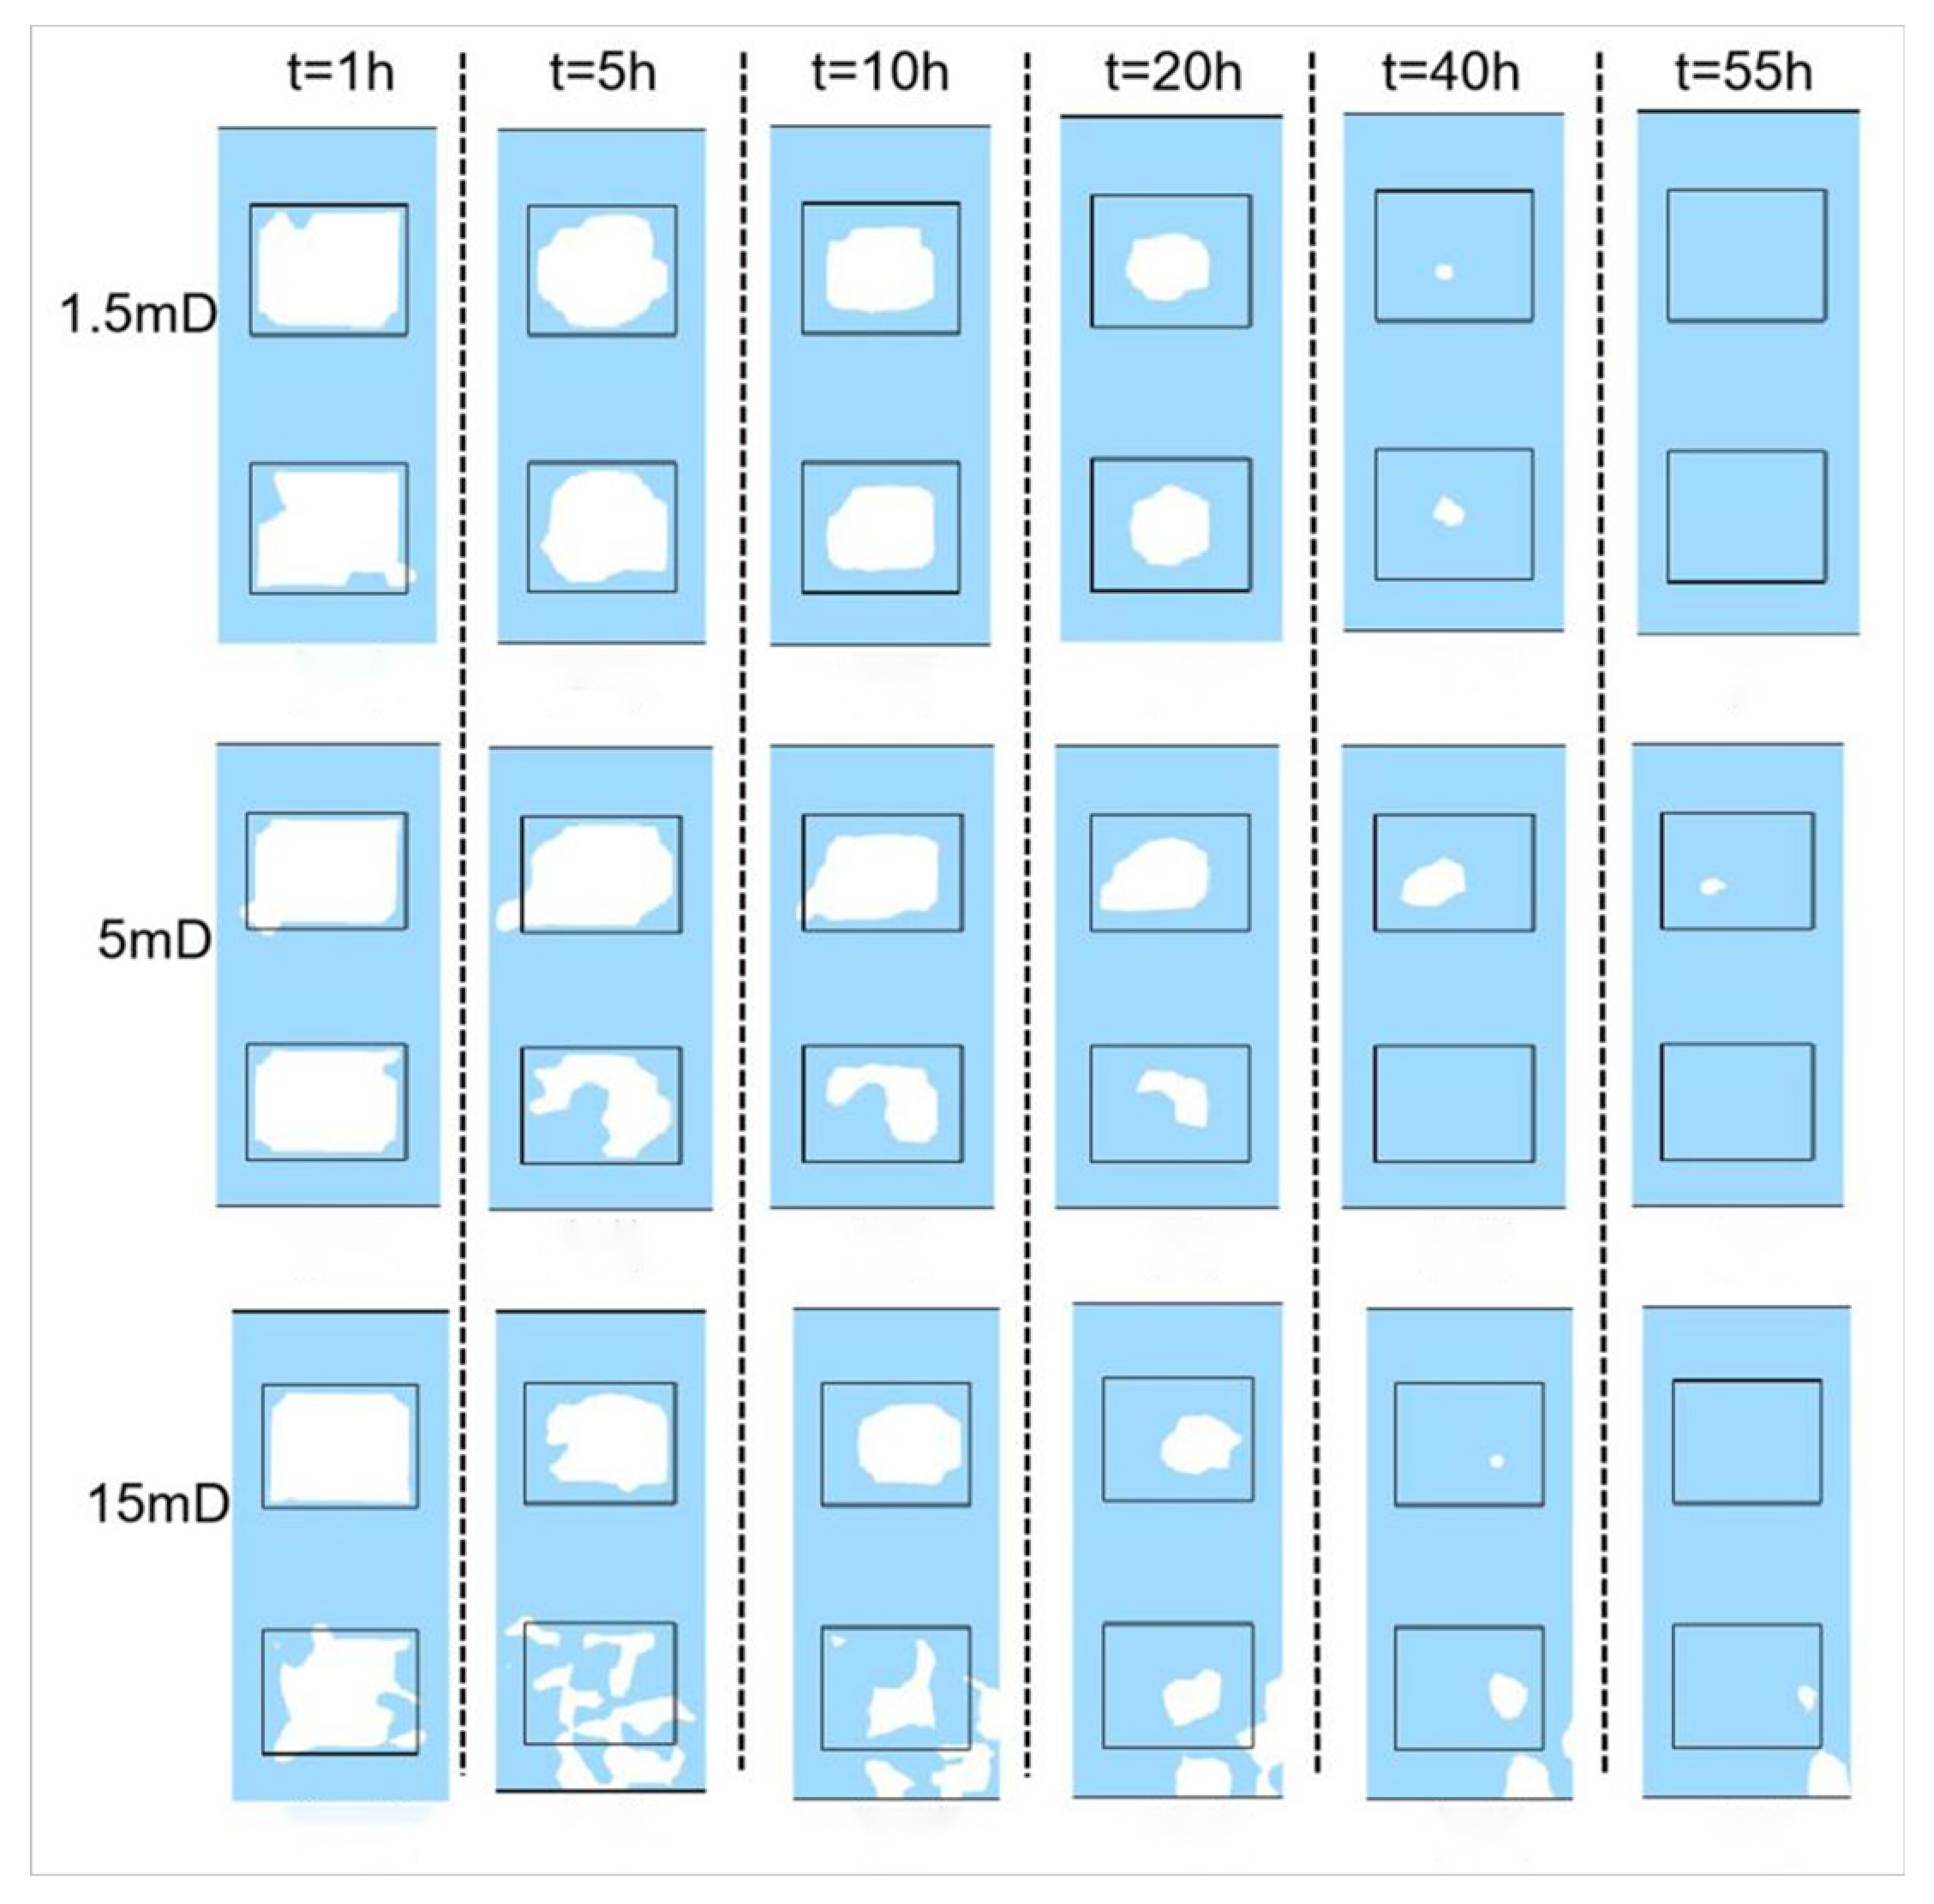
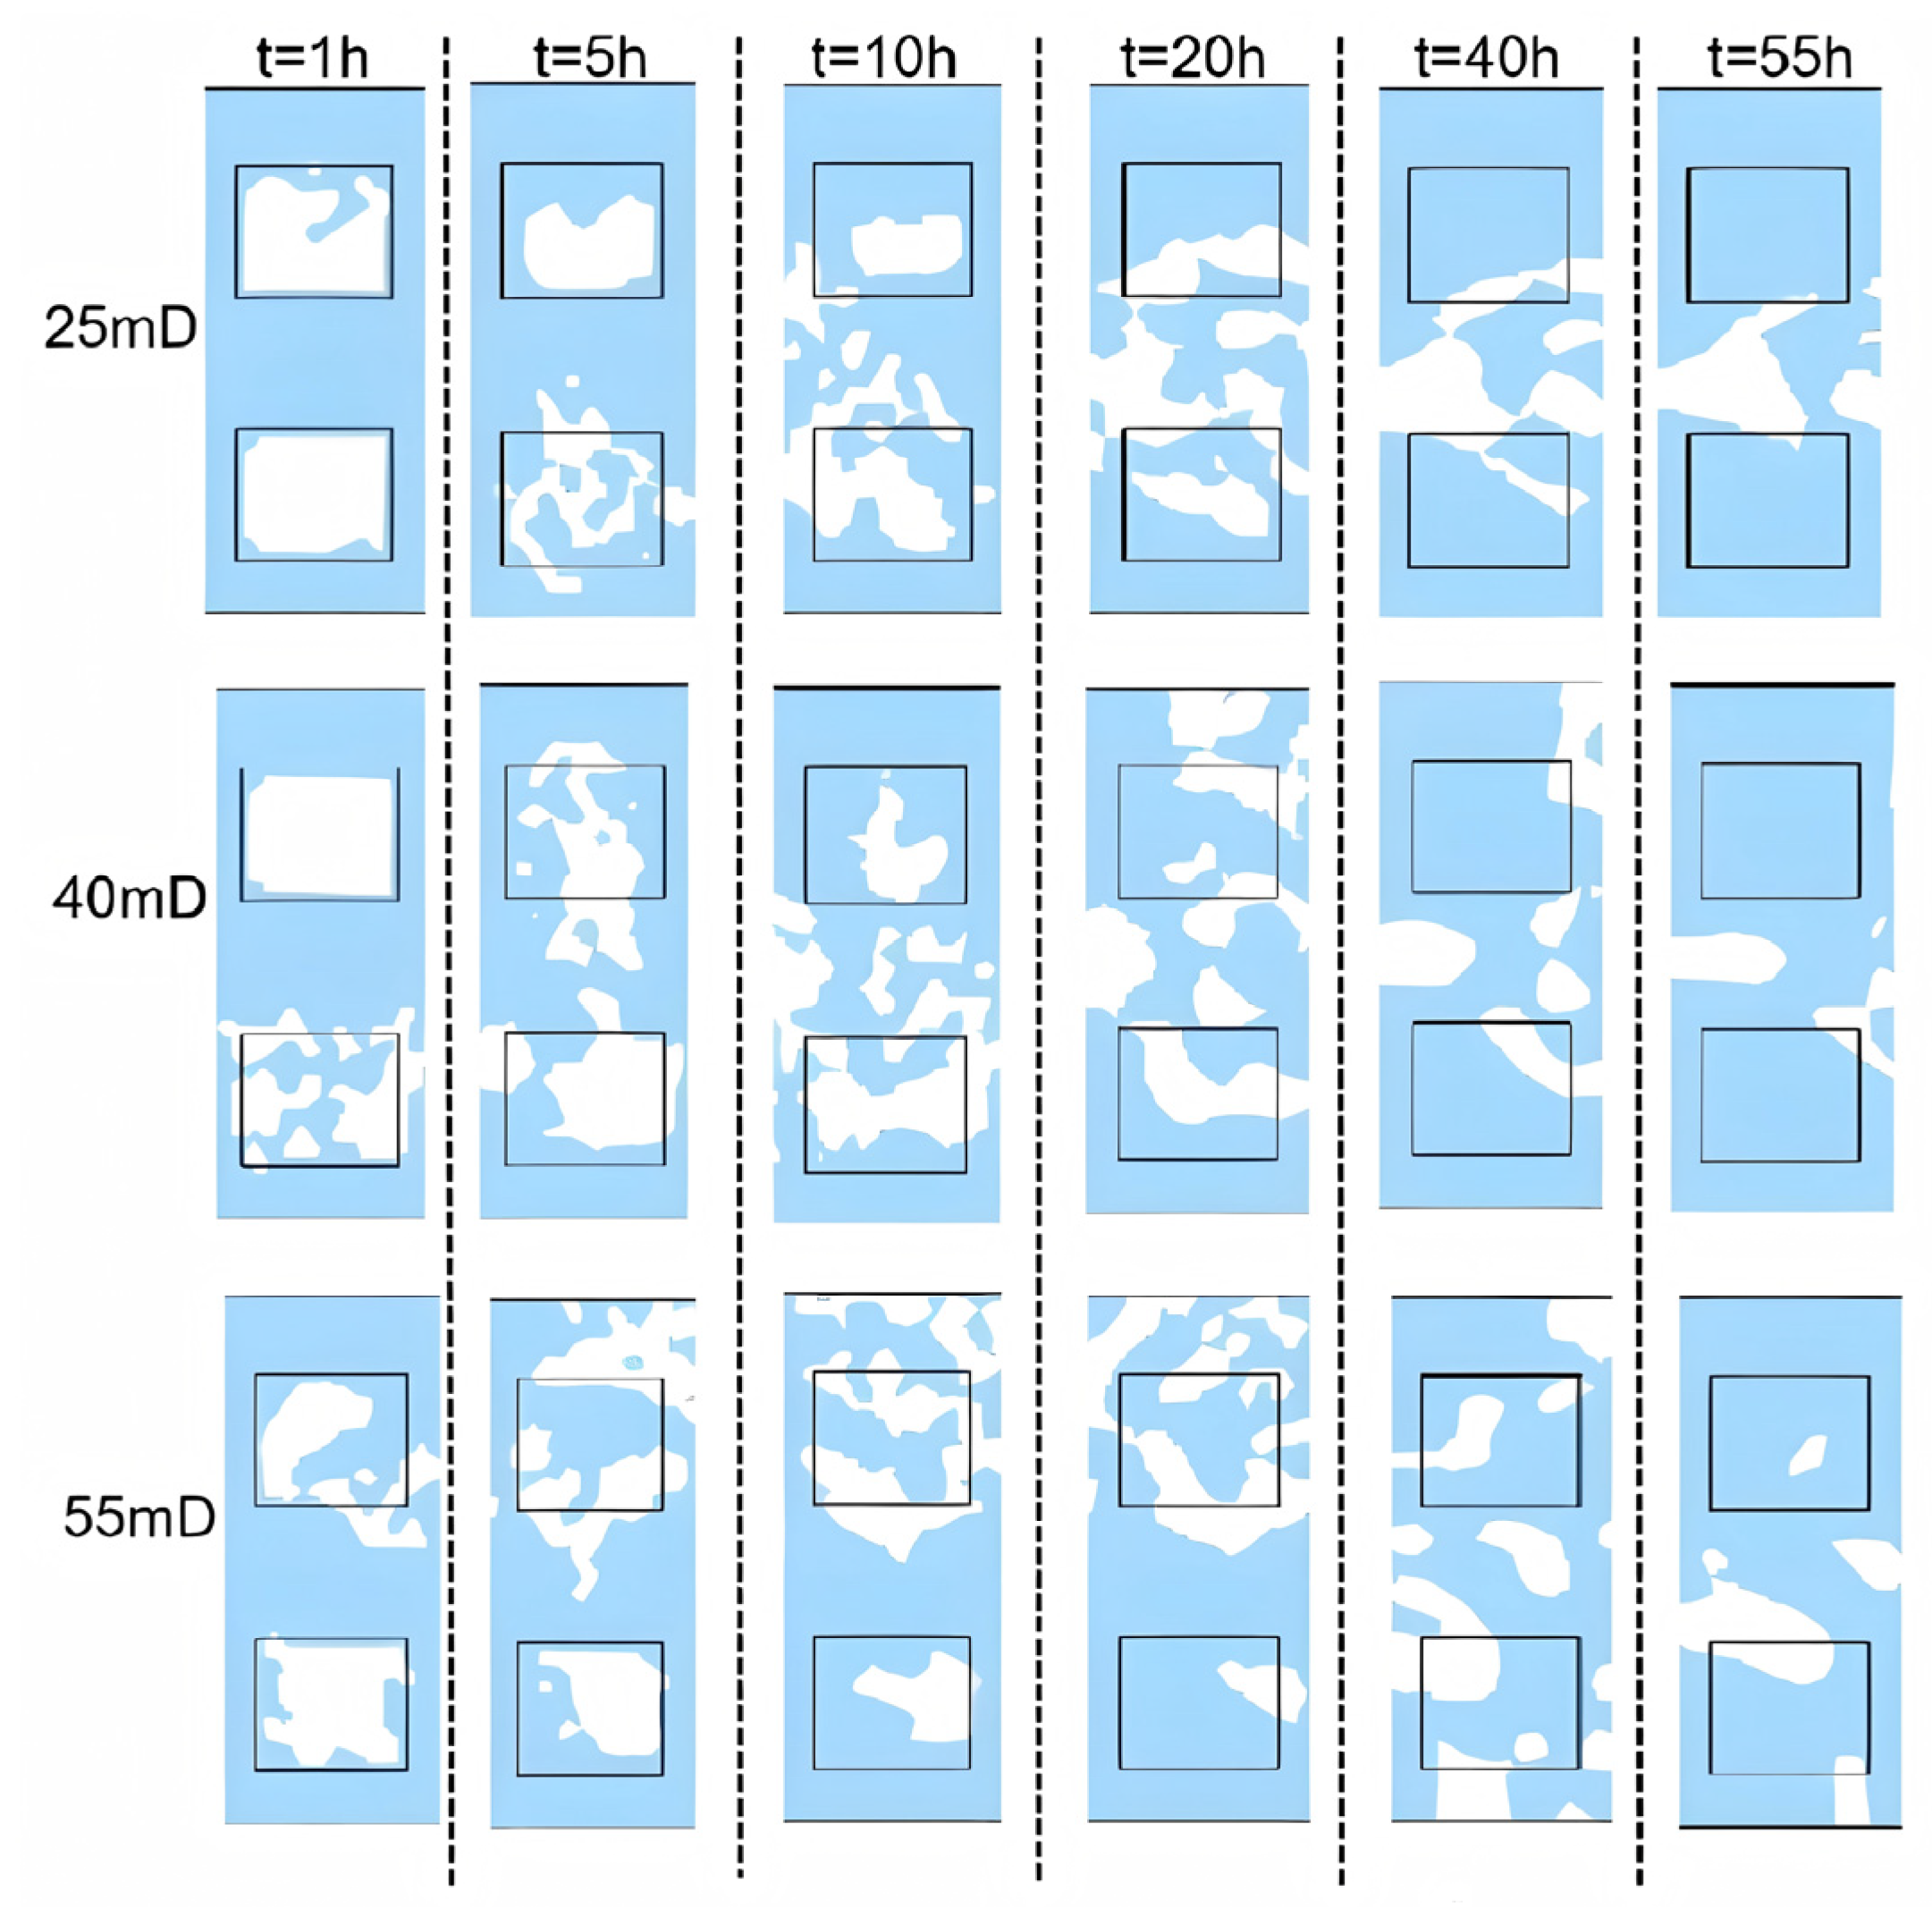
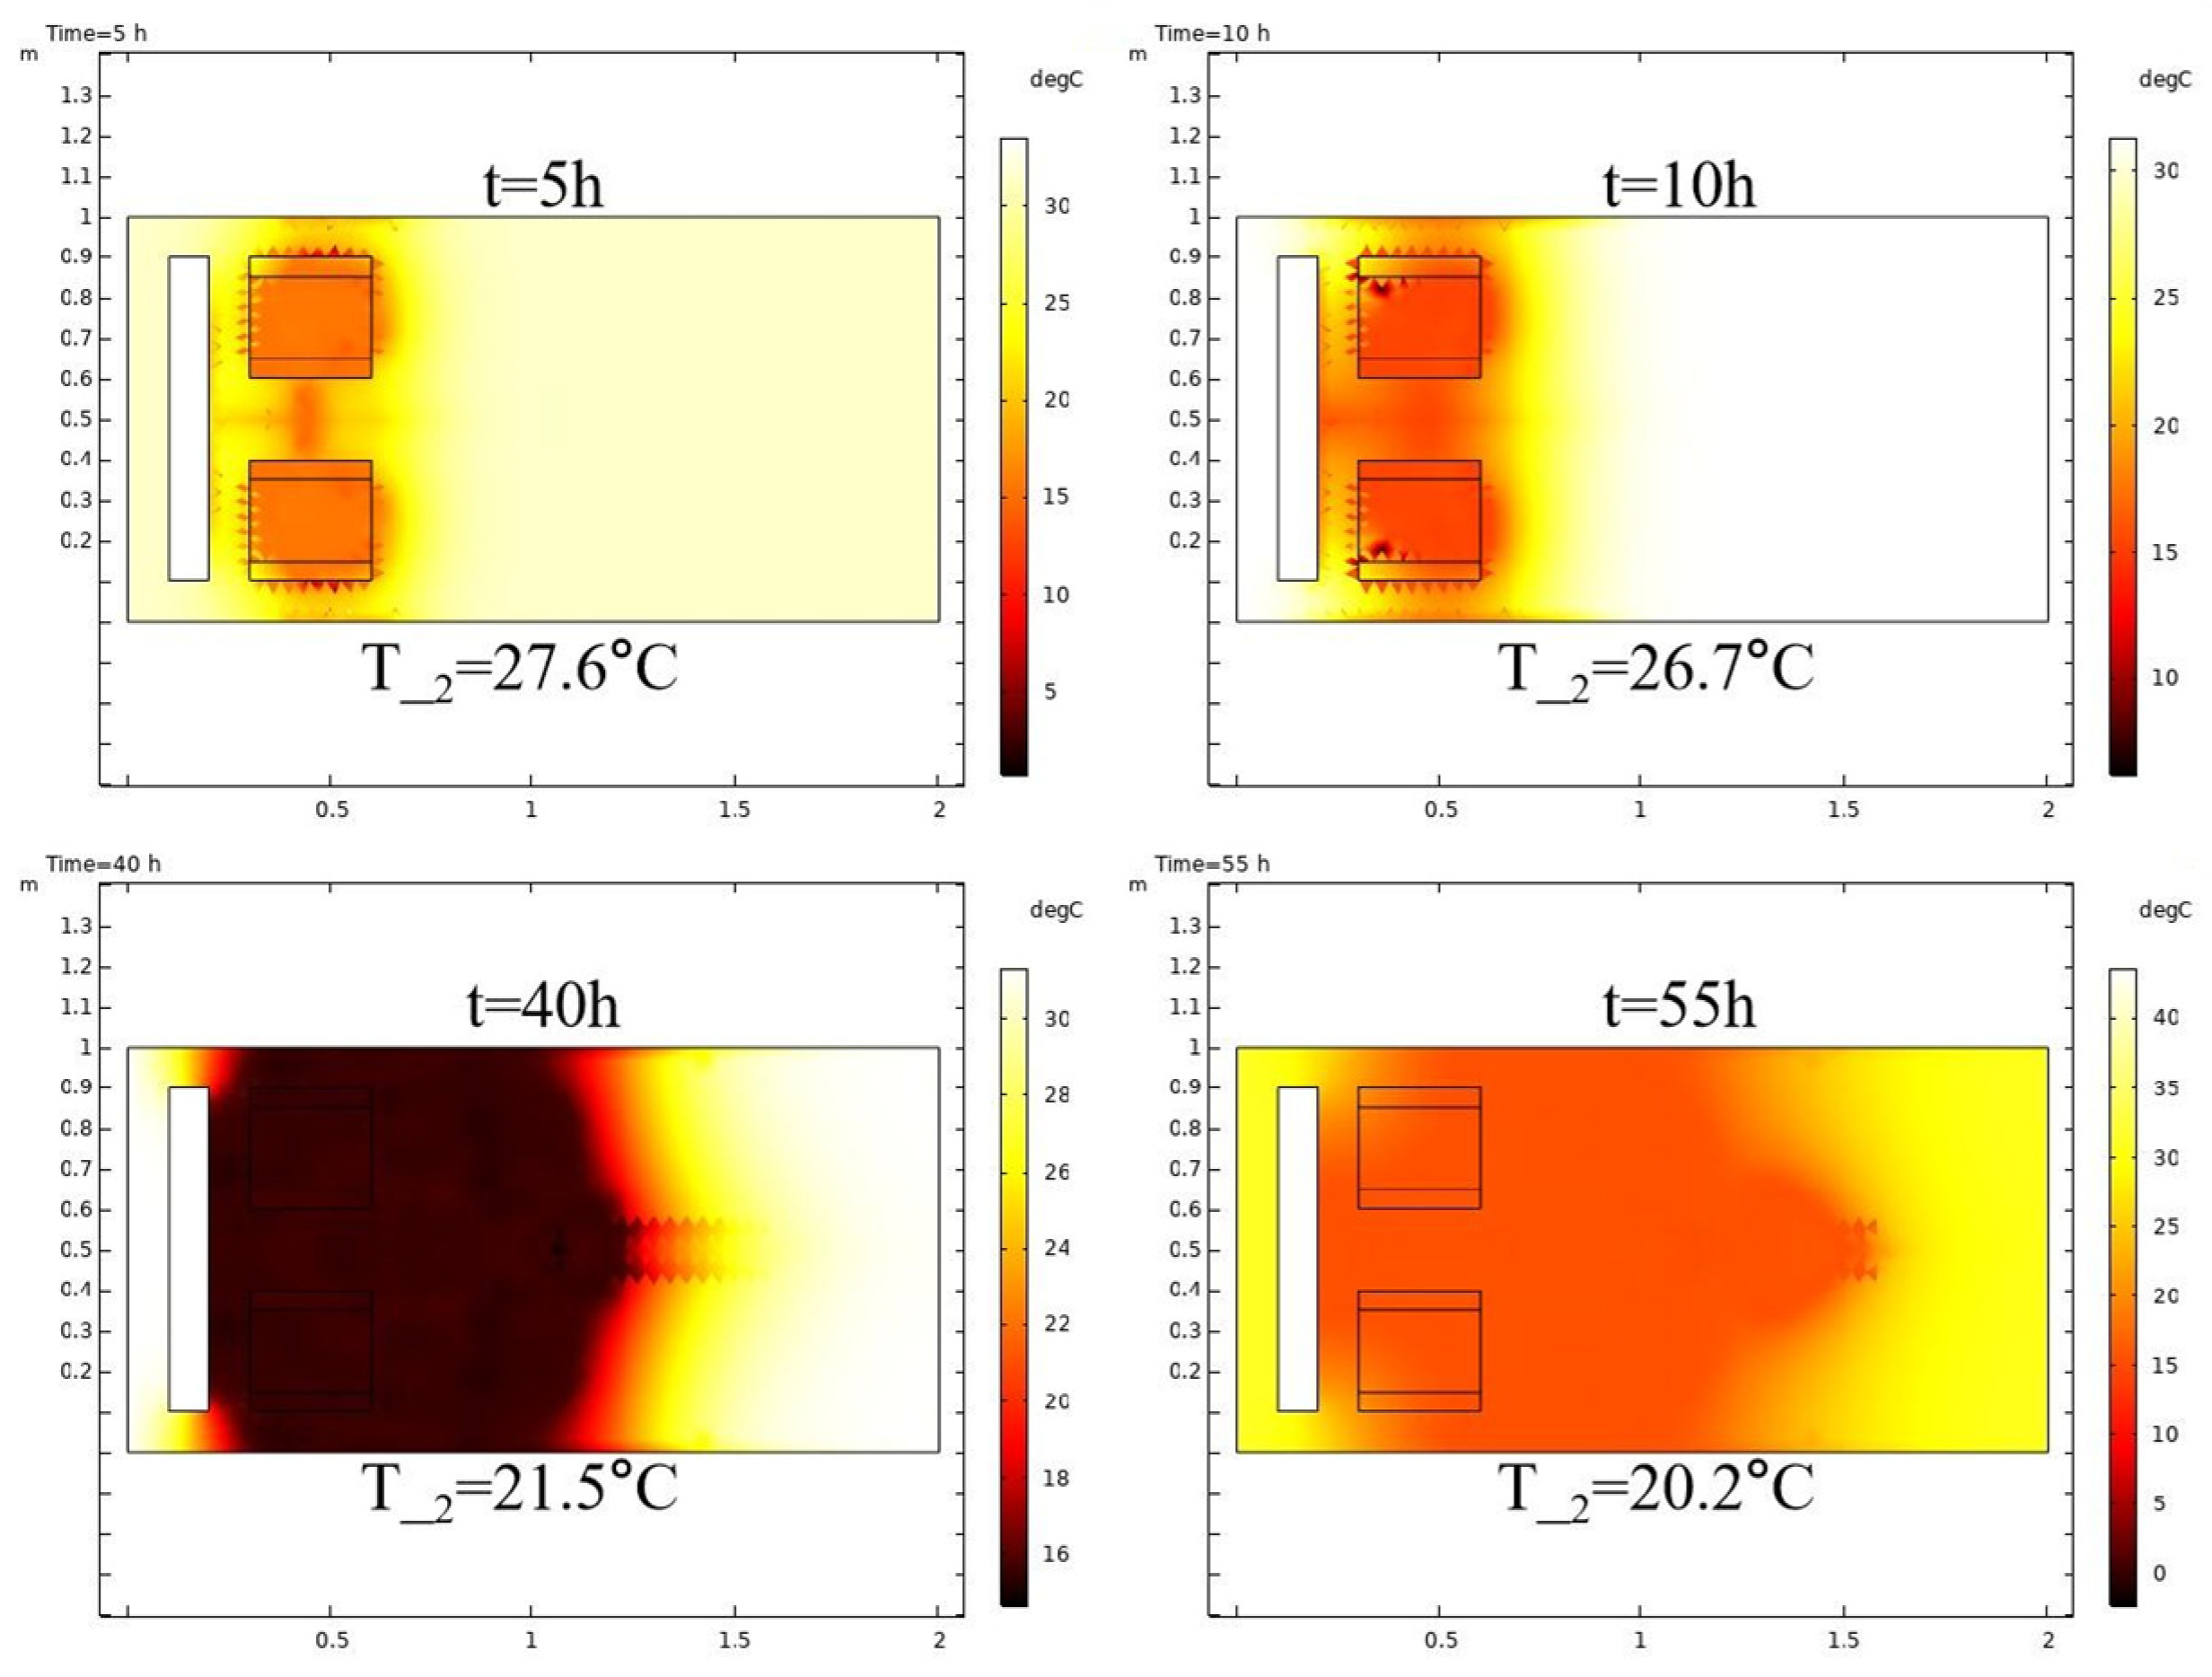
The hydrate-bearing media’s initial permeability is classified as low-K (1.5–15 mD), medium-K (25–55 mD), and high-K (70–100 mD); hydrate saturation patterns exhibit permeability-dependent changes across these ranges. Figure 5, Figure 6 and Figure 7, respectively, illustrate temporal hydrate saturation changes within the fluid saturation domain across each permeability range. Figure 8 compiles temporal hydrate saturation averages across all permeability cases, with Stage 2 duration divided into early, middle, and late periods. Figure 5, Figure 6, Figure 7 and Figure 8 reveal heterogeneous temporal hydrate saturation evolution. Low-K domain demonstrates progressive hydrate depletion during Stage 2, whereas medium-high permeability ranges exhibit transient regeneration followed by decomposition in phase transition. Figure 6 and Figure 7 demonstrate secondary hydrate formation via heterogeneous nucleation in porous media, aligning with the reported pattern of regenerated hydrates [43]. Secondary hydrate generation peaks are within the 55 mD permeability range. Analysis of reservoir temperature profiles (Figure 9, Figure 10 and Figure 11) reveals that the 55 mD case exhibits significantly greater temperature decline than 5 mD and 70 mD cases during the late-stage phase (40–55 h) of Stage 2, demonstrating the most pronounced heat absorption through hydrate decomposition. Reservoir average temperature distribution is presented in Figure 12.
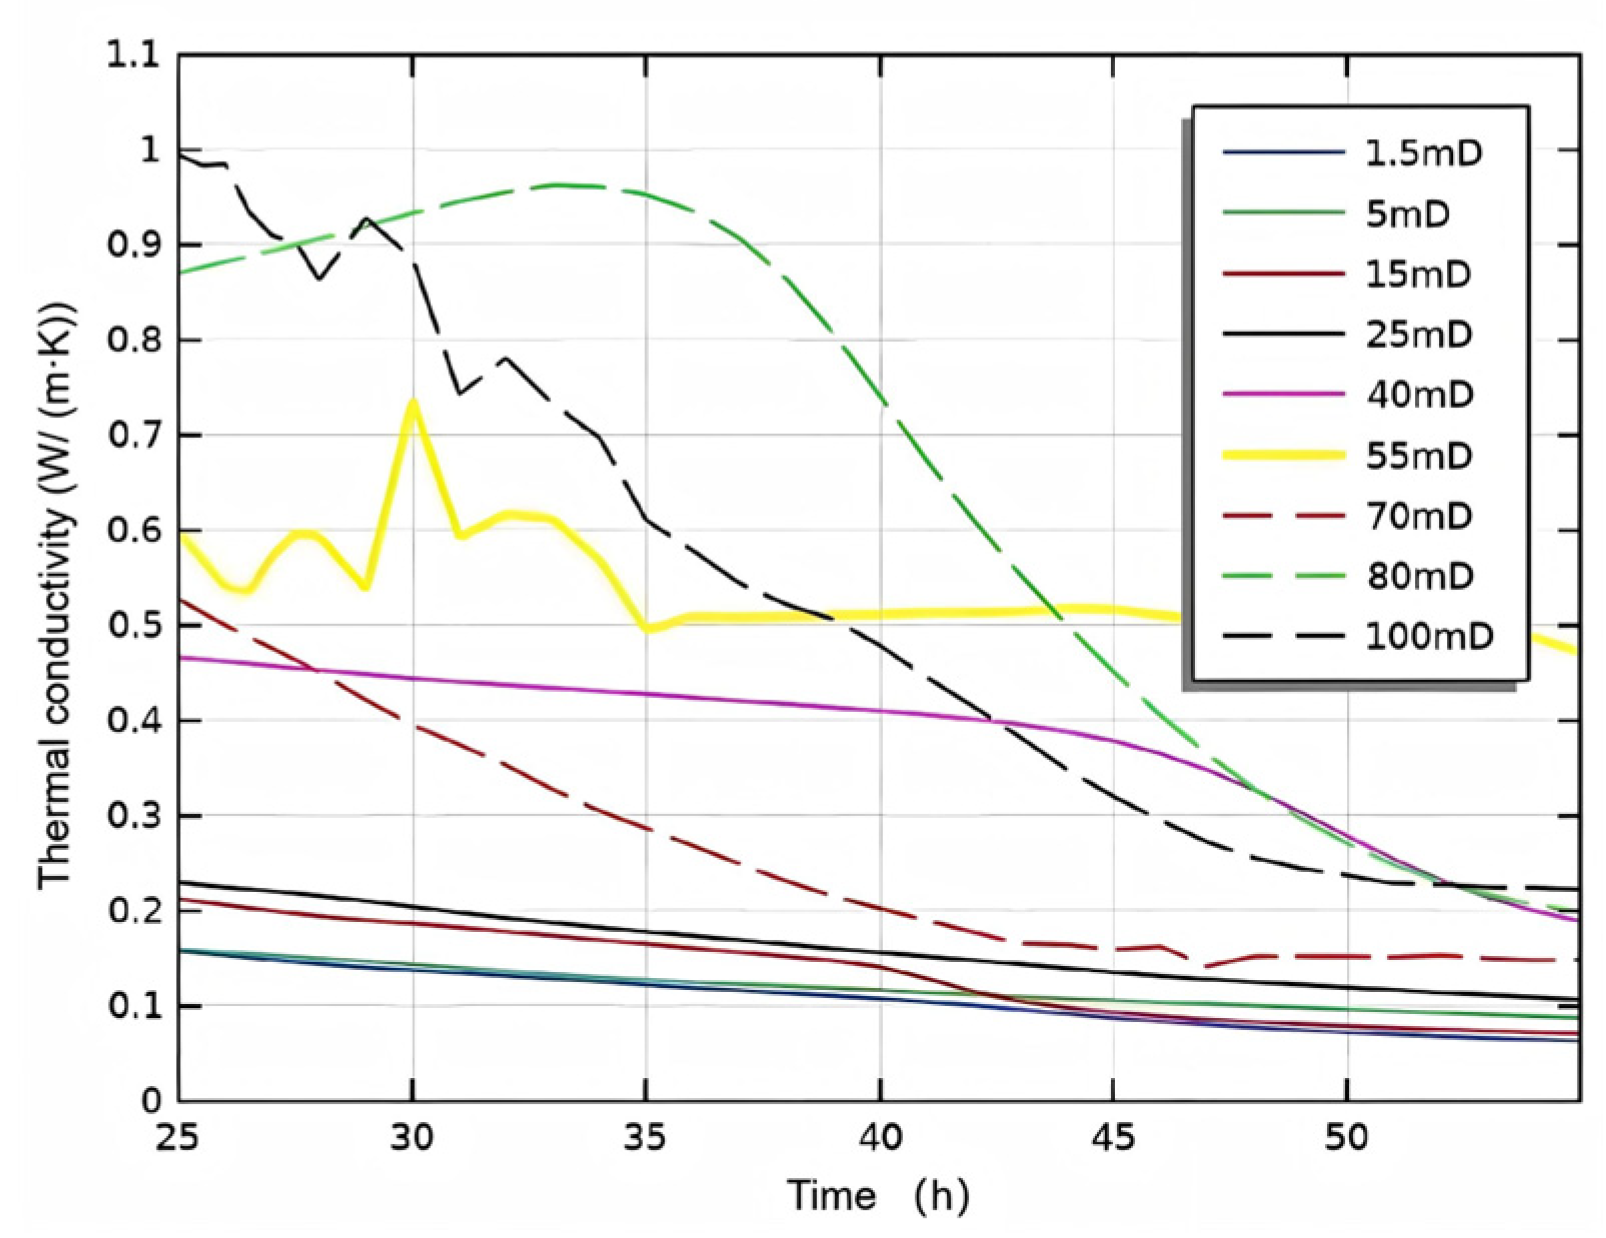
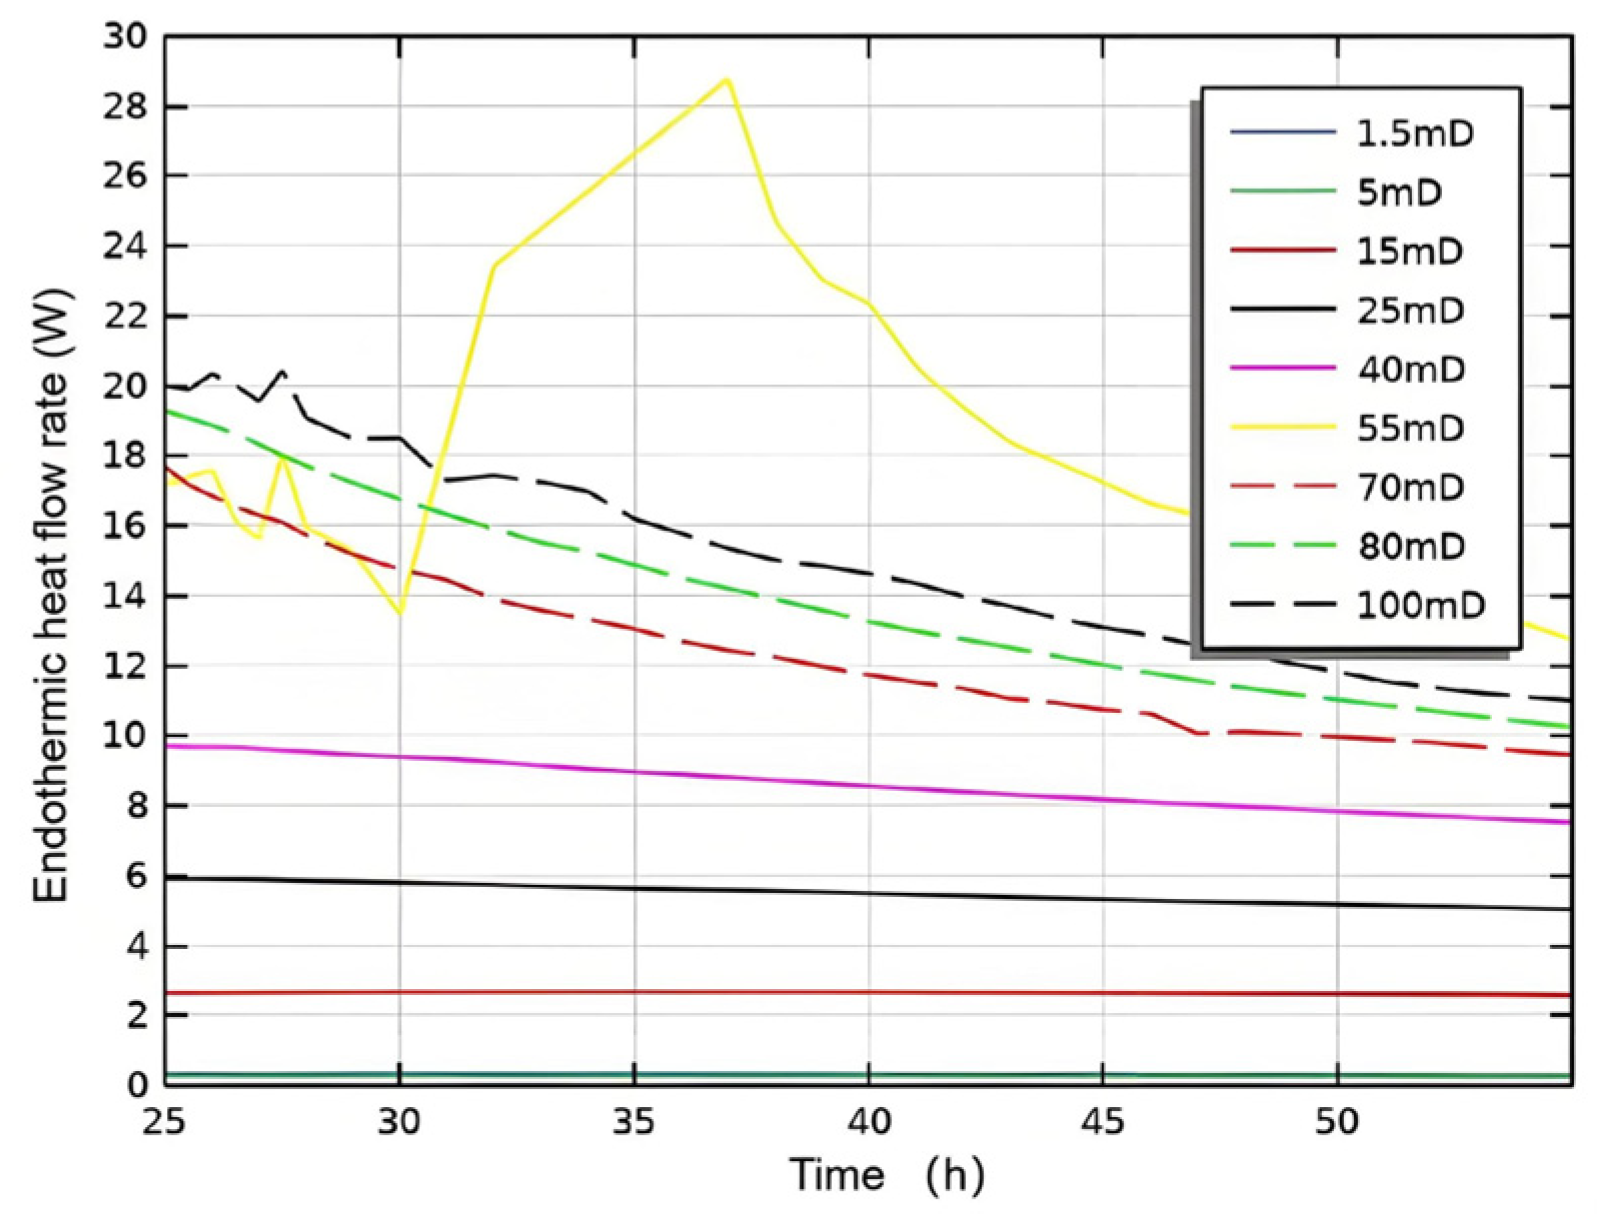
Thermal conductivity and endothermic heat flux govern Stage 2 temperature fluctuations in the reservoir porous media. Figure 12 reveals an anomalous temperature deviation at 25 h in the 55 mD case, exhibiting non-monotonic behavior resulting from competing thermal processes: minor thermal release via hydrate reformation and simultaneous endothermic phase transition of original hydrates [44]. This observation demonstrates marked hydrate phase transition initiation after t = 25 h. It has been confirmed that the hydrate reformation is strongly associated with the reservoir thermodynamic feedback to the attenuated heat conduction efficiency, and the thermal conductivity of porous media is positively correlated with the hydrate decomposition rate [45]. Therefore, the quantification of hydrate-bearing zone thermal indices (conductivity and endothermic flux) during Stage 2 (25–55 h) is essential, with results detailed in Figure 13 and Figure 14. Within the low-permeability range (1.5–15 mD), hydrates exhibit progressive dissociation throughout Stage 2 without secondary formation. Both thermal conductivity (λ) and endothermic heat flow rate (Qendo) maintain depressed levels throughout 25 < t < 55 h. Within moderate-to-high permeability ranges (25–100 mD), dissociation dynamics coexist with secondary hydrate formation. The reason why hydrates regenerate and then decompose can be explained as follows.
In reservoirs with permeability higher than 25 mD, hydrate thermal conductivity typically exhibits twofold enhancement relative to the low-K values in 25 to 40 h duration (Figure 13). Enhanced thermal conductivity elevates heat flux, thereby augmenting the endothermic heat flow rate at hydrate interfaces. The inflow heat flow rate of the system remains fixed due to the constant properties of injected working fluid, so with the elevated endothermic heat flow rate, the net heat flow rate will be reduced. As a result, the decline of average temperature induces secondary hydrate formation in porous media. While low-K (1.5–15 mD) zones show absent secondary hydrates, medium/high-K conditions (25–100 mD) exhibit pronounced temperature difference between original and new hydrate zones with temporal progression. This finding corroborates the existing conclusion that the temperature difference drives the spatial distribution difference in secondary hydrates [31]. In addition, the observed positive correlation between thermal conductivity and reservoir permeability aligns with published studies demonstrating that enhanced gas mobility under high permeability conditions induces higher thermal conductivity in hydrate-bearing sediment [46]. During Δt = 25–55 h, the thermal conductivity (λ) in 25–100 mD cases exhibits significant decay, which is corresponding to the decline of the endothermic heat flow rate Qendo. With constant Qin in system thermodynamics, the net heat flow rate (Qnet) escalation induces attenuated reservoir cooling, triggering hydrates re-decomposition in the reservoir porous media.
In short, hydrate regeneration behavior is fundamentally controlled by initial reservoir permeability (K), with distinct regimes emerging based on permeability thresholds: when K ≤ 15 mD, primary hydrates fully dissociate without secondary nucleation through dynamic thermal conductivity variations and endothermic heat flow rates within the hydrate zone; however, at 25 mD ≤ K < 70 mD, secondary hydrates form during early-mid Stage 2 with peak regeneration intensity in the mid-phase; and for K ≥ 70 mD, late-phase dissociation of secondary hydrates occurs as mass transfer dominates. These permeability-dependent patterns result from the competition between endothermic dissociation kinetics and exothermic reformation thermodynamics, where permeability governs heat distribution efficiency and fluid migration capacity, suggesting that permeability-modulation strategies should be customized to specific reservoir property classes to optimize self-heat fluid injection while minimizing secondary hydrate formation risks.

3.2.2. Injection Mode

The two injection modes, namely fluid flooding and in situ heating, are defined as follows.
Fluid flooding: Self-heat generated fluid (40 °C) flows into the 13.0 °C reservoir porous media from inlet boundary (AC of Figure 1).
In situ heating: Ambient temperature (13.0 °C) fluid flows into the reservoir with fixed 40 °C inlet boundary.
The contrast of in situ heating versus fluid flooding reveals that altered injection modes significantly influence hydrate saturation and reservoir temperature across both Stage 1 and Stage 2 processes.
  • Injection Mode Study: Reactive Chemical Flow Stage (Stage 1)
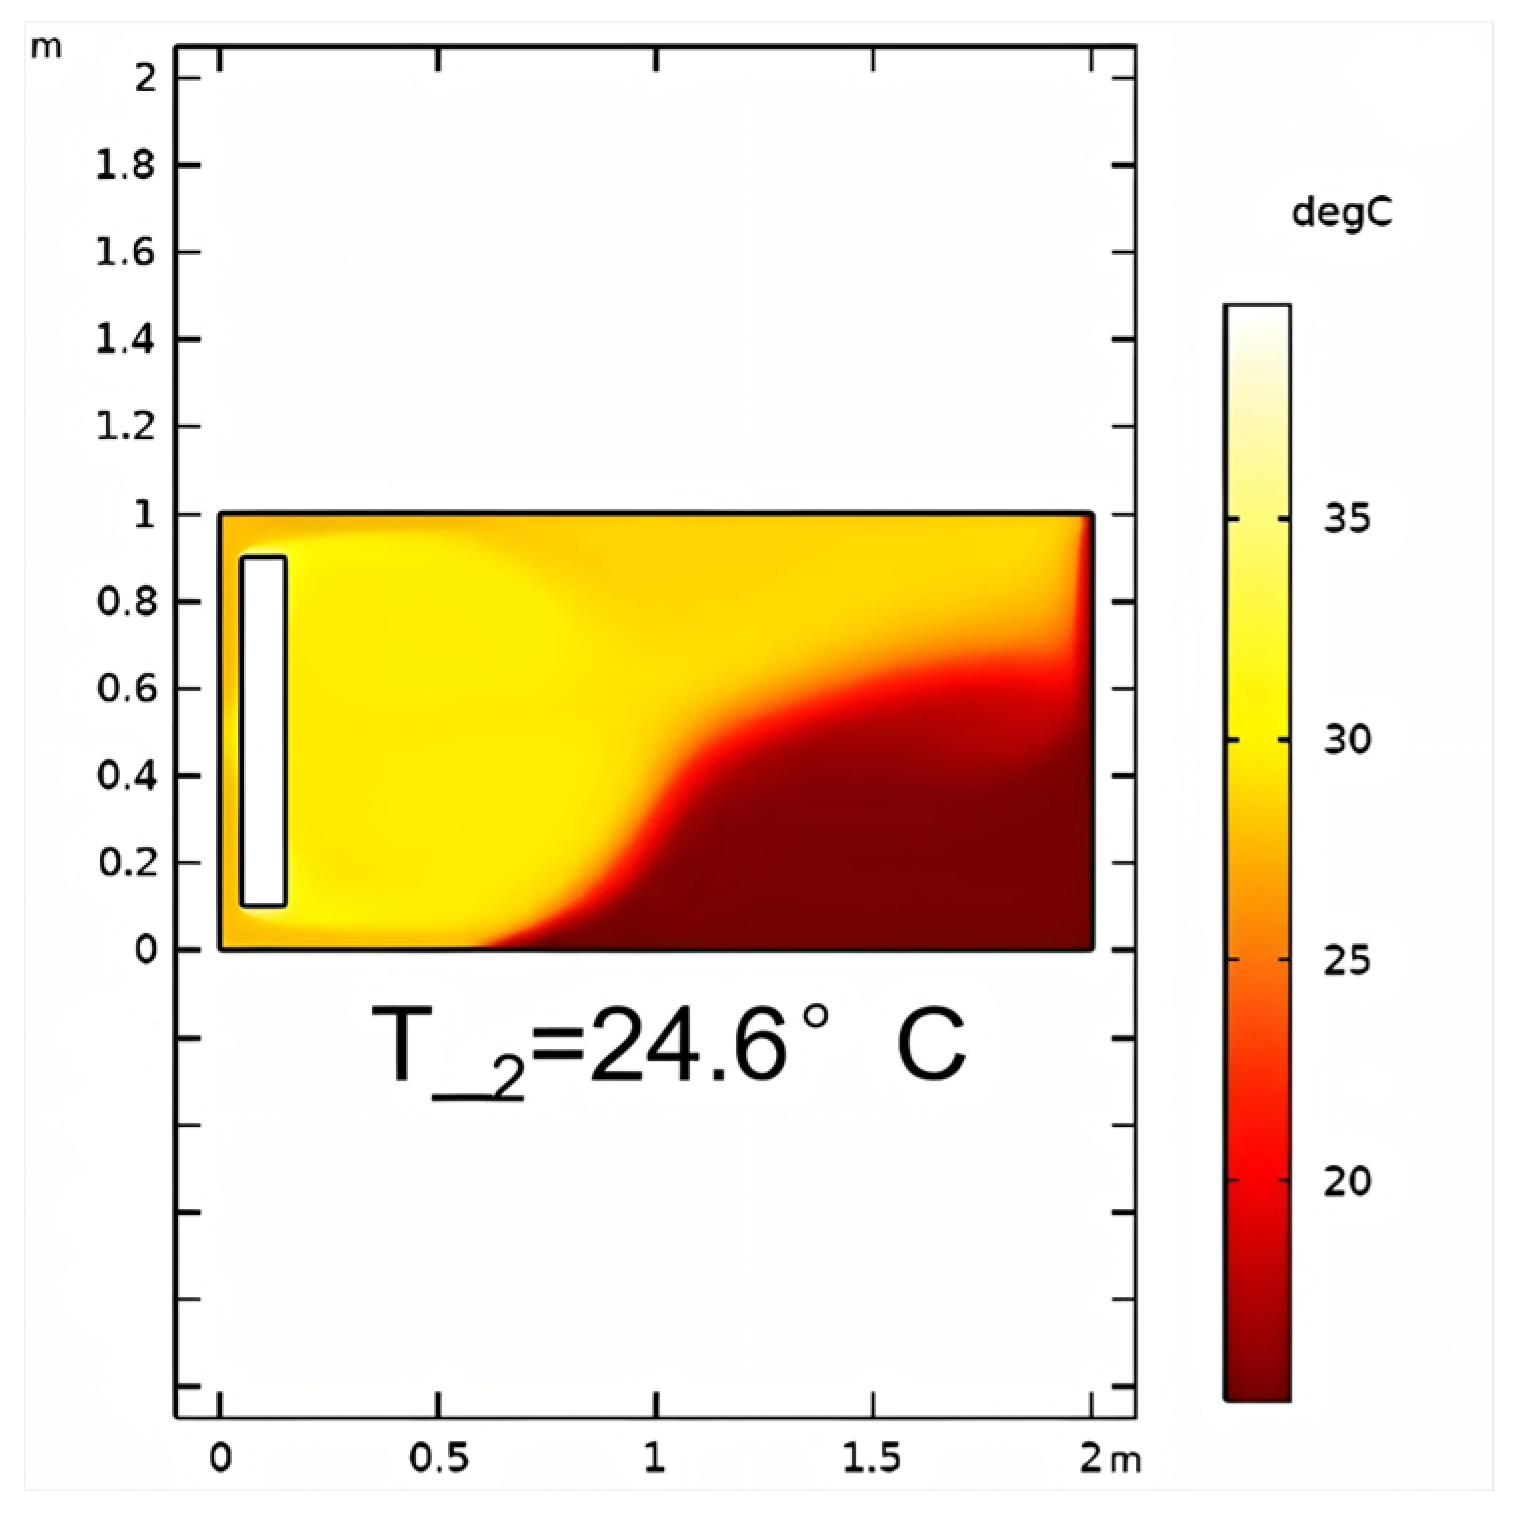
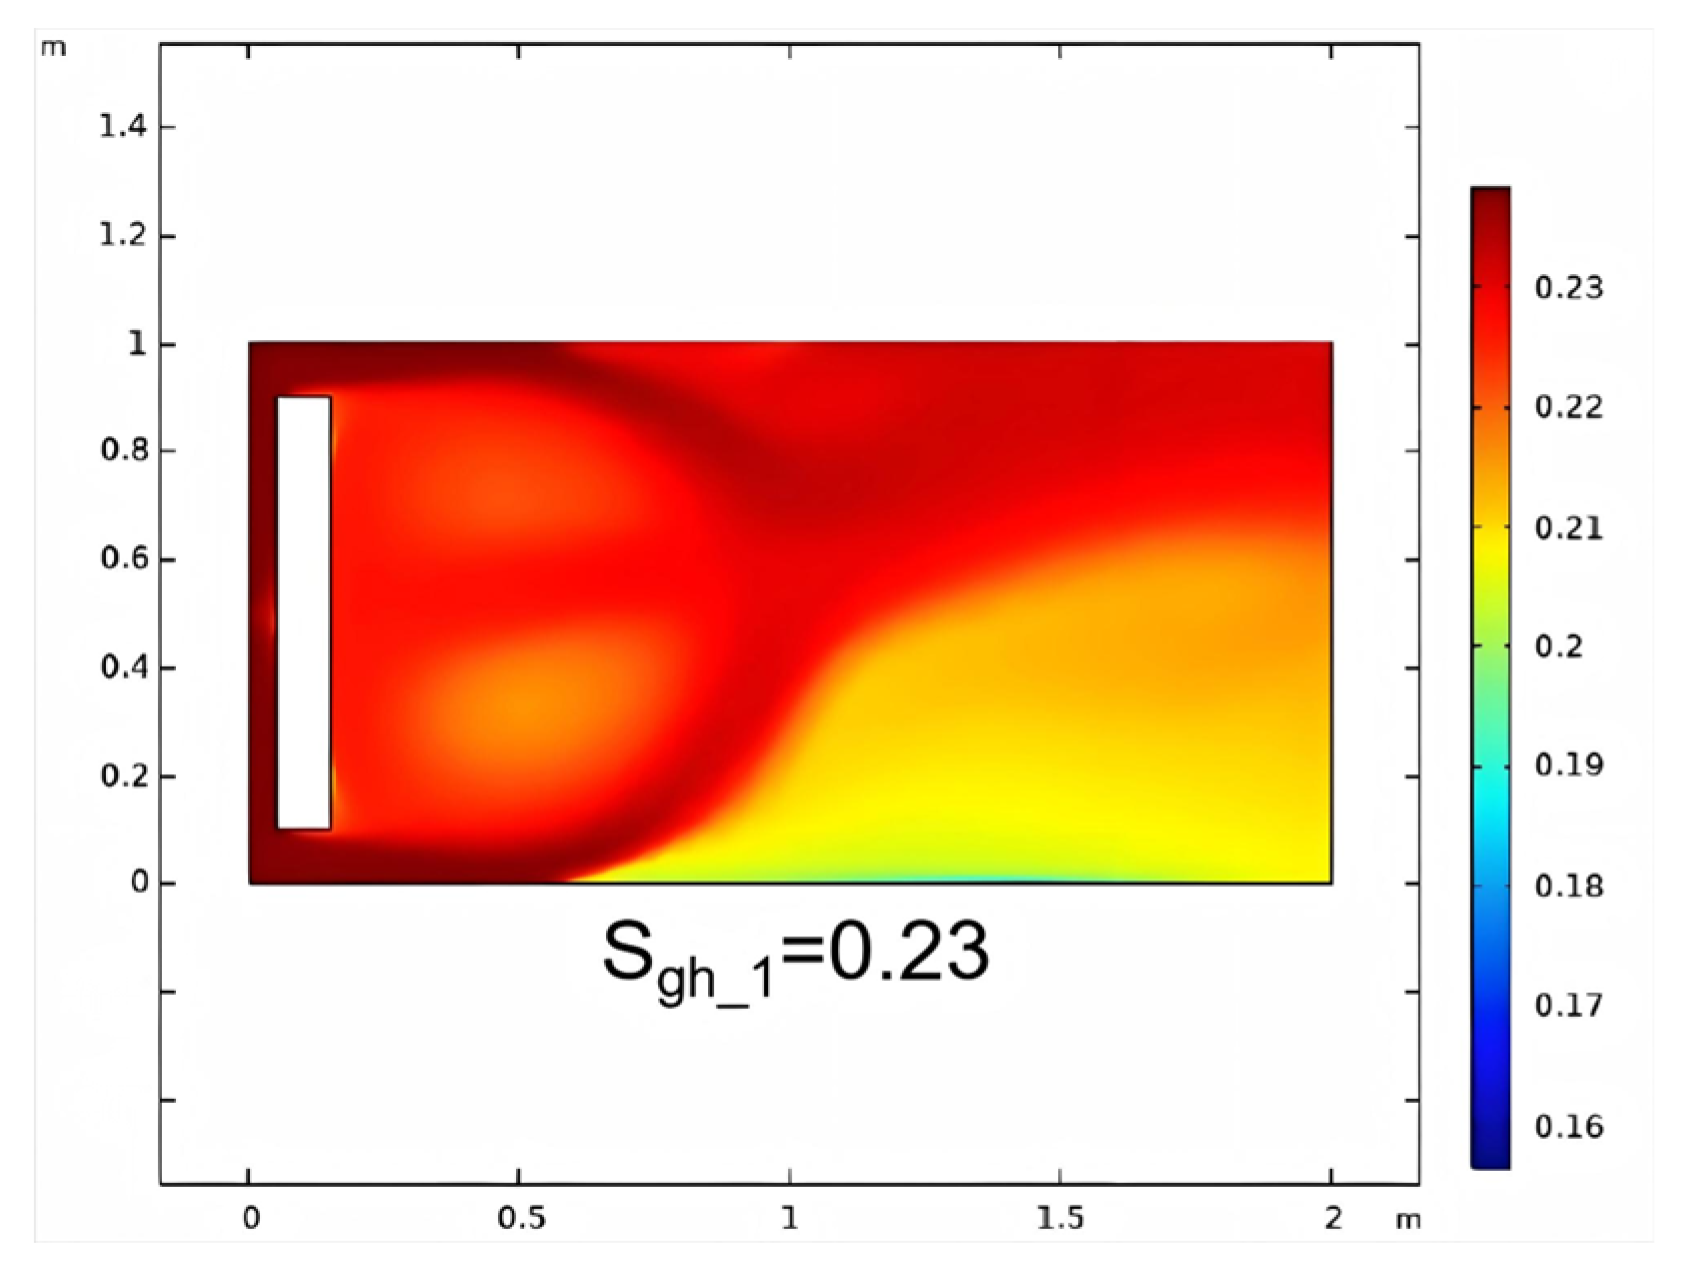
Under the coupled effects of chemical exothermic reactions and hydrate phase transitions within reservoir porous media, the average reservoir temperature under in situ heating rises from 13.0 °C to 24.6 °C (Figure 15), while corresponding hydrate saturation declines from 0.40 to 0.23 (Figure 16).
  • Injection Mode Study: Non-Reactive Flow Stage (Stage 2)
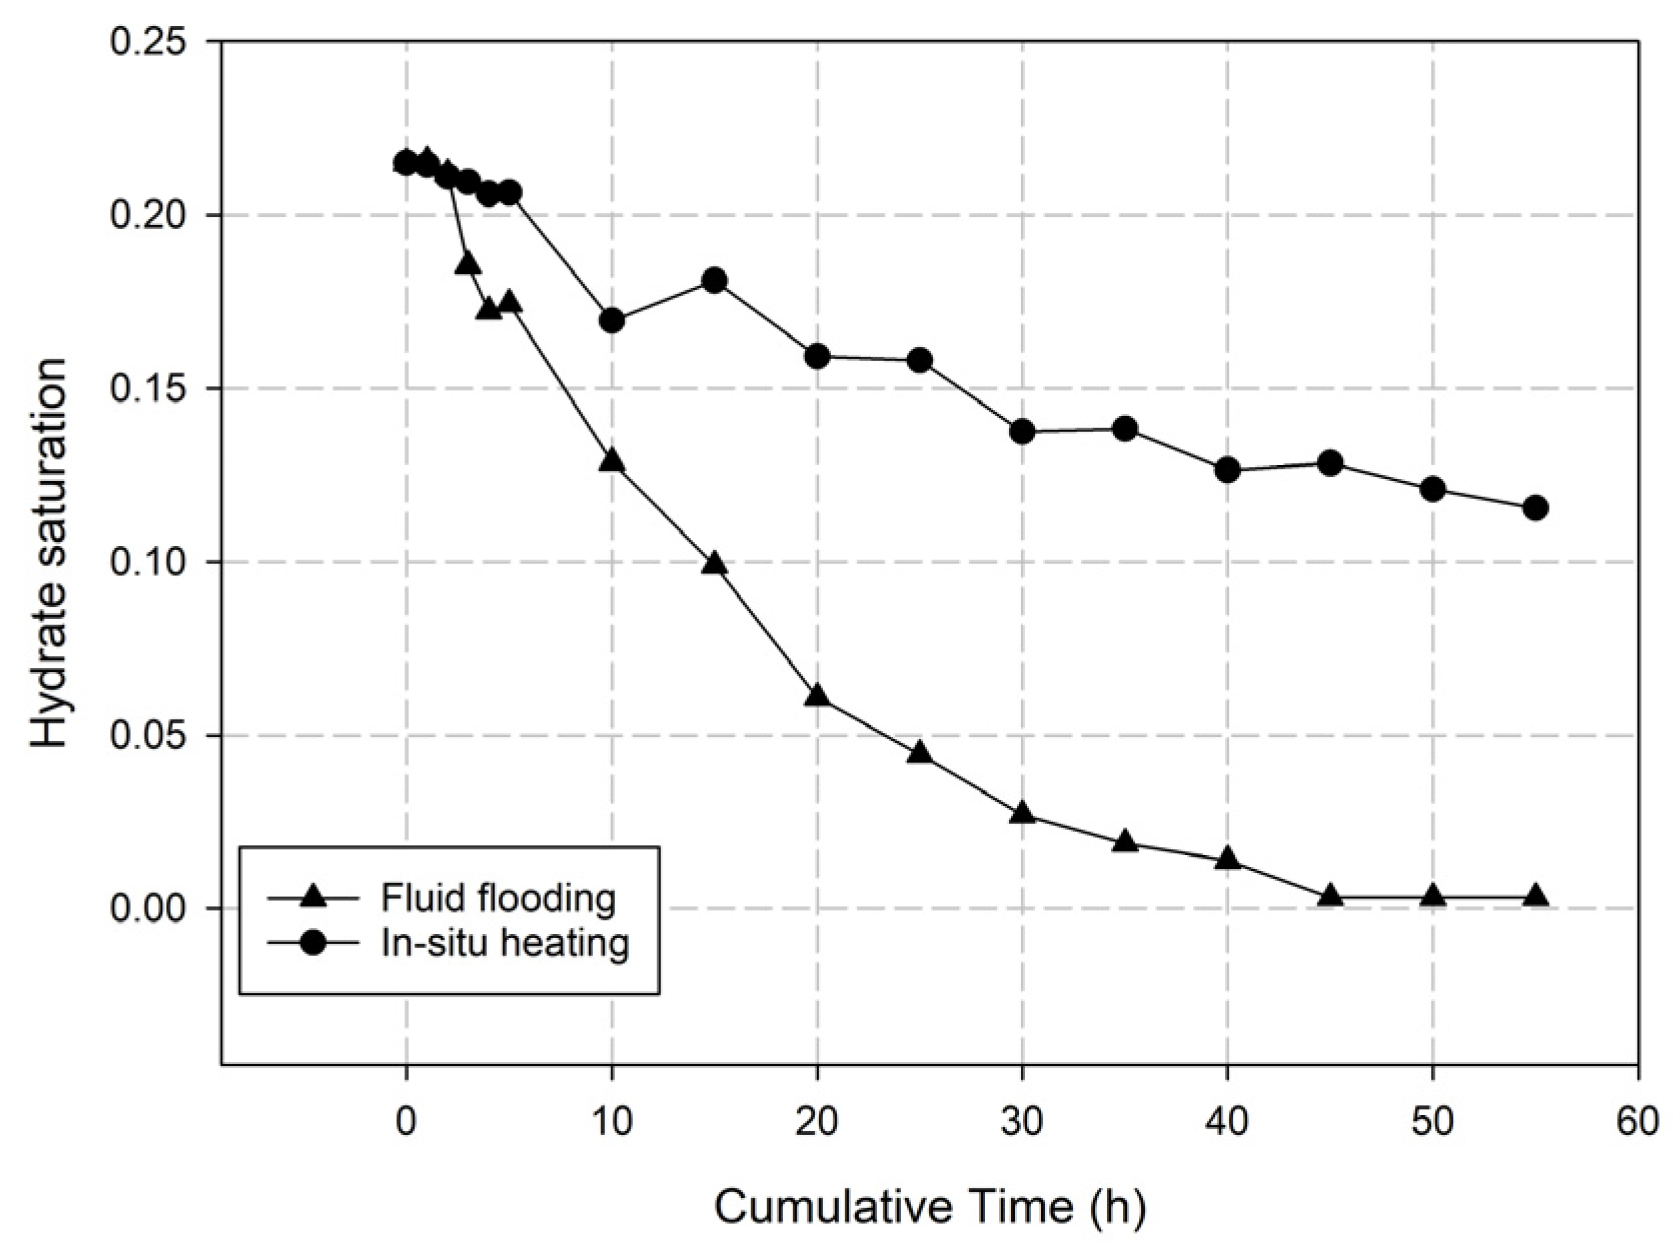
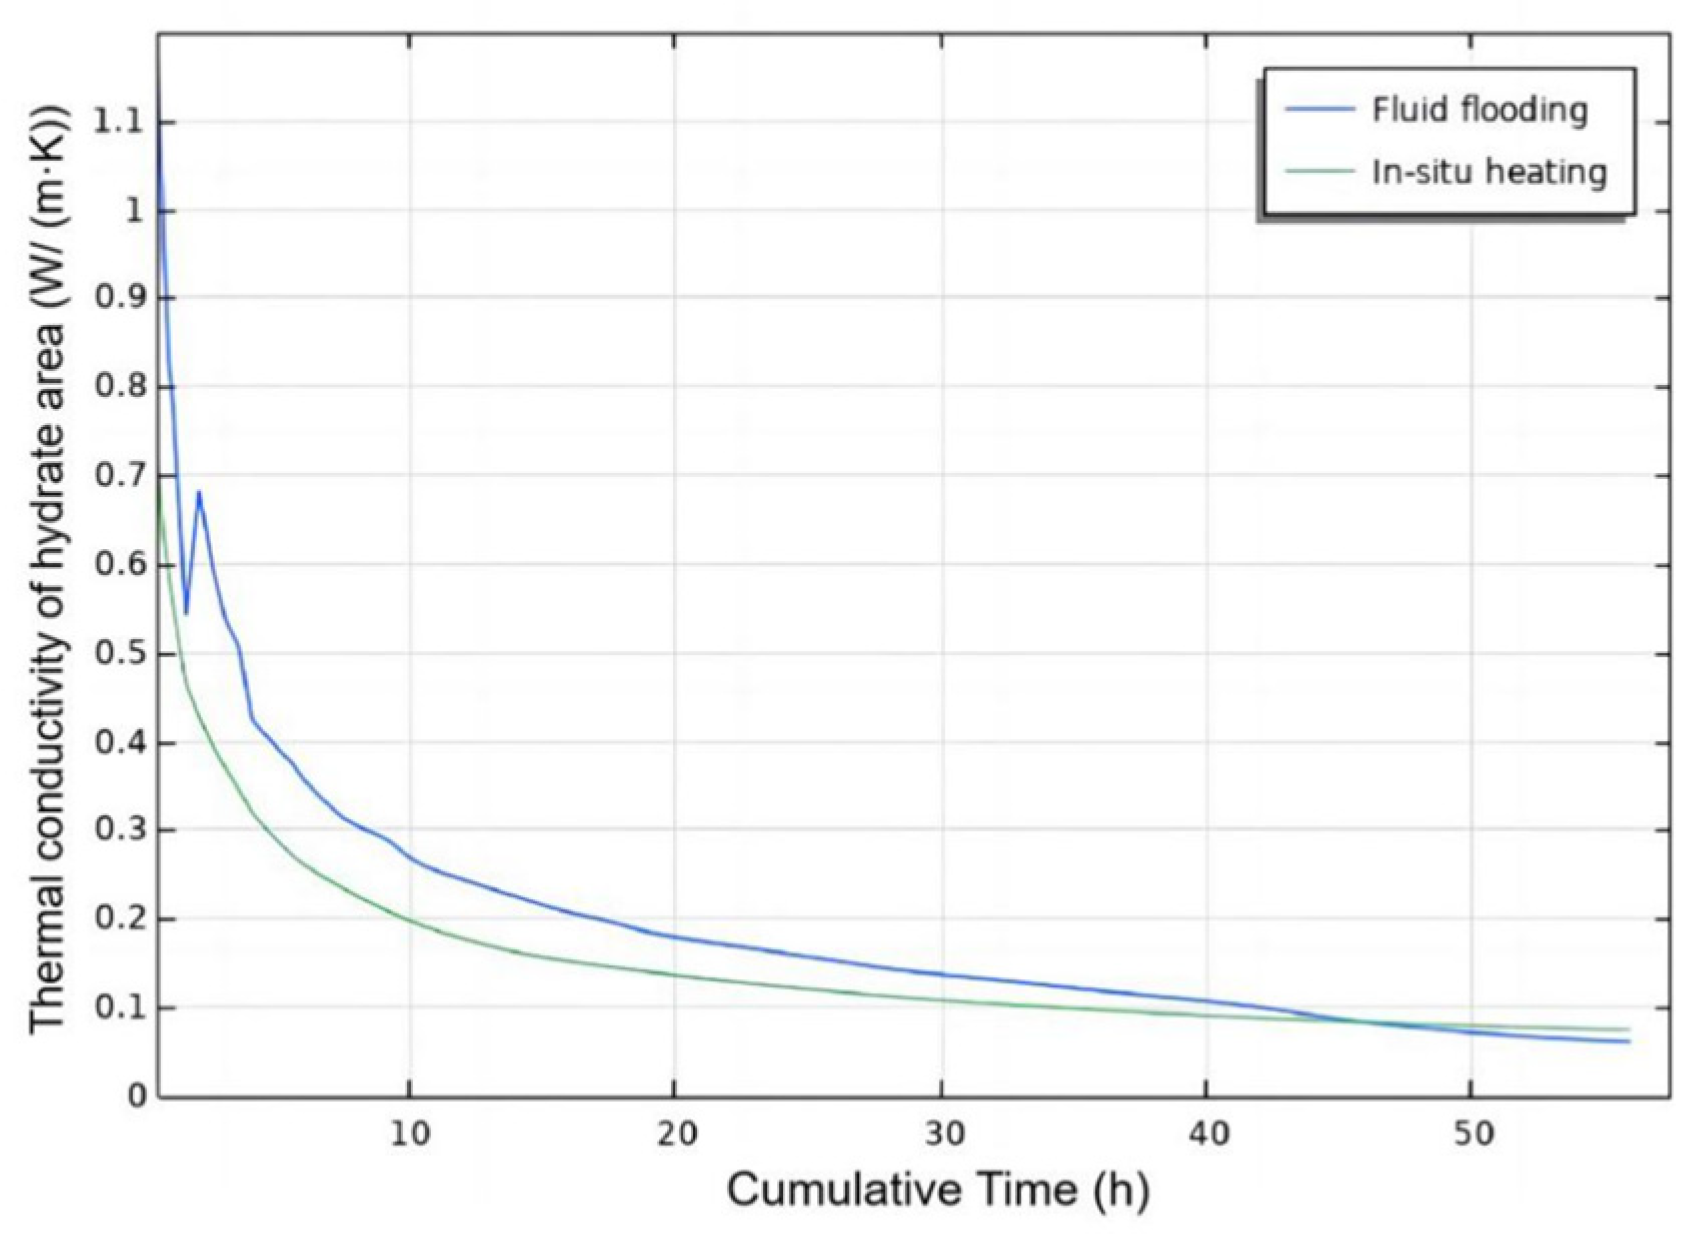
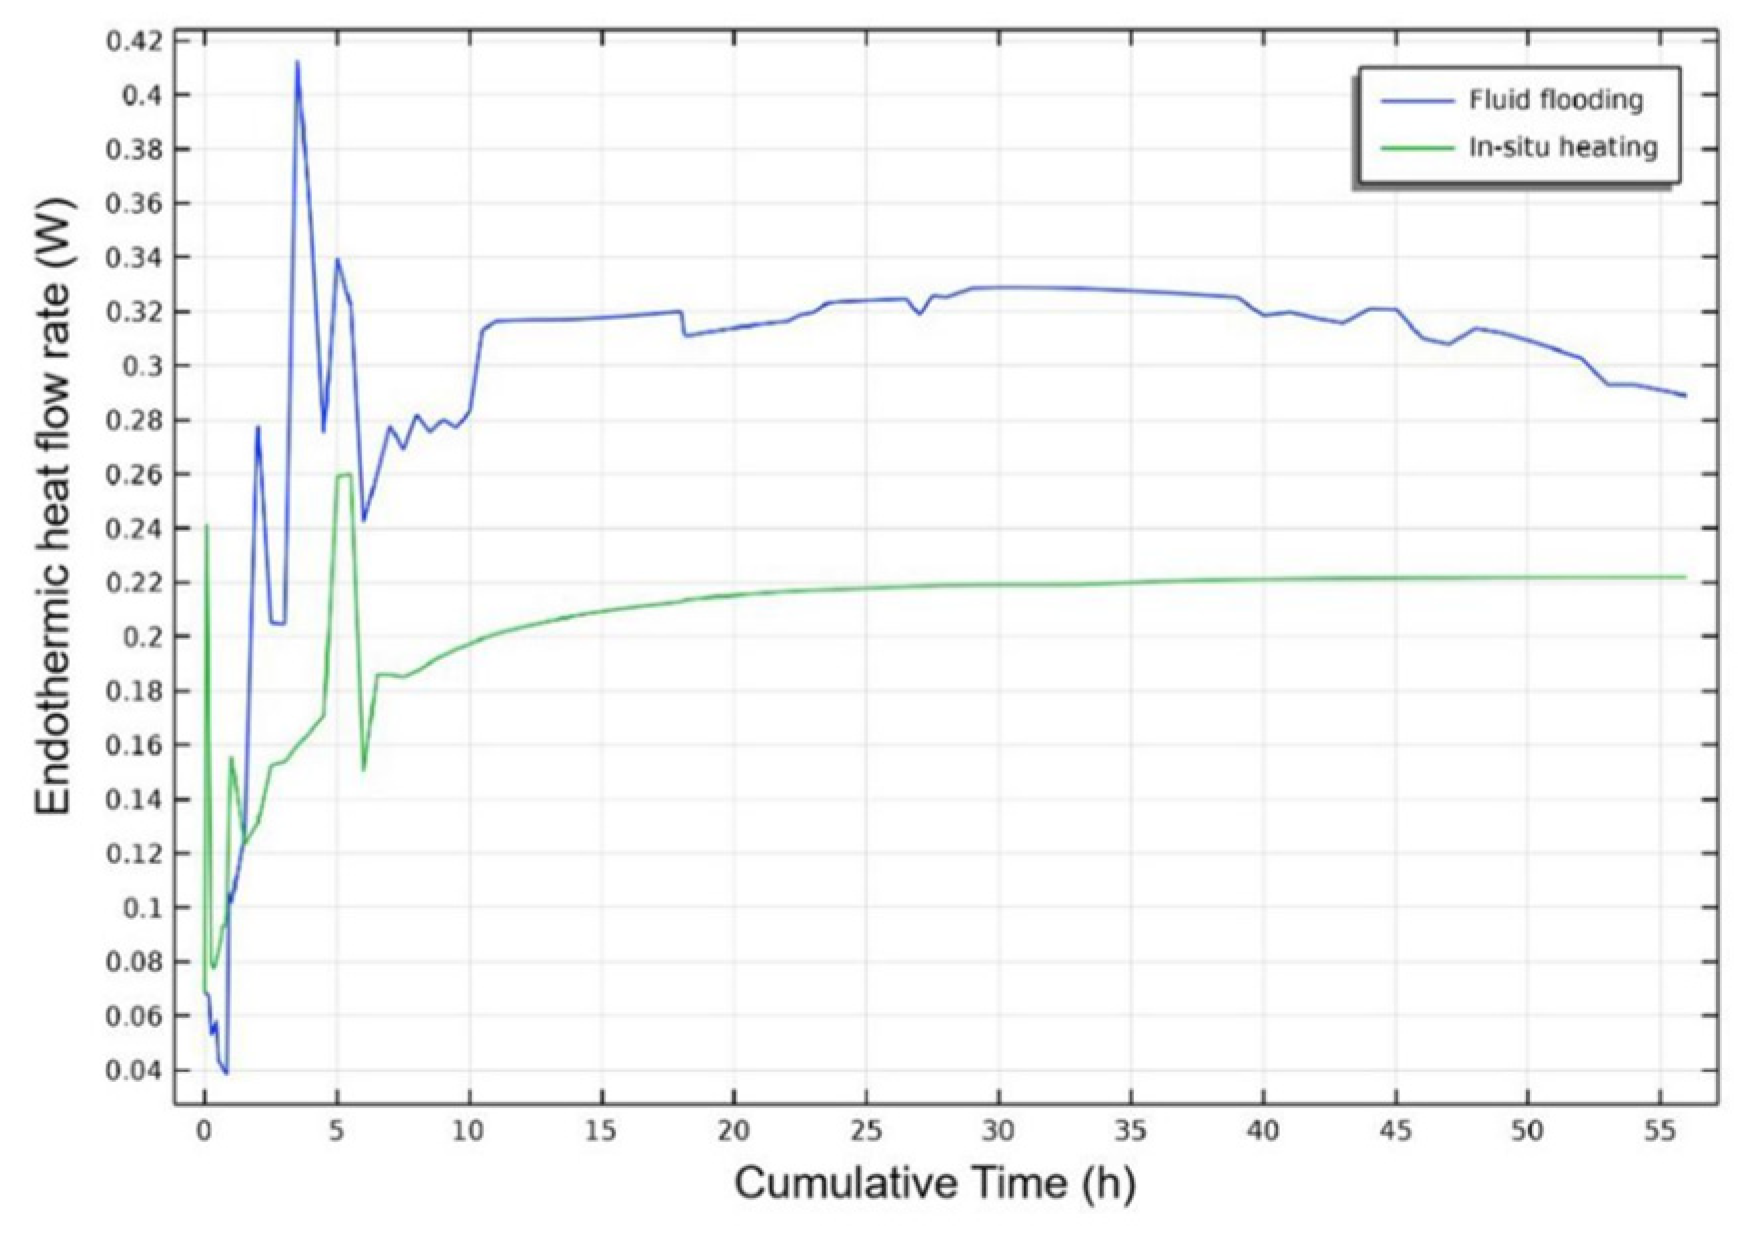
The fluid flooding approach demonstrates superior performance to the in situ heating method in hydrate decomposition efficiency. The quantified average hydrate saturation under both injection modes is presented in Figure 17, with corresponding spatial distribution profiles illustrated in Figure 18. Figure 19 illustrates the average reservoir temperature versus cumulative duration in Stage 2 under both scenarios. The in situ heating method exhibits slower hydrate decomposition rates compared to fluid flooding, resulting in residual hydrate retention due to limited thermal propagation and fluid migration constraints. This incomplete dissociation persists throughout the injection process, as evidenced by saturation profiles. In addition, the average reservoir temperature of the fluid flooding method is sustainably higher than that of the in situ heat generation method during Stage 2. The disparity in hydrate decomposition efficiency between both approaches stems from thermal conductivity and endothermic heat flow rate perspectives. Comparative analysis of Figure 20 and Figure 21 with Figure 13 and Figure 14 reveals little change in thermal conductivity in hydrate zones across the two injection modes; however, compared with the in situ heating method, the heat generation effect is better performed in the fluid flooding method (Figure 4 versus Figure 18), and thus the hydrate decomposition efficiency is elevated in the fluid flooding case throughout both Stages 1 and 2. This aligns with two recent studies: for one, solely elevating local heat source temperature insufficiently enhances hydrate decomposition efficiency due to low thermal conductivity in porous media [7]; for another, heat convection–conduction coupling effect is more contributive compared with heat conduction-dominated regimes during hydrate dissociation under thermal fluid injection [47].

3.3. Post-Injection Gas Production Potential

This research calculates decomposed gas volumes after the self-heating fluid injection process, examining how reservoir properties and injection modes influence post-injection gas production potential. The estimation results indicate that the gas production potential is positively correlated to the hydrate decomposition efficiency. The gas production calculation methodology and results analysis are briefly stated below.
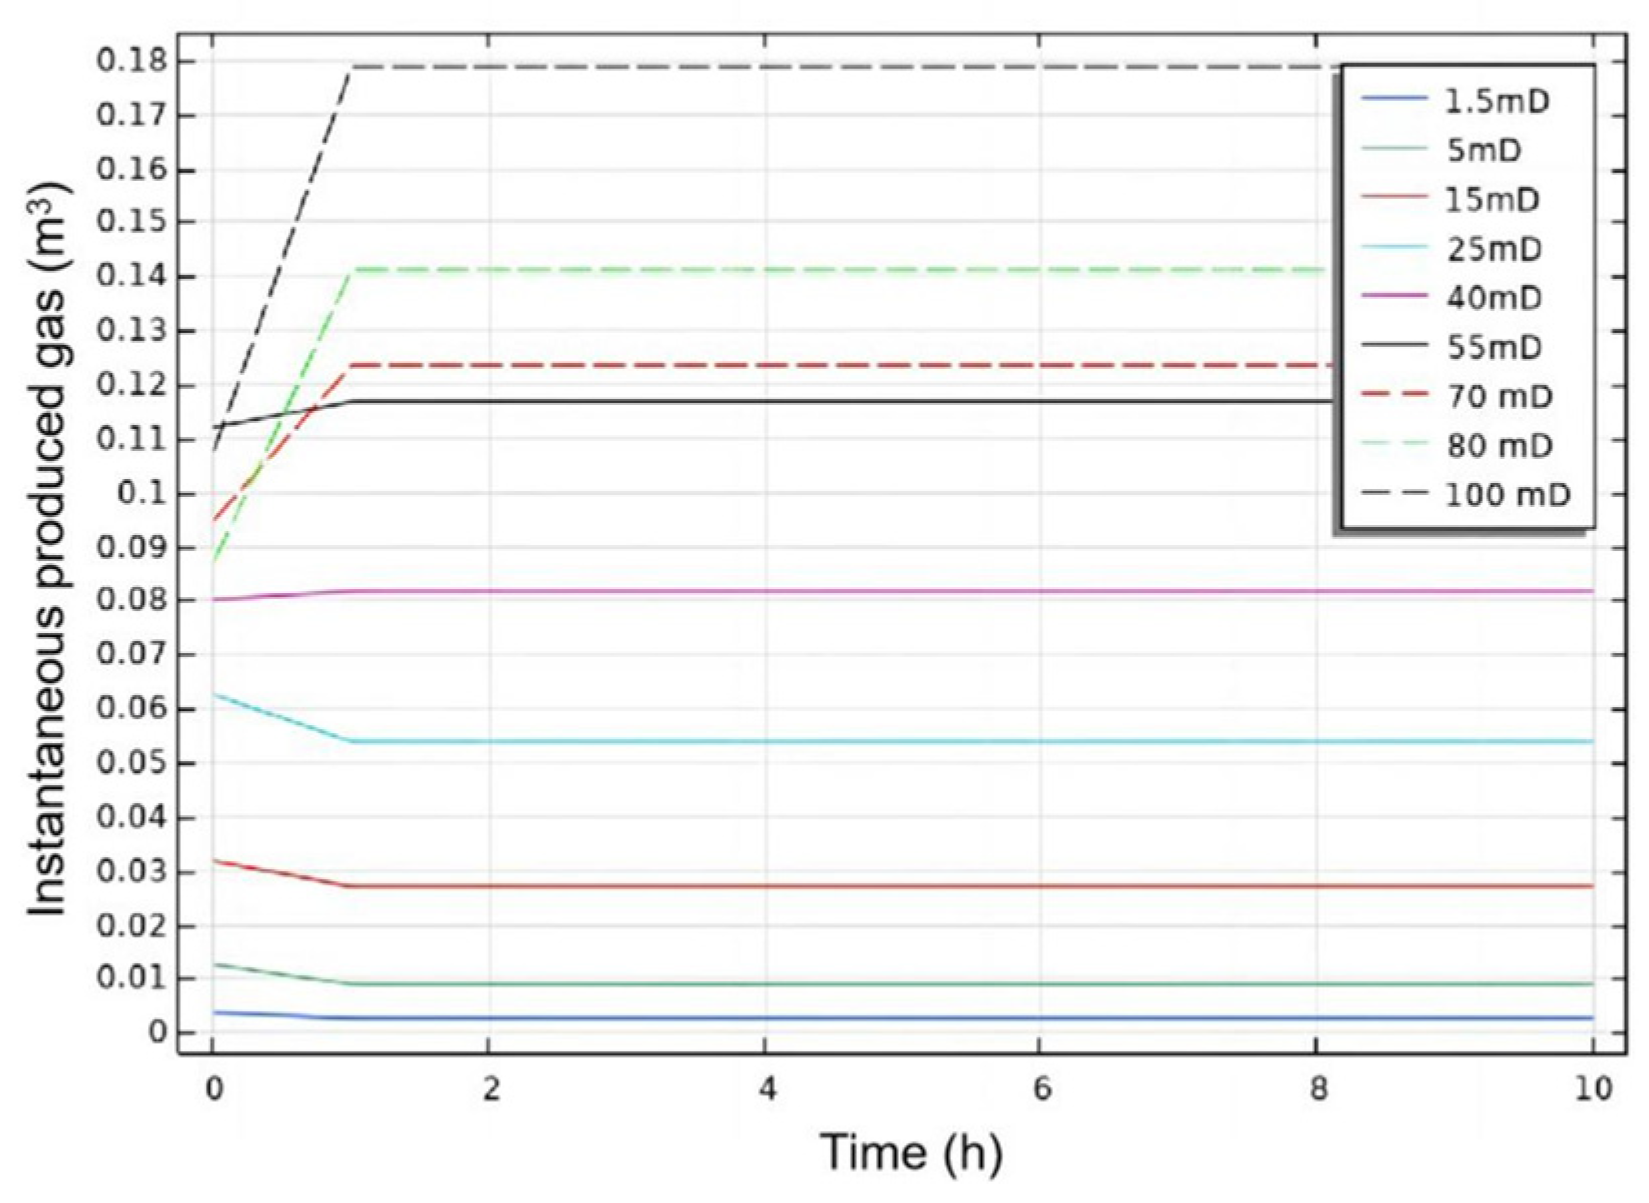
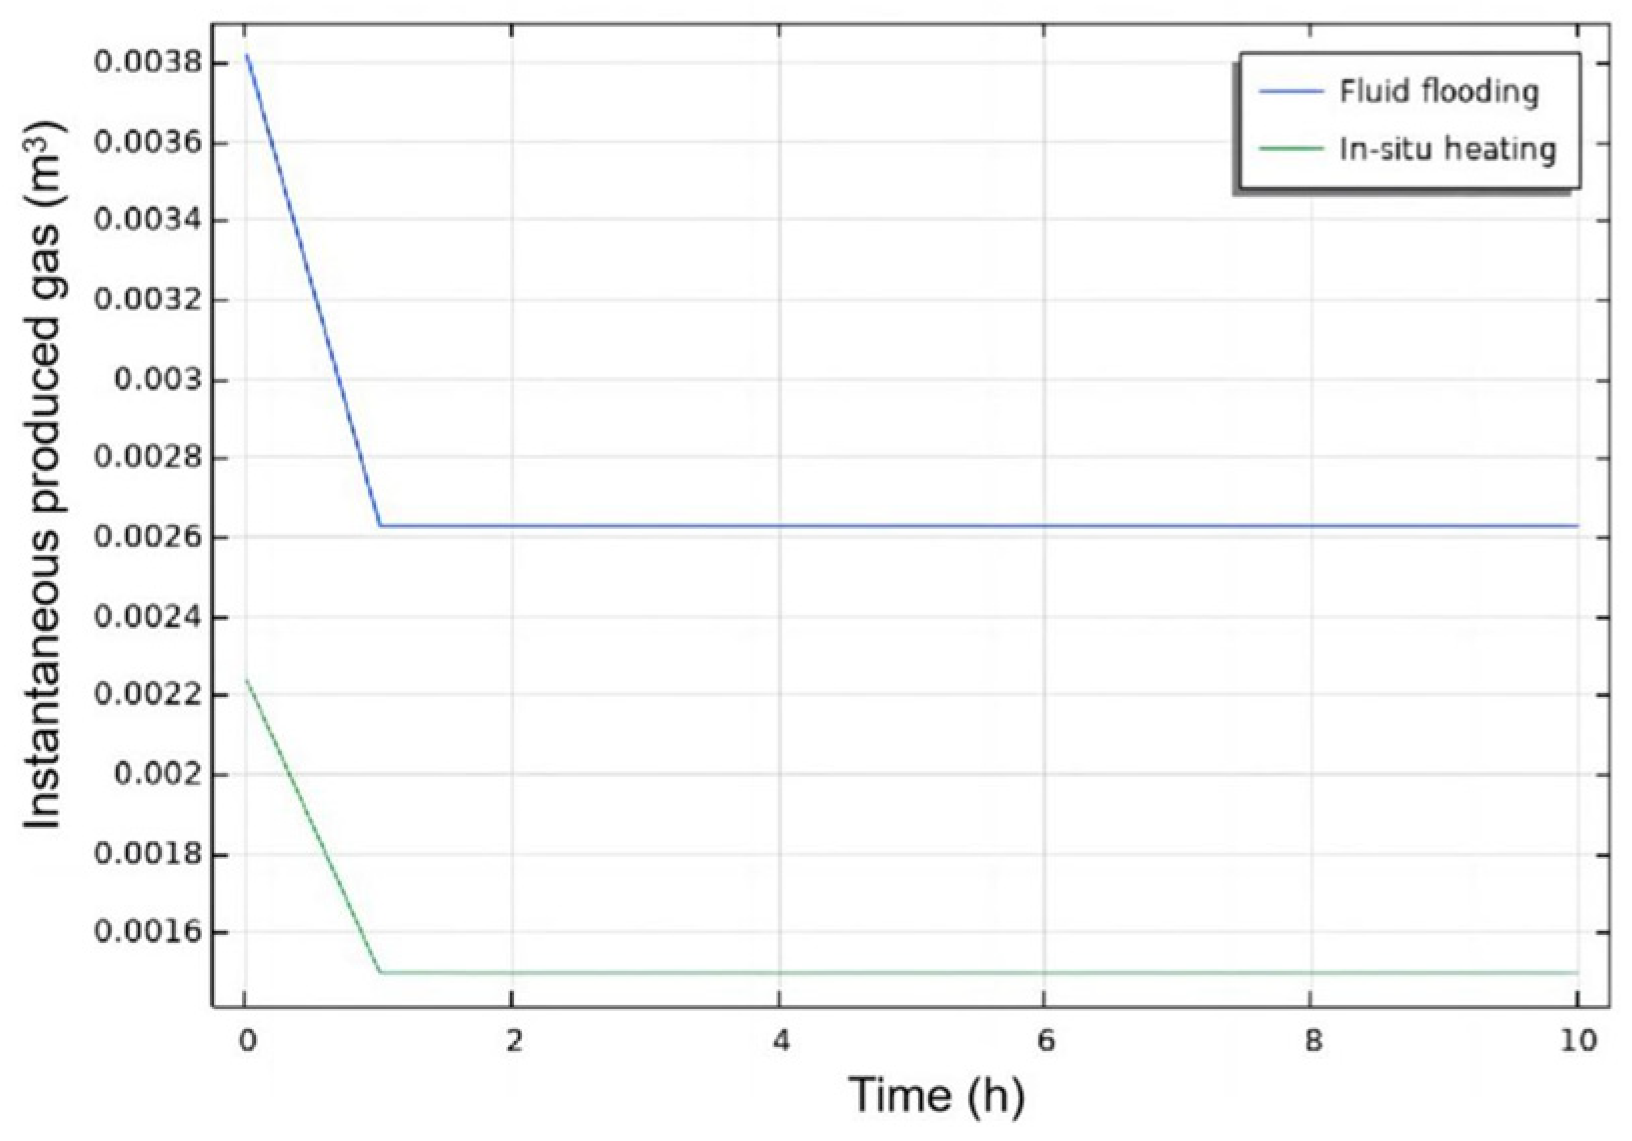
Assuming the gas production well is the same as the fluid injection well, so the produced gas flow direction is opposite to the injected fluid pathway. By calculating the gas saturation and average reservoir temperature after Stage 2, the reservoir pressure at the beginning of the production process (immediately conducted after the injection process) is calculated based on the equation of state, with gas yield subsequently simulated through Darcy’s law. Figure 22 displays gas production versus cumulative time under varying permeability conditions, while Figure 23 comparatively presents output data for two distinct fluid injection modes. The results indicate that the instantaneous gas production exhibits accelerated growth beyond the permeability condition of K > 40 mD. Comparative analysis of the two injection modes demonstrates that the fluid flooding method achieves 1.7-fold greater gas production than the in situ heating approach. Fluid flooding mode surpasses in situ thermal stimulation in gas recovery performance, primarily due to its capacity to optimize hydrate decomposition efficiency within the reservoir porous media.

3.4. Numerical Model Validation

3.4.1. The Experimental Case Selection

It is important to validate the practicability of the simulation model through comparing simulation data with the relevant experimental test. However, as mentioned in the introduction, existing self-heat chemical injection studies predominantly emphasize gas recovery performance over injection dynamics, with hydrate saturation evolution during chemical stimulation remaining underexplored in the published experimental literature. In contrast, gas production potential in self-heat generating fluid experiments has received prior research attention [27]. Therefore, the validation is conducted based on the gas production simulation method of this study and the production data from a previous self-heat thermal stimulation experiment [48]. Validation involves applying the proposed gas prediction model to simulate gas production performance in the reference case. The key parameters dominating the validation process are described in Section 3.4.2.

3.4.2. The Validation Process

The experimental setup employs NH4Cl + NaNO2-based gas stimulation test in a cylindrical vessel to simulate formation–dissociation processes within a hydrate reservoir. In this experimental study, Case 2 (documented on reference Page 40) serves as the validation case due to production method consistency with this study’s simulation scheme. The validating numerical model is constructed using the production estimation methodology outlined in Section 3.3.
The reservoir condition of the model and the production protocol are adopted from the selected experiment. The numerical simulation employs a 2D geometric model with equivalent volume (1.76 L) to the experimental reactor’s effective vessel bulk volume. The model initializes three-phase saturations using experimental parameters, with injected NH4Cl + NaNO2 concentration matching the reference data (5 mol/L). The self-heating fluid injection rate is quantified via Equation (10), under the proportionality premise between flow rate and model geometric bulk. In Equation (10), Vc is the volumetric flow rate, m3/s; BV is the model bulk volume, m3. Since Vcbase = 1.33 m3/s, BVbase = 2 m3 in the base case of Section 3.3, BVverified is 0.88 × 10⁻³ m3 due to the symmetry design of the simulation model, and the calculated Vcverified is 5.8 × 10⁻⁴ m3/s. The validated model’s volumetric flow rate feeds into the validation framework to compute experimental case water saturation (Equation (11), Sw).
V c b a s e V c v e r i f i e d = B V b a s e B V v e r i f i e d
The gas production simulation is conducted under experimental reservoir parameters and specified injection conditions. Simulation outputs quantify produced gas fractions within the bulk volume Equation (11). Equation (5) is used to calculate Sw. Two assumptions are made to conduct the gas fraction calculation: (1) Hydrate achieves complete dissociation in the sand-pack model upon gas production termination; (2) the ideal gas equation of state Equation (12) determines produced gas characteristics under the assumption that compressibility factor equals 1.
V g v o l = S g = 1 S w
n = P V R T
In Equation (12), n is the amount of gaseous substance (mole), P is pressure (Pa), V is gas volume (m3), R is molar gas constant (J/(mol·K)), and T is temperature (K). In Equation (14), subscript 1 represents condition in sand-pack model, and 2 for room condition. V1 is calculated from Equation (13), where φ = 0.405. The calculation result of the Vgvol in Equation (11) is 0.78 according to the simulation output.
V 1 = B V v e r i f i e d φ V g v o l
Equation (12) under reservoir and room conditions exhibits mutual correlation through n1n2 equivalence. Equating n1 = n2 in Equation (14) yields produced gas volume V2, which is 5.7 MPa·(0.88 L·0.405·0.78)/101 KPa·293 K/281 K = 16.36 L.
V 2 = P 1 V 1 P 2 T 2 T 1
Experimental gas production is the value of 16.57 L, as shown in the reference, and the numerical–experimental discrepancy is 1.3%, based on the calculation result. The numerical model thus validates gas production prediction accuracy in the self-heat generation fluid stimulation. In the future, laboratory experiments will be conducted to further validate the simulation model applicability by analyzing hydrate saturation evolution during the self-heat fluid injection process.

3.5. Numerical Stability Validation

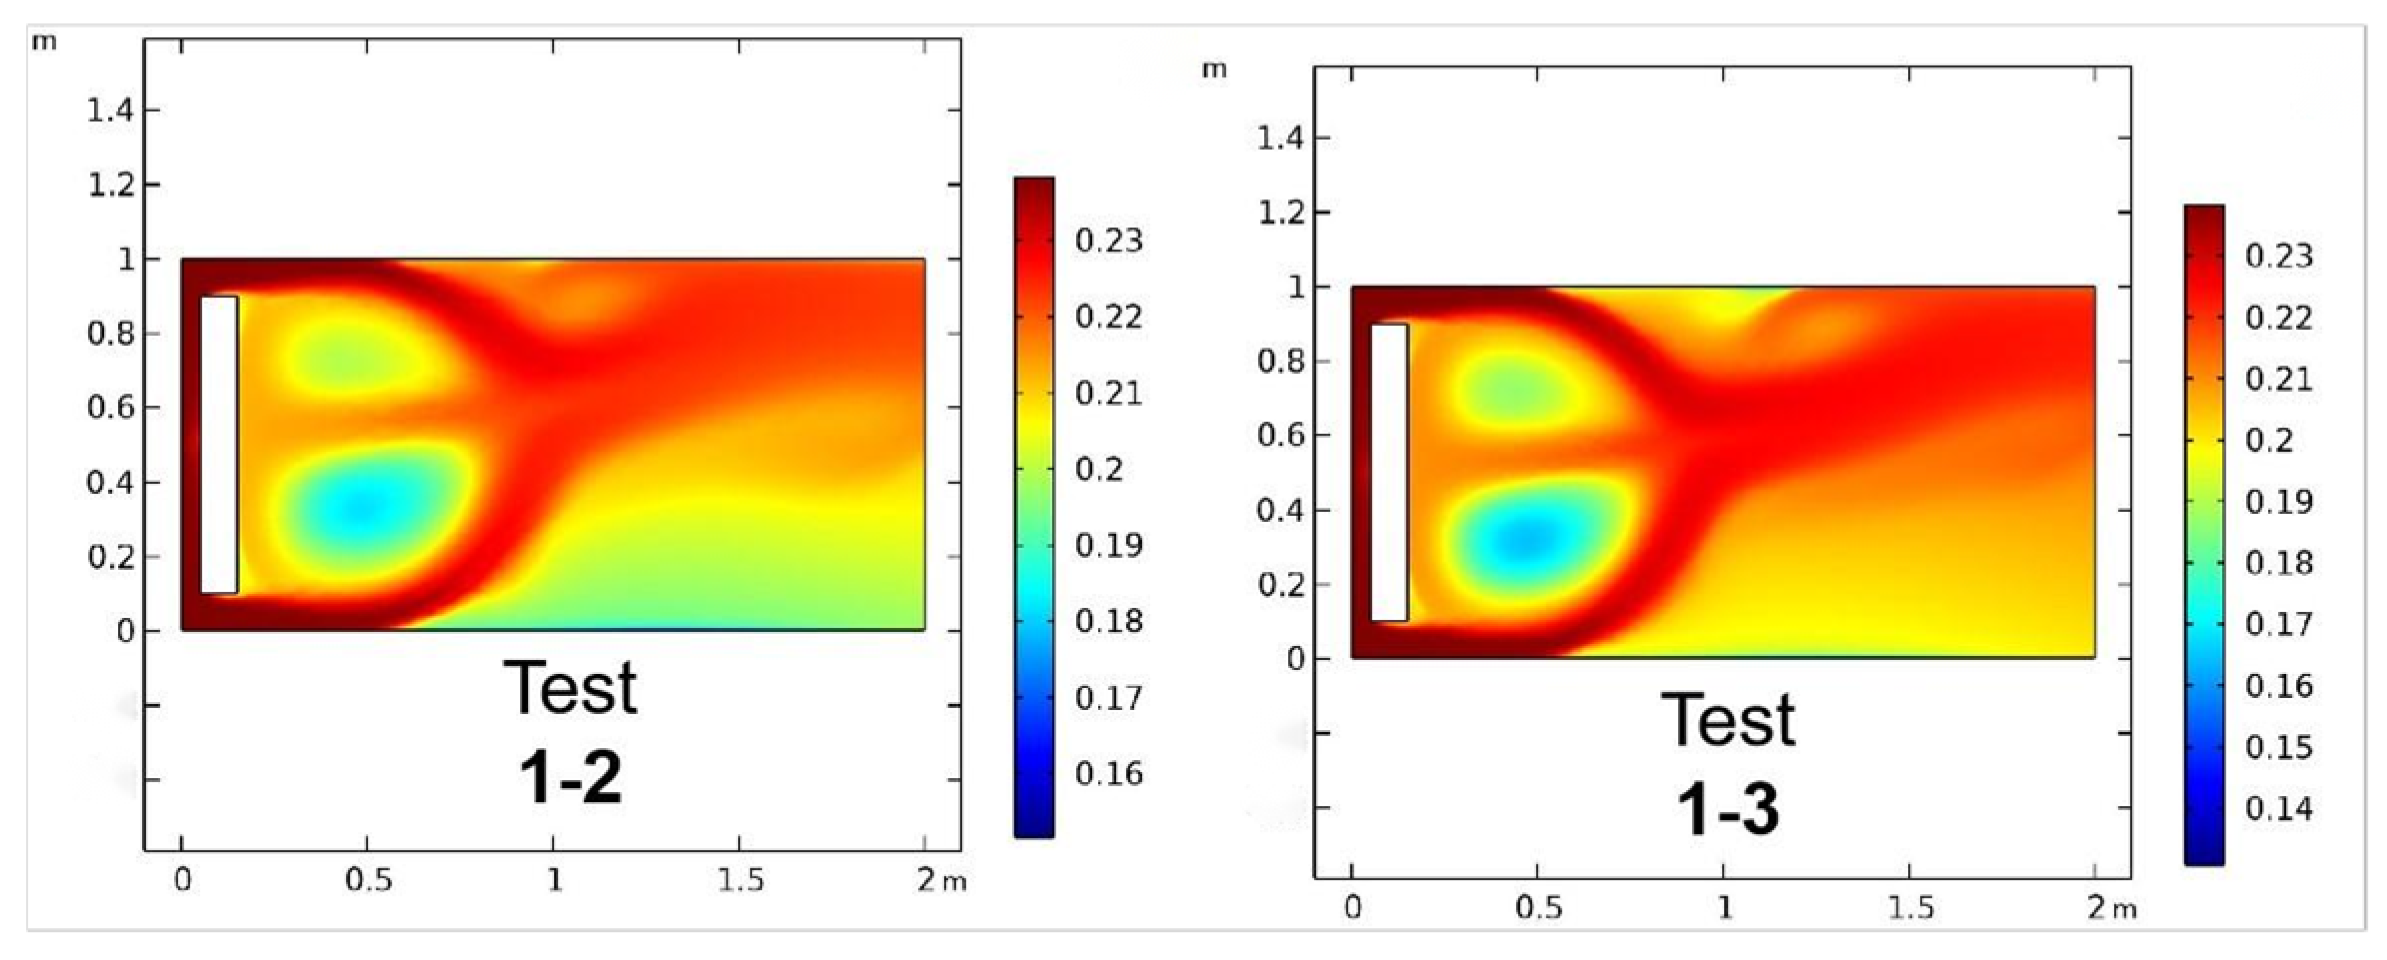
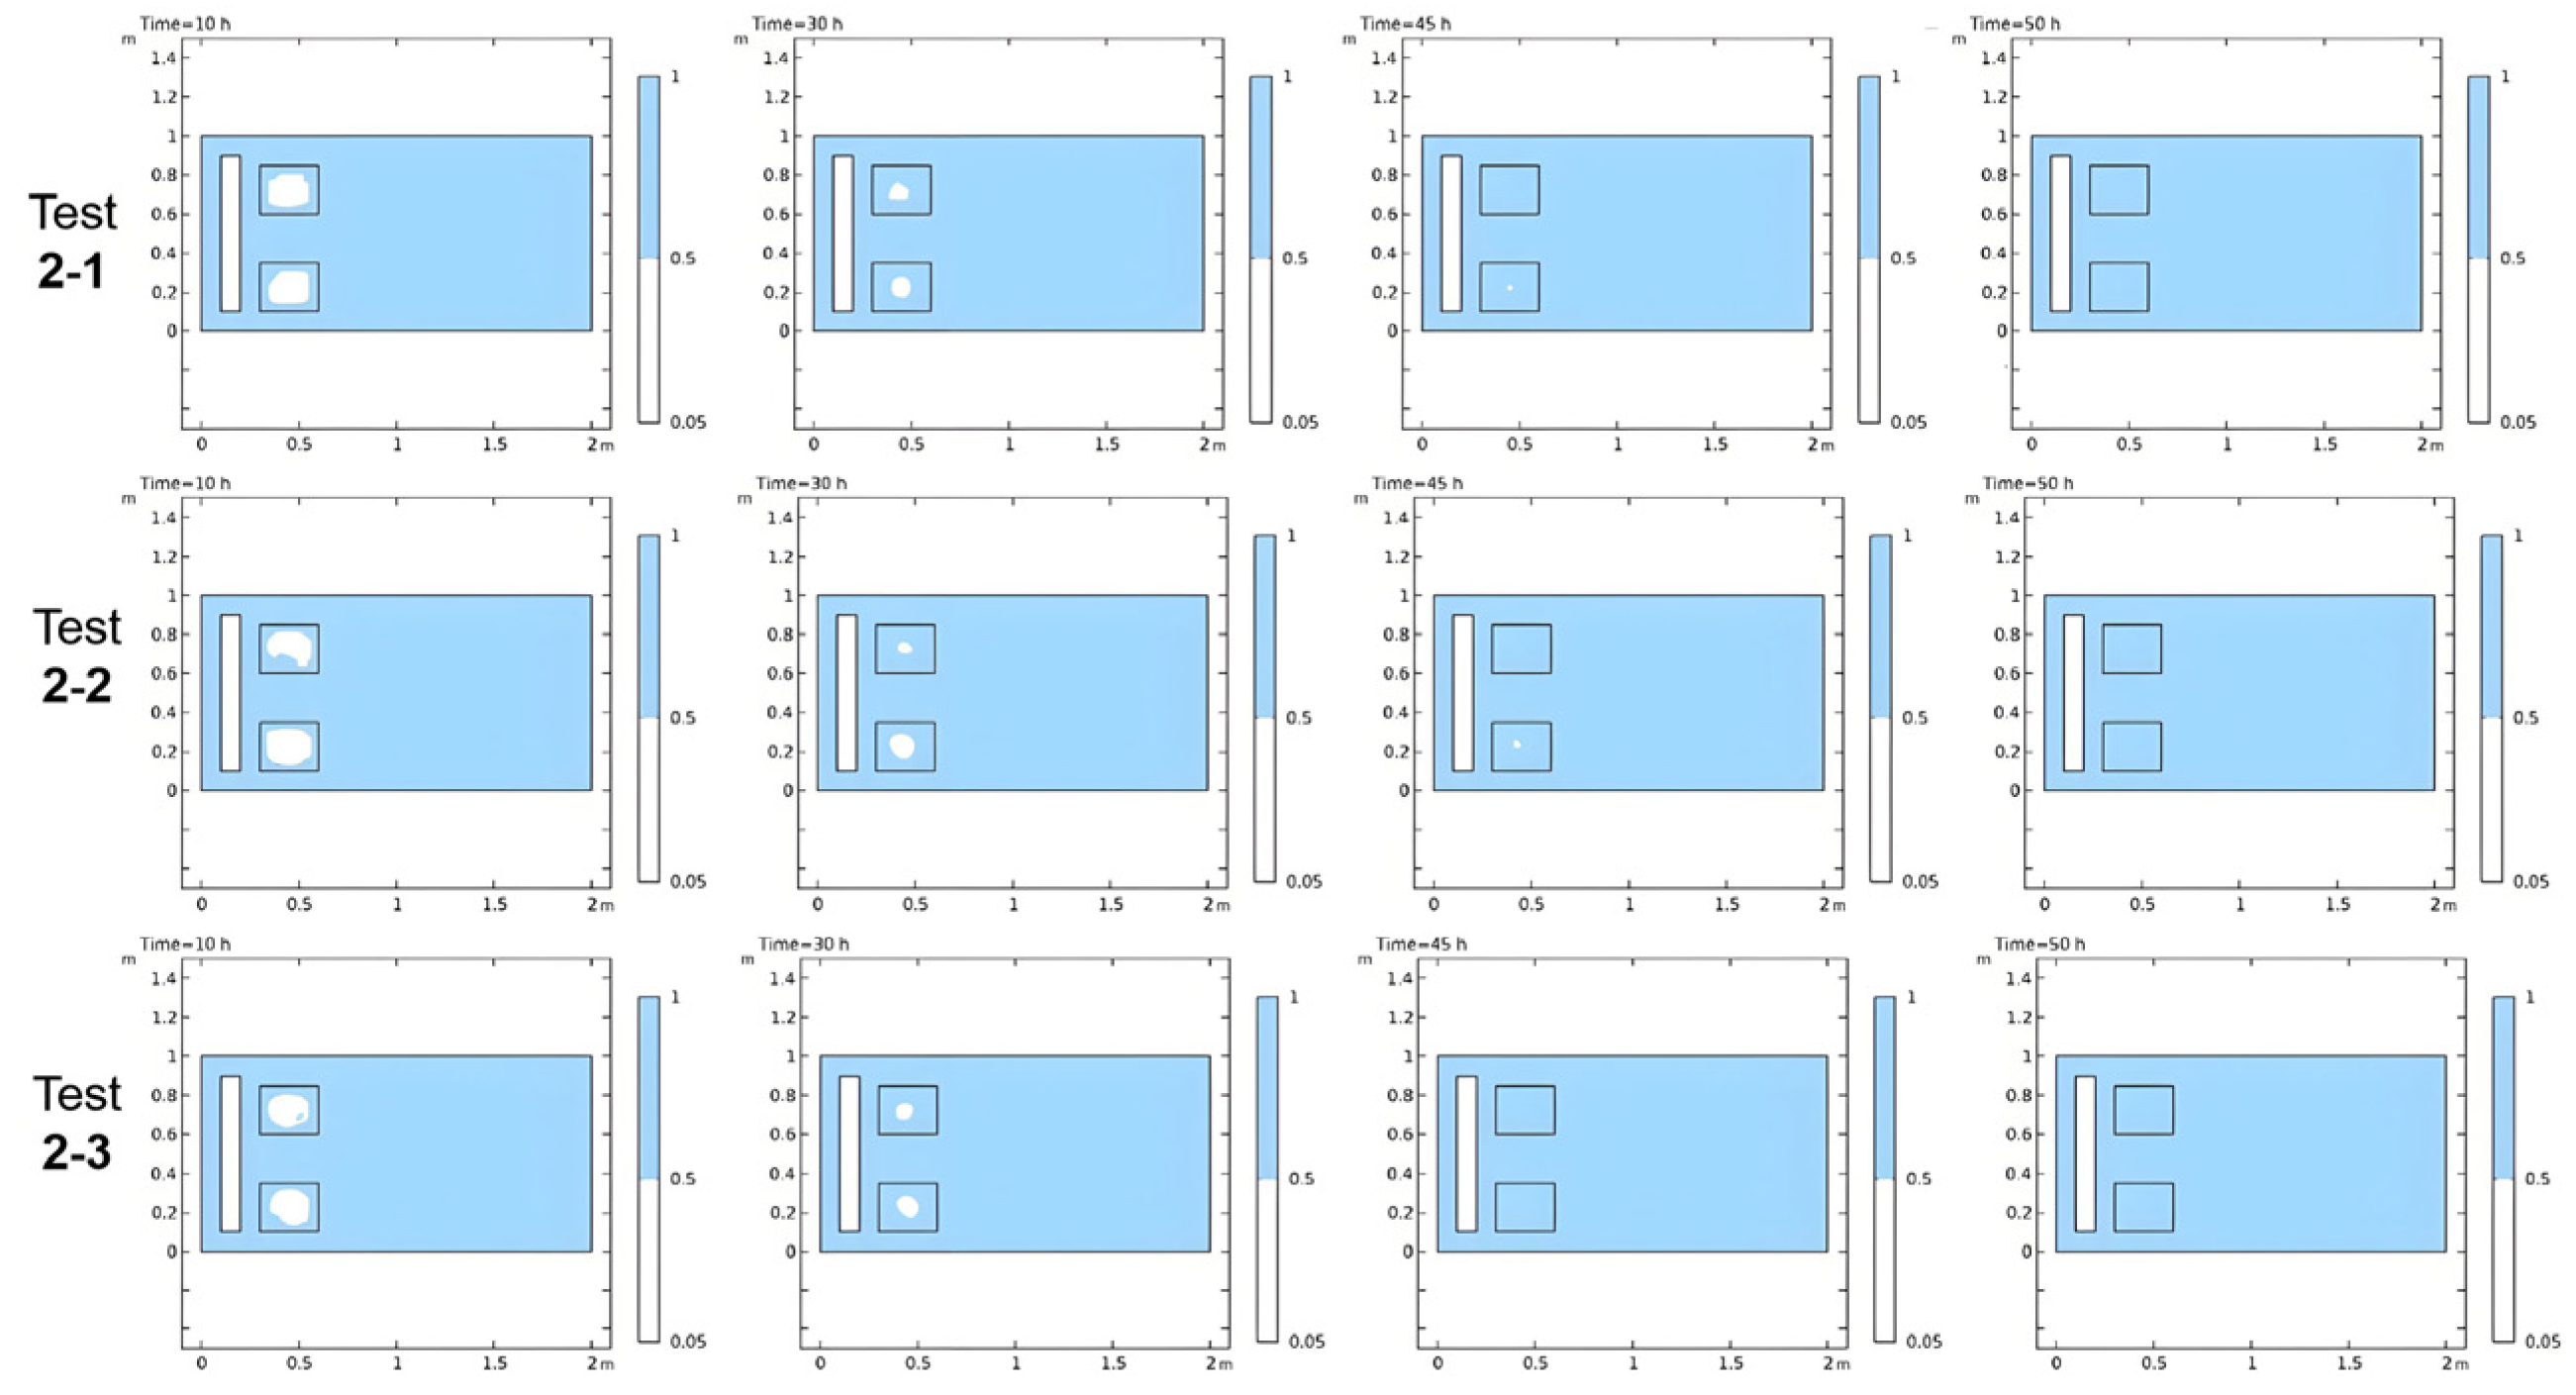
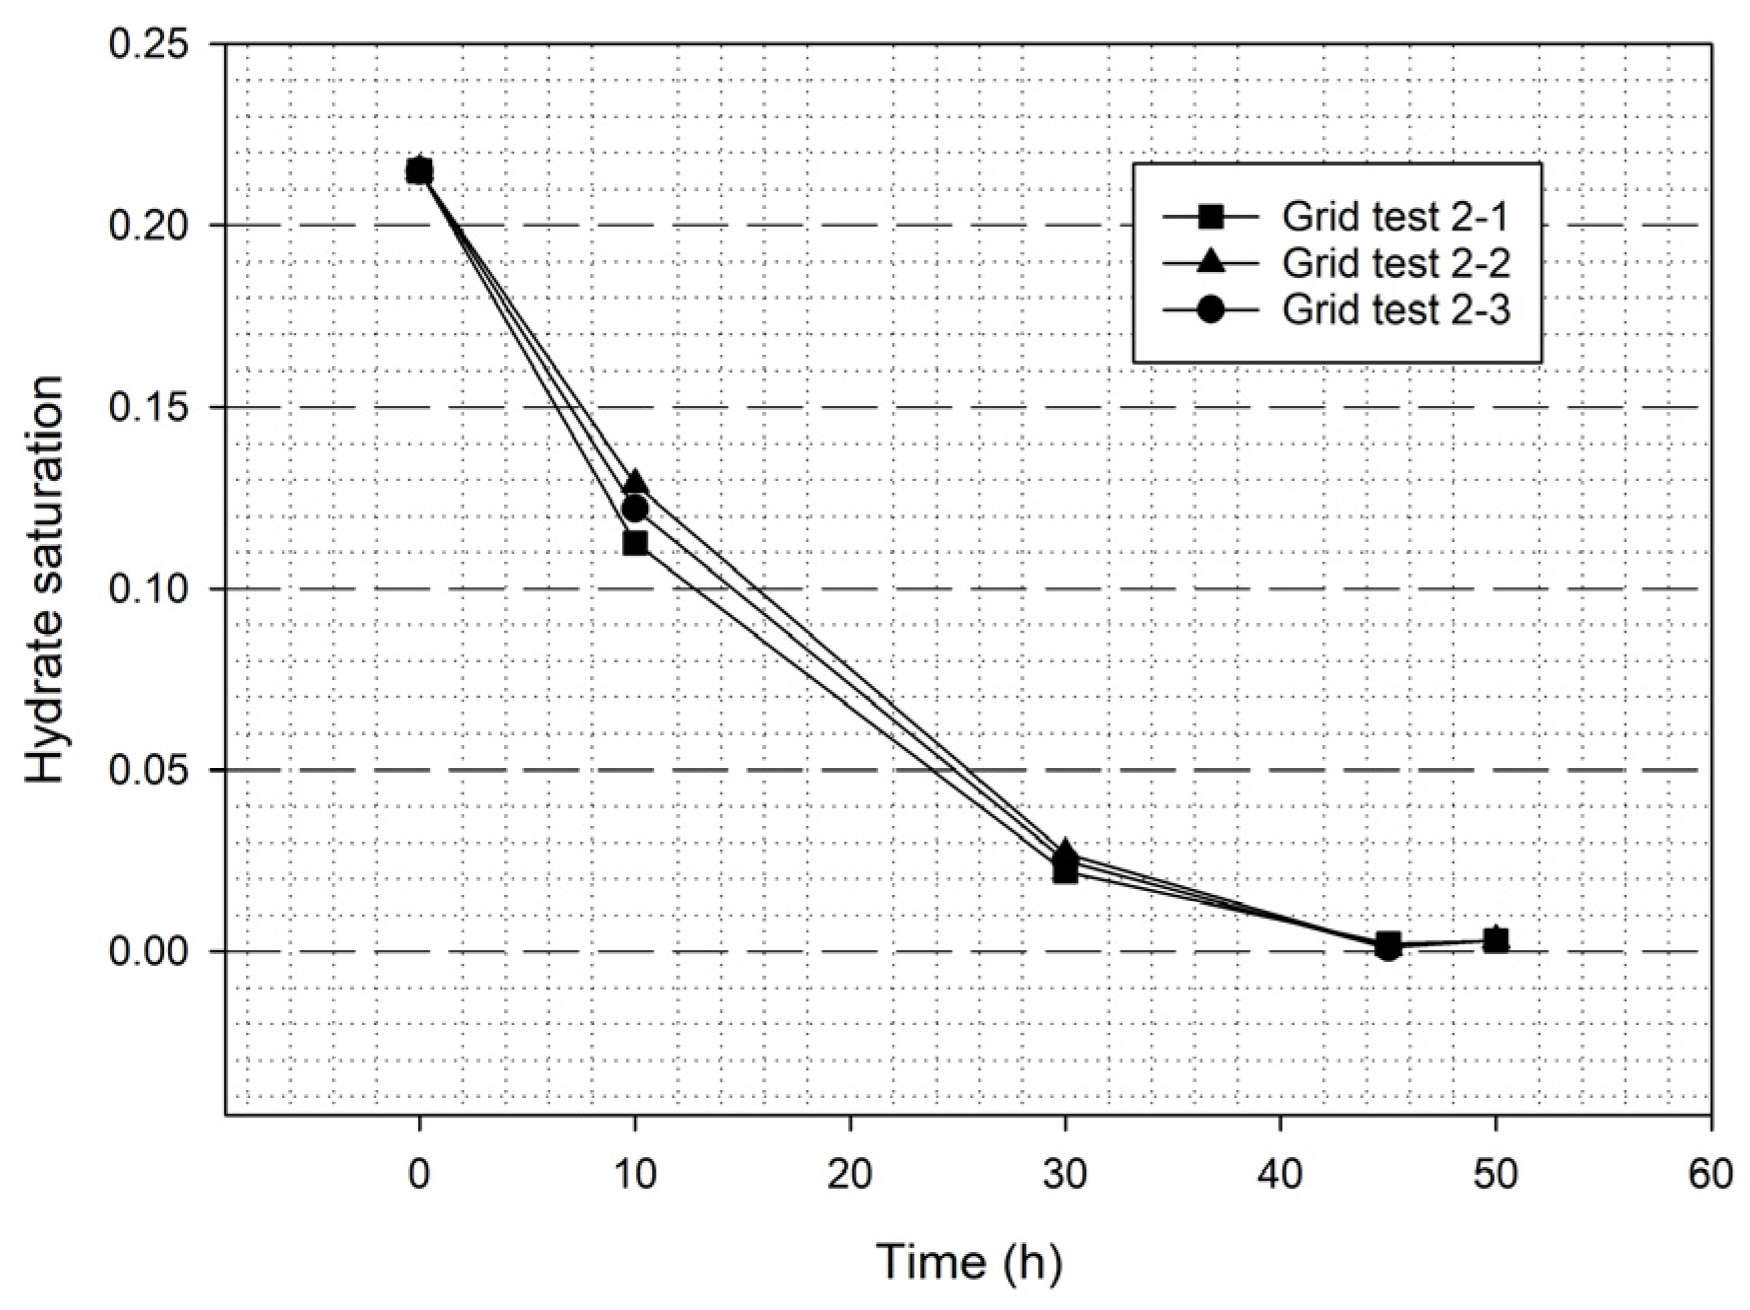
Numerical stability validation is conducted using different refining grids. Based on the computational discrepancies of hydrate saturation values under different grid densities, the numerical model’s calculation errors are analyzed and the relevant results are presented in Table 5. For Stage 1, hydrate saturation profiles for Test 1-1 are shown in Figure 2, while those for Tests 1-2 and 1-3 are shown in Figure 24. For Stage 2, hydrate saturation comparing results are shown in Figure 25 and Figure 26. As shown in the grid density distribution map (Figure 27), the grid density distribution provides a visualization of the mesh configuration.
For Stage 1, the hydrate saturation calculation results represent saturation calculation accuracy. As shown in Table 5, three grid refining cases show relatively negligible changes. The mean absolute deviation (MAD) of each test number of data relative to the baseline (Test 1-1) is 0.0022 for Test 1-2 and 0.0005 Test 1-3; the MAD between the data of two compared tests and the baseline is extremely low (<1.1%).
For Stage 2, all data maintain changes within the same order of magnitude. The MAD of each test number of data relative to the baseline (Test 2-1) is calculated at different times, and the results show the MADs of Test 2-2 and 2-3 are 0.0018 and 0.0012, respectively, which are both lower than 0.002.
In short, all deviations of Stage 1 and 2 are within the commonly accepted 5% MAD engineering tolerance threshold. The validation demonstrates that the computed hydrate saturation values exhibit minimal deviations under different grid refinement parameter conditions. Therefore, the insensitivity of hydrate saturation variation to grid refinement parameters (including element size, maximum growth rate, and curvature factor) validates the model’s stability, as it eliminates potential artifacts caused by mesh-related parameters.

3.6. Comparative Analysis with Prior Studies

3.6.1. Enhancing the Permeability-Secondary Hydrates Response Mechanism Study

Under the circumstance of employing different numerical simulation methodologies, varying research scales, and distinct hydrate decomposition mechanisms, this study has reached similar conclusions to previous research regarding the permeability threshold effect and provided complementary explanations. Specifically, previous studies utilized a large-scale reservoir model based on depressurization-induced decomposition of thermal–hydraulic–chemical (THC), indicating that high permeability (≥75 mD) accelerates fluid flow, leading to rapid heat dissipation and promoting secondary hydrate formation [49]. This study adopts a heat–mass transfer coupled near-wellbore model driven by self-heating to facilitate decomposition, proposing that secondary hydrates in the 55–70 mD range tend to form extensively due to the evolution of heat flow and thermal conductivity. Both studies demonstrate that high permeability intervals promote secondary hydrate formation. Additionally, this study reveals that under relatively low permeability conditions (<15 mD), localized heat accumulation occurs, which helps maintain high temperatures and inhibit secondary hydrate formation. This conclusion expands the understanding of permeability’s impact on secondary hydrate formation during hydrate decomposition.
In short, this study and previous research jointly reveal the controlling role of permeability on secondary hydrate dynamics from different perspectives (thermodynamics vs. fluid dynamics), enhancing mechanistic understanding and supporting the argument of this study that heating near the wellbore is recommended for mitigating secondary hydrates.

3.6.2. Complementing Existing Research on Heat Transfer Mechanisms

Although this study suggests that the fluid flooding mode of self-heat fluid can achieve higher hydrate decomposition efficiency compared to in situ injection, it only discusses one heating mode of continuous local heat release in in situ wellbore; however, previous research indicates that the in situ heat generation mode under huff-puff injection can yield higher hydrate decomposition gas production than heat flooding [50]. The inspiration from this study for our research is that in terms of the heat generation mechanism of self-heating system injection into hydrate reservoirs, a combination of flooding and huff-puff in situ heating can be designed to potentially maximize the advantages of both injection modes. The combination of the two can possibly create a composite thermal transfer mechanism of “macro-convection + micro-reaction”. Additionally, the huff-puff in situ heating method can be attempted to reduce the risk of residual secondary hydrate formation near the wellbore under 55–70 mD conditions.

3.6.3. Synergistic Findings in Formation Heating Modes with Other Studies

The large-scale numerical simulation of seawater flooding and the self-heating fluid flooding around the wellbore in this study jointly demonstrate that the combination of thermal convection and thermal conduction is more efficient than static thermal conduction in terms of heat transfer efficiency [51]. Regarding the inhibition of secondary hydrate formation, due to the low thermal conductivity of sediments [52], both the in situ heating method in this study and wellbore electrical heating exhibit localized and delayed thermal energy diffusion [47]. Therefore, this study, along with current electrical heating studies, reveals the role of external heat source types in controlling hydrate dissociation and secondary formation.

3.7. Evaluation of Self-Heat System’s Impact on Methane Hydrate Decomposition: Quantitative Heat Release and Chemical Product Effects

3.7.1. Energy Efficiency Analysis: Self-Heat System Driven CH4 Hydrate Decomposition

For reaction equation (Equation (1)), the reaction enthalpy of 1 mol of the chemical heating system (1 mol NaNO2 + 1 mol NH4Cl) is −332.58 kJ/mol. The decomposition of 1 mol of methane hydrate requires 55 kJ of energy [53]. Under the assumption of neglecting heat transfer in the porous medium and fluids of the formation, the heat released by the self-heat system reaction can be totally utilized for the decomposition of methane hydrates. Therefore, the amount of methane hydrate decomposed by 1 mol of exothermic reactants is calculated by dividing the total energy released by the energy required to decompose 1 mol of methane hydrate, which is 332.58 kJ/55 kJ/mol = 6.05 mol.

3.7.2. NaNO2/NH4Cl Heating Effect and Hydrate Dissociation Performance

In order to assess the heating performance of the NaNO2 + NH4Cl exothermic system under different reactant mass concentration conditions, a series of temperature rise experiments has been conducted with varying reactant mass concentrations. The main experimental instrument is an insulated reactor with temperature-acquisition capability (Chengdu, China) (Figure 28). The key step is to inject reactants (chemical products from Chengdu, China) into the sealed reactor via the liquid injection while collecting temperature data. By altering the mass concentration ratio of the reactants, the temperature changes have been obtained in the reactor under different concentration ratios, while keeping the dosage of the heating control agent (hydrochloric acid concentration) constant during the experiment. The results show that the peak temperature increase in the system rises with higher reactant dosage. The post-reaction system temperatures under different reactant mass concentration ratios are shown in Figure 29. Considering both the heating effect and cost, the optimal reactant concentration ratio combination is 6% NaNO2+ 7% NH4Cl. More experimental details will be published in future works.
The calculation method for heat release and decomposed gas molar number can be outlined as follows: assuming the total mass of the solution is 1 kg, different reactant concentration ratios correspond to varying heat release amounts of the heating system. Based on the molar ratio of the two reactants, the reactant that determines the heat release can be identified. By combining the molar mass, mass concentration, and total mass of the relevant reactants, the molar number of the reactant reaction can be calculated. As the reaction enthalpy value of the chemical heating system per 1 mol is confirmed (332.58 kJ), the heat release of the reaction system under this molar number can be determined. By combining the energy required for the decomposition of 1 mol of hydrate (55 kJ/mol), the molar number of methane hydrate that can be decomposed under this heat release is calculated as shown in Table 6.

3.7.3. Quantity Comparison Between Reaction-Generated N2 and Hydrate-Dissociated CH4

In order to compare the amount of nitrogen (N2) produced in the exothermic reaction with the methane released from hydrate decomposition, the molar quantities of N2 generated and methane decomposed from hydrates under the aforementioned different reactant mass concentration ratios are calculated. The calculation method for the moles of N2 is as follows: First, calculating the mass of the reactants based on the mass concentration of the reactants and then determining the moles of the reactants using the molar mass. Next, considering the reactant with the smaller number of moles as the basis for determining the moles of N2, and then calculating the moles of N2 based on the stoichiometric ratio.
The influence level of nitrogen gas (N2) on methane hydrate decomposition is relatively insignificant. According to the N2 mass calculation under various reactant mass ratios (Table 6), the N2 mass is obviously lower than that of the hydrate-dissociated gaseous CH4, indicating that the partial pressure of N2 may slightly reduce the phase equilibrium pressure of methane hydrate, yet the effect is restricted.
The quantified correlation between injected N2 condition and methane hydrate extent has been studied recently in the hydrate research field. N2 injection has been experimentally proved to promote methane hydrate replacement kinetics, as evidenced by NMR (Nuclear Magnetic Resonance) data, revealing that N2 is selectively trapped in small cages (512) and enhances guest molecule exchange; however, the research of the pure N2 gas replacement effect on methane hydrate decomposition is conducted within the temperature range of 268.8–278.2 K [54], which is beyond the temperature range of this work (>286.2 K for simulation and 298.2 K for lab test), so the corresponding conclusion that the impact of N2 on methane hydrate dissociation increases with higher temperature and lower injection pressure can hardly explain the influence of N2 existence on this study’s hydrate decomposition, which means the clear effect of produced N2 on methane needs to be validated under more practical reservoir conditions in the future.

3.7.4. The NaCl Effect and Crystallization Tendency

As a thermodynamic inhibitor, the presence of NaCl critically influences methane hydrate stability by shifting the phase equilibrium condition, which necessitates the evaluation of the NaCl effect on methane hydrate dissociation [55,56]. A previous experimental study indicates that the impact of NaCl aqueous solution on methane hydrate crystallization demonstrates concentration-dependent behavior, and a concentration of 1.2 mol/L NaCl represents the critical threshold where its influence on methane hydrate formation shifts from promotion to inhibition [57]. In this study, the concentration of 1.2 mol/L NaCl serves as a critical threshold for determining whether in situ generated NaCl facilitates hydrate dissociation. As shown in Table 6, the calculated NaCl concentrations for each concentration ratio fall within the range that does not induce hydrate deformation. However, further calculation implies that 8.5 wt%NaNO2 + 7.0 wt%NH4Cl represents the critical reactant mass ratio threshold for hydrate inhibition, since its NaCl molar density reaches 1.28 mol/L.
The solubility of sodium chloride increases slightly with rising temperature. Therefore, the solubility under the lowest temperature (room temperature) condition during the experiment is used as the critical indicator for investigating sodium chloride crystallization. At 25 °C, the solubility of sodium chloride is 36.0 g/100 g water, which converts to a molar concentration of 5.4 mol/L. Additionally, the solubility of sodium chloride under actual hydrate reservoir conditions (15 °C) is 35.8 g/100 g water, equivalent to a molar concentration of 5.1 mol/L. Under the current reaction conditions studied, the molar concentration of the reaction product NaCl is less than 1.0 mol/L. Therefore, neither under experimental conditions nor at the actual hydrate reservoir temperature will sodium chloride crystallization or precipitation occur. Although the concentration of sodium chloride theoretically remains within the crystallization-free range in this investigation, the potential for NaCl crystallization remains a noteworthy concern in self-heat-fluid-based hydrate reservoir extraction methods, warranting continued attention and research in the future.
In short, NaCl exhibits concentration-dependent effects on methane hydrate stability, with 1.2 mol/L as the critical threshold where its role changes from enhancing formation to accelerating deformation, while reaction-generated NaCl concentrations (<1.28 mol/L) remain below thresholds, inducing hydrate growth promotion under reactant mass ratio conditions listed in Table 6. With 7.0 wt%NH4Cl, the percentage of NaNO2 needs to be higher than 8.5 wt% to trigger the NaCl hydrate inhibition effect. Theoretical calculations confirm that NaCl concentrations (basically below 1.0 mol/L) remain far lower than solubility thresholds (5.1–5.4 mol/L) under all tested conditions, preventing NaCl crystallization.

3.8. Recommendations for Field Application

From the perspectives of engineering design (Section 3.8.1) and field operation optimization (Section 3.8.2 and Section 3.8.3), the following discussion explores the practical implications of numerical simulation results for in situ applications.

3.8.1. Permeability-Graded Design for Secondary Hydrate Control

(1)
Prioritize low-permeability reservoirs (K < 15 mD)
Simulations indicate that in this range, self-heating fluid injection achieves complete hydrate dissociation without secondary generation (as discussed in Section 3.2). It is recommended to prioritize such reservoirs during target screening, based on in situ logging data.
(2)
For reservoirs with permeability of 15–55 mD
It is recommended to inject hydrate inhibitors before self-heating working fluid to prevent secondary hydrate formation during the later injection phase.
(3)
Avoid high-risk permeability zones (55–70 mD)
Severe secondary hydrate formation might occur in this range. Such reservoirs should be excluded in engineering design, or alternative composite techniques should be employed to reduce risks.

3.8.2. Field Operation Optimization: Thermal Front Dynamic Control

Thermal front propagation speed: It is suggested to dynamically adjust the thermal front’s advance speed based on reservoir permeability. Low-permeability reservoirs (K < 15 mD): a constant high flow rate is recommended to rapidly exceed the dissociation threshold. Medium-permeability reservoirs (15–55 mD): adjusting injection volume flexibly to increase flow rate early to establish thermal fields and reduce it during mid-phase to prevent secondary generation.

3.8.3. Field Operation Optimization: Real-Time Monitoring and Feedback Control

In self-heat fluid-assisted hydrate extraction, it is advised to deploy DTS (Distributed Temperature Sensing) to track thermal fronts monitoring near-wellbore temperature gradients in real time; additionally, using numerical simulations to refine injection parameters, which prevents premature heat dissipation. In addition, adding pressure monitoring points to dynamically adjust injection parameters and to warn of secondary hydrate blockage risks based on pressure changes.

3.9. Limitations and Future Work Directions

This study numerically demonstrates that the self-heating fluid injection method represents an effective strategy for inducing controlled gas hydrate dissociation through thermally stimulated processes; in addition, this investigation employs numerical simulation methods to quantitatively analyze the evolution of hydrate saturation in marine sediments characterized by multi-phase fluid flow dynamics. The computational results provide insights for designing laboratory experiments by identifying optimal reservoir parameters and thermal stimulation scenarios through self-heating fluid injection techniques; however, several limitations and relevant future research directions should be acknowledged, as detailed below.

3.9.1. The Assumption of Isotropic and Homogeneous Porous Media

The central research problem of this study investigates the variation patterns of hydrate saturation during self-heating fluid injection in the near-wellbore region. As the first foundational model exploring this injection process, addressing the primary research question necessitates engineering simplifications regarding other factors. The influence of heterogeneity and anisotropy within the 2 m near-wellbore zone is provisionally treated as a secondary consideration, with the associated reason, potential impacts, and current offsets detailed below.
(1)
The reason for the simplification
Based on hydrate dissociation sensitivity study focusing on sample uniformity, the hydrate dissociation rate constant is highly sensitive to the medium permeability K of hydrate-bearing sediments [58]. Therefore, the homogeneous reservoir assumption in this study can decouple the cross-influences between reservoir permeability heterogeneity and chemical reaction kinetics on gas–aqueous phase transformation, thereby meeting the requirement for engineering simplification. Additionally, a strong coupling relationship exists between hydrate saturation and permeability anisotropy [59]. To reduce computational costs for the primary mechanistic indicator (hydrate saturation) and clarify dominant variables, this study avoids the interference of reservoir anisotropy on the main control mechanisms of hydrate saturation.
(2)
Potential implications for the results
The advance velocity of the thermal front is overestimated: the lower vertical permeability in actual reservoirs may lead to redistribution of thermal fluids, causing the thermal compensation advantage in fluid displacement mode to remain unverified in heterogeneous formations.
The degree of hydrate saturation reduction is overestimated: vertical permeability attenuation caused by sedimentary bedding may inhibit the vertical diffusion of thermal fluids, leading to an overestimation of hydrate saturation reduction in strongly anisotropic formations.
Increased uncertainty in the threshold for secondary hydrate formation: under the same macroscopic permeability, isolated pores and connected pores have different inhibitory effects on secondary hydrate nucleation. Therefore, conclusions about the threshold for secondary hydrate formation may deviate due to variations in pore structure.
(3)
Current offset strategies
The current offset strategy is the sensitivity analysis regarding intrinsic permeability in this study. The sensitivity analysis sets a permeability variation range of 1.5–100 mD, which in fact covers the fluctuation amplitude of permeability after equivalent treatment of heterogeneous and anisotropic reservoirs. This approach compensates for the limitations of heterogeneity and anisotropy simplification to some extent.
(4)
Future plans
Future research will focus on developing multi-scale models that incorporate heterogeneous and anisotropic properties of marine hydrate-bearing sediments. Advanced layer design techniques will be considered to characterize reservoir heterogeneity for the improved hydrate saturation prediction.

3.9.2. Hydrate Saturation-Geomechanical Assumption

(1)
The rationality of geomechanical effects simplification
To facilitate the initial analysis of hydrate saturation variation characteristics during the self-heat fluid injection process, while simplifying computational complexity and emphasizing the influence of formation properties on the study objectives, this research adopts a decoupling approach between mechanical properties and hydrate saturation. The specific analysis proceeds as follows.
The current model focuses on “coupled heat-mass transfer mechanisms” and serves to validate its feasibility during the injection process specifically, which requires prioritizing the solution of the fundamental scientific issue of thermal–fluid coupling. For gas hydrate reservoirs in the Shenhu area of the South China Sea, which is primarily composed of clayey silt, thermal conduction dominates the “coupled heat-mass transfer” process during hydrate dissociation, while mechanical responses can be considered secondary factors. Additionally, the current model aims to rapidly validate the decomposition efficiency of self-generating thermal fluids. The incorporation of mechanical coupling would significantly increase model complexity and potentially obscure the dominant thermal activation-driven decomposition mechanism, as the mechanical strength of hydrate reservoirs remains highly correlated with multiple fundamental formation properties. For example: (1) The linear positive correlation between hydrate saturation and sedimentary shear strength [60]. (2) The nonlinear negative correlation between permeability and effective confining pressure [61]; the dominant effect of confining/overburden stress on the sedimentary porosity and permeability evolution [62]. (3) The dependence of pore structures and sedimentary particle heterogeneity on effective stress [63]. (4) The impact of stress change on sedimentary creep effect through pore destruction [64]. The aforementioned studies indicate that geomechanical effect comprehensively controls various reservoir properties simultaneously, which means porosity, permeability, and pore structure are supposed to be considered as dependent variables once the mechanical characteristics are considered in the simulation model. This leads to model construction challenges in two aspects: 1. Nonlinear Equation Coupling: Temperature field (heat conduction equation) and saturation field (fluid transport equation) are affected by pore deformation feedback, forming strong nonlinear terms. 2. The alteration of reservoir geomechanical properties induced by hydrate decomposition necessitates continuous updates to permeability and porosity values. Consequently, it becomes particularly challenging to isolate a single independent variable during reservoir permeability sensitivity analysis. Those are the computational complexity reasons for the simplification.
(2)
Field Application Risks and Mitigation Strategies Analysis
The potential field-scale risks arising from decoupling hydrate saturation from reservoir geomechanical effects are outlined below, with each item incorporating corresponding preventive and compensatory engineering designs:
(1) Local overpressure during self-heat thermal fluid injection may induce micro-fractures. Operational pressure should be appropriately reduced to prevent excessive rock deformation.
(2) For field applications, to mitigate sediment strength reduction and potential geological collapse caused by hydrate saturation decline after thermal decomposition, it is recommended to inject rock consolidants during the later stage of self-heat thermal fluid operation to enhance sedimentary mechanical strength [65].
(3) For medium-high permeability reservoirs (15–55 mD), secondary hydrates during mid-stage injection initially increase then decrease, potentially triggering mechanical strength fluctuations and localized dynamic evolution of formation porosity/permeability. A real-time pore pressure feedback system must be deployed to monitor formation strain, so as to prevent wellbore shear failure, and dynamically adjust injection rates based on pore pressure changes.

3.9.3. Operational Parameter Limitations in Sensitivity Analysis

While the study evaluates the impacts of reservoir permeability and injection mode as dominant control parameters, it serves as a simplified condition because it does not explicitly address other critical operational variables. The relevant parameters and their potential influences are: (1) Reagent concentration: Influences reaction kinetics and heat generation potential. (2) Injection rate: Affects fluid distribution and thermal front propagation. (3) Initial temperature gradient: Modulates baseline heat transfer efficiency.
The simplification is adopted to prioritize the primary permeability-driven dissociation mechanisms in the first numerical exploration of self-heating fluid injection. Future work should expand sensitivity analyses to quantify the interplay of these parameters, particularly their combined effects on secondary hydrate reformation risks.

3.9.4. Validation Scope Limitation and Future Plans

(1)
Validation scale limitation
The validation is restricted to gas production data from a single experimental case (NH4Cl + NaNO2 stimulation) due to the scarcity of published experimental studies directly monitoring hydrate saturation evolution during self-heating fluid injection, and thus the current validation scope does not encompass direct measurement of spatial–temporal hydrate saturation dynamics, which represents a research gap for characterizing hydrate dissociation/reformation mechanisms.
(2)
Lab and field saturation validation plans
To address this limitation, we propose the following experimental and field-related research plans in the future:
(1) Lab-scale saturation monitoring application: designing reactor-based self-heat injection experiments with embedded NMR sensors to quantify real-time hydrate saturation distributions under controlled injection conditions (e.g., injection rate and reagent concentration) and to validate the conclusions of current numerical studies.
(2) Field data application: Collaborating numerical findings with offshore hydrate drilling projects data to calibrate the numerical model using in situ saturation logs from pilot thermal stimulation tests, leveraging well-log interpretations that quantify porosity–permeability evolution as functions of hydrate saturation.

3.9.5. Limitation of Phase-Specific Hydrate Regeneration Modeling

In the self-heat fluid injection model, the secondary hydrate regeneration issue is considered only in Stage 2. This simplification neglects potential hydrate reformation throughout the entire injection process, which may lead to underestimation of flow impedance and overestimation of injection efficiency. This limitation suggests the need for more comprehensive modeling approaches that account for continuous hydrate reformation dynamics during the whole injection process.

4. Conclusions

In this study, the hydrate saturation change during self-heating chemical fluid injection was investigated, while coupled heat-mass transfer was examined with a focus on fluid-phase behavior in the porous media. The sensitivity analysis was conducted to assess how initial reservoir permeability and fluid injection mode impact hydrate saturation and average reservoir temperature. This work contributes to the specific application details of self-heat-fluid-assisted injection technique, providing valuable parameter references for gas hydrate exploitation experimental/numerical investigations. The main conclusions are summarized below.
(1)
The stimulation process involving self-heating fluid injection into hydrate-bearing marine sediment is conceptualized as the reactive chemical flow stage (Stage 1), followed by the non-reactive flow stage (Stage 2). A near-wellbore 2D three-phase reservoir model is constructed to perform numerical simulations for both stages. In the base case, reservoir temperature rises from 13.0 °C to 29.3 °C with a 47.5% hydrate saturation reduction in Stage 1, followed by full dissociation in Stage 2. The evolution of hydrate saturation and reservoir temperature demonstrates that the self-heat fluid method provides a viable approach for effectively enhancing hydrate decomposition in the thermal stimulation process.
(2)
During the self-heating fluid injection process, variations in reservoir permeability critically affect thermal conductivity and heat flow rate in hydrate-bearing zones, resulting in non-uniform temperature distributions and hydrate saturation patterns within marine porous media. In low-permeability reservoirs (K < 15 mD), complete hydrate dissociation occurs during Stage 2, without secondary hydrate formation, whereas in the 15–55 mD permeability range, a dual-phase behavior is observed—initial hydrate regeneration in early-to-mid Stage 2 followed by secondary decomposition until the end of Stage 2. To minimize secondary hydrate formation, the self-heating fluid method should be applied only in reservoirs with permeability below 15 mD, while its use is strongly discouraged in the 55–70 mD range due to significant secondary hydrate generation.
(3)
Fluid flooding injection exhibits robust heat generation within the hydrate reservoir, evidenced by Stage 1 reservoir temperature analysis and Stage 2 hydrate saturation monitoring. This injection mode outperforms in situ heating mode by enhancing hydrate dissociation efficiency during the injection process of self-heat generating fluid, yielding higher post-injection gas recovery potential.
(4)
For the research domain of secondary hydrate formation suppression, by comparing with other research, this investigation supplements and extends the preceding studies on hydrate decomposition mechanisms: it concurrently demonstrates the regulatory influence of reservoir intrinsic permeability in secondary hydrate dynamics through thermodynamic and fluid dynamic analyses, corroborated by prior large-scale reservoir research. The study further suggests that integrating self-heat fluid flooding with huff-puff in situ heating could potentially establish a macro-convection + micro-reaction composite thermal transfer modality, thereby optimizing decomposition efficacy while alleviating secondary hydrate risks in 55–70 mD reservoirs.

Author Contributions

Conceptualization, K.Z. and K.S.; Methodology, K.Z.; Data Processing, K.Z.; Formal Analysis, K.Z. and Y.W.; Writing—Original draft, K.Z.; Writing—Review and editing, K.Z. and Y.W.; Funding Acquisition, K.Z. and K.S.; Investigation, K.S.; Project Administration, Y.Y.; Resources, Y.Y.; Validation, J.Z. (Jiawei Zhou); Visualization, J.Z. (Jing Zeng). All authors have read and agreed to the published version of the manuscript.

Funding

This work was funded by the National Key Research and Development Program of China (No. 2023YFC2811002) and (No. 2023YFC2811005).

Data Availability Statement

The original contributions presented in this study are included in the article. Further inquiries can be directed to the corresponding author.

Acknowledgments

The authors would like to acknowledge the experimental resources support from Liangjun Du from Sichuan Shenhe New Materials Technology Co., Ltd.

Conflicts of Interest

The authors declare that they have no competing interests or personal relationships that could have appeared to influence the work reported in this paper. The authors declare no conflicts of interest.

References

  1. Wei, R.P.; Xia, Y.Q.; Wang, Z.F.; Li, Q.P.; Lv, X.; Leng, S.D.; Zhang, L.X.; Zhang, Y.; Xiao, B.; Yang, S.X.; et al. Long-Term Numerical Simulation of a Joint Production of Gas Hydrate and Underlying Shallow Gas Through Dual Horizontal Wells in the South China Sea. Appl. Energy 2022, 320, 119235. [Google Scholar] [CrossRef]
  2. Liang, H.; Duan, Y.G.; Pei, J.; Wei, N. Study on Hydrate Phase Equilibrium Diagram of Methane Containing System Based on Thermodynamic Model. Front. Energy Res. 2021, 9, 743296. [Google Scholar] [CrossRef]
  3. Ye, J.L.; Qin, X.W.; Xie, W.W.; Lu, H.L.; Ma, B.J.; Qiu, H.J.; Liang, J.Q.; Lu, J.A.; Kuang, Z.G.; Lu, C.; et al. The Second Natural Gas Hydrate Production Test in the South China Sea. China Geol. 2020, 3, 197–209. [Google Scholar] [CrossRef]
  4. Wang, L.Y.; Dou, M.Y.; Wang, Y.; Xu, Y.L.; Li, Y.; Chen, Y.; Li, L.S. A Review of the Effect of Porous Media on Gas Hydrate Formation. ACS Omega 2022, 7, 33666–33679. [Google Scholar] [CrossRef]
  5. Xiao, C.W.; Li, X.S.; Li, G.; Yu, Y.S.; Lv, Q.N.; Yu, Y.; Weng, Y.F.; Liu, J.W.; Yu, J.X. Kinetic Studies of the Secondary Hydrate Formation in Porous Media Based on Experiments in a Cubic Hydrate Simulator and a New Kinetic Model. Fuel 2024, 358, 130168. [Google Scholar] [CrossRef]
  6. Ma, X.L.; Sun, Y.H.; Liu, B.C.; Guo, W.; Jia, R.; Li, B.; Li, S.L. Numerical Study of Depressurization and Hot Water Injection for Gas Hydrate Production in China’s First Offshore Test Site. J. Nat. Gas Sci. Eng. 2020, 83, 103530. [Google Scholar] [CrossRef]
  7. Wu, N.Y.; Li, Y.L.; Wan, Y.Z.; Sun, J.Y.; Huang, L.; Mao, P.X. Prospect of Marine Natural Gas Hydrate Stimulation Theory and Technology System. Nat. Gas Ind. B 2021, 8, 173–187. [Google Scholar] [CrossRef]
  8. Wu, H.Z.; Zhang, X.; Yang, Z.H.; Liu, D. Numerical Simulation on Depressurization Extraction of Natural Gas Hydrate Based on a Coupled Thermal-Hydraulic-Chemical Model. Energy Rep. 2022, 8, 269–278. [Google Scholar] [CrossRef]
  9. Qin, X.W.; Lu, C.; Wang, P.K.; Liang, Q.Y. Hydrate Phase Transition and Seepage Mechanism during Natural Gas Hydrates Production Tests in the South China Sea: A Review and Prospect. China Geol. 2022, 5, 201–217. [Google Scholar] [CrossRef]
  10. Pan, D.B.; Ma, X.L.; Chen, C.; Zhong, X.P. Numerical Analysis of Hydrate Exploitation Performances of Depressurization Combined with Thermal Fluid Injection in Marine Hydrate Reservoir with Impermeable Boundary. Gas Sci. Eng. 2023, 110, 204894. [Google Scholar] [CrossRef]
  11. Mao, M.; Yan, K.; Li, X.; Chen, Z.; Wang, Y.; Feng, J.; Chen, C. Review of Heat Transfer Characteristics of Natural Gas Hydrate. Energies 2024, 17, 717. [Google Scholar] [CrossRef]
  12. Yu, Q.N.; Tang, H.M.; Li, C.L.; Chen, Z.J.; Zhang, K.; Yu, Y.; Liang, S. Numerical Simulation of Natural-Gas-Hydrate Decomposition in Process of Heat-Injection Production. Processes 2023, 11, 2349. [Google Scholar] [CrossRef]
  13. Han, S.; Deng, X.J.; Li, W.C.; Yu, L.; Guan, L.F. A Study on the Coupling Mechanism of Hydrate Dissociation-Seepage-Heat Transfer Induced by Suction Anchor Installation in Marine Sediments. Ocean Eng. 2023, 288, 116083. [Google Scholar] [CrossRef]
  14. Chen, Y.; Gao, Y.H.; Xin, G.; Yao, W.; Gao, D.Z.; Chen, L.T.; Sun, B.J. Theoretical Analysis and Numerical Simulation of Multi-Fields Coupled Variation During Deepwater Hydrate-Bearing Reservoir Exploitation. Int. Conf. Comput. Exp. Eng. Sci. 2019, 21, 88–89. [Google Scholar] [CrossRef]
  15. Shen, S.; Li, Y.H.; Sun, X.; Wang, L.; Song, Y.C. Stress Behavior of Hydrate-bearing Sands with Changing Temperature and Hydrate Saturation. J. Nat. Gas Sci. Eng. 2022, 98, 104389. [Google Scholar] [CrossRef]
  16. Chen, B.B.; Sun, H.R.; Zheng, J.J.; Yang, M.J. New Insights on Water-Gas Flow and Hydrate Decomposition Behaviors in Natural Gas Hydrates Deposits with Various Saturations. Appl. Energy 2020, 259, 114185. [Google Scholar] [CrossRef]
  17. Wang, S.Y.; Zhang, X.H.; Lu, X.B.; Nie, X.Y. Laboratory Study on Physical and Mechanical Properties of Hydrate Sediment Samples. In Proceedings of the Twenty-Fourth International Ocean and Polar Engineering Conference, Busan, Republic of Korea, 15–20 June 2014; p. ISOPE-I-14-098. [Google Scholar]
  18. Li, Q.C.; Cheng, Y.F.; Zhang, H.W.; Yan, C.L.; Liu, Y.W. Simulating the Effect of Hydrate Dissociation on Wellhead Stability during Oil and Gas Development in Deepwater. J. Ocean Univ. China 2018, 17, 35–45. [Google Scholar] [CrossRef]
  19. Wu, S.T.; Zhou, X.B.; Lu, J.S.; Liang, D.Q.; Li, D.L. Experimental Study on CH4 Hydrate Dissociation by the Injection of Hot Water, Brine, and Ionic Liquids. J. Mar. Sci. Eng. 2023, 11, 713. [Google Scholar] [CrossRef]
  20. Zhu, Y.; Li, X.H.; Zhao, C.; Zhang, J.; Bondarenko, V.; Dreus, A.; Liang, J.Q.; Li, X.Y.; Zhu, J.L.; Wang, P.F.; et al. Decomposition Characteristics of Methane Hydrate in Porous Media under Continuous and Intermittent Microwave Heating. Fuel 2023, 332, 126230. [Google Scholar] [CrossRef]
  21. Hou, J.X.; Zhao, E.M.; Ji, Y.K. Numerical Simulation of Gas Production from Class III Hydrate Reservoirs Using Low-Frequency Electric Heating-Assisted Depressurization with Horizontal Wells. Fuel 2024, 357, 129906. [Google Scholar] [CrossRef]
  22. Wei, N.; Pei, J.; Li, H.T.; Sun, W.T.; Xue, J. Application of In-Situ Heat Generation Plugging Removal Agents in Removing Gas Hydrate: A Numerical Study. Fuel 2022, 323, 124397. [Google Scholar] [CrossRef]
  23. Xu, T.; Zhang, Z.B.; Li, S.D.; Li, X.; Lu, C. Numerical Evaluation of Gas Hydrate Production Performance of the Depressurization and Backfilling with an In Situ Supplemental Heat Method. ACS Omega 2021, 6, 12274–12286. [Google Scholar] [CrossRef]
  24. Ping, X.L.; Han, G.Q.; Zhang, J.Q.; Chang, J.H.; Cen, X.Q.; Tang, H. Study on the Flow Behavior of Wellbore Fluids of a Natural Gas Hydrate Well with the Combined Depressurization and Heat Injection Method. Processes 2023, 11, 1625. [Google Scholar] [CrossRef]
  25. Ahmadpanah, S.J.; Manteghian, M.; Ganji, H. Effect of Cyclopentane and Sodium Chloride on the Formation Kinetics of Natural Gas Hydrate in Different Operating Conditions. J. Nat. Gas Sci. Eng. 2022, 99, 104417. [Google Scholar] [CrossRef]
  26. Wang, J.T.; Shao, Z.H.; Bai, Y.J.; He, G.L.; Wang, X.D.; Liu, L.; Liao, B.; Sun, X.H.; Lv, K.H.; Sun, J.S. Fabrication and Property Evaluation of Calcium-Oxide-Loaded Microcapsules during Supplemental Heat-Based Exploitation of Natural Gas Hydrates. RSC Adv. 2023, 13, 7212–7221. [Google Scholar] [CrossRef] [PubMed]
  27. Liu, S.; Zhang, Y.Y.; Luo, Y.J.; Liang, Y.P.; Li, B. Analysis of Hydrate Exploitation by a New In-Situ Heat Generation Method with Chemical Reagents Based on Heat Utilization. J. Clean. Prod. 2020, 249, 119399. [Google Scholar] [CrossRef]
  28. Chibura, P.E.; Zhang, W.; Luo, A.J.; Wang, J.J. A Review on Gas Hydrate Production Feasibility for Permafrost and Marine Hydrates. J. Nat. Gas Sci. Eng. 2022, 100, 104441. [Google Scholar] [CrossRef]
  29. Wu, T.W.; Wan, K.; Li, X.S.; Wang, Y.; Chen, Z.Y. Heat Utilization Efficiency Analysis of Gas Production from Hydrate Reservoir by Depressurization in Conjunction with Heat Stimulation. Energy 2023, 263, 125625. [Google Scholar] [CrossRef]
  30. Ren, L.L.; Jiang, M.; Wang, L.B.; Zhu, Y.J.; Li, Z.; Sun, C.Y.; Chen, G.J. Gas Hydrate Exploitation and Carbon Dioxide Sequestration under Maintaining the Stiffness of Hydrate-Bearing Sediments. Energy 2020, 194, 116869. [Google Scholar] [CrossRef]
  31. Xiao, C.W.; Li, X.S.; Li, G.; Yu, Y.; Weng, Y.F.; Lv, Q.N.; Yu, J.X. Key Factors Controlling the Kinetics of Secondary Hydrate Formation in the Porous Media. Gas Sci. Eng. 2023, 110, 204911. [Google Scholar] [CrossRef]
  32. Liao, T.; Yuan, L.; Li, W.; Kan, J.Y.; Luo, W.; Xiong, X.Q.; Li, N. One-Dimensional Numerical Simulation on Removal of CO2 Hydrate Blockage around Wellbore by N2 Injection. Processess 2024, 12, 204. [Google Scholar] [CrossRef]
  33. Wang, Y.N.; Sun, Z.X.; Li, Q.P.; Lv, X.; Ge, Y. A Thermal Chemical Reaction System for Natural Gas Hydrates Exploitation. Front. Energy Res. 2022, 9, 804498. [Google Scholar] [CrossRef]
  34. Li, Q.P.; Lv, X.; Pang, W.X.; Yao, H.Y.; Ge, Y.; Wang, J.A. Numerical Simulation of the Effect of Porous Media Permeability on the Decomposition Characteristics of Natural Gas Hydrate at the Core Scale. Energy Fuels 2021, 35, 5843–5852. [Google Scholar] [CrossRef]
  35. Vikram, V.; David, L.; Samardeep, S.; Sharma, A.; Ranjith, P.G. Sensitivity Analysis of Methane Hydrate Bearing Class 3 Reservoirs during Thermal Injection. J. Pet. Sci. Eng. 2020, 195, 107575. [Google Scholar] [CrossRef]
  36. Liang, Y.P.; Liu, S.; Zhao, W.T.; Li, B.; Wan, Q.C.; Li, G. Effects of Vertical Center Well and Side Well on Hydrate Exploitation by Depressurization and Combination Method with Wellbore Heating. J. Nat. Gas Sci. Eng. 2018, 55, 154–164. [Google Scholar] [CrossRef]
  37. Li, J.F.; Ye, J.L.; Qin, X.W.; Qiu, H.J.; Wu, N.Y.; Lu, H.L.; Xie, W.W.; Lu, J.A.; Peng, F.; Xu, Z.Q.; et al. The First Offshore Natural Gas Hydrate Production Test in South China Sea. China Geol. 2018, 1, 5–16. [Google Scholar] [CrossRef]
  38. Falser, S.; Uchida, S.; Palmer, A.C.; Soga, K.; Tan, T.S. Increased Gas Production from Hydrates by Combining Depressurization with Heating of the Wellbore. Energy Fuels 2012, 26, 6259–6267. [Google Scholar] [CrossRef]
  39. Sun, X.; Luo, H.; Soga, K. A Coupled Thermal-Hydraulic-Mechanical-Chemical (THMC) Model for Methane Hydrate Bearing Sediments Using Comsol Multiphysics. J. Zhejiang Univ.-Sci. A 2018, 8, 600–623. [Google Scholar] [CrossRef]
  40. Comsol Search. All Research Results About Products, COMSOL Blog, and Application Gallery, etc. Available online: https://www.comsol.com/search/ (accessed on 12 May 2022).
  41. Datta, A.K. Porous Media Approaches to Studying Simultaneous Heat and Mass Transfer in Food Processes. I: Problem Formulations. J. Food Eng. 2007, 80, 80–95. [Google Scholar] [CrossRef]
  42. Zhao, Z.W. Thermodynamic Analysis for the Gas Production from Gas Hydrate by Heating. China Min. Mag. 2013, 8, 125–128. (In Chinese) [Google Scholar]
  43. Kou, X.; Feng, J.C.; Li, X.S.; Wang, Y.; Chen, Z.Y. Visualization of Interactions between Depressurization-Induced Hydrate Decomposition and Heat/Mass Transfer. Energy 2022, 239, 122230. [Google Scholar] [CrossRef]
  44. Kou, X.; Wang, Y.; Li, X.S.; Zhang, Y.; Chen, Z.Y. Influence of Heat Conduction and Heat Convection on Hydrate Dissociation by Depressurization in a Pilot-Scale Hydrate Simulator. Appl. Energy 2019, 251, 113405. [Google Scholar] [CrossRef]
  45. Li, G.; Moridis, G.J.; Zhang, K.N.; Li, X.S. The Use of Huff and Puff Method in a Single Horizontal Well in Gas Production from Marine Gas Hydrate Deposits in the Shenhu Area of South China Sea. J. Pet. Sci. Eng. 2011, 77, 49–68. [Google Scholar] [CrossRef]
  46. Malagar, B.R.; Lijith, K.P.; Singh, D.N. Formation & Dissociation of Methane Gas Hydrates in Sediments: A Critical Review. J. Nat. Gas Sci. Eng. 2019, 65, 168–184. [Google Scholar] [CrossRef]
  47. Wei, W.N.; Li, B.; Li, G.; Zhang, T.T.; Wan, Q.C.; Zhou, J.H. Investigating Optimal Thermal-Assisted Depressurization Regimes for Enhanced Methane Hydrate Dissolution in a Multiple Well System. Energy Fuels 2023, 37, 15795–15807. [Google Scholar] [CrossRef]
  48. Zhang, Y.Y. Experimental Study on Gas Production from Hydrate Reservoir Using Self-Heating System Injection Method. Master’s Thesis, Chongqing University, Chongqing, China, 2019. (In Chinese). [Google Scholar]
  49. Wang, Z.Q.; Liu, S.Y.; Li, H.Y.; Li, S.X.; Xu, J.C.; Wang, X.P. A Numerical Simulation Study of Methane Hydrate Reformation During the Dissociation Process Induced by Depressurization. Fuel 2022, 313, 122983. [Google Scholar] [CrossRef]
  50. Zhang, Y.Y.; Wang, Z.Y.; Chen, L.Q.; Li, H.; Zhang, J.B.; Yang, H.M. Effects of Hydrate Saturation and Sand-Filling Content on Hydrate Exploitation Using In-Situ Heat Supply with Chemical Reagents. Lect. Notes Civ. Eng. 2024, 472, 568–589. [Google Scholar] [CrossRef]
  51. Yu, T.; Chen, B.B.; Jiang, L.L.; Zhang, L.X.; Yang, L.; Yang, M.J.; Song, Y.C.; Abudula, A. Feasibility Evaluation of a New Approach of Seawater Flooding for Offshore Natural Gas Hydrate Exploitation. Energy Fuels 2023, 37, 4349–4364. [Google Scholar] [CrossRef]
  52. Zhang, Q.; Zhang, Q.; Zhang, Q.; Wang, Y.F.; Wang, Y.F.; Wang, Y.F. Numerical Simulations of Combined Brine Flooding With Electrical Heating–Assisted Depressurization for Exploitation of Natural Gas Hydrate in the Shenhu Area of the South China Sea. Front. Earth Sci. 2022, 10, 843521. [Google Scholar] [CrossRef]
  53. Sloan, E.D.; Koh, C.A. Clathrate Hydrates of Natural Gases, 3rd ed.; CRC Press: Boca Raton, FL, USA, 2007. [Google Scholar]
  54. Mok, J.H.; Choi, W.J.; Seo, Y.W. The Dual-Functional Roles of N2 Gas for the Exploitation of Natural Gas Hydrates: An Inhibitor for Dissociation and an External Guest for Replacement. Energy 2021, 232, 121054. [Google Scholar] [CrossRef]
  55. Wei, N.; Zheng, H.R.; Guo, B.Y.; Hu, H.Y.; Li, C. Acceleration Mechanism of Methane Hydrate Dissociation in Inorganic Salt Solutions: Experimental and Molecular Dynamics Study. Geoenergy Sci. Eng. 2025, 252, 213913. [Google Scholar] [CrossRef]
  56. Xing, Q.Z.; Wan, L.; Zhang, J.Y.; Zhang, S.F.; Cui, X.Y. Experimental Study of Methane Hydrate Decomposition Kinetics in NaCl, KCl, and PVP Solutions. ACS Omega 2025, 10, 22647–22656. [Google Scholar] [CrossRef]
  57. Zeng, H.P.; Zhang, Y.; Zhang, L.; Chen, Z.Y.; Li, X.S. Effects of the NaCl Concentration and Montmorillonite Content on Formation Kinetics of Methane Hydrate. J. Mar. Sci. Eng. 2022, 10, 548. [Google Scholar] [CrossRef]
  58. Yin, Z.Y.; Moridis, G.; Linga, P. On the Importance of Phase Saturation Heterogeneity in the Analysis of Laboratory Studies of Hydrate Dissociation. Appl. Energy 2019, 255, 113861. [Google Scholar] [CrossRef]
  59. Li, R.R.; Han, Z.H.; Zhang, L.Q.; Zhou, J.; Wang, S. Effect of Hydrate Saturation on Permeability Anisotropy for Hydrate-Bearing Turbidite Sediments Based on Pore-Scale Seepage Simulation. J. Mar. Sci. Eng. 2024, 12, 1079. [Google Scholar] [CrossRef]
  60. Chen, H.; Du, H.; Shi, B.; Shan, W.C.; Hou, J.Q. Mechanical Properties and Strength Criterion of Clayey Sand Reservoirs During Natural Gas Hydrate Extraction. Energy 2021, 242, 122526. [Google Scholar] [CrossRef]
  61. Wang, Y.H.; Wu, P.; Huang, L.; Song, Y.C.; Li, Y.H. Stress-Induced Permeability Evolution Mechanism of Hydrate-Bearing Sediments from Pore-Scale Perspective. Energy 2025, 319, 134977. [Google Scholar] [CrossRef]
  62. Zhang, N.; Wang, H.N.; Jiang, M.J. A Mechanistic Model for Porosity and Permeability in Deformable Hydrate-Bearing Sediments with Various Hydrate Growth Patterns. Acta Geotech. 2023, 19, 1–26. [Google Scholar] [CrossRef]
  63. Shang, Y.H.; Lei, G.; Tang, J.D.; Qu, J.T.; Ning, F.L. Permeability of Marine Gas Hydrate-Bearing Sediments Considering Effective Stress and Particle Size Distribution: A Theoretical Model. SSRN J. 2024. preprint. [Google Scholar] [CrossRef]
  64. Lei, G.; Qu, J.T.; Zhao, Y.J.; Wu, Q.; Liu, T.L. Permeability Behavior of Hydrate-Bearing Clayey-Silty Sediments During Creeping. J. Rock Mech. Geotech. Eng. 2024, 17, 2492–2510. [Google Scholar] [CrossRef]
  65. Xu, Z.Q.; Shen, K.X.; Wang, Y.S.; Wu, J.; Liu, P.L.; Du, J.; Huang, Q.S.; Chen, C. Consolidation-Acidizing Experiments on Methane Natural Gas Sediment Skeleton. Front. Energy Res. 2024, 12, 1332495. [Google Scholar] [CrossRef]
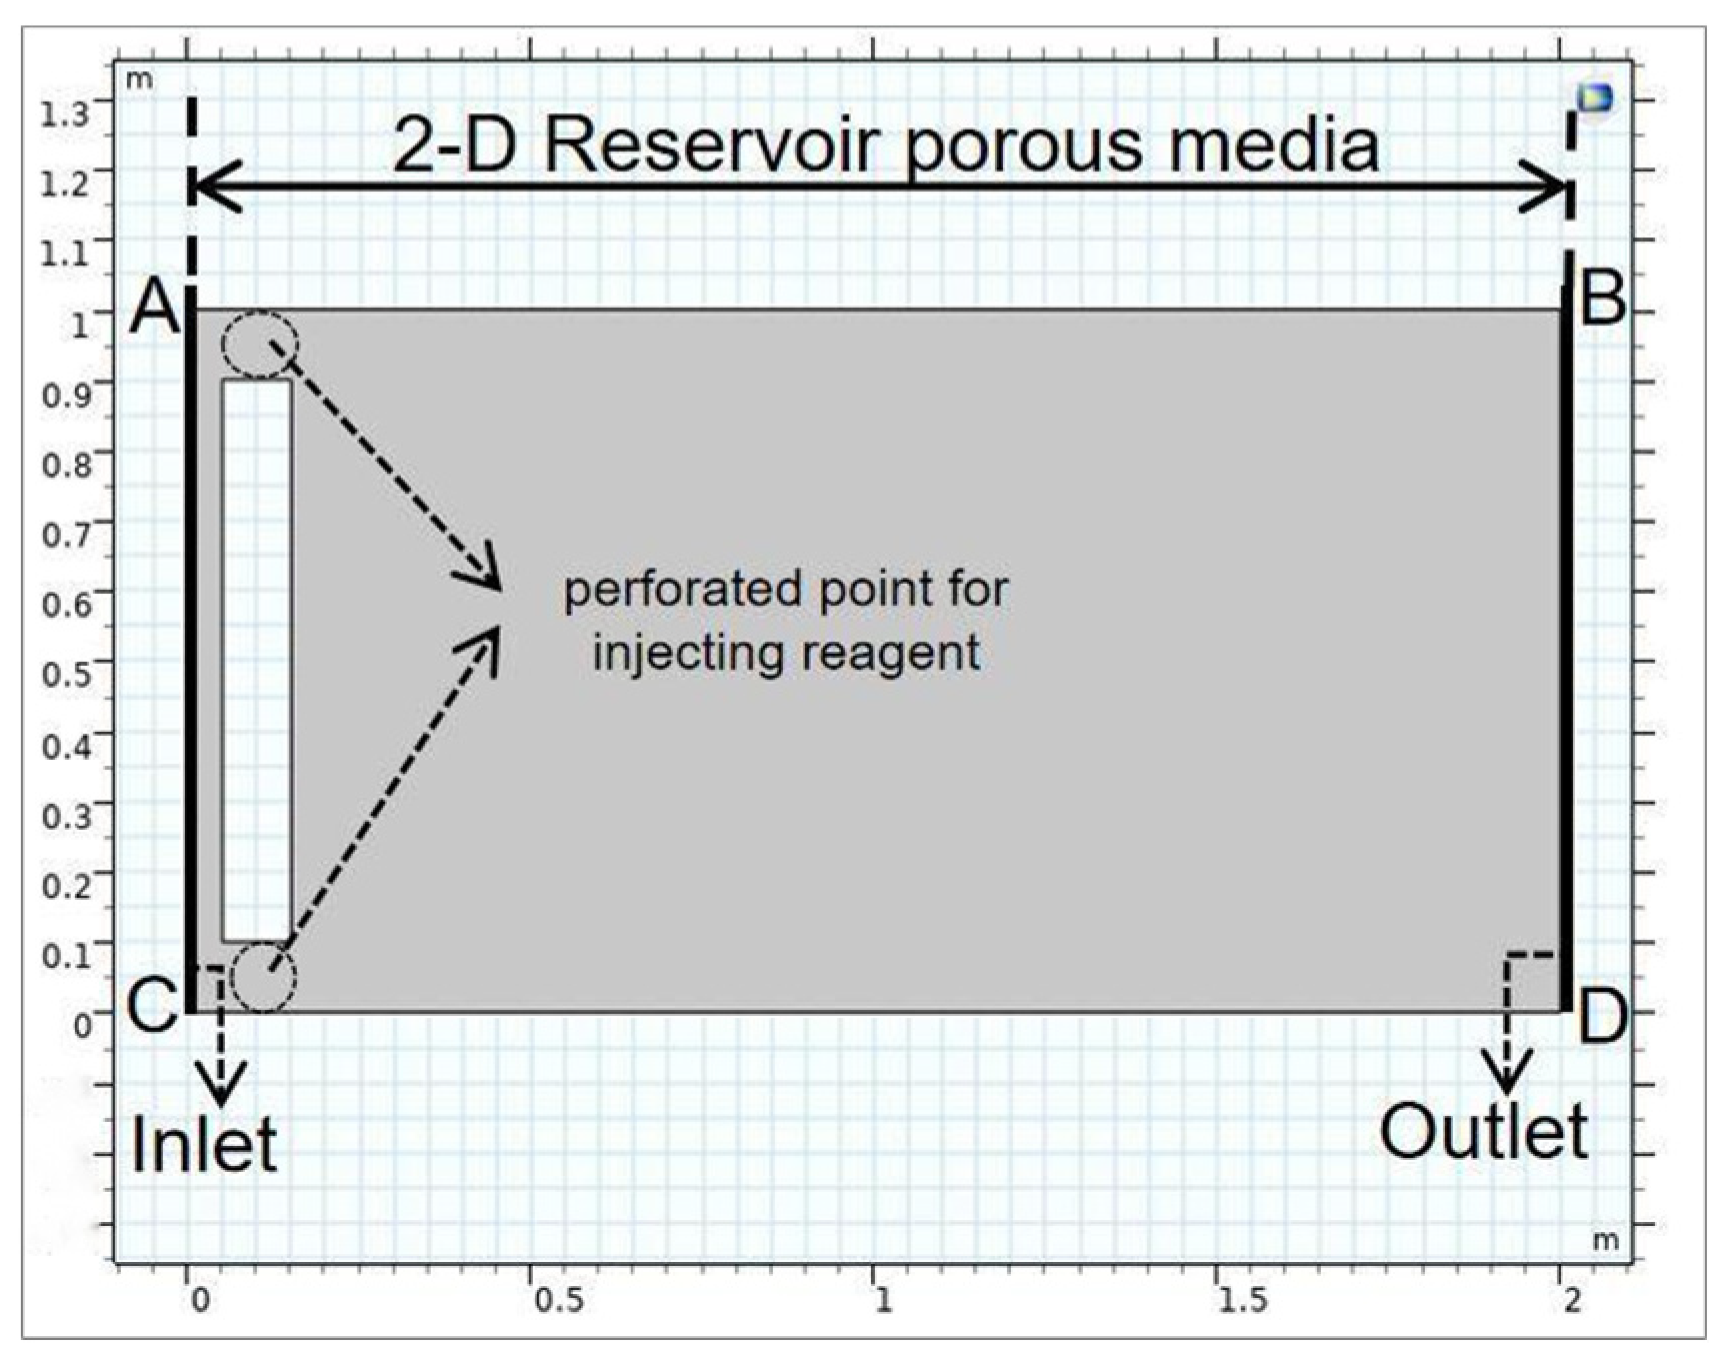
Figure 1. Hydrate reservoir porous media.
Jmse 13 01772 g001
Figure 2. The reservoir hydrate saturation distribution by the end of Stage 1 (base case).
Jmse 13 01772 g002
Figure 3. Average reservoir temperature by the end of Stage 1 (base case).
Jmse 13 01772 g003
Figure 4. Hydrate saturation distribution over time for the base case (0~55 h).
Jmse 13 01772 g004
Figure 5. The evolution of hydrate saturation zone over time (1.5–15 mD).
Jmse 13 01772 g005
Figure 6. The evolution of hydrate saturation zone over time (25–55 mD).
Jmse 13 01772 g006
Figure 7. The evolution of hydrate saturation zone over time (70–100 mD).
Jmse 13 01772 g007
Figure 8. The estimated average hydrate saturation for various reservoir permeability conditions during Stage 2.
Jmse 13 01772 g008
Figure 9. Reservoir temperature change profile (5 mD).
Jmse 13 01772 g009
Figure 10. Reservoir temperature change profile (55 mD).
Jmse 13 01772 g010
Figure 11. Reservoir temperature change profile (70 mD).
Jmse 13 01772 g011
Figure 12. Average reservoir temperature for various permeability conditions.
Jmse 13 01772 g012
Figure 13. The thermal conductivity of the hydrate area from 25 to 55 h in various permeability conditions.
Jmse 13 01772 g013
Figure 14. The endothermic heat flow rate of the hydrate area from 25 to 55 h in various permeability conditions.
Jmse 13 01772 g014
Figure 15. Reservoir temperature profile by the end of Stage 1 (in situ heating case).
Jmse 13 01772 g015
Figure 16. Hydrate saturation profile by the end of Stage 2 (in situ heating case).
Jmse 13 01772 g016
Figure 17. The estimated average hydrate saturation for two injection conditions during Stage 2.
Jmse 13 01772 g017
Figure 18. Hydrate saturation distribution over time for the in situ heating case (0~55 h).
Jmse 13 01772 g018
Figure 19. Average reservoir temperature of the two injection modes.
Jmse 13 01772 g019
Figure 20. The thermal conductivity of the hydrate area under the two injection modes.
Jmse 13 01772 g020
Figure 21. The endothermic heat flow rate of the hydrate area under the two injection modes.
Jmse 13 01772 g021
Figure 22. Instantaneous gas production of various permeability conditions in 10 h.
Jmse 13 01772 g022
Figure 23. Instantaneous gas production of two injection modes in 10 h.
Jmse 13 01772 g023
Figure 24. Hydrate saturation profile under various refining grids.
Jmse 13 01772 g024
Figure 25. Hydrate saturation profile under various refining grids (Stage 2).
Jmse 13 01772 g025
Figure 26. Hydrate saturation record under various refining grids (Stage 2).
Jmse 13 01772 g026
Figure 27. Grid density distribution map.
Jmse 13 01772 g027
Figure 28. Temperature-acquisition insulated reactor.
Jmse 13 01772 g028
Figure 29. Post-reaction system temperatures under various reactant mass concentration ratios.
Jmse 13 01772 g029
Table 1. Fundamental physical parameters of reservoir porous media and fluid.
ParametersPhysical MeaningValues
d [m]Reservoir length
(Figure 1, AB and CD)
2.00
b [m]Reservoir width
(Figure 1, AC and BD)
1.00
kpor [mD]Reservoir initial absolute permeability1.50
ϕ Reservoir porosity0.33
SghiInitial hydrate saturation0.40
SwiInitial water saturation0.55
SgiInitial gas saturation0.05
Mgh [g/mol]Hydrate molar mass119.50
Mm [g/mol]Methane molar mass16
Mw [g/mol]Water molar mass18
Table 2. Required physical parameters in Stage 1.
ParametersPhysical MeaningRelated EquationValues
ρc [kg/m3]Chemical reagent fluid densityMomentum conservation equation1.0 × 103
VC [m/s]Chemical reagent fluid velocity0.19
μc [Pa·s]Chemical reagent fluid dynamic viscosity1.0 × 10−3
g [m/s2]Force per unit volume of fluid9.80
ρG [kg/m3]Hydrate densityHeat transfer equation0.91
CG [J/(kg·K)]Hydrate heat capacity1600
kG [W/(m·K)]Hydrate thermal conductivity0.62
uG [m/s]Hydrate velocity0
qG [W/m2]Heat flux by conductionkG∇T
QG [W/m3]External heat source for hydrate0
Di [m2/s]The diffusion coefficient of injected fluid molecules in porous mediaMass conservation equation1 × 10−9
Table 3. Required physical parameters in Stage 2.
ParametersPhysical MeaningRelated EquationValues
Cw [J/(kg·K)]Water heat capacityHeat transfer equation1600
kw [W/(m·K)]Water thermal conductivity0.62
Lpc [J/kg]Latent heat for phase change43,500
Qh [W/m3]External heat source0
ρw [kg/m3]Water dynamic densityDarcy’s law equation1 × 103
uw [m/s]Water velocity1.96 × 10−8
μw [Pa·s]Water dynamic viscosity1.0 × 10−3
Qm [W/m3]Water mass increase due to hydrate phase changeBased on simulation process
Table 4. Initial conditions and boundary conditions for Stages 1 and 2.
StageParametersPhysical MeaningValues
Stage 1VC [m/s]AB and CD boundary velocity of chemical reagent fluid0
T1_ave [K]Formation ambient temperature286.2
c_initial
[mol/m3]
Initial chemical reagent fluid concentration in the reservoir0
c_inlet
[mol/m3]
Initial chemical reagent fluid concentration at AC inlet boundary2000
Stage 2P_inlet [MPa]Injected pressure for chemical reagent fluid20
P_outlet [MPa]Outlet pressure for chemical reagent fluid5
T2_ave [K]Average formation temperature at the beginning of Stage 2 (by the end of Stage 1)303.8
(base case)
T2_gh [K]Hydrate temperature before phase change278.7
Table 5. Grid information for stability validation cases (Stages 1 and 2).
StagesTest NumberGrid Element NumberMaximum
Grid Size
Minimum
Grid Size
Maximum Element
Growth Rate
Curvature
Factor
Simulated
Saturation
Stage 1Test 1-131950.067 m0.003 m1.200.400.2111
Test 1-235970.055 m0.002 m1.200.400.2133
Test 1-354200.045 m0.002 m1.150.300.2106
Stage 2Test 2-132100.040 m1.5 × 10−41.200.25Please see Section 3.5
Test 2-257740.030 m1.5 × 10−41.100.20
Test 2-379980.025 m4.0 × 10−51.100.20
Table 6. Heat release capacity, hydrate decomposition capacity, and reaction product yield under different reactant mass concentration ratios (X wt%NaNO2 + Y wt%NH4Cl).
Physical ParametersUnit5.0% +
7.0%
5.5% +
7.0%
6.0% +
7.0%
6.5% +
7.0%
7.0% +
7.0%
Heat releaseKJ241.0265.1289.2313.3337.40
Decomposable
CH4 hydrate molar number
mol4.384.825.265.706.13
Generated N2mol0.730.800.870.941.01
Generated NaClmol/L0.740.820.890.971.04
Disclaimer/Publisher’s Note: The statements, opinions and data contained in all publications are solely those of the individual author(s) and contributor(s) and not of MDPI and/or the editor(s). MDPI and/or the editor(s) disclaim responsibility for any injury to people or property resulting from any ideas, methods, instructions or products referred to in the content.