Abstract
In marine seismic surveys, the indistinguishability of subsurface boundaries caused by the superimposition of the acoustic signals reflected from it, particularly at specific frequency ranges characterized by strong spectral interference, reduces the resolution of the seismic record. We processed sub-bottom profiler data, acquired using a Bubble Pulser (nominal central frequency: ~400 Hz; effective bandwidth extending to ~1 kHz), (i) by extracting continuous wavelet transform (CWT) coefficients at the dominant energy scale to form the envelope and (ii) by applying Hilbert-based instantaneous frequency analysis to characterize medium-dependent spectral shifts. Envelope accuracy was benchmarked against four conventional filters using the sum of squared error (SSE) relative to a cubic-spline reference. CWT yielded the lowest SSE, outperforming low-pass 1 kHz and band-pass 400–1000 Hz; band-pass 400–650 Hz and low-pass 650 Hz were the least effective. Instantaneous-frequency trends differentiated rock, sand, and mud layers. Thus, compared to fixed-band filters, the scale-adaptive CWT envelope replicates raw energy more faithfully, while frequency attributes improve sediment classification. Low-pass filtering at 1000 Hz provides a more accurate representation of energy distribution than does bandpass filtering, particularly in the 400–650 Hz range. The integrated workflow—a robust, parameter-light alternative for high-resolution stratigraphic interpretation—enhances offshore engineering safety.
1. Introduction
The seafloor comprises various components, such as sediments and rocks, each possessing distinct physical properties and diverse acoustic responses. Acoustic data obtained from seafloor sediments not only help elucidate the characteristics of sound wave reflection, refraction, scattering, and attenuation of the seafloor but also contribute to the analysis of the geological and geotechnical properties of the sediments, as well as to research related to seismic waves [1,2].
Marine seismic exploration is primarily used to distinguish seafloor sediments and study stratigraphic structures using the acoustic reflection properties of the seabed. The recorded data include not only primary and multiple reflections from the seafloor but also reflections from the boundaries of the subsurface rock layers forming the sedimentary cover, which provide additional information for stratigraphic interpretation. Several studies have classified marine sediments using these techniques. For example, Qu et al. [3] proposed a method for categorizing marine sediments using convolutional neural networks coupled with bidirectional long short-term memory (CNN-BLSTM) fusion, and He et al. [4] proposed a five-step classification method using two key lithological parameters derived from SBP data—acoustic reflection strength and frequency-dependent attributes (e.g., instantaneous frequency and dominant frequency)—to construct a high-accuracy subsurface map. Li et al. [5,6] accurately classified seafloor sediments using a backpropagation neural network-based method integrating the Biot–Stoll and attenuation-based models.
In marine seismic exploration, the amplitudes of the primary and first multiple reflection signals are measured, and their ratio is calculated to estimate the acoustic reflection coefficient [7]. However, quantifying the amplitude of reflection signals is challenging because overlapping waveform elements generate multiple local spectral peaks within the frequency band, rather than a single dominant frequency. By representing the acoustic reflection signal as an energy envelope, the amplitude can be readily measured without being affected by the polarity or phase characteristics of the waveform. Kim & Park [8] extracted the source wavelet of Chirp SBP in MATLAB R2023a (MathWorks Inc., Natick, MA, USA), evaluated the source wavelet extraction method through an adaptive machine learning filter, and performed deterministic deconvolution after extracting the optimal source wavelet from raw data. Although such procedures may differentially alter the amplitudes of primary and multiple reflections, their study focused on improving signal resolution and sediment classification rather than on retrieving absolute reflection coefficients, thereby minimizing the impact of amplitude distortion.
Researchers have used the concept of instantaneous frequency, which represents momentary frequency changes in seismic signals, to study how these values vary according to the physical properties of sediments (e.g., grain size, porosity, and water content) [9,10]. Li et al. [9] proposed a new method for sediment characterization by combining modified variational mode decomposition (MVMD) and Wigner–Ville distribution (WVD) with a robust estimation algorithm using instantaneous frequency series and relaxation times. MVMD is an advanced extension of variational mode decomposition that adaptively decomposes a signal into intrinsic mode functions with reduced mode mixing, while WVD provides a high-resolution time–frequency representation of nonstationary signals, though it may be affected by cross-term interference. They validated the effectiveness of their proposed method with SBP data, core sampling, and geological analysis. LeBlanc et al. [11] developed an attenuation-based model for classifying marine sediments using chirp sonar in the 2–10 kHz frequency range. They evaluated the potential of using the instantaneous frequency method for accurate sediment type prediction. Additionally, enhanced low- and high-frequency components in seismic data have improved the resolution of sediment classification, highlighting the importance of considering both frequency ranges in analyses [12].
The Hilbert–Huang transform is a powerful tool for analyzing nonlinear and non-stationary time-series data. The transform has been studied for its capacity to enhance the resolution of marine seismic exploration data [13]. Olhede & Walden [14] proposed a method for extracting instantaneous estimates using generalized Morse wavelets, which offer high noise resistance and excellent time–frequency localization. Daubechies et al. [15] utilized a synchro-squeezing transform (SST) to enable an accurate instantaneous frequency estimation and seismic signal analysis. Additionally, Liu et al. [16] compared various instantaneous frequency extraction methods, emphasizing noise mitigation and accuracy improvements. Recent studies have significantly enhanced the accuracy and resolution of marine seismic exploration by combining SST with modified analytical wavelet (MAW) methods or inverse scattering theory.
Current research trends in marine seismic science have brought significant progress in classifying and analyzing seafloor sediments through a range of novel techniques such as CNN-BLSTM fusion, backpropagation neural networks, and modified variational mode decomposition. Although the reflection coefficient is theoretically defined by amplitudes of primary and multiple reflections, in practice, we adopt the energy envelope extracted using the continuous wavelet transform (CWT) to mitigate noise and phase sensitivity. This yields a more stable and interpretable measure of reflection strength in SBP data. This approach improves the accuracy of amplitude measurements and enables a more nuanced understanding of frequency variations in different media, providing a novel methodology that outperforms traditional filtering techniques. By comparing these results with those obtained using conventional methods, this study aims to set a new benchmark for the accuracy and resolution of marine seismic data processing, representing a significant advance in the field.
Recent advances in artificial intelligence have also shown promise in subsurface diagnostics, where predictive algorithms have been applied to detect early material degradation [17]. Such approaches highlight the potential of combining signal analysis with data-driven methods, providing an auxiliary avenue to our CWT-based framework.
Therefore, this study aims to analyze SBP signals obtained from marine seismic exploration using the CWT to obtain the energy envelope and then explore the frequency characteristics across different media through filtering and instantaneous frequency analysis. The results were benchmarked with energy envelopes obtained using traditional filtering methods to evaluate the effectiveness and accuracy of each technique. These findings contribute to improving the accuracy and resolution of marine seismic data processing. The remainder of the paper is structured as follows: Section 2 describes the methods, Section 4 presents the results, and Section 5 discusses the implications.
2. Methods
2.1. CWT
The CWT is an effective technique for analyzing the time–frequency characteristics of signals. It decomposes a signal into various frequency bands, enabling the analysis of frequency components as they change over time; this is particularly useful for analyzing non-stationary signals, such as those from marine seismic exploration data. The wavelet transform provides simultaneous resolution in frequency and time, enabling the visualization of frequency components at different time scales, thereby providing a precise understanding of medium properties. In this study, we selected the generalized Morse wavelet as the mother wavelet for its high noise resistance and excellent time–frequency localization [14]. The choice of scale parameters was guided by the dominant frequency range of the Bubble Pulser source signal (approximately 350–1000 Hz), ensuring that the analysis window covered both primary and multiple reflections. Sensitivity tests confirmed that while the exact scale range may slightly affect resolution, the overall energy envelope and instantaneous frequency trends remained robust across reasonable parameter variations. For example, the CWT is useful for analyzing the frequency characteristics of signals reflected from various seafloor sediments, aiding the interpretation of sediment types and distributions [18,19,20].
Wavelet analysis can be applied to continuous and discrete signals and is widely recognized for its versatility across disciplines. The wavelet transform is particularly advantageous for analyzing non-stationary signals, which makes it a viable alternative to traditional methods such as the short-time Fourier transform (STFT) and Gabor transform. The fundamental difference between the wavelet transform and traditional STFT is that STFT uses a fixed-size filter window for all frequency bands. In contrast, the wavelet transform uses a narrow window for high-frequency bands and a wide window for low-frequency bands. Wavelet analysis is also known as constant relative bandwidth analysis because the frequency bandwidth consistently varies in proportion to the frequency value.
The wavelet transform also decomposes an input signal into a set of specific basis functions. The set of basis functions in the wavelet transform is derived by scaling and translating a single mother wavelet along the time axis. This function is considered a special type of bandpass filter, and the constant relative bandwidth property of the wavelet transform is achieved through the scaling and translation of the mother wavelet basis function. Consequently, in the wavelet transform, “scale” is commonly used instead of “frequency band.” Thus, the wavelet transform of an input signal is referred to as a time-scale representation of the original signal.
The CWT is defined by the inner product of a basis function Ψ and a signal f(x), as shown in Equation (1). The basis functions are obtained by scaling and translating the mother wavelet function. The mother wavelet is scaled by scale parameter a, which represents the frequency band, and translated by translation parameter b, which corresponds to the time axis.
where a and b denote the scale and translation parameters, respectively [21].
Figure 1 illustrates the differences between the Fourier and wavelet transforms [22]. The Fourier transform uses a window of constant size regardless of the signal frequency. In contrast, the wavelet transform varies the window size according to the characteristics of a given signal. Consequently, the wavelet transform effectively adapts to input signals by providing time and frequency information.
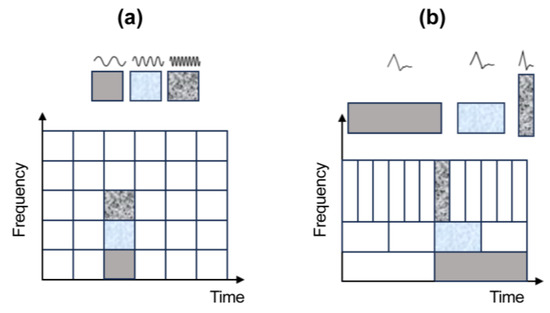
Figure 1.
Time–frequency window of (a) Fourier and (b) wavelet transformations. The Fourier transform uses a fixed-size window, whereas the wavelet transform implements time–frequency localization: short windows for high-frequency signals (blue) and long windows for low-frequency signals (gray). This fundamental property of the CWT explains why signals of similar shapes may appear with different durations and frequency compositions.
The CWT quantifies the relationship between the wavelet basis function and raw data through a correlation coefficient C, as shown in Figure 1. This is achieved by scaling and translating the mother wavelet basis function along the time axis.
2.2. Traditional Filtering Method
Filtering is a fundamental method for processing and analyzing signals in marine seismic exploration data. It can remove noise from raw signals and enhance the specific frequency bands of interest. Commonly used filters include low-pass, high-pass, and bandpass filters, each selectively passing or removing the signal components within a particular range of frequency. The filtering process is crucial for maintaining signal resolution while reducing unnecessary noise. The filtered signal obtained through this process can then be used for subsequent energy-envelope calculations and instantaneous frequency analysis.
As shown in Figure 2, we applied fourth- to sixth-order filters for different purposes. Band-pass filters (400–650 Hz, 400–1000 Hz) and low-pass filters (650 Hz, 1 kHz) passed the specified frequency ranges while retaining or amplifying their amplitudes. The original unfiltered signal is also shown in Figure 2 for direct comparison with the filtered results. Mirror frequencies appear as Fourier transform artifacts, and negative sample numbers indicate the centering of the signal in the time domain. This section provides a baseline for comparison with our CWT-based approach.
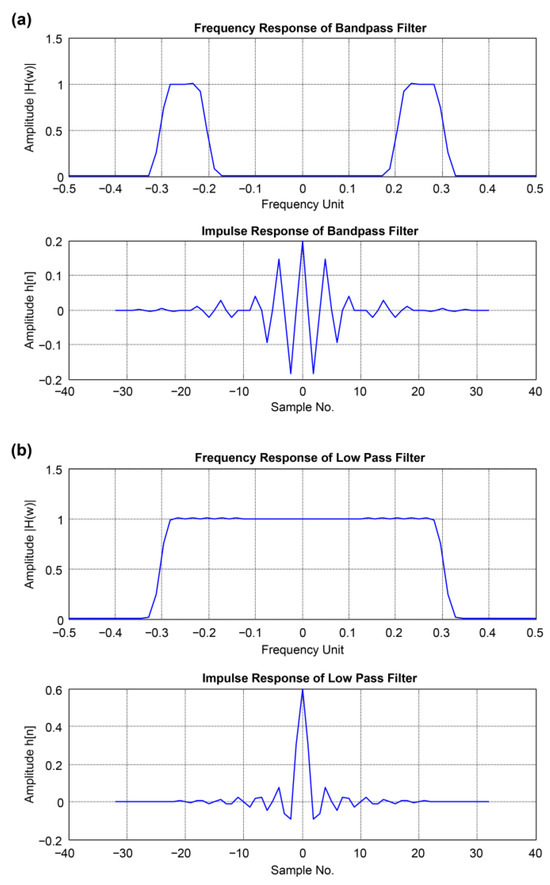
Figure 2.
Comparison of the original unfiltered and filtered signals. (a) Band-pass filters with pass bands of 400–650 Hz and 400–1000 Hz, and (b) low-pass filters with cutoffs at 650 Hz and 1 kHz, were applied with orders of 4–6. Mirror frequencies appear as artifacts due to Fourier transform symmetry, while negative sample numbers indicate time-domain centering of the signal.
2.3. Energy Envelope
The energy envelope is a curve representing changes in the amplitude of a signal over time, providing a visual expression of the energy of the signal. It enables straightforward measurement of the amplitude regardless of the polarity or phase of the signal. Typically, the energy envelope is calculated by processing the signal with a low-pass filter and then applying a Hilbert transform [23]. This method removes high-frequency noise from the raw signal and identifies the significant amplitude changes in the signal.
By representing the acoustic reflection signal as an energy envelope, the amplitude can be readily measured without being affected by the polarity or phase characteristics of the waveform.
If the acoustic reflection signal recorded over time is represented by x(t), the energy envelope E(t) of x(t) can be derived as follows:
where y(t) is the x(t) phase shifted by 90°, which can be obtained using the Hilbert transform [24].
2.4. Instantaneous Frequency
Instantaneous frequency represents the local frequency changes in a signal over time and provides essential information for analyzing its physical properties. In marine seismic exploration, analyzing the instantaneous frequency of signals enables evaluation of the physical properties of sediments (such as grain size and porosity); it is typically extracted using the Hilbert transform [16]. For example, Li et al. [9] and Zong et al. [10] investigated sediment characterization using instantaneous frequency series and relaxation times. They combined MVMD-WVD with robust estimation algorithms to validate its performance. These analytical methods significantly aid in accurately classifying seafloor sediments and analyzing geological structures.
Building on this theoretical background, in this study, we aim to derive the energy envelope of marine seismic exploration data using CWT, filtering methods, instantaneous frequency analysis, and analysis of the frequency characteristics according to different media. By comparing the effectiveness and accuracy of each technique with those of conventional methodologies, this study aims to improve the data processing accuracy and resolution of marine seismic exploration.
Instantaneous frequency represents the frequency of a signal at each moment as it changes over time, making it particularly useful for analyzing non-stationary or modulated signals. It is calculated as the derivative of the phase relative to time, indicating the rate of frequency change at a specific point in the signal. The Hilbert transform yields the instantaneous phase and frequency of a signal in practical applications. The instantaneous frequency is obtained by differentiating the phase angle of the complex signal with respect to time.
3. Extraction of Energy Envelope and Instantaneous Frequency from SBP Seismic Exploration Data
In this study, we extracted the energy envelope of the SBP seismic exploration data acquired using a Bubble Pulser (Hegg Marine HMS-620, Geomatrix Earth Science Limited, Leighton Buzzard, UK), which has a nominal central frequency of approximately 400 Hz and an effective bandwidth extending up to ~1 kHz. The acquired data were processed using CWT and Hilbert transform to extract the energy envelope, which was then compared with the envelope obtained through filtering and cubic spline curves. The cubic spline curve, calculated using the positive peak points from the seismic exploration data, was the most similar to the energy envelope curve. The CWT enables accurate analysis of signal changes across various frequency bands. In contrast, the energy envelope is obtained through filtering, and the Hilbert transform reveals the main amplitude changes in the signal. These methods improve the accuracy and resolution of marine seismic exploration data.
3.1. Energy Envelope by Continuous Wavelet Transform
The acquired data were processed using CWT, as shown in Figure 3, and expressed in the time-scale domain using Equation (1). The maximum CWT coefficients were observed when the primary wave reflected from the seafloor was received. The CWT coefficients reached extrema when reflective interfaces or multiple reflections occurred within the strata.
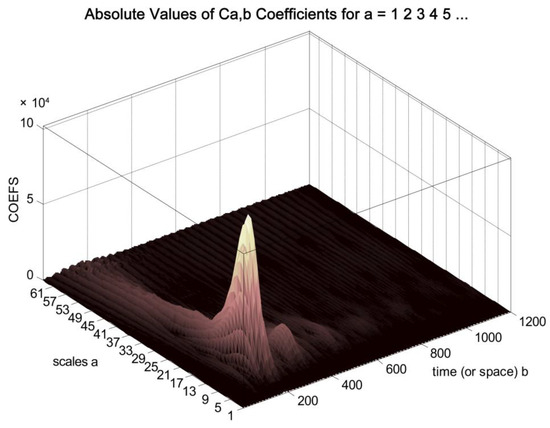
Figure 3.
Data processed using CWT are expressed in the time-scale domain. The figure illustrates the extraction of a trace to construct an energy envelope using Bubble Pulser survey data.
The scale at which the CWT coefficients peak corresponds to the central frequency of the reflected acoustic signal. Therefore, the energy envelope was obtained using CWT coefficients at this scale. “Scale” is a core CWT concept. The CWT analyzes the signal in the time-scale domain, where the scale represents the “stretching/compression” of the wavelet function. The scale behaves like the inverse of frequency: high scales correspond to low frequencies, and low scales correspond to high frequencies. Thus, the CWT captures the local characteristics of a signal across various scales (i.e., frequencies); this is particularly useful in geophysics as it allows the analysis of detailed geological structures and large-scale geological formations. Therefore, this method produces an energy envelope that visualizes the main amplitude changes in the signal, contributing to improved analytical accuracy and resolution of marine seismic exploration data.
3.2. Energy Envelope by Filtering Methods
For the SBP seismic exploration data, bandpass and low-pass filtering were performed to remove high-frequency noise components. Before filtering, the frequency spectrum of the seismic exploration data was obtained to assess the frequency characteristics. Figure 4 illustrates the amplitude spectrum of the Bubble Pulser data, showing that the peak frequency is approximately 600 Hz.
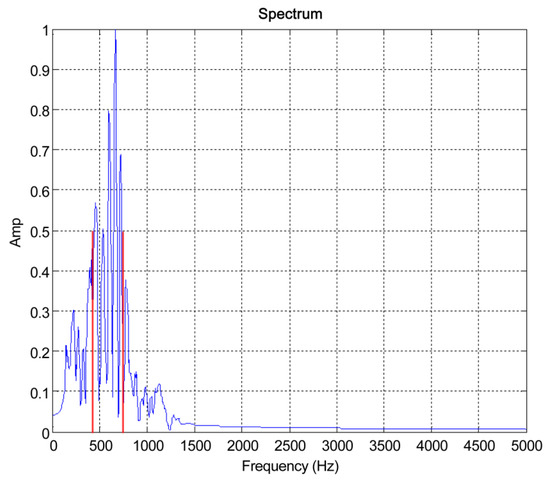
Figure 4.
Amplitude spectrum of the Bubble Pulser data. The peak of the acquired seismic exploration data frequency spectrum appears at approximately 600 Hz.
A zero-phase bandpass filter was applied with passbands set to 400–650 Hz (half of the maximum value of the frequency spectrum at −3 dB) and 400–1000 Hz (a slightly wider bandwidth); subsequently, the energy envelope was obtained. Additionally, low-pass filters with cutoffs set at 650 and 1000 Hz were applied. The resulting energy envelopes were compared with each other and with a cubic spline curve for similarity.
The energy envelopes of marine seismic exploration data can be reliably extracted through these filtering methods. This approach improves the accuracy and resolution of the data by comparing signal characteristics across various frequency bands.
Although various band-pass and low-pass filters can be applied to SBP data, the resulting spectra primarily show suppression of specific frequency components along with smoothing of reflection features. This demonstrates the limitation of conventional filtering methods, and therefore, Section 3.2 presents only a baseline comparison, highlighting the superior performance of the CWT-based energy envelope approach.
3.3. Instantaneous Frequency by Medium
The process of extracting instantaneous frequency is as follows:
- Hilbert transform: The Hilbert transform is used to obtain the complex form of the signal, generating a complex signal that includes both real and imaginary parts.
- Phase calculation: The phase values of the complex signal are calculated using the Hilbert transform. These phase values represent the frequency changes at each signal moment.
- Time derivative of phase: The calculated phase values are differentiated with respect to time to acquire the instantaneous frequency; this allows for a precise analysis of how the signal frequency changes over time.
Instantaneous frequency analysis accurately captures the frequency changes in nonlinear and nonstationary signals. This approach enables the evaluation of the physical properties of seafloor sediments, such as grain size and porosity [6]. This improves the accuracy of marine seismic exploration data analysis and yields a more precise understanding of the frequency characteristics of different media.
As reported by Stevenson et al. [25], the instantaneous frequency of a received seismic trace can be inferred from the shape of the seismic signal. The analyzed seismic signal is a multicomponent waveform composed of real and imaginary components. A given seismic trace y(t) can be represented by the energy envelope a(t) and the phase θ(t). Therefore, field traces were recorded.
The orthogonal trajectory is as follows:
The complex trace z(t) is expressed as follows:
where y*(t) denotes the Hilbert transform of y(t), a(t) represents the amplitude envelope function, and θ(t) denotes the instantaneous phase.
The instantaneous amplitude is represented as follows:
The instantaneous phase is represented as follows:
The instantaneous frequency f(t) represents the rate of change in the instantaneous phase, which serves as a measure of the time variation in the frequency and can be expressed as follows:
In this study, we examined the instantaneous frequency of SBP exploration data for each medium using the Hilbert transform. This analysis revealed distinct frequency variations among sedimentary media, reflecting their physical properties. Consistent with Li et al. [6] and Stevenson et al. [25], these variations confirm that frequency-domain acoustic attributes, including instantaneous frequency, provide reliable indicators for distinguishing seafloor sediment types and distributions.
4. Results
Figure 5a compares the energy envelope obtained using CWT with the raw data of the acoustic reflection signals acquired in the field.
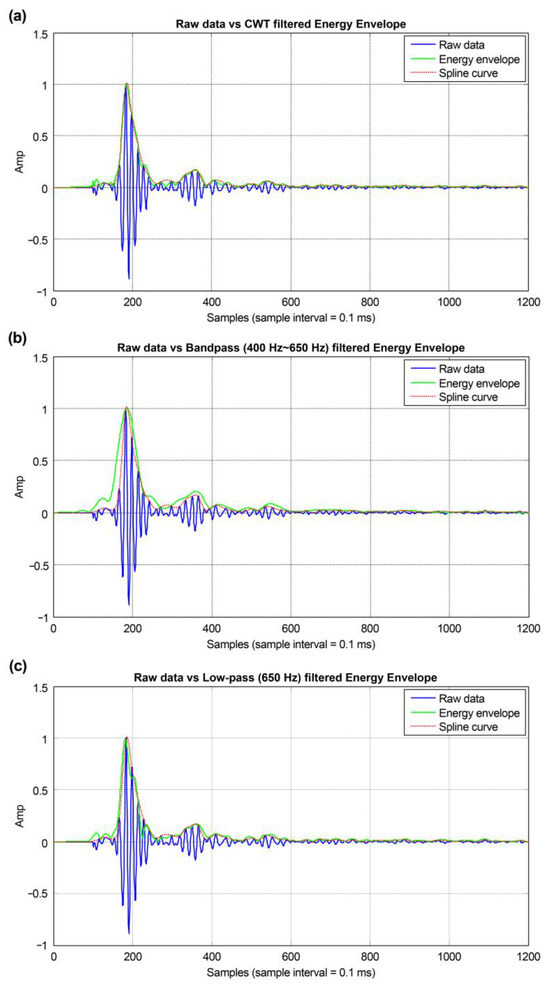
Figure 5.
Evaluation of energy envelopes obtained using different methods against raw acoustic reflection data acquired in the field. (a) CWT. (b) Bandpass filtering (400–650 Hz). (c) Low-pass filtering (650 Hz).
Figure 5b shows the energy envelope obtained by bandpass filtering of the acoustic reflection signals acquired in the field within the frequency range 400–650 Hz and compares it with the raw data. A bandpass filter was selected because the maximum value of the frequency spectrum peaked near 600 Hz.
Figure 5c shows the energy envelope obtained by low-pass filtering of the acoustic reflection signals acquired in the field with a cutoff frequency of 650 Hz and compares it with the raw data. Low-pass filtering removes high-frequency components, allowing only low-frequency components to pass through, making it helpful in analyzing the frequency characteristics of the signal.
The energy envelope shown in Figure 5a connects the positive peak points of the raw data more smoothly than the energy envelopes shown in Figure 5b,c, representing the energy distribution more accurately; this demonstrates that the CWT is highly effective for extracting the energy envelope. However, the energy envelope in Figure 5c connects the positive peak points of the raw data more effectively than Figure 5b. However, it exhibits significant value fluctuations, limiting its ability to represent the energy distribution accurately. These results highlight the differences in the energy envelopes obtained using different filtering methods, emphasizing the need to consider the characteristics of each technique when performing signal analysis.
Figure 6a compares the energy envelope obtained using CWT with the raw data of acoustic reflection signals acquired in the field.
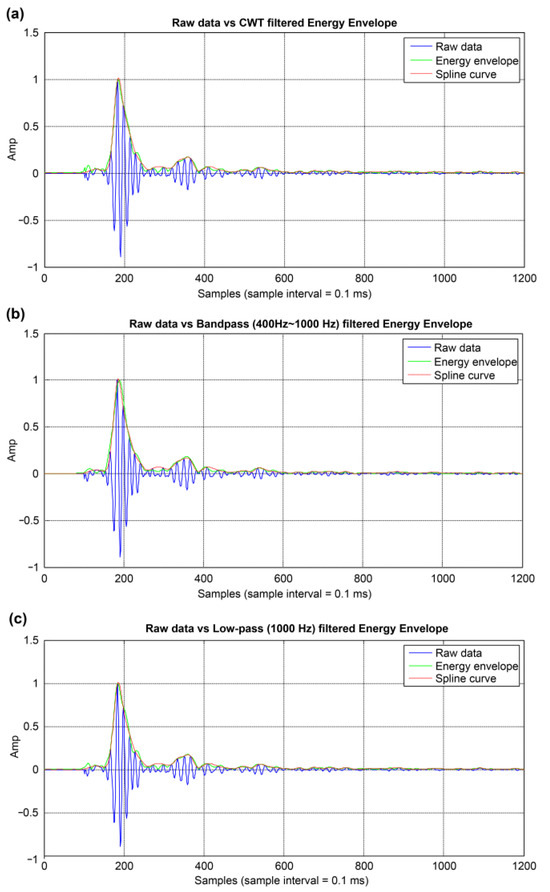
Figure 6.
Comparison of energy envelopes obtained using different methods with the raw data of acoustic reflection signals acquired in the field. (a) CWT. (b) Bandpass filtering (400–1000 Hz). (c) Low-pass filtering (1000 Hz).
Figure 6b shows the energy envelope obtained by bandpass filtering of the acoustic reflection signals acquired in the field over 400–1000 Hz and compares it with the raw data.
Figure 6c shows the energy envelope obtained by low-pass filtering of the acoustic reflection signals acquired in the field with a 1000 Hz cutoff and compares it with the raw data.
The energy envelope in Figure 6a connects the positive peak points of the raw data more smoothly than those in Figure 6b,c, accurately representing the energy distribution; this demonstrates the high effectiveness of CWT in extracting the energy envelope. The energy envelope in Figure 6c connects the positive peak points of the raw data better than that in Figure 6b; however, it exhibits significant amplitude fluctuations, limiting its ability to represent the energy distribution accurately.
To evaluate the smoothness of the energy envelope connecting the positive peak points, the difference from the cubic spline curve was calculated using the sum of squared error (SSE), as shown in Table 1. The SSE was calculated to measure the difference from the cubic spline curve to evaluate the smoothness of the energy envelope connecting the positive peak points. Table 1 presents the results of this analysis.

Table 1.
Comparison of sum of squared error between energy envelope and cubic spline curve.
The cubic spline interpolation was used as a reference baseline to represent the natural continuity of reflection events. A lower SSE indicates a closer fit to this baseline, reflecting better preservation of signal continuity. Among all tested methods, the CWT approach yielded the lowest SSE (0.2630), confirming its effectiveness in maintaining the continuity of the energy envelope compared with conventional band-pass and low-pass filters. Bandpass filtering within the 400–650 Hz range had the highest error at 5.1639 Hz, suggesting a smoother connection of the peak points compared with the cubic spline curve.
When the bandpass filter range was adjusted from 400 Hz to 1000 Hz, the SSE decreased to 0.4136, indicating a better fit than the narrower bandpass filter but still not as smooth as CWT. Low-pass filtering at 650 Hz resulted in an SSE of 1.4376, whereas extending the low-pass filter to 1000 Hz significantly improved the fit, reducing the error to 0.3020.
These results illustrate the varying degrees of smoothness in connecting the positive peak points of the energy envelope, with CWT providing the closest approximation to the cubic spline curve, followed by the broader bandpass and low-pass filtering methods.
The energy envelope obtained using the CWT was similar to the cubic spline curve. In contrast, the energy envelope obtained by bandpass filtering with a passband of 400–650 Hz is the least similar. The energy envelopes obtained through bandpass filtering with a passband of 400–1000 Hz and low-pass filtering with a cutoff frequency of 1000 Hz were also comparable to the cubic spline curve, similar to those obtained using the CWT.
These results indicate that using a CWT or low-pass filtering to extract the energy envelope is more effective than bandpass filtering, with the CWT being the most accurate. However, low-pass filtering has the drawbacks of potential subjectivity in selecting the cutoff frequency and significant fluctuations in the energy envelope values over time.
The results of the instantaneous frequency analysis for rock are shown in Figure 7. The center frequency of the primary reflection wave ranged from approximately 300 to 700 Hz, whereas that of the secondary reflection wave ranged from approximately 400 to 700 Hz. The center frequency pattern in the primary reflection wave region exhibited a W-shape, whereas that in the secondary reflection wave region exhibited an M-shape, the inverse of the primary pattern. These frequency patterns reflect the physical properties of the rock and the characteristics of the reflected waves.
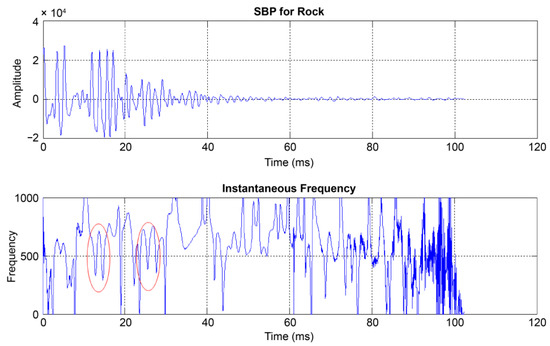
Figure 7.
Results of instantaneous frequency analysis for rock using sub-bottom profiler (SBP) data.
The results of the instantaneous frequency analysis for sand are shown in Figure 8. The characteristics of the waves were similar to those of rock, except that the center frequency of the primary reflection wave ranged from approximately 500 to 700 Hz, whereas that of the secondary reflection wave ranged from approximately 500 to 800 Hz. Compared to that of rock, the center frequency pattern of sand was higher, reflecting the physical properties of sand.
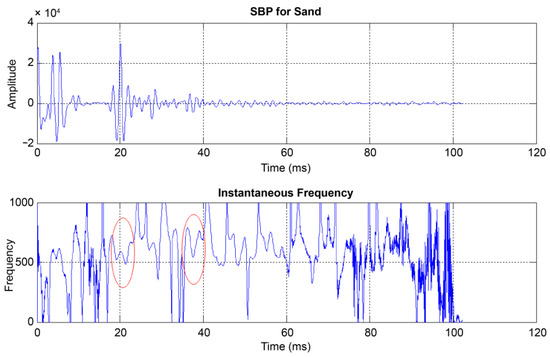
Figure 8.
Results of instantaneous frequency analysis for sand using sub-bottom profiler (SBP) data.
The results of the instantaneous frequency analysis for mud are shown in Figure 9. The center frequency of the primary reflection wave appeared to be approximately 800 Hz. In contrast, the center frequency pattern of the secondary reflection wave was unclear. The presence of more noise in mud than in rock or sand makes the signal analysis more complex. This complexity is attributed to the low porosity and high water content of mud, which causes signal distortion.
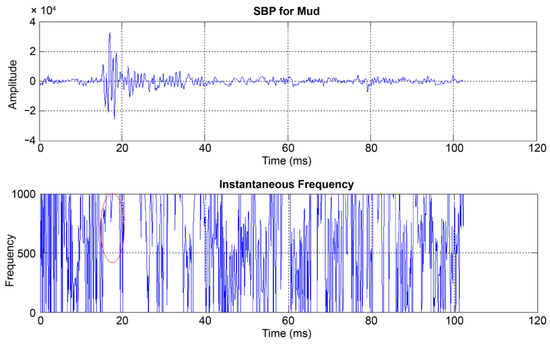
Figure 9.
Results of the instantaneous frequency analysis of mud using SBP data.
These W- and M-shaped frequency patterns can also be interpreted in terms of sediment properties. In rocks, the W-shaped primary reflection is associated with heterogeneous grain packing and lower porosity. In contrast, the M-shaped secondary reflections result from overlapping multiples caused by strong impedance contrasts. In sand, the shift in these patterns to slightly higher frequencies reflects finer grain size and moderately higher porosity compared to those of rock. In mud, the concentration of the frequency peak near 800 Hz is consistent with very fine-grained sediments and high porosity, although high noise levels complicate interpretation. These interpretations are supported by prior studies relating instantaneous frequency to sediment properties (Stoll [2]; Li et al. [6]).
5. Discussion
In this study, the energy envelopes derived with the CWT, bandpass filtering (400–650 Hz), and low-pass filtering (cutoff at 650 Hz) were compared with the raw data. The CWT method provided greater continuity of the positive peak points of the raw data and represented the energy distribution more accurately than the filtering methods. Bandpass and low-pass filtering showed significant amplitude fluctuations, limiting their ability to represent the energy distribution accurately.
Further comparisons were made between the energy envelopes obtained using CWT, bandpass filtering (400–1000 Hz), and low-pass filtering (cutoff at 1000 Hz). Similarly to the previous comparison, the CWT method proved more effective for accurately visualizing the energy distribution.
The SSE was calculated with respect to the cubic spline curve to evaluate the smoothness of the energy-envelope connections. The CWT yields the lowest SSE (0.2630), indicating the closest approximation to the cubic spline curve. Bandpass filtering (400–650 Hz) yielded the highest SSE (5.1639), indicating the least similarity. Other methods (bandpass at 400–1000 Hz and low-pass at 1000 Hz) exhibited intermediate SSE values, demonstrating moderate accuracy.
Instantaneous frequency analysis using the Hilbert transform provides critical insights into the frequency variations in seismic signals, which are essential for understanding the physical properties of different media. Distinctive frequency patterns were observed for rock, sand, and mud, reflecting the intrinsic characteristics of each medium.
Our results are consistent with those of previous studies, highlighting the effectiveness of advanced signal processing techniques in marine seismic exploration. However, we observed that bandpass filtering, particularly in the 400–650 Hz range, produced maximal SSE, suggesting limitations in accurately capturing energy envelopes. Analysis of instantaneous frequencies also revealed the frequency patterns associated with different sediment types and yielded informative insights into their physical properties. Given the limitations of this study, including possible subjectivity in selecting cutoff frequencies for low-pass filtering and variations in energy envelope values, we recommend future research to refine these methods and explore additional frequency ranges. Similarly to recent deep learning frameworks for microcrack detection, integrating multiple feature channels could further enhance sediment classification accuracy [26].
Overall, the present study demonstrates that the CWT approach significantly improves the accuracy and resolution of energy envelope extraction from acoustic reflection signals and outperforms traditional bandpass and low-pass filtering methods. Instantaneous frequency analysis further enhances our understanding of the physical properties of marine sediments. These methodologies substantially enhance the processing accuracy and resolution of the marine seismic exploration data, contributing to more precise geological and geotechnical evaluations. The CWT provided smoother connections to the positive peak points and better represented energy distribution, as evidenced by the lowest SSE compared to other methods. These findings confirm our hypothesis that CWT provides enhanced time–frequency characterization. Our findings have practical implications for boosting accuracy of marine seismic data interpretation and may contribute to more accurate geological and geotechnical assessments of seafloor sediments. Although the present study demonstrates the resolution improvement of CWT through quantitative SSE evaluation and frequency-domain analysis, it does not include a direct comparison using complete multi-trace seismic sections. In future work, we plan to develop a dedicated program based on the methodology of this study and apply it to raw seismic sections, thereby enabling full-section visualization of resolution enhancement in practical survey conditions.
6. Conclusions
In this study, we effectively analyzed the acoustic characteristics of SBP seismic exploration data by extracting the energy envelope using the CWT and Hilbert transform. The primary results are summarized as follows:
- Extraction of energy envelope: Using CWT and Hilbert transforms enabled the extraction of high-quality energy envelopes. CWT analyzed the time–frequency characteristics of a signal and accurately visualized its energy distribution.
- Characteristics of CWT: The energy envelope obtained via CWT better reflected the energy distribution of the raw data than filtering methods, owing to the simultaneous resolution of the CWT in both frequency and time, which enables precise capture of signal changes.
- Low-pass filtering: Among the filtering methods, low-pass filtering more accurately reflected the energy distribution of raw data than bandpass filtering. It effectively removed high-frequency noise while maintaining the main characteristics of the signal.
- Objective data analysis: The CWT method enables more objective data analysis than filtering methods because it uses the CWT coefficients corresponding to the scale with the maximum value to obtain the energy envelope. Filtering methods can result in different energy envelopes depending on the cutoff frequency or passband settings.
- Instantaneous frequency analysis: The physical properties of each medium were evaluated using instantaneous frequency analysis. In rock, the primary and secondary reflection waves, with central frequencies of 300–700 and 400–700 Hz, exhibited W- and M-shaped patterns, respectively. In sand, these frequencies were 500–700 and 500–800 Hz, respectively, with lower M-shaped patterns than rock. In mud, the primary reflection wave had a center frequency of approximately 800 Hz, but the secondary reflection wave patterns were unclear because of significant noise. These findings offer key insights for the accurate understanding and interpretation of the types and characteristics of media.
The findings of this study have significant implications for improving the accuracy and reliability of acoustic reflection data analysis, which may enable more robust assessments of seafloor sediment structures and stratigraphy. Accurate extraction of the energy envelope using CWT and Hilbert transforms enhances our understanding of the marine environment by providing more precise data on sediment characteristics; this capability is critical in offshore resource exploration, environmental monitoring, and geological research.
In subsequent research, adaptive wavelets will be applied to high-frequency chirp SBP systems (e.g., 2–16 kHz) to evaluate seafloor sediment classification performance in high-resolution environments and will be integrated with machine learning- and deep learning-based classification algorithms to assess their potential for automated interpretation of seafloor strata characteristics and real-time processing.
The improved data analysis methods can support more informed decision-making while exploring underwater resources, ensuring more efficient and targeted extraction processes. Environmental monitoring efforts can also benefit from these techniques by enabling a better understanding of sediment dynamics and potential environmental impacts. Additionally, geological research can use these findings to advance the study of seabed formations and their historical developments.
Integrating these advanced signal-processing techniques into standard seismic exploration practices could significantly advance our understanding and management of the marine environment. Enhancing the accuracy of seafloor assessments contributes to safer, more effective exploration activities and ultimately supports the sustainable use and conservation of marine resources.
Author Contributions
Conceptualization, S.-B.K.; methodology, S.-H.L.; software, S.-B.K.; validation, D.-P.K., S.-B.K. and S.-H.L.; formal analysis, D.-P.K. and S.-B.K.; investigation, S.-B.K.; resources, S.-B.K.; data curation, D.-P.K. and S.-B.K.; writing—original draft preparation, S.-H.L.; writing—review and editing, D.-P.K. and S.-B.K.; visualization, D.-P.K., S.-B.K. and S.-H.L.; supervision, S.-H.L.; project administration, S.-H.L.; funding acquisition, S.-B.K. All authors have read and agreed to the published version of the manuscript.
Funding
This research was supported by the Basic Science Research Program through the National Research Foundation of Korea (NRF), funded by the Ministry of Education (NRF-2022R1I1A3066000).
Institutional Review Board Statement
Not applicable.
Informed Consent Statement
Not applicable.
Data Availability Statement
Data is contained within the article.
Conflicts of Interest
The authors declare no conflicts of interest. The funder had no role in the design of the study; in the collection, analyses, or interpretation of data; in the writing of the manuscript; or in the decision to publish the results.
Abbreviations
The following abbreviations are used in this manuscript:
| CWT | Continuous Wavelet Transform |
| SSE | Sum of Squared Error |
| SBP | Sub-bottom Profiler |
| STFT | Short-time Fourier Transform |
| MAW | Modified Analytical Wavelet |
| MVMD | Modified Variation Mode Decomposition |
References
- Claerbout, J.F. Fundamentals of Geophysical Data Processing; McGraw-Hill Book Co. Inc.: New York, NY, USA, 1976. [Google Scholar]
- Stoll, R.D. Marine sediment acoustics. J. Acoust. Soc. Am. 1985, 77, 1789–1799. [Google Scholar] [CrossRef]
- Qu, Z.; Shan, M.; Zou, D.; Cao, X.; Zhong, Z.; Xie, Y. Sampling guidance of deep-sea surficial sediment using acoustic faces CNN-BLSTM fusion. IEEE Geosci. Remote Sens. Lett. 2024, 21, 1–5. [Google Scholar] [CrossRef]
- He, L.; Zhao, J.; Lu, J.; Qiu, Z. High-accuracy acoustic sediment classification using sub-bottom profile data. Estuar. Coast. Shelf Sci. 2022, 265, 107701. [Google Scholar] [CrossRef]
- Li, M.; Tao, Q.; Hou, G.; Zhai, J. A novel sub-bottom profiler seabed sediment classification method based on BPNN with Biot–Stoll model and attenuation-based model. IEEE Access 2021, 9, 53379–53391. [Google Scholar] [CrossRef]
- Li, S.; Zhao, J.; Zhang, H.; Qu, S. Sub-bottom sediment classification using reliable instantaneous frequency calculation and relaxation time estimation. Remote Sens. 2021, 13, 4809. [Google Scholar] [CrossRef]
- Taner, M.T.; Koehler, F.; Sheriff, R.E. Complex seismic trace analysis. Geophysics 1979, 44, 1041–1063. [Google Scholar] [CrossRef]
- Kim, S.B.; Park, H.L. Optimizing source wavelets extracted from the chirp sub-bottom profiler using an adaptive filter with machine learning. J. Mar. Sci. Eng. 2022, 10, 449. [Google Scholar] [CrossRef]
- Li, S.; Zhao, J.; Wu, Y.; Bian, S.; Zhai, G. Marine sediment classification spectral ratio technique from a signal decomposition view based on chirp sonar data. IEEE Trans. Geosci. Remote Sens. 2023, 61, 1–12. [Google Scholar] [CrossRef]
- Zong, Z.; Zhao, J.; Li, S.; Zhang, H. Automatic marine sub-bottom sediment classification using feature clustering and quality factor. J. Mar. Sci. Eng. 2023, 11, 1770. [Google Scholar] [CrossRef]
- LeBlanc, L.R.; Panda, S.; Schock, S.G. Sonar attenuation modeling for classification of marine sediments. J. Acoust. Soc. Am. 1992, 91, 116–126. [Google Scholar] [CrossRef]
- Nasıf, A. Enhancing low- and high-frequency components of the seismic data to emphasise BSRs and bright spots and implications for seismic attribute analysis. J. Earth Syst. Sci. 2024, 133, 33. [Google Scholar] [CrossRef]
- Huang, N.E.; Shen, Z.; Long, S.R.; Wu, M.C.; Shih, H.H.; Zheng, Q.; Yen, N.C.; Tung, C.C.; Liu, H.H. The empirical mode decomposition and the Hilbert spectrum for nonlinear and non-stationary time series analysis. Proc. R. Soc. Lond. A 1998, 454, 903–995. [Google Scholar] [CrossRef]
- Olhede, S.C.; Walden, A.T. Generalized Morse wavelets. IEEE Trans. Signal Process. 2002, 50, 2661–2670. [Google Scholar] [CrossRef]
- Daubechies, I.; Lu, J.; Wu, H.T. Synchrosqueezed wavelet transforms: An empirical mode decomposition-like tool. Appl. Comput. Harmon. Anal. 2011, 30, 243–261. [Google Scholar] [CrossRef]
- Liu, N.; Gao, J.; Jiang, X.; Zhang, Z.; Wang, P. Seismic instantaneous frequency extraction based on the SST-MAW. J. Geophys. Eng. 2018, 15, 995–1007. [Google Scholar] [CrossRef]
- Ahmad, S.; Ahmad, S.; Akhtar, S.; Ahmad, F.; Ansari, M.A. Data-driven assessment of corrosion in reinforced concrete structures embedded in clay dominated soils. Sci. Rep. 2025, 15, 22744. [Google Scholar] [CrossRef] [PubMed]
- Kim, S.B. A Study on Extraction of Acoustic Seafloor Sediments Classification Parameters. Master’s Thesis, Dong-A University, Busan, Republic of Korea, 2007. [Google Scholar]
- Sun, H.; Gao, F.; Huang, X.; Zhang, J.; Li, M.; Zhao, X. Time–frequency analysis method of seismic data based on sparse constraints for road detection. IEEE Trans. Intell. Transp. Syst. 2024, 25, 2748–2756. [Google Scholar] [CrossRef]
- Appiah, M.K.; Danuor, S.K.; Bienibuor, A.K. Performance of continuous wavelet transform over Fourier transform in features resolutions. Int. J. Geosci. 2024, 15, 87–105. [Google Scholar] [CrossRef]
- Zhuravov, D.V.; Stepanov, A.B. Application of Simulink in the implementation of calculation algorithms for continuous wavelet transform on a digital signal processor. J. Radio Electron. 2019, 5, 11. [Google Scholar] [CrossRef]
- Frikha, T. Source localization of the EEG human brainwaves activities via all the different mother wavelets families for stationary wavelet transform decomposition. arXiv 2019, arXiv:1911.01230. [Google Scholar] [CrossRef]
- Zhou, Y.; Chen, W.; Gao, J.; He, Y. Application of Hilbert–Huang transform based instantaneous frequency to seismic reflection data. J. Appl. Geophys. 2012, 82, 68–74. [Google Scholar] [CrossRef]
- Zang, L.G.; Qu, Y.F.; Shi, P.W.; Zhong, W.L.; Hou, Y.M.; Liu, Y.; Ohshima, S. Analysis of nonlinear mode-mode interaction using Hilbert transform on HL-2A. In Proceedings of the 28th IAEA Fusion Energy Conference, Virtual Event, 10 – 15 May 2021; Available online: https://conferences.iaea.org/event/214/contributions/17319/ (accessed on 19 November 2024).
- Stevenson, I.R.; McCann, C.; Runciman, P.B. An attenuation-based sediment classification technique using Chirp sub-bottom profiler data and laboratory acoustic analysis. Mar. Geophys. Res. 2002, 23, 277–298. [Google Scholar] [CrossRef]
- Moreh, F.; Hasan, Y.; Rizvi, Z.H.; Wuttke, F.; Tomforde, S. MCMN deep learning model for precise microcrack detection in various materials. In Proceedings of the 2024 International Conference on Machine Learning and Applications (ICMLA), Miami, FL, USA, 15–17 December 2024; pp. 1928–1933. [Google Scholar] [CrossRef]
Disclaimer/Publisher’s Note: The statements, opinions and data contained in all publications are solely those of the individual author(s) and contributor(s) and not of MDPI and/or the editor(s). MDPI and/or the editor(s) disclaim responsibility for any injury to people or property resulting from any ideas, methods, instructions or products referred to in the content. |
© 2025 by the authors. Licensee MDPI, Basel, Switzerland. This article is an open access article distributed under the terms and conditions of the Creative Commons Attribution (CC BY) license (https://creativecommons.org/licenses/by/4.0/).