Article

Time Series Changes of Surficial Sediments on Eastern Ship Shoal, Louisiana Shelf

1
Department of Oceanography and Coastal Sciences, Louisiana State University, Baton Rouge, LA 70803, USA
2
Coastal Studies Institute, Louisiana State University, Baton Rouge, LA 70803, USA
3
Louisiana Universities Marine Consortium (LUMCON), 8124 Highway 56, Chauvin, LA 70344, USA
4
Virginia Institute of Marine Sciences, Gloucester Point, VA 23062, USA
*
Author to whom correspondence should be addressed.
J. Mar. Sci. Eng. 2025, 13(9), 1753; https://doi.org/10.3390/jmse13091753
Submission received: 15 July 2025 / Revised: 3 September 2025 / Accepted: 5 September 2025 / Published: 11 September 2025

Abstract

Ship Shoal, a large transgressive sand body on the Louisiana continental shelf, is a critical sediment source for coastal restoration. This study evaluates spatial and temporal variability in sediment grain size, percents organic matter (%OM), and carbonate (%CO3) across the shoal crest (REF), Caminada Dredge Pit (CAM), and Terrebonne Dredge Pit (TER). Sediment samples were collected between 2020 and 2022 using box cores and analyzed for grain size, %OM, and %CO3, with temporal and spatial patterns assessed through statistical comparisons, correlation analyses, and random forest regression models. Results show that dredged areas act as sinks for fine-grained, organic-rich sediments, with CAM consistently exhibiting the smallest median grain sizes and highest %OM, while REF maintained coarse, well-sorted sands. Carbonate enrichment reflected long-term depositional regimes, with REF exhibiting the highest %CO3 due to the absence of dredging disturbance. Grain size and %CO3 were identified as the strongest predictors of %OM, while %CO3 was only weakly correlated with other sedimentary variables. Collectively, these findings demonstrate that dredge pits function as persistent repositories, with implications for benthic habitat resilience, sediment management, and coastal restoration planning. Future integration of hydrodynamic modeling with sediment transport and biogeochemical processes is needed to enhance predictive capability for managing dredged environments.

1. Introduction

The Louisiana continental shelf is shaped by dynamic sedimentary processes influenced by riverine inputs, coastal hydrodynamics, and anthropogenic activities. Among its key geological features, Ship Shoal (Figure 1A) is a transgressive sand body located approximately 15 km offshore from the Isles Dernières barrier island system. It represents a relict deltaic deposit of the Mississippi River system, which was reworked into its current form due to Holocene sea-level rise [1,2]. This shoal is recognized as one of the most significant offshore sand reservoirs on the Louisiana shelf, containing an estimated 1.2 billion cubic meters of high-quality quartz sand [3]. Given its proximity to eroding coastal regions, Ship Shoal is a primary borrow site for coastal restoration projects [3,4].
Sediment composition across the Louisiana continental shelf reflects a complex interplay between fluvial inputs from the Mississippi and Atchafalaya Rivers and sediment reworking by oceanic and atmospheric forces. The eastern portion of Ship Shoal exhibits coarser, quartz-dominated sands, whereas finer sediments dominate the western portion due to increased influence from the Atchafalaya-derived muds [5]. These textural differences potentially influence the organic matter and carbonate content of sediments, which are key factors in understanding sediment transport, biogeochemical processes, and the ecological consequences of dredging activities [6,7].
Dredging has substantially modified local sedimentary environments, particularly at the Caminada (CAM) and Terrebonne (TER) borrow areas (Figure 1A,B) [3,4]. Excavations at CAM (2014, 2016, 2020, 2021) and TER (2021–2022) have transformed sandy environments into sites of fine-grained infilling [3]. Similar infilling has been observed at Block 88 (2018) (Figure 1A) and Raccoon Island (2013) (Figure 1A), where borrow areas evolved into mud-dominated environments over time. Such changes raise concerns about the long-term viability of Ship Shoal as a renewable sediment resource [3,4,6,8].
Although previous studies have highlighted storm-driven resuspension as a dominant control on Louisiana’s inner-shelf sediment dynamics [2,3,4,6,8,9], several unresolved issues remain. First, the role of high-energy events (cold fronts, tropical cyclones) in driving textural shifts across natural and dredged areas has not been well quantified. Second, the relationship between sediment texture and %OM, while conceptually established, lacks time-series validation across dredged and undisturbed environments. Third, carbonate dynamics within dredge pits remain poorly understood; although carbonate accumulation is thought to reflect long-term depositional regimes [7], dredging may alter seabed conditions in ways not yet documented.
To address these gaps, this study analyzes spatial and seasonal variability in grain size, %OM, and %CO3 across the shoal crest, the established CAM pit, and the newly dredged TER pit. By combining high-resolution sediment analyses with temporal observations, we provide new insights into the sedimentological and geochemical evolution of dredged borrow areas, with implications for sediment management, benthic habitat stability, and long-term coastal restoration strategies.

1.1. Study Site

CAM and TER represent two major excavation sites within the eastern portion of Ship Shoal [3]. These dredged areas undergo progressive sediment infilling, primarily driven by fine-grained materials transported by fluvial inputs and resuspension events [3,4,6]. The influence of hurricanes and winter storms further alters sediment deposition patterns, leading to episodic resuspension and redeposition cycles [3,4,9]. Over time, these processes result in a shift from sandy to muddy sediments, which diminishes the renewability of these sites as sand sources for future dredging projects [3,9].
The spatial heterogeneity of Ship Shoal sediments reflects a balance between sand and mud, with dredged pits acting as traps for muddy sediments. While the shoal crest maintains its sandy composition, the pits and adjacent seabed exhibit a mixture of sand, silt, and clay, influenced by regional sediment transport pathways [3,4,6,8,9]. The organic matter content varies spatially, with higher concentrations in the finer-grained sediments of the dredge pits due to the preferential deposition of organic-rich riverine inputs [7]. Similarly, carbonate content is generally elevated in sandy regions, reflecting biogenic calcite contributions from marine organisms [7].
This study provides a detailed assessment of sediment characteristics across Ship Shoal, offering critical insights for coastal restoration planning, sediment transport modeling, and the long-term management of dredged borrow areas. By integrating high-resolution sediment analyses with hydrodynamic observations, this research advances our understanding of sediment redistribution and post-dredging morphological evolution in Ship Shoal.

1.2. Hypotheses

The dynamic sedimentary environment of Ship Shoal, shaped by hydrodynamic forces, seasonal storm events, and anthropogenic modifications such as dredging, presents a unique opportunity to assess sediment transport, organic matter variability, and carbonate deposition patterns. Given the complex interactions between wave action, storm-driven resuspension, and sediment infilling processes within natural and dredged areas, it is critical to establish a framework for understanding how these forces influence sediment characteristics over time. Previous studies have demonstrated that storm events, rather than tidal processes, play a dominant role in sediment redistribution on the Louisiana shelf, particularly within transgressive sand bodies like Ship Shoal [2,3]. Additionally, the influence of cold front passages, tropical cyclones, and long-term sedimentation processes may contribute to variability in grain size distribution, organic matter accumulation, and carbonate deposition across different regions of the shoal [3,4].
To address these complexities, three hypotheses have been developed to examine key sedimentological and geochemical processes occurring within the shoal crest, the established dredge pits, and newly dredged areas. These hypotheses aim to investigate the following: (1) the role of high-energy storm events in controlling sediment resuspension and grain size distribution, (2) the impact of wind-driven resuspension on organic matter variability, and (3) the long-term depositional nature of shell fragments and carbonate content within natural and dredged areas. Previous research on dredged borrow areas suggests that sediment infilling follows distinct patterns influenced by wave energy and riverine input, with fine sediments preferentially accumulating in low-energy regions [3,5,7]. Similarly, organic matter concentrations have been linked to storm-driven nutrient resuspension, influencing benthic productivity and carbon cycling on the inner Louisiana shelf [2,5,7]. Finally, carbonate accumulation within Ship Shoal is largely controlled by long-term sedimentation processes rather than short-term seasonal variations, as biogenic carbonate production and deposition occur over extended timescales [7]. The following sections present these hypotheses in detail, outlining the expected patterns and mechanisms that may drive sedimentary changes in Ship Shoal.
H1. 
In the microtidal Ship Shoal setting, sediments are expected to remain coarse, well-sorted, and unimodal in distribution unless disrupted by significant physical or anthropogenic events.
Expected Observations: The crest of Ship Shoal will exhibit a unimodal peak in sand distribution, with minimal seasonal variability due to its exposure to higher wave energy and limited fine sediment deposition. In contrast, sediment within an established dredge pit (e.g., CAM) will display a bimodal grain size distribution, reflecting multiple years of sediment infilling from multiple sources and seasonal reworking. Variations in fine sediment deposition within the dredge pit will correlate with increased hydrodynamic energy during storm events, particularly the passage of cold fronts. TER is expected to exhibit characteristics of both environments: prior to dredging, sediment distribution will mirror the unimodal pattern observed on the shoal crest, whereas post-dredging samples will transition into a bimodal pattern, with seasonal shifts in mud deposits coinciding with storm-driven resuspension.
H2. 
The percent organic matter (%OM) in Ship Shoal sediments is primarily correlated with sediment grain size, with finer sediment binding higher organic matter content due to their greater surface area and stronger bonds, while coarser sediment contains lower organic matter concentrations due to reduced adsorption.
Expected Observations: Organic matter is preferentially associated with fine-grained sediments, such as silts and clays (mud), which provide a higher surface area for organic particle attachment and retention. Consequently, areas with a greater proportion of fine sediments, including dredge pits and depositional low-energy environments, will exhibit higher %OM, whereas coarser-grained sands, particularly those found on the shoal crest, will contain lower %OM.
H3. 
The accumulation of %CO3, primarily in the form of shell fragments, occurs over long-term depositional cycles rather than being significantly influenced by seasonal hydrodynamic variations.
Expected Observations: Sampling data indicate an absence of recently deposited shell fragments, suggesting that the carbonate material present in both the shoal crest and dredge pits has accumulated over extended timescales during Holocene. As a result, seasonal variations in %CO3 are expected to be minimal. However, differences in carbonate deposition are anticipated between dredged pits and undisturbed control sites on the shoal shelf, as dredging activities may alter the physical characteristics of the seabed, influencing long-term sedimentary processes.

2. Materials and Methods

2.1. Sample Collection and Preparation

Sediment samples were collected using NGOMEX box corers (30 cm × 30 cm) at the shoal crest (Reference area; REF), CAM, and TER areas. Sampling sites were within a 500 m × 500 m area, such as CAM1–CAM3 for CAM, TER1–TER3 for TER, and REF1–REF3 for the Reference area. Triplicate syringe samples were extracted from two depths to capture both surface and subsurface sediment layers: 0–1 cm, representing topmost surface sediments, and 0–5 cm, for integrated analysis of subsurface sediment characteristics. This was performed by collecting a single 0–1 cm and 0–5 cm syringe core from each of 3 replicate box cores. Over 300 samples over the course of multiple cruises with TER being sampled in fall 2020 and then spring, summer, and fall in 2021 and 2022. REF and CAM were sampled during spring, summer, and fall of 2021 and 2022, providing a unique and extensive dataset for this study. This is arguably the largest time-series seabed surficial sediment sampling dataset collected on the Louisiana shelf.

2.2. Sediment Analysis

Grain size distributions were determined using laser diffraction technique, which provided high-resolution characterization of textural variability across the study sites. Median grain size (D50, in µm) is used in the data analysis. Organic matter and carbonate content were quantified through loss-on-ignition (LOI) analysis. This method involved drying sediment samples at 100 °C for 24 h (or until reaching constant weight) to remove moisture, followed by sequential combustion. Samples were first combusted at 550 °C for 3 h to determine organic matter content, then at 950 °C for 2 h to quantify carbonate content. These procedures followed standardized methods outlined by Heiri et al. (2001) [10] to ensure accuracy and reproducibility.
The dataset utilized for this study included measurements of Percent Organic Matter (%OM), Percent Carbonate (%CO3), and Grain Size Distribution collected from the REF, TER, and CAM areas. Data preprocessing involved ensuring consistent formatting, converting date values to datetime format, and addressing missing or anomalous data. The analysis focused on temporal trends, spatial variability, and relationships among the studied variables.

2.3. Temporal–Spatial Analysis

Temporal trends in %OM, %CO3, and grain size were analyzed using line plots to visualize changes over time for each variable. Temporal variation was stratified by area (REF, TER, and CAM) and depth (0–1 cm and 0–5 cm). Separate visualizations for each depth highlighted differences in the temporal behavior of surface and subsurface sediments.
Spatial variability was assessed comparing the distributions of %OM, %CO3, and grain size across the three study areas (REF, TER, and CAM). This analysis identified if there were significant differences in sediment composition among the areas.

2.4. Depth Variation

To explore depth-related changes, boxplots were generated to compare %OM, %CO3, and grain size between the two depths (0–1 cm and 0–5 cm) within each area. This approach enabled the assessment of in-depth sediment variability and differences in sediment characteristics between surface and subsurface layers.

2.5. Correlation Analysis

Relationships among %OM, %CO3, and grain size were evaluated using Pearson correlation coefficients. The Pearson correlation coefficient ( r ) was calculated as follows:
r =   i = 1 n ( X i   X ¯ ) ( Y i   Y ¯ ) i = 1 n ( X i   X ¯ ) 2 i = 1 n ( Y i   Y ¯ ) 2
where Xi and Yi are individual data points for variables X and Y, X ¯ and Y ¯ are their respective means, and n is the number of observations. The results were visualized as a heatmap to display the relationships among variables.

2.6. Random Forest Regression

To model the relationships between sediment properties and environmental variables, a random forest regression (RFR) model was implemented using Python v3.10 Scikit-Learn library [11]. RFR is an ensemble learning method that constructs multiple decision trees during training and averages their predictions to improve accuracy and reduce overfitting. This method is particularly effective for handling non-linear relationships and multicollinearity between predictor variables, making it well-suited for analyzing complex sedimentological datasets.
The dataset was preprocessed by standardizing numerical variables and handling missing data through mean imputation where necessary. The target variable (e.g., organic matter content, carbonate content, grain size distribution) (Table 1) was selected based on research objectives, while predictor variables included depth, sediment grain size D50, carbonate content, hydrodynamic parameters (wind direction, wind speed, and wave height), and site location (Table 1). To prevent data leakage, the dataset was split into 80% training and 20% testing subsets, and a five-fold cross-validation approach was used to evaluate model performance.
Hyperparameter tuning was performed using a grid search with cross-validation, optimizing the number of trees (n_estimators), maximum tree depth (max_depth), minimum samples per split (min_samples_split), and minimum samples per leaf (min_samples_leaf). Feature importance scores were extracted to determine the relative contribution of each predictor variable. The model’s performance was assessed using Mean Absolute Error (MAE), Root Mean Squared Error (RMSE), and R2 scores. Model residuals were analyzed to check for bias, and predictions were validated against observed values to ensure robustness.

3. Results

3.1. Grain Size Distribution

The grain size distribution curves (Figure 2) reflect a range of sediment samples, illustrating significant variation in sediment proportions across the fractions of sand, silt, and clay. Sand, which falls within the phi (ϕ) scale range of −1 to 4 (63 µm to 2000 µm), is the dominant component in many samples, with a consistent peak concentration near 2 ϕ (250 µm). This pronounced peak suggests a prevalence of fine-to-medium sand particles, indicating that the sediments are primarily composed of well-sorted sand. Silt, defined as the ϕ scale range of 4 to 8 (4 µm to 63 µm), exhibits a minor but noticeable presence across the samples, though its overall contribution is substantially lower compared to sand. Clay, represented by ϕ values greater than 8 (<4 µm), contributes minimally to the overall grain size distribution. The low clay content highlights a scarcity of very-fine-grained particles in the sediment, suggesting that the depositional environment or sediment source is not conducive to the accumulation of clay-sized material.
The grain size distribution at the reference sites (Figure 3A) exhibits a strong and consistent peak in the sand range around 2 ϕ, indicating a high sand content across all samples. Beyond 4 ϕ, the distribution flattens significantly, with minimal contributions from silt and clay, highlighting well-sorted sediments dominated by sand particles. In contrast, the grain size distribution for CAM (Figure 3C) also shows a prominent sand-dominated peak near 2 ϕ but with greater variability in the silt range. Some samples from this location exhibit higher proportions of silt and clay compared to the reference sites. Similarly, the TER dredge pit (Figure 3B) displays a notable sand peak at 2 ϕ, though with a slightly broader variation than both the reference sites and CAM. This site also shows a more significant presence of silt and detectable but minimal clay content. These observations suggest that the sediment in TER is being influenced by the dredging activity and have begun to trend towards a finer distribution, as observed in CAM.

3.2. Seasonal Trends

3.2.1. Seasonal Median Grain Size Distribution

Median grain size distribution across the study site shows both temporal and spatial variations. CAM exhibits the finest and most heterogeneous sediment, with median grain sizes of approximately 62 μm and 69 μm for the shallow and deeper intervals, respectively (Table 2). Its smallest D50 values (17.71 and 32.60 μm) and high standard deviations (~67 μm) suggest a wide range in particle sizes. In contrast, REF displays the coarsest and most uniform grain sizes, with median values around 187 μm and narrow standard deviations (~10 μm), indicative of a consistent high-energy setting (Table 2). TER falls between the two, with median values near 166 μm and broader variability (standard deviations ~35 μm), pointing to a transitional environment as dredging occurred (Table 2). Minor increases in median grain size with depth across all areas suggest subtle changes in depositional conditions over time, with CAM showing the most pronounced vertical shift in sediment texture.
REF, located on the undisturbed shoal crest, consistently shows the coarsest and most stable sediment texture (~180–200 μm) and shows little seasonal variation (Figure 4). The TER samples, initially sampled on the shoal crest like REF, exhibits similar coarse grain sizes early in the record. However, beginning in mid-2021, coinciding with the onset of dredging activity, the TER grain sizes (Figure 4) become more variable and trend slightly finer. In contrast, CAM (Figure 4) represents an older, well-established dredge pit that has since been gradually infilling. It shows the finest and most variable grain sizes across the entire time series, with values dropping below 50 μm after 2021, especially in the 0–1 cm surface interval. The high standard deviations at CAM further support a heterogeneous infilling process and patchy and mixed deposit in the bottom of CAM.

3.2.2. Percent Organic Matter

Organic matter content across the study site reveals clear temporal and spatial trends that align with observed grain size patterns. CAM, representing the infilling dredge pit, contains the highest and most variable OM concentrations, with median values of 3.86% and 2.95% for the 0–1 cm and 0–5 cm intervals, respectively (Table 3). The elevated standard deviations (2.12% and 1.88%) and wide range (up to 8.41%) point to substantial heterogeneity, consistent with the episodic deposition of fine, organic-rich material during resuspension events. In contrast, REF, located on the undisturbed shoal crest, displays the lowest and most uniform OM levels, with medians around 1.08%, minimal variation, and tight standard deviations below 0.5%, indicative of a consistently high-energy, sandy environment that limits organic matter accumulation (Table 3). TER, which transitioned from an active shoal crest to a newly dredged pit during this study period, shows intermediate OM concentrations (~1.57% at the surface and 1.29% at depth) and greater variability than REF, suggesting a shift toward finer, more organic-rich sediment deposition following dredging activity (Table 3). These patterns reinforce the sedimentological gradient across the site—from coarse, organic-poor sands at REF, to finer, more organic-rich muds at CAM—with TER reflecting a transitional phase in both texture and organic content.
Located on the undisturbed shoal crest, REF consistently exhibits the lowest and most stable organic matter concentrations across the time series, with values remaining below 2% and showing minimal seasonal or interannual variation (Figure 5). TER, which was also sampled on the shoal crest prior to mid-2021, displays slightly elevated but still relatively low organic matter levels early in the record. Following the onset of dredging in mid-2021, TER values remain low but become slightly higher but marginally more variable, indicating small changes in sediment composition. In contrast, CAM shows the highest and most variable organic matter content throughout the study period. Surface (0–1 cm) organic matter values at CAM increase markedly after 2021, frequently exceeding 4% and reaching over 5.5% by October 2022, while the deeper 0–5 cm interval follows a similar but slightly attenuated trend. The elevated standard deviations at CAM highlight a heterogeneous environment influenced by episodic resuspension and supply of organic-rich fine sediments. This pattern is consistent with ongoing infilling processes and supports the interpretation of CAM as a dynamic, low-energy setting accumulating substantial organic material over time.

3.2.3. Percent Carbonate

Carbonate content across the Ship Shoal study site further distinguishes the sedimentary environments represented by CAM, REF, and TER. REF, situated on the stable shoal crest, shows the highest carbonate concentrations, with mean values of 2.39% and 2.00% at 0–1 cm and 0–5 cm depths, respectively. The broad standard deviations, particularly at the surface (2.29%), suggest occasional pulses of carbonate-rich material, possibly from shell hash or storm-driven reworking, though the median values are lower (1.36% and 1.57%), reflecting skewed distributions (Table 4). CAM, the older infilling dredge pit, has moderate carbonate levels, with means of 1.74% and 1.36% for surface and subsurface intervals. While slightly more enriched in carbonates than TER, CAM’s moderate standard deviations (1.28% and 0.76%) and range up to 8.84% indicate episodic delivery of biogenic carbonate material amidst ongoing muddy sediment infilling (Table 4). TER, which underwent dredging during the study period, displays the lowest carbonate content, with mean values of just 0.67% and 0.96% for the 0–1 cm and 0–5 cm depths, suggesting that the newly dredged sediments are largely devoid of shell debris or other carbonate sources. The relatively low medians and broader variability at depth (standard deviation of 1.26%) imply occasional incorporation of shell fragments or carbonate-rich pulses post-dredging (Table 4). Collectively, these trends reinforce the depositional contrasts among sites: REF reflects carbonate-rich sandy shoal environments, TER captures disturbed, carbonate-poor sediments post-dredging, and CAM contains a transitional carbonate signal as it infills with suspended sediment and reworked material.
REF consistently exhibits the highest and most variable carbonate concentrations over time, with %CO3 values peaking above 5% in June 2022 and showing notable fluctuations throughout the time series (Figure 6). TER maintains the lowest carbonate concentrations across both depths. Its %CO3 values generally remain below 1%, with limited variability, indicating that the sediment introduced or exposed through dredging are largely devoid of carbonate material. CAM displays moderate carbonate levels with consistent values around 1.5% to 2.5% across time. Though less dynamic than REF, CAM exhibits subtle temporal changes, particularly in the surface interval, that reflect episodic contributions of carbonate fragments within the infilling fine-grained matrix. These spatial trends align with depositional environments: REF as a carbonate-enriched high-energy shoal crest, TER as a disturbed, carbonate-poor dredge site, and CAM as a gradually infilling basin intermittently influenced by biogenic carbonate input.

3.3. Comparative Analysis

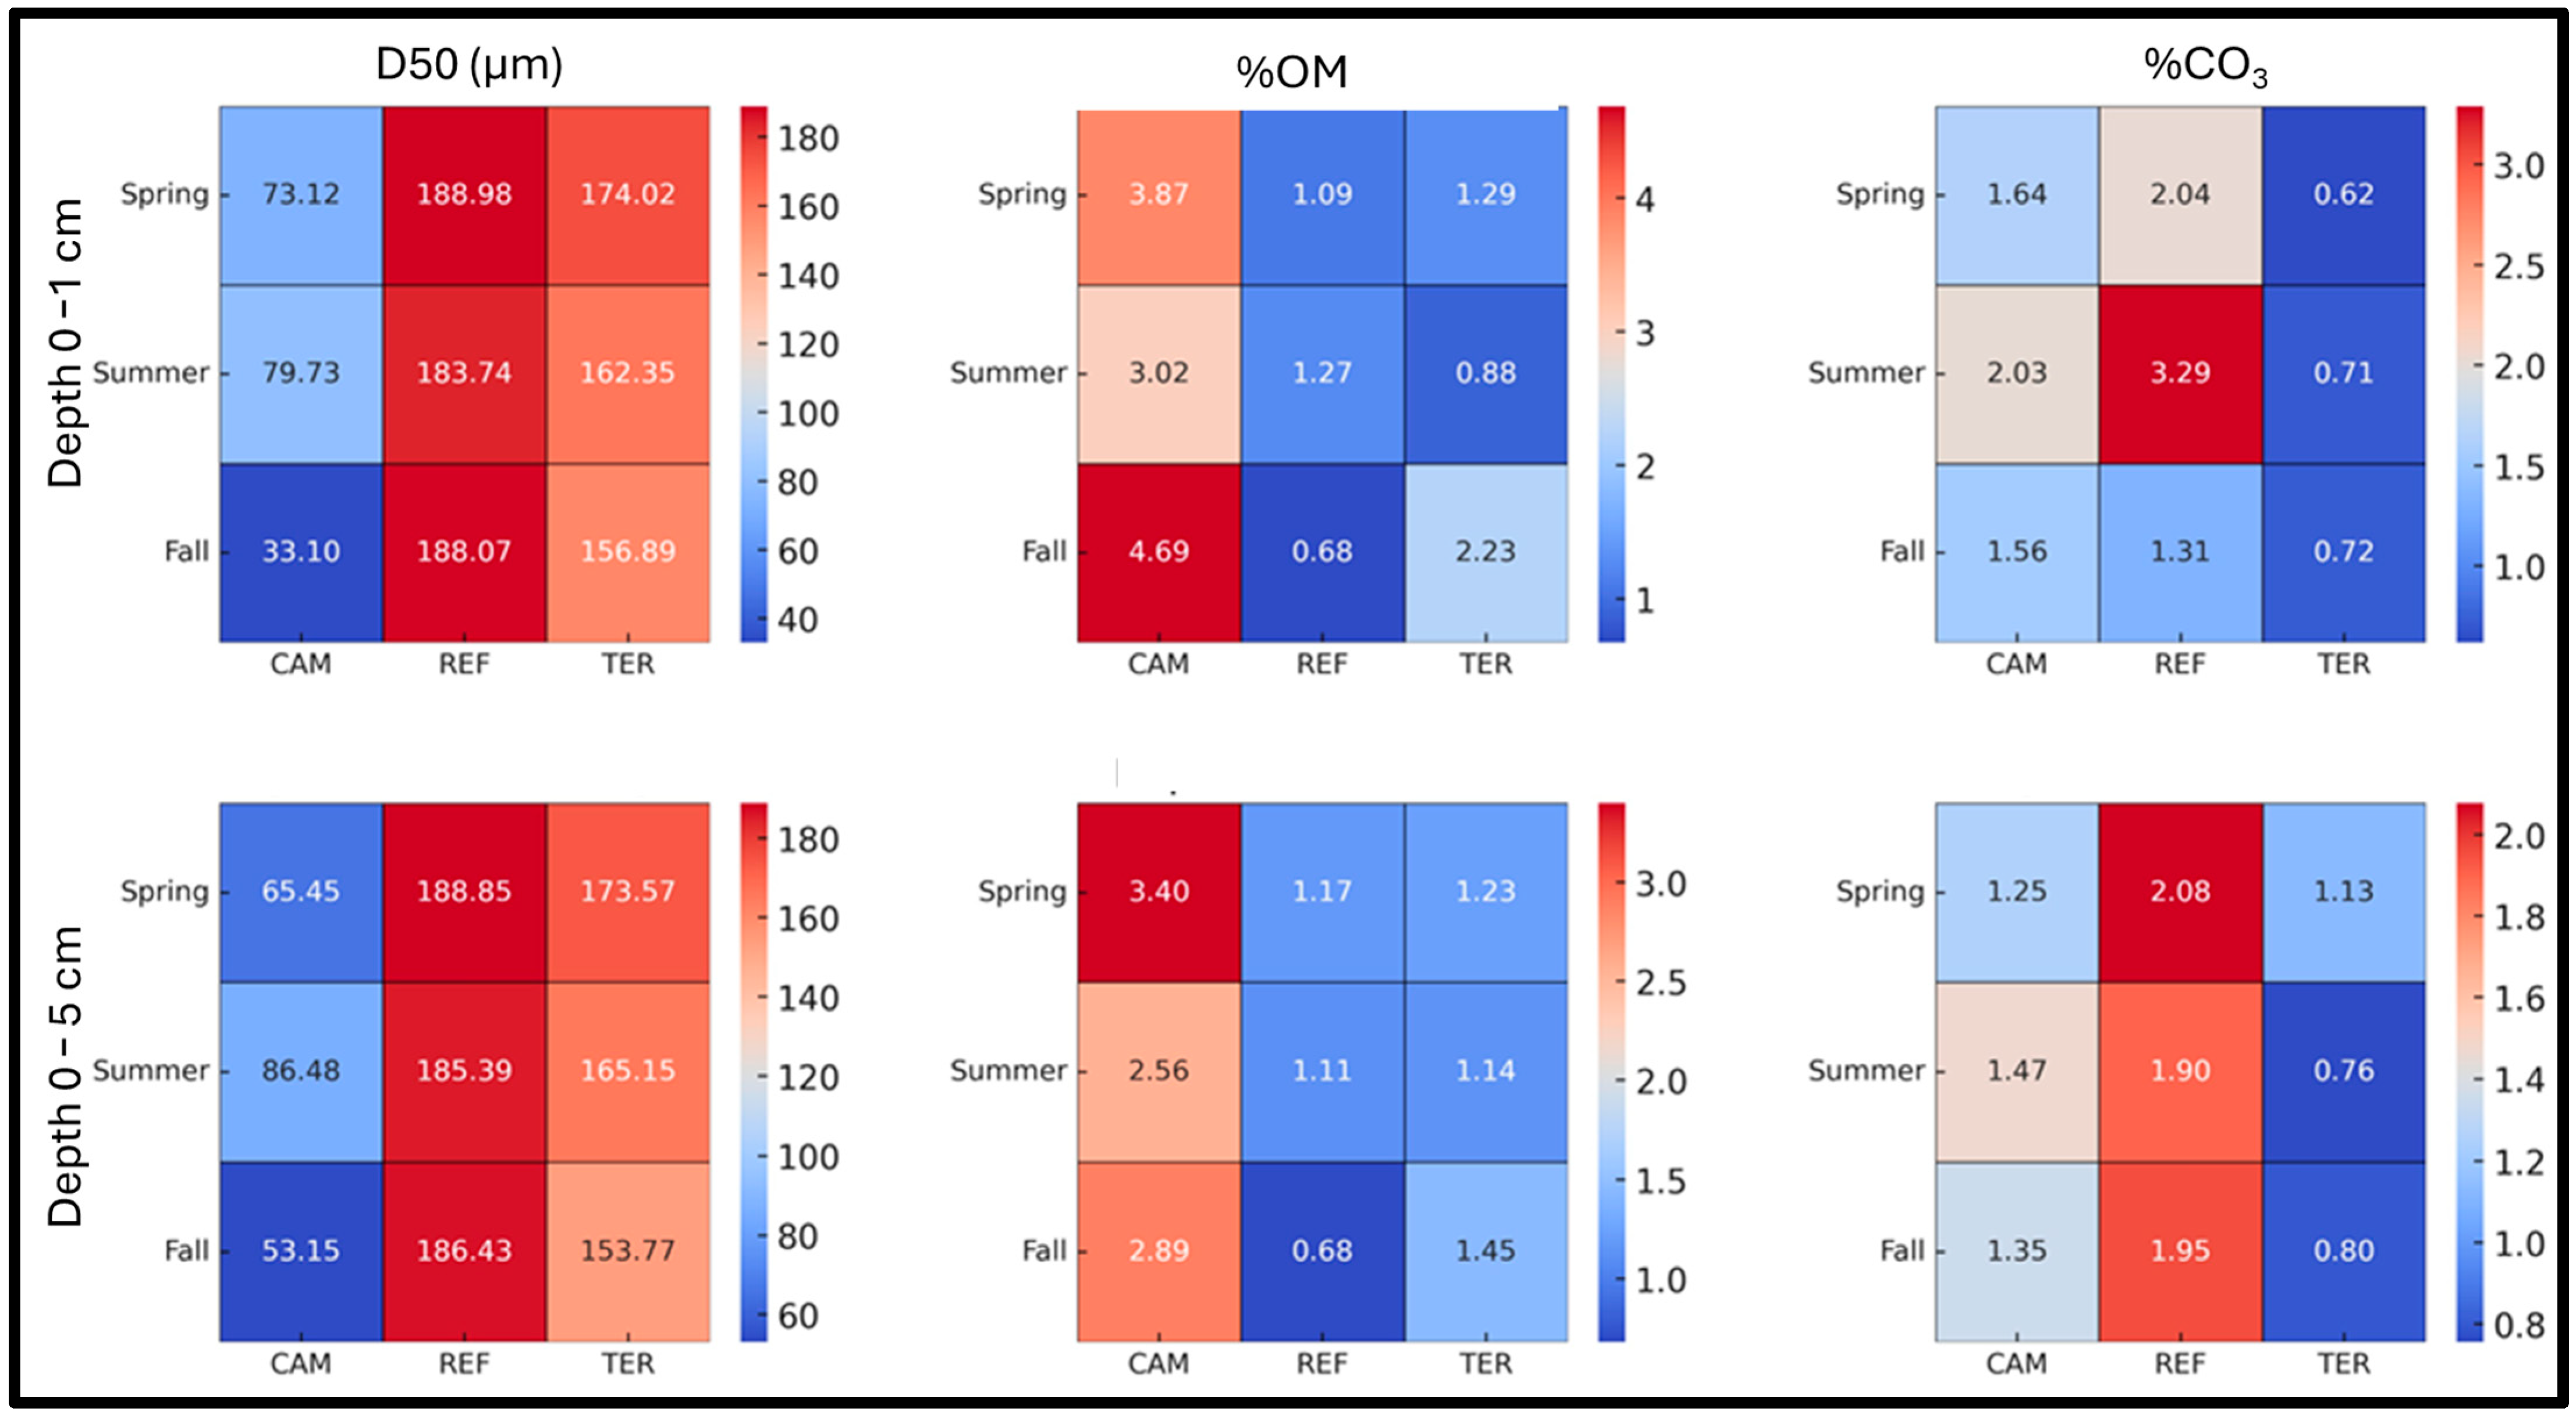
The heatmap (Figure 7) illustrates seasonal and spatial variations in median grain size (D50), percent organic matter (%OM), and percent carbonate (%CO3) across three sites (CAM, REF, TER) and two sediment depths (0–1 cm and 0–5 cm).
For D50, REF consistently shows the coarsest and most stable grain sizes across all seasons and depths (~185–189 µm), reflecting its high-energy environment on the undisturbed shoal crest. TER exhibits slightly finer but still relatively coarse sediment (~154–174 µm), with moderate seasonal variability. CAM displays the finest and most variable sediment textures, with values ranging from 33 to 86 µm, suggesting active infilling with finer material, particularly during the fall.
In terms of organic matter, CAM maintains the highest %OM values across all depths and seasons, especially at the surface (0–1 cm) during fall (4.69%), indicating ongoing accumulation of organic-rich sediments. REF and TER show lower and relatively consistent %OM (~0.7–1.3%), with minimal seasonal shifts.
Carbonate content shows the highest concentrations at REF, peaking in the 0–1 cm interval during summer (3.29%) and remaining consistently elevated (~1.9–2.1%) at 0–5 cm across seasons. CAM and TER generally display lower %CO3 values (~0.6–2.0%), with slight seasonal fluctuations, suggesting less carbonate input or enhanced dilution by siliciclastic or organic material.
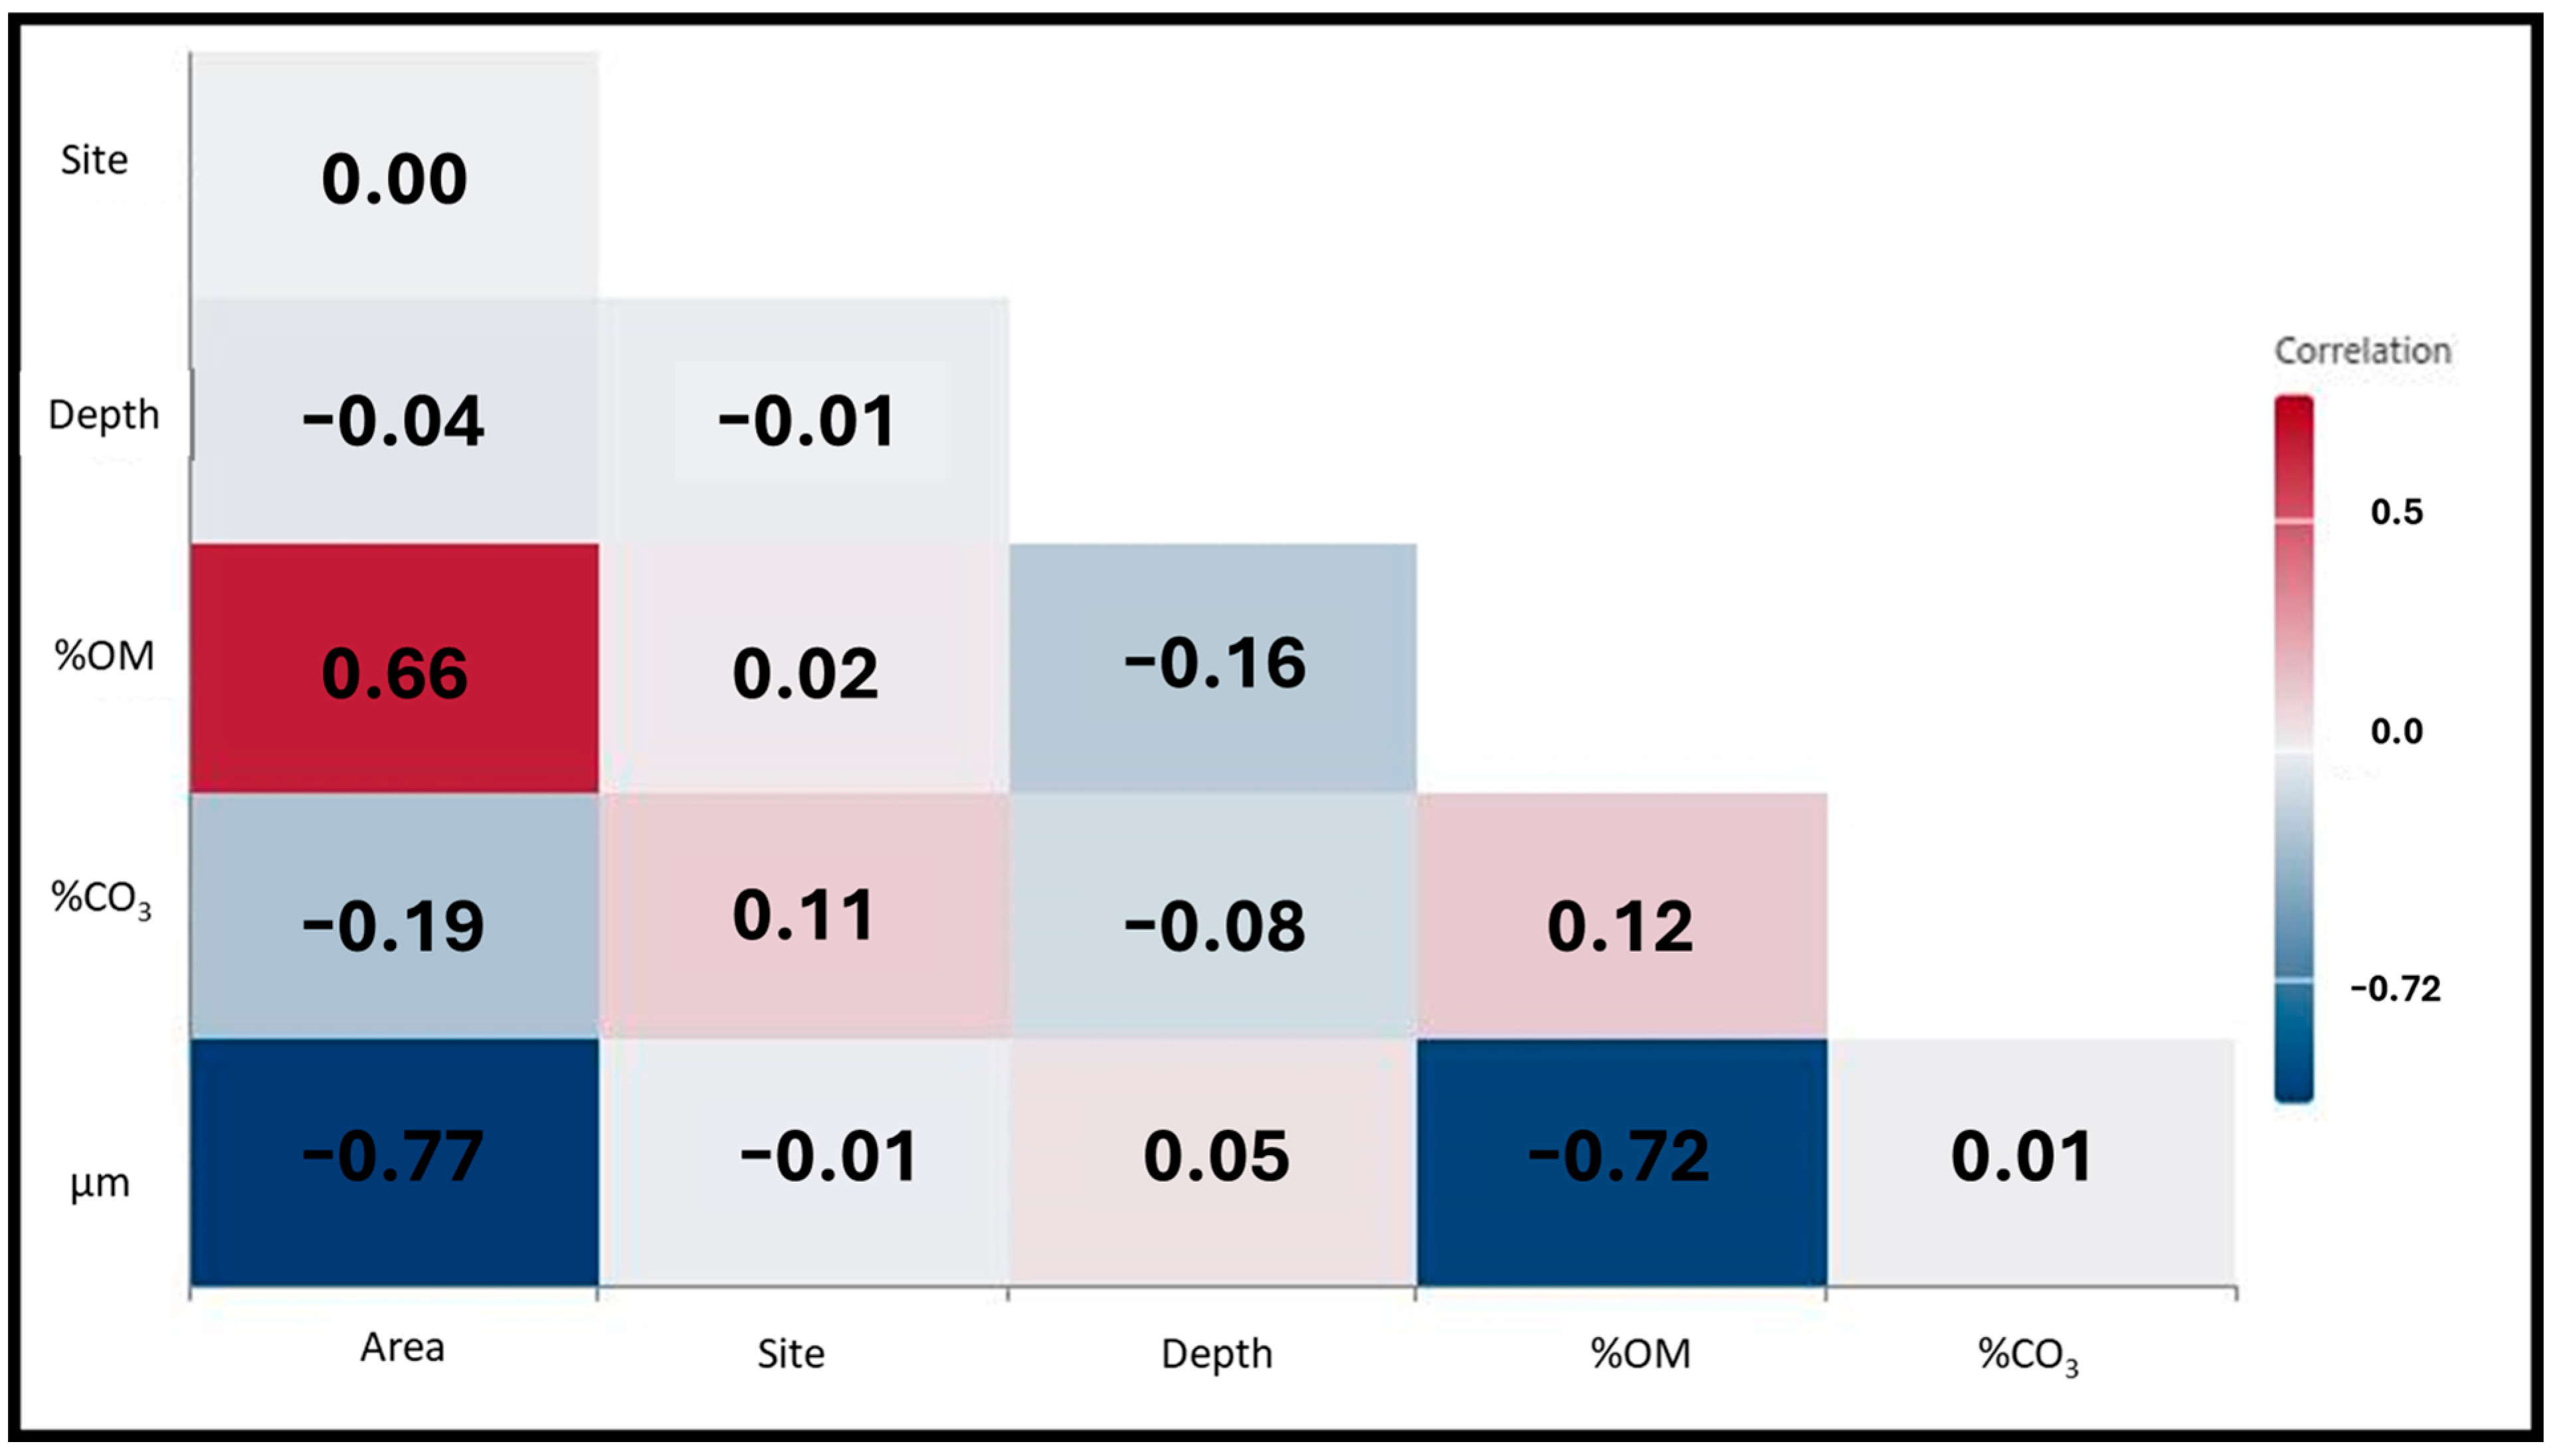
The correlation matrix presented in Figure 8 quantifies the relationships between various sediment parameters, with color intensity and numerical values representing the strength and direction of the correlations. Percent Organic Matter exhibits a strong positive correlation with Area (REF, TER, CAM) (0.66), suggesting that certain study locations have significantly higher %OM content than others. However, %OM shows a moderate negative correlation with Depth (0–1 cm or 0–5 cm) (−0.16), indicating that deeper sediments may have lower organic matter concentrations, potentially due to reduced organic input or increased decomposition rates in deeper environments.
A strong negative correlation exists between grain size and %OM (−0.72), suggesting that finer sediments tend to attach more organic matter, while coarser sediments have lower %OM content. Similarly, grain size is highly negatively correlated with Area (−0.77), implying that sediment texture varies significantly across the study locations, likely influenced by depositional and hydrodynamic processes. In contrast, %CO3 has weak correlations with most variables, showing only slight positive relationships with Site (0.11) and %OM (0.12), suggesting that carbonate presence is relatively independent of other sediment characteristics.

3.4. Regression Modeling

Feature Importance scores were derived from the random forest regression model, indicating the relative influence of each predictor variable on the prediction of %OM in sediments (Figure 9A). The most significant variables affecting %OM prediction are Grain Size (GS) and %CO3, which exhibit the highest importance scores. This suggests that variations in carbonate content and sediment texture play a crucial role in determining %OM levels, likely due to their control over sedimentary depositional environments and organic material retention.
Displayed in Figure 9B, the actual vs. predicted values of %OM, with an R2 value of 0.72 and an RMSE of 1.04%, are both indicators that the model does well in prediction. The scatter plot reveals that many predictions cluster around lower %OM values (1–3%), with greater deviations at higher %OM levels. The dashed black ideal fit line (1:1) shows that while the model captures the general trend, it underestimates or overestimates some values, particularly at the higher end of %OM percentages.
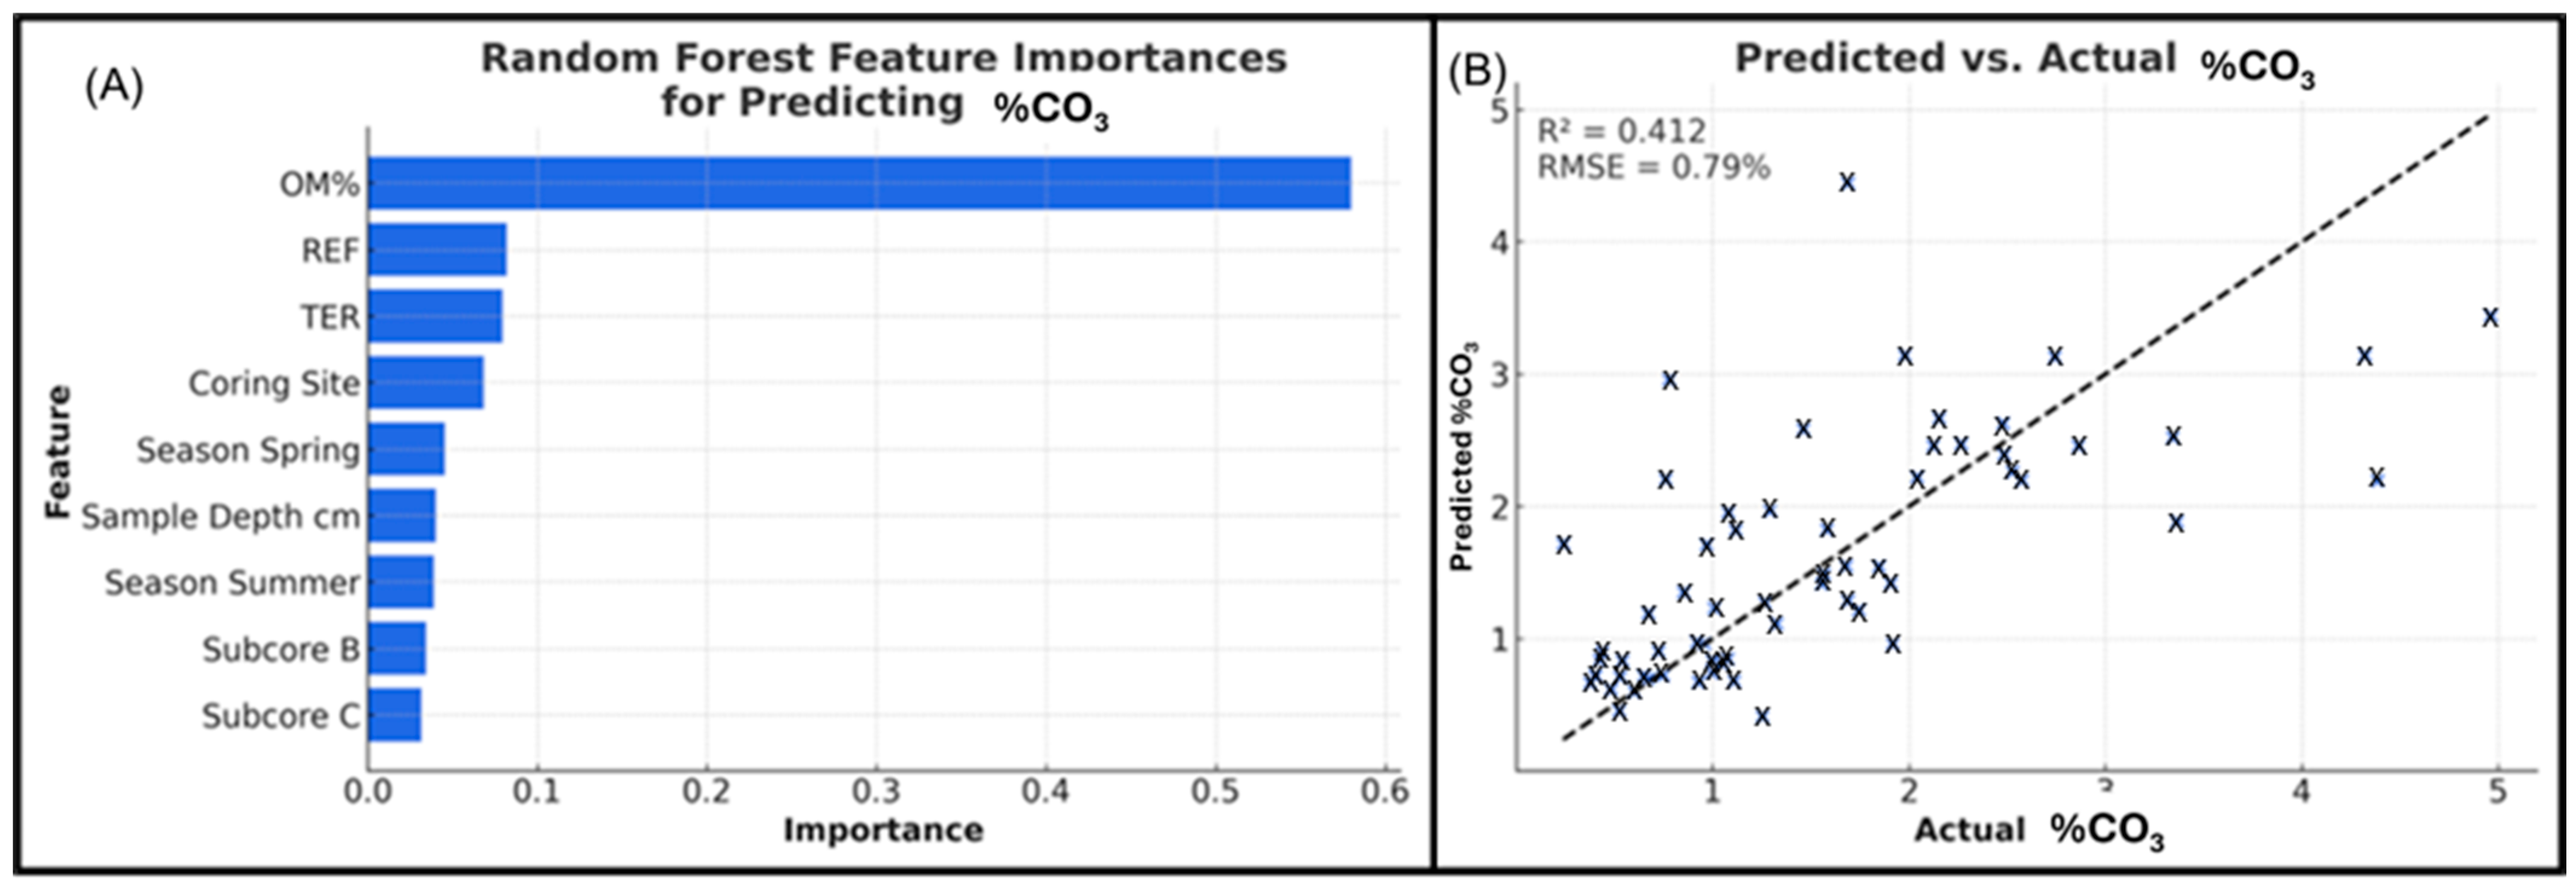
When examining the Feature Importance scores from the random forest regression model used to predict %CO3 in sediments (Figure 10A). The most influential predictors in this model are %OM and Area, suggesting that they strongly govern %CO3 deposition patterns. The lower importance of season implies that carbonate variations are not strongly seasonal, or time-dependent compared to other physical characteristics such as Area, Site, and %OM.
Presented in Figure 10B are the actual vs. predicted %CO3 values, with a root mean squared error (RMSE) of 0.79%, indicating a moderate level of predictive accuracy. However, an R2 value of 0.412 shows that the model cannot accurately predict more than half of the values. The scatterplot shows that most predicted values cluster between 1% and 3% %CO3, while higher carbonate values (above 4%) exhibit greater deviation from the ideal 1:1 fit line.
As displayed in Figure 11A, feature importance scores derived from a random forest regression model were used to predict sediment grain size (µm). Among the input variables, “Area” shows the highest importance score, followed by “OM” (Percent Organic Matter) and “Date.” “CO3” (Percent Carbonate) and “Site” have lower but positive contributions, while “Sub” and “Depth” register near-zero or negative importance values, indicating minimal predictive value in the model. Figure 11B plots actual versus predicted grain size values. A general positive trend is evident with an R2 value of 0.635, indicating a better model fit than observed in %CO3, but this does not perform as well as the model for %OM. However, considerable scatter is present, especially among values below ~100 µm. The model’s root mean squared error (RMSE) is reported as 38.62 µm.

4. Discussion

4.1. Sources and Transport of Sediments

Our results indicate significant variations in sediment texture between natural and dredged environments, with dredge pits functioning as traps for fine sediments. This pattern suggests that hydrodynamic energy strongly influences grain size distribution. Past modeling studies show that sediment transport in our study area is mainly westward along the Louisiana inner shelf [3,12,13]. Observational studies using optical and acoustic sensors deployed in the bottom boundary layer revealed a similar dominant E-W flow path between Ship Shoal and Isles Dernières barrier island chain [13]; based on their preliminary estimates, ~51.0 million tons of sediment passes along the Louisiana inner shelf annually. Figure 12 shows that sands dominated in Isles Dernieres barrier island chain and Ship Shoal, with more than 80% sands in sediment samples. Between Isle Dernières and Ship Shoal, sediment is a mixture of sand and mud. East of Ship Shoal, sediment samples contain about 20–40% of sand and 60–80% of mud. It is well known that mud is mainly transported as suspended load, whereas sand is mainly transported as bed load. Thus, the source of infilling sand in CAM and TER pits is likely localized, either on top of or surrounding the eastern Ship Shoal (blue dots near CAM and TER pits in Figure 12). However, the sources of the muds can be from far distance shelf resuspension, degrading marsh edges, river mouths, and others.
The REF is characterized by a coarse-grained sediment composition, indicative of a high-energy environment. Conversely, the finer-grained sediments in CAM suggest a relatively lower-energy depositional setting, allowing for the accumulation of muds over time [3]. The progressive infilling of dredged areas with muddy sediments could have long-term implications for their stability and ecological function. Future research should quantify sedimentation rates, hydrodynamic influences on sediment redistribution, and potential impacts on benthic habitat composition to inform sustainable dredging and coastal sediment management strategies.
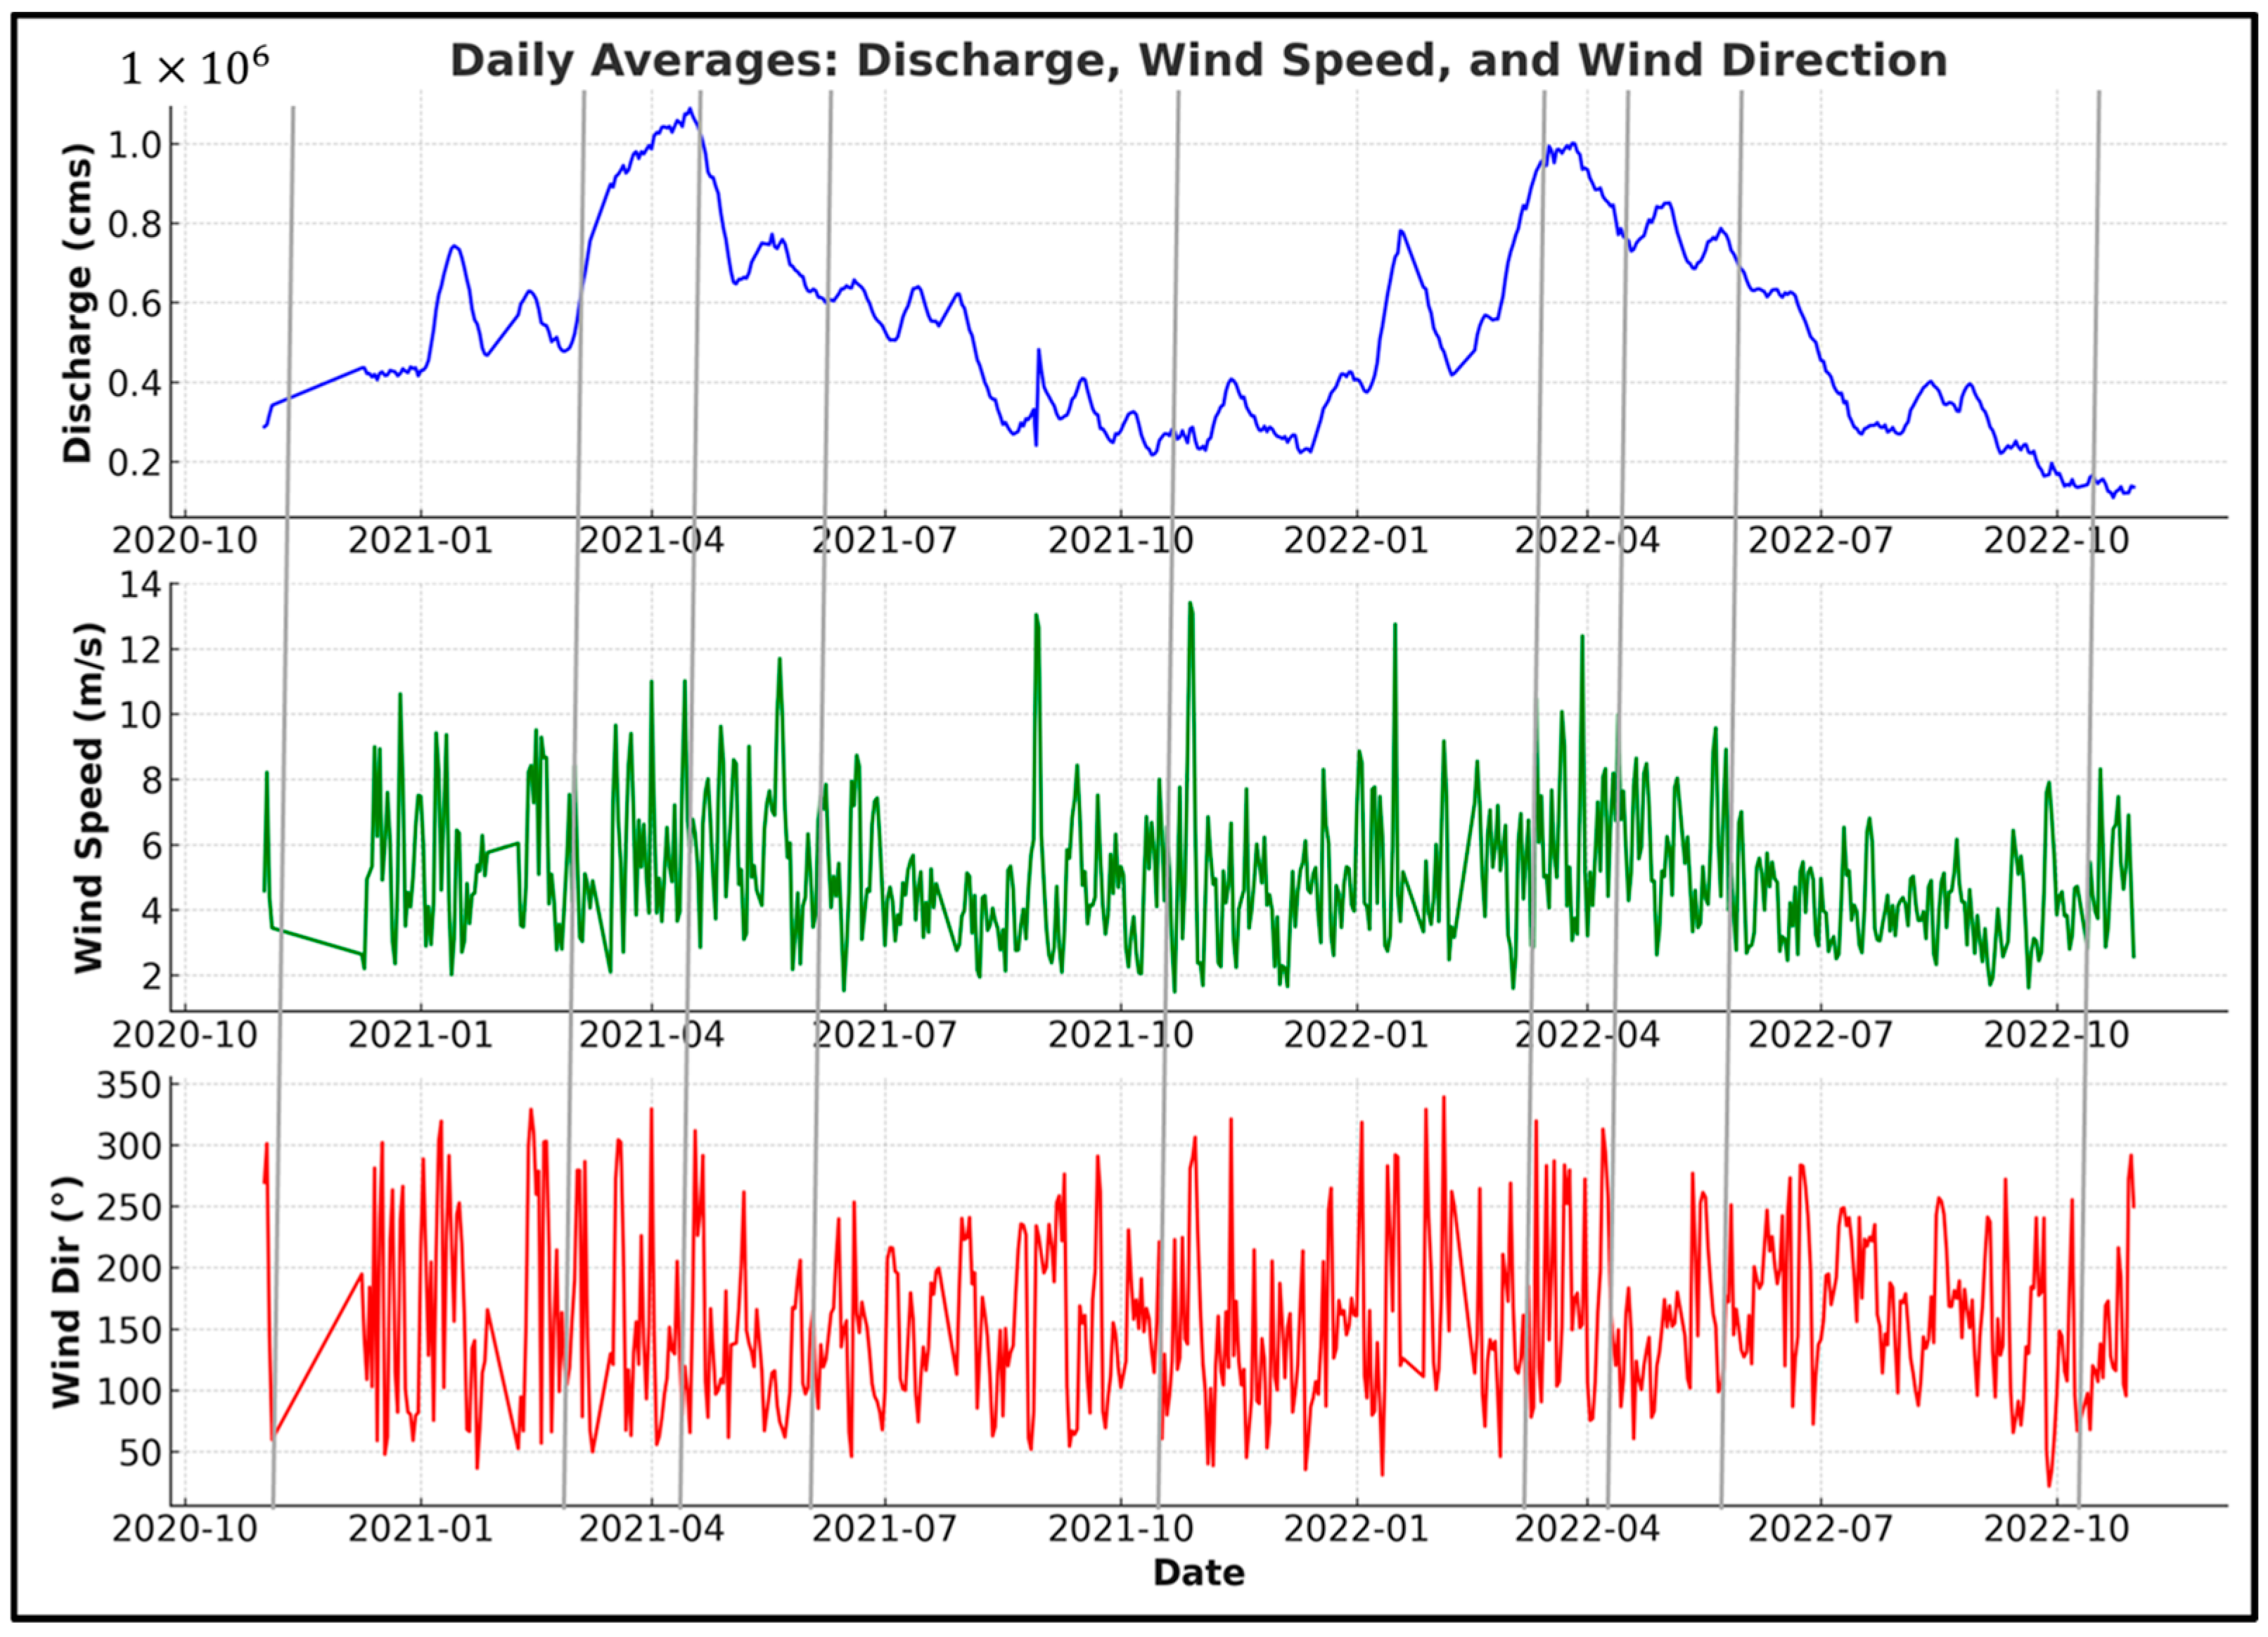
River discharge, wind speed, and wind direction components (Figure 13) highlight the strong influence of fluvial and atmospheric forcing on sediment transport and deposition. The variability in river discharge over time suggests seasonal fluctuations in sediment supply, with higher discharge events likely introducing large pulses of fine sediments into the system in late spring and early summer each year. Wind speed and direction components reveal persistent variability, with episodic peaks corresponding to likely storm events or cold front passages, which may trigger sediment resuspension and redistribution. The interaction between wind-driven resuspension and fluvial sediment inputs could contribute to the observed temporal variations in %OM, %CO3, and grain size across the study sites. Future work should incorporate wave energy, tidal currents, and storm-driven transport models to assess their combined effects on sediment dynamics and long-term deposition patterns.
Our results demonstrate significant differences in sediment texture between natural and dredged environments, with dredge pits clearly functioning as traps for fine sediments. This pattern underscores the role of hydrodynamic energy in controlling grain size distributions. Statistical analysis of mud (silt and clay) fractions across REF, TER, and CAM confirms significant differences among sites. ANOVA results yielded F = 36.09, p = 1.85 × 10⁻⁶, while the non-parametric Kruskal–Wallis test gave H = 12.12, p = 0.0023. Both tests indicate that mud content differs significantly between natural and dredged environments. The REF site is characterized by fine-grain sand-dominated sediments (>96%), indicative of a high-energy shoal crest environment with limited fine deposition (Table 5). In contrast, CAM sediments are enriched in mud, consistent with a lower-energy depositional sink where fines have accumulated with heterogenous infilling (Table 5). The progressive enrichment of TER with mud following its excavation in 2021 illustrates the early infilling trajectory of newly created dredge pits (Table 5).
These findings highlight that while sands are primarily mobilized and deposited locally, fines have multiple distal sources, enhancing their accumulation in dredged environments. Over time, this progressive infilling with muddy sediments has implications for pit stability, hydrodynamics, and benthic ecological function.

4.2. Sources and Transport of Organic Matter and Carbonate Content

Organic matter (%OM) content in deltaic marsh environments is typically elevated due to sustained vegetative input, limited disturbance, and anaerobic conditions that promote preservation. Previous studies, such as Bomer et al. (2019) [12] and Wang et al. (2019) [13], have reported %OM values ranging from 50 to 90% in Louisiana marsh sediments, reflecting the highly organic-rich nature of these systems. In contrast, sediments from Ship Shoal in the present study displayed substantially lower %OM across all sampling sites, generally remaining below 6%, which is one order of magnitude lower than these marshes. The highest values occurred at CAM, an established dredge pit, consistent with its role as a depositional sink for fine-grained, organic-rich sediments under low hydrodynamic energy conditions. REF and TER, located on or near the shoal crest, showed lower and more stable %OM. An increase in %OM at CAM after 2021 may indicate evolving depositional dynamics, possibly linked to compaction, reduced oxygen exposure, or altered sediment sources. Vertical variability, with higher %OM near the surface, suggests recent deposition and progressive decay with depth.
Elevated carbonate levels at REF suggest the accumulation of biogenic material (e.g., shell fragments, skeletal remains) or environmental conditions that promote carbonate precipitation and preservation. Conversely, low %CO3 at TER suggests that dredging has diminished carbonate content. Seasonal peaks in %CO3 during spring and early summer may be linked to biological productivity cycles, while storm events and sediment resuspension could redistribute carbonate to dredge pits. Depth-dependent decreases in %CO3 likely suggest post-depositional dissolution or diagenetic alteration, particularly in deeper, more reducing sediments.
When compared with other U.S. coastal systems (Table 6), Ship Shoal sediments exhibit %OM values far lower than those reported for vegetated marshes (e.g., 12–15% OM in Atlantic and Gulf estuaries) and below many open-shelf and estuarine settings on both the West Coast and East Coast, where values frequently exceed 6% OM [14,15,16,17], and the Gulf Coast showing >10% OM [18]. Ship Shoal’s %CO3 levels are like or slightly lower than carbonate-rich Atlantic shelf and Gulf systems, where localized contributions from shell debris can reach 60%. In contrast, several Pacific Coast sites (e.g., California Margin, Southern California Bight) exhibit comparable carbonate levels, reflecting a combination of biogenic input and hydrodynamic retention. Median grain size at Ship Shoal (D50~126 µm) is comparable to finer-grained depositional zones on the Atlantic and Gulf shelves, yet finer than many high-energy Pacific Coast beach and nearshore settings (e.g., >250 µm in the San Francisco Bay and Oregon Shelf). These differences underscore the influence of dredging history, shoal morphology, and regional hydrodynamics in producing Ship Shoal’s distinct sedimentary records.

4.3. Integrated Analysis and Predictive Modeling

The correlogram and random forest analyses together provide a comprehensive view of the factors controlling sediment composition across the study sites. The correlation matrix revealed a strong inverse relationship between grain size and %OM (r = −0.72), consistent with the tendency of finer sediments (bigger ϕ) to enhance organic matter retention due to their greater surface area and adsorption capacity. Coarser sediments, by contrast, promote oxygen penetration and microbial degradation, limiting %OM preservation. A similarly strong negative correlation between grain size and area (r = −0.77) indicates that spatial differences in sediment texture are strongly tied to hydrodynamic regimes, sediment sources, and site-specific energy conditions. The moderate negative relationship between %OM and depth (r = −0.16) supports the idea that organic deposition is concentrated near the seabed surface, with deeper layers undergoing progressive remineralization. Weak correlations between %CO3 and other variables suggest that carbonate accumulation is more strongly influenced by biological inputs (e.g., shell debris) and geochemical precipitation than by sediment texture or %OM content. The lack of obvious shell debris in the sediment samples indicates that the carbonate is likely older and not from recent deposition patterns.
Random forest modeling reinforced these interpretations while identifying the variables most predictive of each sediment property. For %OM, the model ranked %CO3 and grain size as the top predictors, supporting the idea that finer, carbonate-rich sediments enhance organic matter retention. The model’s moderate performance (RMSE = 1.04) indicates that although sediment controls are significant, additional environmental or biological variables, such as hydrodynamic energy, nutrient fluxes, and microbial activity, are likely required to explain the remaining variability.
For %CO3, the highest feature importance predictor was %OM, followed by categorical site indicators (REF, TER, coring site), with grain size notably absent from the top-ranked features. This finding suggests that carbonate content in Ship Shoal sediments is more strongly governed by organic–biogenic relationships and spatial site characteristics than by sediment texture. The moderate model performance (R2 = 0.412; RMSE = 0.79%) and its difficulty in predicting high %CO3 values indicate that unmeasured factors such as carbonate mineralogy, pH, episodic shell production events, and storm-driven redistribution likely influence carbonate accumulation patterns.
For grain size, area was the dominant predictor, highlighting the role of regional hydrodynamic conditions, morphological setting, and sediment transport pathways in shaping textural distributions. %OM was of moderate importance, consistent with the observed inverse correlation between organic matter content and grain size. Depth and substrate type had minimal influence, implying that hydrodynamic sorting processes overshadow local substrate effects. Scatter in the predicted versus observed grain size values points to the potential value of incorporating direct hydrodynamic metrics, such as wave height, current velocity, and storm frequency, into future modeling efforts.
Overall, the integrated correlation–modeling framework underscores that sediment composition at Ship Shoal is shaped by a combination of spatial gradients, hydrodynamic energy, and biogeochemical processes. While the current models capture primary controls, enhancing predictive capability will require expanding the predictor set to include physical forcing metrics, seasonal biological inputs, and finer-scale geochemical parameters.

5. Conclusions

This study demonstrates that hydrodynamics, sediment supply, and depositional processes exert strong and sustained control on sediment distribution across natural and dredged shelf environments. Reference sites retained well-sorted sands, while dredged sites (TER, CAM) acted as persistent sinks for fine-grained material, with resuspension governed by high-energy events such as cold fronts and tropical cyclones. The consistent inverse relationship between grain size and %OM highlights enhanced organic matter retention in finer sediments, with CAM serving as a long-term low-energy repository. Carbonate enrichment reflected long-term depositional regimes rather than short-term variability, with REF maintaining the highest %CO3 in the absence of dredging disturbance. Collectively, these findings advance understanding of how dredge pits evolve as stable repositories for fine sediment, with direct implications for benthic habitat resilience, sediment resource management, and coastal restoration planning. By integrating hydrodynamic modeling with sediment transport and biogeochemical processes, future work can better predict post-dredging trajectories and inform sustainable strategies for managing disturbed shelf systems.

Author Contributions

Conceptualization, A.G. and K.X.; Data curation, A.G.; Formal analysis, A.G.; Funding acquisition, K.X., B.J.R. and D.S.J.; Investigation, A.G.; Methodology, A.G. and K.X.; Project administration, B.J.R. and D.S.J.; Resources, A.G.; Software, A.G.; Supervision, K.X.; Validation, A.G.; Writing—original draft, A.G. and K.X.; Writing—review and editing, K.X., B.J.R., D.S.J. and M.L. All authors have read and agreed to the published version of the manuscript.

Funding

This study was funded by the Bureau of Ocean Energy Management Agreement Number M19AC00015 and multiple others, with Barton Rogers and Christopher DuFore serving as project officers of the Bureau of Ocean Energy Management.

Data Availability Statement

The data presented in this study are available on request from the corresponding author. The data are not publicly available due to confidentiality.

Acknowledgments

Thanks go to members of Brian Roberts’s Lab at LUMCON, Paige Clariza and Stephanie Plaisance for logistics with sample delivery and to captains of the RV Acadiana (Ross Turlington and Carl Sevin).

Conflicts of Interest

The authors declare no conflicts of interest.

References

  1. Penland, S.; Suter, J.R. Transgressive depositional systems of the Mississippi delta plain: A model for barrier shoreline and shelf sand development. J. Sediment. Petrol. 1988, 58, 932–949. [Google Scholar]
  2. Williams, S.J.; Flocks, J.; Jenkins, C.J.; Kulp, M.; Penland, S.; Reid, J.A. Surficial Sediment Character of the Louisiana Offshore Continental Shelf Region: A GIS Compilation; USGS Open-File Report 2006-1195; U.S. Geological Survey: Reston, VA, USA, 2006.
  3. Gartelman, A.; Xu, K.; Maiti, K.; Liu, H.; Moran, K.; Wilson, C.; Roberts, B.J.; Nelson, J. Sedimentation processes and morphological changes in a dredge pit and surrounding environment on Ship Shoal in the northern Gulf of Mexico. Mar. Geol. 2024, 470, 107218. [Google Scholar] [CrossRef]
  4. Zhang, W.; Xu, K.; Herke, C.; Alawneh, O.; Jafari, N.; Maiti, K. Spatial and temporal variations of seabed sediment characteristics in the inner Louisiana shelf. Mar. Geol. 2023, 463, 107115. [Google Scholar] [CrossRef]
  5. Gordon, E.S.; Goñi, M.A. Sources and distribution of terrigenous organic matter delivered by the Atchafalaya River to sediments in the northern Gulf of Mexico. Geochim. Cosmochim. Acta 2003, 67, 2359–2375. [Google Scholar] [CrossRef]
  6. Liu, H.; Xu, K.; Bentley, S.J. Sediment transport and infilling processes in dredge pits along the Louisiana continental shelf. Sediment. Geol. 2022, 425, 106021. [Google Scholar]
  7. Maiti, K.; Xu, K.; Bianchi, T.S. Organic carbon cycling in Gulf of Mexico sediments: Impacts of fluvial sediments and hydrodynamics. Estuar. Coast. Shelf Sci. 2020, 233, 106550. [Google Scholar] [CrossRef]
  8. Suter, J.R.; Penland, S. Evolution and depositional patterns of transgressive sand bodies along the Mississippi River delta plain: Insights for barrier island restoration and sediment dynamics. J. Coast. Res. 1987, 3, 487–502. [Google Scholar]
  9. Zhang, W.; Xu, K.; Harris, C.K.; Bentley, S.J.; White, L.D. Sedimentation patterns and storm-induced sediment dispersal in a dredged sand borrow area, Louisiana inner shelf. Mar. Geol. 2023, 462, 107114. [Google Scholar] [CrossRef]
  10. Heiri, O.; Lotter, A.F.; Lemcke, G. Loss on ignition as a method for estimating organic and carbonate content in sediments: Reproducibility and comparability of results. J. Paleolimnol. 2001, 25, 101–110. [Google Scholar] [CrossRef]
  11. Pedregosa, F.; Varoquaux, G.; Gramfort, A.; Michel, V.; Thirion, B.; Grisel, O.; Blondel, M.; Prettenhofer, P.; Weiss, R.; Dubourg, V. Scikit-learn: Machine learning in Python. J. Mach. Learn. Res. 2011, 12, 2825–2830. [Google Scholar]
  12. Bomer, E.J.; Bentley, S.J.; Hughes, J.E.T.; Wilson, C.A.; Crawford, F.; Xu, K.H. Deltaic morphodynamics and stratigraphic evolution of middle Barataria Bay and middle Breton sound regions, Louisiana, USA: Implications for River-Sediment Diversions. Estuar. Coast. Shelf Sci. 2019, 224, 20–33. [Google Scholar] [CrossRef]
  13. Wang, J.; Xu, K.H.; Bentley, S.J.; White, C.; Zhang, X.; Liu, H. Degradation of the Plaquemines sub-delta and relative sea-level in eastern Mississippi deltaic coast during late Holocene. Estuar. Coast. Shelf Sci. 2019, 227, 106344. [Google Scholar] [CrossRef]
  14. Smith, E.; Livingston, R.J.; Lewis, F.G. Sediment characteristics and benthic infauna in Apalachicola Bay, Florida. Estuaries 2000, 23, 416–427. [Google Scholar] [CrossRef]
  15. Keogh, M.E.; Törnqvist, T.E.; Kolker, A.S.; Erkens, G.; Bridgeman, J.G. Organic matter accretion, shallow subsidence, and river delta sustainability. J. Geophys. Res. Earth Surf. 2021, 126, e2021JF006231. [Google Scholar] [CrossRef]
  16. Drexler, J.Z.; Ewel, K.C. Effect of the 1997–1998 ENSO-related drought on hydrology and salinity in a Pacific Coast estuary. Estuaries 2001, 24, 337–347. [Google Scholar] [CrossRef]
  17. Sommerfield, C.K.; Nittrouer, C.A.; Alexander, C.R. 1997 flood deposit in the lower Columbia River: High-resolution mapping and sedimentological characterization. Estuar. Coast. Shelf Sci. 1999, 50, 703–725. [Google Scholar]
  18. Barnard, P.L.; Schoellhamer, D.H.; Jaffe, B.E.; McKee, L.J. Sediment transport in the San Francisco Bay coastal system: An overview. Mar. Geol. 2013, 345, 3–17. [Google Scholar] [CrossRef]
  19. Neubauer, S.C. Contributions of mineral and organic components to tidal freshwater marsh accretion. Estuar. Coast. Shelf Sci. 2008, 78, 78–88. [Google Scholar] [CrossRef]
  20. Hatcher, P.G.; McGillivary, P.A. Humic substances in estuarine sediments of the US Gulf Coast. Geochim. Cosmochim. Acta 1979, 43, 1341–1348. [Google Scholar]
  21. Jay, K.R.; Hacker, S.D.; Hagen, C.J.; Stepanek, J.; Moore, L.J.; Ruggiero, P. Quantifying the relative importance of sand deposition and dune grasses to carbon storage in US Central Atlantic Coast dunes. Estuaries Coasts 2025, 48, 60. [Google Scholar] [CrossRef]
  22. Gelfenbaum, G.; Stumpf, R.P.; Pennock, J.R. Hydrodynamics and sediment transport in Grays Harbor, Washington. Estuaries 1991, 14, 224–238. [Google Scholar]
  23. Corbett, D.R.; McKee, B.; Duncan, D. An evaluation of mobile mud dynamics in the Mississippi River deltaic region. Mar. Geol. 2004, 209, 91–112. [Google Scholar] [CrossRef]
  24. Alexander, C.R.; Pilkey, O.H.; Neal, W.J.; Estes, E.; Kelley, J.T.; Parmenter, C.; Hiland, M.W.; Steel, N.C.; Cacchione, D.A.; Schwab, W.C. Sedimentology of Puget Sound. Mar. Geol. 1986, 70, 1–28. [Google Scholar]
  25. Christiansen, T.; Wiberg, P.L.; Milligan, T.G. Flow and sediment transport on a tidal salt marsh surface. Estuar. Coast. Shelf Sci. 2000, 50, 315–331. [Google Scholar] [CrossRef]
  26. Locker, S.D.; Hine, A.C.; Brooks, G.R.; Twichell, D.C.; Donoghue, J.F.; Davis, R.A.; Gelfenbaum, G.; Mayer, L.A.; FitzGerald, D.M.; Cunningham, R.H. Regional stratigraphic framework linking continental shelf and coastal sedimentary deposits of the Gulf of Mexico. Gulf Coast Assoc. Geol. Soc. Trans. 1999, 49, 675–681. Available online: https://archives.datapages.com/data/gcags/data/049/049001/pdfs/0675.pdf (accessed on 8 August 2025).
  27. Hale, S.S.; Buffum, H.W.; Kiddon, J.A.; Hughes, M.M. Subtidal benthic invertebrates shifting northward along the US Atlantic Coast. Estuaries Coasts 2017, 40, 174–185. [Google Scholar] [CrossRef] [PubMed]
  28. Jenkins, C.J.; Reid, J.M.; Reid, J.A.; Hastings, M.E.; Williams, S.J.; Poppe, L.J. usSEABED: Atlantic Coast Offshore Surficial Sediment Data Release; U.S. Geological Survey Data Series; U.S. Geological Survey: Reston, VA, USA, 2005; Volume 118, pp. 1–55. Available online: https://www.academia.edu/download/78326339/fa3fe638a80bb7bc0d6b6bef6693aaa347ca.pdf (accessed on 8 August 2025).
  29. Allison, M.A.; Kineke, G.C.; Gordon, E.S.; Goni, M.A. Development and reworking of a seasonal flood deposit on the inner continental shelf off the Atchafalaya River. Cont. Shelf Res. 2000, 20, 2267–2294. [Google Scholar] [CrossRef]
  30. Pilkey, O.H.; Morton, R.W.; Luternauer, J. The carbonate fraction of beach and dune sands. Sedimentology 1967, 9, 311–327. [Google Scholar] [CrossRef]
  31. Law, B.A.; Milligan, T.G.; Hill, P.S.; Newgard, J.; Wheatcroft, R.A.; Wiberg, P.L. Flocculation on a muddy intertidal flat in Willapa Bay, Washington, Part I: A regional survey of the grain size of surficial sediments. Cont. Shelf Res. 2013, 60 (Supplement), S136–S144. [Google Scholar] [CrossRef]
  32. Barnard, P.L.; Erikson, L.H.; Hansen, J.E. Monitoring and modeling nearshore dredge disposal for indirect beach nourishment, Ocean Beach, San Francisco, CA. Coast. Eng. 2009, 56, 86–95. [Google Scholar]
  33. Hickey, B.M.; Kudela, R.M.; Nash, J.D.; Bruland, K.W.; Jay, D.A.; MacCready, P.; Banas, N.S.; Peterson, T.D.; McCabe, R.M.; Dever, E.P.; et al. River influences on shelf ecosystems: Introduction and synthesis. J. Geophys. Res. Ocean. 2010, 115, C00B17. [Google Scholar] [CrossRef]
  34. Wehmiller, J.F.; Groot, J.J.; Benson, R.N. Palynological, foraminiferal and aminostratigraphic studies of Quaternary sediments from the US middle Atlantic upper continental slope, continental shelf and coastal plain. Quat. Sci. Rev. 1995, 14, 583–605. [Google Scholar] [CrossRef]
  35. Balsam, W.L.; Beeson, J.P. Sea-Floor Sediment Distribution in the Gulf of Mexico. Deep Sea Res. Part I Oceanogr. Res. Pap. 2003, 50, 1421–1444. [Google Scholar] [CrossRef]
  36. Baker, E.T.; Milburn, H.B.; Tennant, D.A. Field assessment of sediment trap efficiency under varying flow conditions. J. Mar. Res. 1988, 46, 573–592. [Google Scholar] [CrossRef]
  37. Malaizé, B.; Bertran, P.; Carbonel, P.; Bonnissent, D.; Charlier, K.; Galop, D.; Imbert, D.; Serrand, N.; Stouvenot, C.; Pujol, C. Hurricanes and climate in the Caribbean during the past 3700 years BP. Holocene 2011, 21, 911–924. [Google Scholar] [CrossRef]
  38. Berelson, W.M.; McManus, J.; Coale, K.H.; Johnson, K.S.; Kilgore, T.; Burdige, D.; Pilskaln, C. Biogenic matter diagenesis on the sea floor: A comparison between the Gulf of Mexico and the California margin. Mar. Chem. 1996, 81, 71–99. [Google Scholar] [CrossRef]
  39. Berelson, W.M.; McManus, J.; Coale, K.H.; Johnson, K.S.; Kilgore, T.E.; Burdige, D.J.; Hammond, D.E.; Santschi, P.H.; Passow, U.; Chanton, J.P. Early diagenesis in the Gulf of Mexico. Deep Sea Res. Part I 2003, 44, 1–26. [Google Scholar]
  40. Wang, Z.A.; Wanninkhof, R.; Cai, W.-J.; Byrne, R.H.; Hu, X.; Peng, T.-H.; Huang, W.-J. The marine inorganic carbon system along the Gulf of Mexico and Atlantic coasts of the United States. Limnol. Oceanogr. 2013, 58, 325–342. [Google Scholar] [CrossRef]
Figure 1. (A) The location of Ship Shoal on the Louisiana Coast with the outline of several dredge pits at Racoon Island, Block 88, Terrebonne, and Caminada. Inset showing the relative location of Ship Shoal in on Louisiana shelf. (B) Zoomed map depicting the location of sediment collection sites with the outlines of CAM and TER dredge pits. Raccoon Island Dredge Pit is shown as a short, elongated polygon between Raccoon Island and Ship Shoal in (A).
Jmse 13 01753 g001
Figure 2. Graph depicting grain size distribution of all samples collected and combined to show the volume percentages of sand and mud.
Jmse 13 01753 g002
Figure 3. (AC) Sediment grain size distribution in the phi scale and measuring volume percentages on the y axis for REF, TER, and CAM, respectively.
Jmse 13 01753 g003
Figure 4. (Left) Median grain size displayed by region for depths of 0–1 cm and grouped by sample collection date. (Right) Median grain size displayed by region for depths of 0–5 cm and grouped by sample collection date.
Jmse 13 01753 g004
Figure 5. (Left) Percent organic matter displayed by region for depths of 0–1 cm and grouped by sample collection date. (Right) Percent organic matter displayed by region for depths of 0–5 cm and grouped by sample collection date.
Jmse 13 01753 g005
Figure 6. (Left) Percent carbonate displayed by region for depths of 0–1 cm and grouped by sample collection date. (Right) Median grain size displayed by region for depths of 0–5 cm and grouped by sample collection date.
Jmse 13 01753 g006
Figure 7. Heat map showing peak values of %OM, %CO3, and grain size across seasonal and spatial regions with depth variation being shown with 0–1 cm (top row) and 0–5 cm (bottom row).
Jmse 13 01753 g007
Figure 8. Correlogram showing that there is a strong positive correlation between %OM and the Area with strong negative correlations noted between grain size and Area as well as grain size and %OM.
Jmse 13 01753 g008
Figure 9. (A) Bar graph showing the feature importance when predicting the %OM. (B) 1:1 regression line of a random forest regression model showing the predictive model values versus the actual values.
Jmse 13 01753 g009
Figure 10. (A) Bar graph showing the feature importance when predicting the %CO3. (B) 1:1 regression line of a random forest regression model showing the predictive model values versus the actual values.
Jmse 13 01753 g010
Figure 11. (A) Bar graph showing the feature importance when predicting the median grain size. (B) 1:1 regression line of a random forest regression model showing the predictive model values versus the actual values.
Jmse 13 01753 g011
Figure 12. Sediment grain size distribution along the Louisiana shelf. Grain size data are from USGS usSEABED 2020. Bathymetric data are from ETOPO 2024.
Jmse 13 01753 g012
Figure 13. Three panels displaying river discharge (Mississippi River at Belle Chasse, LA–07374525) and wind data (Station EINL1–8764314), with the river discharge in the first panel, wind speed in the second, and wind direction in the third panel. cms is cubic meters per second. The vertical gray lines represent the approximate dates of fieldwork to retrieve the sediment samples.
Jmse 13 01753 g013
Table 1. Table displays the different variable categories used with the possible subcategory for each category.
AreaSiteDepth (cm)SubcoresSeasonHydrodynamic
REF10–1ASpring (March, April, May)Wind Direction
TER20–5BSummer (June, July, August)Wind Speed
CAM3 CFall (September, October, November)Wave Height
Table 2. Table of the sites with an overall mean, D50, minimum, maximum, and standard deviation of the different sites and grouped by the depth ranges for sediment grain size.
AreaDepth (cm)Mean (µm)Median (µm)SD (µm)Min (µm)Max (µm)Count
REF0–1186.70183.4010.69173.65217.1545
REF0–5187.29183.4610.21172.96224.1254
TER0–1166.61172.2734.926.68209.3551
TER0–5165.57168.4235.2019.81215.3654
CAM0–161.6517.7167.086.10203.0053
CAM0–568.6532.6066.795.54203.3753
Table 3. Table of the sites with an overall mean, median, minimum, maximum, and standard deviation of the different sites and grouped by the depth ranges for percent organic matter.
AreaDepth (cm)Mean (%)Median (%)SD (%)Min (%)Max (%)Count
REF0–11.081.030.440.242.1345
REF0–51.071.080.370.63.2154
TER0–11.571.290.850.635.7651
TER0–51.291.190.440.623.2954
CAM0–13.863.412.121.218.1154
CAM0–52.952.321.880.758.4154
Table 4. Table of the sites with an overall mean, median, minimum, maximum, and standard deviation of the different sites and grouped by the depth ranges for percent carbonate.
AreaDepth (cm)Mean (%)Median (%)SDMin (%)Max (%)Count
REF12.391.362.290.2410.4545
REF521.571.360.717.4554
TER10.670.560.420.232.7351
TER50.960.691.260.379.6354
CAM11.741.541.280.478.8454
CAM51.361.050.760.543.7854
Table 5. Table shows the temporal changes in percents of clay, silt, and sand within the different sampling areas.
Year_SeasonAreaClaySiltSand
2020_FallTER0.811.1498.06
2021_SpringTER0.380.4499.18
2021_SummerTER0.951.1797.88
2021_FallTER8.1215.5076.38
2022_SpringTER1.562.4296.02
2022_SummerTER3.316.2790.42
2021_SpringCAM11.0935.1953.73
2021_SummerCAM7.4317.5375.03
2021_FallCAM25.3155.6519.03
2022_SpringCAM20.9950.2728.74
2022_SummerCAM18.6357.2024.17
2022_FallCAM22.6141.6235.77
2021_SpringREF0.640.7498.62
2021_SummerREF0.640.6898.68
2021_FallREF1.241.6497.12
2022_SpringREF0.850.6798.49
2022_SummerREF0.770.6198.62
2022_FallREF1.501.7796.72
Table 6. Summary of organic matter (%OM), carbonate content (%CO3), and median grain size from 28 U.S. coastal studies, including the Atlantic, Pacific, and Gulf coasts, with Ship Shoal data included for comparison.
LocationEnvironmentReferences%OM%CO3Median Grain Size (µm)
Apalachicola BaycoastalSmith, E. (2000) [14]6 50
Gulf Coast MarshescoastalKeogh, M. (2021) [15]26
California EstuarycoastalDrexler, J. (2001) [16]10 50
Columbia River EstuarycoastalSommerfield, C. (1999) [17]1.5 250
San Francisco BaycoastalRalston, D. (2013) [18]6.5 80
Tidal Freshwater Marshes (Atlantic)coastalNeubauer, S. (2008) [19]15 30
Gulf Coast EstuariescoastalHatcher, P. (1979) [20]12 30
Central Atlantic DunescoastalJay, K. (2025) [21]0.9 600
Grays Harbor, WAcoastalGelfenbaum, G. (1991) [22] 280
Mississippi River DeltacoastalCorbett, D. (2004) [23]3.220100
Puget SoundcoastalAlexander, C. (1986) [24]4.21060
Virginia Coast ReservecoastalChristiansen, T. (2000) [25]8 50
Ship Shoal, LAinner shelfThis Study1.7<10.0126
Gulf Shelfinner shelfLocker, S. (1999) [26] 60150
Atlantic Coast Subtidal Zonesinner shelfHale, S. (2017) [27]2.3 250
Atlantic Coast Offshoreinner shelfJenkins, C. (2005) [28]1.235180
Atchafalaya Shelfinner shelfAllison, M. (2000) [29]2.8 70
Atlantic Coast Beachesinner shelfPilkey, O. (1967) [30]0.850450
Oregon Coast Shelfinner shelfLaw, B.A. (2013) [31] 15
San Francisco, CA (West Coast)inner shelfBarnard, P. (2009) [32] 350
Southern California Bightinner shelfHickey, B. (2010) [33]120120
Mid-Atlantic Shelfshelf marginWehmiller, J. (1995) [34] 40200
Northern Gulfshelf marginBalsam, W. (2005) [35]2.53590
Pacific Coast and Gulf of Mexicoshelf marginBaker, E. (1988) [36]2.515200
Atlantic Marginshelf marginMalaizé, B (2011) [37]3.52270
California Marginshelf marginBerelson, W. (1997) [38]225140
Gulf Marginshelf marginBerelson, W. (2003) [39]1.525140
Atlantic Coast Shelfshelf marginWang, Z. (2013) [40] 30150
Disclaimer/Publisher’s Note: The statements, opinions and data contained in all publications are solely those of the individual author(s) and contributor(s) and not of MDPI and/or the editor(s). MDPI and/or the editor(s) disclaim responsibility for any injury to people or property resulting from any ideas, methods, instructions or products referred to in the content.