Article

Stability Analysis of Coastal Sheet Pile Wall Considering Soil Weakening Induced by Earthquake Loading

1
Institute of Geotechnical Engineering, Zhejiang University, Hangzhou 310058, China
2
Institute of Hypergravity Science and Technology, Zhejiang University, Hangzhou 310058, China
*
Author to whom correspondence should be addressed.
J. Mar. Sci. Eng. 2025, 13(9), 1752; https://doi.org/10.3390/jmse13091752
Submission received: 18 August 2025 / Revised: 4 September 2025 / Accepted: 9 September 2025 / Published: 11 September 2025
(This article belongs to the Section Coastal Engineering)

Abstract

A sheet pile wall is a widely used retaining structure in coastal and riverbank areas. In liquefiable soils, seismic activity can generate excess pore pressure, which not only increases the load on the sheet pile wall but also reduces the soil strength. Here, a modified stability analysis method is proposed to consider the effect of excess pore pressure on the stability of sheet pile walls. The excess pore pressure ratio was estimated through a pore pressure generation model and an equivalent number of loading cycles. In addition, two sets of dynamic centrifuge model tests were conducted on a liquefiable layer retained by a cantilevered sheet pile wall. The retained backfill experienced significant excess pore pressure, leading to the rotation failure of the sheet pile wall. The bending moments of the sheet pile wall were obtained using strain gauges, validating the effectiveness of the newly proposed stability analysis method. The dynamic water pressure in front of the wall can reduce the wall’s bending moment. When considering dynamic water pressure, the bending moment decreased by approximately 7.7%. For the same earthquake loading, varying the equivalent number of cycles did not affect the wall’s force response or the determination of instability. During the transition of the wall from static to unstable, the passive earth pressure in front of the wall extended deeper, causing a downward shift in the location of the maximum bending moment of the wall. Above all, this study provides a theoretical foundation for the design and construction of sheet pile walls in liquefiable regions.

1. Introduction

Sheet pile walls are commonly used as retaining structures in coastal and riverbank areas. Compared to other types of retaining structures, such as gravity retaining walls and pile-supported wharves, sheet pile walls can reduce construction costs by more than 25%. They are also particularly suited for the construction of excavated ports in silty areas [1]. Observations from previous earthquakes have demonstrated that the seismic performance of sheet pile walls is significantly influenced by the occurrence of soil liquefaction [2]. For instance, the 1995 Great Hanshin Earthquake (Mw = 6.9) caused extensive damage to the Port of Kobe. Liquefaction of the soil around the port led to large deformations of the sheet pile walls and ground subsidence, ultimately resulting in even more severe destruction [3,4]. In addition, the 2010–2011 Canterbury earthquake in New Zealand and the 2011 Tohoku earthquake in Japan caused widespread liquefaction damage to structures and their foundation systems [5,6,7,8]. The generation of excess pore pressure or even soil liquefaction induced by earthquakes loading led to a reduction in the stiffness and shear strength of the surrounding soil [9], and increased lateral earth pressures on retaining walls.
Current calculation methods for sheet pile walls largely rely on the pioneering work of Okabe [10] and Mononobe and Matsuo [11], conducted after the 1923 Great Kanto Earthquake in Japan. This approach, commonly known as the Mononobe–Okabe (M–O) method, is based on Coulomb’s static earth pressure theory and was originally developed for gravity walls retaining cohesionless backfill materials. Subsequent research has predominantly adhered to this general approach, relying on analytical solutions for idealized cohesionless backfill or experimental data derived from model tests. Following the M–O method, several studies have concentrated on the dynamic earth pressures on retaining structures, including both theoretical methods [12,13,14,15,16] and physical model tests [17,18]. However, relatively few studies have considered the generation of excess pore pressure in the backfill, with the majority of research focusing on the seismic behavior of retaining walls. Zeng and Steedman [19] conducted centrifuge model tests on anchored sheet pile walls, demonstrating that the vibration amplification caused by the degradation of backfill stiffness (a result of excess pore pressure accumulation) can lead to failure. Liu et al. [20] derived the distribution of dynamic active earth pressure and conducted a comprehensive analysis of the key influencing parameters based on the M–O method. The International Seismic Design Code for Port Structures [21,22] adopted the M–O method for calculating dynamic active earth pressures. It also proposed that the effect of excess pore water pressure in sandy backfill can be approximated by reducing the internal friction angle of the soil. It is recognized that the presence of water can influence the seismic behavior of retaining walls in three ways [23]: (1) by altering the inertial forces within the backfill, (2) by developing dynamic water pressures, and (3) by generating excess pore pressure due to cyclic loading. However, there is still a lack of reasonable procedures for considering these effects in the seismic design of sheet pile walls, and current approaches typically rely on approximate and relatively crude solutions. The literature review indicates that theoretical studies on seismic earth pressure for sheet pile walls have mainly addressed dry sand sites, whereas analyses accounting for excess pore pressure have been largely confined to gravity retaining walls. As a result, methods for assessing the structural response of sheet pile walls in saturated sites remain underdeveloped. Although recent centrifuge experiments have investigated sheet pile walls in saturated sites, they have primarily focused on soil–structure interaction, with limited attention to the internal force of the sheet pile wall.
With the growing demand for coastal engineering, there is a need for evaluating the stability of sheet pile walls in saturated sites that accounts for the generation of excess pore pressure. This study proposes a stability assessment method based on the pseudo-static approach and the equivalent number of cycles principle. The method allows random earthquake loadings to be transformed into equivalent amplitude waves, and introduces the excess pore pressure ratio as a criterion for instability, enabling the evaluation of wall stability under arbitrary earthquake loadings. Two sets of centrifuge shaking table tests were conducted to investigate the excess pore pressure variations and the record bending moments in sheet pile walls during earthquake loading, validating the proposed method. The effects of equivalent cycle number, dynamic water pressure, and excess pore pressure ratio on wall bending moments under the same earthquake loading were further analyzed.

2. Calculation Method of Conti and Viggiani (Hereafter, the C–V Method)

Conti and Viggiani [14] proposed a novel pseudo-static limit equilibrium method for the design of sheet pile walls subjected to seismic loading. Following the rotational deformation of the sheet pile wall, the pivot point is not located at the toe of the wall but rather at a specific depth (dm) within the soil in front of the sheet pile wall. The earth pressure distribution on the sheet pile wall is divided into four zones based on the pivot point O: (1) the passive zone in front of the wall; (2) the active zone in front of the wall; (3) the active zone behind the wall; and (4) the passive zone behind the wall, as illustrated in Figure 1. When kh < kc, there are two unknowns in Figure 1: the depth of the passive zone in front of the wall (dn) and the depth of the pivot point (dm). By applying force and moment equilibrium, the two unknowns can be solved. When kh = kc, the wall is in the limit equilibrium state with dn = dm, which still contains two unknowns: dm and kc. Similarly, by applying force equilibrium and moment equilibrium conditions, these two unknowns can be solved.
However, the C–V method, as well as the traditional pseudo-static method, is only applicable to dry sand conditions. It can determine the critical seismic acceleration value under the limit equilibrium state. However, in the saturated site, it is acknowledged that the sheet pile wall failure is also significantly influenced by the generation of excess pore pressure. Therefore, in addition to the two unknown parameters Figure 1, it is also necessary to determine the excess pore pressure ratio (ru) when conducting a stress analysis of the sheet pile wall. However, the C–V method provides only two equilibrium equations, making it insufficient to solve for all three unknowns.

3. Proposed Method

3.1. Equivalent Number of Cycles Principle

According to the research by Yang et al. [24], the damage effects caused by small-amplitude, multi-cycle dynamic loads (point B in Figure 2) are comparable to those caused by large-amplitude, few-cycle dynamic loads (point A in Figure 2), as shown in Figure 2. Here, CSR (Cyclic Stress Ratio) denotes the ratio of cyclic shear stress amplitude to the effective normal stress on the shear plane, Ni represents the number of cycles required to reach failure under a cyclic stress ratio of CSRi, which can be obtained from the liquefaction resistance curve derived through cyclic triaxial tests [25]. Nref is the reference number of cycles, and CSRref is the dynamic cyclic stress ratio corresponding to failure after Nref cycles. The relationship between CSR and N shown in Figure 2 can be determined using Equation (1), where the parameters a and b are calibrated through element tests.
C S R = a N b
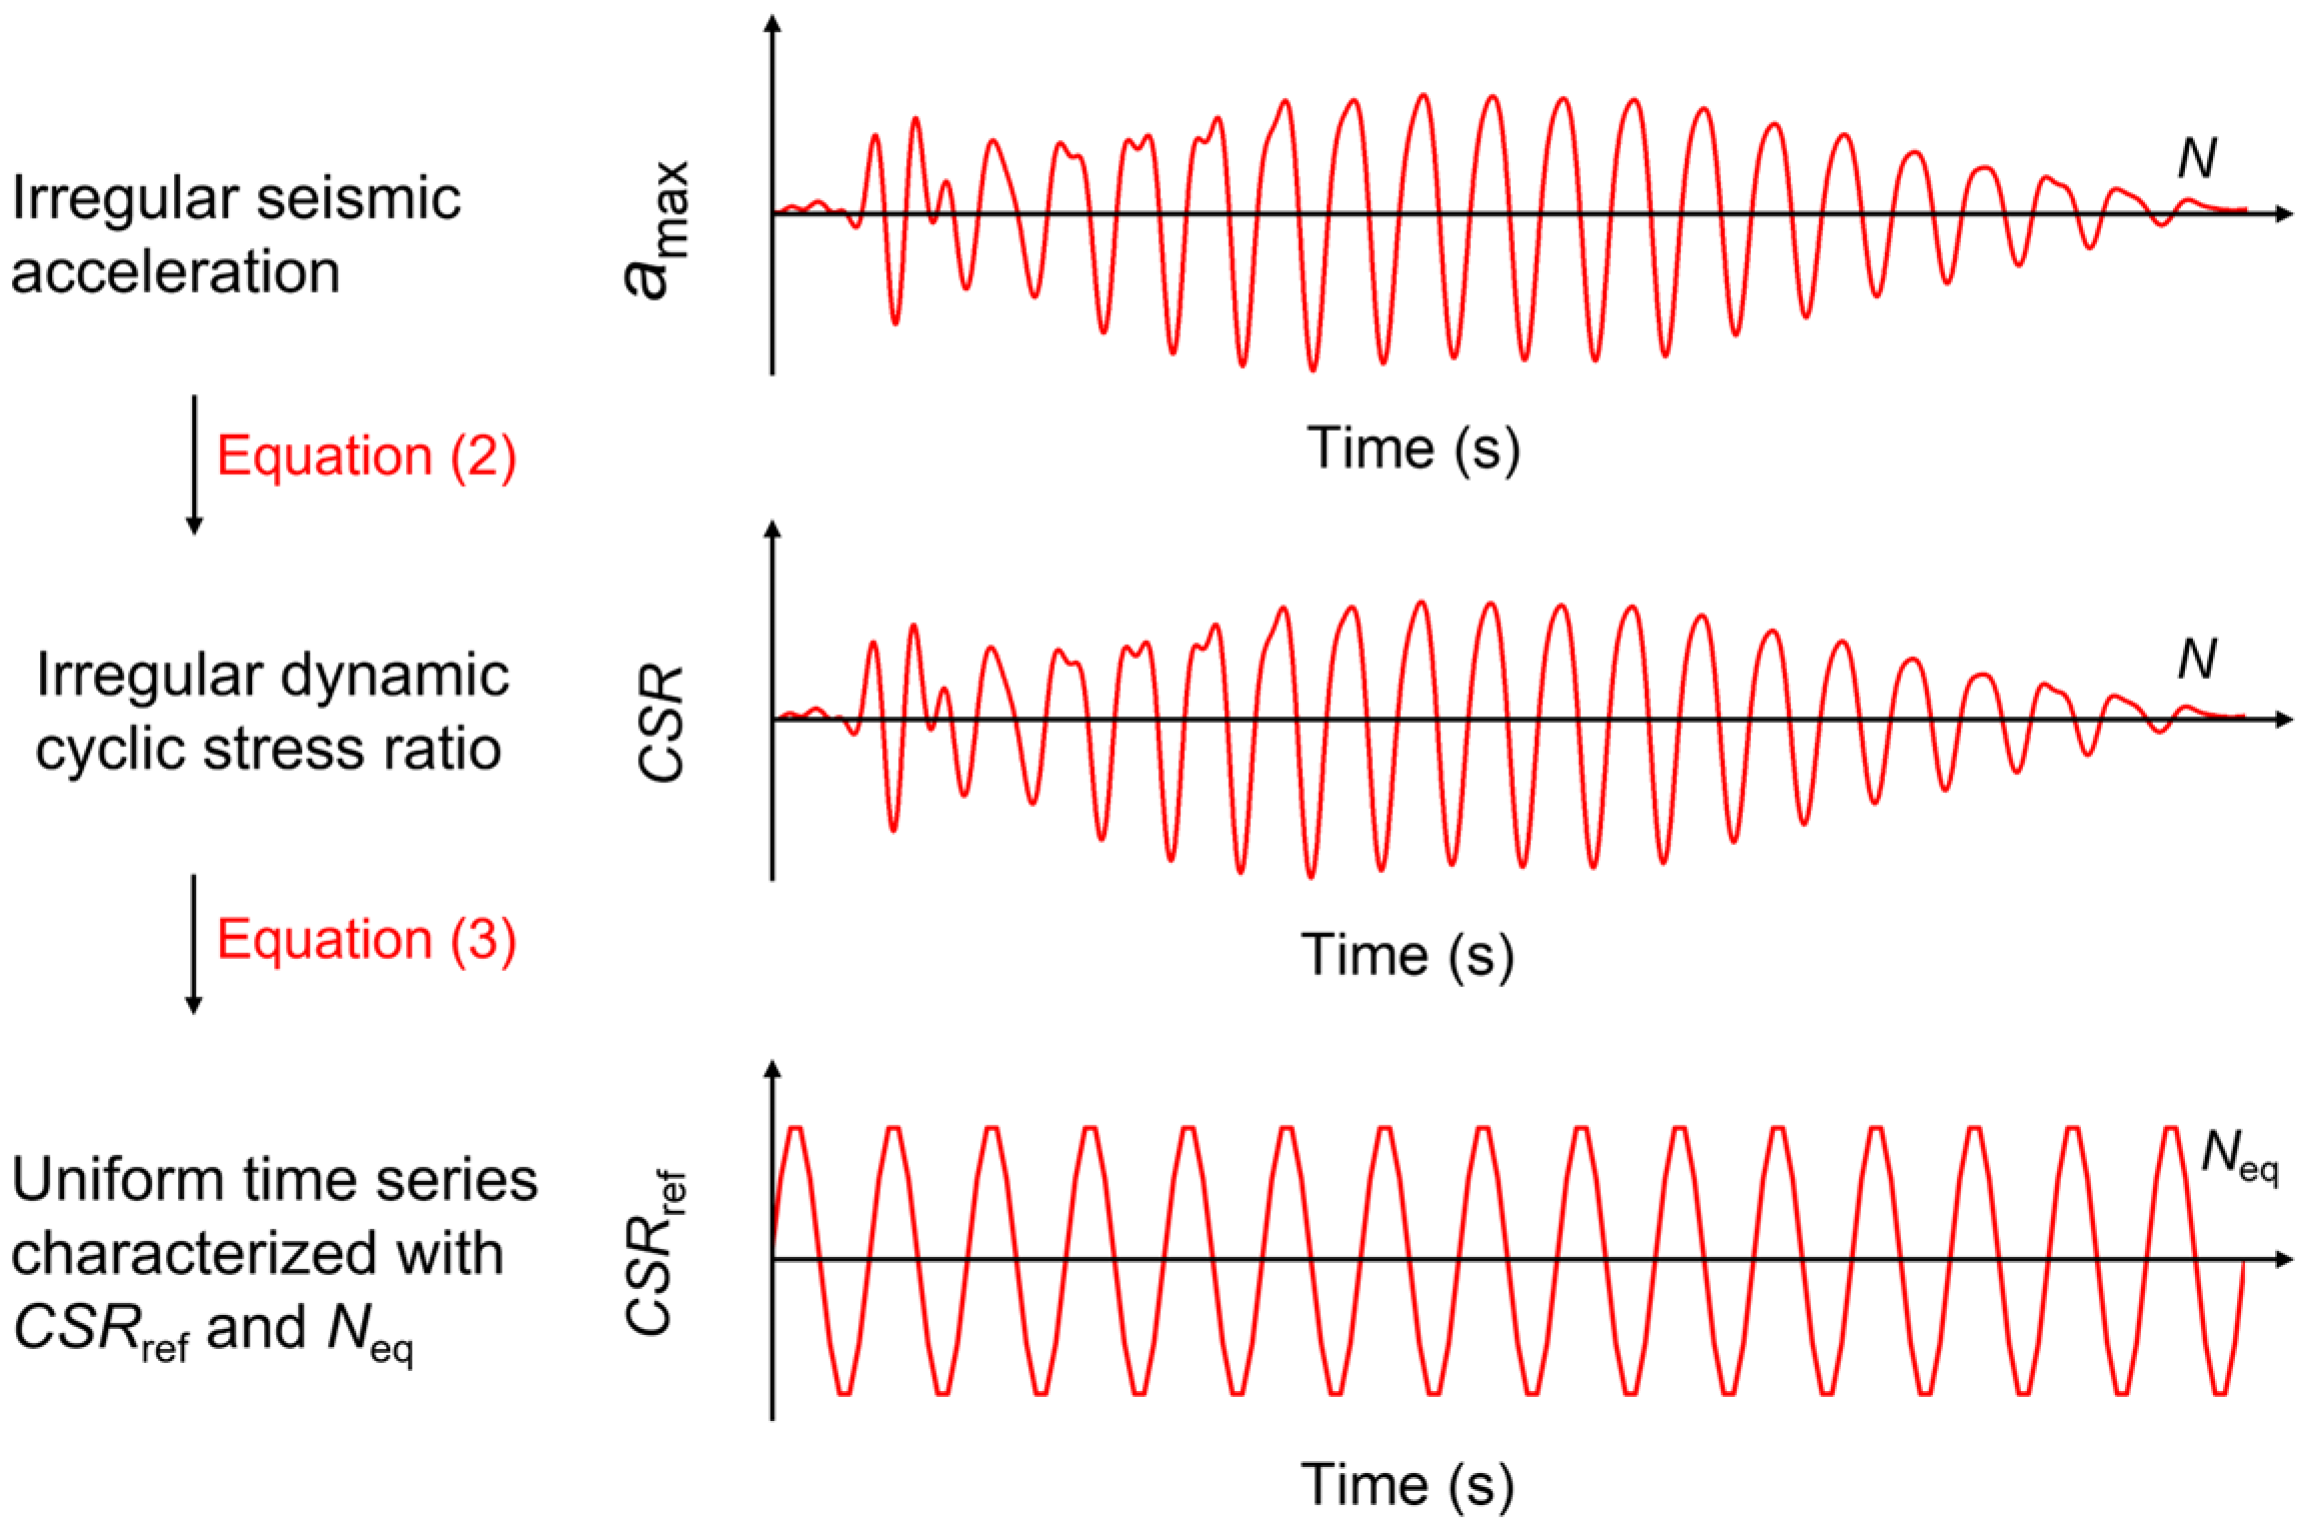
By converting the non-uniform cyclic loading into uniform cyclic loading, the fixed horizontal seismic acceleration (amax) and horizontal seismic acceleration coefficient (kh) can be determined based on Equation (2) [26]. Here, γd is the reduction factor, and when the site depth (z) is less than 9.15 m, γd = 1 − 0.00765z. It originates from the linear fatigue damage accumulation theory (P–M cumulative damage hypothesis) in the metal industry [27], and was later developed for calculating the equivalent cyclic number of sand soils [28]. As shown in Figure 2, a single cycle dynamic load with an amplitude of CSRi can be equivalently represented by a dynamic load with an amplitude of CSRref and a cycle number of Nref/Ni [25].
C S R = 0.65 σ v σ v α max g γ d
Based on the above understanding, a non-uniform cyclic loading can be equivalently represented as a collection of numerous half-cycles (each with a cycle number of 0.5). Ultimately, an irregular time series can be equivalently represented as a homogeneous sequence with an amplitude of CSRref and Neq cycles, as shown in Figure 3. To calculate the equivalent number of cycles (Neq) for the non-uniform cyclic loading, the equivalent number of cycles for each decomposed half-cycle is first computed and then summed. The specific calculation formula is as follows [28]:
N eq = 0.5 × i = 1 m N ref N i
where m represents the number of half-cycles that can be decomposed from a non-uniform cyclic loading. As a result, the three unknown variables (dm = dn, kh = kc, and ru) reduce to two: the pivot point position (dm = dn) and the excess pore pressure ratio (ru).

3.2. Stability Analysis of Sheet Pile Wall with Pore Pressure Generation

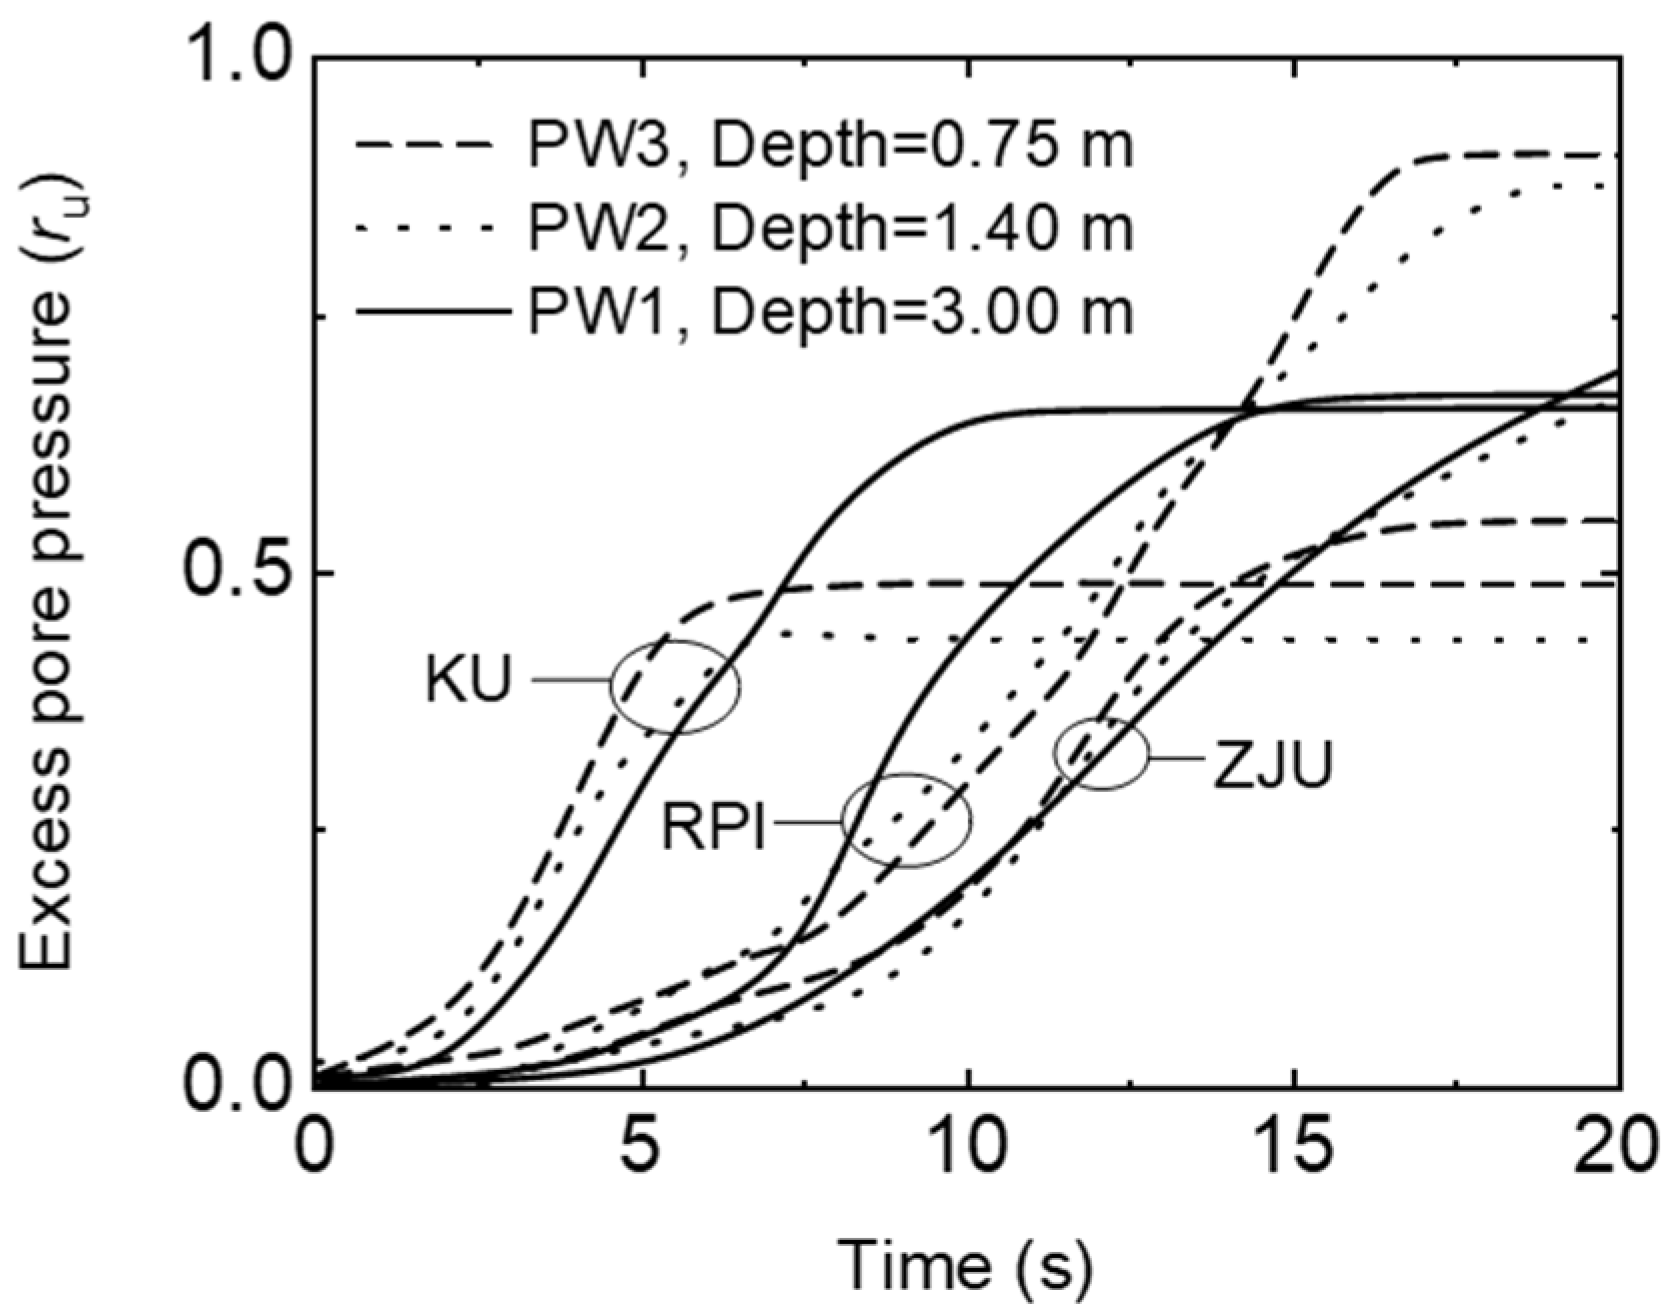
Based on the above considerations, for saturated backfill soil, this study uses the separate calculation of water and soil pressure. Specifically, the earth pressure is calculated according to the C–V method, while the excess pore pressure is applied to the sheet pile wall based on the distribution of hydrostatic pressure. Figure 4 presents the generation of residual excess pore pressure behind the wall for different teams in the LEAP–RPI–2020 project. It is evident that the rate of generation of excess pore pressure at shallow depths (PW3) is slightly greater than that at deeper depths (PW1). However, according to the RPI (Rensselaer Polytechnic Institute) records, the excess pore pressure at deeper levels exceeds that at shallow depths after 7 s. Overall, the excess pore pressure ratios obtained from different teams exhibit similar growth patterns in the initial stages. For the sheet pile wall conditions addressed in this study, where the embedding depth typically does not exceed 5 m, it is assumed that the rate of increase in excess pore pressure remains constant within this depth range. As a result, the excess pore pressure is considered to follow a triangular distribution with respect to depth.
Using the separate calculation of water and soil pressure, a new stress distribution for the sheet pile wall is shown in Figure 5. Figure 5a illustrates the dynamic earth pressure acting on the sheet pile wall, following the principles of the C–V method. However, the effective stress decreases as ru increases. Figure 5b shows the excess pore pressure distribution, which is related to the excess pore pressure ratio ru and the effective unit weight. By applying force balance (FL = FR) and moment balance (ML = MR), the two unknowns, the depth of the pivot point from the excavation surface, denoted as dm, and the excess pore pressure ratio at the limit state, denoted as ru, can be solved.
F L , cr = 1 2 γ ( 1 r u , cr ) K AE h + d m 2 + 1 2 γ ( 1 r u , cr ) K PE 2 h + d + d m d d m + 1 2 γ r u , cr h + d 2
F R , cr = 1 2 γ ( 1 r u , cr ) K PE d m 2 + 1 2 γ ( 1 r u , cr ) K AE d + d m d d m + 1 2 γ r u , cr d 2
M L , cr = 1 2 γ ( 1 r u , cr ) K AE h + d m 2 1 3 h + d m + d d m + 1 6 γ ( 1 r u , cr ) K PE 3 h + d + 2 d m d d m 2 + 1 6 γ r u , cr h + d 3
M R , cr = 1 2 γ ( 1 r u , cr ) K PE d m 2 d 2 3 d m + 1 6 γ ( 1 r u , cr ) K AE d d m 2 d + 2 d m + 1 6 γ r u , cr d 3
By calculating the ru,cr at the limit state and combining it with the pore pressure increase model [29,30], the corresponding number of cycles can be determined by Equation (8).
r u , cr = 1 2 + 1 π arcsin 2 N cr N L 1 0.7 1
In Equation (8), N represents the number of cycles, and NL denotes the number of cycles corresponding to liquefaction, which is referred to Nref in this study. When N and Nref are known, the original cyclic loading (non-uniform) can be back-calculated to determine the number of cycles (n) required to produce the same level of damage, as shown in Equation (9). Using this method, the stability and failure time of sheet pile walls in saturated sites under any cyclic loading can be assessed.
N cr N L = N cr N ref = 0.5 × i = 1 n 1 N i
When the critical pore pressure ratio ru,cr is known, the pressure and moment distributions corresponding to any ru value during the process from the static state to the failure of the sheet pile wall can be determined using Equations (10)–(13), with the unknowns being dm and dn.
F L = 1 2 γ ( 1 r u ) K AE h + d m 2 + 1 2 γ ( 1 r u ) K PE 2 h + d + d m d d m + 1 2 γ r u h + d 2
F R = 1 2 γ ( 1 r u ) K PE d n 2 + 1 2 K PE d n + K AE d m d m d n + 1 2 γ ( 1 r u ) K AE d + d m d d m + 1 2 γ r u d 2
M L = 1 2 γ ( 1 r u ) K AE h + d m 2 1 3 h + d m + d d m + 1 6 γ ( 1 r u ) K PE 3 h + d + 2 d m d d m 2 + 1 6 γ r u h + d 3
M R = 1 2 γ ( 1 r u ) K PE d n 2 d 2 3 d n + 1 6 γ ( 1 r u ) K AE d d m 2 d + 2 d m + 1 2 γ ( 1 r u ) K PE d n + K AE d m d m d n × d m d n 3 K AE d m + 2 K PE d n K AE d m + K PE d n + d d m + 1 6 γ r u d 3

4. Centrifuge Model Test

The Liquefaction Experiment and Analysis Project (LEAP) is an international collaborative project, aiming to provide reliable centrifuge test data for the evaluation, calibration, and validation of constitutive models, as well as to support numerical simulation techniques for analyzing soil liquefaction [31]. The most recent LEAP collaboration aimed to study the impact of different Arias intensities (Ia) on the displacement of sheet pile walls in horizontally liquefiable sites. Zhejiang University conducted two tests in this LEAP, namely ZJU5 and ZJU6. This study uses ZJU5 and ZJU6 as examples to validate the method mentioned above.

4.1. Model Design

This test was conducted on a ZJU400 centrifuge from Zhejiang University, applying a 26 g centrifugal acceleration to simulate the prototype conditions, with loading completed by the accompanying unidirectional shaker. The physical similarity parameters in the experiment are shown in Table 1.

4.2. Model Geometry and Sensors

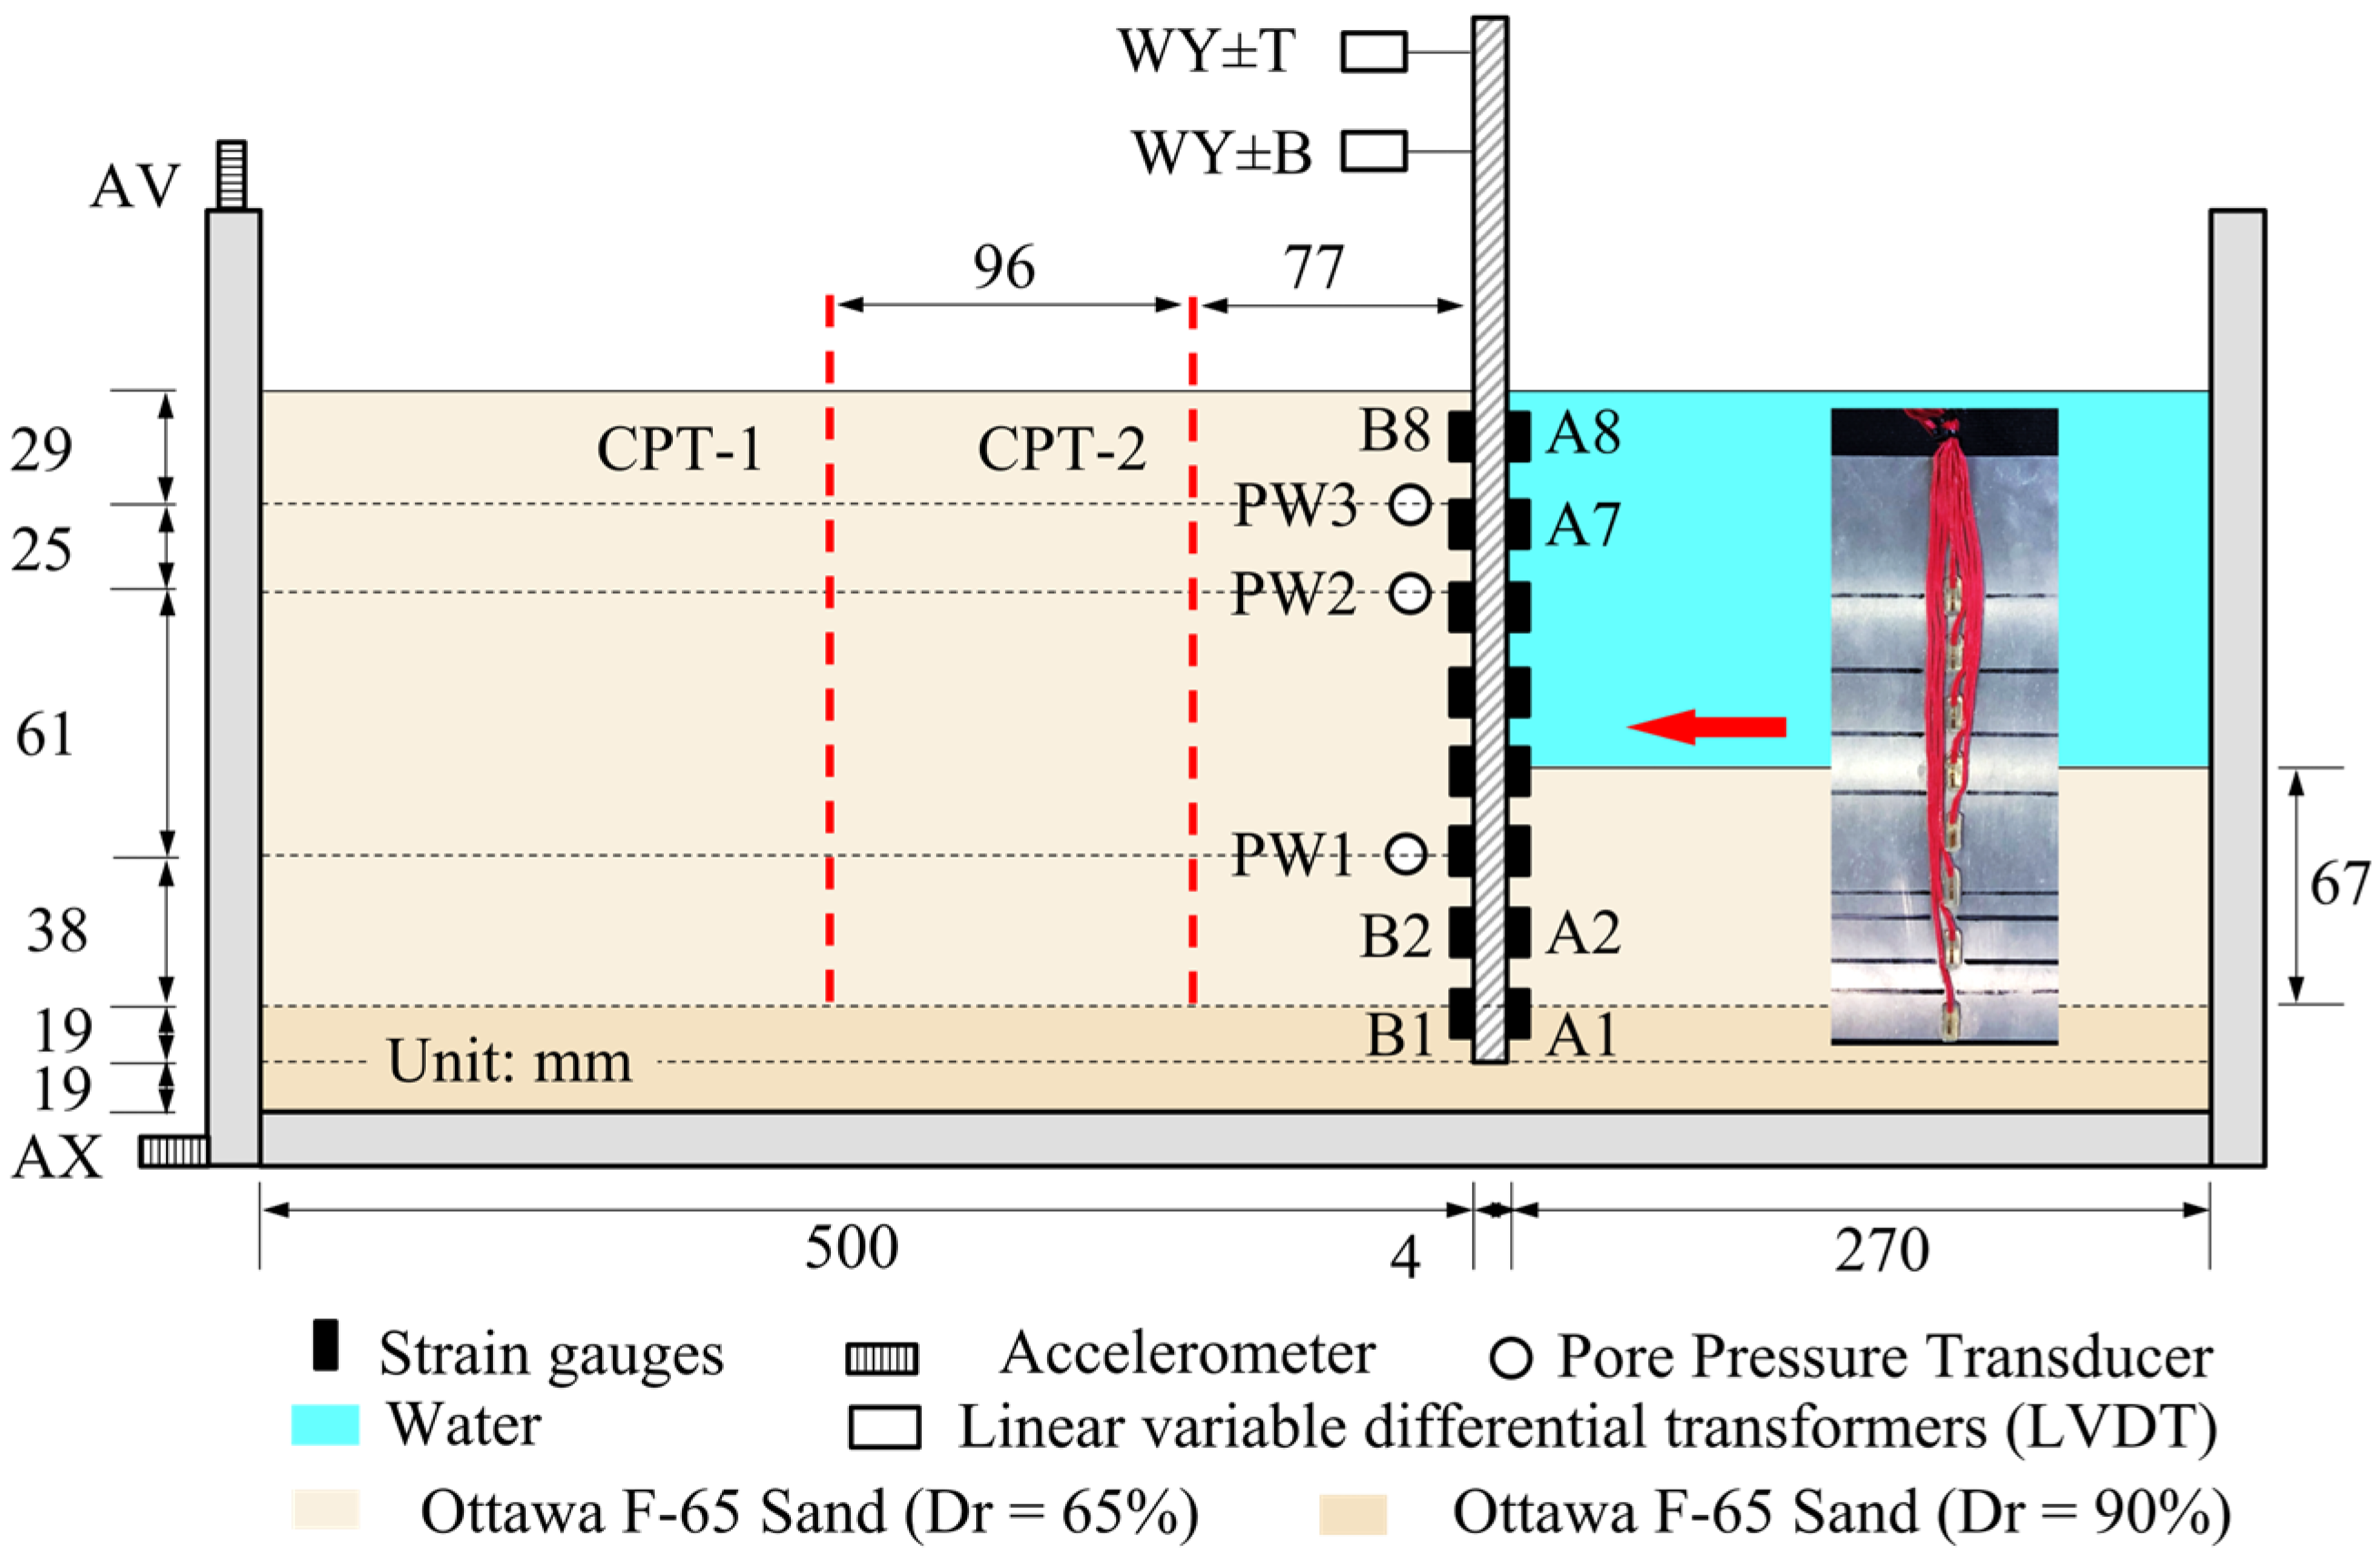
The model consists primarily of Ottawa F–65 sand and aluminum alloy sheet pile. The soil is divided into two layers: the lower layer, which is one meter thick, is a dense layer with a relative density (Dr) of 90%, and a mass density of 1726 kg/m3 (with ρmin = 1490 kg/m3 and ρmax = 1757 kg/m3). The upper layer is a medium–dense sand layer with a Dr of 65%, and a mass density of 1652 kg/m3. The sheet pile wall is suspended at a depth of 0.5 m within the dense layer, and its material properties are listed in Table 2. Behind the sheet pile wall, the medium–dense sand layer is four meters thick and approximately thirteen meters long. In front of the sheet pile wall, the medium–dense sand layer is 1.75 m thick and about seven meters long.
As shown in Figure 6, four displacement sensors are installed on the wall to record lateral displacement and rotation of the wall. To mitigate potential failure during testing, duplicate gauges were installed symmetrically at identical heights on both sides of the sheet pile wall, as shown at positions A1–A8 and B1–B8 in Figure 6. The bending moment (per unit width) of the wall is then calculated using Equation (14). The strain gauges employed in the tests exhibit a measurement range of ±5% at room temperature. Based on Equation (14), these gauges are capable of measuring bending moments in the sheet pile wall up to 3109.6 kN × m/m. With a sensitivity of 1 × 10⁻⁶, the corresponding resolution in bending moment measurement is approximately 0.062 kN × m/m. These specifications meet the strain measurement accuracy required for the experimental objectives. One accelerometer is placed at the bottom and another at the top of the model container to measure horizontal and vertical accelerations, respectively. To verify the model’s relative density, static cone penetration tests (CPT) are performed at the locations marked by the dashed lines. The model is saturated using methyl silicone oil with a viscosity coefficient 26 times that of water.
M = E t 2 ε A ε B 12

5. Results and Discussion

The relative densities of ZJU5 and ZJU6, as determined through the application of data from Kutter et al. [32] in conjunction with that from the Cone Penetration Test (CPT), are systematically presented in Table 3. This study summarizes the relative densities at depths of 1.5 m, 2.0 m, 2.5 m, and 3.0 m. Except for the slightly lower relative density at the shallow location in the middle of the site, the overall density of the model ranges from 60% to 65%, which meets the modeling requirements.
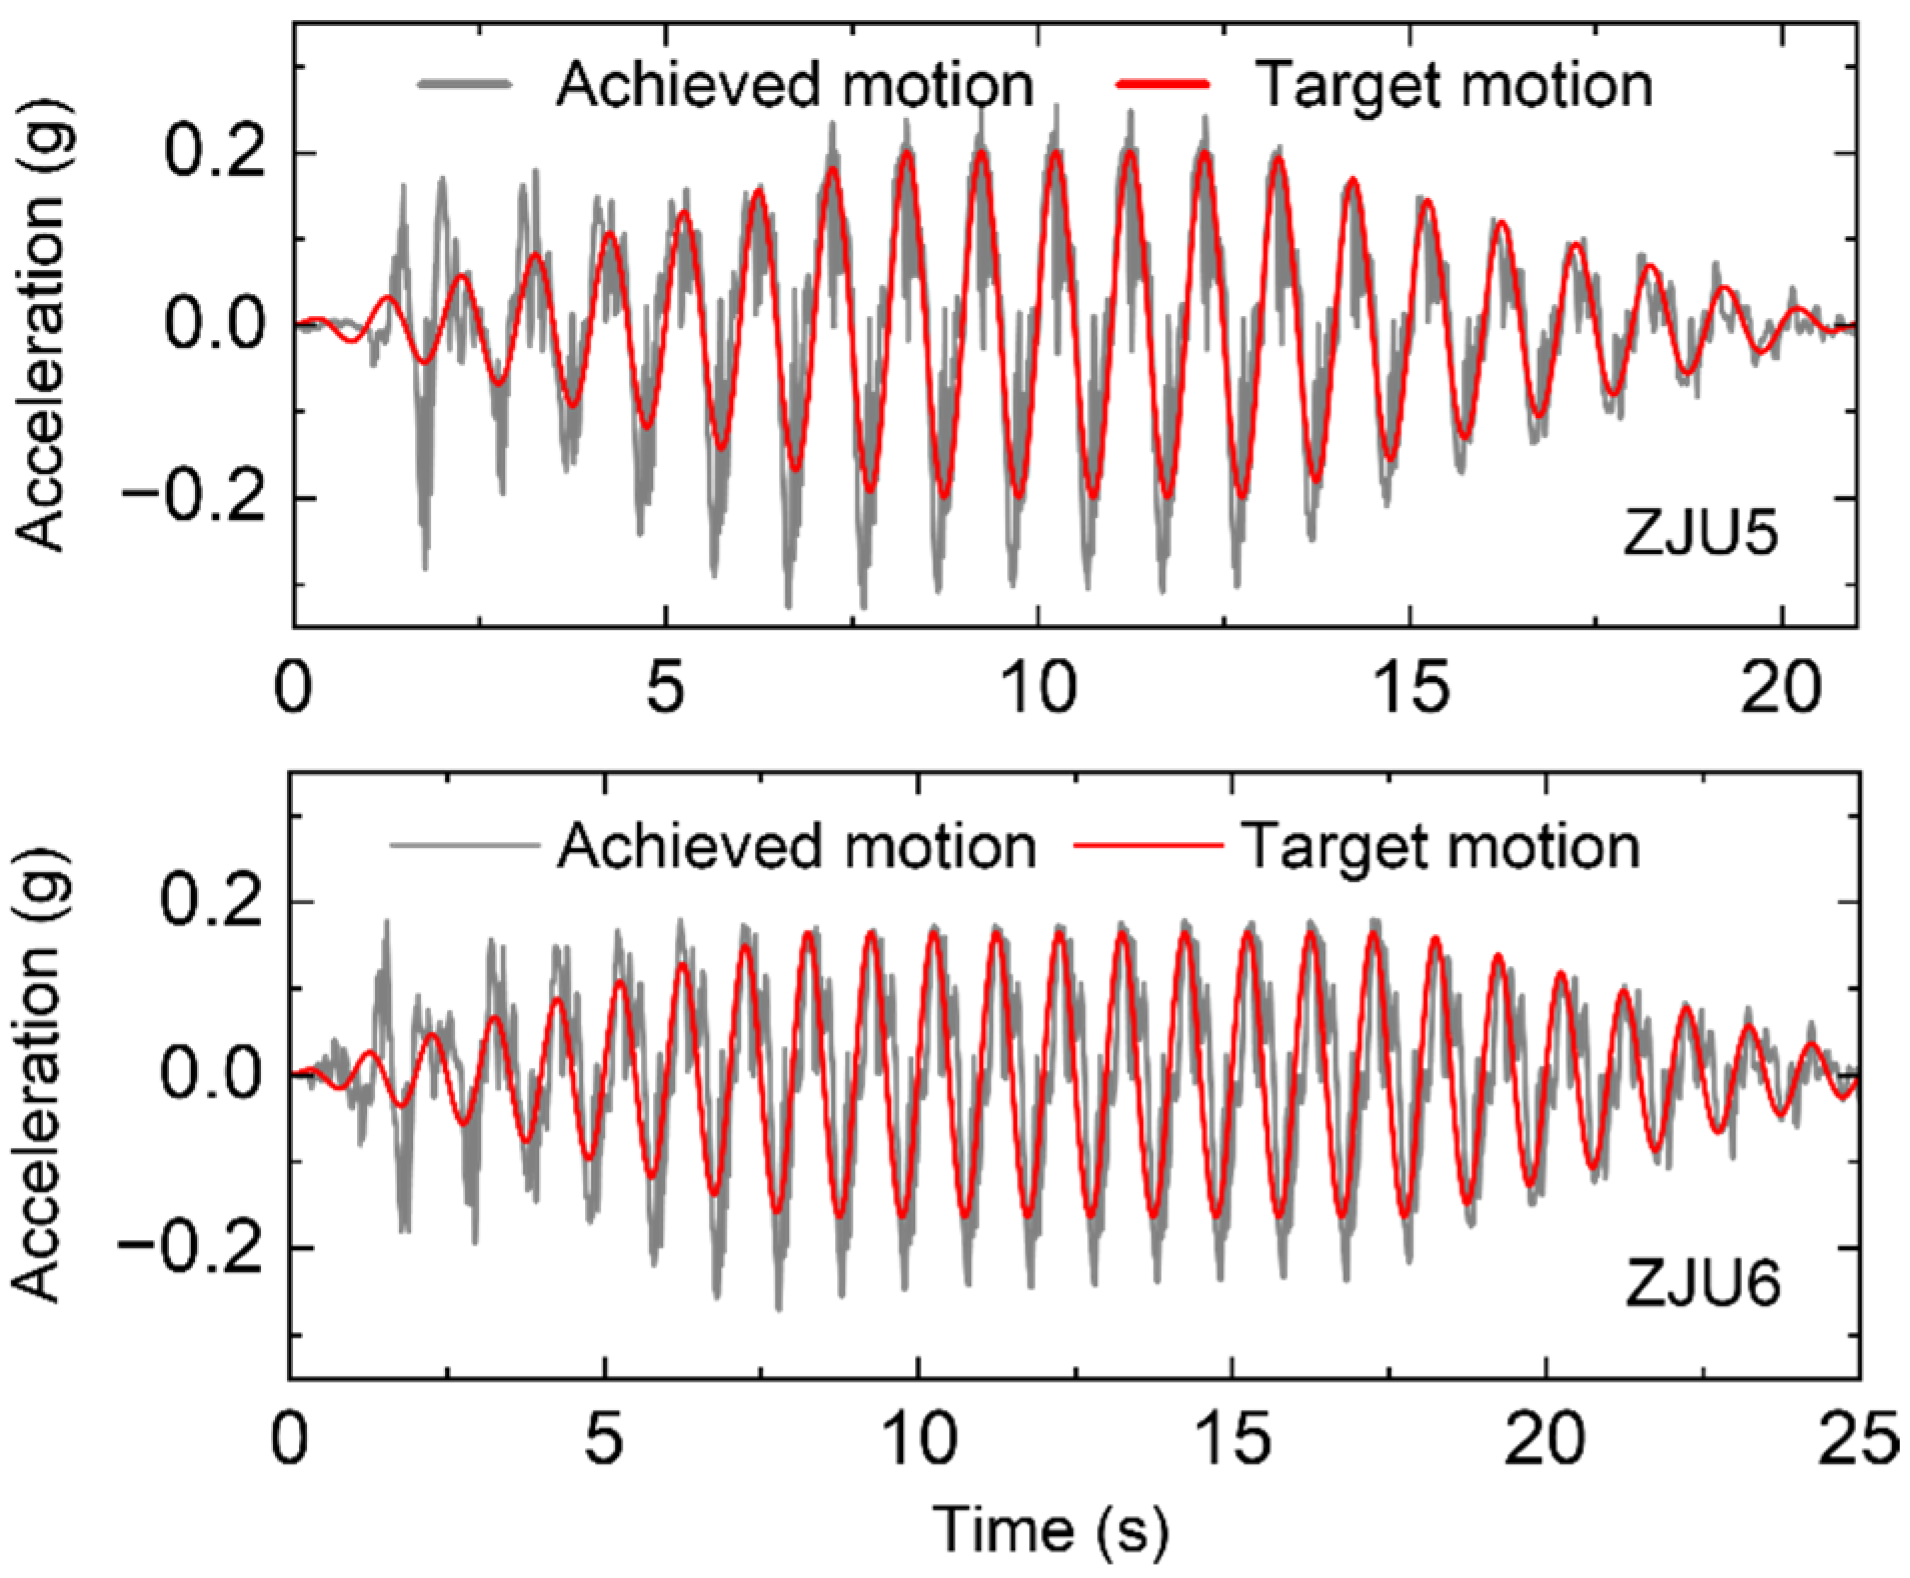
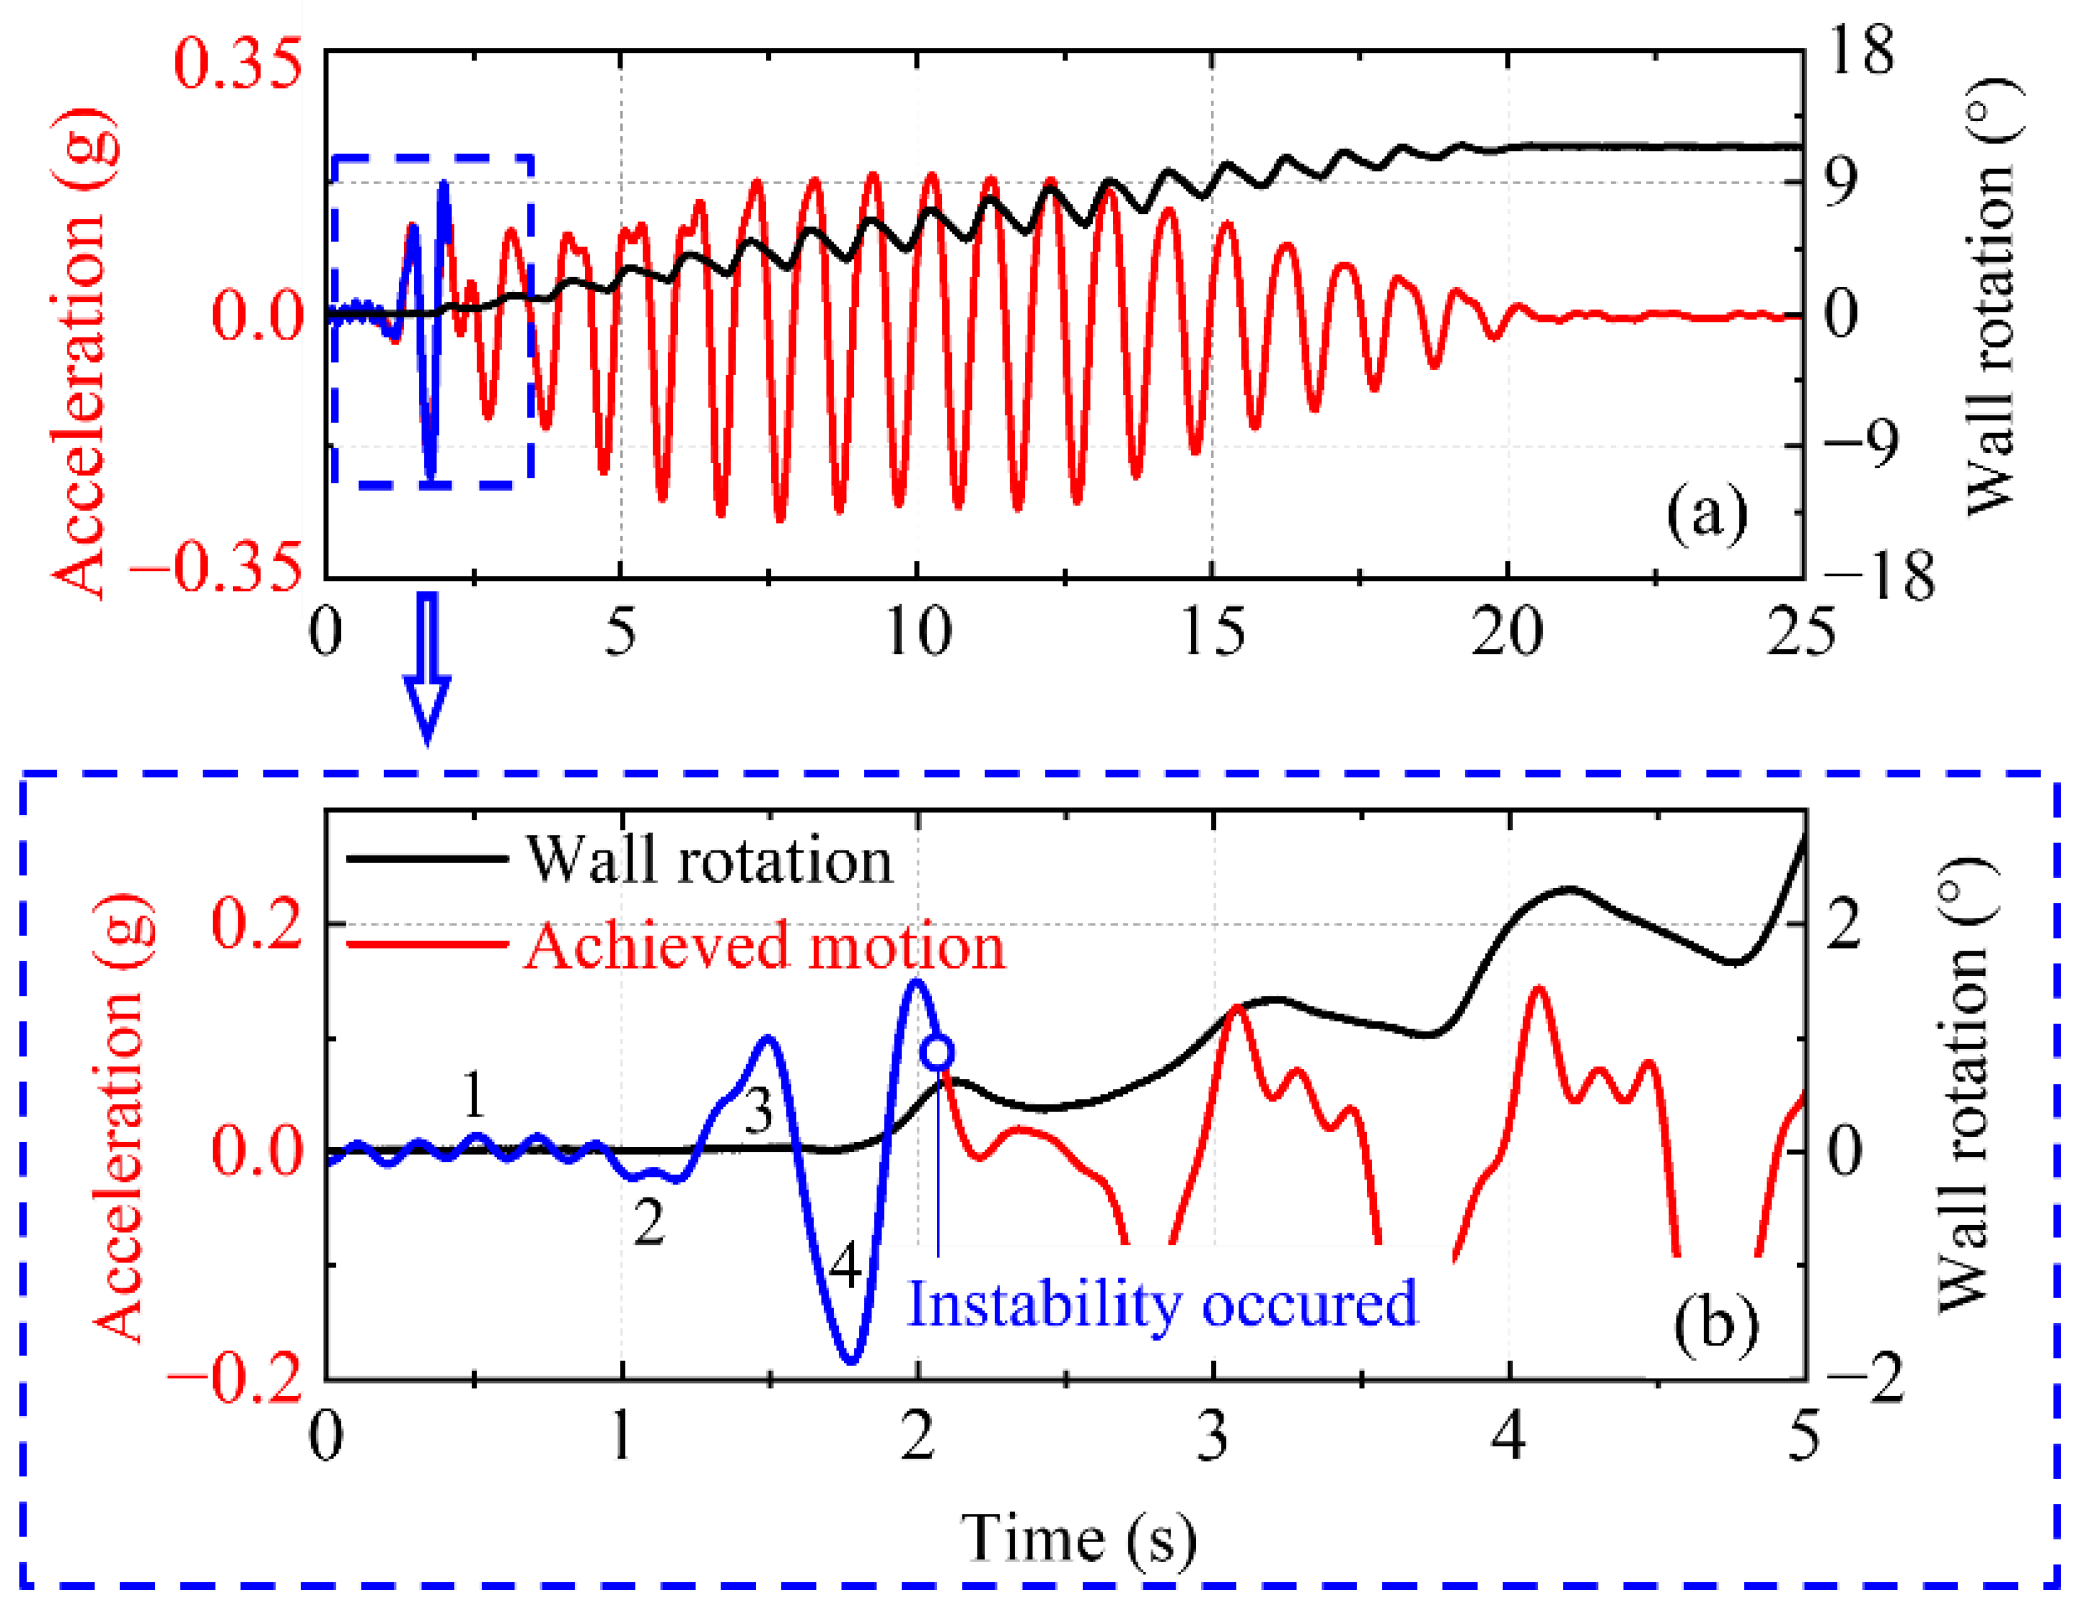
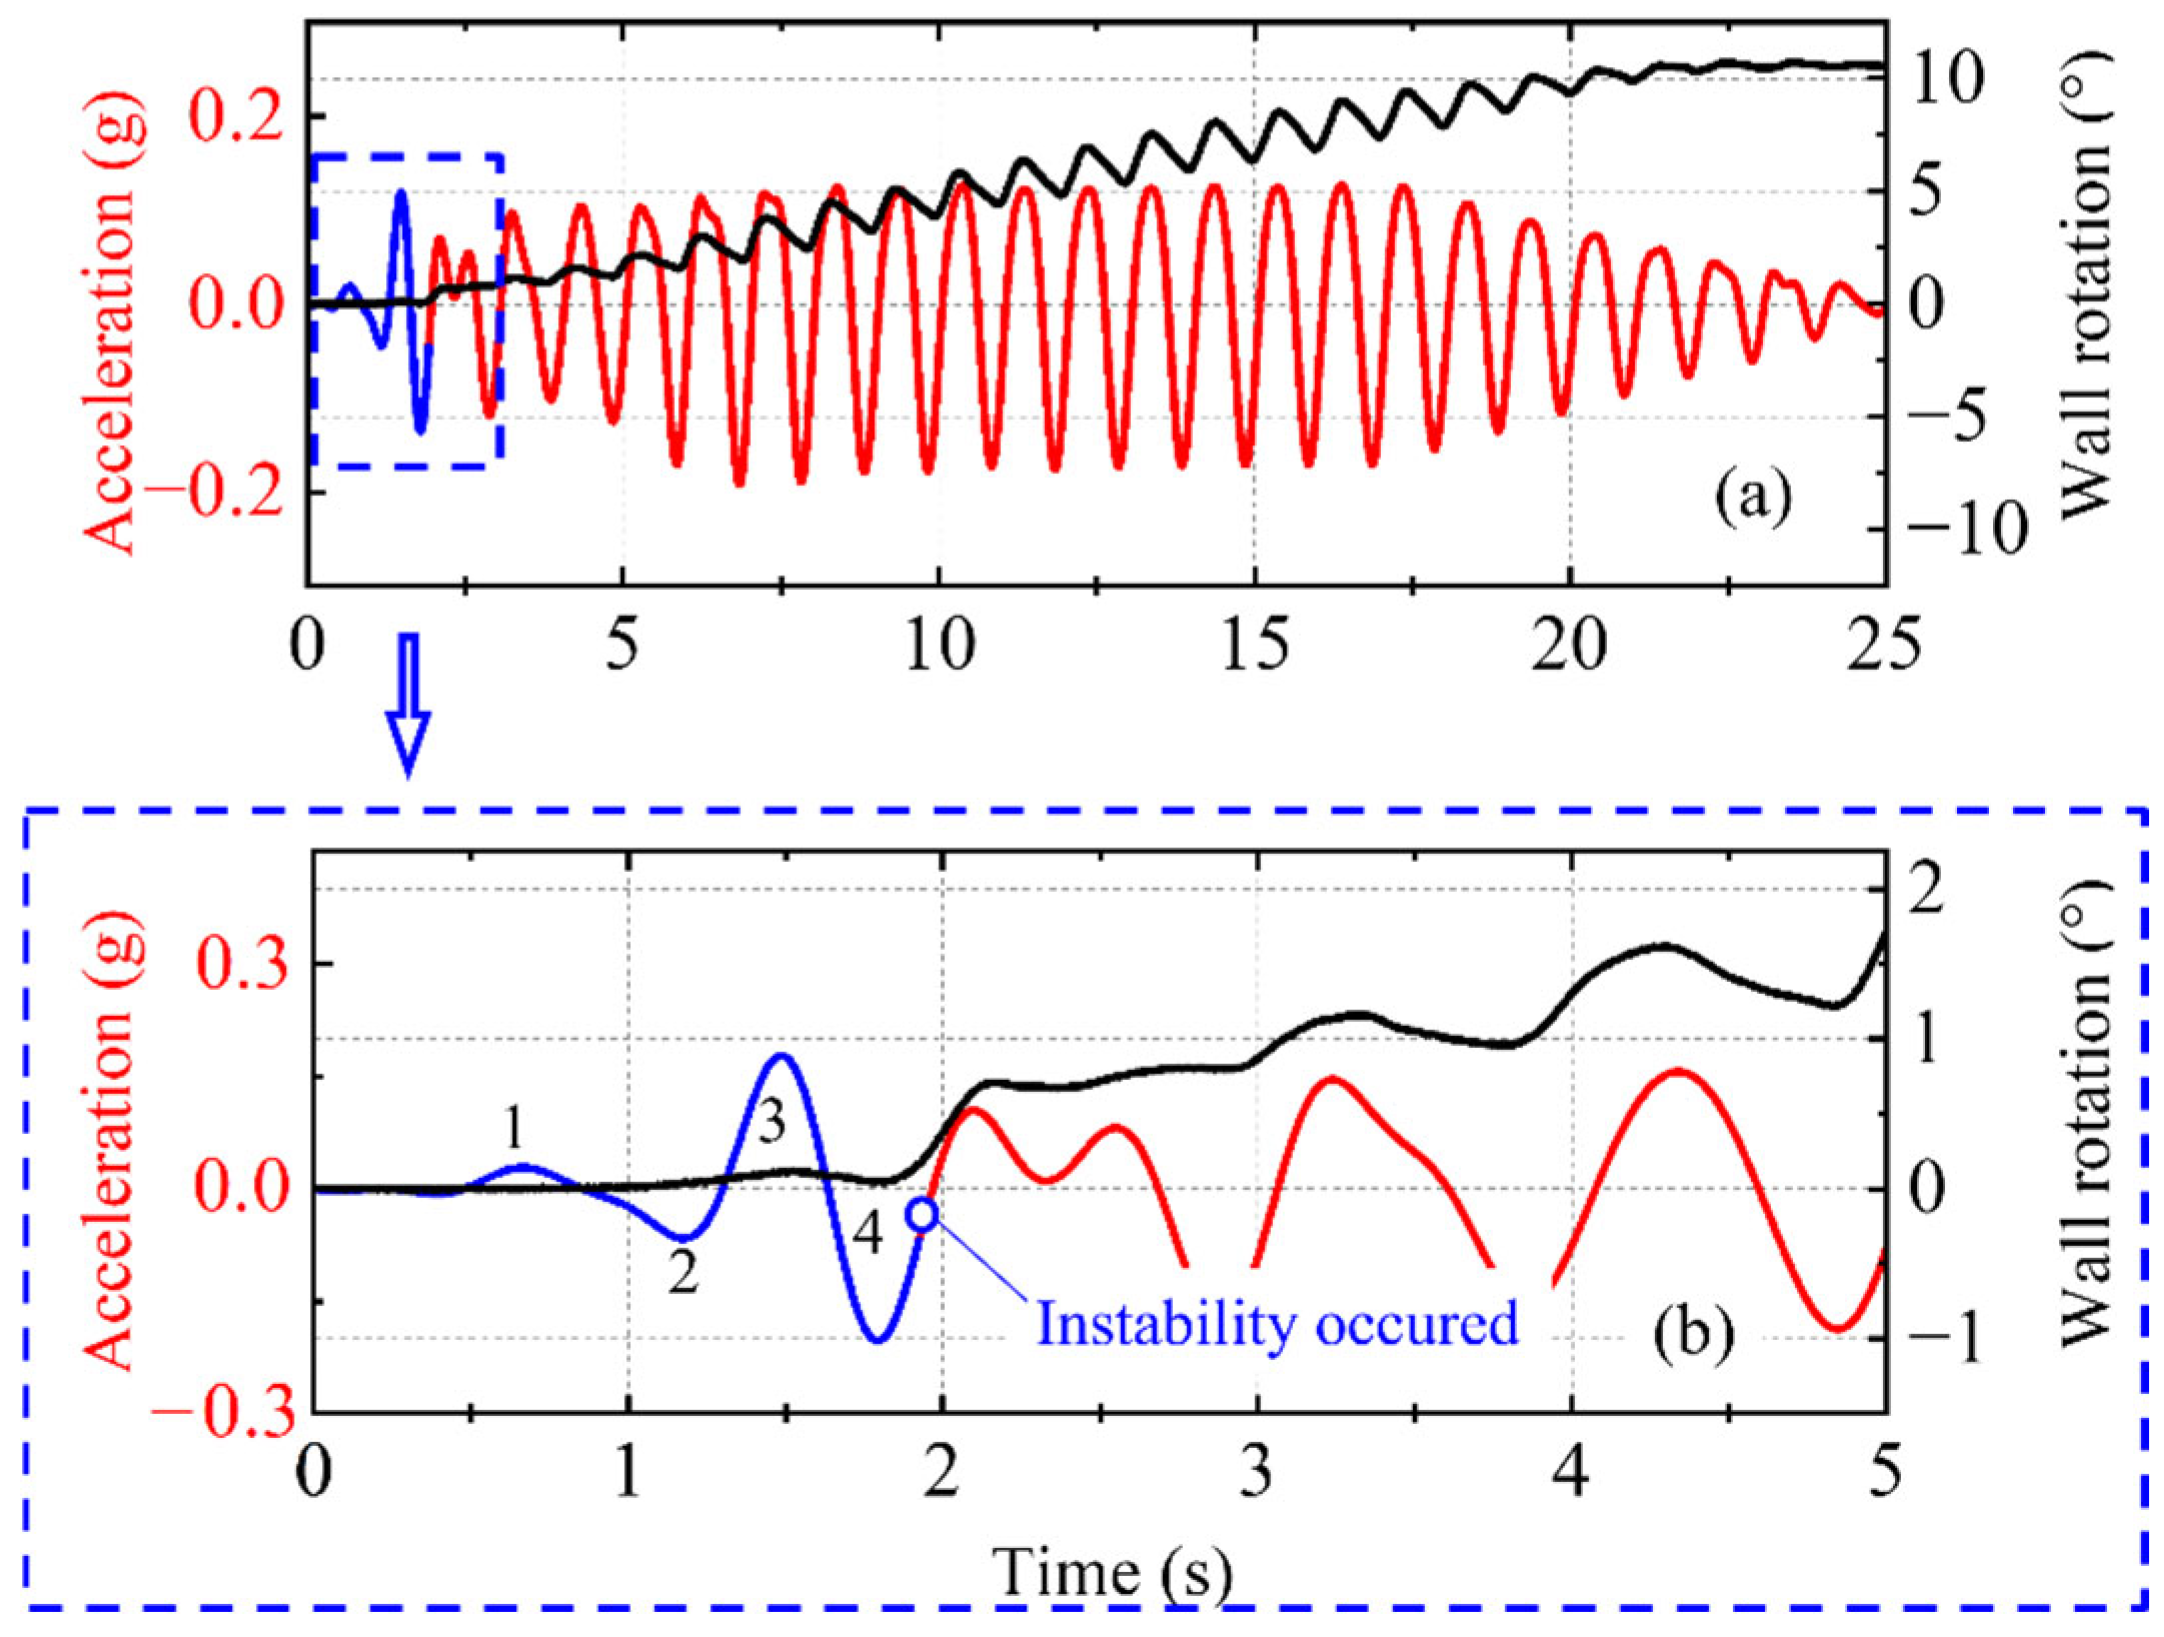
Figure 7 shows the acceleration response at the bottom of the model box, where the red line represents the target motion and the black line represents the achieved motion. The input motion in ZJU5 and ZJU6 are non-uniform cyclic loadings with a frequency of 1 Hz, the input motion consists of three segments: the first segment is eight cycles of a non-uniform amplitude sine wave with increasing amplitude, the second segment is five cycles of a uniform amplitude sine wave with an amplitude of 0.2 g in ZJU5 and 0.164 g in ZJU6, and the third segment is eight cycles of a non-uniform amplitude sine wave with decreasing amplitude. The agreement between the achieved and target motions was governed by the performance of the shaking table. From Figure 7, it can be observed that the achieved motion contains some high-frequency components. This high-frequency component is produced by most shakers during shaking [33], which results in a slightly higher amplitude compared to the target motion. During the first 0–5 s, insufficient control of energy release resulted in amplified motion in the initial phase of shaking. As the test progressed, the shaking table gradually stabilized, leading to a reduction in the discrepancy between the actual and target motions. Overall, the achieved motion of ZJU5 and ZJU6 match the target motion well.
To validate the rationality of the assumptions adopted during the computational analysis, specifically that the pore pressure increase across the entire site is uniform before the wall failure, Figure 8 presents a summary of the residual pore pressure observed during the ZJU6 test. The test data reveal that the rate of residual pore pressure accumulation at the shallow monitoring point (PW3) slightly exceeds that at the deeper monitoring point (PW1) during the pre-failure phase. Nevertheless, the observed discrepancy remains within an insignificant range, which corroborates the validity of the uniform pore pressure distribution assumption adopted in this investigation. Ono and Okamura [34] also observed this phenomenon in their analysis of the excess pore pressure in the soil behind retaining walls.
Figure 9 and Figure 10 show the comparison between the wall rotation and the achieved motion in ZJU5 and ZJU6, respectively. As seen in Figure 9b, the wall begins to rotate near 2 s in ZJU5, which corresponds to the 5th half-cycle of the motion. However, the wall begins to rotate in the 4th half-cycle of the motion in ZJU6, as shown in Figure 10b. Both ZJU5 and ZJU6 indicate that sheet pile walls are highly susceptible to instability under earthquake loading in saturated sites. This phenomenon was also observed by other teams in the LEAP [34,35,36], suggesting that excess pore pressure generated during earthquakes can significantly compromise the stability of sheet pile walls. These findings also highlight that the influence of excess pore pressure cannot be neglected when evaluating the stability of sheet pile walls in saturated sites.
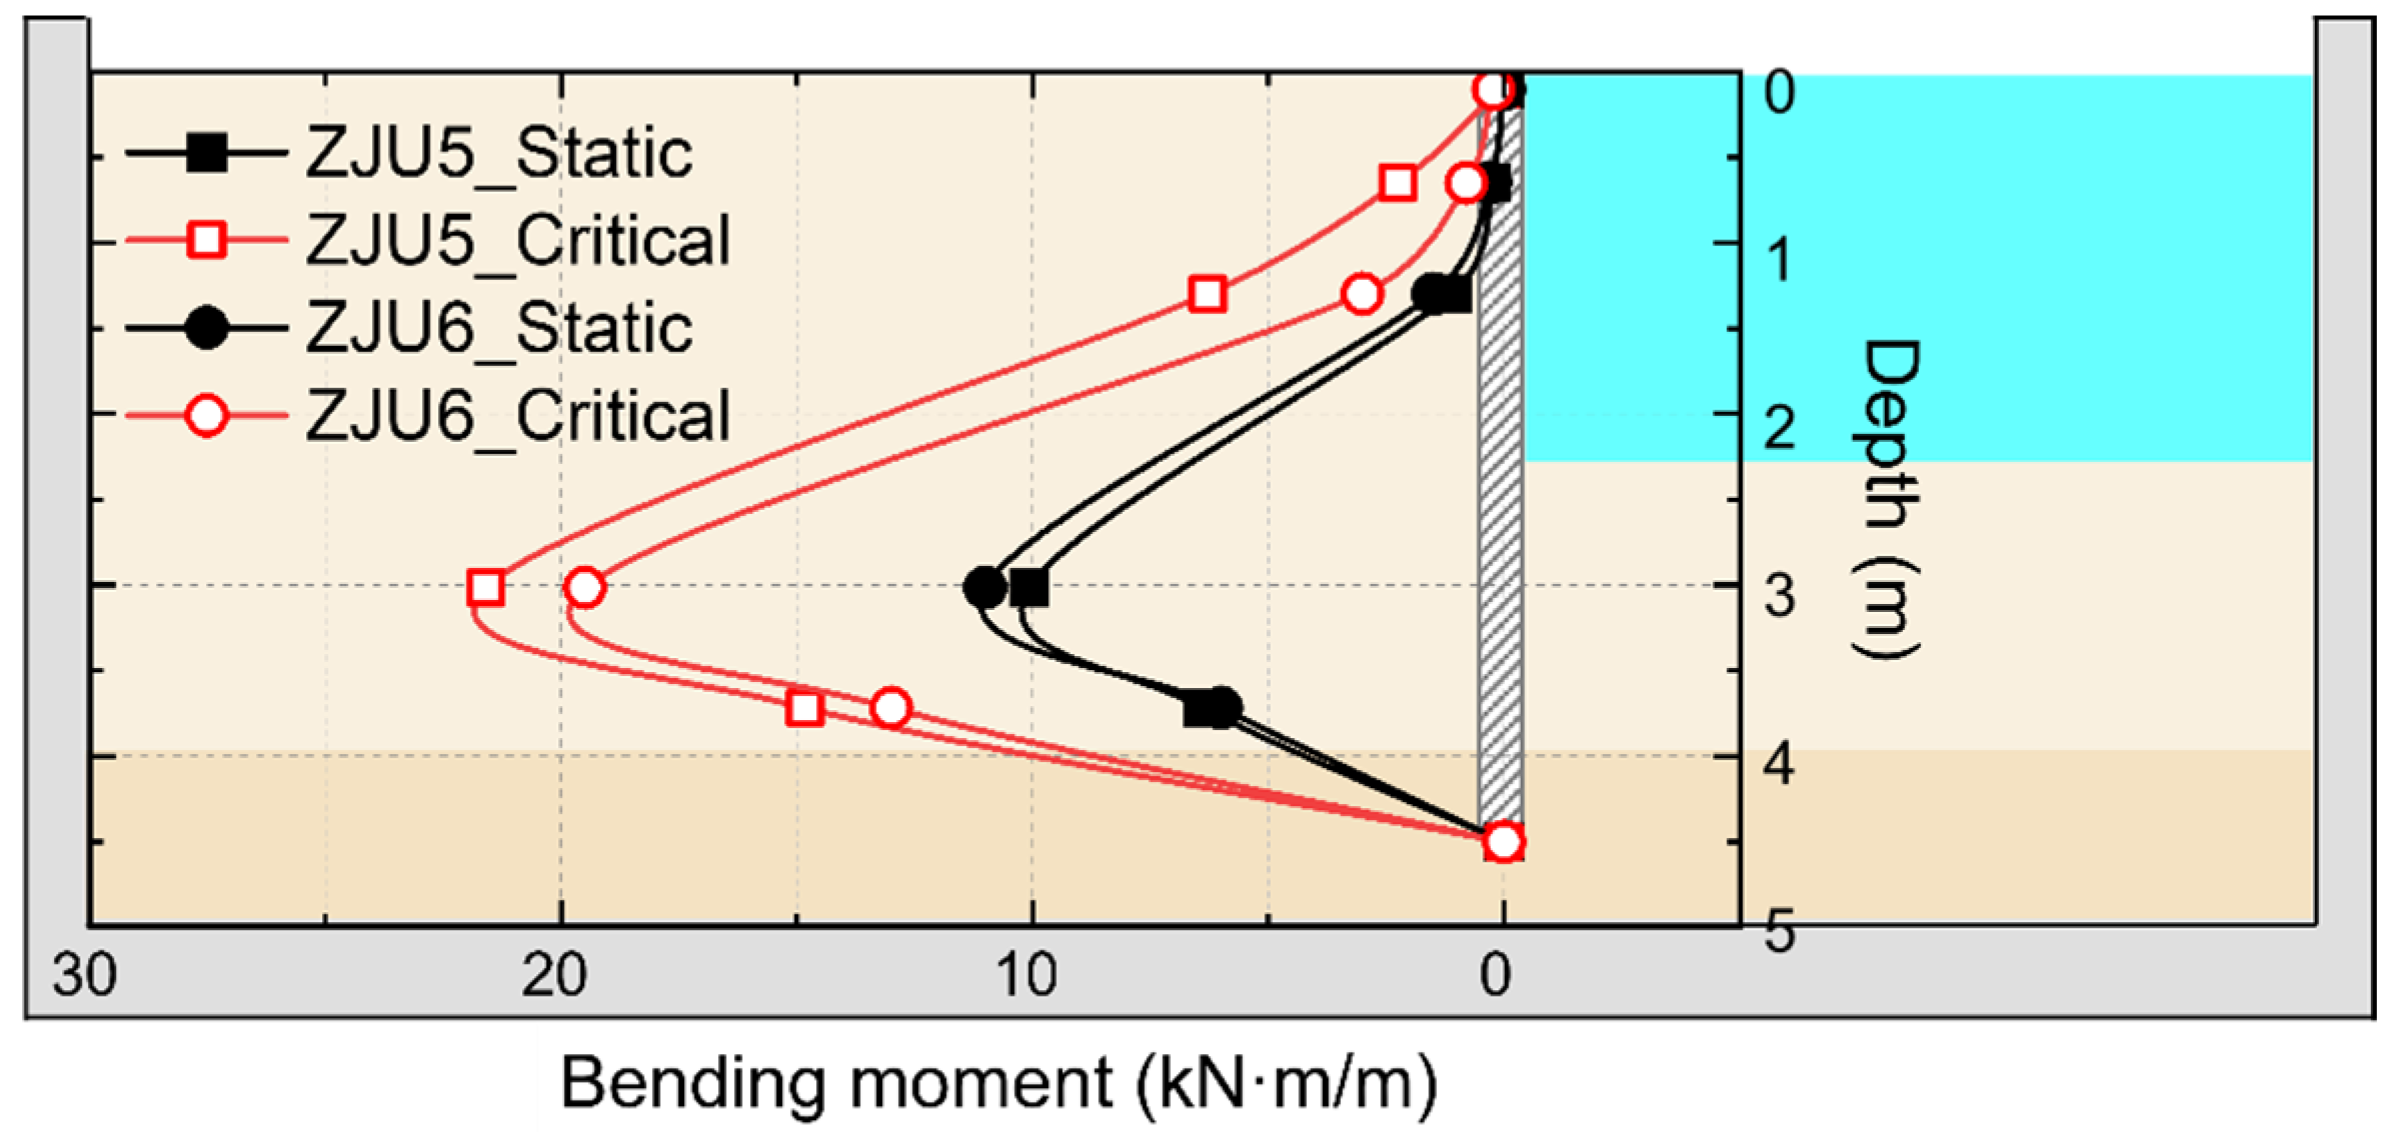
Based on Equation (14), the bending moment distribution of the wall before vibration and in the limit state of the two tests are plotted, as shown in Figure 11. It can be observed that before vibration, the maximum bending moment occurs approximately 3 m underground, reaching around 10 kN × m/m. Once the wall reaches the limit state, the bending moment distribution remains unchanged, with the maximum bending moment still appearing at approximately 3 m underground, but the amplitude significantly increases to around 20 kN × m/m.
The reference cycle number is taken as Nref = 15, meaning liquefaction occurs when the number of cycles reaches 15. When the soil is Ottawa F–65 sand with a relative density (Dr) of 65%, the parameters a and b in Equation (1) are 0.33 and −0.24, respectively. Accordingly, when Nref = 15, the corresponding CSRref is 0.1723. According to Equation (2), amax is calculated to be 0.127 g. Solving the equilibrium equation results in a pivot point located 2.012 m below the dredging depth, corresponding to an excess pore pressure ratio ru of 0.194.
From Equation (8), the number of cycles at the limit state, Ncr, is 3.6, corresponding to a damage level of Ncr/Nref = 0.24. The damage level for each half-cycle of the achieved motion is calculated as 0.5/Ni and then summed, and half-cycles with CSR less than 0.05 are excluded from the analysis. The calculation process of ZJU5 and ZJU6 are shown in Table 4 and Table 5, respectively. It can be observed that after the completion of the fourth half-cycle in ZJU5, the damage level of the site is 0.1635, while after the fifth half-cycle, the damage level reaches 0.2435. Therefore, the sheet pile wall reaches the limit state at the fifth half-cycle. Similarly, after the completion of the fourth half-cycle in ZJU6, the damage level of the site is 0.259, the sheet pile wall reaches the limit state at this half-cycle. As shown in Figure 9 and Figure 10, the calculation results are consistent with the test results.
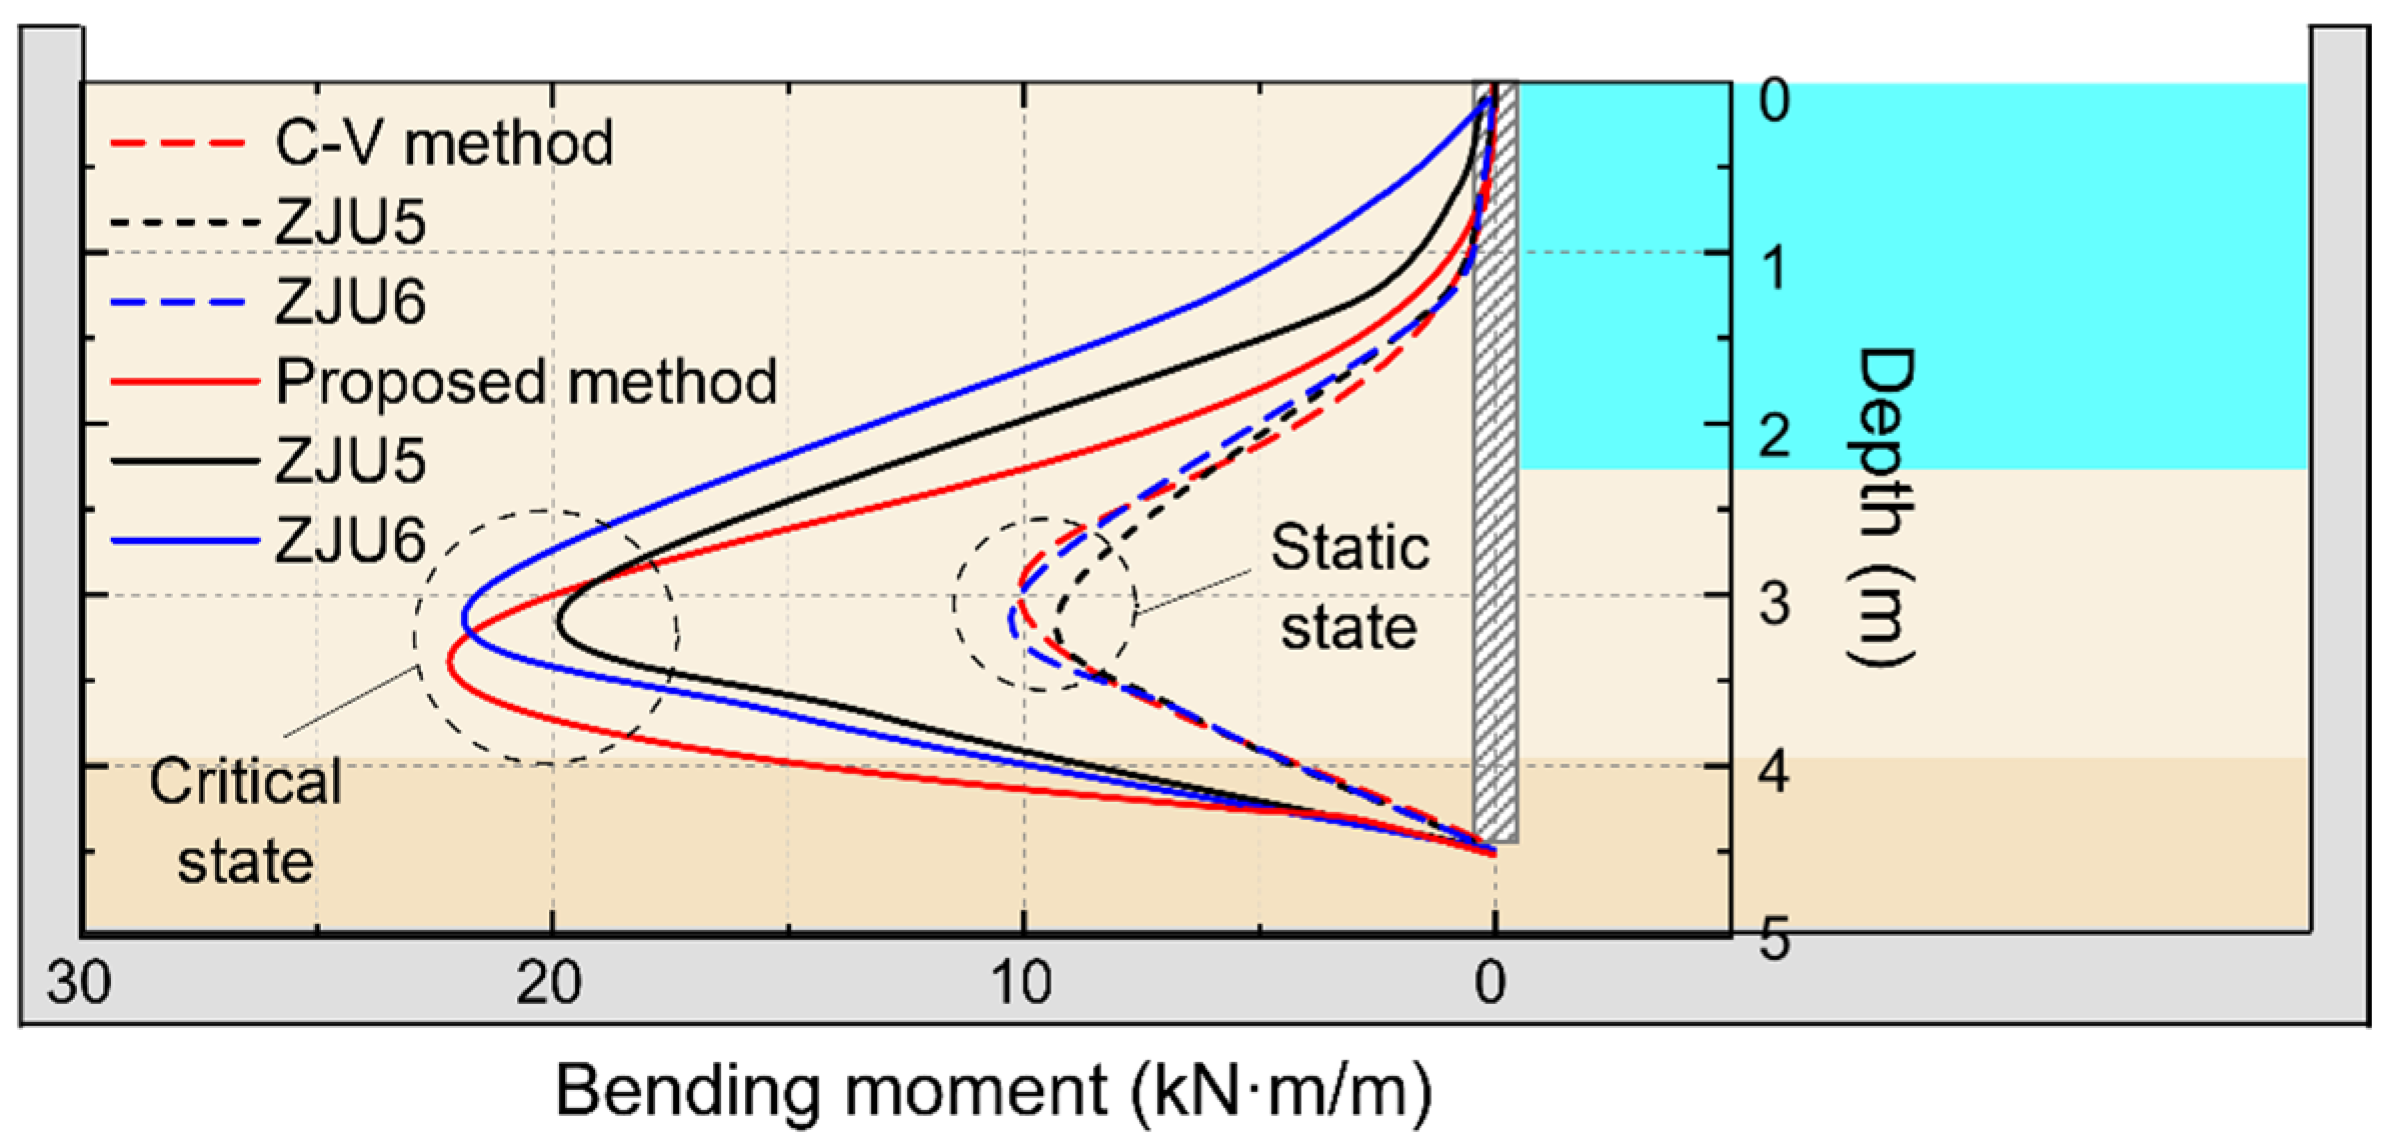
Guan et al. [36] evaluated the stability of sheet pile walls in saturated sites by assuming earth pressure distribution according to the C-V method. This method neglects the effect of excess pore pressure, and due to the absence of soil pressure and wall bending moment data in their experiments, stability verification relied solely on displacement measurements, which cannot accurately reflect the stress state at wall failure. Manandhar et al. [33] employed soil pressure sensors, but their measurements were limited to static conditions and post-shaking load distributions, providing no insight into the stress state during instability. In this study, the influence of excess pore pressure during shaking is fully considered, allowing the bending moments at the onset of wall instability in saturated sites to be determined and compared with experimental results. The bending moment of the sheet pile wall under static and limit states were plotted in Figure 12. Under static conditions, the bending moment calculated using the C–V method matches well with the test results. The calculation result places the location of the maximum bending moment slightly higher than the test results, occurring at a depth of approximately 3 m, which corresponds to one-third of the wall height. In the limit state, the maximum bending moment calculated using the proposed method (22.2 kN × m/m) is slightly larger than the test result (20 kN × m/m in ZJU5 and 21.6 kN × m/m in ZJU6), indicating a conservative estimate in the calculations. Additionally, the location of the maximum bending moment (3.5 m) is slightly deeper than that observed in the experiment (3 m). Overall, the proposed method accurately predicts the bending moment distribution of the wall.
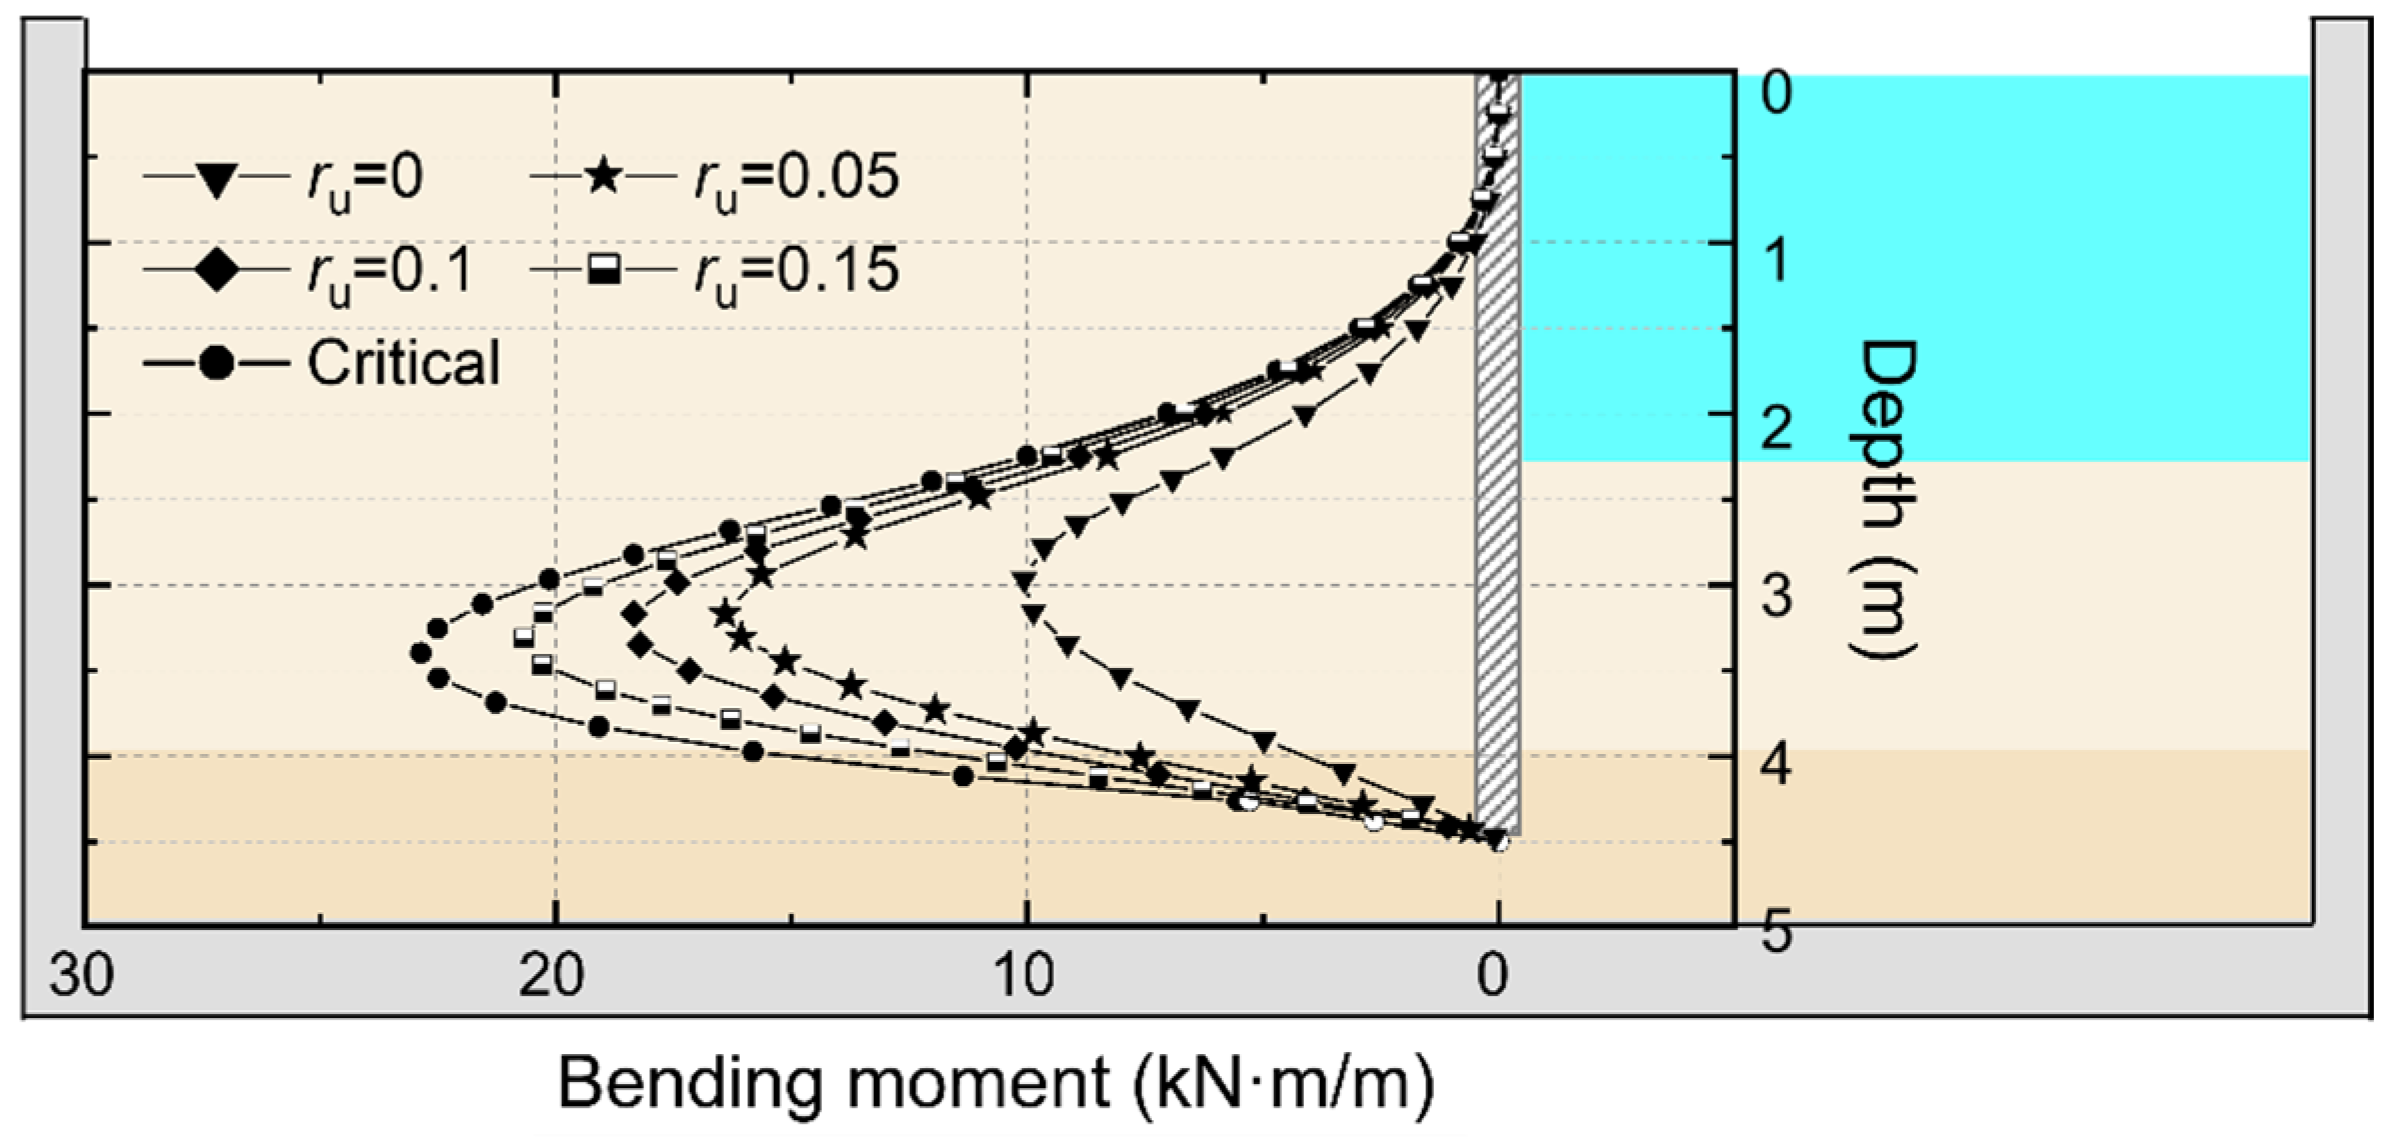
To analyze the impact of the reference number of cycles (Nref) on the calculation results, this study computed the bending moment distribution for Nref = 15, 20, and 30. When Nref is 15, 20, and 30, the maximum horizontal seismic acceleration (amax) calculated by Equations (1) and (2) are 0.128, 0.120, and 0.109, respectively. The excess pore pressure ratios (ru) are 0.194, 0.196, and 0.199, respectively. According to Table 4, the wall becomes unstable at the fifth half-cycle for all three cases. Figure 13 shows the bending moment distribution for different reference cycle numbers (Nref). It can be observed that the bending moment distribution of the wall in critical state remains almost identical, regardless of the value of Nref. By comparing the dynamic cyclic stress ratio (CSRi) and excess pore pressure ratio (ru) for different Nref values, it becomes evident that, compared to the maximum horizontal seismic acceleration (amax), the excess pore pressure ratio has a more significant impact on the stability of sheet pile walls in liquefiable soils. The bending moment distribution is primarily influenced by the excess pore pressure ratio.
Figure 14 illustrates the changes in bending moment of the sheet pile wall from static to critical state. It can be observed that as the excess pore pressure ratio increases, the bending moment of the wall gradually increases, and the location of the maximum bending moment shifts downward. Therefore, in future designs of sheet pile walls, the reinforcement position of the wall needs to be reconsidered.
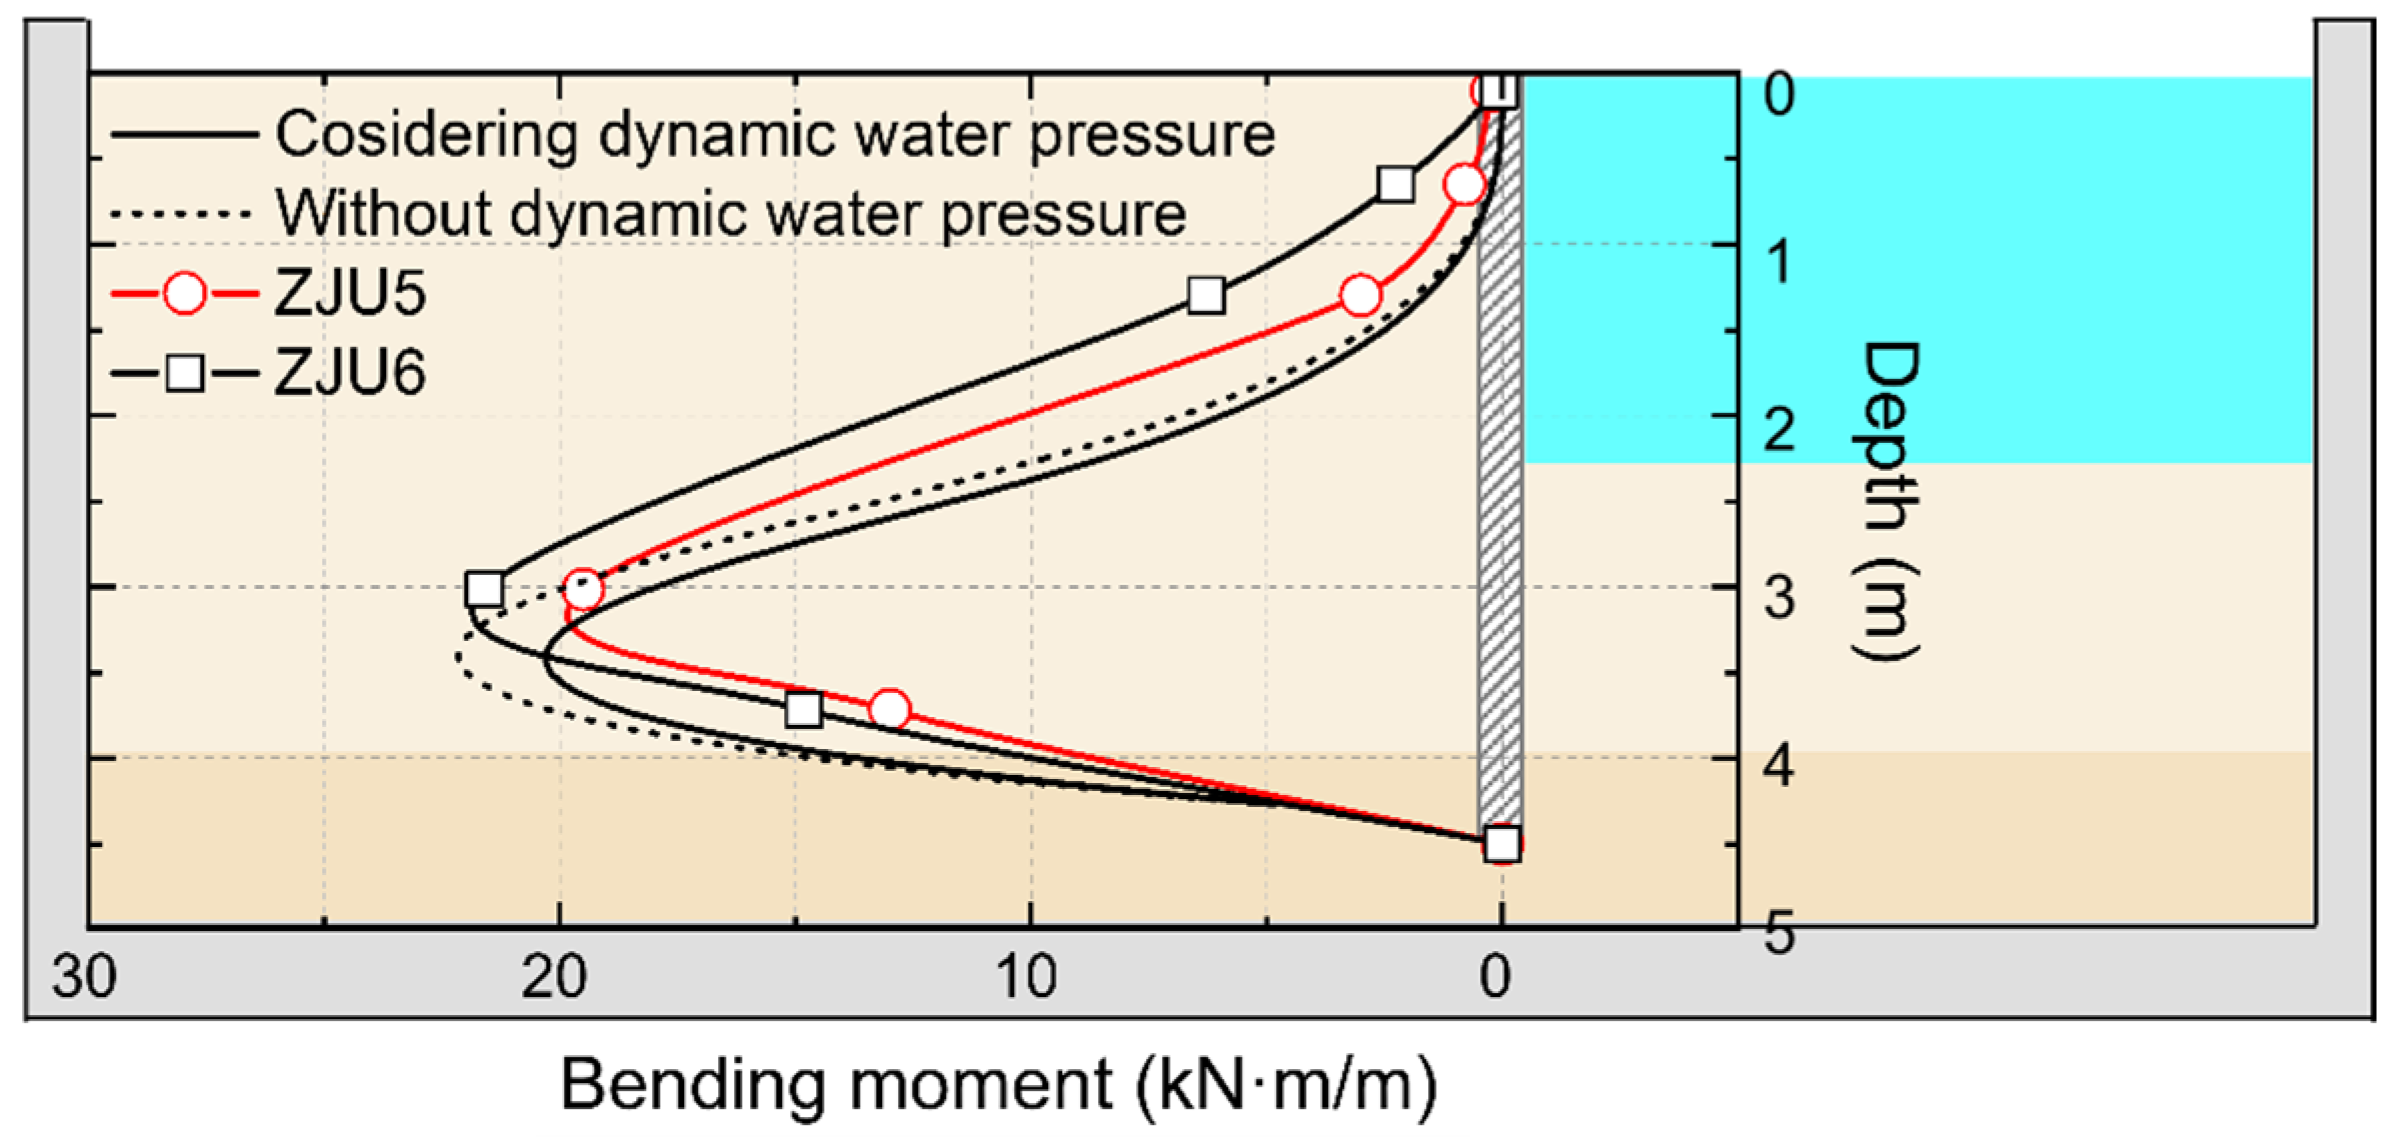
Considering the dynamic water pressure in the excavation area in front of the wall, a comparison was made between the bending moment distributions with and without accounting for dynamic water pressure. This comparison was based on the dynamic water pressure calculation method developed by Westergaard [37]. As shown in Figure 15, it can be observed that the presence of dynamic water pressure reduces the amplitude of the bending moment distribution. The maximum bending moment decreases from 22.2 kN × m/m to 20.5 kN × m/m, a reduction of approximately 7.7%. The location of the maximum bending moment remains the same as when dynamic water pressure is not considered, but it is deeper than the test result.

6. Conclusions

Retaining structures in coastal and port areas play a critical role in ensuring the safety of onshore buildings and machinery, particularly under earthquake loading. These structures must withstand not only earthquake-induced inertial forces but also forces generated by excess pore pressure. In this study, building on existing pseudo-static analysis methods and employing the equivalent number of cycles principle, an analytical expression was developed to quantify the stress distribution on sheet pile walls in liquefiable sites, which captures the evolution of pore pressure. By applying the equivalent number of cycles principle, non-uniform cyclic loading is converted into a uniform loading, thereby relating the stability of the sheet pile wall to excess pore pressure. When combined with the pseudo-static method, this approach allows for the calculation of the stress distribution in the sheet pile wall under arbitrary cyclic loading.
Two sets of dynamic centrifuge model tests were conducted on a liquefiable layer retained by a cantilevered sheet pile wall. The tests provided detailed measurements of site acceleration, pore water pressure, as well as the displacement and bending moment of the sheet pile wall during shaking. The pore pressure data validated the proposed representation of pore pressure evolution during the initial stage of shaking, while the recorded displacement and bending moment confirmed the accuracy of both the wall stability evaluation and the bending moment calculations.
Under identical seismic loading conditions, the selection of different equivalent cycle numbers does not significantly influence the variation in bending moment or the instability evaluation of the sheet pile wall. This result supports the validity of the proposed method, which integrates the principle of equivalent cycle numbers with the pseudo-static method. During shaking, the dynamic water pressure in front of the wall contributes additional resistance, partially offsetting the dynamic earth pressure behind the wall and consequently reducing the bending moment. As the passive earth pressure in front of the wall develops, the position of the maximum bending moment shifts downward along the sheet pile wall. This observation implies that, in future sheet pile wall designs, reinforcement efforts may be concentrated on the corresponding wall segment.
In practical engineering, by obtaining the site’s CSRNL curve, the method proposed in this study can be used to assess the seismic performance and stress distribution of sheet pile walls, providing a theoretical basis for engineering design and seismic performance optimization. While the simplified model yielded satisfactory results, the analysis is restricted to the critical state, which generally occurs only during the initial phase of earthquake loading. Post-earthquake observations, however, indicate that instability of sheet pile walls is often unavoidable. In line with modern performance-based design codes, which allow limited wall displacements under earthquake, the dynamic behavior of sheet pile walls following instability warrants further investigation.

Author Contributions

Conceptualization, S.N. and Q.M.; methodology, S.N. and Y.C.; validation, S.N., Q.M. and Y.C.; formal analysis, S.N., Q.M. and Y.C.; investigation, S.N. and Q.M.; resources, Q.M. and Y.C.; data curation, S.N., Q.M. and Y.C.; writing—original draft preparation, S.N.; writing—review and editing, Q.M. and Y.C.; visualization, S.N.; supervision, Q.M.; project administration, Q.M. and Y.C.; funding acquisition, Q.M. and Y.C. All authors have read and agreed to the published version of the manuscript.

Funding

This research was funded by the National Science Foundation for Young Scientists of China (No. 52408400), the National Natural Science Foundation of China (No. 52588202) and the National Key Research and Development Program of China (No. 2024YFF1700901).

Data Availability Statement

The data presented in this study are openly available in [DesignSafe] at [https://doi.org/10.17603/ds2-amgj-d475] (accessed date: 29 July 2025).

Acknowledgments

The authors would thank Zizhuang Yan and Shuai Hong of Zhejiang University for their great help during the centrifuge model tests. At the same time, we would like to thank Muzhi Li for reviewing the formulas in this paper.

Conflicts of Interest

The authors declare no conflicts of interest.

References

  1. Cai, Z. Innovation and development of earth pressure theories for sheet-pile structures. Chin. J. Geotech. Eng. 2020, 42, 201–220. (In Chinese) [Google Scholar] [CrossRef]
  2. Cao, Y.; Zhou, Y.G.; Ma, Q.; Zhou, X.H.; Chen, Y.M. Liquefaction and fluidization responses of level ground retained by sheet-pile wall through centrifuge model tests. Soil Dyn. Earthq. Eng. 2024, 178, 108517. [Google Scholar] [CrossRef]
  3. Soga, K. Soil Liquefaction Effects Observed in the Kobe Earthquake of 1995. Proc. Inst. Civ. Eng.-Geotech. Eng. 1998, 131, 34–51. [Google Scholar] [CrossRef]
  4. Inagaki, H.; Iai, S.; Sugano, T.; Yamazaki, H.; Inatomi, T. Performance of caisson type quay walls at Kobe port. Soils Found. 1996, 36, 119–136. [Google Scholar] [CrossRef]
  5. Allen, J.; Bradley, B.; Green, R.A.; Ashford, S.; Wotherspoon, L. Geotechnical reconnaissance of the 2010 Darfield (Canterbury) earthquake. Bull. N. Z. Soc. Earthq. Eng. 2010, 43, 243–320. [Google Scholar] [CrossRef]
  6. Yasuda, S.K.; Harada; Ishikawa, K.; Kanemaru, Y. Characteristics of liquefaction in Tokyo Bay area by the 2011 Great East Japan Earthquake. Soils Found. 2012, 52, 793–810. [Google Scholar] [CrossRef]
  7. Cubrinovski, M. Liquefaction-Induced Damage in the 2010–2011 Christchurch (New Zealand) Earthquakes. In Proceedings of the 7th Conference of the International Conference on Case Histories in Geotechnical Engineering, Chicago, IL, USA, 29 April–4 May 2013; Available online: https://scholarsmine.mst.edu/icchge/7icchge/session12/1 (accessed on 15 July 2025).
  8. Henderson, D.R.K. The Performance of House Foundations in the Canterbury Earthquakes. Master’s Thesis, University of Canterbury, Christchurch, New Zealand, 2013. [Google Scholar]
  9. Cao, Y.; Zhou, Y.G.; Ishikawa, A.; Kurimoto, K.; Chen, Y.M. Initial cyclic shear strain-based pore pressure generation model of saturated sands under cyclic stress loading. Soil Dyn. Earthq. Eng. 2025, 190, 109167. [Google Scholar] [CrossRef]
  10. Okabe, S. General theory on earth pressure and seismic stability of retaining wall and dam. J. Jpn. Civil Eng. Soc. 1924, 10, 1277–1323. [Google Scholar]
  11. Mononobe, N.; Matsuo, M. On the determination of earth pressures during earthquakes. In Proceedings of the World Engineering Congress, Tokyo, Japan, 29 October–7 November 1929. [Google Scholar]
  12. Steedman, R.S.; Zeng, X. The influence of phase on the calculation of pseudo-static earth pressure on retaining wall. Geotechnique 1990, 40, 103–112. [Google Scholar] [CrossRef]
  13. Yang, J.; Wang, R.W.; Shen, Y.; Peng, X.J. Analytical solution of seismic passive earth pressure for negative friction angle of wall-soil interface. Chin. J. Geotech. Eng. 2011, 33, 785–791. (In Chinese) [Google Scholar]
  14. Conti, R.; Viggiani, G.M. A new limit equilibrium method for the pseudo-static design of embedded cantilevered retaining walls. Soil Dyn. Earthq. Eng. 2013, 50, 143–150. [Google Scholar] [CrossRef]
  15. Singh, A.P.; Chatterjee, K. The influence of strip load on the seismic design of cantilever sheet pile walls: A simplified analytical solution. Bull. Earthq. Eng. 2022, 20, 5301–5322. [Google Scholar] [CrossRef]
  16. Fusco, A.; Conti, R.; Viggiani, G.M.B.; Madabhushi, G.S.P.; Prüm, C. Centrifuge and theoretical study of the seismic response of anchored steel sheet pile walls in dry sand. Geotechnique 2023, 73, 1561–1576. [Google Scholar] [CrossRef]
  17. Atik, L.A.; Sitar, N. Seismic earth pressures on cantilever retaining structures. J. Geotech. Geoenviron. Eng. 2010, 136, 1324–1333. [Google Scholar] [CrossRef]
  18. Zheng, G.; Liu, C.; Liu, Y.; Hu, Q.; Wang, C.; Kang, G.; Liu, Y. Experimental study on horizontal bearing behaviors of different types of full-scale piles under reciprocating horizontal loads. Chin. J. Geotech. Eng. 2019, 41, 32–40. (In Chinese) [Google Scholar] [CrossRef]
  19. Zeng, X.; Steedman, R.S. On the behaviour of quay walls in earthquakes. Geotechnique 1933, 43, 417–431. [Google Scholar] [CrossRef]
  20. Liu, Z.; Yan, F. Dynamic active earth pressure on rigid retaining walls with submerged soils. Rock Soil Mech. 2006, 27, 566–570. (In Chinese) [Google Scholar]
  21. Balkema. Seismic Design Guidelines for Port Structures; International Navigation Association: Brussels, Belgium, 2001. [Google Scholar]
  22. Iai, S. Seismic actions for designing geotechnical works-ISO23469. J. Jpn. Assoc. Earthq. Eng. 2004, 4, 483–485. [Google Scholar] [CrossRef]
  23. Kramer, S.L.; Stewart, J.P. Geotechnical Earthquake Engineering; CRC Press: Oxford, UK, 2024. [Google Scholar]
  24. Yang, X.T.; Zhou, Y.G.; Cao, Y.; Ishikawa, A.; Chen, Y.M. On the determination of cyclic shear stress for soil liquefaction triggering in centrifuge model test. Soil Dyn. Earthq. Eng. 2023, 173, 108137. [Google Scholar] [CrossRef]
  25. Zhou, X.H.; Zhou, Y.G.; Ma, Q.; Chen, Y.M. Shear wave velocity-based evaluation of cyclic mobility type of liquefaction and validation by centrifuge model tests in LEAP. Soil Dyn. Earthq. Eng. 2024, 183, 108787. [Google Scholar] [CrossRef]
  26. Seed, H.B.; Idriss, I.M.; Arango, I. Evaluation of liquefaction potential using field performance data. J. Geotech. Eng. 1983, 109, 458–482. [Google Scholar] [CrossRef]
  27. Wilkins, E.W.C. Cumulative Damage in Fatigue; Springer: Berlin/Heidelberg, Germany, 1956. [Google Scholar] [CrossRef]
  28. Green, R.A.; Terri, G.A. Number of equivalent cycles concept for liquefaction evaluations–Revisited. J. Geotech. Geoenviron. Eng. 2005, 131, 477–488. [Google Scholar] [CrossRef]
  29. Seed, H.B.; Martin, P.P.; Lysmer, J. Pore-Water Pressure Changes during Soil Liquefaction. J. Geotech. Eng. Div. 1976, 102, 323–346. [Google Scholar] [CrossRef]
  30. Wang, L.; Liu, H. Study of Seismic Active Earth Pressure Acted on Gravity Wall in Backfill Sand. China J. Highway. Transp. 2009, 22, 26–33. (In Chinese) [Google Scholar]
  31. Zhou, Y.; Ma, Q.; Liu, K.; Cao, Y.; Chen, Y. Centrifugal shaking table tests on soil liquefaction and progress of LEAP projects. Chin. J. Geotech. Eng. 2023, 46, 54–62. (In Chinese) [Google Scholar] [CrossRef]
  32. Kutter, B.L.; Manzari, M.T.; Zeghal, M. Model Tests and Numerical Simulations of Liquefaction and Lateral Spreading LEAP-UCD-2017; Springer Nature: London, UK, 2020. [Google Scholar] [CrossRef]
  33. Manandhar, S.; Lee, S.R.; Manzari, M.T.; Cho, G.C. Seismic performance of sheet pile walls in liquefiable soil using centrifuge tests and an assessment of nonlinear effective stress analysis using PM4Sand. Soil Dyn. Earthq. Eng. 2024, 183, 108777. [Google Scholar] [CrossRef]
  34. Ono, K.; Okamura, M. Stability of sheet-pile wall in liquefiable soil: LEAP-2020 and LEAP-2022 centrifuge tests at Ehime University. Soil Dyn. Earthq. Eng. 2024, 182, 108743. [Google Scholar] [CrossRef]
  35. Korre, E.; Zeghal, M.; Abdoun, T. Liquefaction in the presence of soil-structure interaction: Centrifuge tests of a sheet-pile quay wall in LEAP-2020. Soil Dyn. Earthq. Eng. 2024, 181, 108650. [Google Scholar] [CrossRef]
  36. Guan, X.; Fusco, A.; Haigh, S.K.; Madabhushi, G.S.P. LEAP centrifuge tests on retaining walls at Cambridge University. Soil Dyn. Earthq. Eng. 2024, 180, 108610. [Google Scholar] [CrossRef]
  37. Westergaard, H.M. Water pressures on dams during earthquakes. Trans. Am. Soc. Civ. Eng. 1933, 98, 418–433. [Google Scholar] [CrossRef]
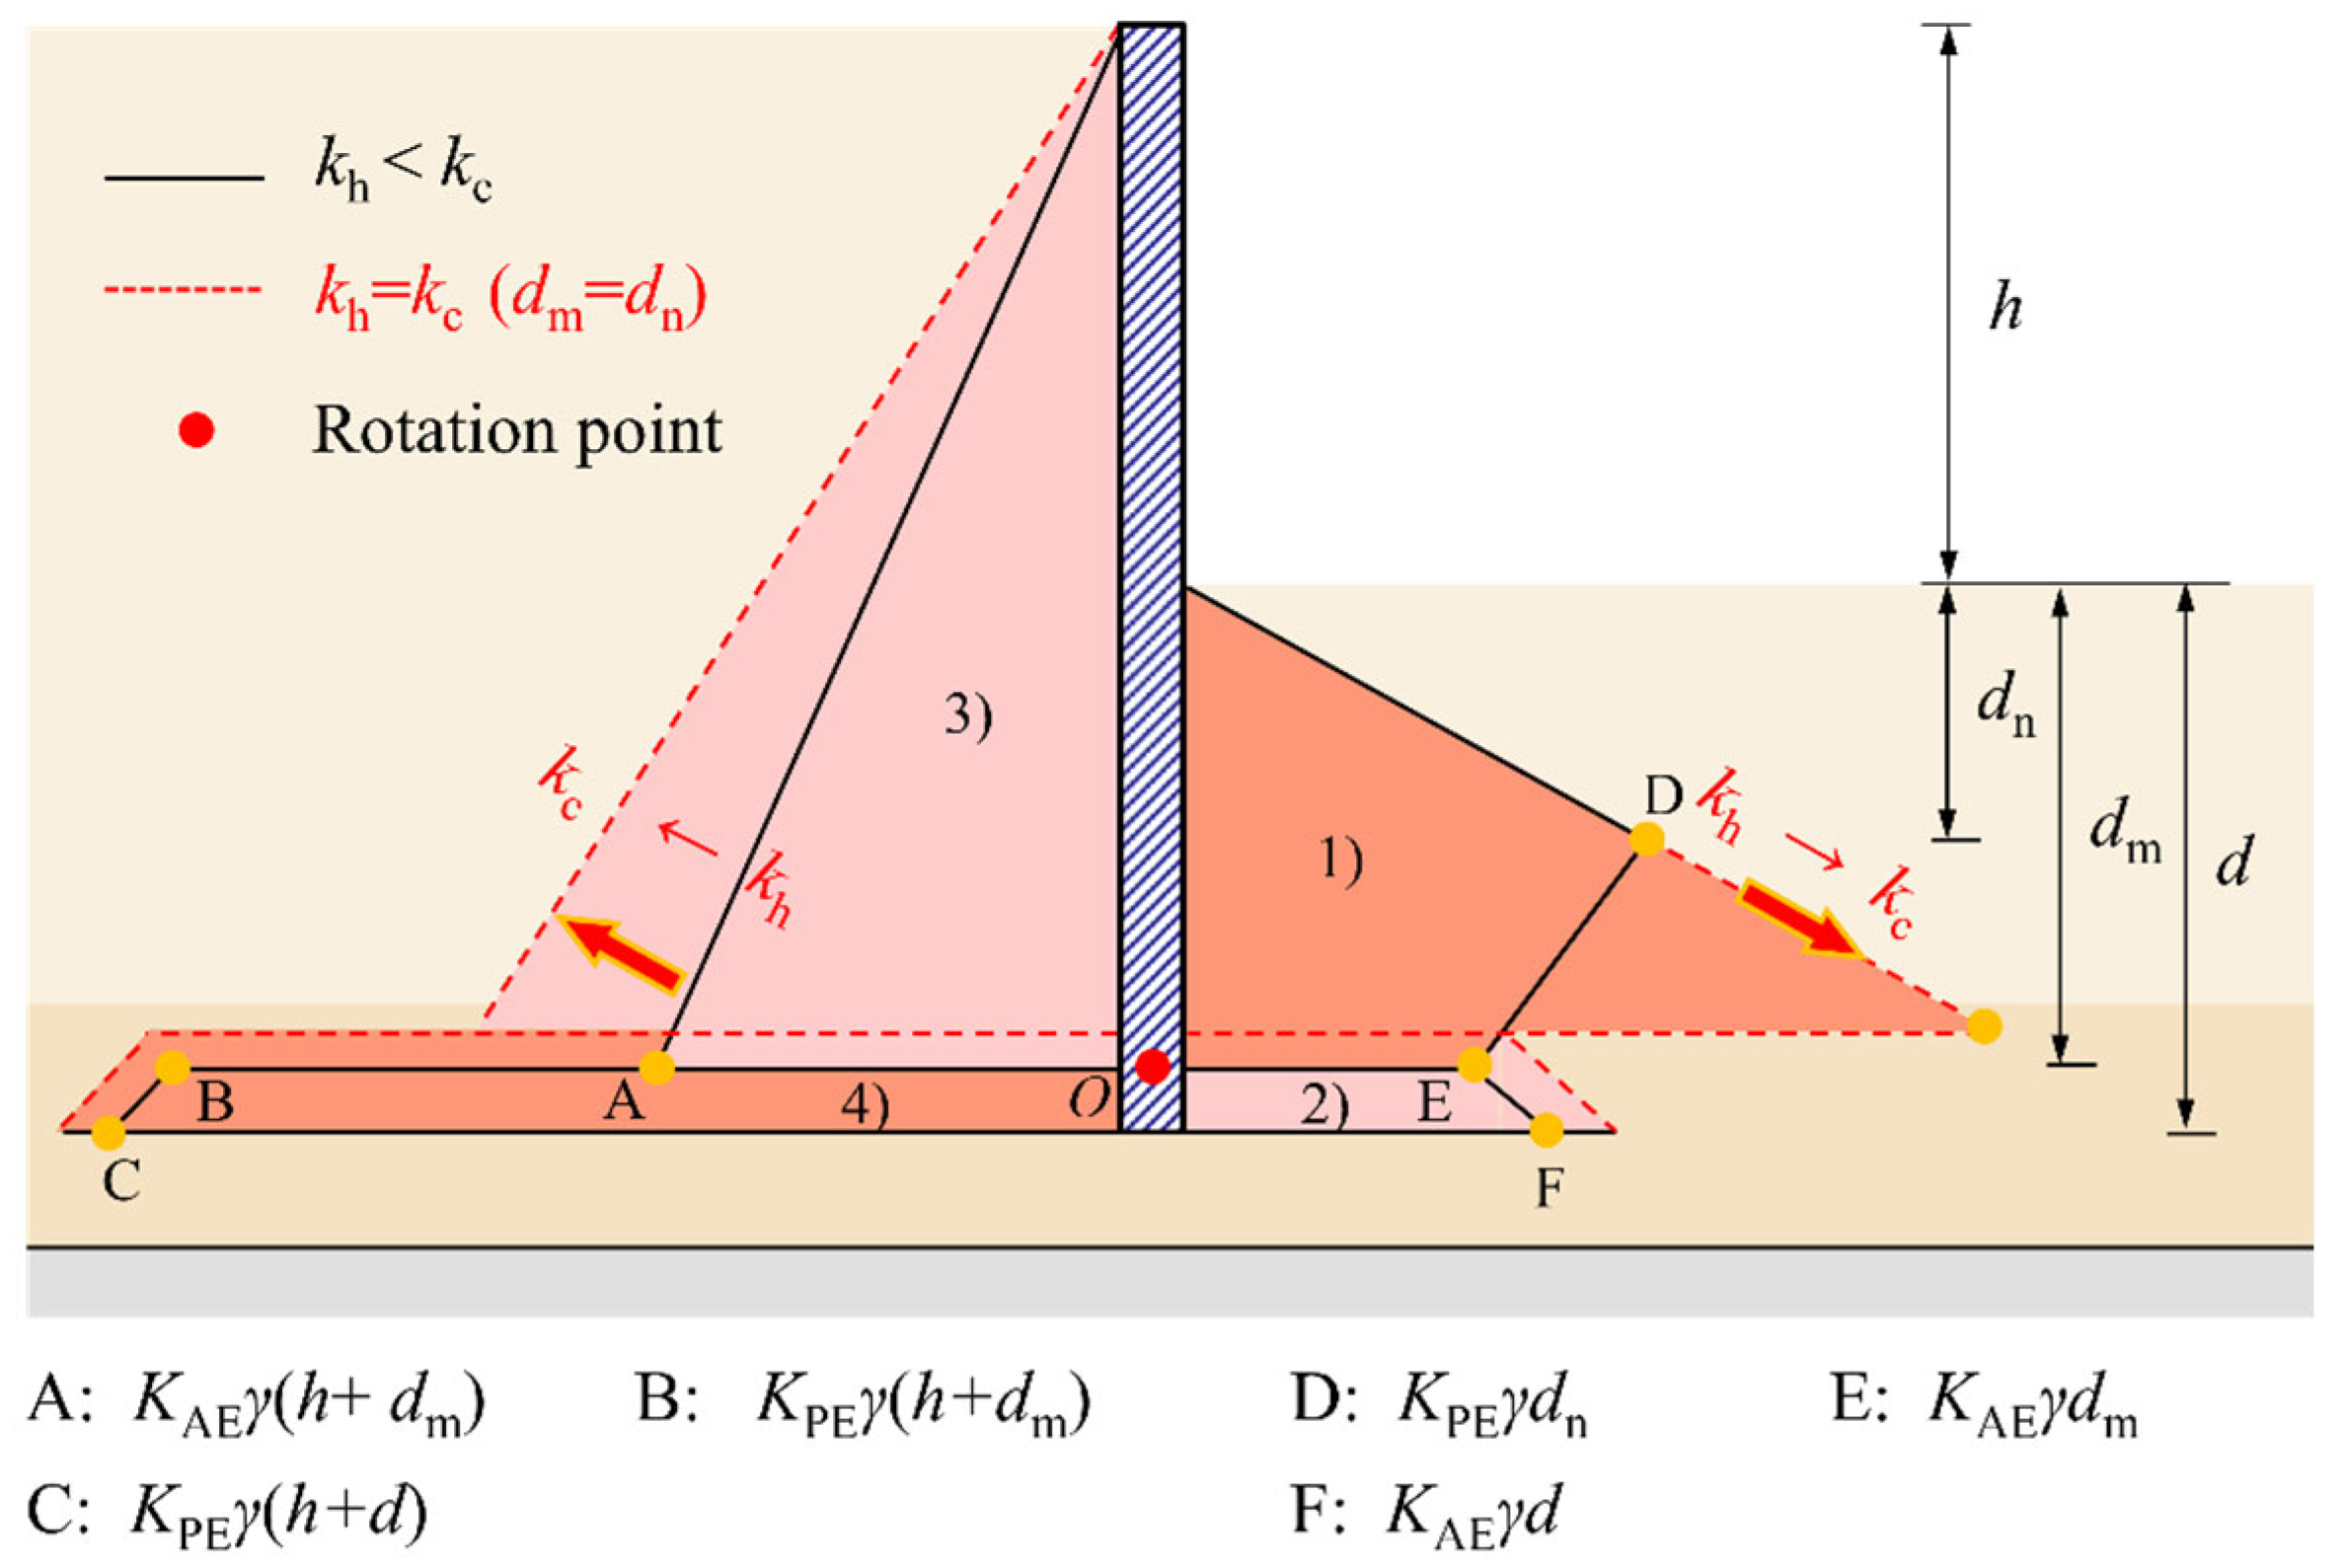
Figure 1. Earth pressure distribution on both sides of the sheet pile wall under seismic loading.
Jmse 13 01752 g001
Figure 2. Relationship between the number of loading cycles and cyclic shear stress on the CRR curve.
Jmse 13 01752 g002
Figure 3. Schematic diagram of equivalent number of cycles principle.
Jmse 13 01752 g003
Figure 4. Residual pore pressure of different teams in the LEAP-RPI-2020 Project.
Jmse 13 01752 g004
Figure 5. Stress distribution of the sheet pile wall in a saturated site under seismic loading: (a) distribution of earth pressure; (b) distribution of excess pore pressure.
Jmse 13 01752 g005
Figure 6. Model geometry and sensor layout (model scale).
Jmse 13 01752 g006
Figure 7. Comparison between the target motion and the achieved motion.
Jmse 13 01752 g007
Figure 8. Growth patterns of residual pore pressure at varying depths.
Jmse 13 01752 g008
Figure 9. Comparison between the wall rotation and the achieved motion in ZJU5. (a) Throughout the shaking process; (b) In the 0–5 s shaking period.
Jmse 13 01752 g009
Figure 10. Comparison between the wall rotation and the achieved motion in ZJU6. (a) Throughout the shaking process; (b) In the 0–5 s shaking period.
Jmse 13 01752 g010
Figure 11. Comparison of the bending moment diagrams of the sheet pile wall in the static and limit states.
Jmse 13 01752 g011
Figure 12. Comparison between the test results and the calculation results.
Jmse 13 01752 g012
Figure 13. Comparison of the wall bending moment in the limit state under different reference cycle numbers.
Jmse 13 01752 g013
Figure 14. Evolution of the wall bending moment from a static to a limit state.
Jmse 13 01752 g014
Figure 15. The bending moment of the wall in the limit state, considering and neglecting the dynamic water pressure.
Jmse 13 01752 g015
Table 1. Scaling law of centrifuge model.
ParameterModel/PrototypeParameterModel/Prototype
AccelerationNUnit weightN
Length1/NForce1/N2
FrequencyNBending moment1/N3
Strain1ViscosityN
Density1Velocity1
Stress1Time1/N
Table 2. Material parameters of the sheet pile wall model.
MaterialThickness t
(mm)
Density ρ
(kg/m3)
Elastic Modulus
E (Gpa)
Poisson
Ratio
6063 aluminum alloy42800690.31
Table 3. Relative densities at different locations of two models.
TestLocationRelative Density (%)
1.5 m2.0 m2.5 m3.0 m
ZJU5CPT-158606264
CPT-260626065
ZJU6CPT-165706465
CPT-263626465
Table 4. Calculation procedure for the degree of site damage in ZJU5.
iαCSRiNi0.5/NiSUM
10.0050.006251.50 × 1073.32 × 10−80
2−0.050.062511024.70.00050.0005
30.160.200048.00.0620.063
4−0.180.225054.90.1010.164
50.170.212556.30.0800.244
6−0.1950.243803.50.1420.386
70.1650.206307.10.0710.457
Table 5. Calculation procedure for the degree of site damage in ZJU6.
iαCSRiNi0.5/NiSUM
10.030.0375186095.81 × 10−50
2−0.060.075024790.0010.001
30.180.225054.90.1010.102
4−0.20.250063.20.1570.259
50.1050.1312846.60.0110.270
6−0.090.1125288.50.0060.276
70.0750.09377189.20.0030.279
Disclaimer/Publisher’s Note: The statements, opinions and data contained in all publications are solely those of the individual author(s) and contributor(s) and not of MDPI and/or the editor(s). MDPI and/or the editor(s) disclaim responsibility for any injury to people or property resulting from any ideas, methods, instructions or products referred to in the content.