Abstract
Piles are common support elements for marine and coastal structures. The scour around pile foundations caused by currents is a major threat to the stability and safety of these structures. The empirical equations commonly used for estimating the equilibrium scour depth around pile groups are limited in their predicative capability, especially when the current approaches the pile group at an angle. This study applies a Multi-Layer Perceptron Backpropagation (MLP/BP) neural network to develop a general model for predicting the local maximum equilibrium scour depth around pile groups in steady currents. The input parameters for the model include all relevant non-dimensional hydrodynamic and structural variables taking full account of the effects of the pile group arrangement and its orientation relative to the approaching current. The model’s performance was evaluated by comparing its predictions against those generated by multiple other machine learning methods, as well as against results from widely used empirical formulas. A comprehensive sensitivity analysis is carried out to determine the importance ranking of the input parameters on model accuracy.
1. Introduction
Piles are among the most common foundation forms for river and marine structures in coastal and ocean engineering such as bridges, jetties and piers, offshore oil platforms and wind turbines. However, due to the interactions of the current, piles and erodible sediment bed, scour holes can form around the piles which is known to be one of the main risks of structural instability and damage. Therefore, local scour depth is an important parameter in the stability design of these structures and requires accurate prediction.
The local scour induced by current is a complex nonlinear hydrodynamic problem. Since 1950s, considerable progress has been made in understanding the scour mechanisms around single piers and a range of methods have been developed to make reliable predictions of either the time development of scour hole or the equilibrium depth [1]. But the same cannot be said about the flow field and scour around pile groups [2,3,4,5]. When piles are in close proximity to each other, the interference between the flows around individual piles will result in the formation of complex flow patterns and make the pile groups more susceptible to local scour than single piles. Hannah [6] studied the scour depth around pile groups with different configurations and discussed the effects of the number of piles perpendicular to and align with the flow direction. It was found that the number of piles in the flow direction has little effect on the maximum scour depth, while increasing the number of piles perpendicular to the flow increases the scour depth. This effect diminishes with increasing pile spacing. Ataie-Ashtiani and Beheshti [2] conducted extensive experiments on different pile group configurations and investigated the relationship between the scour depth and the number of piles parallel and perpendicular to the flow direction. They proposed to add a correction factor related to the relative distance between piles to the equation proposed by Richardson and Davis [7]. Amini et al. [8] studied local clear water scour around rectangular arranged pile groups in steady current and assessed the effects of different pile group arrangements, pile spacing, and submergence ratios. Lança et al. [9] conducted a series of experiments on rectangular arranged pile groups and showed that pile group configurations, including pile spacing, skew angle of the current, and the numbers and arrangement of piles can result in very different scour patterns as well as equilibrium scour depths.
In design practice, up until now, the most commonly used methods for predicting the maximum equilibrium scour depth around pile groups is to adopt the existing single-pile scour formulae and substitute an effective pile diameter to account for the pile group effects, such as HEC-18 formula [7] and that of Sheppard and Renna [10] who introduced the concept of effective width to substitute the pier diameter in Sheppard et al.’s [11] formula. The skew angle affects the calculations of both the effective pile diameter and the relevant correction coefficient that are dependent on the skew angle which makes the empirical formulae highly nonlinear. Baghbadorani et al. [1] conducted a comprehensive review of existing empirical formulas, including those mentioned earlier as well as additional approaches that do not rely on the concept of effective diameter but correlate scour depth with basic pile group geometrical parameters using conventional regression analysis Nevertheless all these works have identified the pile gap-to-diameter ratio as the most important parameter in determining the maximum equilibrium scour depth while the pile number ratio and the skew angle significantly alter the morphology of the scour hole and the maximum scour depth through its influence on the effective diameter or correction coefficients. In recent decades, sophisticated numerical models based on full description of the flow and sediment transport processes have also been developed to simulate scour depth around pile groups [4,12,13] but they are generally time consuming especially when large number of closely placed piles are involved in the pile group.
In recent years, with the rapid advancement of artificial intelligence, various machine learning methods have been applied to predict the scour at hydraulic structures. Mohammadpour et al. [14] and Choi et al. [15] employed artificial neural networks (ANNs) and adaptive neuro-fuzzy inference systems (ANFIS) to predict scour depths around abutments and bridge piers. Hoang et al. [16] applied support vector regression (SVR) technology to estimate the local scour depth around complex pier foundations. Abdollahpour et al. [17] used gene expression programming (GEP) and support vector machine (SVM) to predict the scour depth and scour length downstream of W-weir structures. Sharafati et al. [18] predicted the scour depth downstream of weirs by combining ANFIS with various optimization algorithms. Ali et al. [19] and Rathod et al. [20] predicted the local scour depth around bridge piers, utilizing ANNs and GEP, respectively. All these works demonstrated that Machine Learning (ML) provides an attractive alternative to the traditional methods as it is capable of learning the intricate and highly nonlinear relationships between inputs and outputs. Although the primary aim of applying ML methods is to develop an accurate and efficient prediction tool for scour depth estimates during preliminary design stages, the determination of the key influence parameters through sensitivity analysis could also inform related process-based research.
Various ML techniques have been applied to predict flow-induced scour around pile groups [21,22,23,24,25]. Zounemat-Kermani et al. [3] developed three models—including the Feed-Forward Backpropagation Neural Network (FFBP-NN), Radial Basis Function Neural Network (RBF-NN), and Adaptive Neuro-Fuzzy Inference System (ANFIS) to predict the equilibrium scour depth around pile groups under the action of current. They found that the FFBP-NN model achieved greater prediction accuracy. Recently, Samadi et al. [21] applied three techniques, MARS, CART, and ANN to predict pile group scour depth under the influence of current and demonstrated that ANN generally achieves higher prediction accuracy. In this work, they used non-dimensional parameters included pile Reynolds number, Froude number, relative water depth, relative particle size, relative velocity, the number of piles parallel to the flow, the number of piles perpendicular to the flow, and pile spacing-to-diameter ratio. The preceding discussions indicate that machine learning methods have been increasingly applied to predict the local equilibrium scour depth of pile foundations, all showing promising prediction potential. However, none of the existing pile group models have considered the effects of skew angle of the current to the pile group which has been shown to be important [26,27].
This study applies a Multi-Layer Perceptron Backpropagation Neural Network (MLP/BP) method to predict the local maximum equilibrium scour depth around pile groups in steady currents. For the first time, the approach angle of the current, which significantly affects scour depth when the pile spacing is less than four to five times the pile diameter, is explicitly considered. A sensitivity analysis through input feature elimination is performed to determine the relative importance of each input parameters on the model’s prediction accuracy.
2. Method and Dataset Used
2.1. Architecture of the ANN Model
Artificial neural networks (ANNs) are a flexible mathematical framework capable of representing complex nonlinear functions associated with various input and output datasets. The multi-layer perceptron (MLP) is one of the most commonly used neural network architectures. In this study, a model for predicting the maximum local equilibrium scour depth under the influence of current around pile groups are developed using the feed-forward neural network, specifically the MLP, with backpropagation (BP) for training.
A feed-forward neural network consists of an input layer, one or more hidden layers, and an output layer, with information flowing unidirectionally from the input layer to the output layer without feedback connections. The BP algorithm utilizes gradient descent as the learning rule, adjusting the network’s weights and biases through backpropagation in order to minimize the output error. The basic architecture of the MLP model is shown in Figure 1.
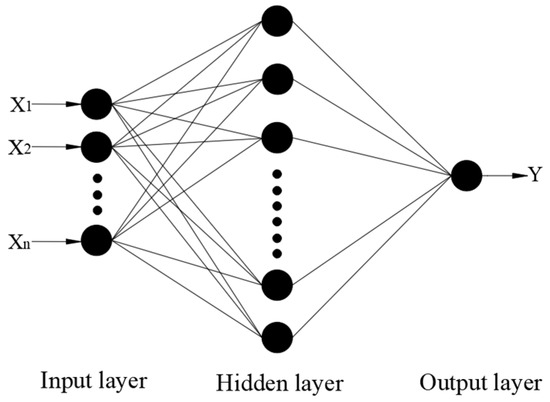
Figure 1.
Basic architecture of MLP model.
Data (X1, X2, …, Xn) are first fed into the network via the input layer. The hidden layers, situated between the input and output layers, contain neurons that process weighted inputs from the preceding layer using an activation function to generate their outputs. The multilayer perceptron then takes the outputs from the last hidden layer and produces a final prediction (Y) at the output layer. The complexity of the network is influenced by the number of hidden layers which need to be optimized depending on the data used.
2.2. Parameters Selection and Data Collection
The local equilibrium scour depth for a group of uniform and non-submerged vertical circular piles on non-cohesive sediments can be described as a functional relationship by Equation (1) which contains all independent parameters that could potentially affect the local equilibrium scour.
where D is the pile diameter, U is the average flow velocity, h is the water depth, D50 is the median particle diameter of the sediment, Uc is the critical value of U associated with initiation of motion of particles on bed surface, v is the kinematic viscosity, and g is the gravitational acceleration, the scour depth S here refers to the maximum equilibrium scour depth of the pile group. There are four independent parameters, G, m, n and α which account for the full effects of the pile groups as shown in Figure 2. G is the constant distance between adjacent pile edges in the orthogonal coordinate frame which has a skew angle of α with the incoming current defined as positive in clockwise rotation. m and n are the numbers of piles in the two orthogonal directions in the pile patch which leads to α = 0° when n piles are arranged in columns perpendicular to the flow. The essential effects of the proximity of piles are that the streamlines between upstream piles are contracted, and the horseshoe vortices that form in front of the upstream piles interfere with each other in the space between the two piles [28]. In the wake region between inline piles, sheltering effect reduces streamwise velocity [29]. Both processes are affected by the approach angle.
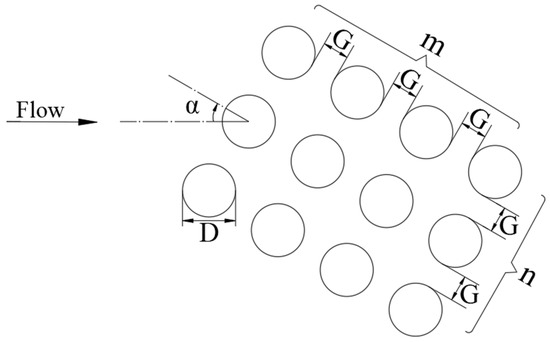
Figure 2.
Configurations of the pile group used.
In engineering practice, formulas are typically expressed in nondimensional form because the nondimensional parameters have clear physical significance. This formulation enhances reliability when extrapolating results. Through dimensional analysis, the functional relationship can be expressed in a non-dimensional form as:
where Re = UD/v represents the Reynolds number for the pile, and Fr = U/(gh)0.5 represents the Froude number, m/n and α represent the arrangement of the piles and the skew angle with the current. Equation (2) has eight non-dimensional parameters, all of which are included as the input parameters to the ANN with the relative scour depth S/D as the output.
Most existing data are for flow with zero angle of attack for approach flow as discussed in a review by Amini Baghbadorani et al. [1]. Through a thorough search of open literature we are able to identify 126 experimental datasets from Amini et al. [8], Lança et al. [9], and Qi et al. [19]. Amini et al. [8] investigated the local scour around pile groups with various rectangular arrangements including 2 × 2, 3 × 5, 2 × 4, and 3 × 4 configurations. Lança et al. [9] examined the effects of various pile spacing, skew angles, and numbers of pile columns, with the pile configurations as presented in Figure 2. Qi et al. [26] focused only on the effects of different orientations for double pile arrangements. The sources and ranges of the data (126 in total) used for the pile groups are provided in Table 1. The non-dimensional data ranges are shown in Table 2. As a comparison, Zounemat-Kermani et al. [3] and Samadi et al. [21] developed their ML models based on 124 and 156 datasets, respectively, all for unidirectional aligned flow.

Table 1.
Data sources and original parameter ranges.
Table 2.
The data range of non-dimensional parameters.
These experimental data are separately divided into training and testing samples. The training samples are used to train the parameters of the neural network model, while the testing samples are employed to evaluate the model’s generalization ability and actual predictive performance. The training and testing samples account for 75% and 25% of the total data, respectively. To ensure the validity of the testing results, the training and testing samples are randomly selected from the entire dataset.
3. ANN Model Development
3.1. Model Structure
In constructing the neural network model, the number of neurons in the input layer is consistent with the number of input features, and the output layer consists of a single neuron. In the input parameters affecting scour depth are standardized to ensure that the data exhibits zero mean and unit variance which allows the model to learn and train more efficiently. The standardization formula used in this study is as follows:
where Z is the standardized data, X is the original data, μ is the mean of the original data, and is the standard deviation of the original data.
The number of hidden layers and the number of neurons in each hidden layer are determined through the Optuna hyperparameter optimization framework [30], which explores combinations of hyperparameters within a defined search space. The performance is evaluated by the objective function (minimizing test loss) to identify the optimal configuration. Hyperparameter tuning for the neural network is conducted through multiple trials to select the best hyperparameters, which are then used to rebuild and train the model, with final performance evaluation.
During the neural network prediction process, the hidden layers receive the data and compute the results using the pre-constructed multi-layer perceptron (MLP/BP) model, passing the output to the output layer, which predicts the scour depth. The predicted values are compared with the actual sample values, and the weights of the hidden layers are iteratively updated until the training concludes. The activation function in the hidden layers is the ReLU function, which maps negative values to zero and retains positive values. The Adam optimizer, which adapts the learning rate during training, is selected to control the training speed. L2 regularization is employed to prevent model overfitting. If the learning rate is set too high, it may cause the model to fail to converge, while a learning rate set too low could result in slow convergence or failure to complete the learning process.
Through a large amount of trial and error to minimize the training errors, the pile group local scour depth prediction model with non-dimensional inputs is finally structured as a four-layer network, with an input layer of 8 neurons (representing pile Reynolds number, relative water depth, relative median particle diameter, Froude number, relative flow intensity, gap-to-diameter ratio, pile number ratio, and skew angle), two hidden layers with 33 and 21 neurons, respectively, and an output layer with 1 neuron (representing the predicted relative scour depth). An initial learning rate of lr = 0.001 is decided upon after repeated experimentations and the model is able to achieve small stable errors and high fitting accuracy after approximately 200 iterations.
3.2. Statistical Metrics
To evaluate the predictive performance of the model, this study employs three evaluation metrics: Mean Absolute Error (MAE), Root Mean Square Error (RMSE), and the Coefficient of Determination (R2). The MAE represents the average of the absolute differences between the predicted and actual values, while the RMSE is the square root of the mean squared error. Both MAE and RMSE values indicate stronger predictive ability when they are smaller. The R2 metric measures the degree of fit between the predicted and actual values, with values closer to 1 indicating better model fit. The formulae for these metrics are as follows:
where the true value of the i-th sample, is the predicted value of the i-th sample, is the mean of the true values, and n is the number of data samples. The neural network model that minimizes both error metrics (MAE and RMSE) and maximizes the R2 value is selected as the final model.
4. Results and Discussion
4.1. Training and Testing of the ANN Model
During the training process of the neural network model, the weights are typically initialized randomly, meaning that the initial weights of the model differ with each training session. Due to these variations in the initial weights, the model may converge to different local optima after each training, resulting in multiple stable states. In this study, each network model is repeated at least 10 times, and the model with the best predictive performance is selected. No outlier removal or filtering was performed on the data prior to training. The training dataset consists of 94 samples, while the remaining 32 samples are used for prediction.
Figure 3 shows a comparison of the predicted scour depth by the model and the experimental measurements. As can be seen from Figure 3, the ANN model achieves a training set fitting accuracy and mean absolute error of 0.96956 and 0.19641, respectively, while the testing set also attains high predictive accuracy, with fitting accuracy and mean absolute error of 0.90745 and 0.40710, respectively.
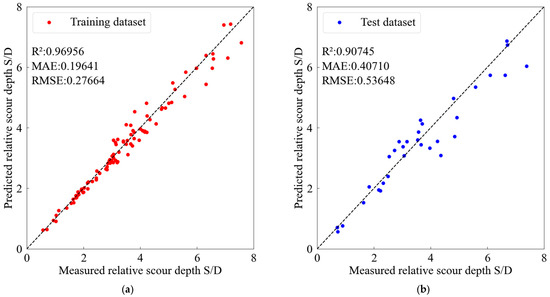
Figure 3.
Comparison of the measured and predicted relative scour depth by the ANN model. (a) Training set; (b) Test set.
4.2. Comparison with Different Machine Learning Models
The adoption of Artificial Neural Networks (ANN) in this study is primarily motivated by their demonstrated superiority over other machine learning methods in predicting equilibrium scour around both single piles and pile groups aligned with currents, as evidenced in previous research. Given the relatively limited dataset size, it is essential to verify the model’s accuracy and robustness. To this end, comparative analyses were conducted using alternative machine learning approaches—namely Support Vector Regression (SVR), Random Forest (RF), and Extreme Gradient Boosting (XGB)—each offering distinct advantages for this application. SVR was chosen for its robustness in high-dimensional spaces and margin-maximization approach, which is particularly effective with limited samples. RF’s inherent feature randomness and ensemble structure help mitigate overfitting risks, often making it more reliable than ANN with sparse training data. XGB was included for its sequential residual correction, which excels in modeling strong nonlinear gradients and frequently outperforms ANN in small-dataset regression tasks.
The SVR algorithm divides values at similar levels into distinct groups using a hyperplane composed of support vectors in multidimensional space [31]. This technique achieves optimal separation by identifying the maximum margin hyperplane, which can determine the linear maximum margin or transform nonlinear relationships into linear expressions using the kernel trick. RF, as an ensemble machine learning model, forms several decision trees, performs voting on the results classified by each tree, and selects the result with the most votes as the final classification result [32]. This algorithm was specifically designed to address the shortcomings of traditional decision trees, utilizing bootstrap sampling to create differentiated training sets while incorporating random variable selection mechanisms. Random forest maximizes the technical advantages of ensemble learning, simultaneously enhancing classification and prediction accuracy while ensuring model stability. XGB is a method that enhances classification performance by combining multiple weak classifiers, employing a tree-based boosting technique [33]. This boosting technique belongs to ensemble methods, which construct multiple weak tree models that learn the residuals of the prediction target for making predictions. All models adopted the same feature scaling and standardized input processing methods as that for the ANN model. Each was rigorously optimized through hyperparameter tuning and evaluated based on predictive accuracy (R2, RMSE), training stability (loss convergence), and generalization capability (train-test deviation). The results are presented in Figure 4, Figure 5 and Figure 6 in the same way as that of the ANN model for easy comparison. It can be seen that all models show consistent performance, with the ANN method exhibiting superior accuracy and stability for the test dataset compared to alternative approaches.
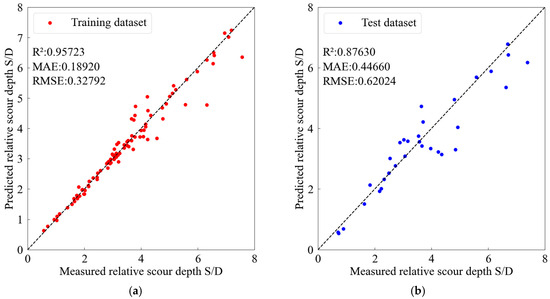
Figure 4.
Comparison of the measured and predicted relative scour depth by the SVM model. (a) Training set; (b) Test set.
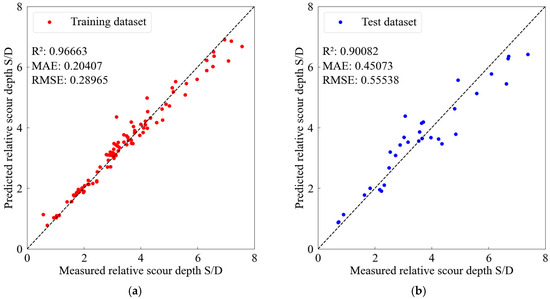
Figure 5.
Comparison of the measured and predicted relative scour depth by the RF model. (a) Training set; (b) Test set.
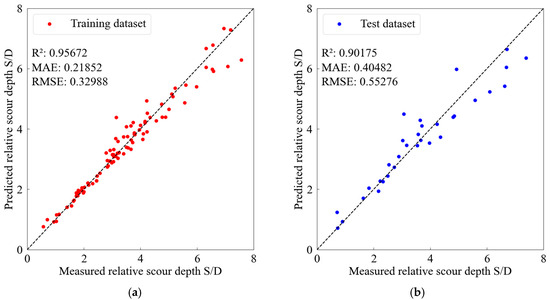
Figure 6.
Comparison of the measured and predicted relative scour depth by the XGB model. (a) Training set; (b) Test set.
The reason is likely that the ANN model can automatically learn through multi-layer nonlinear transformations, so as to better capture the complex nonlinear relationships between the input parameters and scour depth.
4.3. Comparison with Empirical Formulae
In order to evaluate the accuracy of the neural network model in predicting the equilibrium scour depth, a comparison was made with existing empirical formulae using the same test datasets. The commonly used empirical formulae, Arneson et al. [34]/HEC-18 (Equation (7)) and Sheppard and Renna [10]/FDOT (Equation (8)), are selected both of which have the pile diameter replaced by the equivalent pile diameter D*. The HEC-18 equation is:
where , K1 is the correction factor for pier nose shape and equals to 1 for circular piles. is the correction factor for angle of attack (L is the length of pile group and is the width of pile group), K3 is the correction factor for bed conditions and is set to 1.1 for sand bed, K4 is the correction factor for armoring by bed material size and is 1 as the test data are all for flat sand bed, D* is the effective width, Dp is sum of the non-overlapping projected widths of piles [35], Ksp is the correction factor for the pile spacing, Ksp = 1 − 4/3[1 − 1/(Dp/D)][1 − (s/D)−0.6], s is the pile spacing representing the center-to-center distance between two piles, Km is the correction factor for the number of piles in-line with the flow, Km = 0.9 + 0.1m − 0.0714(m − 1)[2.4 − 1.1(s/D) + 0.1((s/D)2].
The FDOT equation is
where , D* is the effective width, Km is the correction factor for the number of piles in-line with the flow, Ksp is the correction factor for the pile spacing, Ksh is the shape factor(1 for circular pile) and Dp is the sum of projected width. The method for calculating the sum of projected width and Ksp are the same as that in the HEC-18 procedure. The correction for the number of piles in-line with the flow is calculated by:
It is of interest to note that these formulae contain either Fr or Uc but not both, the reason being that these two parameters are usually strongly correlated (but not perfectly as the former depends on mean flow properties while the latter is also related to sediment size and turbulence).
The scatter plot shown in Figure 7 compares the measured and calculated values of the relative scour depth (S/D) using the single pile and pile group empirical formulae.
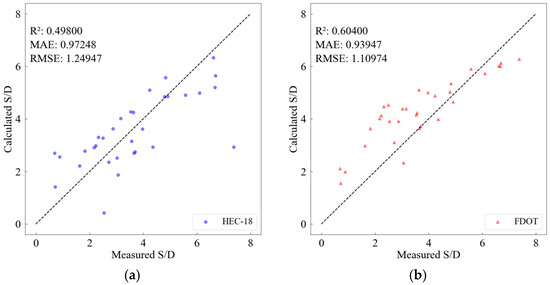
Figure 7.
Comparison between the measured and calculated values of the empirical formulae. (a) HEC-18; (b) FDOT.
From Figure 7, the fitting accuracy and mean absolute error of HEC-18 are 0.49800 and 0.97248, respectively. Although the calculated values are relatively concentrated, some points remain far from the distribution. The fitting accuracy and mean absolute error of FDOT are 0.60400 and 0.93947, respectively, indicating a potential risk of overestimation in this formula. In contrast, the fitting accuracy and mean absolute error of the ANN model are 0.90745 and 0.40710, respectively, demonstrating that the ANN model can provide higher predictive accuracy than the traditional empirical formulas.
4.4. Sensitivity Analysis
To assess the influence of input variable on the prediction accuracy, a sensitivity analysis was conducted for each input variable of the model. This test involves systematically removing one of the variables and rebuilding the neural network model. The modified models are then used to predict the scour depths and compared with the results from the complete inputs. The results are presented in Table 3. As it can be seen, the pile gap-to-diameter ratio has the greatest impact on the model’s prediction results, followed by the pile number ratio and the skew angle. These are broadly consistent with the available empirical knowledge.
Table 3.
Sensitivity analysis.
5. Conclusions
This study applied machine learning methods to predict the local maximum equilibrium scour depth around pile groups under the action of steady currents. An ANN model with non-dimensional variables was developed and its performance is compared with the results from a number of other machine learning models and widely used empirical formulae. The following conclusions are drawn:
- The inclusion of the skew angle in the ANN model extends its range of applications, enabling the model performance to be assessed more fully against the empirical formulae.
- The ANN-based methods can be effectively used to predict local equilibrium scour depth in steady currents for pile groups, achieving prediction accuracy much higher than that of the conventional empirical formulae as measured by the Mean Absolute Error (MAE), Root Mean Square Error (RMSE), and Coefficient of Determination (R2).
- The sensitivity analysis reveals that the ratio of gap to diameter has the greatest influence, followed by the pile number ratio and the skew angle, which are consistent with the experimental knowledge of the maximum scour behavior around pile groups.
- The use of laboratory data only for model training and testing is recognized as a limitation of the work, which is due to the lack of prototype data for the conditions considered. To strengthen model validation, expanding the existing database to encompass both laboratory and field conditions is critically needed.
Author Contributions
Data compilation, Writing—original draft, Model development, Computation and analysis, X.Z. (Xinao Zhao); Conception of the study, Methodology, Supervision, P.D.; Supervision, Review and Editing, Resources, Project administration, Y.L.; Review and Editing, Y.Z.; Checking and Model validation, X.Z. (Xiaoying Zhao); Resources and Editing, Q.W.; Review and Editing, C.Z. All authors have read and agreed to the published version of the manuscript.
Funding
This research is financially supported by the National Natural Science Foundation of China (Youth Project, Grant No. 52401329), the Shandong Provincial Natural Science Foundation (Youth Project, Grant No. ZR2023QE310), the National Natural Science Foundation of China (Key Project, Grant No. 42330406) and the Shandong Provincial Lab and Talent Program (“Double Hundred Plan for Oversees Experts” Talent Category, Grant No. WSR2023026).
Data Availability Statement
The raw data supporting the conclusion of this article will be made available by the authors on request.
Conflicts of Interest
The authors declare no conflicts of interest.
References
- Baghbadorani, D.A.; Beheshti, A.A.; Ataie-Ashtiani, B. Scour hole depth prediction around pile groups: Review, comparison of existing methods, and proposition of a new approach. Nat. Hazards 2017, 88, 977–1001. [Google Scholar] [CrossRef]
- Ataie-Ashtiani, B.; Beheshti, A.A. Experimental investigation of clear-water local scour at pile groups. J. Hydraul. Eng. 2006, 132, 1100–1104. [Google Scholar] [CrossRef]
- Zounemat-Kermani, M.; Beheshti, A.A.; Ataie-Ashtiani, B.; Sabbagh-Yazdi, S.R. Estimation of current-induced scour depth around pile groups using the neural network and adaptive neuro-fuzzy inference system. Appl. Soft Comput. 2009, 9, 746–755. [Google Scholar] [CrossRef]
- Zhang, Q.; Zhou, X.L.; Wang, J.H. Numerical investigation of local scour around three adjacent piles with different arrangements under current. Ocean Eng. 2017, 142, 625–638. [Google Scholar] [CrossRef]
- Yang, Y.; Qi, M.; Wang, X.; Li, J. Experimental study of scour around pile groups in steady flows. Ocean Eng. 2020, 195, 106651. [Google Scholar] [CrossRef]
- Hannah, C.R. Scour at Pile Groups; Research Report No. 28-3; Civil Engineering Department, University of Canterbury: Christchurch, New Zealand, 1978. [Google Scholar]
- Richardson, E.V.; Davis, S.R. Evaluating Scour at Bridges Report; Federal Highway Administration, Office of Bridge Technology: Washington, DC, USA, 2001. [Google Scholar]
- Amini, A.; Melville, B.W.; Ali, T.M.; Ghazali, A.H. Clear-water local scour around pile groups in shallow-water flow. J. Hydraul. Eng. 2012, 138, 177–185. [Google Scholar] [CrossRef]
- Lança, R.; Fael, C.; Maia, R.; Pêgo, J.P.; Cardoso, A.H. Clear-water scour at pile groups. J. Hydraul. Eng. 2013, 139, 1089–1098. [Google Scholar] [CrossRef]
- Sheppard, D.M.; Renna, R. Bridge Scour Manual; Florida Department of Transportation: Tallahassee, FL, USA, 2005. [Google Scholar]
- Sheppard, D.M.; Odeh, M.; Glasser, T. Large scale clear-water local pier scour experiments. J. Hydraul. Eng. 2004, 130, 957–963. [Google Scholar] [CrossRef]
- Saghravani, S.F.; Azhari, A. Simulation of clear water local scour around a group of bridge piers using an Eulerian 3D, two-phase model. Prog. Comput. Fluid Dyn. 2012, 12, 333–341. [Google Scholar] [CrossRef]
- Lin, Y.; Lin, C. Scour effects on lateral behavior of pile groups in sands. Ocean Eng. 2020, 208, 107420. [Google Scholar] [CrossRef]
- Mohammadpour, R.; Ghani, A.A.; Vakili, M.; Sabzevari, T. Prediction of temporal scour hazard at bridge abutment. Nat. Hazards 2016, 80, 1891–1911. [Google Scholar] [CrossRef]
- Choi, S.U.; Choi, B.; Lee, S. Prediction of local scour around bridge piers using the ANFIS method. Neural Comput. Appl. 2017, 28, 335–344. [Google Scholar] [CrossRef]
- Hoang, N.D.; Liao, K.W.; Tran, X.L. Estimation of scour depth at bridges with complex pier foundations using support vector regression integrated with feature selection. J. Civ. Struct. Health Monit. 2018, 8, 431–442. [Google Scholar] [CrossRef]
- Abdollahpour, M.; Dalir, A.H.; Farsadizadeh, D.; Shiri, J. Assessing heuristic models through k-fold testing approach for estimating scour characteristics in environmental friendly structures. ISH J. Hydraul. Eng. 2019, 25, 239–247. [Google Scholar] [CrossRef]
- Sharafati, A.; Haghbin, M.; Asadollah, S.B.H.S.; Tiwari, N.K.; Al-Ansari, N.; Yaseen, Z.M. Scouring depth assessment downstream of weirs using hybrid intelligence models. Appl. Sci. 2020, 10, 3714. [Google Scholar] [CrossRef]
- Ali, A.S.A.; Günal, M. Artificial neural network for estimation of local scour depth around bridge piers. Arch. Hydroeng. Environ. Mech. 2021, 68, 87–101. [Google Scholar] [CrossRef]
- Rathod, P.; Manekar, V.L. Gene expression programming to predict local scour using laboratory and field data. ISH J. Hydraul. Eng. 2022, 28, 143–151. [Google Scholar] [CrossRef]
- Samadi, M.; Afshar, M.H.; Jabbari, E.; Sarkardeh, H. Prediction of current-induced scour depth around pile groups using MARS, CART, and ANN approaches. Mar. Georesour. Geotec. 2021, 39, 577–588. [Google Scholar] [CrossRef]
- Sreedhara, B.M.; Rao, M.; Mandal, S. Application of an evolutionary technique (PSO-SVM) and ANFIS in clear-water scour depth prediction around bridge piers. Neural Comput. Appl. 2019, 31, 7335–7349. [Google Scholar] [CrossRef]
- Azimi, H.; Bonakdari, H.; Ebtehaj, I.; Talesh, S.H.A.; Michelson, D.G.; Jamali, A. Evolutionary Pareto optimization of an ANFIS network for modeling scour at pile groups in clear water condition. Fuzzy Sets Syst. 2017, 319, 50–69. [Google Scholar] [CrossRef]
- Najafzadeh, M. Neuro-fuzzy GMDH systems based evolutionary algorithms to predict scour pile groups in clear water conditions. Ocean Eng. 2015, 99, 85–94. [Google Scholar] [CrossRef]
- Bateni, S.M.; Vosoughifar, H.R.; Truce, B.; Jeng, D.S. Estimation of clear-water local scour at pile groups using genetic expression programming and multivariate adaptive regression splines. J. Waterw. Port. Coast. Ocean Eng. 2019, 145, 04018029. [Google Scholar] [CrossRef]
- Qi, W.G.; Li, Y.X.; Xu, K.; Gao, F.P. Physical modelling of local scour at twin piles under combined waves and current. Coast. Eng. 2019, 143, 63–75. [Google Scholar] [CrossRef]
- Nandi, B.; Das, S. Developing new equations for maximum scour depth near tandem, side-by-side, and eccentric piers. Can. J. Civ. Eng. 2025, 52, 1030–1044. [Google Scholar] [CrossRef]
- Ataie-Ashtiani, B.; Aslani-Kordkandi, A. Flow field around side-by-side piers with and without a scour hole. Eur. J. Mech. B Fluids 2012, 36, 152–166. [Google Scholar] [CrossRef]
- Ataie-Ashtiani, B.; Aslani-Kordkandi, A. Flow field around single and tandem piers. Flow Turbul. Combust. 2013, 90, 471–490. [Google Scholar] [CrossRef]
- Akiba, T.; Sano, S.; Yanase, T.; Ohta, T.; Koyama, M. Optuna: A next-generation hyperparameter optimization framework. In Proceedings of the 25th ACM SIGKDD International Conference on Knowledge Discovery & Data Mining, Anchorage, AK, USA, 4–8 August 2019; pp. 2623–2631. [Google Scholar]
- Boser, B.E.; Guyon, I.M.; Vapnik, V.N. A training algorithm for optimal margin classifiers. In Proceedings of the Fifth Annual Workshop on Computational Learning Theory, Pittsburgh, PA, USA, 27–29 July 1992; pp. 144–152. [Google Scholar]
- Breiman, L. Random forests. Mach. Learn. 2001, 45, 5–32. [Google Scholar] [CrossRef]
- Chen, T.; Guestrin, C. Xgboost: A scalable tree boosting system. In Proceedings of the 22nd ACM Sigkdd International Conference on Knowledge Discovery and Data Mining, San Francisco, CA, USA, 13–17 August 2016; pp. 785–794. [Google Scholar]
- Arneson, L.A.; Zevenbergen, L.W.; Lagasse, P.F.; Clopper, P.E. Evaluating Scour at Bridges; No. FHWA-HIF-12-003; National Highway Institute: Washington, DC, USA, 2012. [Google Scholar]
- Sheppard, D.M. Scour at Complex Piers; Finial Report UF: 4910 45-04-799; Florida Department of Transportation: Tallahassee, FL, USA, 2003. [Google Scholar]
Disclaimer/Publisher’s Note: The statements, opinions and data contained in all publications are solely those of the individual author(s) and contributor(s) and not of MDPI and/or the editor(s). MDPI and/or the editor(s) disclaim responsibility for any injury to people or property resulting from any ideas, methods, instructions or products referred to in the content. |
© 2025 by the authors. Licensee MDPI, Basel, Switzerland. This article is an open access article distributed under the terms and conditions of the Creative Commons Attribution (CC BY) license (https://creativecommons.org/licenses/by/4.0/).