1. Introduction
With the continuous reduction in global fishery resources and the serious degradation of marine ecosystems, the urgency and importance of fishery management have become increasingly prominent, and a key issue that needs immediate attention has been raised. In all aspects of fishery management, the supervision and monitoring of fishing vessels is particularly critical. As a basic physical characteristic, the length of fishing vessels is an important basis for the fishery management department to classify, formulate rules, and implement restrictions on fishing vessels. However, at present, the measurement of the size of fishing vessels by the fishing port management department is largely dependent on manual measurement, which leads to low efficiency and difficulty in updating the size information of large fishing vessels in time. Therefore, intelligent measurement and monitoring technology is urgently needed to achieve accurate measurement of the size of large-scale fishing vessels. With the development and popularization of deep learning target detection algorithms and computer measurement technology, new ideas have been brought to this research.
Object detection algorithms based on deep learning are a research hotspot in the field of computer vision, which mainly includes the two-stage object detection algorithm and single-stage object detection algorithm. Among them, the two-stage target detection algorithm first extracts the candidate box according to the image, and then performs secondary correction based on the candidate region to obtain the detection result. The detection accuracy is high, but the detection speed is slow. Common two-stage target detection algorithms include the R-CNN series [
1]. The single-stage target detection algorithm regards the target detection problem as a regression analysis problem of target location and category information, and the detection results can be directly output through a neural network model. Compared with the two-stage detection algorithm, the single-stage detection algorithm does not need to generate candidate regions and can directly extract eigenvalues in the network for target classification and location, so it has higher detection speed. Common single-stage object detection algorithms include SSD [
2], the YOLO series [
3], and RetinaNet [
4]. Among them, the YOLO series algorithm has the characteristics of fast detection speed and high accuracy, which are more suitable for the needs of this study.
At present, many domestic and foreign scholars have applied the target detection algorithm based on deep learning to the identification and tracking of ships. Fang et al. [
5] used YOLOv5 to solve the problem of high false detection rate and missed detection rate of small targets in optical remote sensing images, and proposed an improved method, which significantly improved the detection accuracy of ships, especially small ships, while reducing false detection and missed detection. Sun et al. [
6] introduced a SAR vessel detector bfa-YOLO based on YOLO, which uses bidirectional feature fusion and angle classification to effectively solve the challenge of fast and accurate recognition of multi-scale, arbitrary direction, and dense distributions of blood vessels in SAR images. Wang et al. [
7] proposed a GT-YOLO algorithm based on infrared images to solve the problem of near-shore infrared ship detection, which effectively improved ship recognition performance at night and under inclement weather conditions.
The above work has significantly enhanced ship detection performance and practicability in the field of ship recognition. However, these studies mainly focused on ship identification rather than ship size measurement. Anjanayya et al. [
8] proposed an innovative target size measurement method using OpenCV library and image processing technology, which realized efficient and accurate size estimation and provided a new solution for fishing vessel size measurement. O.E. Apolo-Apolo et al. [
9] proposed an innovative method for estimating citrus fruit size, which integrates UAV remote sensing technology, FasterR-CNN, and LSTM deep learning models and image processing technology to provide accurate estimation of citrus fruit size. This method shows the great potential and application value of the combination of computer vision measurement technology and UAV remote sensing. Han et al. [
10] introduced the SSMA-YOLO model, using YOLOv8-n and UAV remote sensing technology to solve the detection challenges caused by small pixel size and insufficient features of ship satellite remote sensing images. This fusion promotes the development and application of UAV remote sensing technology in the field of ship identification. However, there is still a lack of ship measurement models that combine computer vision measurement technology with UAV remote sensing technology.
Compared with traditional high-point monitoring, the UAV platform has higher mobility [
11,
12], which can better meet the real-time requirements of law enforcement, but it also puts forward more stringent standards for model lightweighting, which has become the core focus of model improvement. Based on an analysis of lightweight networks such as MobileNetV3 [
13], AKConv [
14] and RepGhost [
15], we propose a real-time tracking and size measurement model, YOLO-LFVM, for light fishing vessels based on the improved YOLOv8. The goal of the model is to minimize the growth of the number of parameters while keeping the detection accuracy of the fishing vessel basically unchanged. Specifically, firstly, the MobileNetV3 backbone network is introduced to optimize parameter efficiency through neural architecture search (NAS), which greatly reduces the number of model parameters, but direct migration leads to increases in the small target missed detection rate and rotating ship angle deviation. Subsequently, AKConv dynamic convolution is integrated to enhance multi-scale feature extraction, and the calculation amount is reduced by 28% on the VisDrone-DET2021 dataset, but there are still deficiencies in the suppression of ripple interference in complex sea surface background. Finally, the RepGhost module is introduced to further compress the parameters through reparameterization technology, and combined with the unique color enhancement strategy of the sea scene, the feature identification accuracy under complex sea surface is improved, which provides a new lightweight solution for UAV deployment. Finally, the improved model is combined with UAV remote sensing technology, and the Python script is integrated with OpenCV to measure the size of the fishing vessels in a pixel-by-pixel manner. In order to make full use of the real-time advantages of UAVs, the problem of low efficiency and difficulty in updating the size information of large fishing vessels faced by the current fishing port management department must be solved.
The rest of this paper is organized as follows:
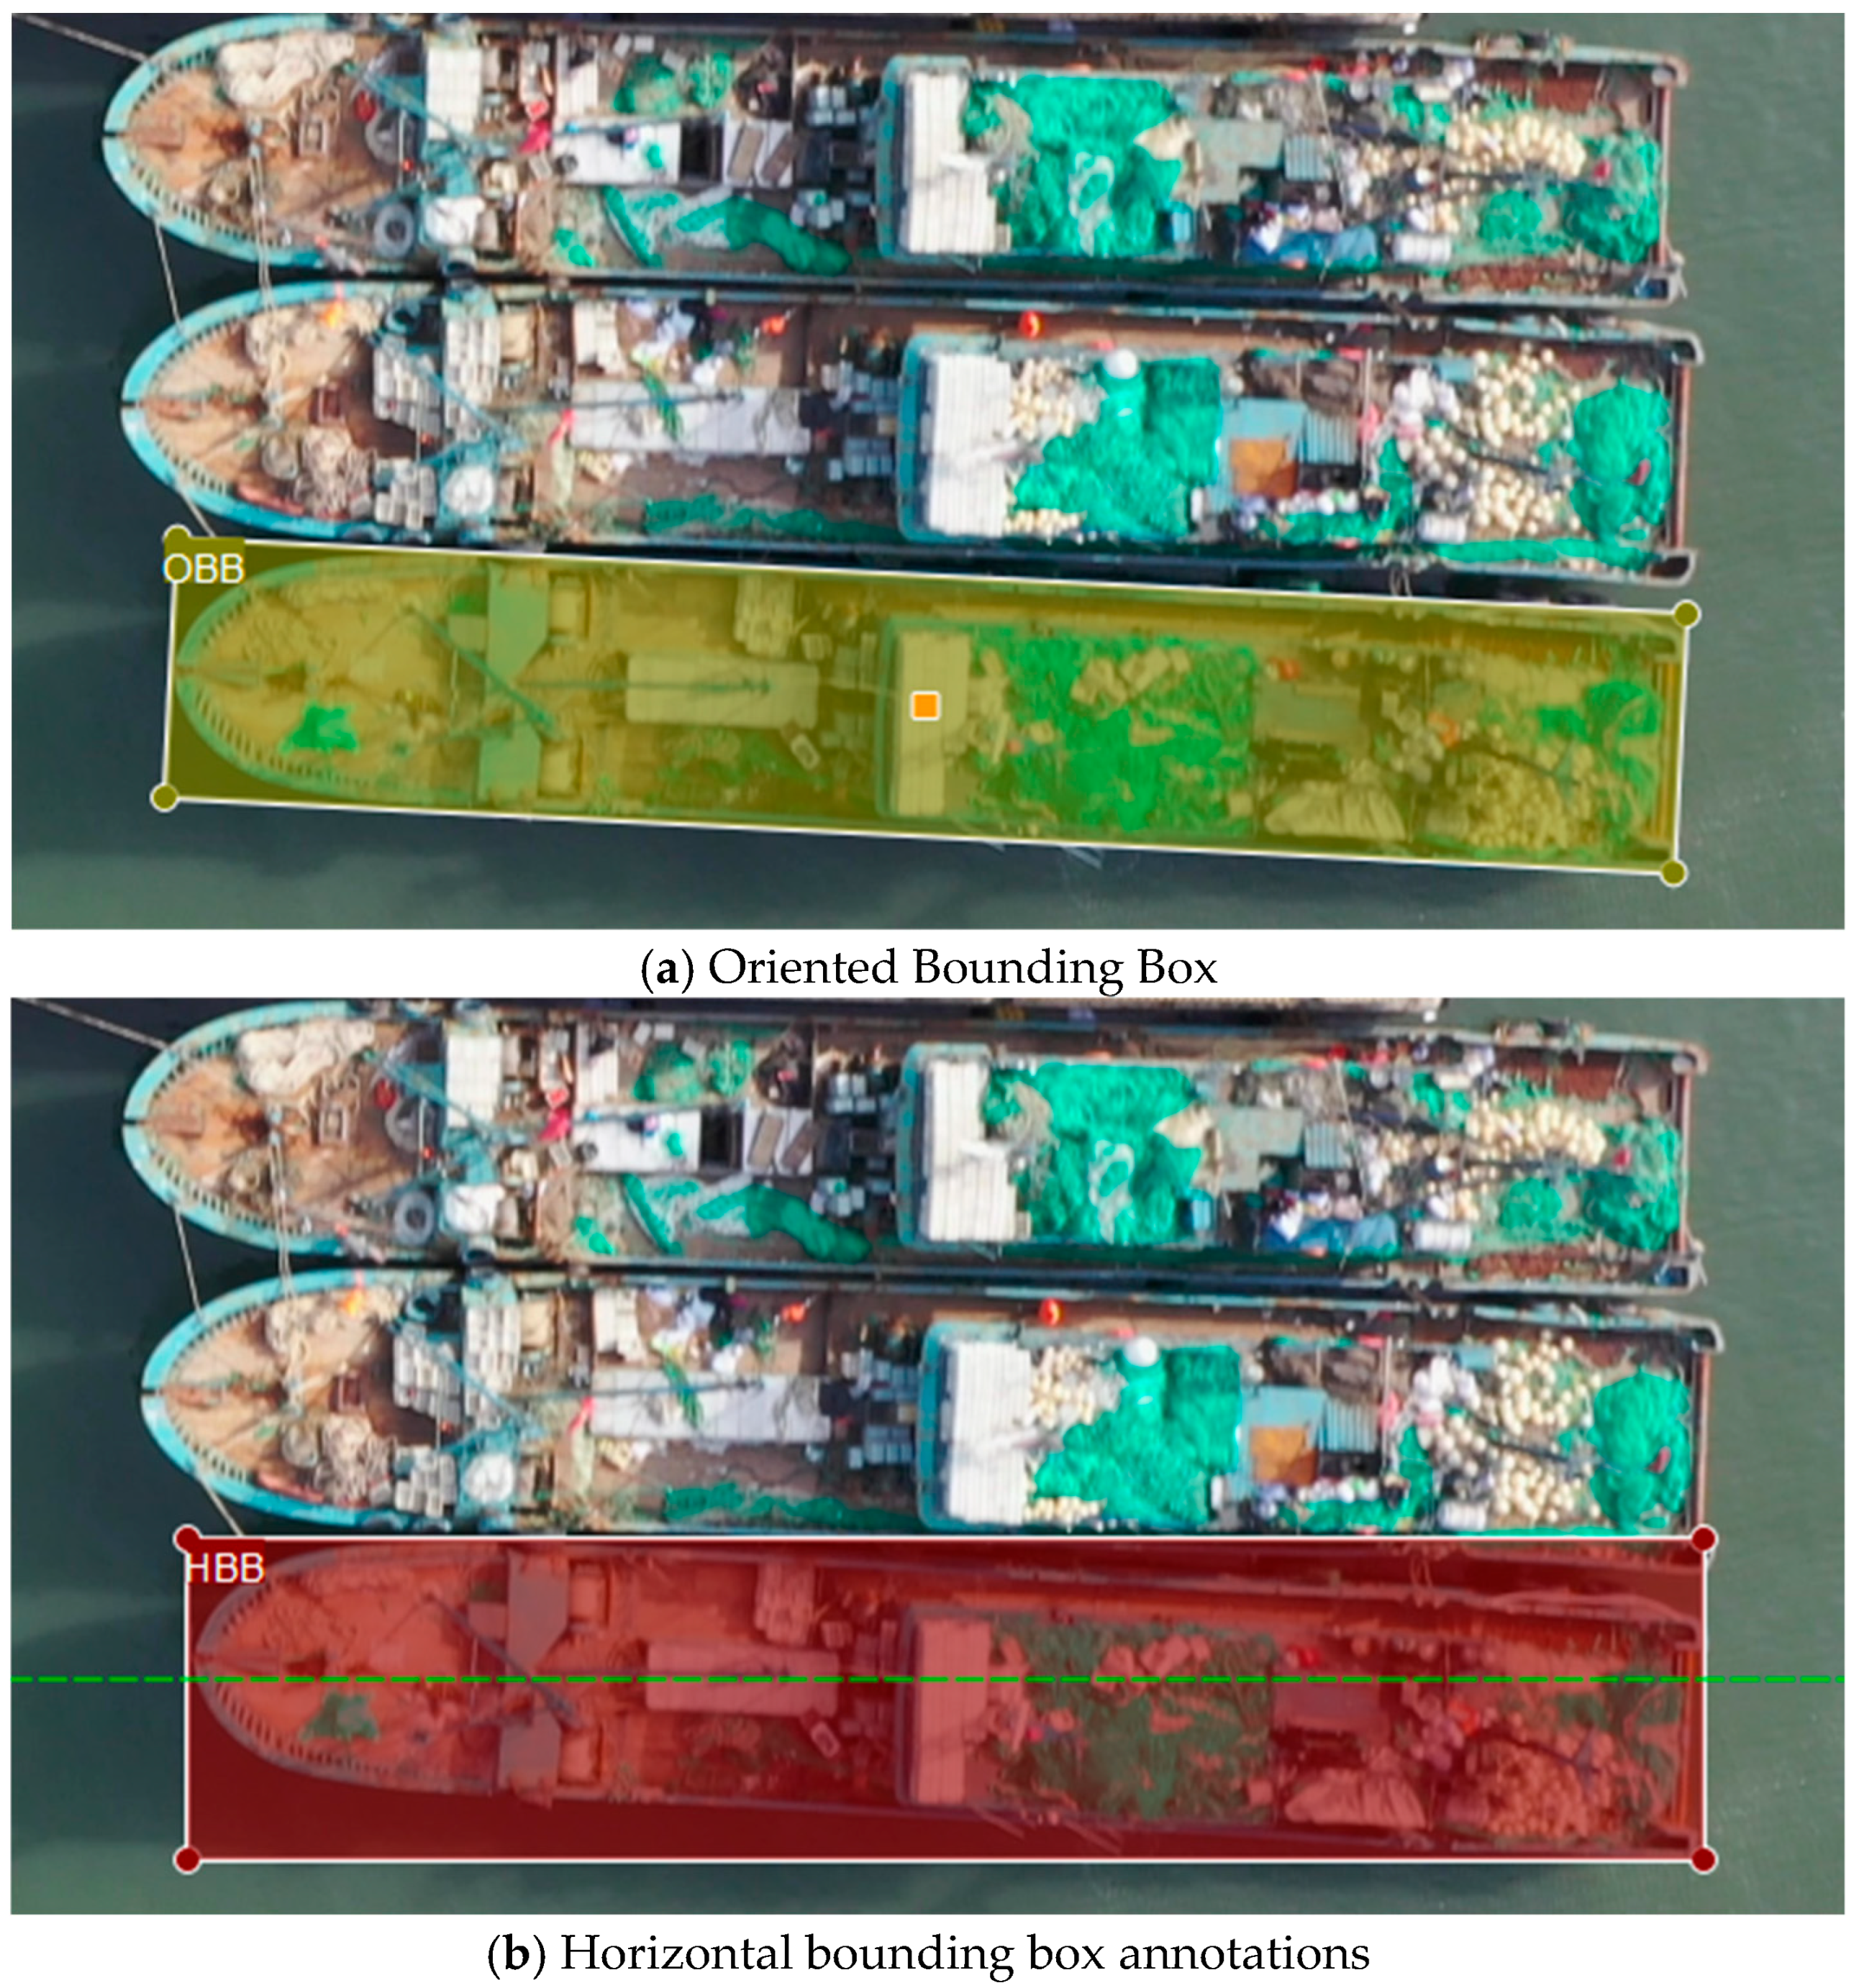
Section 2, Dataset Creation, explains the necessity of a rotating frame in ship size measurement and proposes a data enhancement method without changing the BBOX for rotating frame labeling. In
Section 3, Experimental Environment and Model Improvement, the structure and method of the improved model are introduced, and the effectiveness of model improvement is verified by experiments.
Section 4, Ship Tracking Statistics and Size Measurement, introduces the principle of ship measurement; the tracking ability of the model in the process of UAV flight is optimized. The size measurement results and errors are analyzed. In
Section 5, the influence of orient labeling on ship size measurement results and the influence of orient data enhancement on model training are discussed. The
Section 6 draws a conclusion.
3. Experimental Environment and Model Improvements
3.1. Training Environment and Parameter Settings
The experiments were conducted on a Windows 11 operating system using Python 3.8.18 as the programming language and PyTorch 2.1.1 as the deep learning framework. The CPU configuration was a 13th Gen Intel(R) Core (TM) i5-13450HX with a clock speed of 2.40 GHz. The CUDA version used was CUDA 12.2, and the GPU was an NVIDIA 4050 (Santa Clara, CA, USA). The model training was conducted with the following hyperparameter configuration: an initial learning rate of 0.001, a batch size of 16, and 100 training epochs.
3.2. Model Evaluation Criteria
The following indicators were used to evaluate the performance of the model: precision (P), recall (R), mean average precision (mAP@0.5), mean average precision (mAP@0.95), Params, and GFLOPS.
(1) Precision (
P) represents the ratio of the number of targets correctly predicted by the model to the total number of predictions.
A true positive is a positive sample that the model correctly predicts. A false positive is a positive sample that the model incorrectly predicts. The higher the P value, the lower the false detection rate.
(2) Recall (
R) reflects the model ‘s ability to cover the actual positive samples.
A false negative is a positive sample that the model misses. The higher the recall rate, the more comprehensively the model can detect the actual target.
(3) The detection performance of the mean average accuracy (mAP@0.5) at the intersection-over-union threshold loU = 0.5 is used to measure the accuracy of target positioning. The higher the mAP@0.5value is, the more accurate the bounding box prediction is.
(4) The performance of the mean absolute error (mAP@0.95) under the IoU threshold of 0.95 is used to evaluate the robustness of the model under harsh conditions. The higher the mAP@0.95 value, the stronger the cross-scenario stability.
(5) Params represent the sum of all trainable parameters of the model. The smaller the Params, the lighter and easier it is to deploy the model.
(6) GFLOPS (floating-point operations) are the floating-point operations required for single-image reasoning. The smaller the GFLOPS, the higher the computational efficiency of the model.
3.3. YOLOv8-OBB Network Model
3.3.1. YOLOv8-OBB Network Model
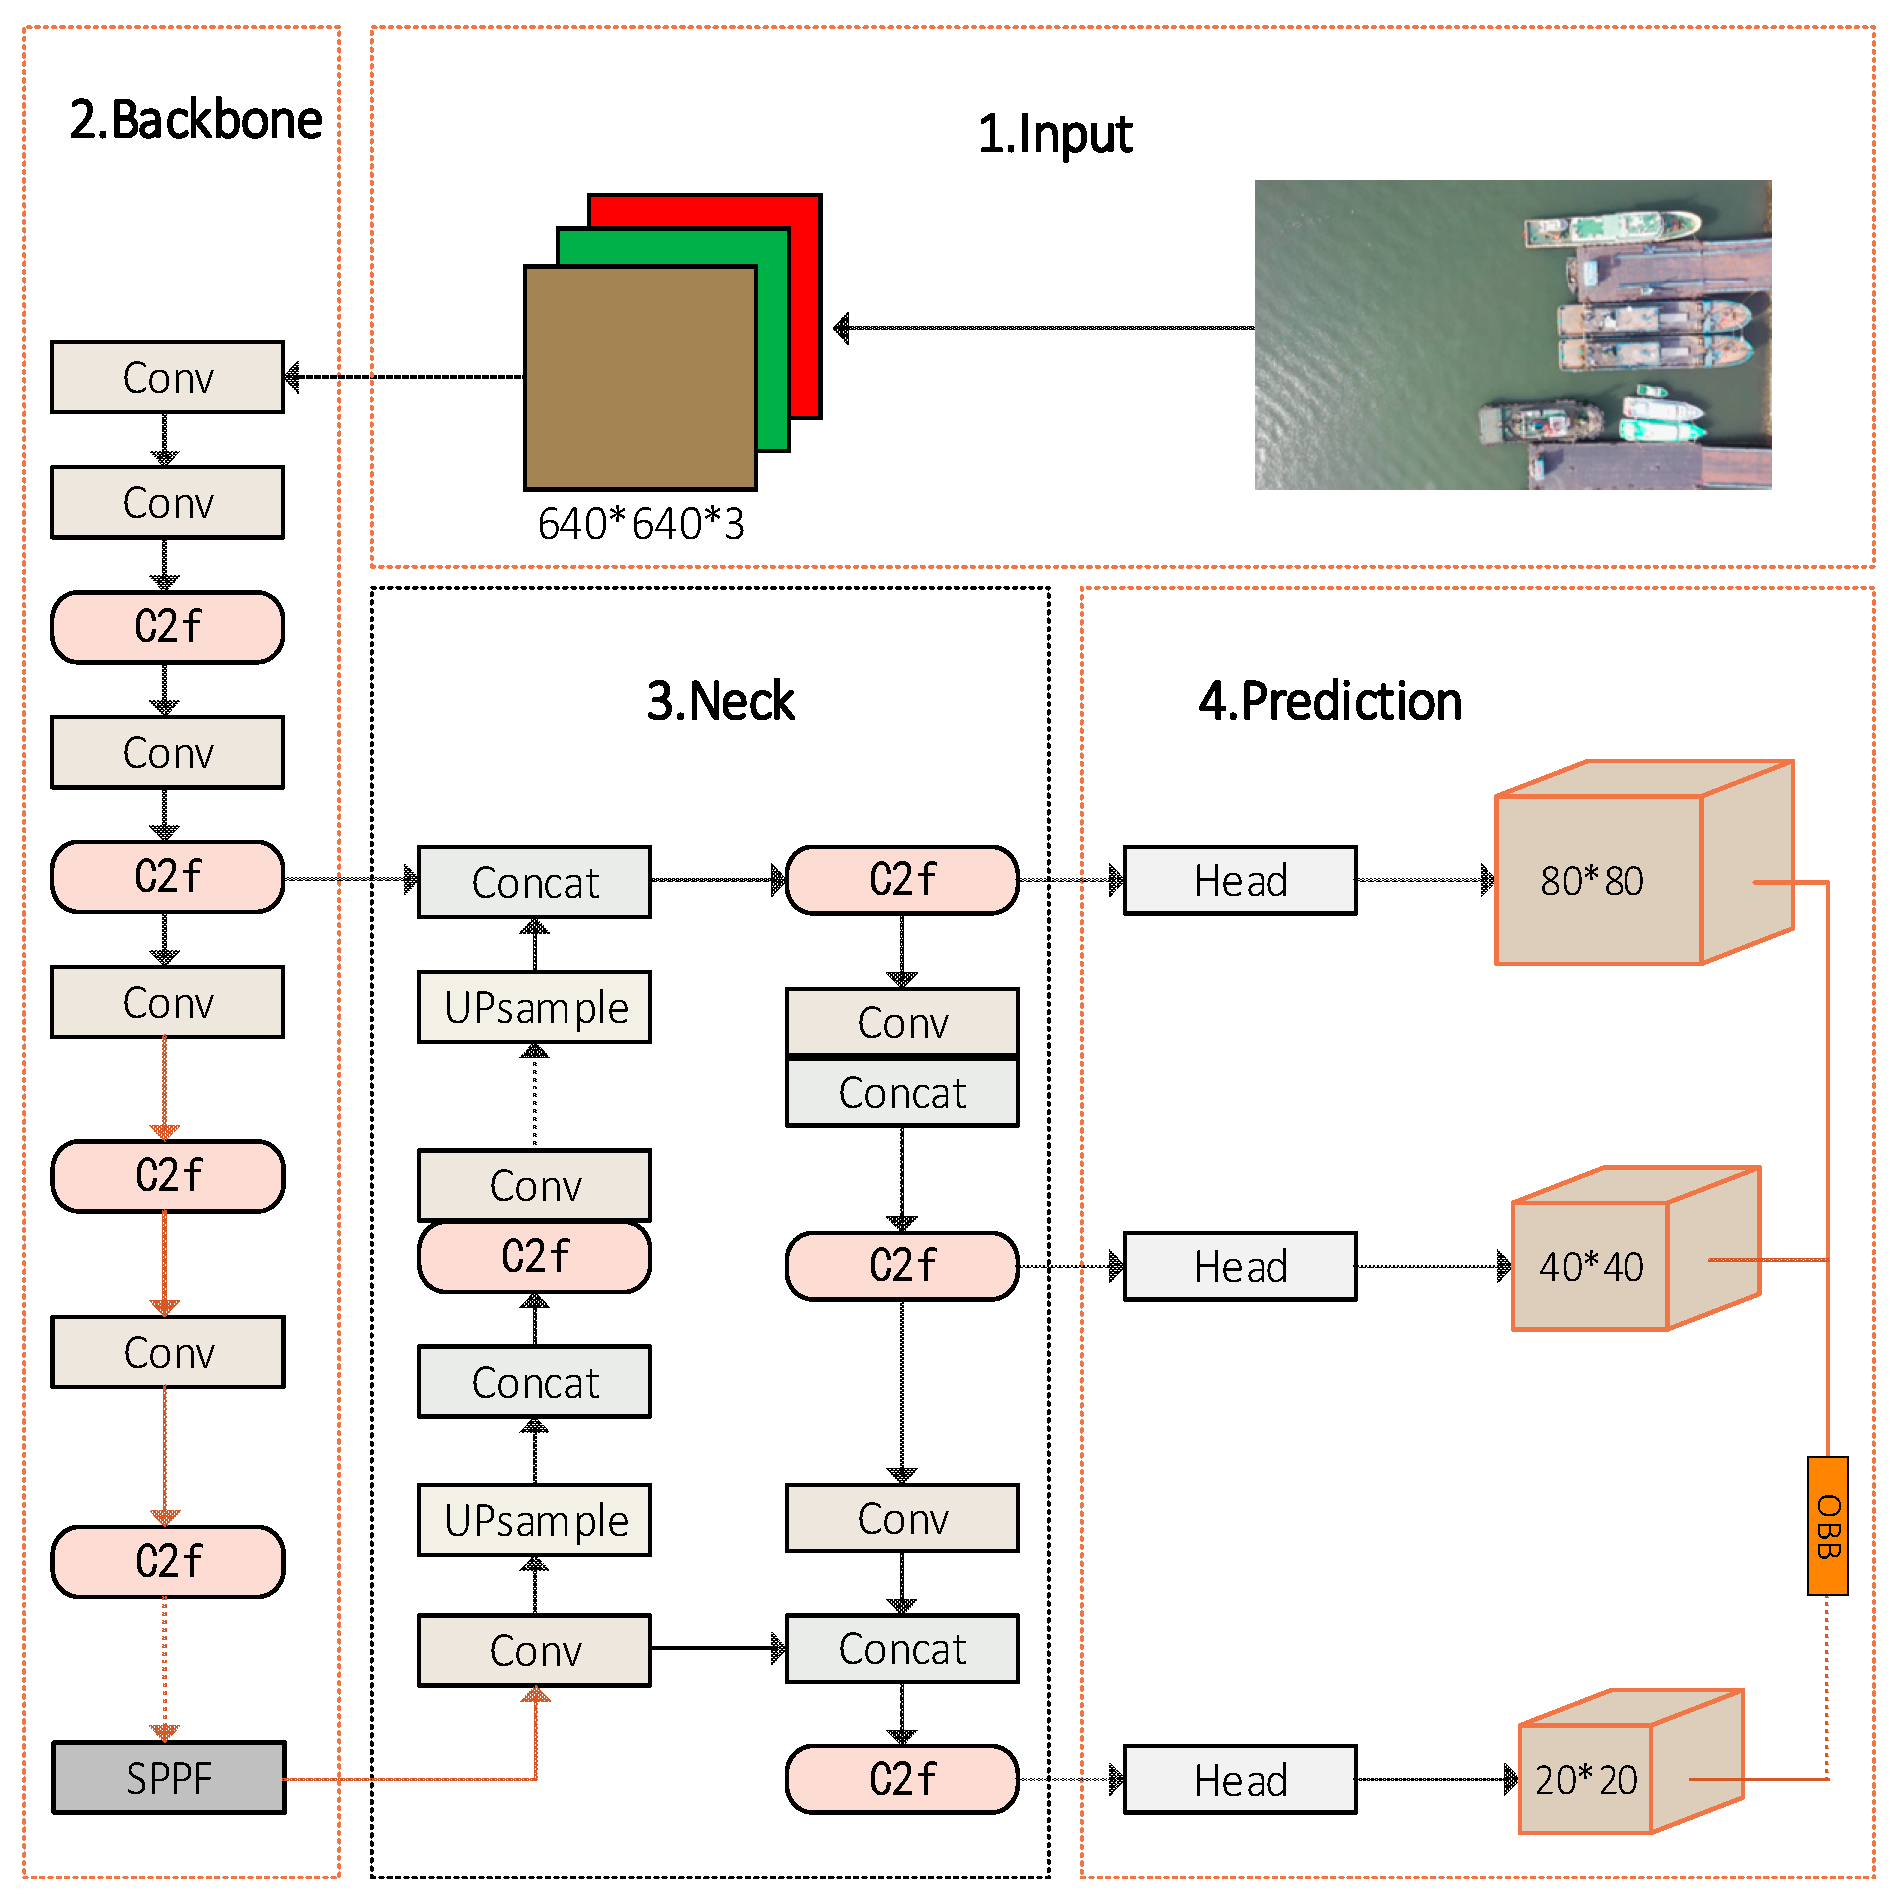
YOLOv8-OBB, as an upgraded version of the YOLO algorithm, is primarily designed for the detection of arbitrarily oriented objects. It exhibits significant advantages in terms of model architecture design, oriented bounding box (OBB) detection, and loss functions. The model comprises two main components: the backbone and the head. The backbone, which includes C2f and SPPF modules, leverages multiple convolutional layers combined with downsampling to extract feature information from images. The head incorporates Upsample, Concat, and C2f modules to fuse features from different hierarchical levels, ultimately predicting oriented bounding boxes through the OBB mechanism. YOLOv8-OBB exhibits robust performance in detecting objects at arbitrary orientations, accurately localizing target objects within images, and generating bounding boxes that minimize background region inclusion, thereby reducing the impact of background on object classification. The model employs three primary loss functions: Classification Loss (CLS), Bounding Box Loss (BOX), and Distribution Focal Loss (DFL), which quantify the classification loss, bounding box localization loss, and the distribution of objects within predicted bounding boxes, respectively.
The development of YOLOv8-OBB extends the capabilities of the YOLO algorithm to the detection of arbitrarily oriented targets, thereby broadening its application scope. It demonstrates significant potential for various applications, including aerial imagery analysis and text detection. By enabling the detection of oriented bounding boxes, YOLOv8-OBB facilitates more detailed object detection in images, reducing the influence of background on target classification and achieving more precise and accurate localization of objects. Moreover, the detection of oriented bounding boxes substantially reduces the impact of background on image target recognition.
3.3.2. Theoretical Innovation of YOLOv8-OBB
The theoretical innovation of YOLOv8-OBB lies in its deep integration of the geometric prior knowledge and dynamic feature optimization mechanisms of rotating target detection. Through the introduction of angle decoupling coding and multi-task collaborative optimization strategy, it achieves efficient and accurate detection of targets in any direction. In terms of parametric representation of the rotating box, the model employs Gaussian angle encoding (GAE) instead of the traditional angle regression method to decompose the angle θ into a horizontal projection coefficient (cosθ) and vertical projection coefficient (sinθ). The gradient discontinuity problem caused by angle periodicity is mitigated through two-channel independent regression. Its mathematical representation is as follows:
The orient angle θ is mapped to a two-dimensional vector = [σ (cosθ), σ (sinθ)] by Gaussian angle encoding (GAE), where σ (·) is the Sigmoid activation function.
The projection coefficient is constrained to the interval (0, 1), thereby achieving the smooth optimization of the angle in the loss calculation. At the feature fusion level, the model introduces a Orient-Aware Feature Pyramid Network (OA-FPN), which dynamically adjusts the shape of the receptive field through deformable convolution, aligns the feature sampling area with the direction of the target spindle, and substantially enhances the semantic representation ability of the orient sensitive area. Experimental results demonstrate that the RA-FPN improves the detection recall rate of tilted targets by 18.6% on the DOTA-v2.0 dataset. In addition, the model establishes a coupling training framework of bounding box loss and distributed focusing loss via the joint optimization strategy of orinet intersection over union (O-IoU) and KL divergence. The loss function system can be expressed as.
Here, is the total loss function, is the classification loss function, is the bounding box loss function, is the distribution focus loss function, and is the weight coefficient.
Finally, the structure of YOLOv8-OBB is shown in
Figure 3.
3.4. Improved YOLOv8-OBB Network Model
3.4.1. MobileNetV3 Network Architecture
MobileNetV3, as a lightweight network architecture specifically designed for mobile devices and resource-constrained environments, exhibits significant advantages. Compared to traditional backbone networks, MobileNetV3 significantly reduces the number of parameters and computations, thereby substantially reducing the computational resource consumption when deployed on devices such as drones. Notably, it achieves an optimal balance between resource utilization efficiency and model accuracy, ensuring that even with a more compact network structure, its performance remains substantially intact. This balance is achieved through a series of innovative methodologies employed within MobileNetV3, including the utilization of hardware-aware neural architecture search (NAS) techniques and the NetAdapt algorithm [
19]. The NAS techniques facilitate the automated exploration of optimal network architectures for MobileNetV3, balancing computational efficiency and model performance, particularly for mobile device resources, through systematic evaluation of different layer combinations, connection patterns, and hyperparameter settings. Meanwhile, the NetAdapt algorithm further refines network parameter adjustments based on hardware awareness, reducing the number of filters while maintaining performance, ensuring efficient operation on mobile platforms. Additionally, MobileNetV3 exhibits low latency while maintaining high accuracy. According to experimental results, MobileNetV3 not only demonstrates exceptional performance across various application scenarios but also demonstrates lower latency compared to other lightweight network architectures, establishing it as an optimal solution for tasks such as real-time object detection on drones.
Figure 4 illustrates the network architecture of MobileNetV3.
3.4.2. AKConv Module
AKConv, as an innovative convolutional neural network structure, not only enhances the accuracy and efficiency of feature extraction but also provides the capability to reduce model parameters and computational overhead. In AKConv, the input image dimensions are (C, H, W), where C represents the number of channels, and H and W denote the height and width, respectively. Its fundamental principle lies in the design of adaptive convolution kernels, which can dynamically adjust their size and shape based on image features. The processing pipeline commences with a Conv2d layer for preprocessing, followed by AKConv utilizing learned offsets to adjust the convolution kernel shape, adapting to different image features. The adjusted convolution kernels are then employed for convolution operations, integrated with the SiLU activation function and normalization, to generate the final feature representation. The SiLU activation function enhances the network’s nonlinear capabilities, enabling improved transmission of feature information. Normalization, on the other hand, contributes to stabilizing the training process and improving the model’s generalization ability.
Experimental results demonstrate that compared to traditional fixed convolution kernels, AKConv significantly improves the network’s ability to capture multi-scale information and feature extraction accuracy by adaptively adjusting the shape and size of convolution kernels. This improvement substantially increases the network’s adaptability. In object detection tasks, AKConv has demonstrated remarkable performance on datasets such as COCO2017 [
20] and VisDrone-DET2021 [
21], exhibiting greater flexibility in handling sample shapes while achieving notable optimizations in parameter efficiency, computational efficiency, and network performance. These advantages are of particular significance for drone applications, improving the target detection performance and real-time capabilities of drones, thereby fulfilling the demands of complex tasks such as fishing vessel size measurement. The AKConv module architecture is illustrated in
Figure 5.
3.4.3. C2fRepGhost Module
The C2fRepGhost module constitutes an innovative integration of the C2f module with the design philosophy of the RepGhost module. The RepGhost module, as an improvement over the GhostNet module, is dedicated to optimizing the feature fusion process through reparameterization techniques, aiming to enhance the efficiency and effectiveness of feature representation. In the C2f module, feature maps of different resolutions are conventionally fused through concatenation (Concat) operations to integrate multi-scale information. However, in the C2fRepGhost module, the incorporation of reparameterization techniques optimizes the processing of feature maps. This optimization not only replaces the Concat operation with addition (add) to reduce computational overhead but also encompasses more complex parameter transformations and operational combinations, thereby implicitly enhancing feature interaction and fusion.
Furthermore, the RepGhost module implements strategies including strategically repositioning the ReLU activation function to further enhance model performance. Compared to the GhostNet module, the RepGhost module significantly reduces parameters and computational load through halving the number of intermediate channels, particularly when combined with SE (Squeeze-and-Excitation) attention mechanisms or depthwise separable convolution modules. This lightweight architecture confers upon the C2fRepGhost module substantial efficiency and significant lightweight characteristics while maintaining high computational capabilities. The GhostNet and RepGhost architectures are illustrated in
Figure 6 and
Figure 7, respectively.
3.4.4. YOLO-LFVM Model Network
The YOLO-LFVM (Lightweight Fishing Vessel Measurement) model is a streamlined deep learning architecture specifically engineered for real-time object detection on mobile platforms. This framework achieves synergistic optimization of detection accuracy and computational efficiency through multi-dimensional enhancements, where “L” denotes lightweight design, “FV” represents fishing vessel targets, and “m” indicates metric measurement capabilities. Built upon an improved YOLOv8-OBB framework, the model innovatively integrates a lightweight MobileNetV3 backbone network, an adaptive dynamic convolution module (AKConv), and an enhanced feature fusion module, forming a comprehensive lightweight solution for object detection.
Regarding backbone network design, the LFVM model employs a MobileNetV3 structure optimized through neural architecture search (NAS). By leveraging hardware-aware NAS techniques and the NetAdapt algorithm, the network architecture is automatically refined, significantly reducing computational complexity while preserving feature extraction capabilities.
During the feature extraction phase, the AKConv module with dynamic adaptability is incorporated. Its deformable convolution kernel mechanism facilitates automatic adjustment of the receptive field shape and size based on input features, effectively enhancing the model’s ability to capture features of multi-scale objects.
In the feature fusion stage, the C2fRepGhost module, improved through reparameterization techniques, is employed. Via sophisticated feature recombination and compression strategies, this module enhances cross-scale feature interaction capabilities while reducing parameter count. The LFVM model prioritizes deployment efficiency optimization, utilizing structural reparameterization and channel pruning to maintain excellent real-time detection performance on resource-constrained devices like drones. In practical applications such as fishing vessel size measurement, the LFVM network model demonstrates high-precision detection capabilities for multi-scale objects in complex backgrounds while maintaining low energy consumption and computational latency, establishing a novel technological paradigm for mobile-end object detection tasks. The final improved YOLOv8-OBB model, designated as YOLO-LFVM, is illustrated in
Figure 8.
3.5. Ablation Research
To evaluate the effectiveness of the improvements made to the YOLOv8n-OBB model, ablation studies were conducted through incrementally introducing modifications to different modules of the YOLOv8n-OBB model. These comprised YOLOv8n-OBB, YOLOv8n-OBB+MobileNetV3, YOLOv8n-OBB+MobileNetV3+AKConv, and YOLOv8n-OBB+MobileNetV3+AKConv+C2fRepGhost. All tests were conducted utilizing the same dataset, with model training and testing executed under identical epochs and batch sizes.
As shown in
Table 2, compared to the baseline Compared to the YOLOv8n-OBB model, the YOLOv8n-OBB+MobileNetV3+AKConv+C2fRepGhost model (YOLO-LFVM) exhibited only minor decreases: 0.7% in accuracy, 0.3% in mAP@0.5, and 0.2% in recall rate. However, it achieved a substantial improvement of 1.7% in mAP@0.95. Crucially, while maintaining nearly identical detection performance, the model size was reduced by 65%, and the floating-point operations (FLOPs) were decreased by 69%. This significant reduction substantially reduces the computational requirements of the model, thereby considerably improving its potential for deployment on resource-constrained devices such as drones.
3.6. Comparison of Detection Performance Among Mainstream Models
To accommodate the limited computational resources of UAVs and meet the requirements of real-time detection, this study adopts a single-stage object detection algorithm and conducts a comparative analysis among mainstream YOLO series models. The comparison of detection performance among mainstream models is shown in
Table 3. Experimental results demonstrate that YOLO-LFVM exhibits significant advantages due to its innovative lightweight design. With only 1.08M parameters and computational complexity as low as 2.6 × 10
9 FLOPS, the model reduces the parameter count and computational load by 59% and 61%, respectively, compared to the best-performing YOLOv11-OBB, and achieves a 54% reduction in parameters even relative to the most lightweight YOLOv10-OBB. This lightweight characteristic endows YOLO-LFVM with prominent deployment advantages on resource-constrained UAV platforms. Although its 92.2% mean absolute error (MAE) is slightly lower than YOLOv11-OBB’s 99.1%, it maintains a high mAP of 99.2% and a recall rate of 99.7%, fully meeting the accuracy requirements for UAV object detection. In contrast, YOLOv8-OBB, YOLOv10-OBB, and YOLOv11-OBB, despite their higher detection accuracy, exhibit computational loads 2.5 to 3.2 times that of YOLO-LFVM, which would significantly compromise real-time performance under the limited computational capacity of UAVs. Through its meticulously designed lightweight architecture, YOLO-LFVM substantially reduces computational burden while ensuring sufficient detection accuracy, achieving superior “performance per unit computation” and providing a computationally efficient and easily deployable solution for UAV object detection. This design philosophy, which balances accuracy and efficiency, makes YOLO-LFVM particularly suitable for mobile and embedded applications with stringent demands on model size and computational resources.
4. Vessel Tracking Statistics and Vessel Size Test
4.1. Vessel Size Measurement
In the research of vessel dimension measurement, a standardized imaging protocol was established, involving a fixed takeoff position, constant flight altitude, and uniform shooting angle. This configuration ensures spatial consistency in the perspective view. Under these controlled conditions, the sampling regularity of the image sensor with respect to real-world objects demonstrates high stability. Specifically, vessel components of the same physical dimensions occupy a constant pixel area in the image, and this pixel-scale invariance provides a physical foundation for dimension measurement. However, the mapping relationvessel between pixel units and actual physical dimensions is determined by the spatial geometric characteristics of the imaging system. To establish an accurate measurement benchmark, the scale factor relating actual physical length to unit pixel must be determined using calibration references with known dimensions. This calibration process requires comprehensive compensation for lens distortion and perspective projection effects, establishing spatial correlation between the true length of the reference object and its pixel span in the image, thereby enabling scale conversion between digital images and the real world.
Based on the calibration results, vessel target dimensions are obtained by converting the pixel dimensions of its oriented detection bounding box. The physical values of overall length and beam are calculated by multiplying the respective pixel lengths of the long and short axes by the established scale factor. This method decouples the measurement process into two key steps: establishing global scale parameters through system-level calibration, then integrating pixel dimensions from target-level detection. This integrated approach ensures millimeter-level theoretical accuracy while facilitating reproducibility of measurement results across different scenarios, thereby providing quantifiable technical evidence for harbor supervision.
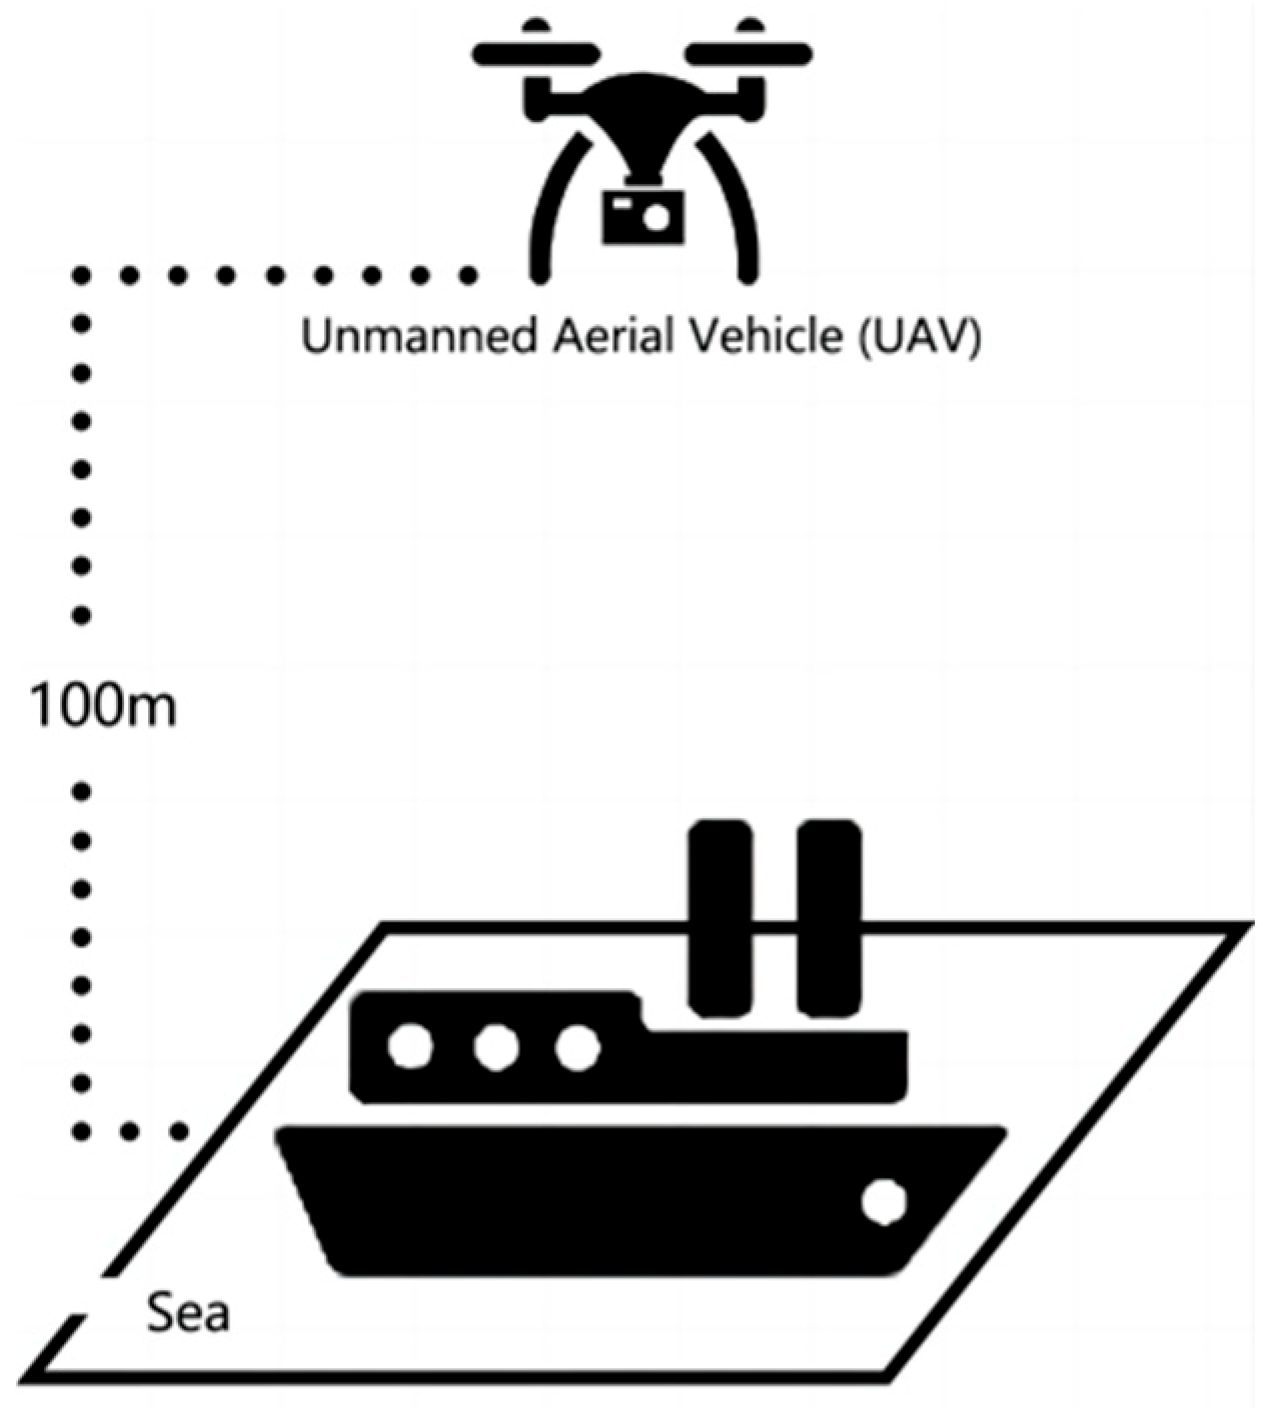
Figure 9 presents the vessel dimension measurement schematic.
In the ship patrol operation, the UAV adopts a fixed take-off point, preset cruise path, constant flight height, and established camera angle setting. In this scheme, the cruise altitude is set to 100 m, which is not the maximum lift limit of the UAV, but the operating altitude used to optimize the measurement accuracy. Flying height is a key parameter in ship size measurement. Choosing 100 m instead of 10 m, although both of them have the integer characteristic of number 1 (which can ensure that the proportional calculation result is an integer and avoid introducing additional errors due to the unfinished proportional coefficient), the height of 100 m can not only provide a better observation perspective, but also expand the ship coverage of a single frame image, thereby improving the reliability and operation efficiency of the measurement data.
4.2. Vision-Based Vessel Dimension Measurement Theory Using OpenCV
4.2.1. Measurement Principle
Vessel dimension measurement is accomplished through perspective projection geometry and pixel-to-physical dimension mapping via the following methodology:
(1) Oriented bounding box parameter analysis:
Obtain five parameters of the oriented bounding box from the YOLOv8-OBB model: center point, width, height, and orient angle (in degrees, range [−90°, 90°]).
(2) Key point extraction:
Calculate the coordinates of the four corner points of the oriented bounding box (using OpenCV’s cv2.boxPoints function):
where
and
represent the coordinates of the geometric centroid of the bounding box;
denotes the width of the oriented bounding box; h signifies the height of the oriented bounding box; and
corresponds to the orient angle of the bounding box.
(3) Size calculations:
Take the length of the long side of the orient box as the total pixel length
:
Take the length of the short side of the orient box as the pixel width
:
where
represents the horizontal pixel width of the target within the image, and
represents the vertical pixel height of the target within the image.
4.2.2. Conversion of Pixels to Physical Size
(1) Calibration Aids:
A calibration plate of known size is placed in the shooting scene, and the pixel/meter scale factor is calculated:
where L represents the physical dimensions of the calibrated object (expressed in meters), and l represents the corresponding pixel dimensions of the calibrated object.
(2) Actual dimensions of the vessel:
where
represents the actual total length,
represents the total pixel length,
represents the pixel-to-meter conversion ratio,
represents the actual width, and
represents the pixel width.
(3) UAV altitude mapping method:
When the calibrator is not available, it is estimated by the drone height
and the camera focal length
:
where
represents the pixel-to-meter conversion ratio,
represents the altitude of the drone,
represents the focal length of the camera, sensor width represents the physical width of the camera sensor, and image width represents the pixel width of the target within the image.
4.2.3. Error Correction Model
(1) Tilt compensation:
In view of the perspective distortion caused by the non-horizontal state of the vessel, the total length is corrected by the
inclination angle between the plane where the target object is located and the imaging plane of the camera:
where
represents the total pixel length.
(2) Wave compensation:
The true total length
of the object is obtained by introducing a highly fluctuating compensation coefficient
for the floating vessel:
where
represents the pixel length following geometric correction, and
represents the altitude fluctuation compensation coefficient (ranging from 0.98 to 1.02).
4.2.4. Sources of Error in Drone Measurements
(1) Altitude Measurement Error Transfer:
If there is an error between the
actual height of the UAV
and the measured height
, the size measurement error is
where
L represents the actual dimensions of the target object,
represents the size estimation error attributed to altitude measurement uncertainty,
h represents the measured height of the vessel,
H represents the actual flight altitude of the UAV, and
represents the altitude measurement error.
(2) Attitude angle effect analysis:
The pitch angle
causes the longitudinal dimensions of the image to change, and the total length measurement error is
where
represents the pitch angle,
represents the actual length of the vessel, and
represents the overall length measurement error.
The roll angle
causes lateral distortion of the image, and the width error is
where
represents the roll angle,
represents the actual width of the vessel, and
represents the overall width measurement error.
The yaw angle affects the angle detection of the rotating frame, which needs to be compensated by IMU data.
Compensation model:
where
represents the yaw angle of the carrier, and
represents the calibration value for the mounting deviation between the camera and the IMU.
4.3. Advanced Vessel Tracking and Detection System Optimization
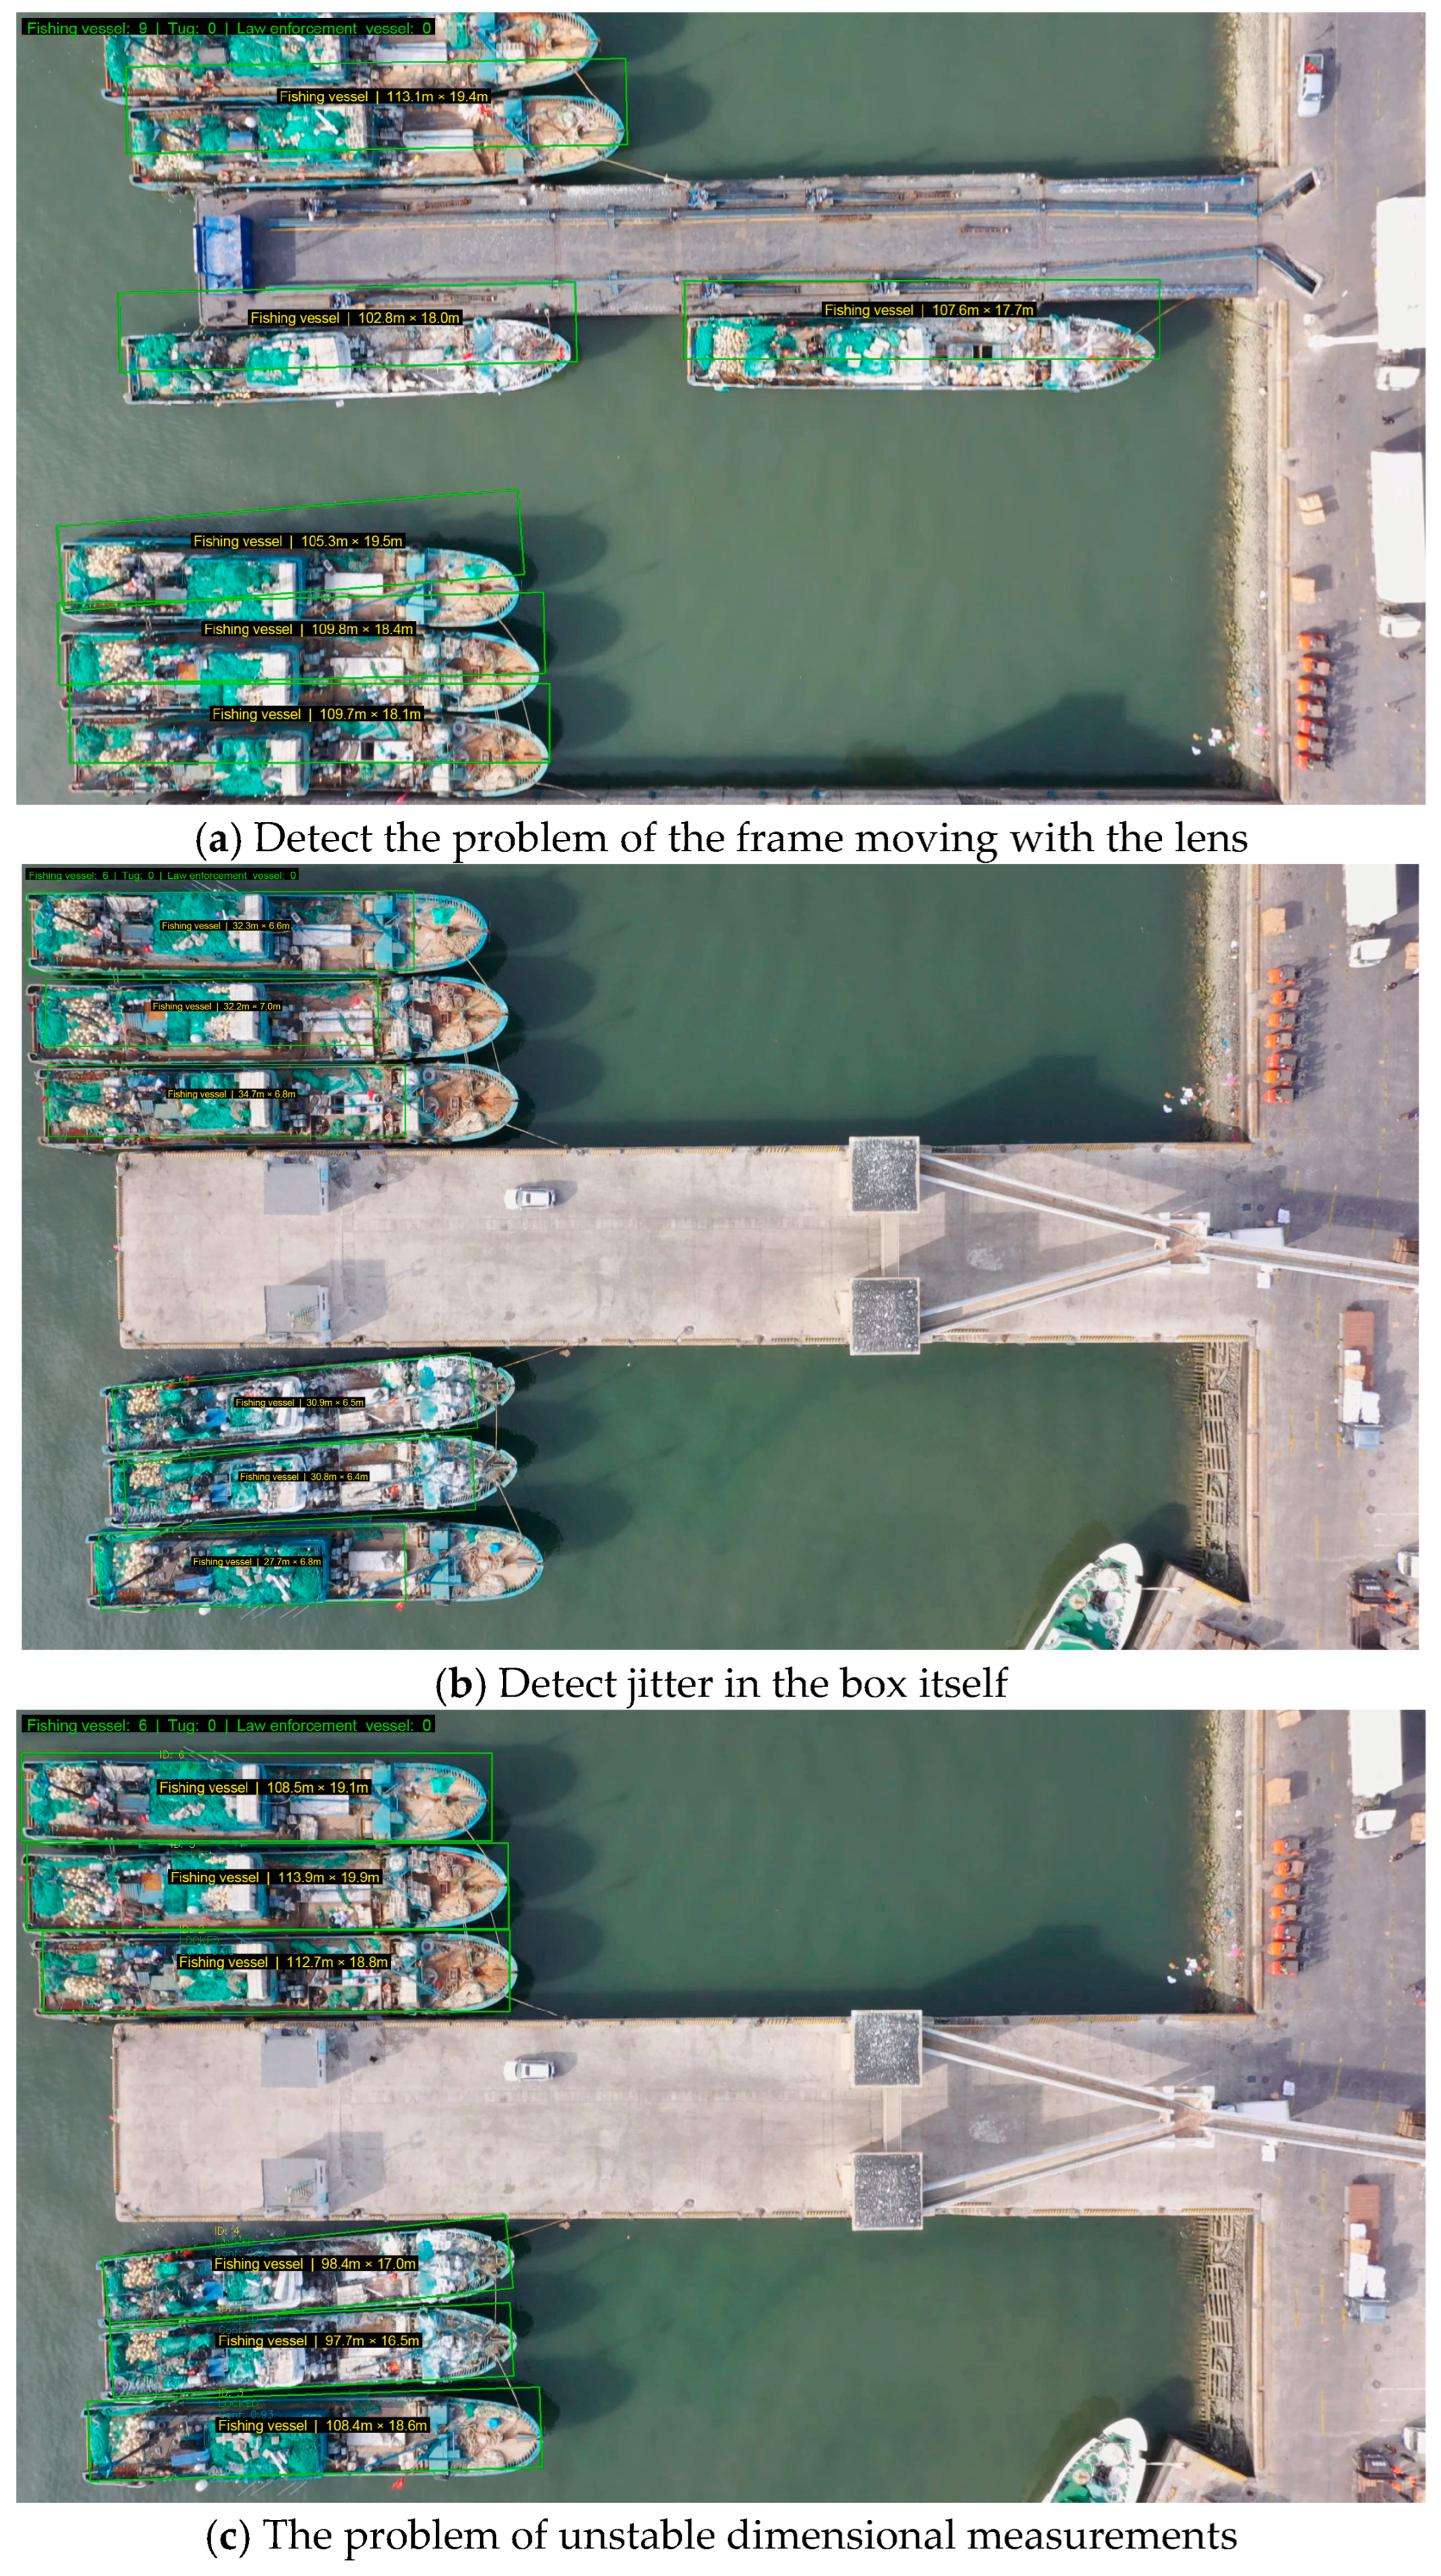
To enhance practical application value, this study optimized the vessel tracking and detection system. Due to the high density of vessels in harbor basins and similar vessel types, real-time tracking and detection of unauthorized vessels is required, posing significant demands on the model’s tracking capabilities. Since vessel and drones cannot maintain complete relative stability, and camera shake occurs under wind conditions, this leads to issues such as detection frames moving with the lens, detection frame jitter, and unstable size measurements, necessitating improvements in tracking ID stability and optimization of system resource management.
(1) As illustrated in
Figure 10a, prior to optimization, the detection frames exhibited displacement correlated with camera movement during UAV flight operations. To address the issue of detection frame displacement relative to lens motion, global motion compensation technology was implemented. The approach utilized the ORB feature point detection algorithm to extract salient feature points within video frames, employed a brute-force matcher (BFMatcher) for feature point correspondence between consecutive frames, and applied the RANSAC algorithm to compute the homography matrix for precise characterization of inter-frame global motion transformation. During the detection phase, an inverse homography transformation was applied to the centroid of each vessel’s detection frame to compensate for displacement induced by UAV motion, thereby maintaining detection frame stability within the image coordinate system.
(2) As demonstrated in
Figure 10b, detection frame oscillation was observed prior to optimization, directly compromising the accuracy of vessel dimensional measurements. To mitigate detection frame instability, a position smoothing algorithm was developed, establishing a position history queue for each tracking target and computing weighted average positions using a linear decreasing weight strategy. Under dimension-locked conditions, only the smoothed centroid offset is applied to the original detection frame while preserving frame geometry. Additionally, angular change constraints and Hanning window-weighted smoothing were implemented to effectively suppress orient oscillation.
(3) As illustrated in
Figure 10c, dimensional measurement instability was evident prior to optimization, characterized by fluctuating measurement outputs with multiple variations per second, resulting in inaccurate measurements. To address dimensional measurement instability, this study introduces an innovative dimension locking mechanism that stabilizes physical size parameters following dimensional change rate assessment, subsequently updating only positional information. The unlocked state employs two-stage filtering: median filtering to eliminate outliers and Hanning window-weighted averaging to smooth normal fluctuations. Additionally, vessel-type-specific correction factors are integrated to enhance dimensional accuracy during initial detection phases.
(4) As demonstrated in the upper right of
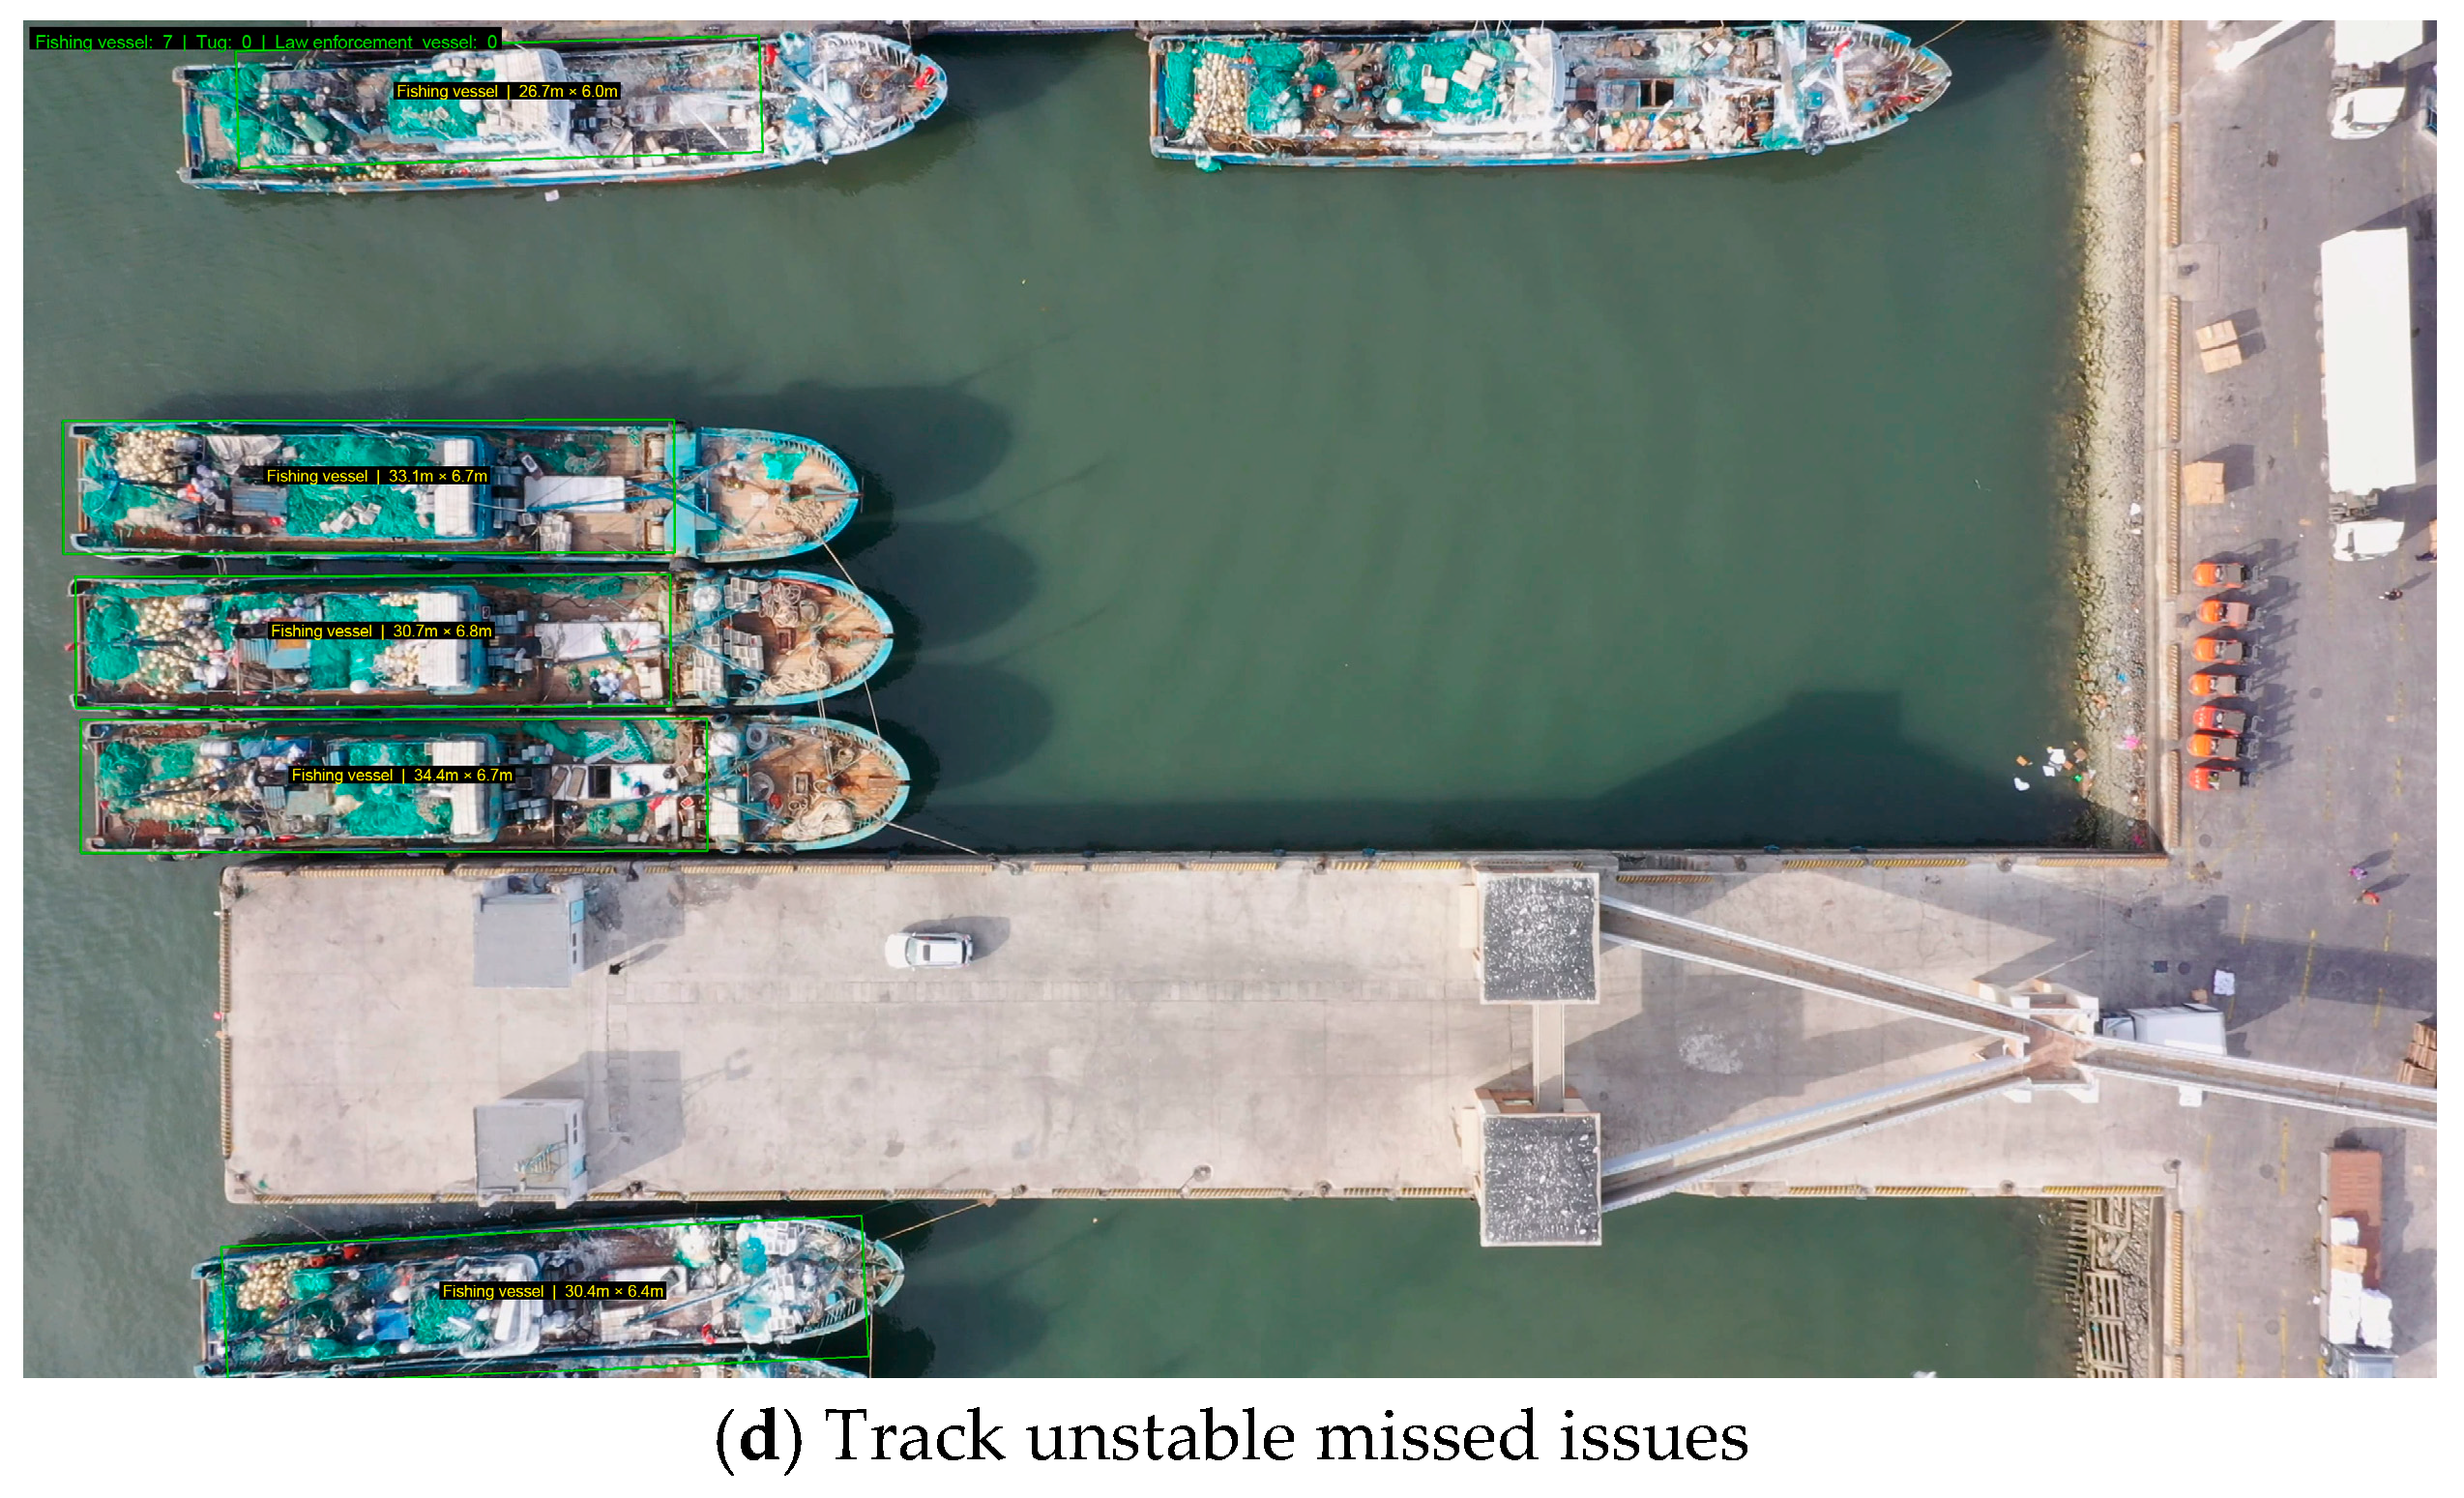
Figure 10d, tracking instability and missed detection issues were observed prior to optimization, necessitating enhanced model tracking stability through dual-modal fusion of motion prediction (Kalman filter) and appearance features (ReID model) to improve occlusion handling capabilities. The design addresses the processing pipeline through sequential operations: cycle normalization → change constraints → historical smoothing. Additionally, tracking ID visualization was implemented alongside a manual reset mechanism to accommodate complex operational scenarios.
(5) To enhance system resource management, this study implemented a dynamic resource recovery mechanism: trackers are automatically purged following a 3 s timeout period, corresponding to typical vessel departure characteristics. Fixed-length queues (5 frames for position history, 15 frames for dimensional history) constrain memory expansion, while expired resources undergo active cleanup per frame. Concurrently, a frame rate monitoring module was established to dynamically adjust processing strategies and maintain real-time performance.
4.4. Vessel Tracking Statistics and Vessel Size Measurement Effect Analysis
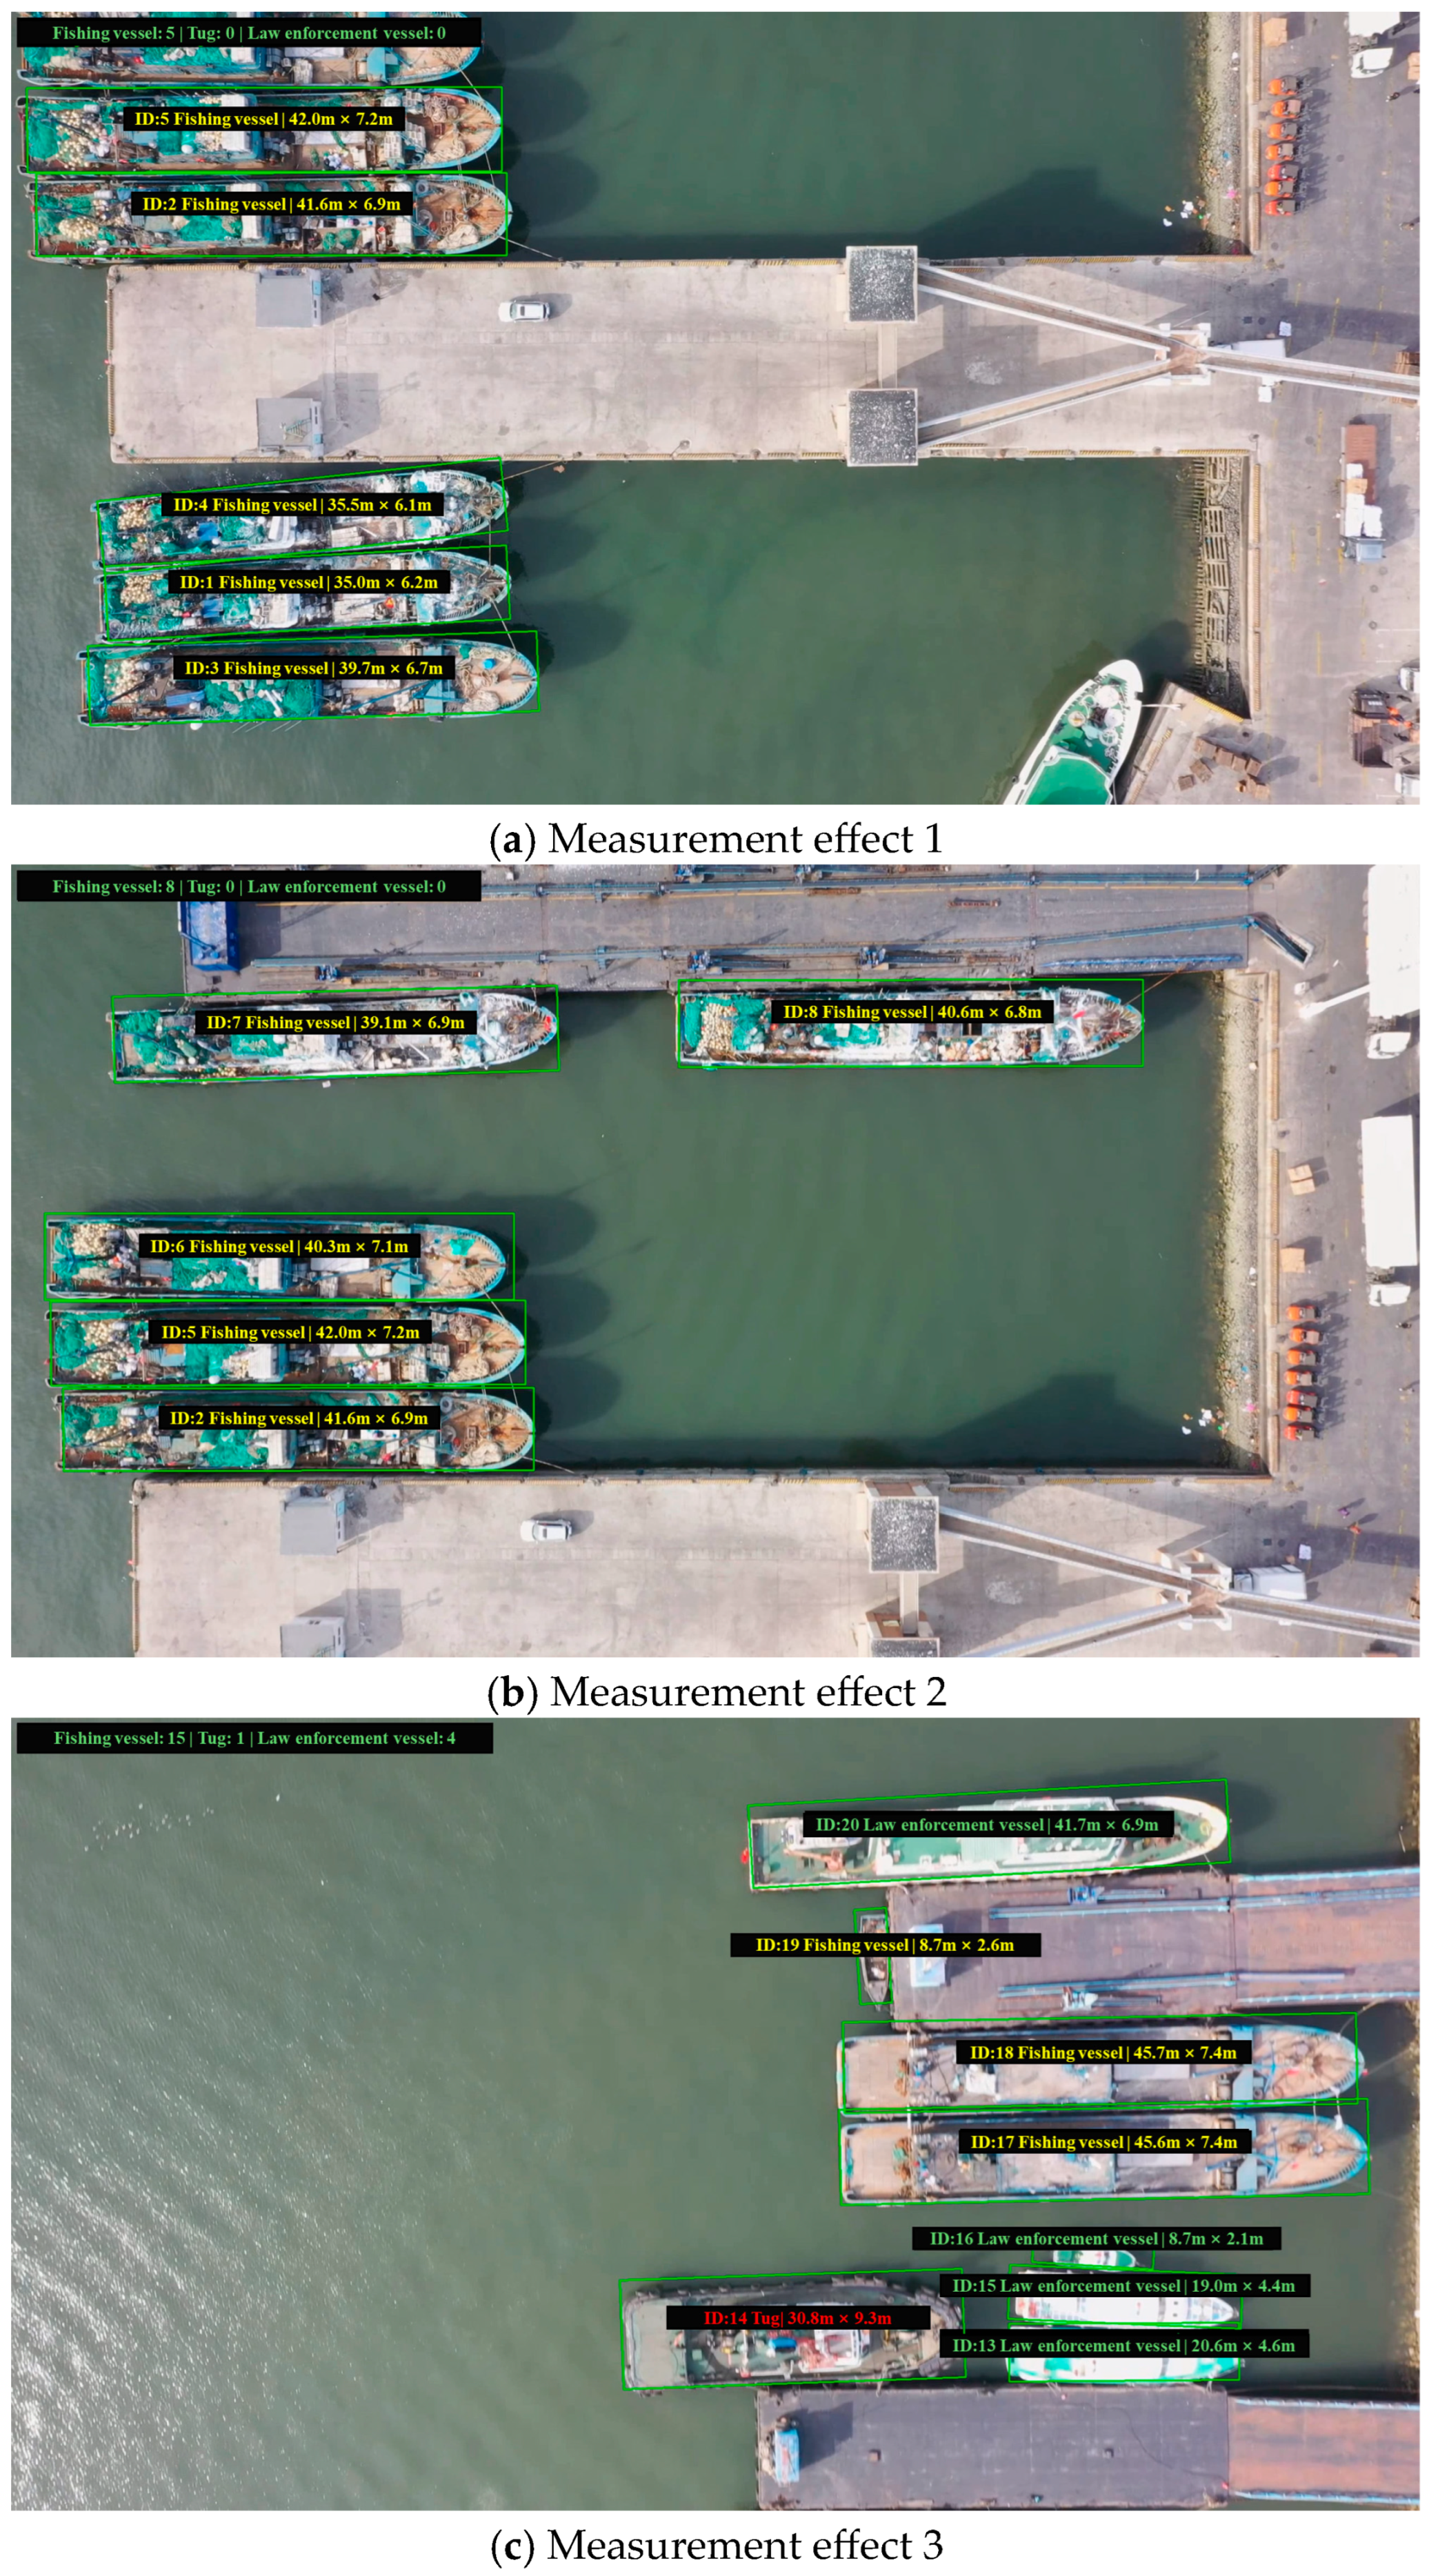
Figure 11 demonstrates the optimized vessel tracking statistics and vessel size measurement performance. As shown in
Figure 11, the green font in the upper left corner represents the statistical results of various vessel types. The yellow font indicates fishing vessel size measurement results, the green font denotes law enforcement vessel size measurement results, and the red font signifies tug size measurement results. This demonstrates effective vessel positioning and size recognition performance.
The measurement results of ID2 and ID5 vessel in
Figure 11a,b remain consistent. The measurement results of ID2 at different times are 41.6 m in total length and 6.9 m in beam width. The measurement results of ID5 are 42.0 m in total length and 7.2 m in beam width, demonstrating effective UAV tracking and measurement performance during flight. The four law enforcement vessels in
Figure 11c and one tug are effectively enumerated by the statistical panel in the upper left corner, confirming effective vessel tracking statistics performance. Additionally, ID19 represents a small fishing vessel, and ID17 represents a large fishing vessel in
Figure 11c, demonstrating that the model can effectively identify and measure fishing vessels of different scales.
4.5. Vessel Size Measurement Results and Error Analysis
The comparison between model measurement results and actual manual measurement results is shown in
Table 4. Manual measurements represent the ground truth values, recorded to two decimal places. The relative error of the average total length is 2.67%, and the relative error of the average beam width is 3.28%. Model measurements exhibit relative errors ranging from 0.71% to 4.11% for total length, and from 1.59% to 4.49% for beam width. However, ID20 demonstrates an anomalous beam width relative error of 15%.
Figure 11c reveals that the predicted width exceeds the actual beam width. Manual re-examination identified this as a labeling error resulting from manual annotation during data preparation. Given the varying vessel sizes, fishing port management authorities employ different regulatory approaches. This algorithm primarily categorizes fishing vessels into three classes: below 12 m, 12 to 24 m, and above 24 m. With average relative errors of 2.67% for total length and 3.28% for beam width, the system provides sufficient accuracy for classification purposes and serves as an effective auxiliary tool for fishing port law enforcement departments.
6. Conclusions
A lightweight real-time fishing vessel tracking and size measurement model based on a UAV is put forward. In view of the problems faced by the current fishing port management department, such as low efficiency of fishing vessel size measurement methods and difficulty in updating the size information of large quantities of fishing vessels in time, this paper proposes a lightweight real-time fishing vessel tracking and size measurement model based on a UAV (YOLO-LFVM, based on improved YOLOv8-OBB and UAV remote sensing technology). Relative to the baseline model, the YOLO-LFVM model exhibits marginal decreases in accuracy, recall rate, and mAP@0.5 of 0.7%, 0.2% and 0.3%, respectively. However, mAP@0.95 increases by 1.7%, while the model demonstrates substantial improvements in computational efficiency with 65% parameter reduction and 69% GFLOP reduction. Comparative analysis of model outputs against actual vessel data reveals average relative errors of 2.67% for total length and 3.28% for total width. The research shows that the YOLO-LFVM model is effective in ship identification, ship tracking statistics, and measurement. Through its integration with UAV remote sensing technology, it is conducive to the timely updating of large-scale fishing vessel size information. Finally, the model can assist the daily management and law enforcement of the fishing port management department and can be applied to other equipment with limited computing power to perform target detection and object size measurement tasks.
The YOLO-LFVM model proposed in this study shows great potential in daily fishing port management and auxiliary law enforcement. However, the current research still has limitations and needs further exploration. A notable shortcoming is the lack of tests in open waters outside the port with harsh sea conditions such as high seas. Future research will focus on expanding the application scenarios to increase the gradient comparison test between open waters outside the port and various sea conditions and developing a better lightweight model architecture to improve the computational efficiency of the model in real-time ship measurement scenarios and reduce the demand for computing resources.
