Article

Marine Geomechanical Approach to Well Trajectory Optimization in Fractured Reservoirs: A Case Study from the X Block, Zhujiangkou Basin

1
School of Petroleum Engineering, China University of Petroleum (East China), Qingdao 266580, China
2
China Oilfield Services Limited, Langfang 065201, China
3
State Key Laboratory of Deep Oil and Gas, China University of Petroleum (East China), Qingdao 266580, China
4
Oil and Gas Drilling and Completion Technology National Engineering Research Center, Qingdao 266580, China
5
Cnooc (China) Limited Zhanjiang Branch, Zhanjiang 524031, China
*
Author to whom correspondence should be addressed.
J. Mar. Sci. Eng. 2025, 13(9), 1732; https://doi.org/10.3390/jmse13091732
Submission received: 31 July 2025 / Revised: 2 September 2025 / Accepted: 4 September 2025 / Published: 9 September 2025

Abstract

This study presents a geomechanics-driven marine approach for optimizing well trajectories in fractured offshore reservoirs, with a focus on the X Block of the Zhujiangkou Basin. The method integrates in situ stress analysis and fracture prediction within a three-dimensional geomechanical modeling framework, tailored to the complex tectonic and sedimentary characteristics of offshore environments. Multi-source geological and engineering data—including core observations, borehole imaging, well logs, and marine seismic interpretation—are synthesized to reconstruct the subsurface stress field and assess fracture development along potential well paths. Key geomechanical parameters, such as principal stress magnitudes and orientations, rock mechanical properties, and fracture propagation tendencies, are quantitatively evaluated to identify fracture-prone zones and mitigate drilling risks. This methodology enables dynamic adjustment of well trajectories to avoid high-stress zones while maximizing contact with productive fracture networks. A case study from a structurally complex marine fractured reservoir demonstrates the practical applicability of this approach, offering valuable guidance for safe and efficient offshore drilling design in geomechanically sensitive environments. The results highlight the significance of incorporating marine geomechanical insights into trajectory planning for enhanced reservoir development.

1. Introduction

Optimizing well trajectory is critical for maximizing reservoir contact, enhancing hydrocarbon recovery, and minimizing drilling risks—particularly in geologically complex and naturally fractured offshore reservoirs. In marine sedimentary environments, where multiphase tectonic activity and rapid sedimentation commonly result in highly heterogeneous stress regimes and fracture systems, the orientation and magnitude of in situ stresses, coupled with fracture development and distribution, exert a decisive influence on wellbore stability, reservoir connectivity, and production efficiency [1,2,3,4]. As offshore oil and gas exploration advances into deeper and more structurally intricate domains, especially in basins like the Zhujiangkou Basin, traditional trajectory planning approaches—primarily relying on geometric targets or petrophysical constraints—are often insufficient for addressing the geomechanical challenges posed by stress concentration zones and complex fracture networks. Importantly, the relative magnitudes of the principal stresses indicate that the present-day stress regime corresponds predominantly to a strike-slip faulting system (SHmax > Sv > Shmin), with localized transitions to a normal faulting regime (Sv > SHmax > Shmin) in structurally uplifted zones. Such results should be strengthened by relevant strike slip studies [5].
Historically, well trajectory design in marine settings has been constrained by the limitations of static geological models, which are often built from core data, imaging logs, and conventional seismic interpretations. These models typically fail to capture the dynamic mechanical behavior of offshore formations under varying stress conditions, especially during active drilling operations [6,7,8]. In deeply buried and fractured marine reservoirs, poor understanding of local stress orientations and fracture mechanics often leads to increased wellbore instability, ineffective fracture intersection, and suboptimal reservoir drainage [9,10,11,12,13]. Recent advancements in marine geomechanics have enabled the development of integrated models that combine in situ stress analysis, rock mechanical property evaluation, and fracture prediction to guide trajectory optimization in offshore settings [14,15,16]. These approaches support dynamic well trajectory adjustments to avoid high-stress regions and target productive fractures. Numerical simulations such as finite element modeling (FEM) and discrete element modeling (DEM) have proven effective in capturing the evolution of stress fields and fracture propagation in marine sedimentary systems [12,17,18], offering valuable insights into rock failure, fracture reactivation, and mechanical responses during drilling.
In offshore basins subjected to complex tectonic overprinting and deep marine deposition, the interaction between marine structural features (e.g., synsedimentary faults, detachment zones) and evolving stress fields leads to highly variable and mechanically diverse fracture systems. Such conditions, as seen in buried hills and deep marine fractured reservoirs, introduce significant uncertainty in trajectory planning [19,20,21]. To address these limitations, increasing attention has been given to integrating geomechanical models with advanced fracture characterization techniques—particularly in marine basins—thereby enabling more predictive and adaptive well trajectory design [22,23,24,25]. By leveraging 3D geomechanical modeling, data-constrained fracture prediction algorithms, and multi-source marine geological datasets—including well logs, core analysis, and seismic data—geomechanics-driven methods are proving increasingly valuable in guiding safe and efficient well placement in offshore fractured reservoirs [26,27,28,29].
The objective of this study is to establish a marine geomechanics-based workflow for well trajectory optimization in fractured offshore reservoirs, with application to the X Block of the Zhujiangkou Basin. The workflow integrates multi-source geological, geophysical, and engineering data to reconstruct a 3D geomechanical model and characterize fracture systems under marine tectono-sedimentary conditions. Specific goals are to: (1) quantify in situ stress fields and heterogeneity through geomechanical modeling; (2) evaluate natural fracture occurrence and activity using a discrete fracture network; (3) identify key geological and geomechanical controls on trajectory risk through grey relational analysis; (4) propose tailored well trajectory strategies for different fracture types and scales; and (5) validate the approach through a case study. This framework provides a robust basis for safe, efficient, and fracture-informed drilling design in geomechanically complex offshore settings.

2. Geological Setting

The study area is situated within the X Depression of the Zhujiangkou Basin, located in the northern margin of the South China Sea (Figure 1a,b). The Zhujiangkou Basin is a Cenozoic extensional rift basin that trends NE–SW and is structurally segmented into three uplifts and two depressions. Among them, the X Depression lies within the northern sag zone and serves as a key hydrocarbon-bearing unit within the Zhu 1 depression. The region has undergone complex tectonic evolution, transitioning from a Mesozoic magmatic arc to Cenozoic extensional subsidence, which significantly influenced the present-day structural framework and in situ stress field. The X 26 Depression, located in the southwestern sector of the X Depression, is primarily bounded by the large-scale normal fault F1 along its southern margin. The stratigraphic succession includes, from bottom to top, the Wenchang, Enping, Zhuhai, Zhujiang, Hanjiang, Yuehai, Wanshan, and Quaternary formations. These formations record a history of syn-rift to post-rift deposition, with alternating episodes of faulting and sedimentation.
Tectonically, the area is characterized by NE- and NWW-trending faults, with evident multi-phase fault activity that has shaped the development of buried hills and fracture networks. The dominant fault trends reflect the shifting regional stress regimes—from early compressional phases to later extensional reactivations. These tectonic events have led to significant structural heterogeneity and anisotropy in the stress field, which directly influences fracture development and distribution. Due to the tectonic complexity, the in situ stress regime within the study area is spatially variable, exhibiting localized high-stress concentrations near fault zones and buried hills. These geological conditions provide a suitable setting for geomechanics-driven well trajectory optimization. Understanding the orientation and magnitude of principal stresses, fault geometries, and fracture propagation patterns is crucial for avoiding drilling hazards and improving well-reservoir contact. This makes the X-26 Depression an ideal case study for applying integrated in situ stress analysis and fracture prediction technologies to optimize well path design in fractured reservoirs.

3. Method and Technique

3.1. Marine Rock Mechanics and In Situ Stress Characterization

To optimize well trajectory in offshore fractured reservoirs, a multi-scale workflow combining laboratory testing, well logging, and empirical modeling was applied. Core samples from representative marine lithologies (sandstone, siltstone, mudstone) were prepared as standard cylinders following ISRM and ASTM guidelines, and typical specimens were photographed to document lithology and natural fractures. Uniaxial and triaxial compression tests (confining pressure 10–40 MPa) were performed using an MTS 815 servo-controlled system (American) to obtain UCS, Young’s modulus, Poisson’s ratio, and stress–strain responses.
Dynamic elastic moduli were derived from well log data (Vp, Vs, density) and calibrated against laboratory measurements. While cohesion and friction angle can in principle be derived from triaxial testing, in this study the number of high-quality, undisturbed samples was limited, and results showed significant variability due to natural fractures, scale effects, and anisotropy. Illustratively, cohesion and friction were first determined directly from mechanical testing. To achieve formation-wide coverage consistent with ISRM recommendations, cohesion and friction angle were then estimated from shale content and porosity derived from well logs, calibrated against available laboratory results. This hybrid approach ensured both local accuracy and spatial continuity of strength parameters.
Vertical stress was calculated from overburden density, pore pressure was estimated from resistivity and sonic logs, and horizontal stresses were derived from poroelastic theory, further calibrated with borehole failures and leak-off tests. To ensure reliability, pore pressure predictions were validated by cross-checking with formation pressure test data (e.g., MDT/RFT measurements) and mud weight records, as well as by comparing seismic velocity–derived pore pressure trends with log-based estimates. The consistency among these independent datasets confirmed the robustness of the pore pressure model, which is critical for constraining effective stresses and evaluating wellbore stability. The integrated dataset—laboratory results (Table 1), calibrated log-based parameters, validated pore pressure, and reconstructed stress fields—was incorporated into a three-dimensional geomechanical model, capturing the anisotropy and heterogeneity of the Zhujiangkou Basin and supporting fracture prediction and trajectory optimization.
E = ρ 3 Δ t s 2 4 Δ t p 2 Δ t s 2 Δ t s 2 Δ t p 2
µ = 0.5 Δ t s 2 Δ t p 2 Δ t s 2 Δ t p 2
where E is Young’s modulus, MPa; μ refers to the Poisson’s ratio, dimensionless; ρ shows the rock density, kg/m3; Δ t s and Δ t p refer to the time difference of shear wave and portrait-wave, respectively, μs/ft.
S H = 1 2 ξ 2 E 1 μ + 2 μ 1 μ S V α P P + ξ 2 E 1 + μ + α P P ,
S h = 1 2 ξ 1 E 1 μ + 2 μ 1 μ S V α P P + ξ 1 E 1 + μ + α P P ,
S V = 0 H ρ h g h ,
where SH, Sh, and SV are the maximum horizontal principle stress (HPS), minimum HPS, and vertical principal stress (MPa), respectively; ξ1 and ξ2 are the coefficients of the horizontal stress; α is the Boit coefficient; Pp is the pore pressure (MPa); H is the depth (m); ρ(h) is the density of the overlying strata (a function related to depth) (g/cm3); and g is gravitational acceleration (m/s2). While developing the calculation model, we determined the horizontal tectonic stress coefficient and the Boit coefficient by applying corrections and conducting reverse calculations based on the measured in situ stress data.

3.2. Three-Dimensional Geomechanical Modeling and Stress Field Simulation

A three-dimensional geomechanical model of the study area was developed using finite element methods (FEM). The model incorporates stratigraphy, fault architecture, rock mechanical properties, and petrophysical attributes, providing a realistic representation of subsurface conditions. It was constructed through the following steps: (1) model inputs: geological (faults, formations), petrophysical (density, porosity, Vsh), and geomechanical (E, μ, UCS, cohesion) data; (2) stress tensor simulation: the model resolves the full stress tensor at each grid point using governing equilibrium equations:
∇·σ + f = 0
where σ is the stress tensor and f is the body force vector.
Special emphasis was placed on constraining the orientation of the maximum horizontal principal stress (σH), as it represents a key control on fracture prediction and wellbore stability. σH azimuth was determined through a combination of borehole breakout analysis from image logs, drilling-induced tensile fractures identified in oriented wellbore imaging, and regional seismic anisotropy interpretation. The borehole-derived indicators provided direct local constraints, while seismic azimuthal velocity anisotropy offered regional consistency. These datasets showed good agreement, indicating a dominant NE–SW trending σH, consistent with the regional tectonic stress regime. The calibrated geomechanical model therefore computes the spatial distribution of principal stresses (σH, σh, σV), shear stress components, and stress gradients. These outputs form the foundation for stress-sensitive fracture prediction and well trajectory optimization.

3.3. Fracture Prediction and Marine Fracture-Prone Zone Identification

Using the in situ stress simulation results, a fracture prediction model was constructed to evaluate fracture initiation, propagation, and reactivation. The Mohr-Coulomb criterion was applied to assess shear failure, where fracture initiation occurs when the resolved shear stress (τ) on a potential plane exceeds the shear strength defined by cohesion and friction angle (τ ≥ c + σn·tanφ). This allowed identification of shear-dominated fracture zones controlled by elevated differential stresses. In parallel, the Griffith criterion was used to evaluate tensile failure, in which fracture initiation is governed by the balance between tensile stress and the material’s tensile strength, reflecting the propensity for extensional opening under low confining stress. By integrating both criteria, the model captured the dual mechanisms of fracture formation—shear slip and tensile opening—common in structurally complex offshore reservoirs.
Fracture aperture and density were quantified based on energy conservation principles. The work performed by in situ stresses during fracture opening was equated to the strain energy required to create new fracture surfaces, enabling the estimation of fracture aperture as a function of stress intensity and rock elastic properties. Fracture density was then derived by relating the total dissipated strain energy to the energy cost per unit fracture surface area, yielding a scale-consistent parameterization of fracture intensity across reservoir intervals. To further assess fracture activity, slip tendency (τ/σn) and dilation tendency (σn3) were computed using the effective normal and shear stresses resolved on candidate fracture planes relative to local stress orientations and fault geometries. These indices distinguished fractures with high reactivation or conductivity potential, thereby delineating geomechanically sensitive zones along prospective well trajectories.

3.4. Integration of Marine Multisource Data for Well Trajectory Evaluation

To support precise well trajectory optimization, this study integrates geological, geophysical, and geomechanical datasets within a unified framework. Key inputs include: (1) Core and Outcrop Data: Provide direct constraints for mechanical testing and fracture surface characterization. (2) Well Logs: Sonic, density, and image logs were used to derive elastic and strength parameters, as well as fracture orientation and occurrence at the borehole scale. (3) Seismic Data: Supply the regional structural framework, fault and fracture orientations, and stress-sensitive seismic attributes. (4) Borehole Imaging and Drilling History: High-resolution borehole image logs were analyzed to identify natural fractures, drilling-induced tensile fractures, and borehole breakouts, thereby constraining local stress orientations. Drilling history records—including caliper enlargement, mud loss, and collapse intervals—were systematically examined to validate geomechanical predictions and highlight weak or unstable zones along the borehole trajectory.
These datasets were spatially aligned and integrated into a 3D geomechanical property model, which includes volumetric distributions of elastic parameters (Young’s modulus, Poisson’s ratio), in situ stress tensors (σH, σh, σV), fracture attributes (orientation, density, aperture, conductivity), and derived rock brittleness and fracture propagation indices. The model provides the basis for identifying geohazard-prone intervals, delineating high-conductivity fracture corridors, and supporting well path designs that balance drilling safety with reservoir connectivity.

3.5. Dynamic Risk Assessment Along Potential Well Trajectories

Using the established geomechanical model, a well path evaluation module is developed to dynamically assess the mechanical and structural risks along candidate trajectories. For any proposed trajectory, the following evaluations are performed at discrete intervals. Stress Intersection Analysis: Determines the angle between borehole trajectory and principal stress directions to evaluate breakout and tensile failure risk. Fracture Intersection Density: Calculates the number and type (open, sealed, conductive) of fractures the wellbore is likely to intersect, based on 3D DFN models. Fracture Reactivation Potential: Assesses slip tendency and dilation tendency based on current stress regime and fracture orientation. Wellbore Stability Prediction: Uses failure envelopes (Mohr-Coulomb or Hoek-Brown criteria) to predict drilling-induced failure zones. Results from this analysis are expressed as risk indices or suitability scores along the wellbore trajectory, guiding real-time trajectory adjustments.

3.6. Intelligent Well Trajectory Optimization Workflow in Offshore Reservoirs

A semi-automated well path optimization workflow is developed by coupling geomechanical evaluation with trajectory design algorithms. Definition of Target Zones: Based on reservoir geometry, effective fracture distribution, and production objectives. Initial Trajectory Generation: Using conventional well planning software to propose 3D well paths under geometric constraints. Multi-Objective Scoring: Each candidate trajectory is scored based on: Minimization of stress anisotropy and breakout risk; Maximization of effective fracture intersection; Avoidance of critically stressed faults; Drilling efficiency and tortuosity minimization. Iterative Optimization: A multi-objective optimization algorithm (e.g., genetic algorithm or simulated annealing) is applied to iteratively search for optimal trajectories based on scoring results. Decision Support Visualization: All evaluations are integrated into a visualization dashboard where engineers can compare trajectory scenarios interactively, supported by Mohr circle displays and 3D geological cross-sections.
The proposed method is applied to a structurally complex fractured reservoir characterized by steeply dipping faults and stress field heterogeneity. In this case, the optimized trajectory successfully avoided high-stress zones and intersected multiple conductive fractures.

4. Results

4.1. Developmental Characteristics of Structural Fractures

Fracture orientation and dip angle characteristics were systematically analyzed across different vertical structural zones in the study area, specifically focusing on the weathered crust and inner zone. To visualize and compare the fracture geometries, rose diagrams of fracture orientations and histograms of dip angle distributions—including both all observed fractures and those classified as high-conductivity—were constructed (Figure 2a,b). In the weathered crust, the dominant fracture orientations range from 60° to 120°, corresponding to the influence of regional extensional stress fields. The majority of fractures in this zone display dip angles between 10° and 50°, with high-conductivity fractures—those most likely to contribute to fluid flow—also concentrated within this range. This suggests that fractures formed in the weathered crust are not only preferentially oriented but also mechanically favorable for conductivity under current stress conditions. In contrast, the inner zone exhibits more complex fracture orientation distributions. The dominant strike directions are primarily clustered within 60–90°, with additional secondary clusters observed at 110–160° and 10–40°, indicating the superposition of multiple tectonic events. Dip angles in the inner zone generally range from 30° to 70°, while high-conductivity fractures are mainly concentrated between 10° and 30°, possibly reflecting variations in local mechanical stratigraphy and fracture reactivation patterns.
To better understand the spatial variation of fracture attributes, statistical analyses were conducted to explore the relationships between key fracture parameters—such as dip angle, orientation, strike, and dip direction—and the distance from major controlling faults. The resulting cross-plots (Figure 2c–e) reveal distinct trends: (1) fracture dip angles exhibit a positive correlation with distance from the main fault, implying reduced shear displacement influence at greater distances; (2) fracture line density initially decreases, reaches a minimum at approximately 2500 m from the fault, and then increases again, suggesting a zone of mechanical stress shadow or fracture shielding; (3) fracture orientations become progressively less variable with increasing distance, indicating more uniform stress conditions away from fault zones; and (4) fracture dip directions follow a non-monotonic trend—first increasing, then decreasing, and finally increasing again—possibly due to the combined effects of fault-related stress perturbations and local lithological heterogeneity. These results emphasize the spatial heterogeneity and fault-controlled distribution of fracture networks, which are essential considerations for accurate in situ stress field reconstruction and fracture prediction. Understanding how fracture geometries vary with structural positioning enables more precise geomechanical modeling, which in turn supports intelligent well trajectory optimization. By targeting zones with favorable fracture orientations and dips—while avoiding regions with complex or ineffective fracture systems—drilling strategies can be dynamically adjusted to maximize reservoir contact, enhance hydraulic connectivity, and minimize the risks associated with unstable or unproductive intervals. This integrative geomechanics-fracture framework provides a robust foundation for safe and efficient development in structurally complex and heterogeneous reservoirs.

4.2. Geomechanical Characteristics of Typical Well Sections

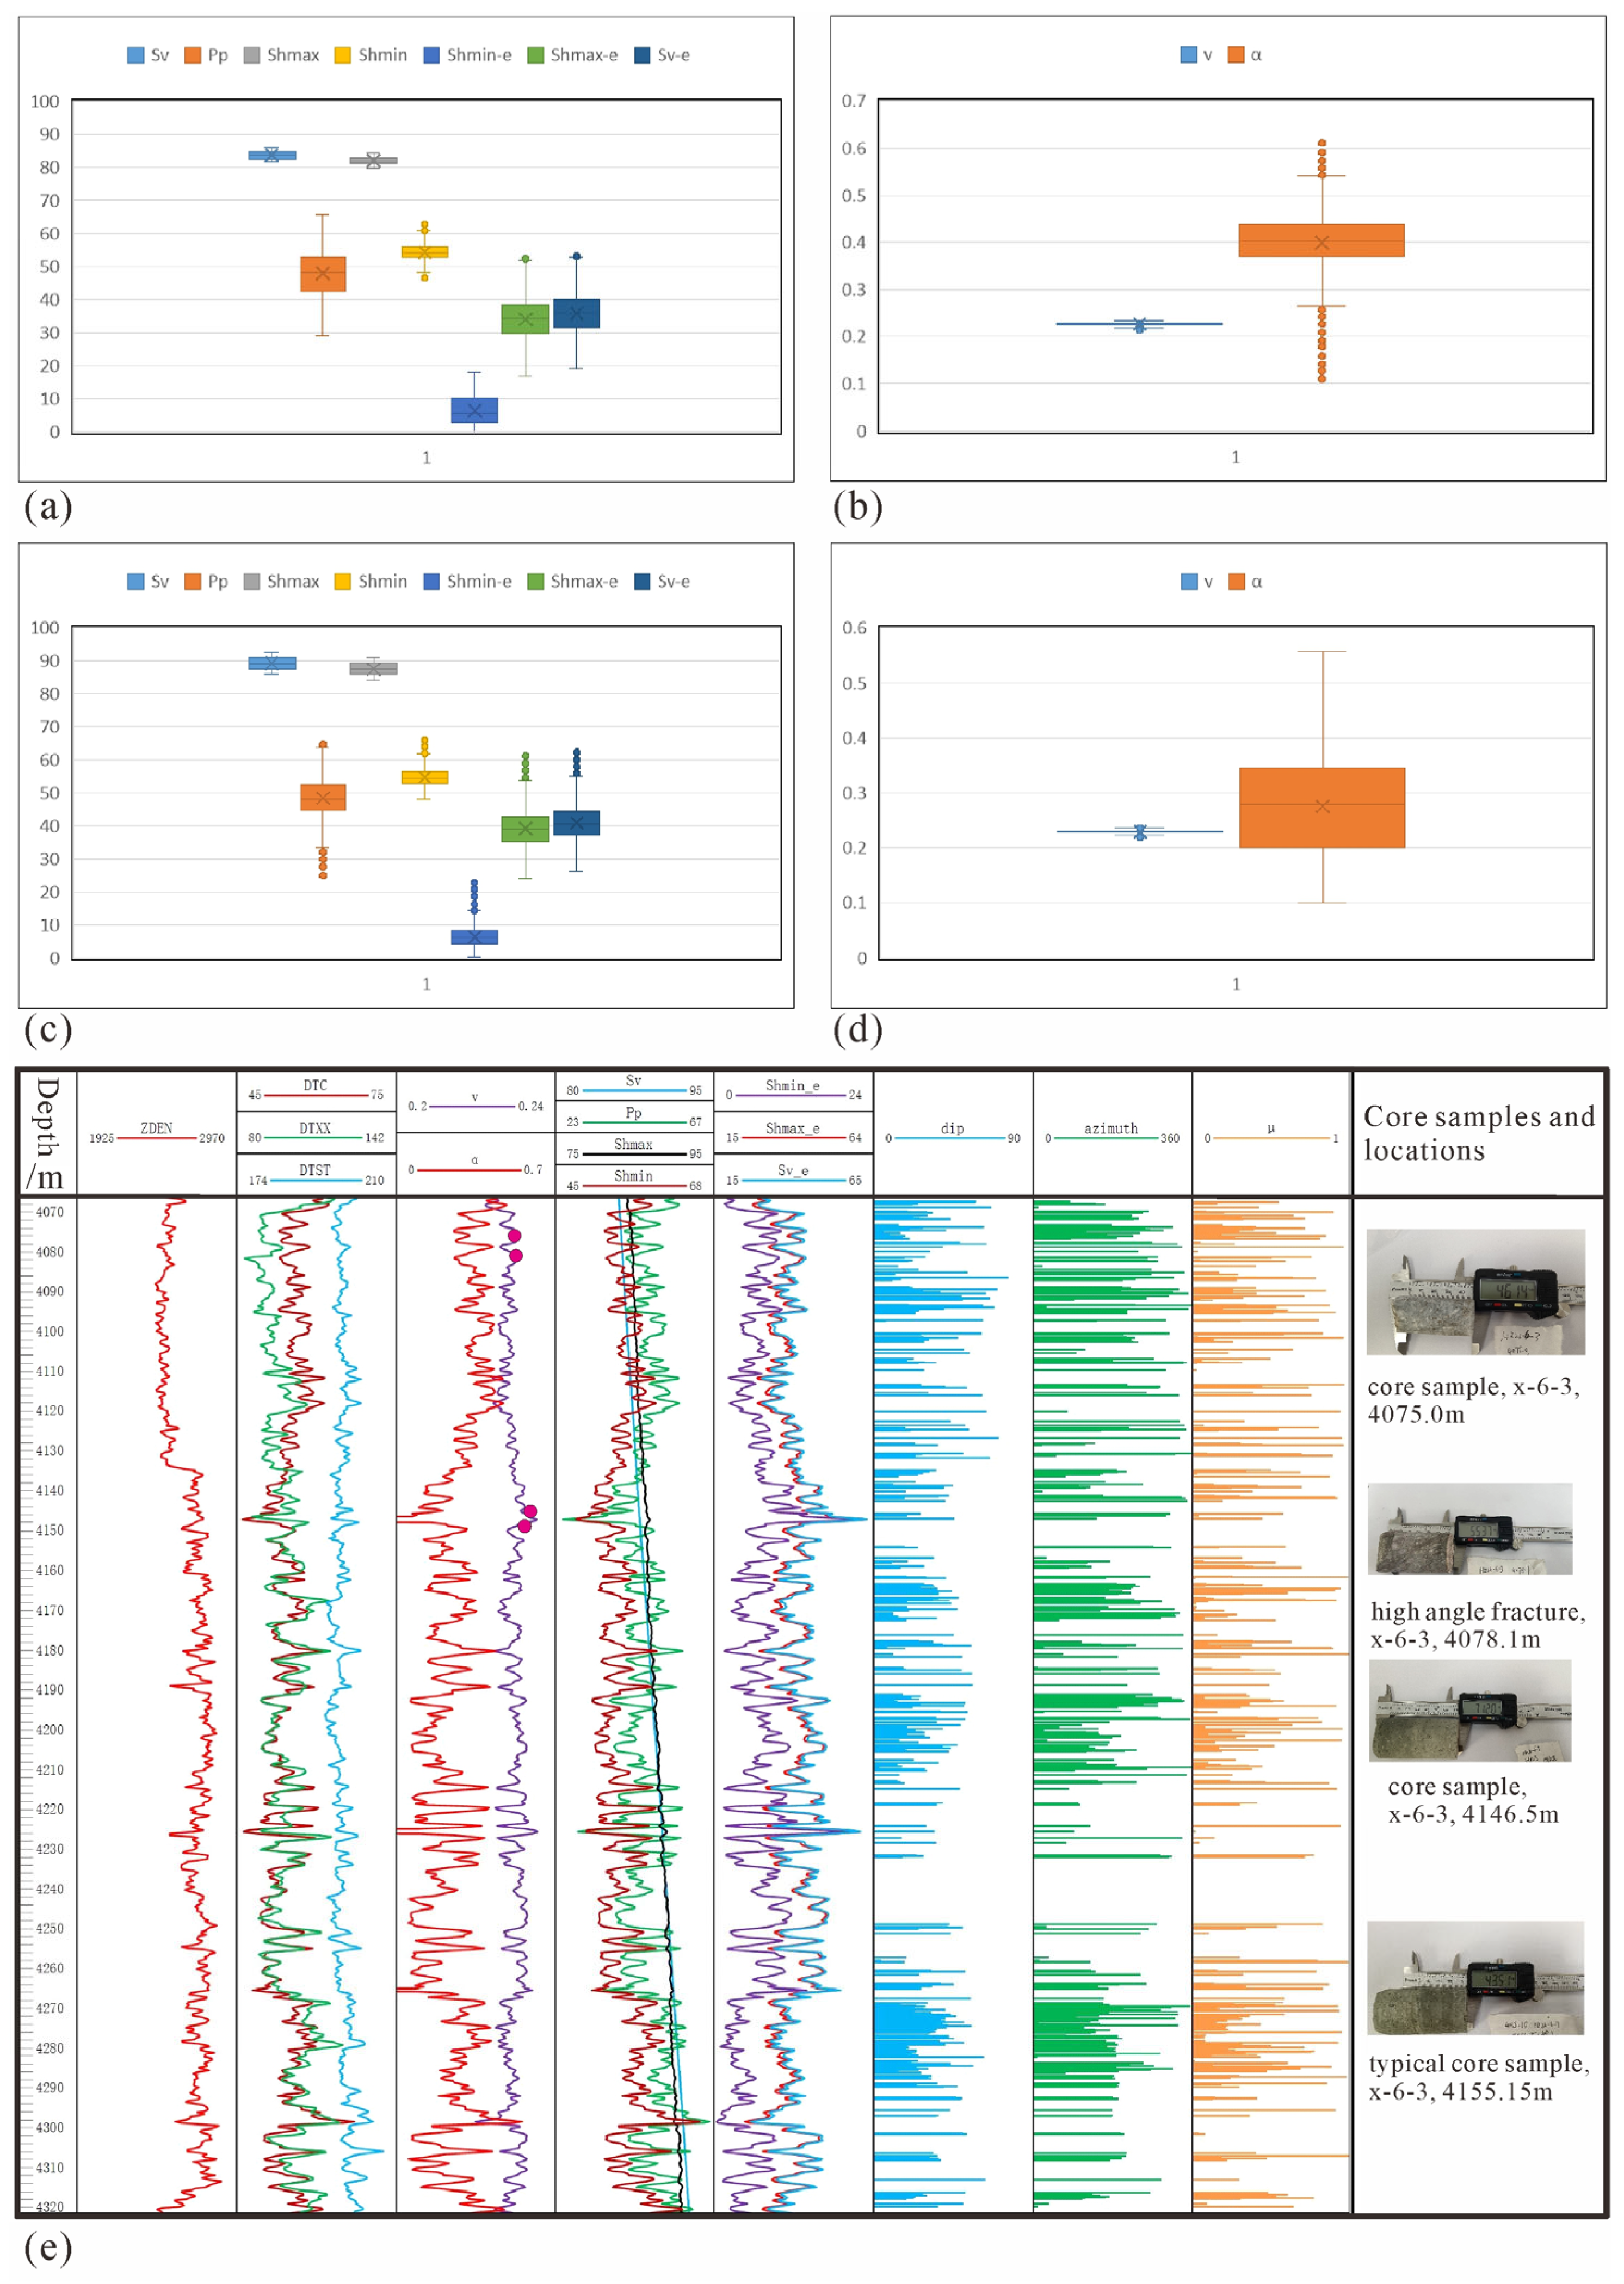
Taking Well X-6-3 as a representative example, a suite of key geomechanical parameters—including vertical stress (Sv), maximum and minimum horizontal stresses (SHmax, Shmin), their effective counterparts (Sv-e, SHmax-e, Shmin-e), pore pressure (Pp), Poisson’s ratio (v), Biot’s coefficient (α), and the fracture surface activity index (μ) (Figure 3a–d). These parameters were further integrated using Resform 3.5 software to construct continuous geomechanical profiles along typical intervals (Figure 3e), enabling a high-resolution understanding of stress and mechanical heterogeneity with depth. The results indicate that Poisson’s ratio in the Wenchang Formation is relatively stable, predominantly ranging between 0.23 and 0.25, while the effective stress coefficient shows moderate variation from 0.35 to 0.45. The vertical principal stress falls between 82–86 MPa, and pore pressure varies from 42 to 55 MPa. SHmax is mainly concentrated within 81–84 MPa, whereas Shmin ranges from 52 to 56 MPa. In terms of effective stress, SHmax-e ranges from 30 to 40 MPa, Shmin-e from 2 to 10 MPa, and Sv-e from 32 to 41 MPa. Stratigraphic comparisons reveal subtle but important contrasts: within the Pre-Paleogene Formation, Sv, SHmax, and Shmin are approximately 86–92 MPa, 85–90 MPa, and 52–55 MPa, respectively. These variations underscore the depth-dependent nature of the stress regime and its sensitivity to lithological and tectonic differences.
Overall, the analysis highlights pronounced spatial variability and stratified zoning in the in situ stress field, driven by both burial depth and tectonic history. This refined geomechanical characterization provides a scientific basis for optimizing wellbore trajectories and fracture targeting. By integrating these insights into well planning, it becomes possible to avoid high-risk stress concentrations, align boreholes with favorable stress orientations, and enhance the likelihood of intersecting productive fracture networks—ultimately improving reservoir stimulation efficiency and production outcomes in complex structural settings.

4.3. Geomechanical Modeling and Numerical Simulation

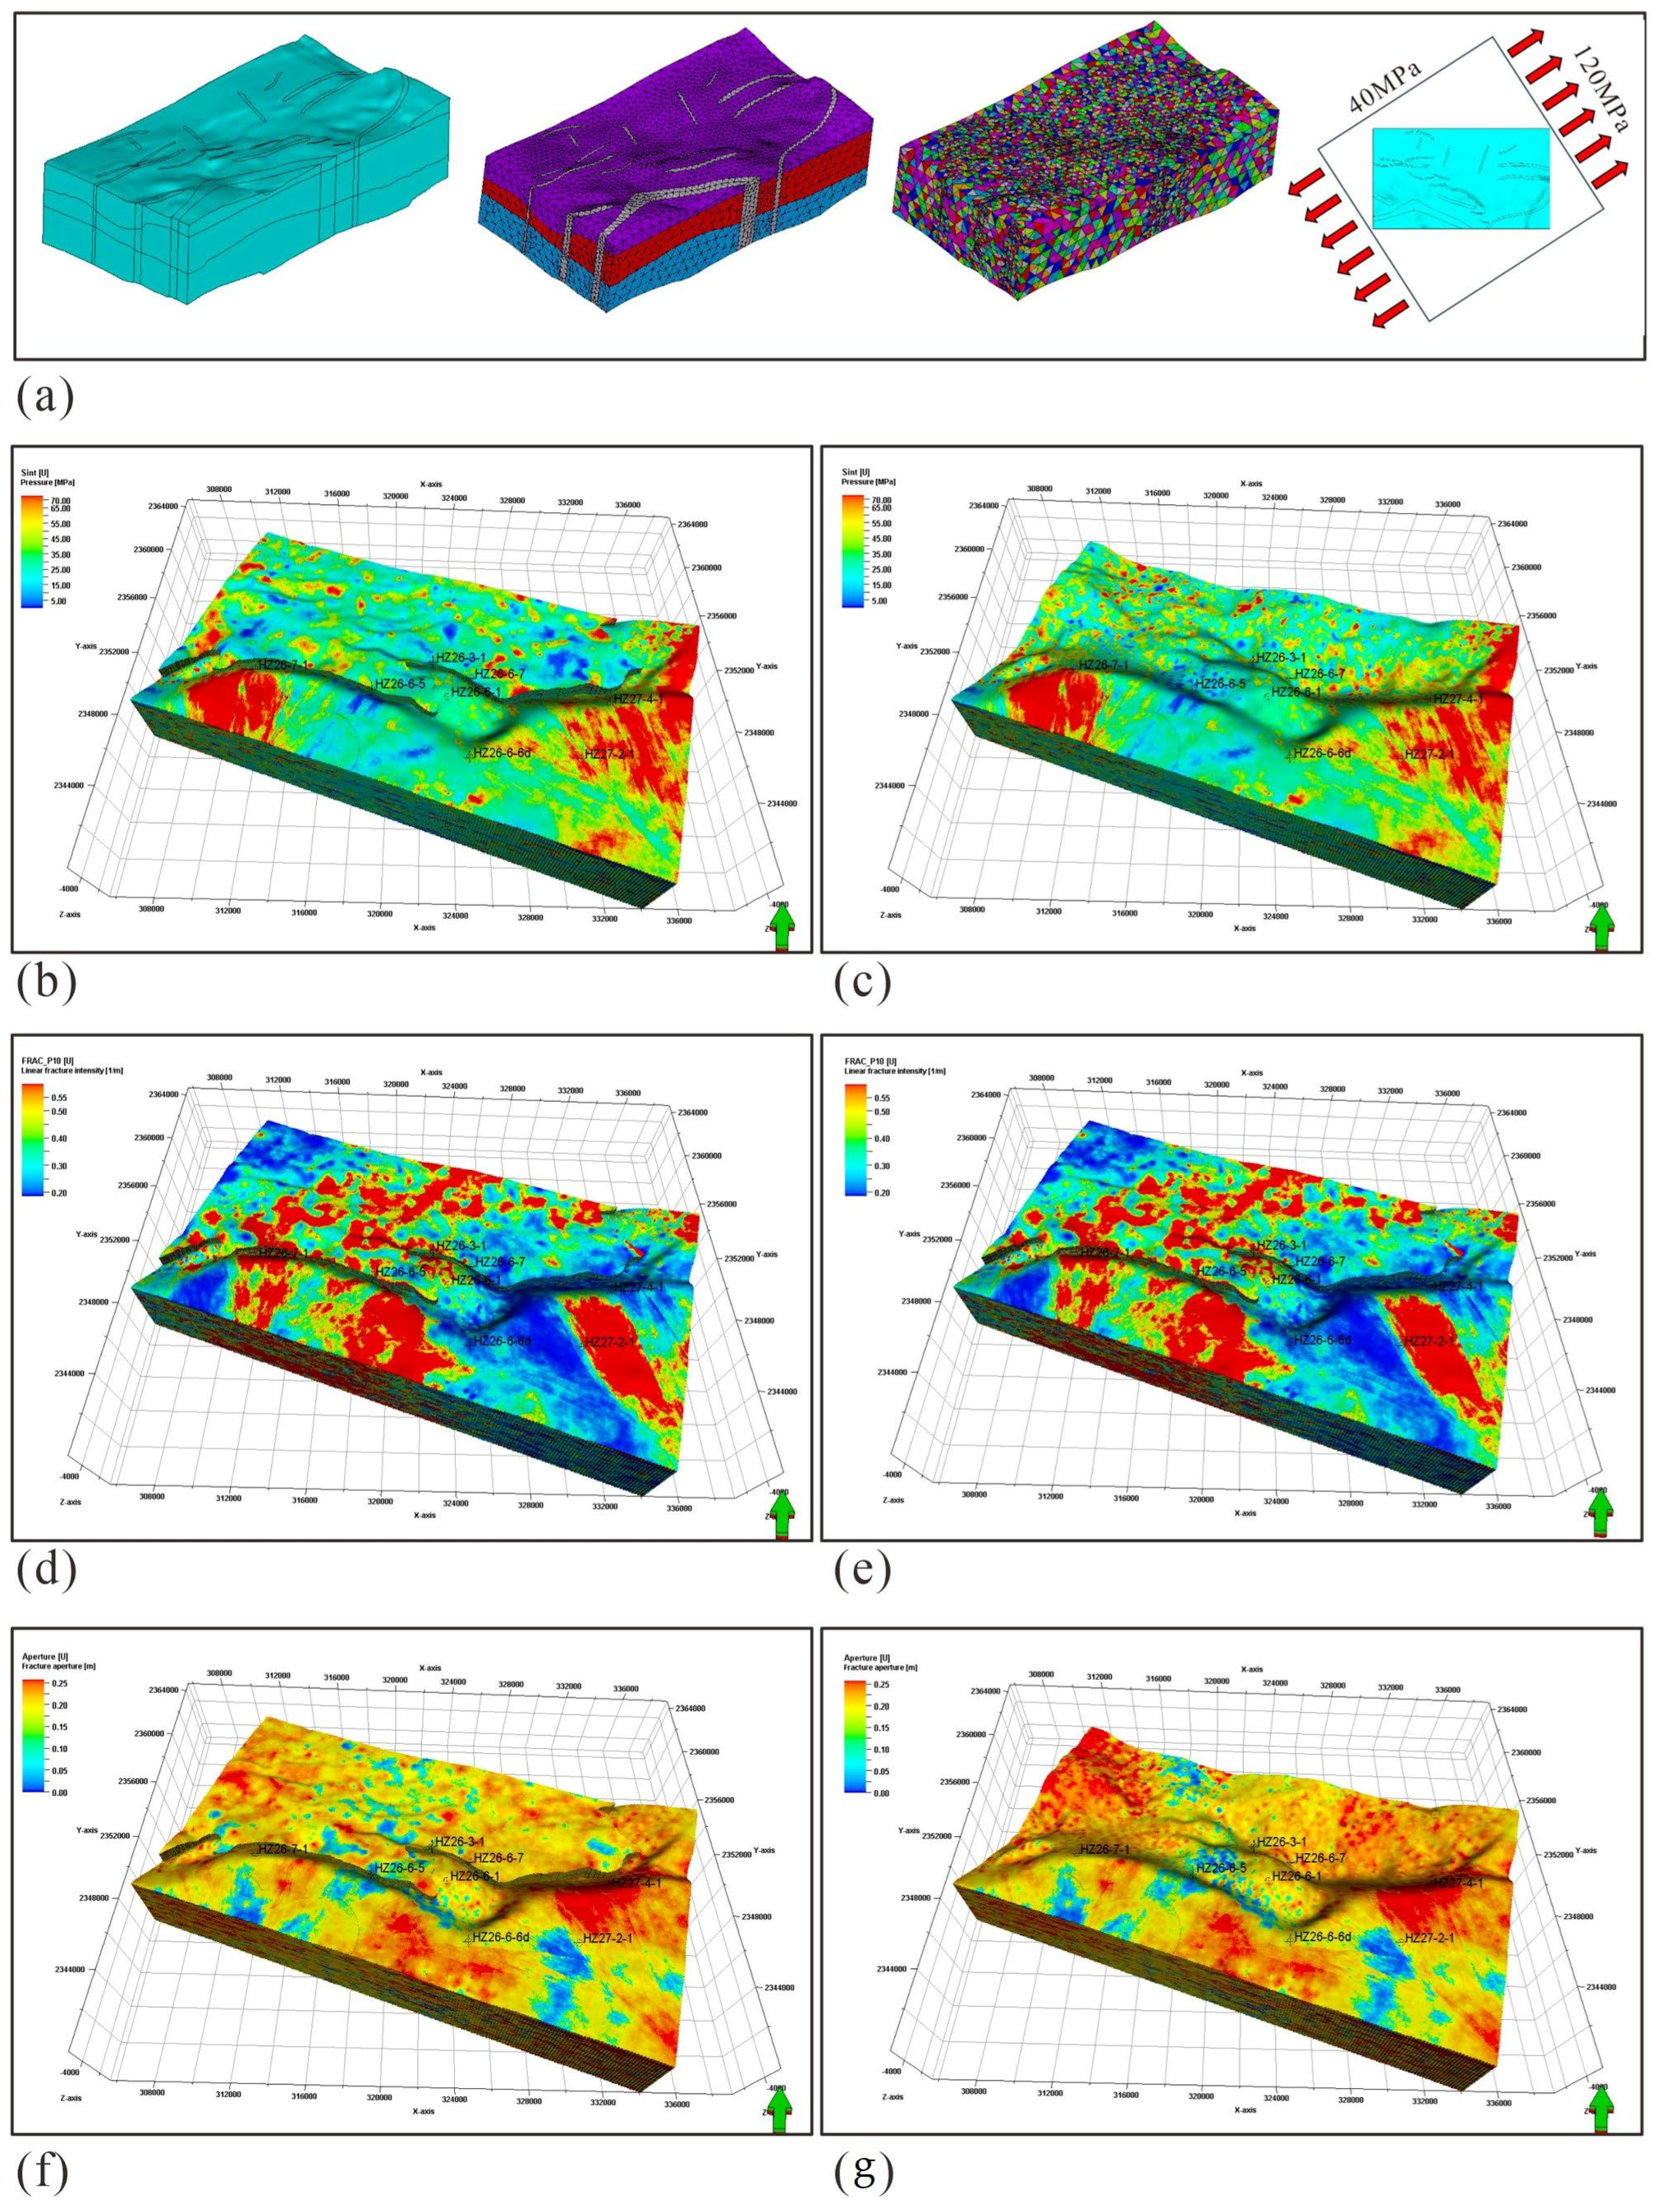
To accurately constrain the in situ stress regime within the study area, a three-dimensional geomechanical model was constructed based on imaging logging data and induced fracture indicators. The boundary conditions applied included a 120 MPa NE–SW extensional stress, gravity-based vertical loading, and fixed constraints at the model base (Figure 4a). The geological model encompassed 56,663 nodes and 200,991 elements, with calibrated mechanical parameters assigned to each grid cell. Simulation results reveal significant spatial variation in the present-day stress field. The maximum horizontal principal stress ranges from 60 to 100 MPa, with elevated values concentrated in the western and eastern sectors (80–100 MPa) and relatively lower values (60–80 MPa) in the central zone. With increasing depth, high-stress zones evolve from broad distributed belts to more localized clusters, particularly around fault intersections, structural highs, and fault tips. The minimum horizontal stress varies between 40–75 MPa, following a similar spatial pattern. Stress intensity maps indicate strong spatial heterogeneity, with concentrations primarily located around fault terminations and intersections, and lower values within fault cores (Figure 4b,c). These patterns intensify with depth, reflecting the cumulative effects of structural deformation and lithological contrast. Notably, stress differences across these interfaces are closely linked to lithological transitions, further emphasizing the need for depth-specific wellbore design strategies.
Especially, the relative magnitudes of the principal stresses indicate that the present-day stress regime corresponds predominantly to a strike-slip faulting system (SHmax > Sv > Shmin), with localized transitions to a normal faulting regime (Sv > SHmax > Shmin) in structurally uplifted zones. This classification provides a critical tectonic framework for understanding fracture development and assessing wellbore stability in the study area. Building on the stress field simulation, fracture prediction was carried out by coupling the geomechanical model with calibrated failure criteria appropriate for the local rock types. The resulting predictions of fracture line density and aperture demonstrate that fractures are preferentially developed in structurally favorable zones, including fault cores, fault intersections, and uplifted blocks (Figure 4d–g). The fracture density exhibits a scattered point-like distribution, heavily influenced by NW–SE striking faults, while fracture aperture is most pronounced in zones dominated by NE–SW faulting. Both attributes reveal a high degree of spatial heterogeneity controlled by the structural fabric of the reservoir.
Imaging logging data were used for validation, revealing a high correlation between predicted and observed fracture density and aperture, with a match rate exceeding 85%. This strong correspondence affirms the robustness of the geomechanical simulation approach and supports its application in predicting fracture development within complex tectonic settings. Based on the profile characteristics of stress intensity, fracture linear density, and fracture aperture (Figure 5a–c), the vertical geomechanics were characterized by strong heterogeneity and a discrete sporadic distribution.
These results provide a solid foundation for integrating stress field analysis and fracture prediction into well trajectory design. By explicitly defining the strike-slip–dominated fault regime and its local variations, drilling strategies can be more effectively tailored to target geomechanically favorable intervals while avoiding mechanically unstable zones, thereby enhancing reservoir contact, reducing drilling risk, and improving overall production efficiency.

5. Discussion

5.1. Distributional Characteristics of Fracture Activity in Marine Setting

Accurately characterizing fracture activity under the present-day in situ stress regime is essential for optimizing well trajectories in fractured marine reservoirs, where depositional and tectonic processes commonly result in complex fault-fracture systems. In this study, a marine geomechanics-driven modeling framework was employed, integrating discrete fracture networks (DFNs), reservoir geomechanics, and fracture mechanics to simulate the mechanical response of faults and fractures within a typical offshore setting. The DFN methodology allows the spatial distribution and geometric complexity of fracture systems—common in deeply buried marine formations—to be represented discretely, enabling localized evaluation of stress perturbations and fracture interactions [16].
Reservoir geomechanics provides the theoretical basis for interpreting the deformation behavior of marine sedimentary rocks under high-pressure, variable stress conditions typical of offshore basins. Fracture mechanics, in turn, facilitates the analysis of crack initiation, propagation, and reactivation potential in fractured marine formations [7]. By integrating these domains, the effective normal and shear stresses across fracture and fault surfaces were quantitatively computed (Figure 6a,b). These stress components act as direct proxies for fracture activity: elevated normal stress inhibits slip and indicates low activity, while higher shear stress enhances the potential for fracture reactivation.
To classify fracture behavior across the study area in the Zhujiangkou Basin, a fracture activity index was developed based on the calculated stress fields. The index ranges from 0 to 1 and is divided into three categories: inactive (0–0.6), moderately active (0.6–0.8), and highly active (0.8–1.0) (Figure 6c,d). This classification provides a reliable basis for identifying geomechanically sensitive regions in offshore settings. To improve prediction precision, a multi-parameter constraint system was established, incorporating marine geological and mechanical attributes such as fracture density, aperture, and in situ stress conditions. Fracture density reflects the structural complexity associated with marine tectono-sedimentary evolution; aperture directly influences fluid transmissibility and mechanical response; and the in situ stress field governs both fracture propagation and slip tendency. Calibrated thresholds for these parameters—derived from field measurements and modeling experience—enabled accurate delineation of zones with elevated fracture activity. This integrated marine geomechanical workflow offers a robust foundation for identifying fracture-prone zones, reducing drilling risks, and improving well placement strategies in offshore fractured reservoirs.

5.2. Key Parameters Influencing Well Trajectory Optimization in Offshore Reservoirs

Effective trajectory optimization in structurally complex marine reservoirs requires a stepwise translation of geomechanical insights into actionable well path adjustments [21,30]. In this study, the workflow proceeded as follows:
(1)
Parameter integration. Geological and geomechanical factors controlling wellbore stability and fracture intersection were compiled, including fracture characteristics (density, aperture, dip angle, strike, and activity), fault attributes (scale and proximity), and stress field components (effective normal and shear stresses, principal stress magnitudes, and stress intensity). These inputs were mapped within the 3D geomechanical model to delineate candidate drilling domains.
(2)
Threshold-based screening. Zones with unfavorable conditions—such as high stress intensity or densely clustered active fractures—were filtered out using calibrated parameter thresholds derived from core observations, borehole failures, and log responses. This step identified geomechanically stable regions suitable for potential wellbore placement.
(3)
Quantitative sensitivity analysis. Grey relational analysis was applied to evaluate the relative influence of each parameter on trajectory optimization. Results show that fracture-related attributes exert the strongest control, with grey relational indices for fracture density (0.3142), aperture (0.2885), activity (0.3188), and dip angle (0.3306). Fault scale (0.2308) and distance to fault (0.2547) further emphasize the critical role of fault proximity in offshore well planning. Among stress attributes, effective shear stress (0.1517) and stress intensity (0.1514) were more relevant to drilling risk than absolute stress magnitudes, underscoring the role of localized stress concentrations in marine basins.
(4)
Trajectory adjustment. Based on the sensitivity rankings, well paths were iteratively adjusted to avoid geomechanically adverse domains while maximizing contact with moderately developed conductive fractures. This entailed deviating trajectories away from intensely fractured or fault-damage zones, steering towards structurally favorable corridors, and incorporating sidetracking contingencies when fault crossings were unavoidable (Table 2).
(5)
Field validation. Compared with the original design, the optimized well path demonstrated a 25% reduction in drilling-related stability issues, a 40% increase in cumulative fracture exposure, and a 30% improvement in initial production rate. These outcomes confirm that the parameter-driven, geomechanics-based workflow effectively transforms subsurface stress–fracture characterization into practical guidance for safer and more productive drilling.
For fault-related parameters, the indices for fault scale (0.2308) and distance to fault (0.2547) confirm the controlling effect of fault proximity—often a critical factor in offshore drilling due to the high likelihood of fault reactivation and associated instability. Among the stress field components, effective shear stress (0.1517) and stress intensity (0.1514) are more impactful than minimum and maximum principal stress magnitudes, suggesting that localized stress concentration zones, common in marine basins, play a decisive role in trajectory adjustments. This parameter-driven optimization strategy, rooted in marine geomechanics, enhances the accuracy and safety of offshore drilling operations by aligning well trajectories with structurally and mechanically favorable zones. The methodology is especially valuable in geologically complex offshore environments like the Zhujiangkou Basin, where conventional trajectory design approaches often fail to account for the dynamic interplay between fractures, faults, and stress fields in marine sediments.

5.3. Marine-Adapted Well Trajectory Optimization Strategies Based on Fracture Scale Classification

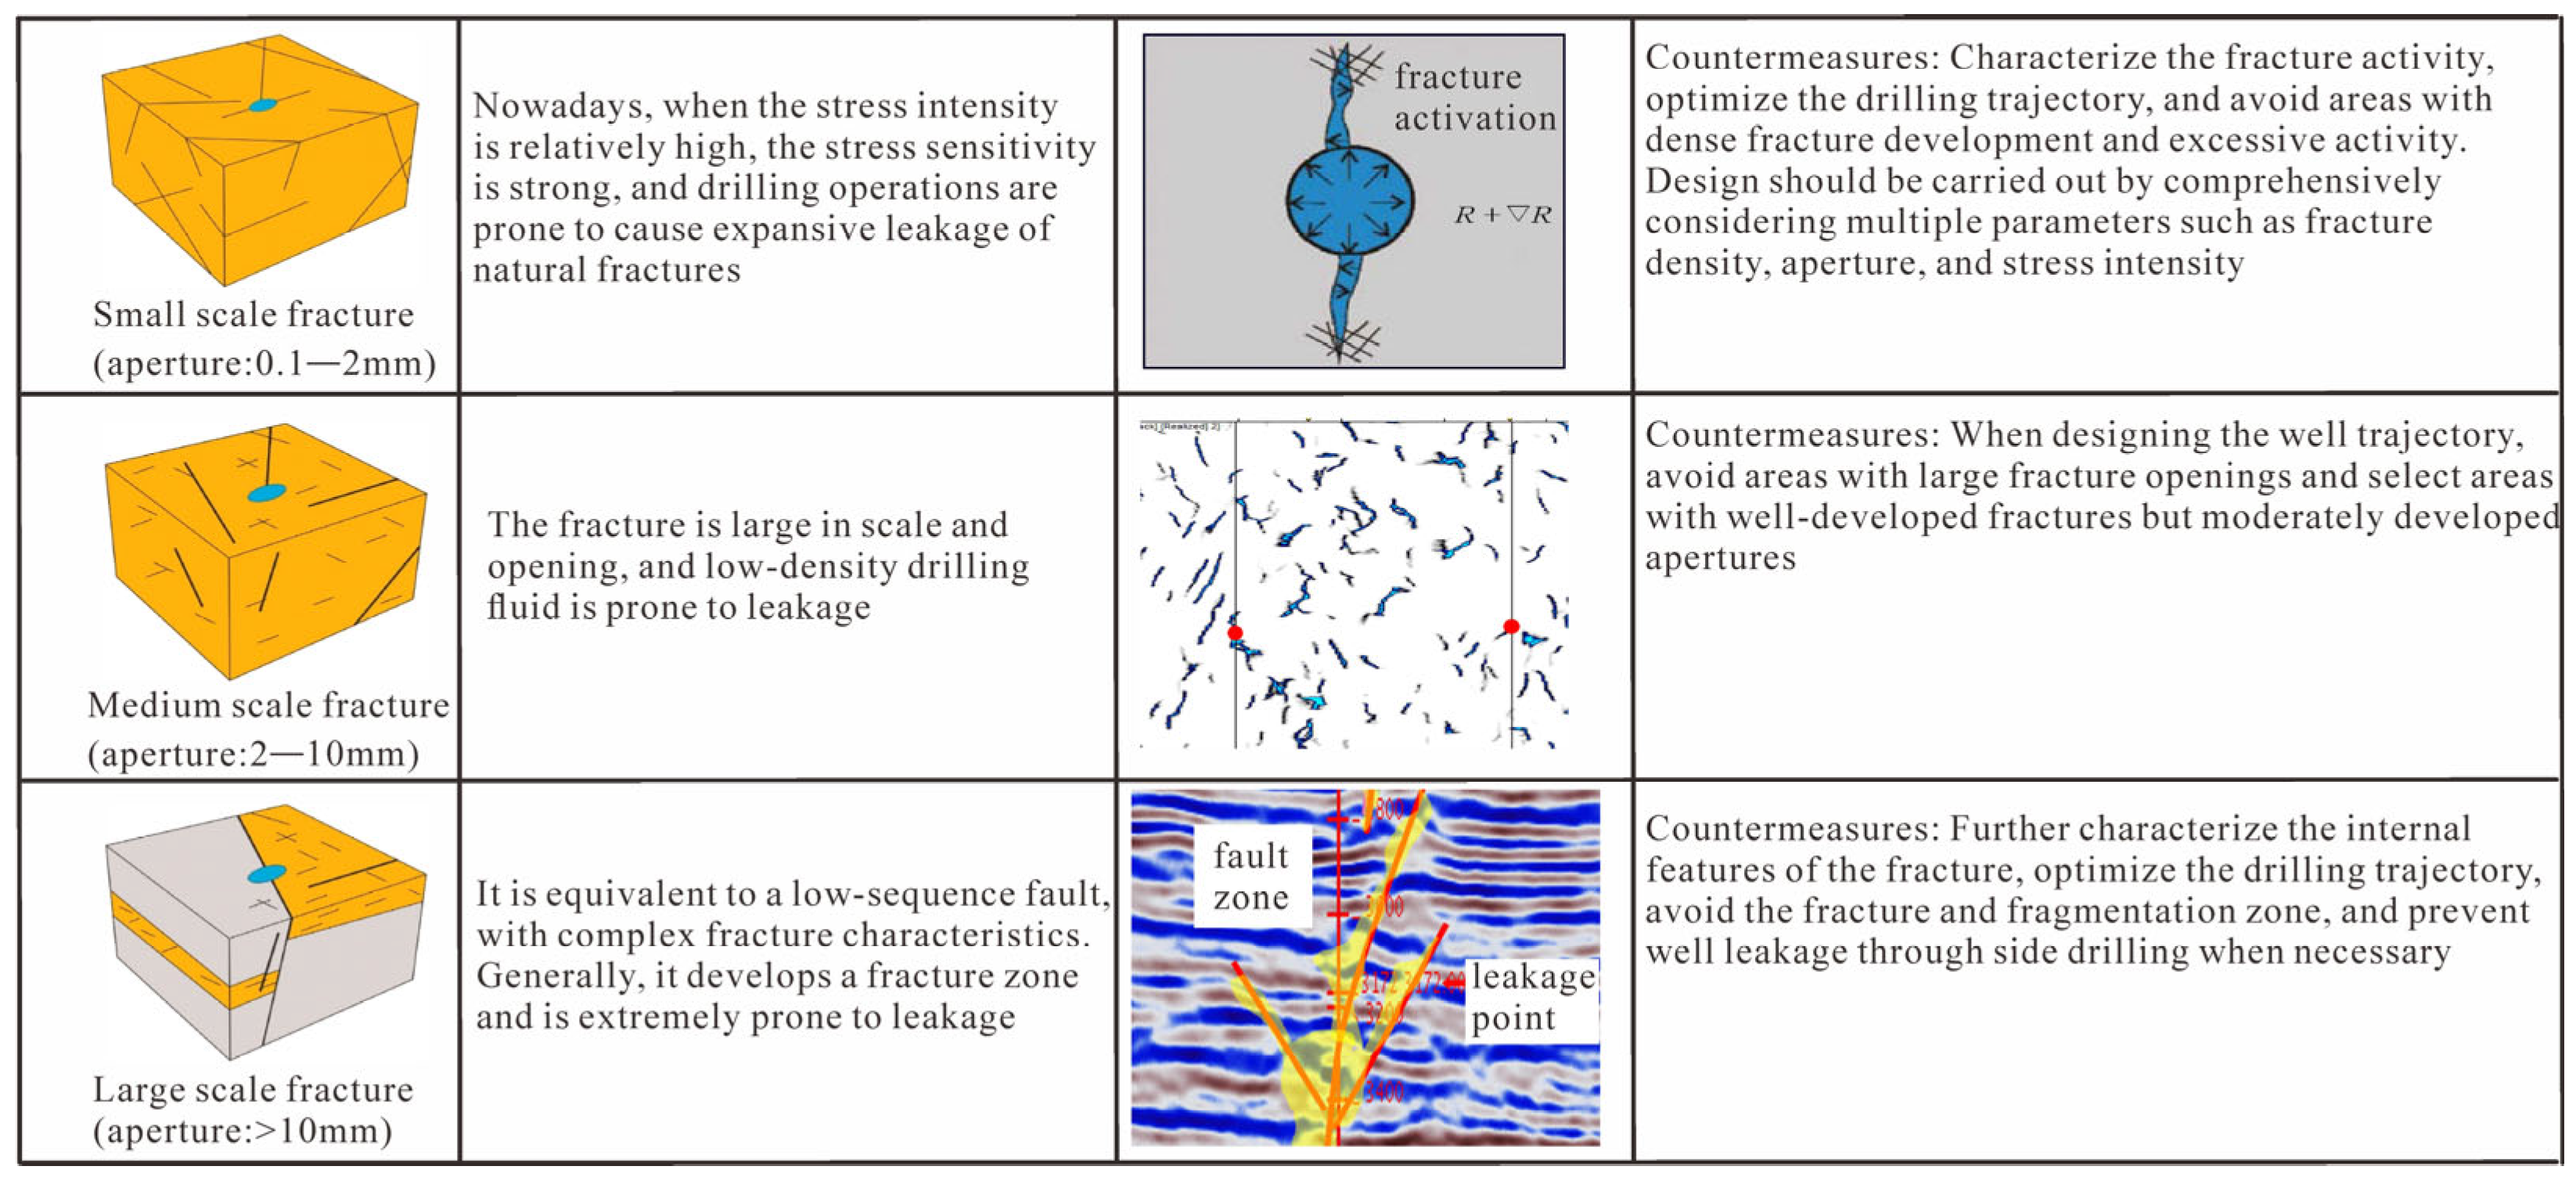
Building upon the multi-scale fracture classification in the marine fractured reservoir of the X Block, Zhujiangkou Basin, a geomechanics-informed workflow was developed to guide well trajectory optimization and mitigate operational risks in offshore drilling (Figure 7). The workflow systematically integrates fracture characteristics, in situ stress analysis, and structural data to assess geomechanical hazards—including borehole instability, fracture intersection, and localized stress concentration—and to translate these insights into actionable trajectory adjustments.
(1)
Small-scale fractures (aperture 0.1–2 mm): Predominantly occurring in shale-dominated intervals, these stress-sensitive fractures are prone to aperture closure, dilation under pressure imbalance, or fluid invasion under high in situ stress, potentially causing lost circulation and wellbore instability. Trajectories were therefore routed to avoid zones of dense, highly active small fractures. Risk assessment combined fracture density, aperture, and local stress intensity to identify mechanically favorable drilling corridors.
(2)
Medium-scale fractures (aperture 2–10 mm): These moderately conductive fractures provide potential flow paths but pose significant mud-loss risk in offshore environments, especially under low-density drilling fluids. Trajectory planning targeted regions with moderately developed, mechanically stable fractures, identified through integration of seismic interpretation, borehole image logs, and geomechanical modeling. This balance minimized formation damage while maintaining reservoir connectivity.
(3)
Large-scale fractures (aperture > 10 mm): Typically associated with low-order faults or major fracture corridors, these zones exhibit complex internal damage, high connectivity, and elevated mechanical risk, particularly near structural highs or basin-margin faults. Detailed geomechanical characterization, including stress concentration and fault core architecture, informed trajectory adjustments to circumvent direct intersection of high-risk corridors. When unavoidable, sidetracking strategies were incorporated to reduce wellbore instability.
This multi-scale, marine geomechanics-driven framework provides a quantitative basis for proactive risk management, enabling real-time trajectory adjustments to minimize mechanical hazards, enhance reservoir contact, and optimize drilling performance [19]. The approach is especially suited for structurally complex deep marine formations, where conventional trajectory design methods may fail to anticipate the evolving mechanical behavior of fracture networks under operational stress conditions.

6. Conclusions

This study proposes a marine geomechanics-based workflow for well trajectory optimization in fractured offshore reservoirs, exemplified by a case study in the X Block of the Zhujiangkou Basin. By systematically integrating in situ stress analysis and fracture prediction within a 3D geomechanical framework, the approach addresses the unique challenges associated with fracture characterization and well planning in structurally complex marine sedimentary environments. The method improves drilling safety, enhances reservoir contact, and supports efficient development under offshore geological constraints.
(1)
A three-dimensional marine geomechanical model was constructed by integrating multi-source data—such as core observations, borehole imaging, well logs, and marine seismic interpretation—capturing the tectono-sedimentary complexity of the offshore Zhujiangkou Basin. The model enabled quantitative calculation of principal stress orientations, effective normal and shear stresses, and stress intensity, revealing clear vertical and lateral stress zoning patterns critical for safe and effective wellbore design in marine strata.
(2)
A discrete fracture network (DFN) integrated with the geomechanical model was used to evaluate the spatial distribution and activity of natural fractures in the offshore reservoir setting. By coupling fracture density, aperture, orientation, and in situ stress conditions, a fracture activity index was developed to classify fractures into inactive, moderately active, and highly active types—providing a practical basis for identifying geomechanically sensitive zones along prospective marine well paths.
(3)
Grey relational analysis was employed to quantify the influence of key geological and geomechanical parameters on trajectory optimization. The results show that fracture development parameters—particularly density, aperture, activity, and dip angle—and proximity to faults exert the strongest control. Among stress-related attributes, effective shear stress and overall stress intensity were found to be more relevant to trajectory risk evaluation than absolute stress magnitudes, especially in offshore formations affected by long-term tectonic reactivation and compaction.
(4)
Tailored trajectory strategies were proposed based on fracture scale classification. For small-scale stress-sensitive fractures typical of marine mudstone intervals, it is recommended to avoid dense, active zones to minimize instability. For medium-scale conductive fractures, targeting moderately developed regions reduces the risk of lost circulation while maintaining reservoir connectivity. For large-scale fracture corridors or low-order marine faults, trajectory planning should avoid intensely damaged zones, with sidetracking options considered when fault crossing is unavoidable.
(5)
The workflow was successfully applied to a geomechanically complex offshore fractured reservoir, demonstrating its capacity to dynamically adjust well paths in response to evolving stress and fracture conditions. This capability enhances both drilling safety and reservoir contact, thereby improving development performance in marine settings characterized by heterogeneity and structural complexity.
In summary, the study advances a robust and adaptable marine geomechanical methodology for well trajectory optimization. By integrating in situ stress analysis with fracture prediction tailored to offshore geological settings, the approach provides valuable guidance for safe, efficient, and fracture-informed drilling in complex marine fractured reservoirs, contributing to more reliable well planning and improved resource recovery in offshore oil and gas fields.

Author Contributions

Methodology, L.Y. and X.Q.; Validation, J.X.; Formal analysis, G.Z.; Investigation, Q.D., G.Z., X.Q. and Y.T.; Data curation, Q.D. and Y.T.; Writing—original draft, L.Y.; Writing—review & editing, L.Y.; Supervision, J.X. All authors have read and agreed to the published version of the manuscript.

Funding

This research received no external funding.

Data Availability Statement

The original contributions presented in this study are included in the article. Further inquiries can be directed to the corresponding author.

Acknowledgments

We thank CNOOC for financial support and the research team and laboratory staff for their technical assistance. We are also grateful to the anonymous reviewers for their constructive comments, which have improved this manuscript. Special thanks are extended to our colleagues for their valuable discussions and to our families for their continuous support during this work.

Conflicts of Interest

Authors Lu Yin, Guangdong Zhang, Xiao Qi and Yi Tang were employed by the company China Oilfield Services Limited. Author Qingjie Du was employed by the company Cnooc (China) Limited Zhanjiang Branch. The remaining authors declare that the research was conducted in the absence of any commercial or financial relationships that could be construed as a potential conflict of interest.

References

  1. Gross, M.R.; Eyal, Y. Throughgoing fractures in layered carbonate rocks. Geol. Soc. Am. Bull. 2007, 119, 1387–1404. [Google Scholar] [CrossRef]
  2. Zeng, L.; Wang, Z.; Xiao, S.; Zhang, G. The origin and geological significance of low dip-angle fractures in the thrust zones of the western basins of China. Acta Pet. Sin. 2008, 30, 56. [Google Scholar]
  3. Zhang, H.; Yin, G.; Wang, H. Effects of natural fractures geomechanical response on gas well productivity in Kuqa Depression, Tarim Basin. Nat. Gas Geosci. 2019, 30, 379–388. [Google Scholar]
  4. Jiang, T.; Zhang, H.; Xu, K.; Yin, G.; Wang, H.; Wang, Z.; Liu, X.J. Technology and practice for quantitative optimization of borehole trajectory in ultra-deep fractured reservoir: A case study of Bozi A gas reservoir in Kelasu structural belt, Tarim Basin. China Pet. Explor. 2021, 26, 149–161. [Google Scholar]
  5. Zhao, T.; Zhang, J.; Ding, W.; Zhao, R.; Radwan, A.E.; Wang, X. Characteristics and application of present in situ stress field of a strike-slip fault: A 3D finite-element simulation study. Geol. Mag. 2022, 159, 2361–2378. [Google Scholar]
  6. Laubach, S.E.; Ward, M.E. Diagenesis in porosity evolution of opening-mode fractures, Middle Triassic to Lower Jurassic la Boca Formation, NE Mexico. Tectonophysics 2006, 419, 75–97. [Google Scholar] [CrossRef]
  7. Liu, B.; Song, Y.; Zhu, K.; Su, P.; Ye, X.; Zhao, W. Mineralogy and element geochemistry of salinized lacustrine organic-rich shale in the Middle Permian Santanghu Basin: Implications for paleoenvironment, provenance, tectonic setting and shale oil potential. Mar. Pet. Geol. 2020, 120, 104569. [Google Scholar] [CrossRef]
  8. Gong, L.; Wang, J.; Gao, S.; Fu, X.; Liu, B.; Miao, F.; Meng, Q. Characterization, controlling factors and evolution of fracture effectiveness in shale oil reservoirs. J. Pet. Sci. Eng. 2021, 203, 108655. [Google Scholar] [CrossRef]
  9. Laubach, S.E.; Diaz-Tushman, K. Laurentian palaeostress trajectories and ephemeral fracture permeability, Cambrian Eriboll Formation sandstones west of the Moine Thrust Zone, NW Scotland. J. Geol. Soc. Lond. 2009, 166, 349–362. [Google Scholar] [CrossRef]
  10. Gale, J.F.; Laubach, S.E.; Olson, J.E.; Eichhubl, P.; Fall, A. Natural fractures in shale: A review and new observations. AAPG Bull. 2014, 98, 2165–2216. [Google Scholar] [CrossRef]
  11. Brooke-Barnett, S.; Flottmann, T.; Paul, P.K.; Busetti, S.; Hennings, P.; Reid, R.; Rosenbaum, G. Influence of basement structures on in situ stresses over the Surat Basin, southeast Queensland. J. Geophys. Res. Solid Earth 2015, 120, 4946–4965. [Google Scholar] [CrossRef]
  12. Gottardi, R.; Mason, S.L. Characterization of the natural fracture system of the eagle ford formation (Val Verde County, Texas). AAPG Bull. 2018, 102, 1963–1984. [Google Scholar] [CrossRef]
  13. Ranjith, P.G.; Wanniarachchi, W.A.M.; Perera, M.S.A.; Rathnaweera, T.D. Investigation of the effect of foam flow rate on foam-based hydraulic fracturing of shale reservoir rocks with natural fractures: An experimental study. J. Petrol. Sci. Eng. 2018, 169, 518–531. [Google Scholar] [CrossRef]
  14. Lorenz, J.C.; Hill, R.E. Subsurface fracture spacing: Comparison of inferences from slant/horizontal and vertical cores. SPE Form. Eval. 1994, 9, 66–72. [Google Scholar] [CrossRef]
  15. Ghosh, S.; Galvis-Portilla, H.A.; Klockow, C.M.; Slatt, R.M. An application of outcrop analogues to understanding the origin and abundance of natural fractures in the Woodford Shale. J. Pet. Sci. Eng. 2018, 164, 623–639. [Google Scholar] [CrossRef]
  16. Ren, Q.Q.; Li, L.F.; Wang, J.; Jiang, R.T.; Li, M.P.; Feng, J.W. Dynamic Evolution mechanism of the fracturing fracture system—Enlightenments from hydraulic fracturing physical experiments and finite element numerical simulation. Pet. Sci. 2024, 21, 3839–3866. [Google Scholar] [CrossRef]
  17. Smart, K.J.; Ofoegbu, G.I.; Morris, A.P.; McGinnis, R.N.; Ferrill, D.A. Geomechanical modeling of hydraulic fracturing: Why mechanical stratigraphy, stress state, and pre-existing structure matter. AAPG Bull. 2014, 98, 2237–2261. [Google Scholar] [CrossRef]
  18. Xu, K.; Yang, H.; Zhang, H.; Ju, W.; Li, C.; Fang, L.; Liang, J. Fracture effectiveness evaluation in ultra-deep reservoirs based on geomechanical method, Kuqa Depression, Tarim Basin, NW China. J. Pet. Sci. Eng. 2022, 215, 110604. [Google Scholar] [CrossRef]
  19. Zoback, M.D. Unconventional Reservoir Geomechanics; Cambridge University Press: Cambridge, UK, 2019. [Google Scholar]
  20. Lyu, W.; Zeng, L.; Zhou, S.; Du, X.; Xia, D.; Liu, G.; Weng, J. Natural fractures in tight-oil sandstones: A case study of the Upper Triassic Yanchang Formation in the southwestern Ordos Basin, China. AAPG Bull. 2019, 103, 2343–2367. [Google Scholar] [CrossRef]
  21. Zeng, L.; Gong, L.; Zhang, Y.; Dong, S.; Lyu, W. A review of the genesis, evolution, and prediction of natural fractures in deep tight sandstones of China. AAPG Bull. 2023, 107, 1687–1721. [Google Scholar] [CrossRef]
  22. Gasparrini, M.; Sassi, W.; Gale, J.F. Natural sealed fractures in mudrocks: A case study tied to burial history from the Barnett Shale, Fort Worth Basin, Texas, USA. Mar. Pet. Geol. 2014, 55, 122–141. [Google Scholar] [CrossRef]
  23. Mathews, J.P.; Campbell, Q.P.; Xu, H.; Halleck, P. A review of the application of X-ray computed tomography to the study of coal. Fuel 2017, 209, 10–24. [Google Scholar] [CrossRef]
  24. Shovkun, I.; Espinoza, D.N. Geomechanical implications of dissolution of mineralized natural fractures in shale formations. J. Pet. Sci. Eng. 2018, 160, 555–564. [Google Scholar] [CrossRef]
  25. Weinberg, K.; Wieners, C. Dynamic phase-field fracture with a first-order discontinuous galerkin method for elastic waves. Comput. Method. Appl. Mech. Eng. 2022, 389, 114330. [Google Scholar] [CrossRef]
  26. Huo, Q.; Zeng, H.; Zhang, X.; Fang, Q.; Wang, Z.; Fu, L. Shale oil occurrence and reservoir characteristics of the Qijia-Gulong depression in Songliao Basin. Acta Geol. Sin.-Engl. Ed. 2015, 89 (Suppl. S1), 151–153. [Google Scholar] [CrossRef] [PubMed]
  27. Eftekhari, B.; Marder, M.; Patzek, T.W. Field data provide estimates of effective permeability, fracture spacing, well drainage area and incremental production in gas shales. J. Nat. Gas Sci. Eng. 2018, 56, 141–151. [Google Scholar] [CrossRef]
  28. Ren, Q.; Feng, J.; Johnston, S.; Peddle, C.; Du, H. Quantitative characterization of interlayer fractures in carbonate rocks based on finite element numerical simulation. J. Pet. Sci. Eng. 2020, 195, 107942. [Google Scholar] [CrossRef]
  29. Radwan, A.E. Three-dimensional gas property geological modeling and simulation. In Sustainable Geoscience for Natural Gas Subsurface Systems; Gulf Professional Publishing: Houston, TX, USA, 2022; pp. 29–49. [Google Scholar]
  30. Ren, Q.Q.; Feng, J.W.; Johnston, S.; Zhao, L.B. The influence of argillaceous content in carbonate rocks on the 3D modeling and characterization of tectonic fracture parameters—Example from the carboniferous and ordovician formations in the hetianhe gas field, Tarim Basin, NW China. J. Petrol. Sci. Eng. 2021, 203, 108668. [Google Scholar] [CrossRef]
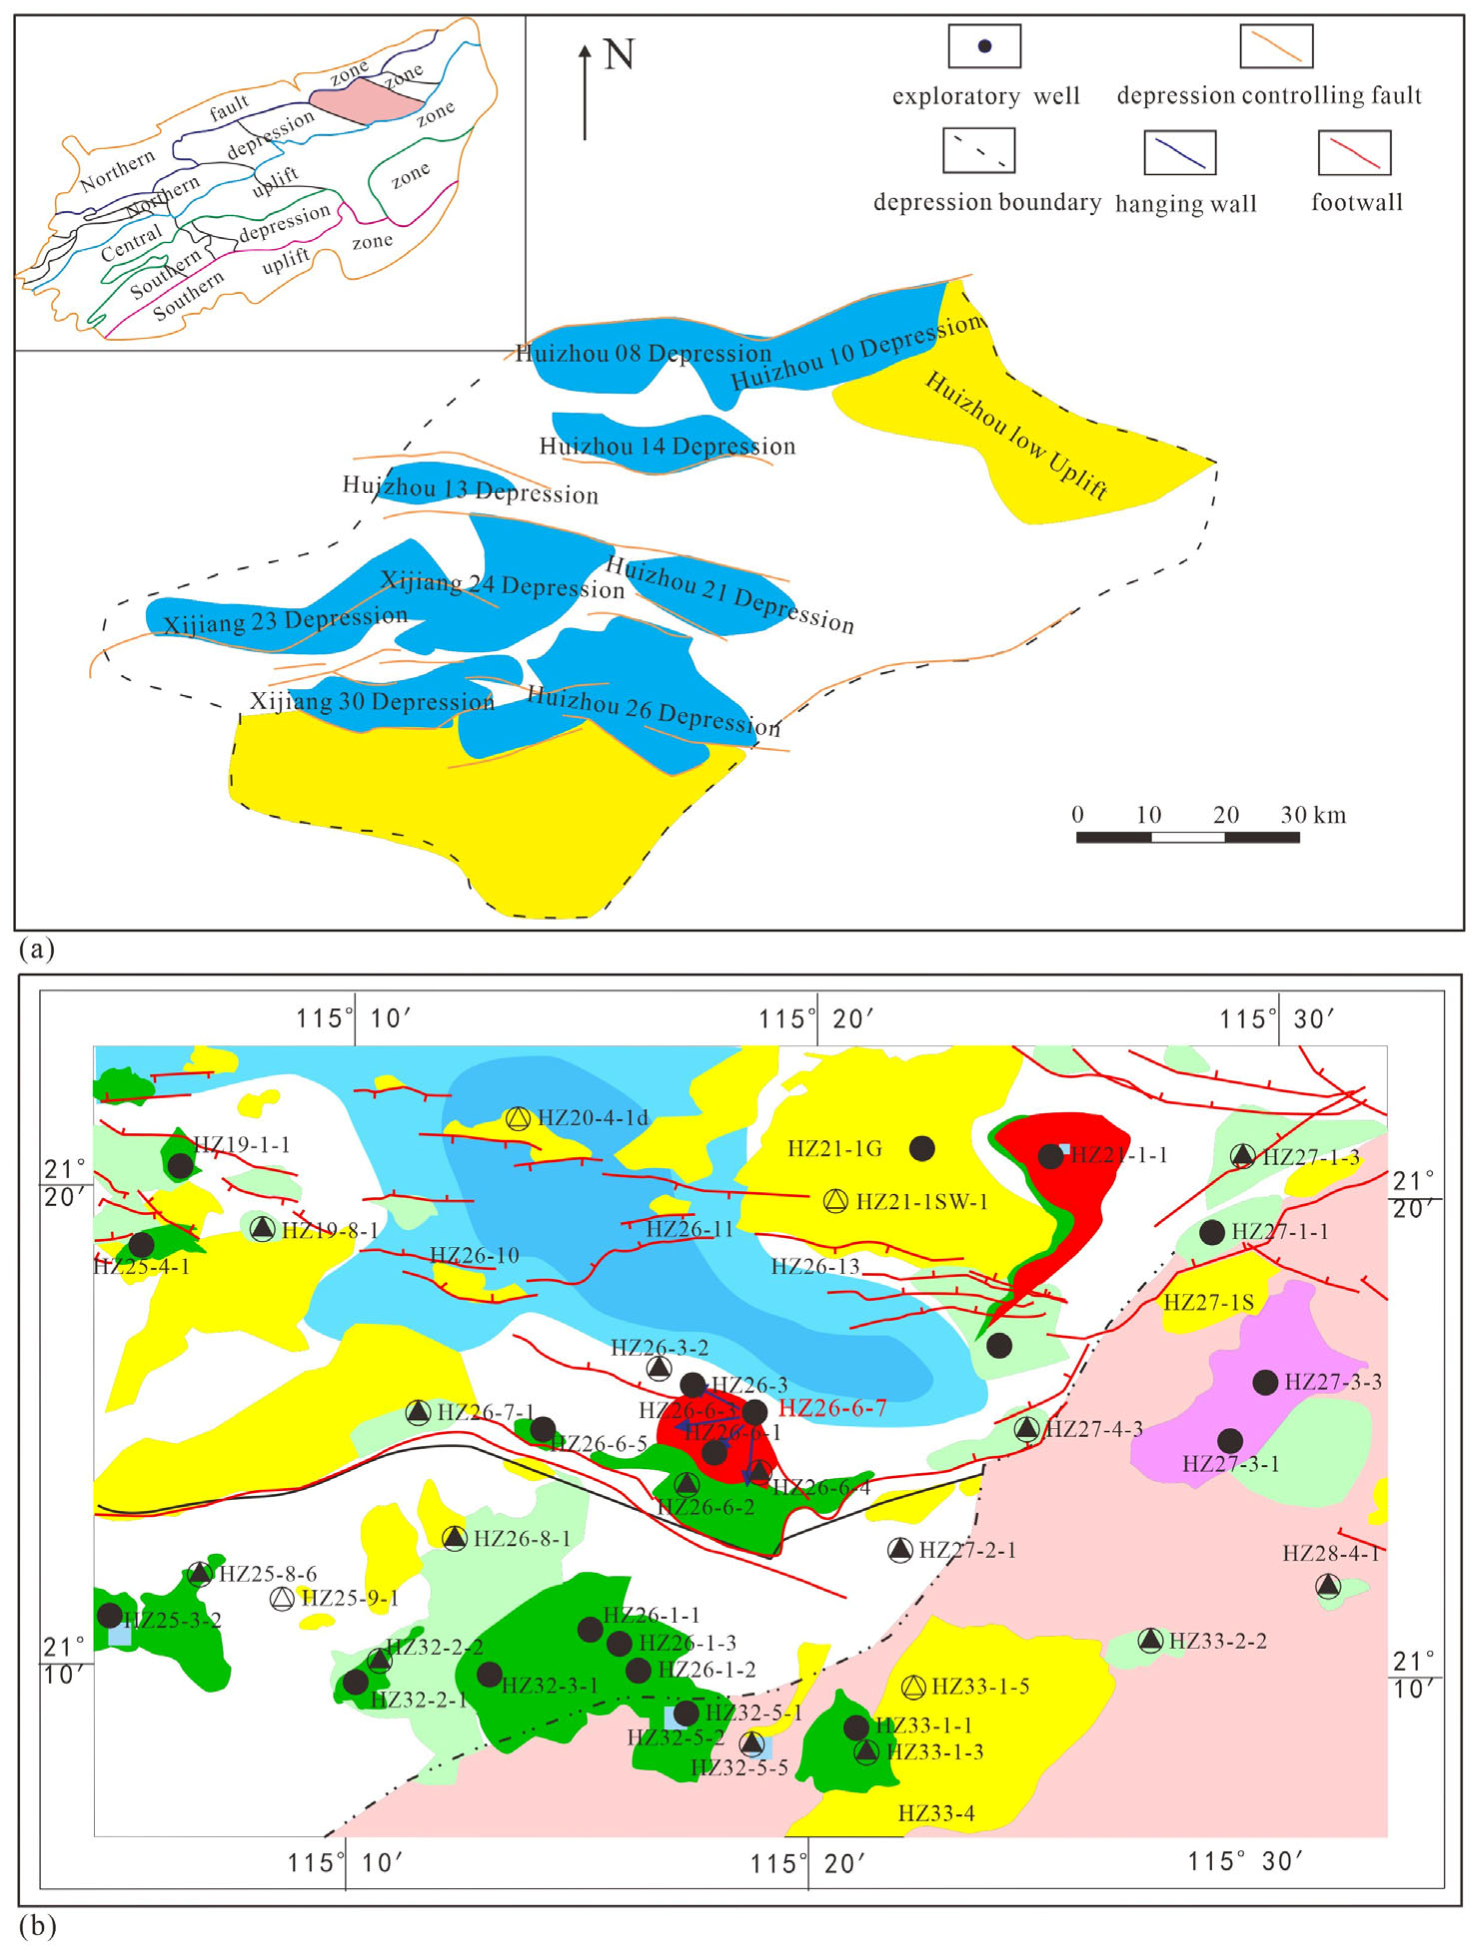
Figure 1. (a) is the regional structural location of the study area; (b) shows developmental characteristics of fault and secondary structure.
Jmse 13 01732 g001
Figure 2. (a) refers to the fracture strike, dip angle (total), and fracture dip angle (highly conductive fracture) in the weathered layer; (b) is the fracture strike, dip angle (total), and fracture dip angle (highly conductive fracture) in the insider layer; (ce) shows the relationship among fracture dip angle, fracture linear density, and fracture strike and distance to the main controlling factor.
Jmse 13 01732 g002
Figure 3. Presents the distribution of geomechanical parameters in Well X-6-3. Panels (a,b) show the characteristics within the Wenchang Formation, while (c,d) depict those in the Pre-Paleogene Formation. Panel (e) illustrates the vertical variation of geomechanical parameters throughout the Pre-Paleogene interval. Parameters include total and effective principal stresses (Sv, SHmax, Shmin; Sv-e, SHmax-e, Shmin-e, all in MPa), pore pressure (Pp, MPa), Poisson’s ratio (v), Biot’s coefficient (α), acoustic slowness (DTC, DTXX, DTSTR), and the fracture surface activity index (μ).
Jmse 13 01732 g003
Figure 4. (a) is the geomechanical modeling process; (b,c) shows the stress intensity in Wenchang Formation and PrePaleogene Formation, respectively; (d,e) refers to the fracture linear density (/m) in Wenchang Formation and PrePaleogene Formation, respectively; (f,g) shows the fracture aperture (mm) in Wenchang Formation and PrePaleogene Formation, respectively.
Jmse 13 01732 g004
Figure 5. (ac) shows the profile characteristics of stress intensity, fracture linear density, and fracture aperture of well section x-6-8d-x-6-3-x-3-1-x-5-1, respectively.
Jmse 13 01732 g005
Figure 6. (a,b) shows the effective shear stress in Wenchang Formation and PrePaleogene Formation, respectively; (c,d) refers to the fracture activity in Wenchang Formation and PrePaleogene Formation, respectively; (e,f) shows the profile characteristics of effective shear stress and fracture activity of well section x-6-8d-x-6-3-x-3-1-x-5-1, respectively.
Jmse 13 01732 g006
Figure 7. The well trajectory optimization strategies for different fracture scales.
Jmse 13 01732 g007
Table 1. The testing results of triaxial mechanical testing in target strata.
Testing NumberDepth/mCP (MPa)Strength
(MPa)
E (GPa)µCo-
(MPa)
IFA
1-14075.0025.00150.8320.950.23630.4829.79
1-235.00170.5822.330.240
2-14078.1015.00102.3722.680.35425.5732.74
2-225.00123.8616.640.225
2-335.00139.4715.920.187
3-14146.535.0075.5414.840.22623.1416.38
3-225.0071.049.460.168
3-315.0059.837.730.167
3-14155.1525.00119.5819.850.11735.7124.35
3-235.00133.6120.200.286
Where the CP is confining pressure, MPa; E is the Young’s modulus, GPa; µ refers to the Poisson’s ratio; Co- is the cohesion, MPa; IFA shows the internal friction angle, °.
Table 2. Well trajectory evaluation parameter’s correlation.
Evaluation FactorsWeightSub-FactorCorrelation CoefficientRelative Correlation Index
Fracture development0.42Fracture linear density0.74820.3142
Fracture aperture0.68690.2885
Fracture dip angle0.61860.2598
Fracture tendency0.78710.3306
Fracture activity0.75900.3188
Fault’s influence0.36Distance to fault0.70750.2547
Fault scale0.64120.2308
Stress field0.22Normal stress0.64400.1417
Shear stress0.68970.1517
Minimum stress0.64160.1411
Maximum stress0.62640.1378
Stress intensity0.68810.1514
Disclaimer/Publisher’s Note: The statements, opinions and data contained in all publications are solely those of the individual author(s) and contributor(s) and not of MDPI and/or the editor(s). MDPI and/or the editor(s) disclaim responsibility for any injury to people or property resulting from any ideas, methods, instructions or products referred to in the content.