Article

Scour Characteristics and Bearing Capacity Response of MGB Hybrid Foundations in Offshore Wind Applications

1
College of Cvil Engineering, Taiyuan University of Technology, Taiyuan 030024, China
2
College of Water Resource Science and Engineering, Taiyuan University of Technology, Taiyuan 030024, China
3
Department of Geotechnical Engineering, Key Laboratory of Geotechnical and Underground Engineering of Ministry of Education, Tongji University, Shanghai 200092, China
*
Author to whom correspondence should be addressed.
J. Mar. Sci. Eng. 2025, 13(9), 1726; https://doi.org/10.3390/jmse13091726
Submission received: 6 August 2025 / Revised: 3 September 2025 / Accepted: 4 September 2025 / Published: 8 September 2025
(This article belongs to the Special Issue Advances in Offshore Foundations and Anchoring Systems)

Abstract

Scour at offshore wind turbine foundations compromises their structural stability. This study investigates scour characteristics and their impact on the ultimate bearing capacity of a novel Monopile-Gravity-Bucket (MGB) hybrid foundation. Utilizing coupled CFD-DEM and finite element analyses, this research examines scour development under varying bucket geometries. Results reveal similar scour morphology as other large diameter structures, with maximum scour depth decreasing as the bucket’s diameter and height increase. The consequent reduction in lateral bearing capacity can reach approximately 20%. These findings provide critical insights for optimizing MGB foundation design and implementing effective scour protection strategies.

1. Introduction

To fully leverage high-quality wind resources, alleviate near-shore development pressure, drive industrial upgrading, and enhance cost-effectiveness, the expansion of offshore wind power into deeper waters represents a critical industry trend. The foundation structures of offshore wind turbines can account for up to half of a project’s total investment [1,2]. Notably, floating foundations incur significantly higher costs than fixed-bottom foundations, substantially impacting the economic viability of floating wind turbines. Further research is thus required before their large-scale deployment becomes feasible [3,4]. Consequently, although fixed-bottom foundations are currently viable only in limited water depths, continuously advancing research and technological iterations make expanding their applicability to depths of 50–70 m or beyond a highly viable technical pathway.
The Monopile-Gravity-Shallow Bucket (MGB) hybrid foundation in this research has shown great potential in terms of its performance in deeper water application based on previous research [5,6,7]. However, the scour mechanism of the MGB hybrid foundation has not been investigated. The presence of a gravity-based shallow bucket foundation near the mudline significantly alters the flow patterns around the foundation, thus affecting the formation of scour pits. For hybrid foundations derived from monopiles, a significant portion of their bearing capacity originates from the hybrid components near the mudline [8,9]. Scour pit formation, however, critically affects the soil-structure interaction at these components. It is therefore imperative to investigate scour development patterns around MGB hybrid foundations and their impact on structural bearing capacity. This research will provide essential insights to inform the geometric design of MGB hybrid foundations and the deployment of scour protection measures.
Research on scour around offshore wind turbine foundations encompasses extensive experimental and numerical investigations. Experimental studies have primarily focused on identifying scour-influencing factors and evaluating protection measures. Key findings include that pile vibration direction significantly impacts scour severity, with 135° vibration relative to inflow causing the most severe scour around monopiles. Shallow water waves pose a greater scour threat [10]. Intermittent turbine operation was found to lead to severe scour regardless of sequence [11]. For scour protection, physical tests demonstrated that collars’ efficiency depends critically on their installation height [12], while comparative testing identified sand-ribbed geotextile mattresses as highly effective though environmentally sensitive [13]. For novel foundations like the Multi-Bucket Jacket Foundation, a pre-embedded bucket lid method proved highly efficient [14]. Scour around jacket foundations under bidirectional flow was found to peak at a foundation angle of 30° [15], and new pile-group foundations exhibited rapid initial scour development [16]. Scale flume tests also confirmed scour and scour protection significantly alter monopile-tower dynamics [17], and in slope condition, steeper slopes correlated to increased upstream scour depth and cross-slope conditions cause uneven scour, deepening on the downslope side [18] with an AI enhanced flume test facility [19].
Numerical simulation studies have addressed scour prediction, risk assessment, foundation response, and microscopic mechanisms. Risk assessment methodologies integrating probabilistic scour hazard and structural fragility were developed for suction bucket and pentapod foundations [20]. Numerical models revealed that scour protection has minimal impact on monopile natural frequency but significantly reduces pile head rotation under SLS [21]. Parametric finite element analyses quantified the “stiffening effect” of rock armor scour protection [22,23]. Scour was shown to non-linearly reduce the bearing capacity of wide-shallow foundations [24] and composite bucket foundations [25], and to increase stress and reduce fatigue life in tripods component [26]. For seismic conditions, scour significantly alters monopile bearing responses [27]. The CFD-DEM (Computational Fluid Dynamics—Discrete Element Method) coupling method emerged as a powerful tool for simulating local scour mechanisms [28,29]. This method was also effectively applied to study scour around twin piles [30] and to evaluate innovative protection nets [31]. Studies also modeled complex foundations under nonlinear waves [32]. Research on scour effects for monopile-oriented hybrid foundations has been conducted [33,34,35]. However, unlike previously studied monopile-bucket hybrids which often feature a deep suction bucket, or friction-wheel-bucket hybrids that rely primarily on surface friction, the MGB foundation integrates a shallow bucket with a gravel-filled gravity wheel. This configuration places a significant mass and a wide, shallow skirt at the mudline, fundamentally altering the flow-structure-seabed interaction mechanism compared to other hybrids. Consequently, the scour development patterns and their subsequent impact on the soil-structure interaction, a critical aspect for its bearing capacity, remain unexplored and form the unique contribution of this paper.
This study employs a two-stage numerical approach to address this gap. First, a CFD-DEM model is used to characterize the scour development and identify the equilibrium scour pit morphologies around the MGB foundation under various hydraulic and geometric conditions. Second, these resultant scour morphologies are idealized and incorporated into a finite element model to systematically quantify their detrimental impact on the foundation’s ultimate lateral bearing capacity. This direct linkage from scour mechanism to structural consequence provides a comprehensive assessment framework for the MGB foundation.

2. Validation of the CFD-DEM Coupling Model

2.1. Model Fundamentals

In fluid mechanics, the flow behavior of fluids is governed by the continuity equation and the momentum conservation equation. The continuity equation embodies the law of mass conservation, ensuring that the mass of the fluid remains constant during motion, while the momentum conservation equation, based on Newton’s second law, explicitly describes the relationship between changes in fluid momentum and applied forces. For turbulence modeling, the standard k-ε turbulence model is adopted.
In the DEM framework, the motion of individual sediment particles adheres to Newton’s second law. Interparticle contact forces are calculated using the Hertz-Mindlin (no-slip) model, which simulates interparticle contact behavior through a combination of springs and dampers. Additionally, the Johnson-Kendall-Roberts (JKR) model is introduced to characterize the cohesive interactions between sediment particles.
The CFD-DEM coupling model achieves fluid-solid coupling through water-sediment interaction, buoyancy, and drag force models. The central porosity method is applied to calculate particle volume fractions, and the Gidaspow drag model is adopted to describe the interaction forces between the fluid and particles.

2.2. Model Validation

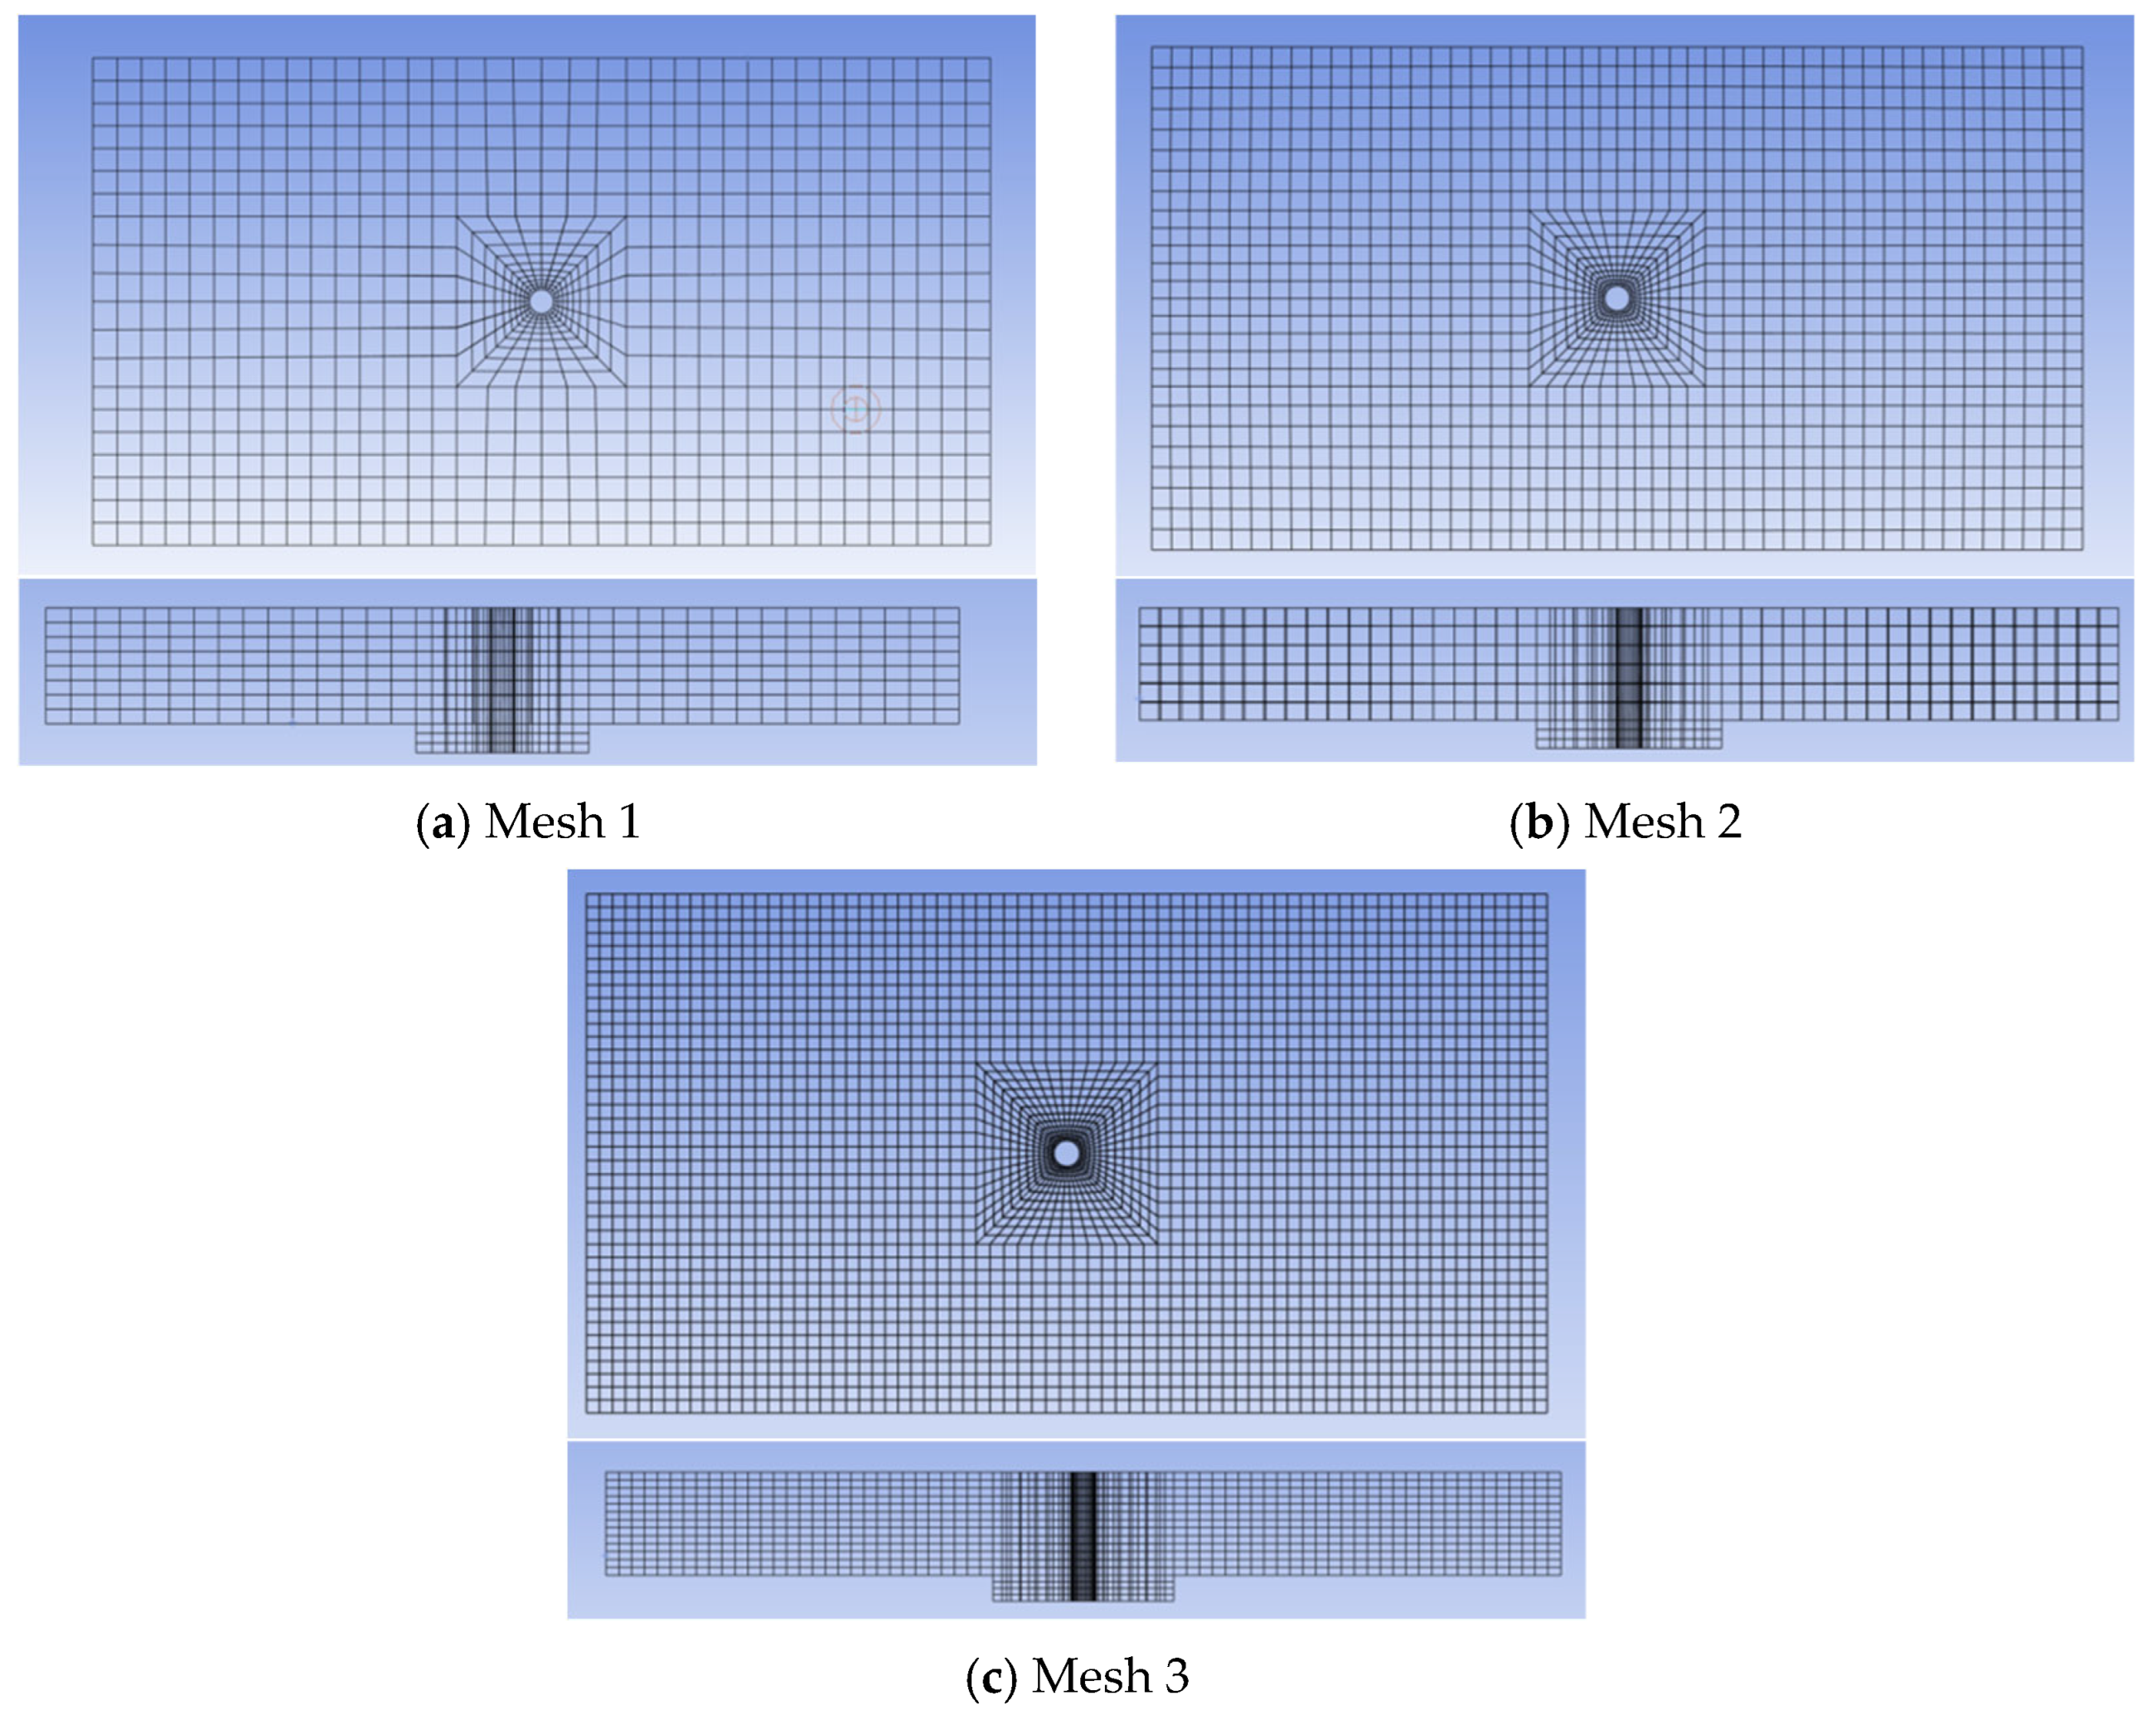
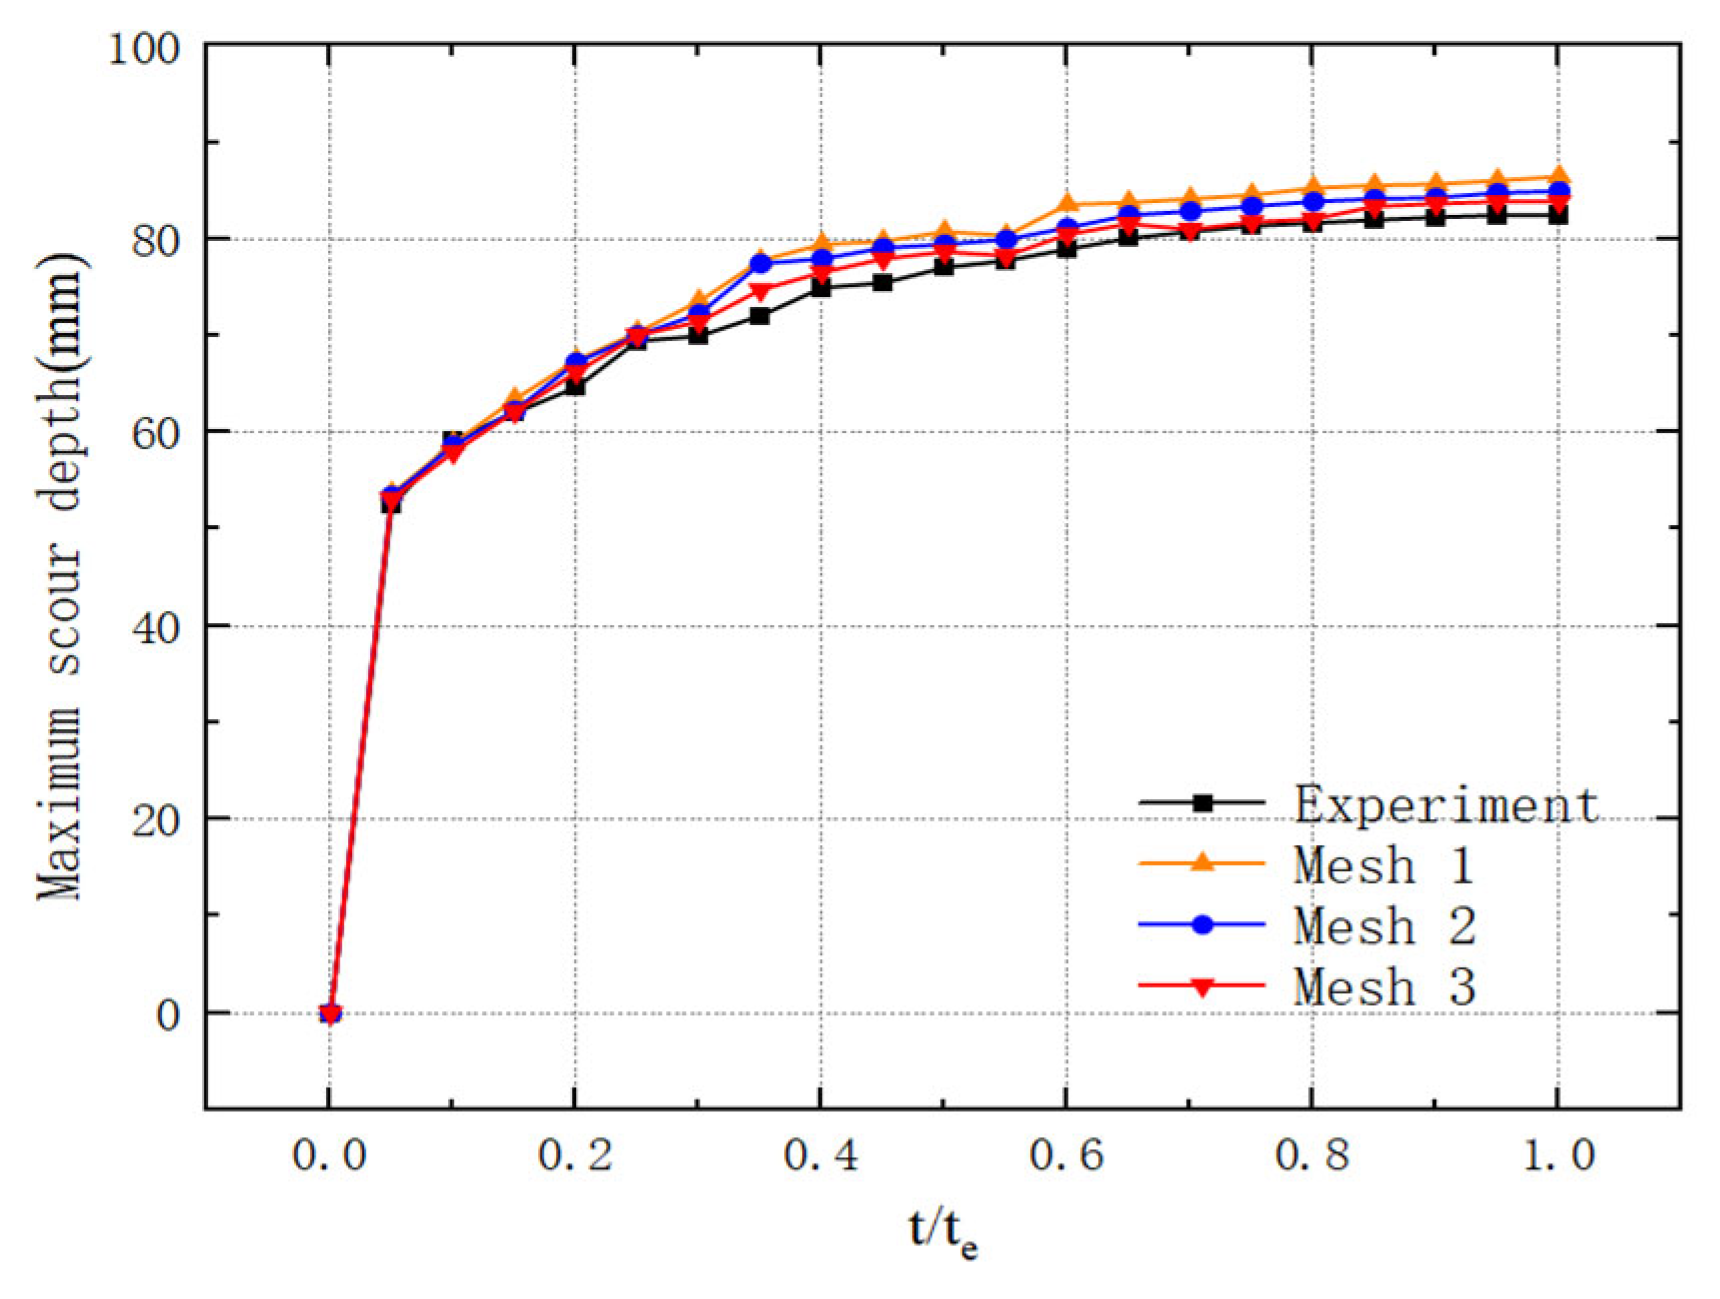
To validate the CFD-DEM coupling model, a numerical model was developed based on experimental data from monopile scouring tests under unidirectional flow [36]. The experiment was conducted in a 60 m × 4 m × 2.5 m flume with a 4 m × 4 m × 0.35 m sand box in the middle. The d50 of the sand sample is 0.29 mm. The relative density of the sand is 2.67, the viscosity of the water v is 10−6 m2/s, and the water depth is 0.4 m. The model includes a fluid domain, a sediment seabed, and a circular monopile foundation. By simultaneously accounting for the coupled interactions between fluid dynamics and granular mechanics, the model accurately simulates the scouring process around the monopile foundation, thereby validating its reliability in capturing complex fluid-sediment-structure interactions, as shown in Figure 1. The model uses three different densities of CFD mesh division to conduct a grid size sensitivity analysis which is shown in Figure 2.
Interactions between sediment particles serve as the primary driving factor for local scour phenomena. The friction and momentum transfer among particles directly influence the movement trajectories and states of soil particles around the pile, thereby governing the extent and depth of scour pit development. The Hertz–Mindlin no-slip model was employed to simulate inter-particle collisions. Within this model, the coefficient of restitution—a key parameter reflecting the efficiency of kinetic energy transfer during collisions—was set to 0.45 based on experimental results from Wang et al. [37]. To account for inter-particle friction, the static friction coefficient was determined according to the friction angle of the sediment, with its tangent value equal to the natural angle of repose of the sand, which is 33°. Given the low rolling friction in underwater conditions, the rolling friction coefficient was set to 0.01. Additionally, the particle density and Poisson’s ratio were specified as 2670 kg/m3 and 0.35, respectively. Since particle stiffness has a relatively minor influence on the local scour process, the shear modulus was defaulted to 5 MPa. To improve computational efficiency and address the impact of particle size and quantity on the simulation speed of the DEM model, the particle diameter was set to 5 mm. The simulation time step was set to 5 × 10⁻⁵ s, and to accurately track particle motion, the data saving interval was defined as 0.05 s. The specific parameters of the DEM model are summarized in Table 1.
In Fluent, a transient simulation was conducted using the finite volume method for flow field discretization. The pressure–velocity coupling was resolved via the SIMPLE algorithm with a first-order upwind scheme. The fluid domain boundaries were configured as follows: a velocity inlet with an average flow velocity of 1.6 m/s, applied normal to the inlet boundary and with a turbulence intensity of 5%, and a pressure outlet set to atmospheric pressure. The side and top boundaries were defined as symmetry planes, while the remaining surfaces were treated as no-slip walls. The standard k–ε model was adopted for turbulence modeling, and the Gidaspow drag model was selected for inter-phase momentum exchange. To ensure numerical stability and facilitate data exchange between the simulations, the time step in Fluent was set to an integer multiple of that in EDEM. Accordingly, the Fluent time step was specified as 100 times that of EDEM, i.e., 5 × 10⁻³ s. The total number of time steps was 10,000, corresponding to a physical time of 50 s. To satisfy the convergence criterion requiring absolute residuals below 10−3, the maximum number of iterations per time step was set to 500. The parameters used in the CFD model are listed in Table 2.
Since the sediment particle size in the CFD-DEM coupling model simulations is significantly larger than that in the experimental tests, it is necessary to proportionally increase the inlet flow velocity in the numerical model to maintain consistency in the dimensionless Shields number between simulations and experiments. The dimensionless Shields number is defined as the ratio of the Shields number θ to the critical Shields number θcr, expressed by Equations (1) and (2) as follows:
θ = τ s ρ f g ( s 1 ) d 50
θ c r = 0.3 1 + 1.2 D * + 0.055 [ 1 exp ( 0.02 D * ) ]
Shields number represents the ratio between the fluid force trying to move the particle and the submerged weight of the particle resisting movement [38]. In the above equations, s denotes the ratio of sediment particle density to water density, τs represents the bed shear stress near the seabed, d50 is the median sediment particle diameter, and D* is the dimensionless particle diameter. The expressions for τs and D* are given by Equations (3) and (4), respectively:
τ s = ρ f κ ln ( d 50 / 12 h ) + 1 2 V 2
D * = d 50 ρ P ρ f 1 g / v 2 1 3
Here, h denotes the water depth, κ represents the von Kármán constant (set to 0.4), V is the depth-averaged flow velocity, and v is the kinematic viscosity of water. A comparison of scouring conditions between the numerical simulations and physical experiments is provided in Table 3. It is acknowledged that the use of larger particles (5 mm vs. 0.29 mm) introduces a scale effect, primarily influencing the resolution of the sediment transport process rather than the overarching scour mechanics governed by the dimensionless Shields number. The calibration ensures the macroscopic scour development and equilibrium state are accurately replicated. While laboratory tests with finer particles offer higher resolution, the current approach provides a computationally efficient and mechanically sound representation of the scour phenomenon for this parametric study.
Through multiple simulation comparisons, the inlet flow velocity in the model was set to 1.6 m/s to replicate real-world scouring conditions. Figure 3 illustrates the three-dimensional view of the scour pit at the equilibrium stage of the scouring process. The flow direction aligns with the x-axis, and the particle colors are color-coded by scouring depth. A symmetrical and uniform scour pit forms around the monopile, with the maximum scouring depth (approximately 85 mm) occurring at ±45° upstream of the monopile. This result matches the equilibrium scouring depth values reported in experimental studies from the literature, validating the model’s accuracy.
The inflection point where the scour slope begins to decrease serves as the reference for determining the maximum scour pit radius. This inflection point is approximately located at coordinates x = −0.08 m, y = 0.08 m, as illustrated in Figure 4. Three measurement points were evenly selected between the inflection point and the monopile foundation to measure flow velocities. Figure 5 shows the variation in flow velocity with water depth at these measurement points. The velocity profiles follow a logarithmic distribution with depth, consistent with experimentally measured velocity distributions reported in the literature. Here, Z denotes the vertical distance from the measurement point to the sediment bed surface.
The mean flow velocity in front of the monopile v is calculated from the velocity distribution profiles using Equations (5) and (6):
v ¯ = W H
v = 1 n i = 1 n v ¯ i
When analyzing scouring caused by flow around foundation structures, the Shields formula exhibits certain limitations. This formula is primarily designed to describe sediment incipient motion and uniform transport in rivers, whereas the flow around foundations generates complex vortices, reverse flows, and local acceleration, which fundamentally differ from uniform flow conditions. Additionally, discrepancies exist between the inlet flow velocity in simulations and the actual scouring-induced flow velocity. The inlet velocity requires a certain distance to stabilize, and the flow velocity during scouring further varies due to sediment transport dynamics. To address these issues, this study introduces a new calibration coefficient by comparing the time-averaged flow velocity, simulated inlet velocity, and Shields formula-predicted velocity. This coefficient is then used to adjust simulation parameters, enhancing modeling accuracy. The corresponding expressions are given in Equations (7) and (8):
C 1 = v 1 v
C 2 = v v 2
Through simulations of varying pile diameters, the inlet flow velocity was adjusted to match the scouring depths obtained from physical experiments. Analysis of the adjusted inlet velocities revealed that the calibration coefficients exhibited high stability across different pile diameter conditions, with minor numerical discrepancies. This indicates that the calibration coefficients possess general applicability and are suitable for simulation studies under varying pile diameter conditions, making them a critical parameter for subsequent analyses. A comparison of calibration coefficients for different pile diameters is summarized in Table 4.
Figure 6 illustrates the morphology of the scour pit in front of the monopile. After reaching the equilibrium stage of scouring, the scour pit forms a slope of approximately 31°, which closely matches the natural angle of repose of sediment defined in the model.
Figure 7 depicts the time history of local scouring around the monopile with different mesh sizes. The vertical axis represents the maximum scouring depth, calculated by extracting the minimum seabed elevation (Z-coordinate) of sediment particles. The horizontal axis denotes the scouring time, normalized by the equilibrium scour time te. It can be seen that as the mesh density increases, the improvement in computational accuracy is limited, with the error in the development process of scouring depth being within 3%. However, the time required for computation increases significantly, which seriously affects the timeliness of the project. Therefore, the mesh division for the subsequent MGB foundation adopts the same mesh density as Mesh 1 in the verification simulation.
Comprehensive analysis shows that the CFD-DEM model effectively reproduces the scouring time history observed in experiments when parameters such as pile diameter D, water depth h, dimensionless Shields number θ/θcr, and sediment angle of repose remain constant. During the equilibrium stage, the maximum scouring depths obtained from both methods are nearly identical, with maximum errors controlled within 10%. This discrepancy is primarily attributed to scale effects in sediment particles, which are unavoidable in practical studies. Reducing particle size significantly increases computational demands due to the surge in particle count, imposing higher hardware requirements. The CFD-DEM scour model focuses on mesoscale exploration of sediment motion and stress characteristics in scouring fields. While it cannot achieve precise predictions, deviations between simulations and experimental data remain acceptable, further validating the model’s reliability in studying local scouring.

3. Scouring Characteristics Analysis of MGB Hybrid Foundations

3.1. Model Development of the MGB Hybrid Foundation

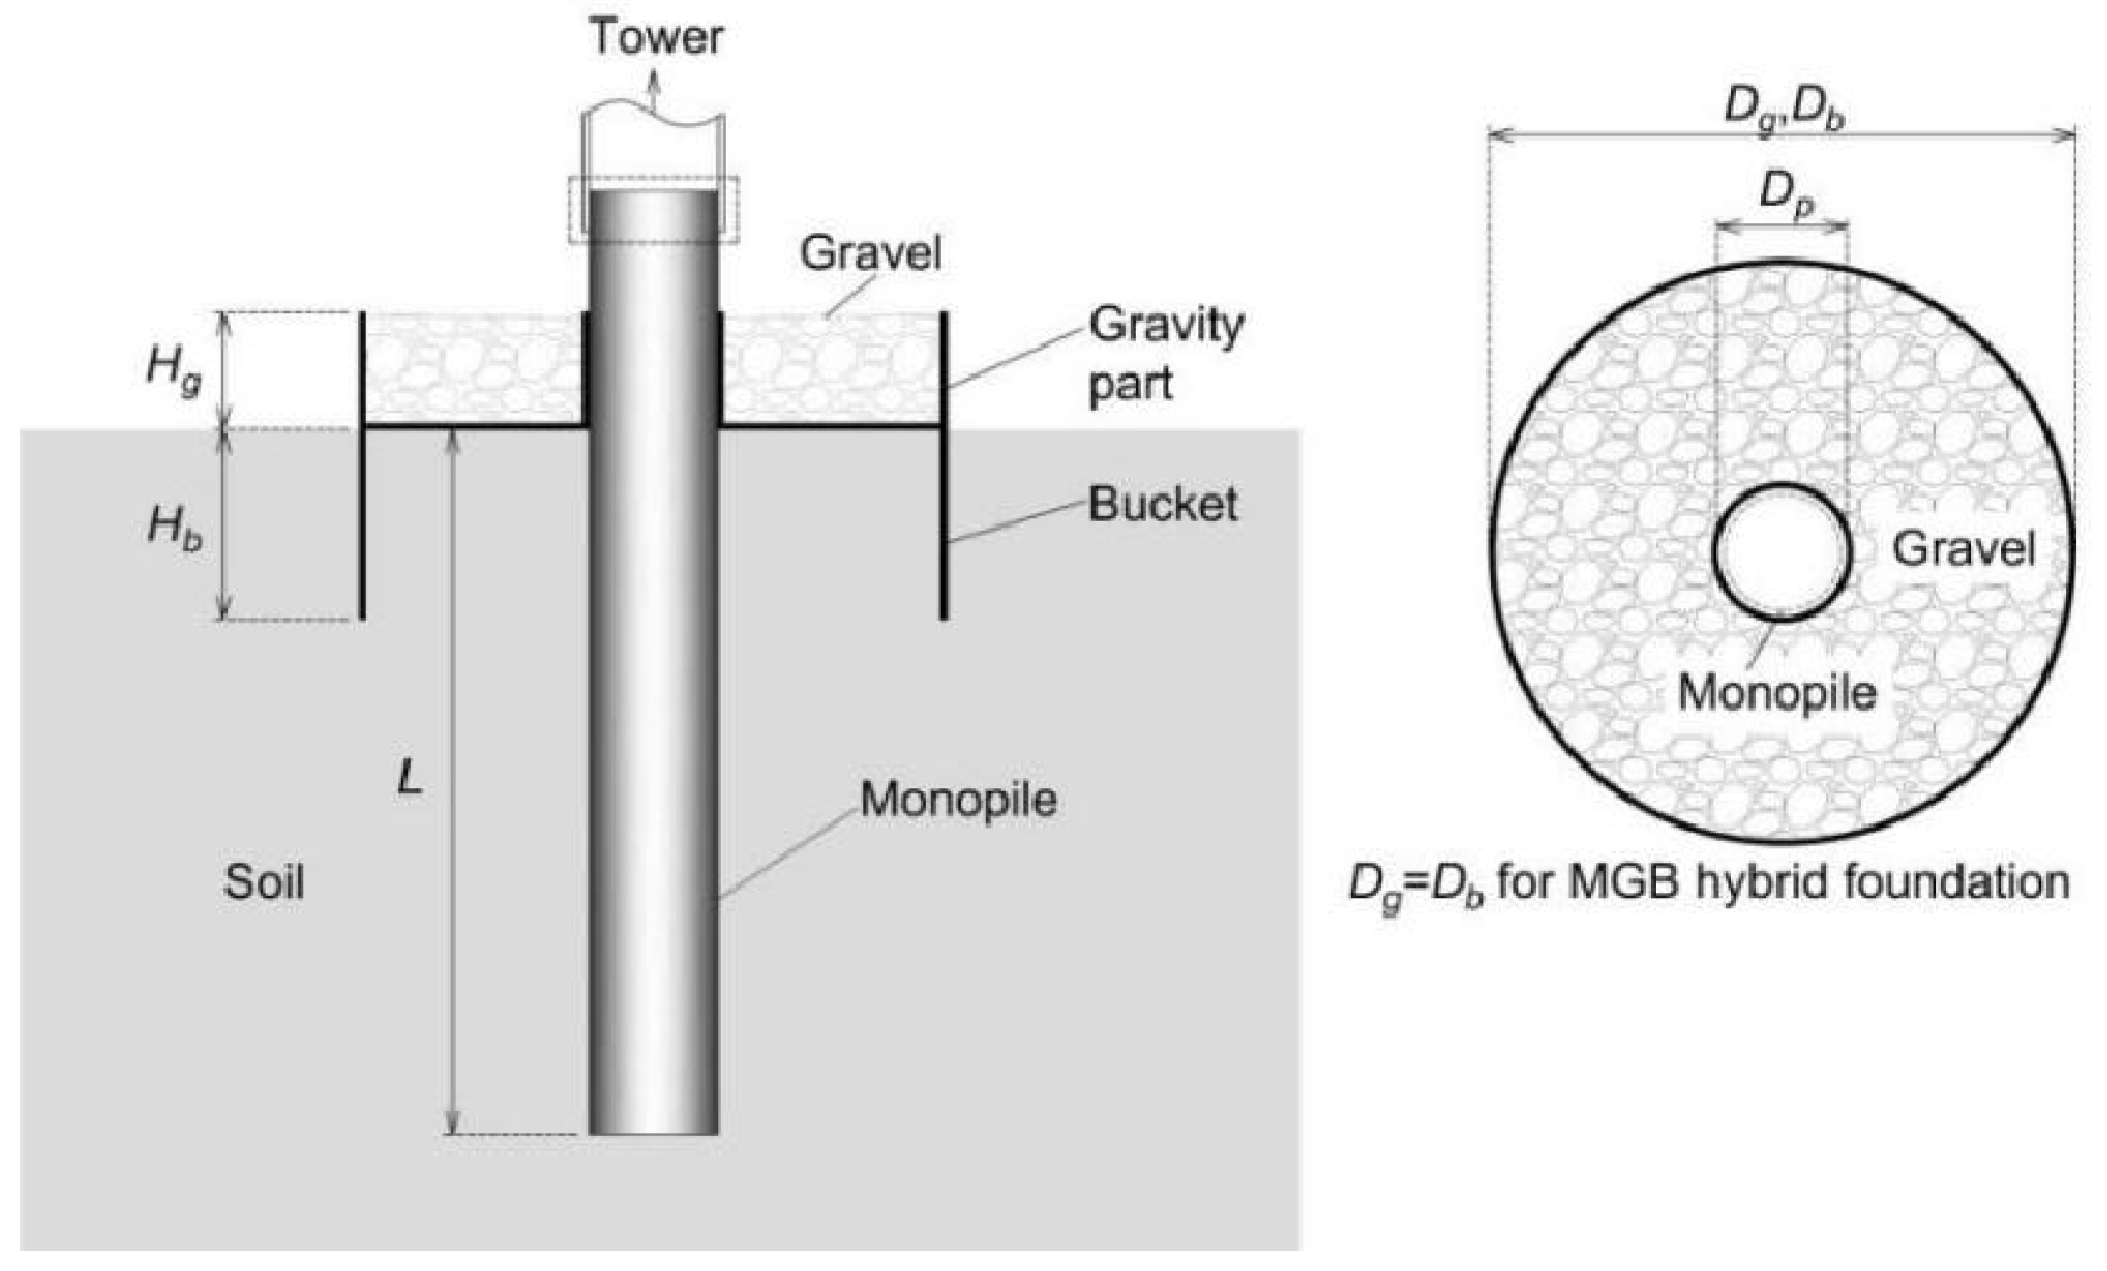
The MGB hybrid foundation comprises three components: a monopile, a gravel-filled gravity wheel, and a suction bucket. The gravity wheel and suction bucket share an identical outer diameter, with their base structures integrated into a single composite unit that combines the gravity wheel’s base and the suction bucket’s top cover. The monopile is installed through a central guide hole in the composite unit, which mechanically restricts horizontal displacement while allowing vertical motion. During construction, gravel filling within the gravity wheel generates sustained vertical loads, significantly enhancing overall stability. Figure 8 illustrates the structural configuration, with key parameters including: monopile diameter D, suction bucket diameter Db (equals to gravity wheel diameter Df), bucket height Hb, gravity wheel height Hg, wall thickness t. Figure 9 shows the three-dimensional geometry of the hybrid foundation model and it’s main parameters.
This study investigates scouring mechanisms around the MGB hybrid foundation. The gravel-filled gravity wheel was simplified as a solid boundary using geometric similarity criteria to isolate structural morphology effects. A hexahedral-dominant structured mesh combined local refinement in scouring zones, prism layers for near-wall accuracy, and gradient-adaptive transitions between regions. Minimum cell size (>5 mm) ensured grid independence and minimized numerical dissipation in sediment-particle simulations. The top view of the mesh can be seen in Figure 10.
This study employs numerical simulations using a controlled variable approach to analyze the effects of key parameters on monopile scouring mechanisms. Multiple simulation cases were designed according to Table 5, with constant parameters including pile diameter, bucket upper edge length, gravity wheel length, and water depth. The primary variables investigated are flow velocity (1.2–2.0 m/s), bucket diameter (0.15–0.35 m), and bucket lower edge length (0.03–0.07 m). Calibration coefficients C1 = 1.38 and C2 = 1.23 were derived from averaged results of three pile diameter simulation cases. Using these coefficients, the inlet average flow velocity was set to 1.6 m/s. A baseline case (flow velocity = 1.6 m/s, bucket diameter = 0.25 m, bucket lower edge length = 0.05 m) was established for single-variable comparative analysis.
The CFD and DEM parameters remain consistent with those defined in the preceding sections.

3.2. EDEM Analysis of Scouring Process in the Baseline Case

Figure 11 depicts the equilibrium scouring morphology under the baseline case, revealing a symmetrical scour pit distributed around the monopile and bucket foundation. The maximum scouring depth occurs at approximately ±45° relative to the flow direction (x-axis), while the upstream frontal region exhibits shallower erosion. Sediment deposition dominates the wake zone due to reduced flow velocity, aligning with classical monopile scouring patterns reported in the literature.
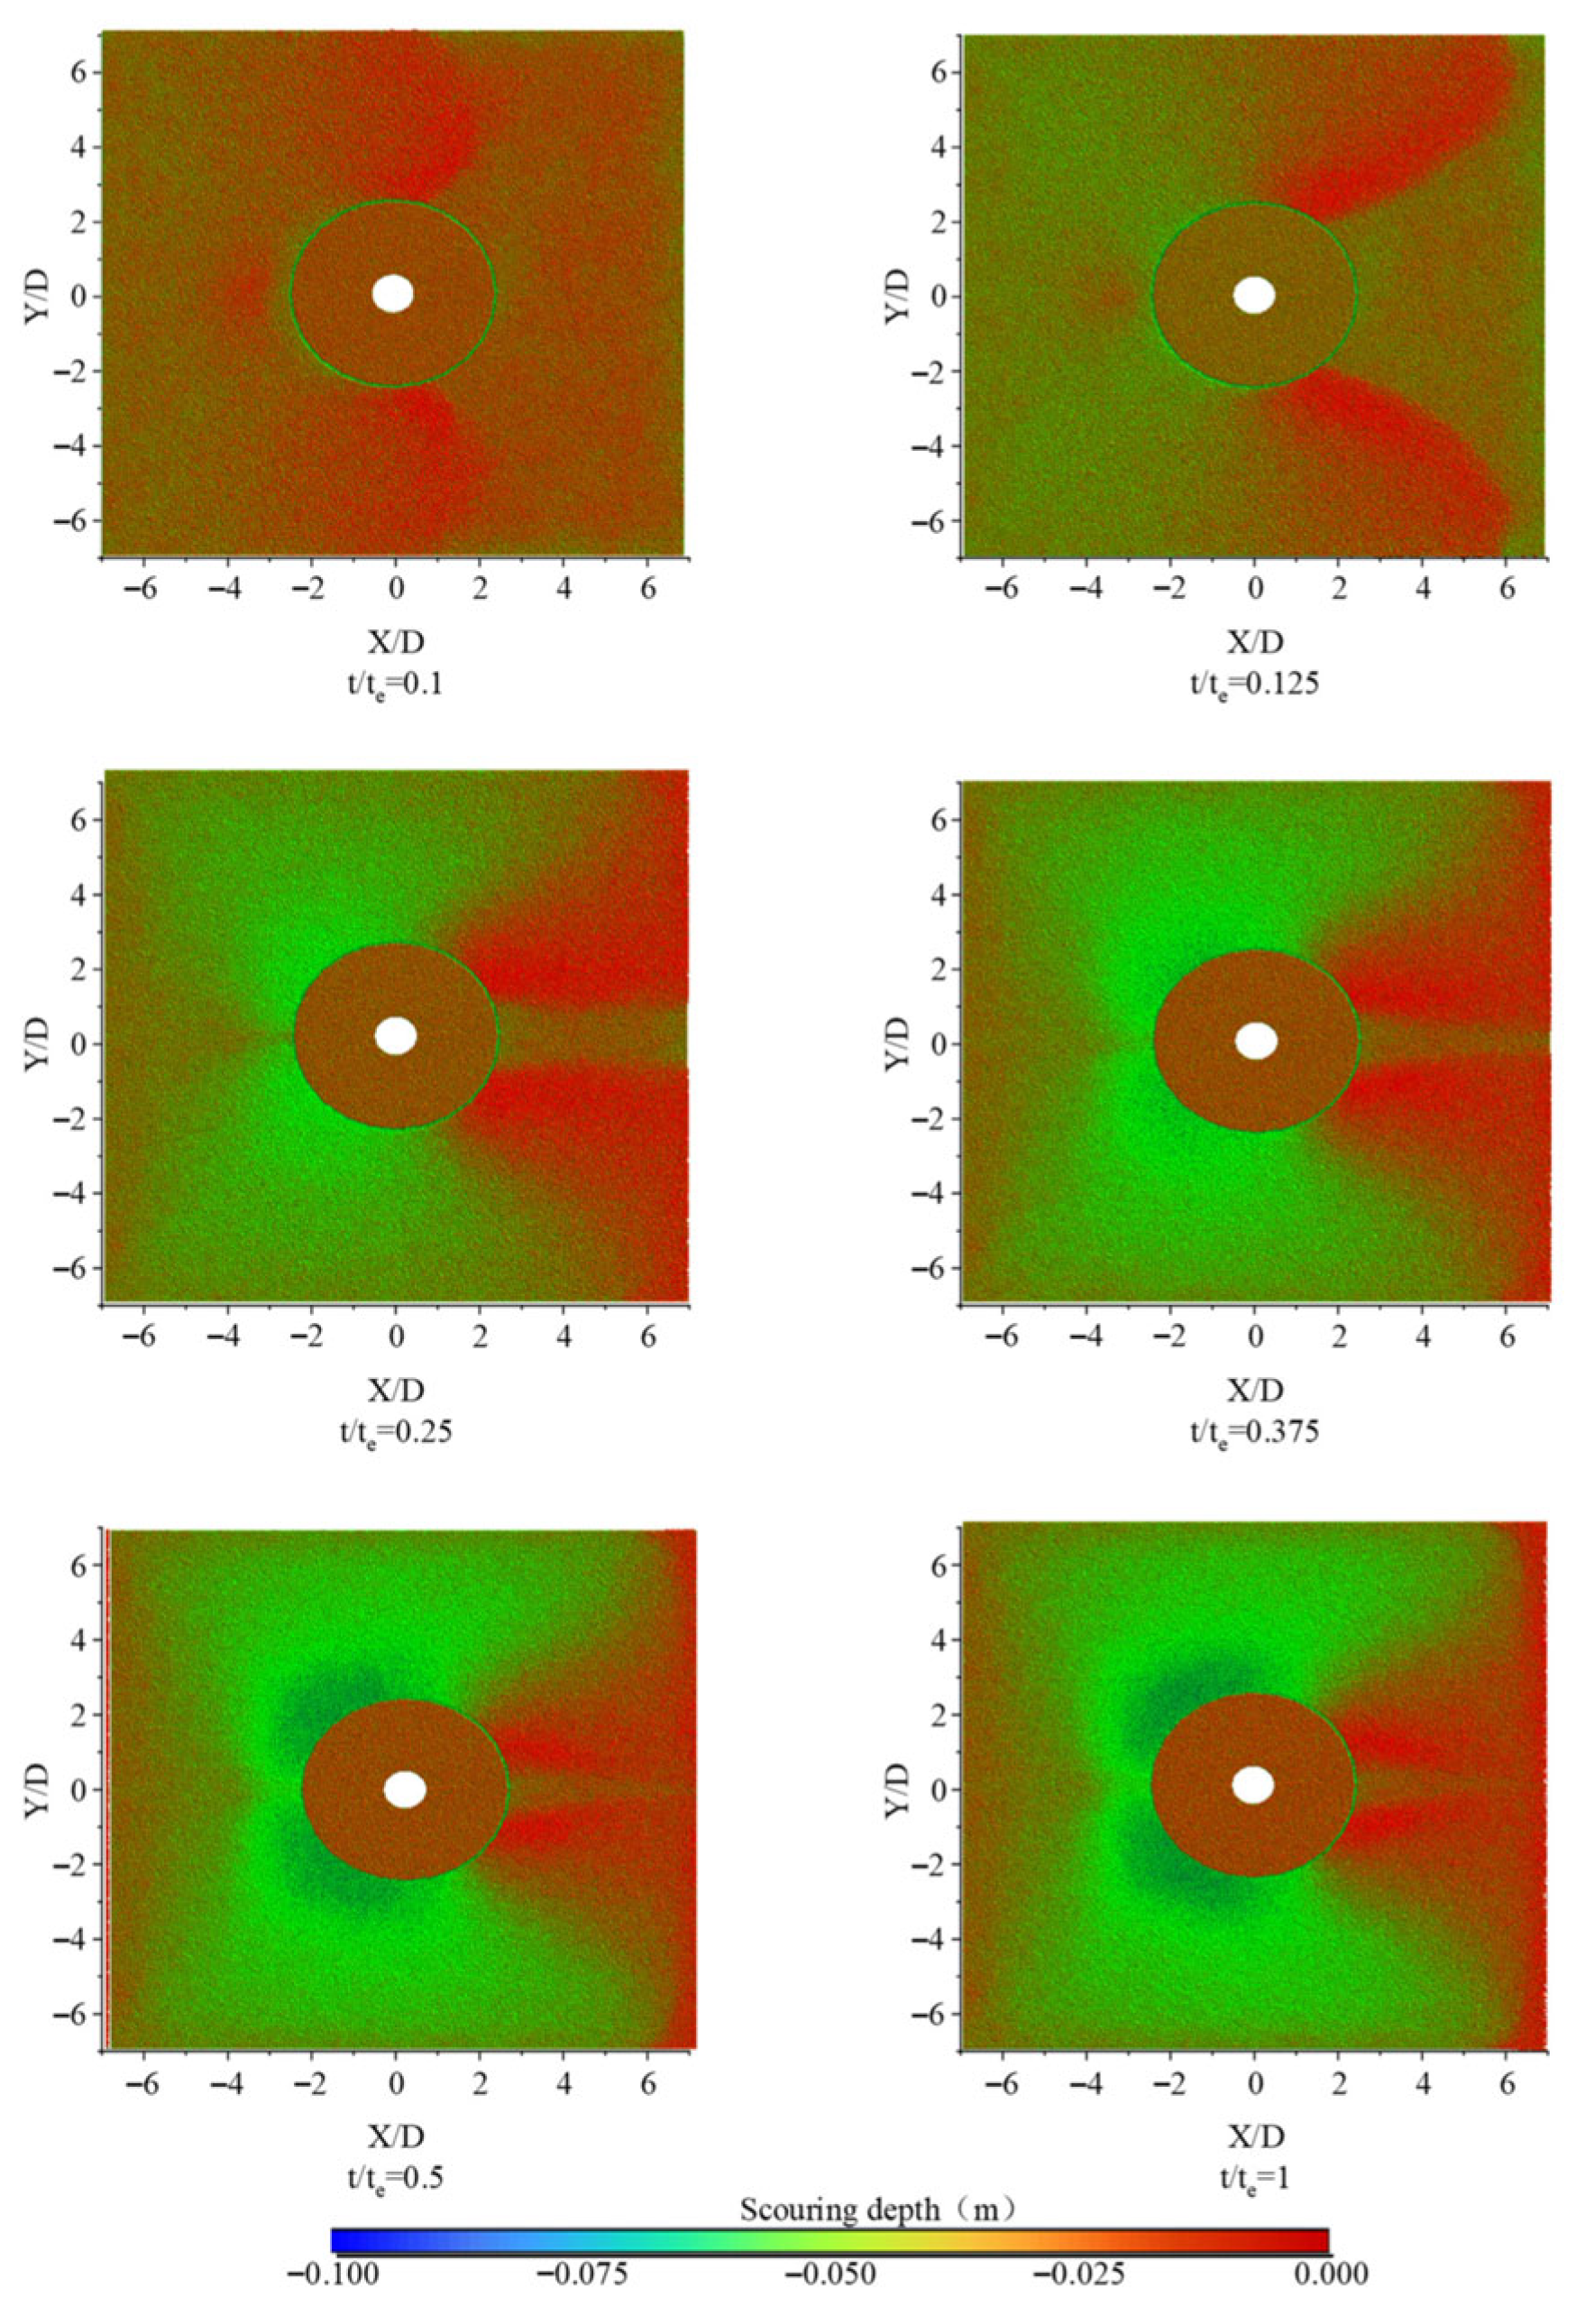
Figure 12 illustrates the normalized spatiotemporal evolution of the scour pit, divided into three phases: (1) Initial phase: rapid vertical scour initiates near the monopile’s upstream and lateral zones, transporting sediment downstream to form deposition mounds; (2) Transition phase: scour rates decelerate, and lateral expansion perpendicular to the flow becomes prominent, intensifying near-bed shear stresses close to the structure; (3) Stable phase: the scour pit stabilizes spatially, with downstream deposition migrating farther and the height of the sediment zone decreasing.
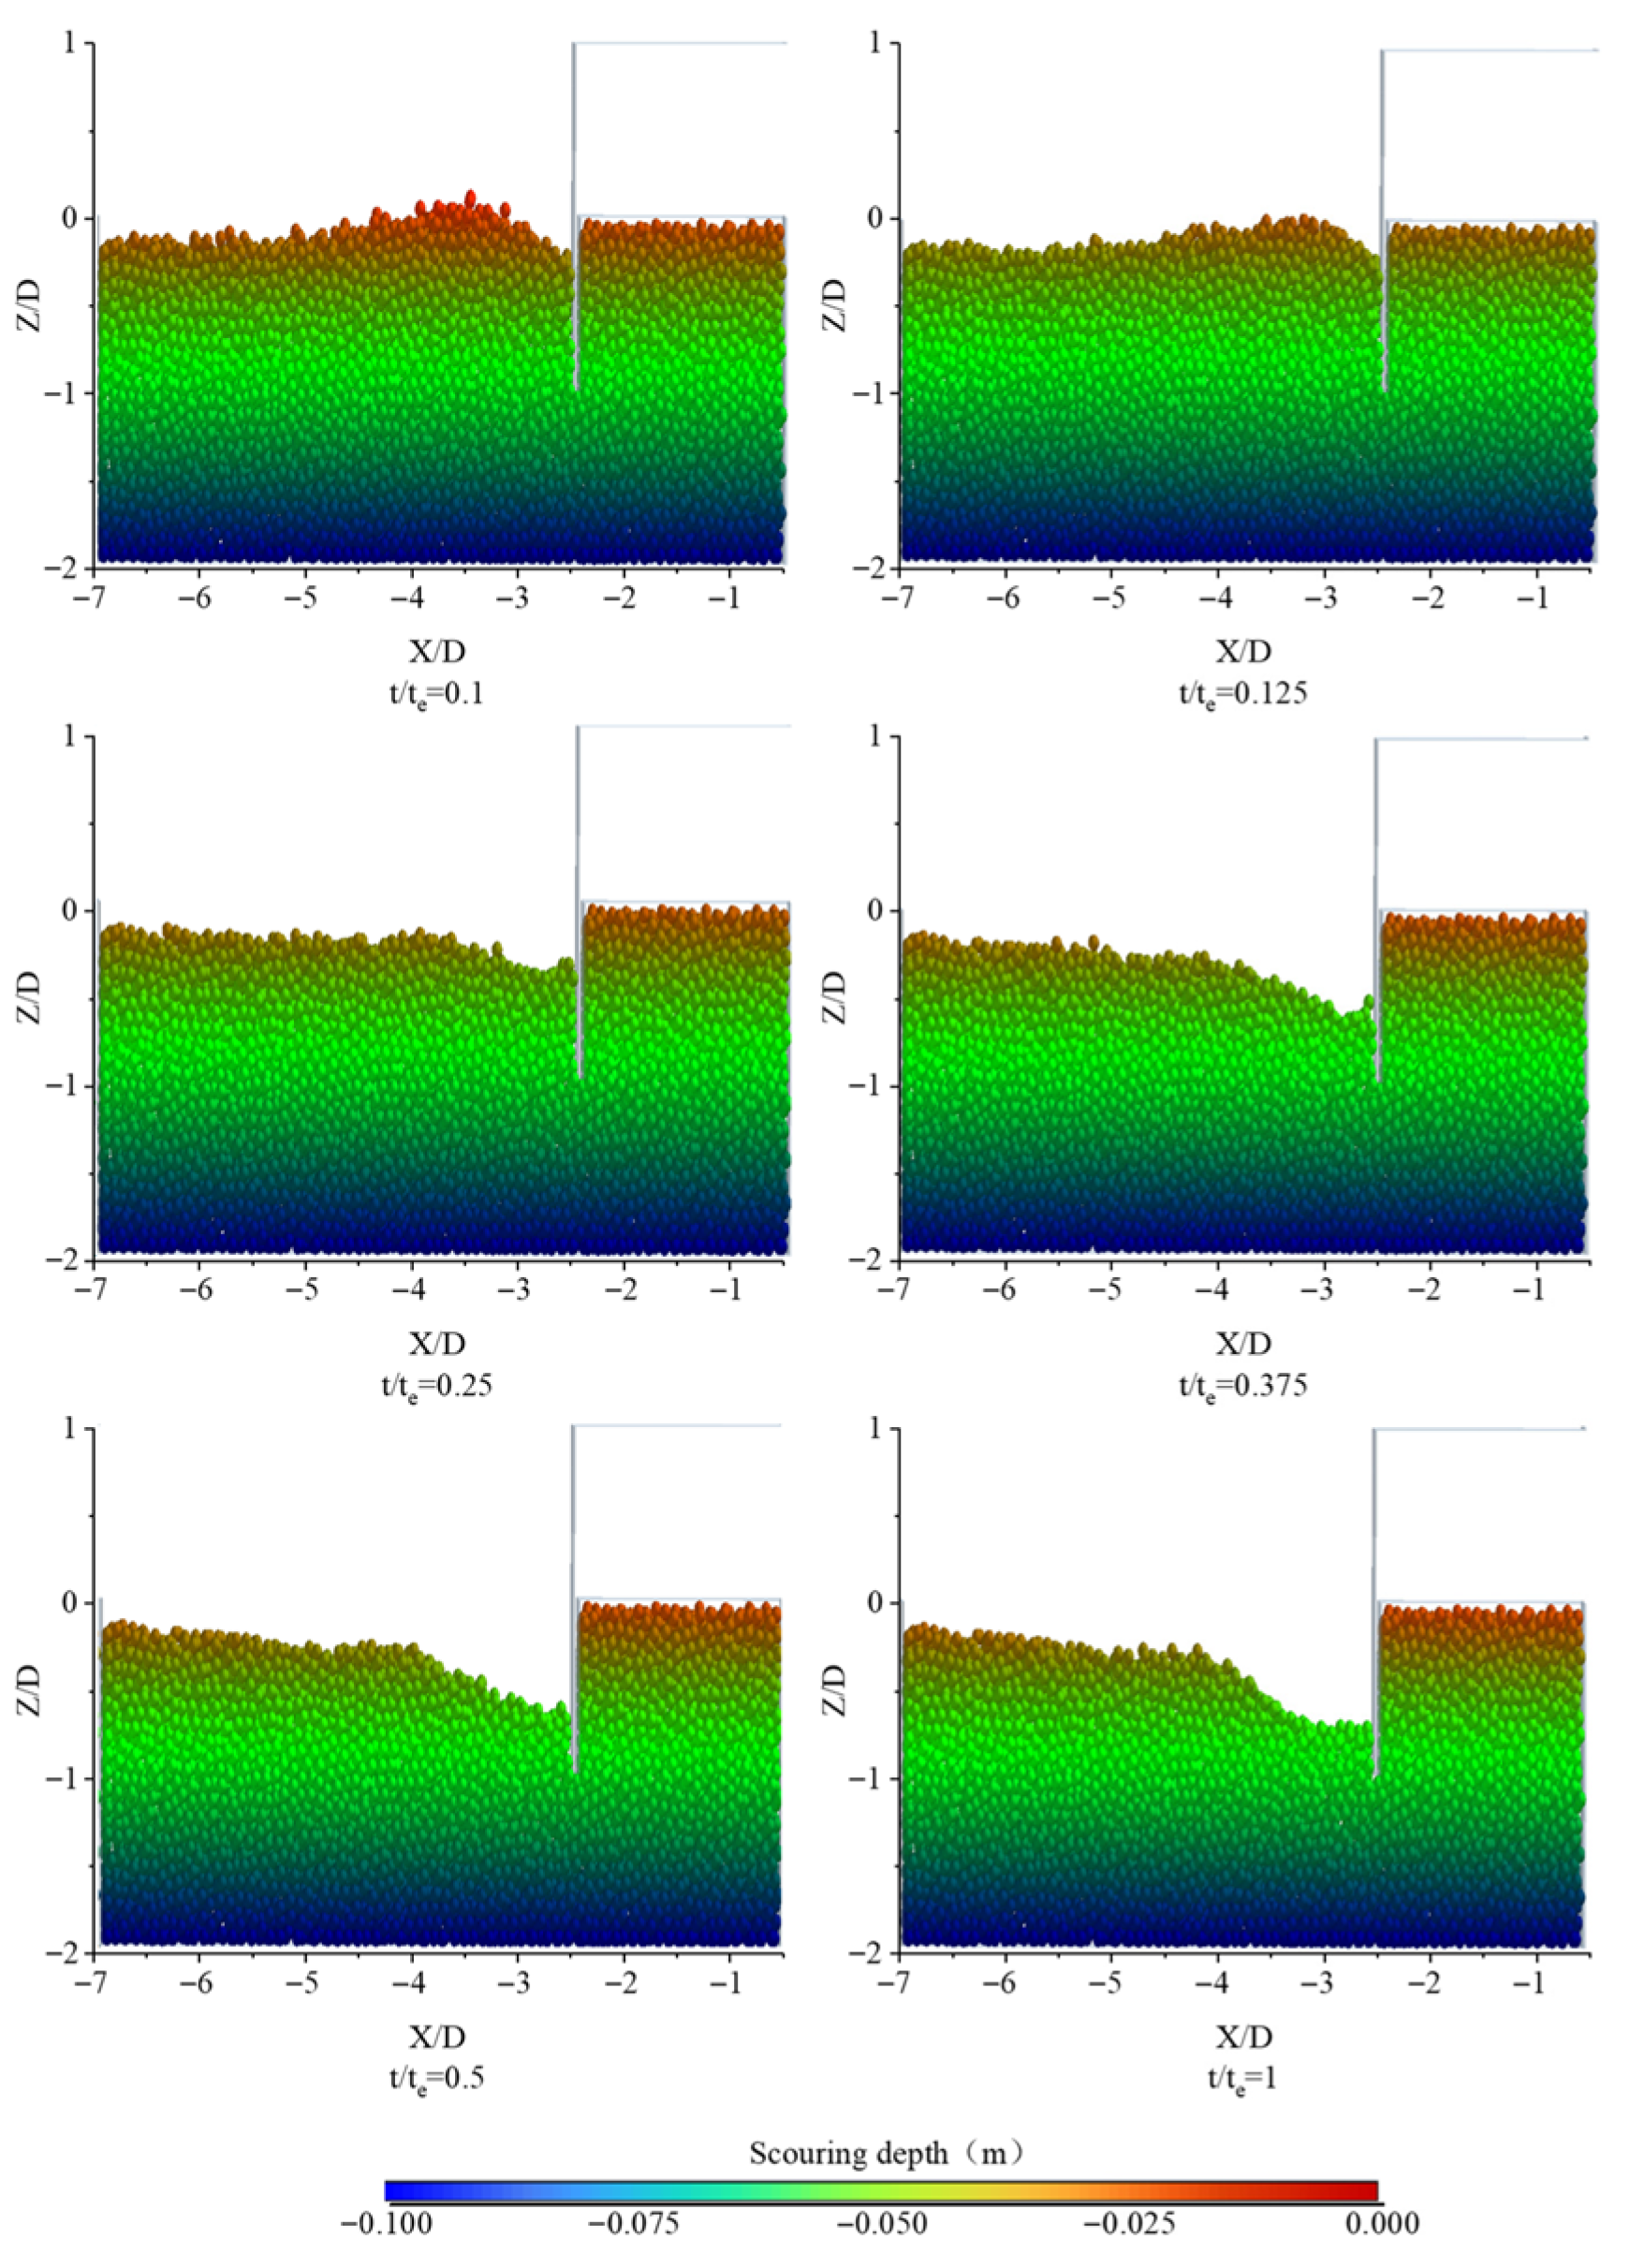
Figure 13 details the evolution of the upstream scour pit, emphasizing the role of horseshoe vortices in sediment mobilization. Initially, localized scouring forms a shallow depression that progressively deepens into a V-shaped profile characterized by a gentle inclined upstream slope, a steep midsection, and a near-horizontal section adjoining the monopile. At equilibrium, the pit’s gradual-slope geometry reflects a balance between fluid drag and sediment self-weight, validating the model’s capability to reasonably replicate natural scouring mechanics.
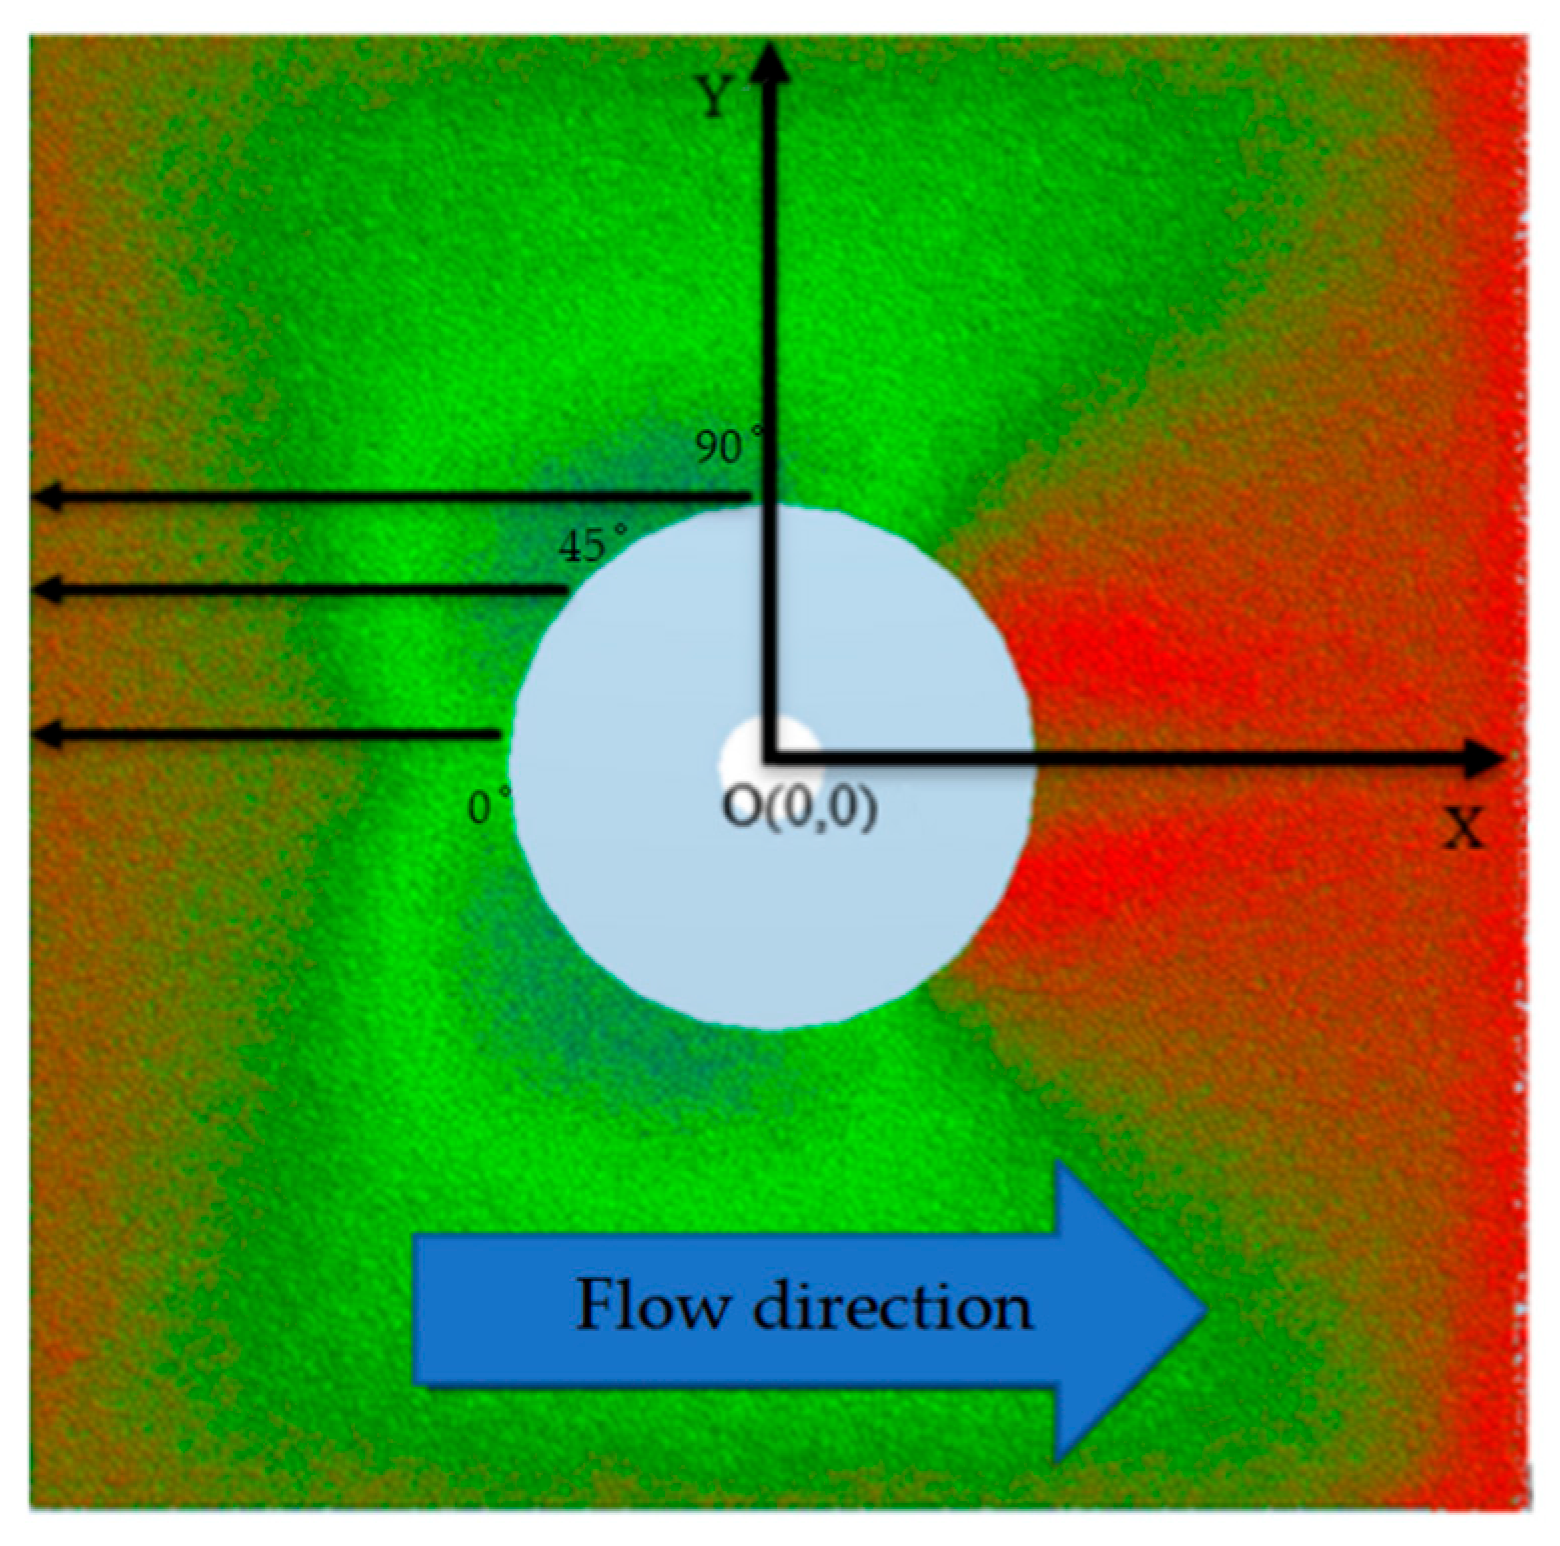
To determine the maximum scouring depth around the MGB hybrid foundation and investigate localized scouring at different positions, three critical positions were selected for analysis: 0° (directly upstream), 45° (lateral), and 90° (side) relative to the flow direction, all centered at the foundation’s cross-sectional axis and adjacent to the bucket component. The positions selected can be seen in Figure 14.
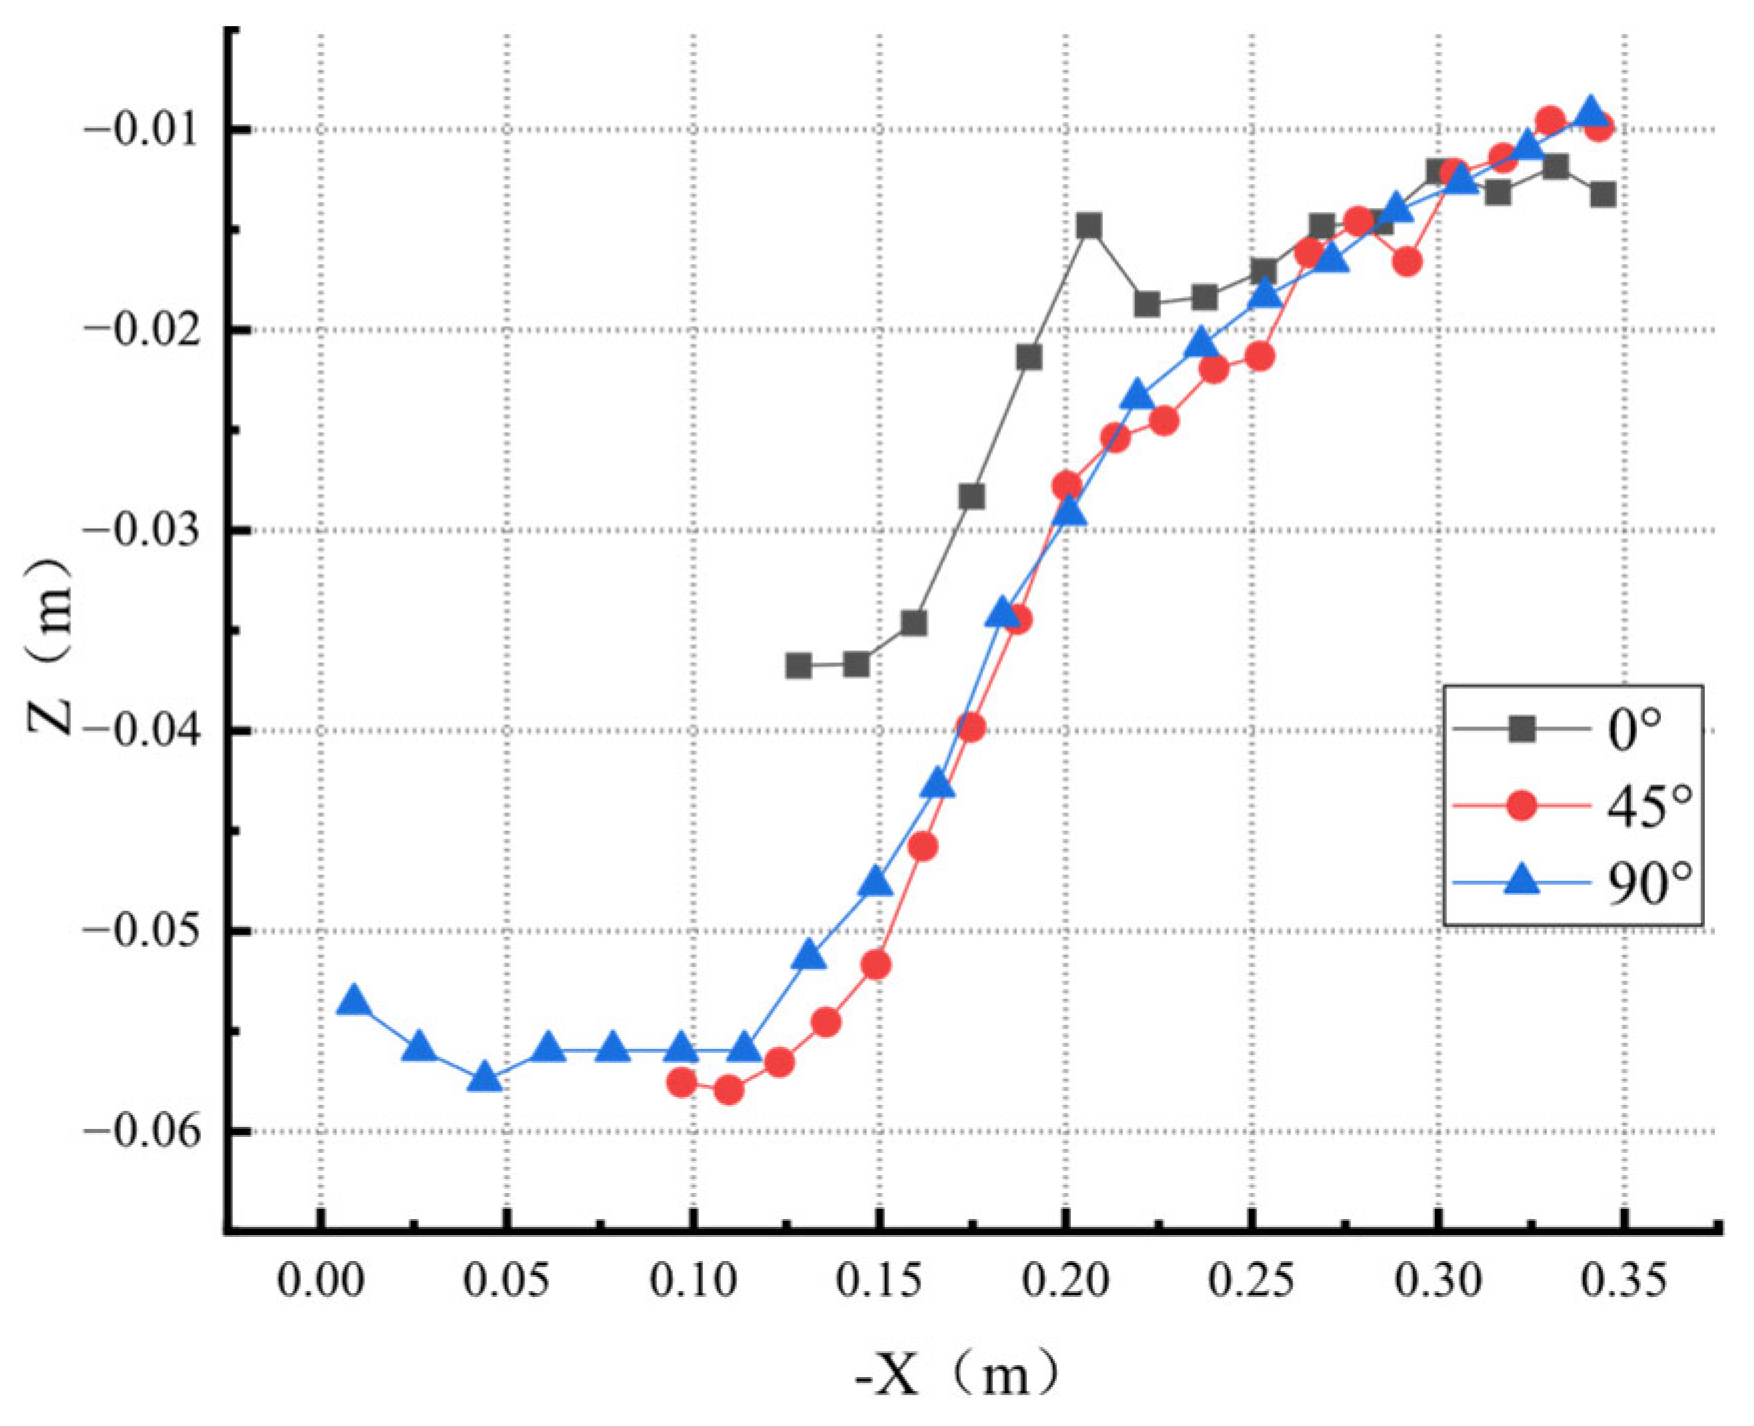
The temporal evolution of maximum scouring depths at these locations was presented in Figure 15. Throughout the scouring process, the 45° position consistently exhibited the greatest scouring depth, surpassing both the 0° and 90° positions. During the initial phase, scouring depths at 0° and 45° increased linearly at comparable rates, while the 90° position lagged significantly. As scouring progressed, the upstream (0°) scour rate decelerated, resulting in a stabilized depth hierarchy at equilibrium: 45° > 90° > 0°. Figure 16 details the scour pit profiles at the three angles. The horizontal axis represents the distance from the foundation center, and the profiles exhibit S-shaped curves. The 45° and 90° directions share similar maximum scouring depths (approximately −0.058 m), exceeding the 0° direction (−0.037 m). Notably, the 45° scour pit spans the largest spatial extent, with a maximum radius of 0.22 m, confirming it as the most scoured region. These findings validate the selection of the 45° cross-section for subsequent studies, providing a reliable basis for further analysis of scouring mechanisms.

3.3. Scour Pit Profile Under Different Conditions

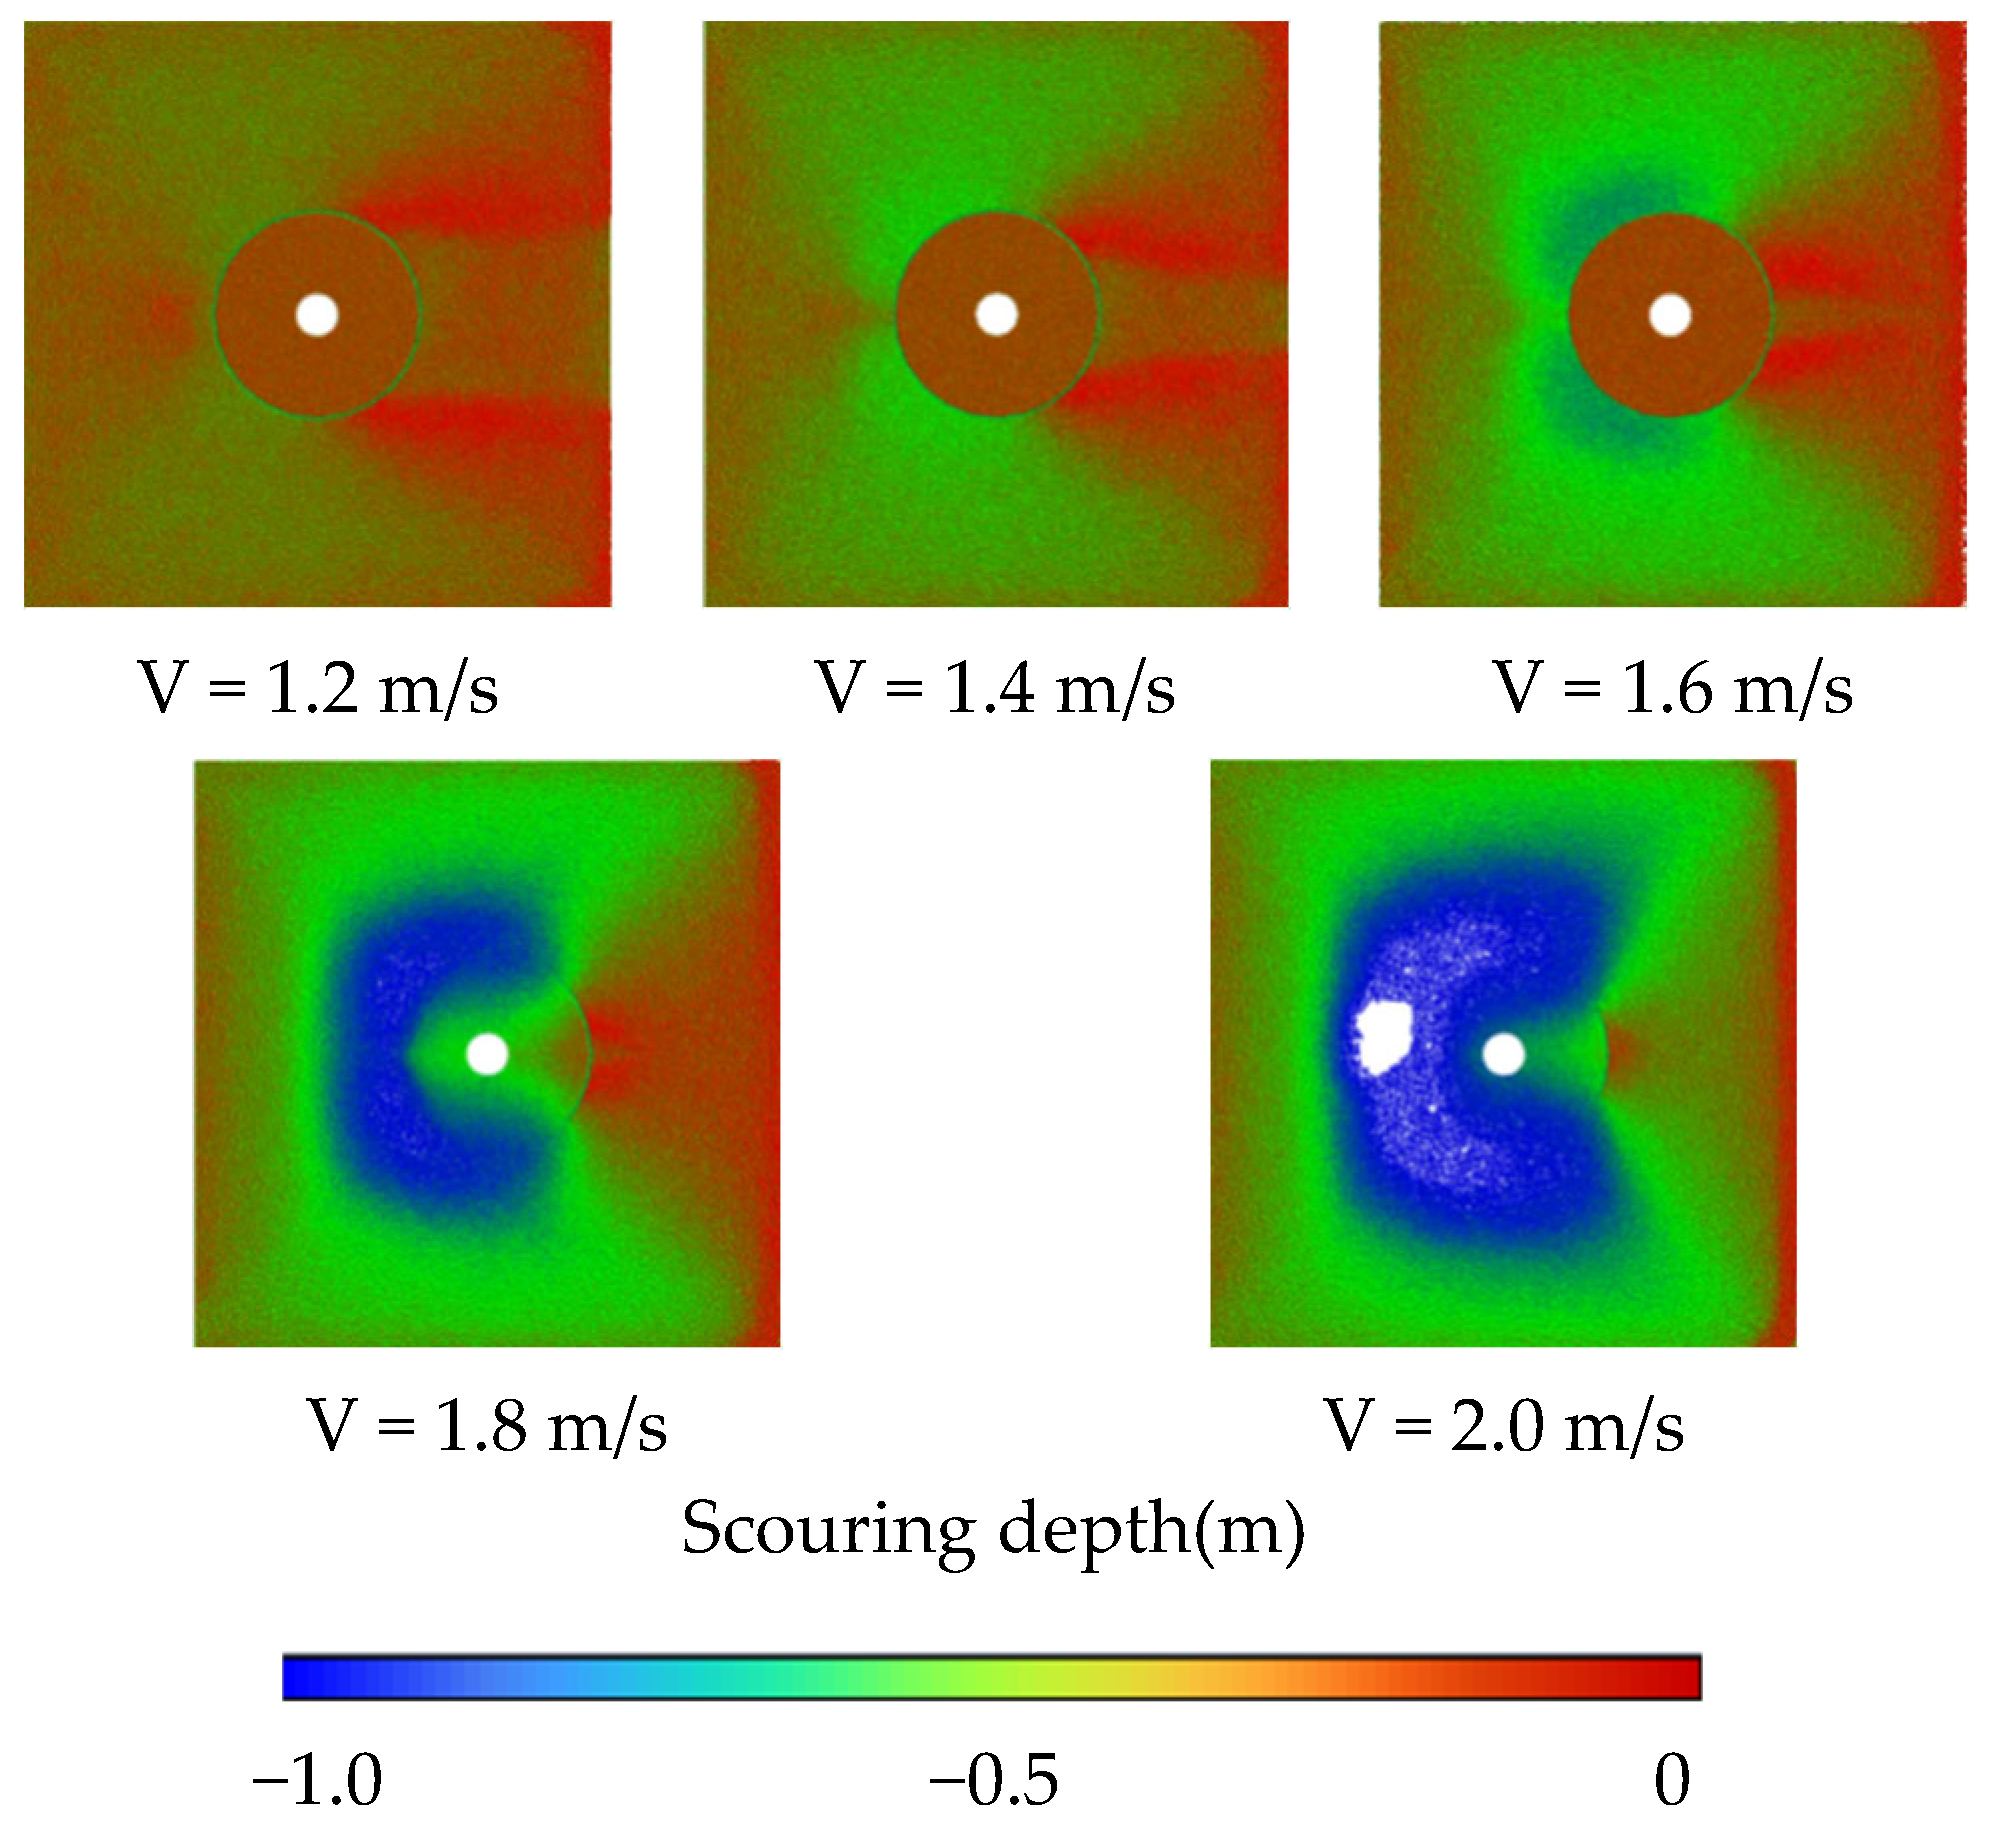
Figure 17 and Figure 18 illustrate the planar and longitudinal scour morphology around the foundation under varying flow velocities ranging from 1.2 to 2.0 m/s. At 1.2 m/s, the seabed exhibits minimal deformation, with no significant scour pit formation observed in either planar or longitudinal views. When the velocity increases to 1.4 m/s, slight erosion zones begin to appear in the planar view, while the longitudinal profile shows a shallow concave depression in the seabed. At 1.6 m/s, the scour pit expands spatially, forming a well-defined structure in the longitudinal profile with clear boundaries and a gradual slope. Further increasing the velocity to 1.8 m/s results in deeper scour zones in the planar view and steeper slopes in the longitudinal profile, indicating intensified erosion. At the highest tested velocity of 2.0 m/s, extensive deep scour regions dominate the planar view, but the longitudinal profile reveals that the scouring depth exceeds the simulation domain boundaries, preventing full characterization of the morphology. These observations highlight the progressive and nonlinear relationship between flow velocity and scour development, where higher velocities amplify both the spatial extent and depth of erosion until computational or physical limits are reached.
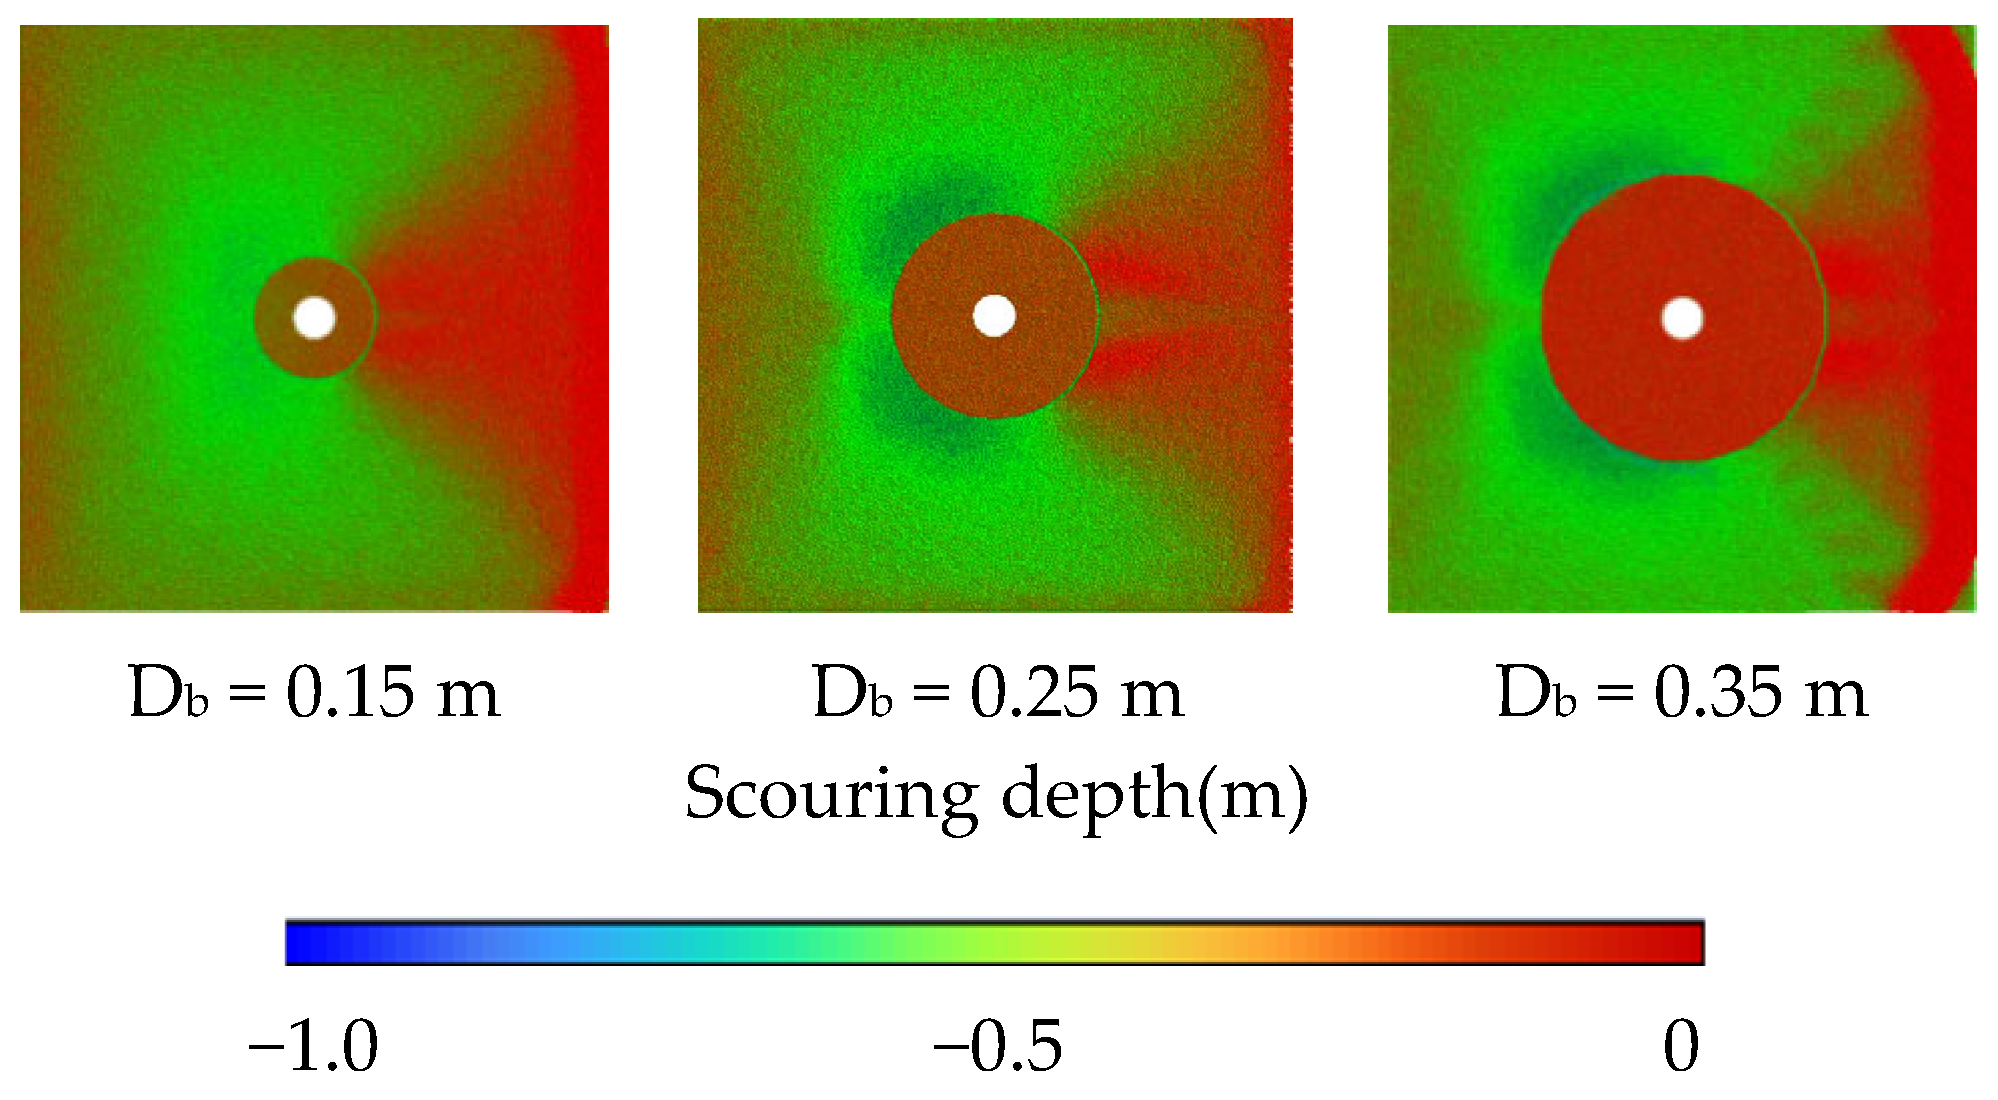
The equilibrium state scour pits under three bucket diameters (0.15 m, 0.25 m, and 0.35 m) were shown in Figure 19. As the bucket diameter increases, the scour pit expands spatially, transitioning from a “horseshoe-shaped” morphology to a more symmetrical and regular pattern, with limited erosion downstream of the bucket and minimal scouring in the wake zone. Figure 20 displays the longitudinal scour profiles upstream of the bucket foundation for these diameters. When the bucket diameter increases from 0.15 m to 0.35 m, the scouring depth increases, and the upstream boundary of the scour pit extends outward, reflecting a morphological evolution influenced by the bucket geometry.
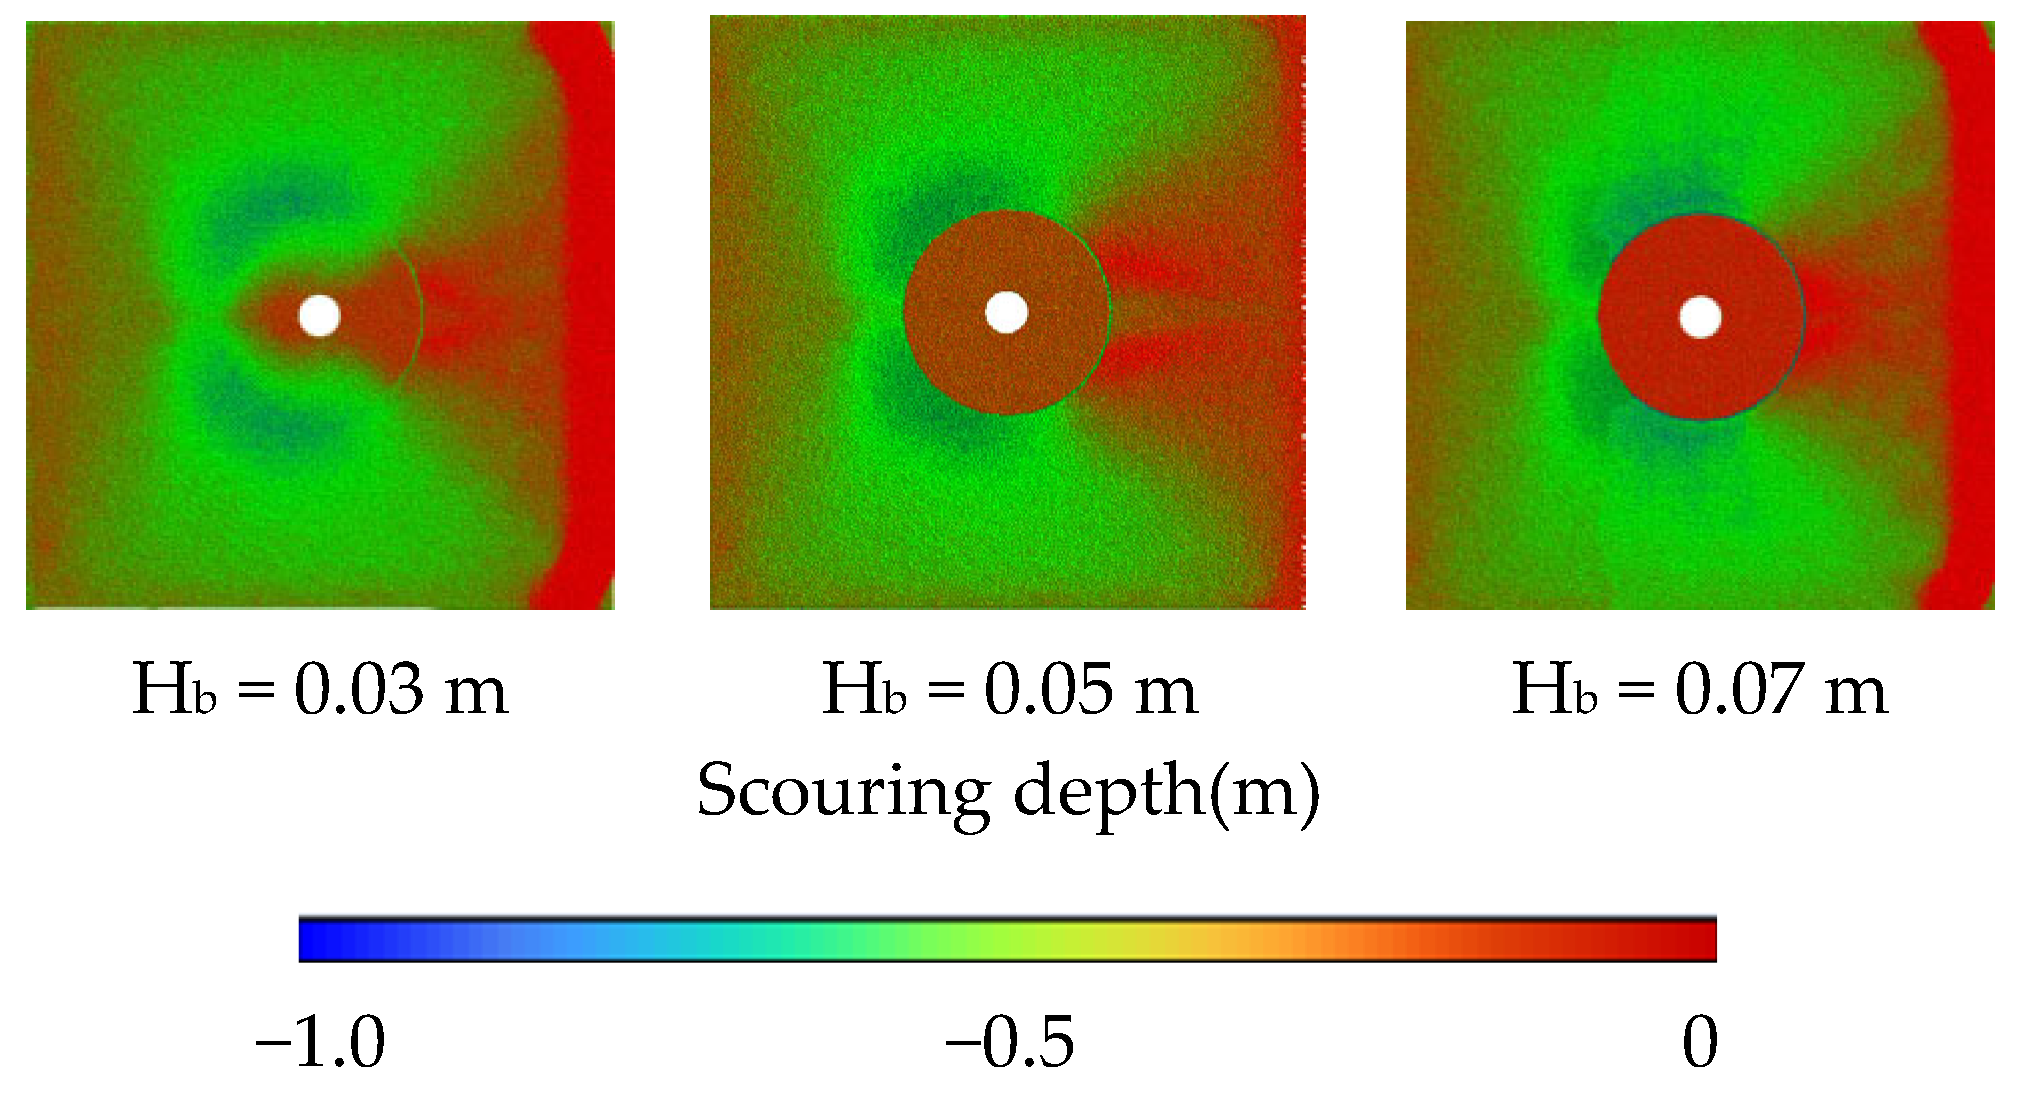
Figure 21 displays the equilibrium state scour pits under three bucket heights (Hb = 0.03 m, 0.05 m, and 0.07 m). At Hb = 0.03 m, significant scouring occurs around the bucket foundation, with erosion observed upstream, laterally, and beneath the structure, leading to under-base hollowing that threatens stability—consistent with flow field analysis results. As the bucket height increases to Hb = 0.07 m, the scour extent slightly expands compared to Hb = 0.05 m. Figure 22 further validates these findings through upstream longitudinal profiles: severe under-base erosion is evident at Hb = 0.03 m, while increasing the bucket height reduces localized erosion but significantly enlarges the scour extent.
Figure 23a demonstrates that across four flow velocities (1.2–1.8 m/s), the maximum scour depth increases nonlinearly with velocity—rising from 0.017 m at 1.2 m/s to 0.090 m at 1.8 m/s. Scour development follows a distinct rapid growth, deceleration, and equilibrium sequence: at higher velocities of 1.6–1.8 m/s, rapid initial growth transitions to minor subsequent increases, whereas lower velocities of 1.2–1.4 m/s achieve stabilization earlier. Figure 23b reveals consistent scour pit morphology across all velocities as a ‘gentle slope–flat bottom’ profile. This general morphology is consistent with observations from scour around other large-diameter structures, where the wide foundation base limits the downflow and horseshoe vortex strength, leading to a wider and shallower scour pit with a flatter base compared to standard monopiles. The specific dimensions of this morphology, however, are uniquely influenced by the MGB’s geometric parameters such as bucket diameter and height. Increasing velocity substantially amplifies both scour depth and spatial extent: maximum depth progresses from approximately 0.015 m with a boundary near X = 0.15 m at 1.2 m/s, to 0.035 m at 1.4 m/s, 0.06 m at 1.6 m/s, and 0.095 m at 1.8 m/s. These results confirm that flow velocity dictates quantitative scour parameters—depth and extent—while fundamental morphological characteristics remain invariant across velocities, reflecting scouring’s intrinsic physical mechanisms.
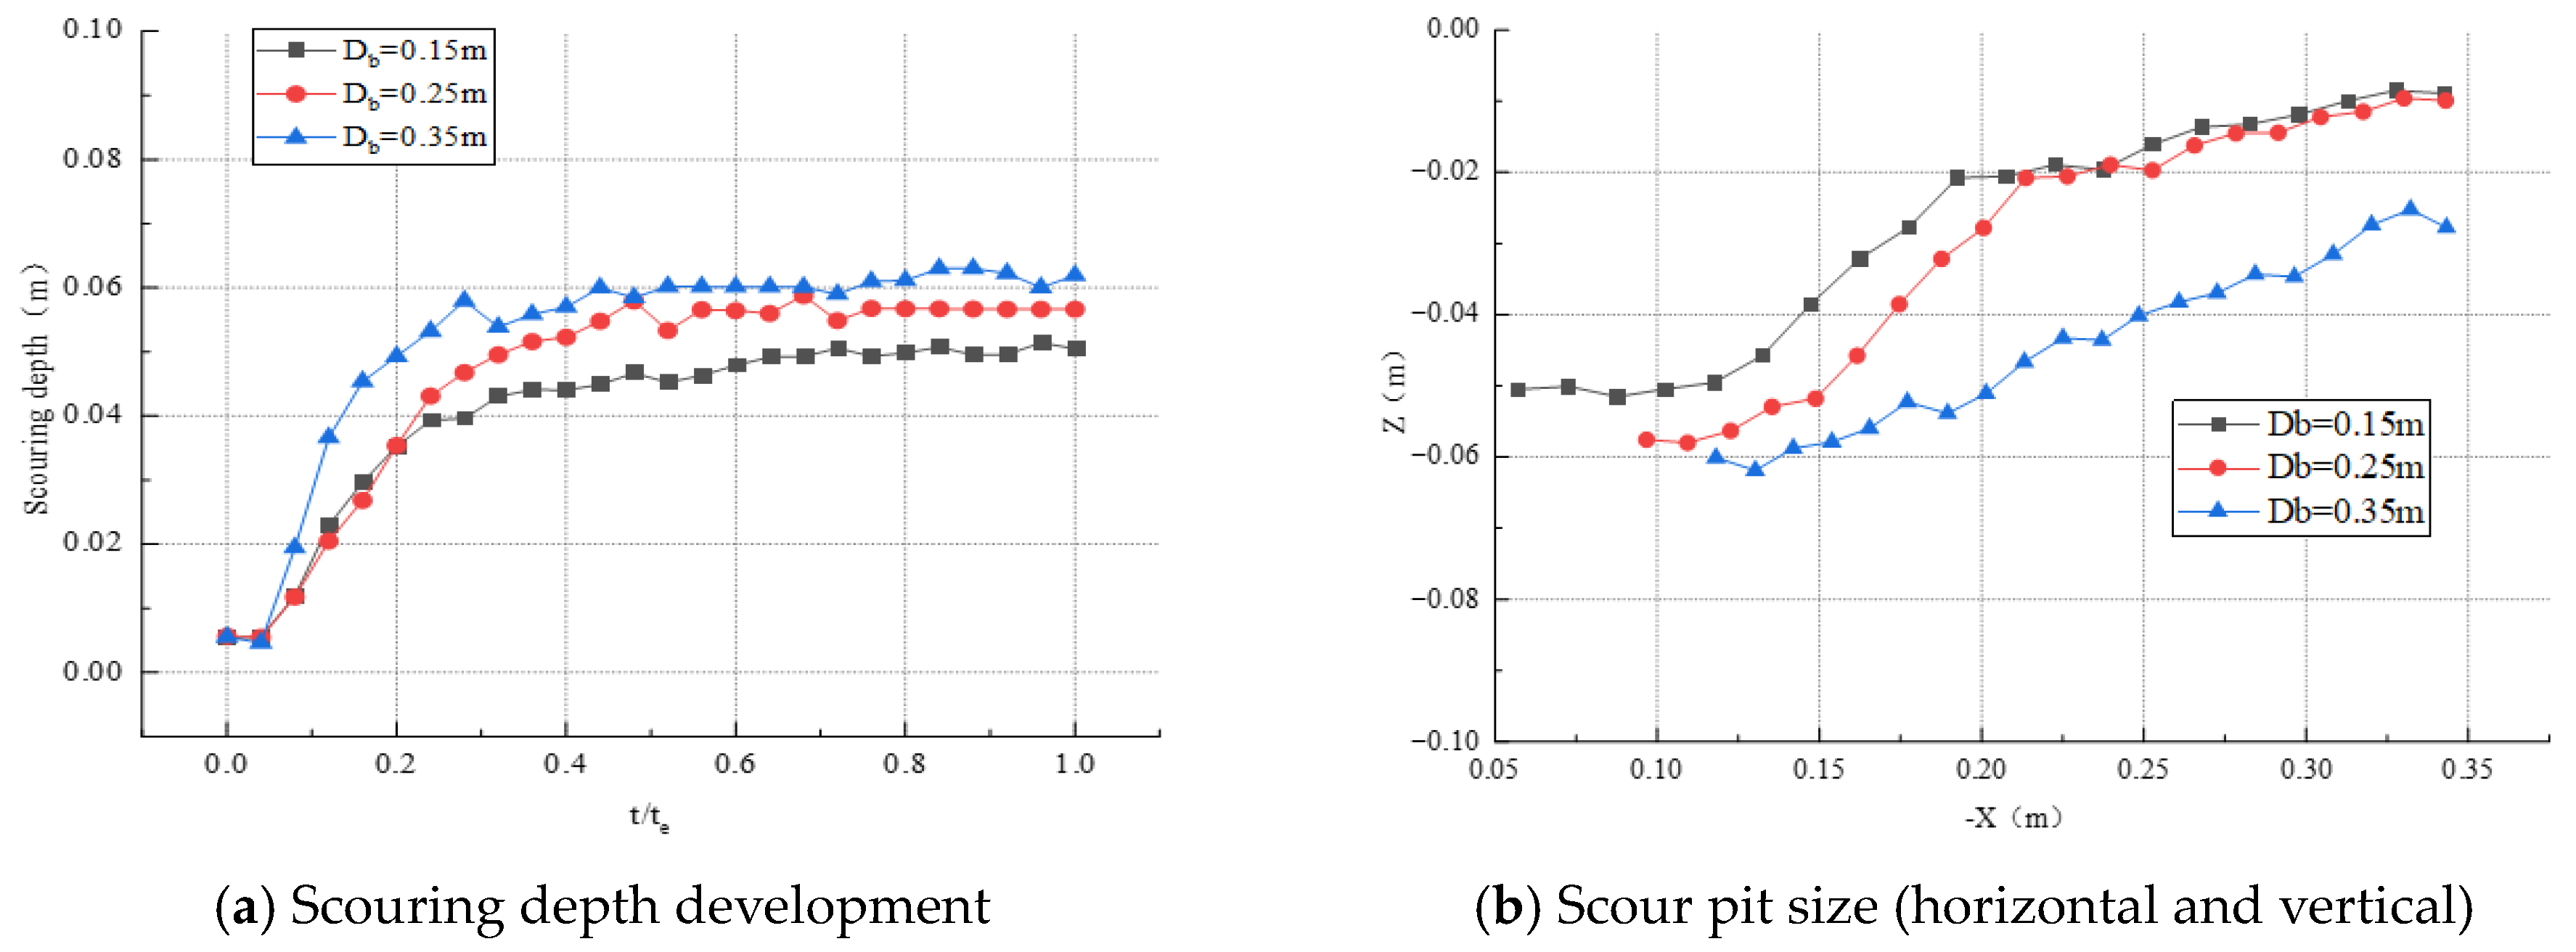
Figure 24a demonstrates that larger bucket diameters yield greater equilibrium scouring depths. The 0.35 m diameter achieves the maximum depth of approximately 0.058 m, followed by the 0.25 m diameter at 0.05 m and the 0.15 m diameter at 0.045 m. All cases exhibit a consistent three-stage scouring process: rapid development, deceleration, and equilibrium. Notably, the 0.35 m diameter displays the highest initial scouring rate, confirming that diameter governs both scouring dynamics and final depth. Beyond 60% of the equilibrium time, scour stabilizes across all cases, though fluctuations persist more prominently for larger diameters. Figure 24b illustrates scour pit profiles across diameters, consistently displaying a ‘inclined to flat’ longitudinal morphology. For the 0.15 m diameter, scouring depth reaches approximately 0.045 m with a minimal radius of 0.18 m and the steepest slope. The 0.25 m diameter increases depth to 0.058 m, extends the radius to 0.25 m, and exhibits progressively moderate inclined slope transitions. The 0.35 m diameter attains the greatest depth of 0.06 m and radius exceeding 0.35 m, demonstrating the flattest slope configuration.
The temporal evolution of maximum scour depth under three bucket heights: 0.03 m, 0.05 m, and 0.07 m were shown in Figure 25a. Both the 0.03 m and 0.07 m heights exhibit rapid early-stage scour development—indicated by their steepest curve slopes, achieving marginally greater final depths than the 0.05 m height. Scour stabilizes across all cases after exceeding 60% of the equilibrium time (t/te > 0.6). Figure 25b reveals scour pits consistently display a ‘gentle slope–flat bottom’ longitudinal profile across all heights, though spatial extents are notably larger for the 0.03 m and 0.07 m configurations. Crucially, scour performance relates nonlinearly to lower-edge height: the shortest 0.03 m height intensifies under-base hollowing, while the tallest 0.07 m height amplifies both scour depth and spatial extent due to reinforced horseshoe vortex development. Optimal lower-edge height thus requires balancing these competing scour mechanisms to minimize adverse impacts on foundation stability.
Scour pit formation fundamentally results from hydrodynamic drag forces acting on sediment particles. During initial development, particle velocity and drag force surge rapidly to initiate scouring. The intermediate stage features fluctuating particle velocities with sustained oscillatory drag forces that expand the pit. At equilibrium, particle velocity declines as drag and gravitational forces balance, stabilizing the scour morphology.
Figure 26a quantifies average particle velocity within the maximum scour zone across four flow velocities (1.2–1.8 m/s). Higher velocities generate proportionally greater particle speeds, peaking at 0.002 m/s at 1.2 m/s, 0.004 m/s at 1.4 m/s, 0.008 m/s at 1.6 m/s, and 0.024 m/s at 1.8 m/s. Lower velocities of 1.2–1.4 m/s concentrate particle activity predominantly in the early stage (t/te < 0.4), whereas 1.8 m/s induces sustained high-velocity motion with pronounced fluctuations.
Figure 26b tracks the drag-to-weight ratio (F/G) evolution. Following an initial rapid rise near t/te ≈ 0.05, F/G stabilizes at approximately 0.4 for velocities of 1.2–1.6 m/s. In contrast, the 1.8 m/s case maintains a higher average F/G of 0.5 with peaks reaching 0.6, indicating intensified drag forces and more vigorous scouring at extreme velocities.
Figure 27a,b demonstrate the influence of bucket diameter on sediment dynamics. The largest diameter of 0.35 m achieves the highest initial particle velocity, reaching 0.024 m/s at just 10% of equilibrium time (t/te = 0.1) and signifying intense early-stage sediment mobilization and irreversible bed erosion. In contrast, smaller 0.15 m diameters generate localized stable flow fields that induce weaker but prolonged scouring. The 0.35 m configuration also exhibits an elevated initial drag-to-weight ratio of F/G ≈ 0.5, reflecting stronger hydrodynamic disturbances. Although all cases converge to F/G ≈ 0.4 beyond t/te = 0.4, the deeper scour pits under larger diameters permanently modify local flow structures.
Figure 28a,b reveal how bucket height affects sediment dynamics. At the maximum 0.07 m height, particle velocity peaks earliest and highest—approximately 0.029 m/s at t/te = 0.1, indicating violent sediment mobilization during initial scouring. Conversely, the minimum 0.03 m height cannot effectively suppress under-base scouring, resulting in persistently active sediment transport with sustained fluctuations. For the drag-to-weight ratio, the 0.07 m edge peaks initially near F/G ≈ 0.58 but stabilizes later at 0.35. The intermediate 0.05 m edge maintains the highest stable ratio of 0.42 during equilibrium, while the 0.03 m edge exhibits a moderate F/G ≈ 0.38, indicating consistent scouring intensity. These results underscore how bucket height critically modulates both scouring intensity and sediment transport regimes.

4. Finite Element Analysis of Ultimate Bearing Capacity for MGB Hybrid Foundations

Based on the formation mechanisms, evolutionary processes, and characteristic behaviors of scour pits previously analyzed, scour pits surrounding MGB hybrid foundations can significantly compromise the soil-structure interaction between gravity-shallow bucket skirt and surrounding soils. This necessitates investigating the ultimate bearing capacity of MGB composite foundations under various scour pit morphologies. The model incorporated idealized scour pit morphologies based on findings in previous sections. The effects of varying scour pit configurations on the characteristics of the lateral bearing capacity of the MGB hybrid foundation were investigated.

4.1. Establishment of the Finite Element Model

The computational model comprises three components: the MGB hybrid foundation, gravel layer, and soil mass, which is shown in Figure 29. A 1/2 symmetric model was established using symmetry about the xz-plane. The computational domain extends 50 m horizontally (10Db) and 60 m vertically downward (2L). The monopile has a diameter of 5.0 m and a total length of 30.0 m, embedded entirely within the soil. The hybrid component has a diameter of 25.0 m, a total height of 10.0 m (the height of the gravity part and bucket part are all 5.0 m), and a skirt thickness of 0.25 m. The top of the monopile is positioned 15 m above the gravel layer. The soil model spans 60.0 m vertically and 100.0 m horizontally to eliminate boundary effects on the results. The gravel-filled gravity wheel was simplified as a solid boundary with equivalent geometric and weight properties. This simplification is justified as the primary focus of the FEA is to assess the global bearing capacity response of the foundation system to scour-induced geometry changes, rather than modeling the internal interaction between gravel particles. The Mohr-Coulomb model was adopted for the soil and gravel due to its proven capability in capturing the ultimate limit state behavior of granular materials under large-scale loading conditions, which is the primary focus of this bearing capacity analysis.
This section presents findings from CFD-DEM simulations, revealing that scour pit profiles typically demonstrate a ‘gentle slope-flat bottom’ morphology. Based on these results, geometric models with varying scour dimensions were developed. Figure 30 illustrates key parameters: H1 denotes the scouring scope, H2 represents the scouring depth, and H3 is the range of the flat bottom section, fixed at 2.5 m. Nine geometric models with distinct scour dimensions were constructed; detailed parameters are provided in Table 6.
The MGB hybrid foundation is modeled as steel with an elastic modulus E = 2.1 × 10⁵ Mpa, Poisson’s ratio ν = 0.3, and density ρ = 7850 kg/m3. The steel is idealized as an elastic-perfectly plastic material. The gravel-filled zone adopts the Mohr-Coulomb elastoplastic model with an elastic modulus E = 200 Mpa, internal friction angle φ = 38°, cohesion c = 8 kPa, dilation angle ψ = 8°, and density ρ = 1850 kg/m3. The surrounding soil mass is also modeled using the Mohr-Coulomb elastoplastic model with parameters: elastic modulus E = 40 Mpa, internal friction angle ν = 0.3, cohesion c = 3 kPa, dilation angle ψ = 5°, and density ρ = 2650 kg/m3. The interface between the MGB hybrid foundation and soil is simulated using the penalty method for tangential contact (friction coefficient 0.3) and the hard contact model for normal contact.
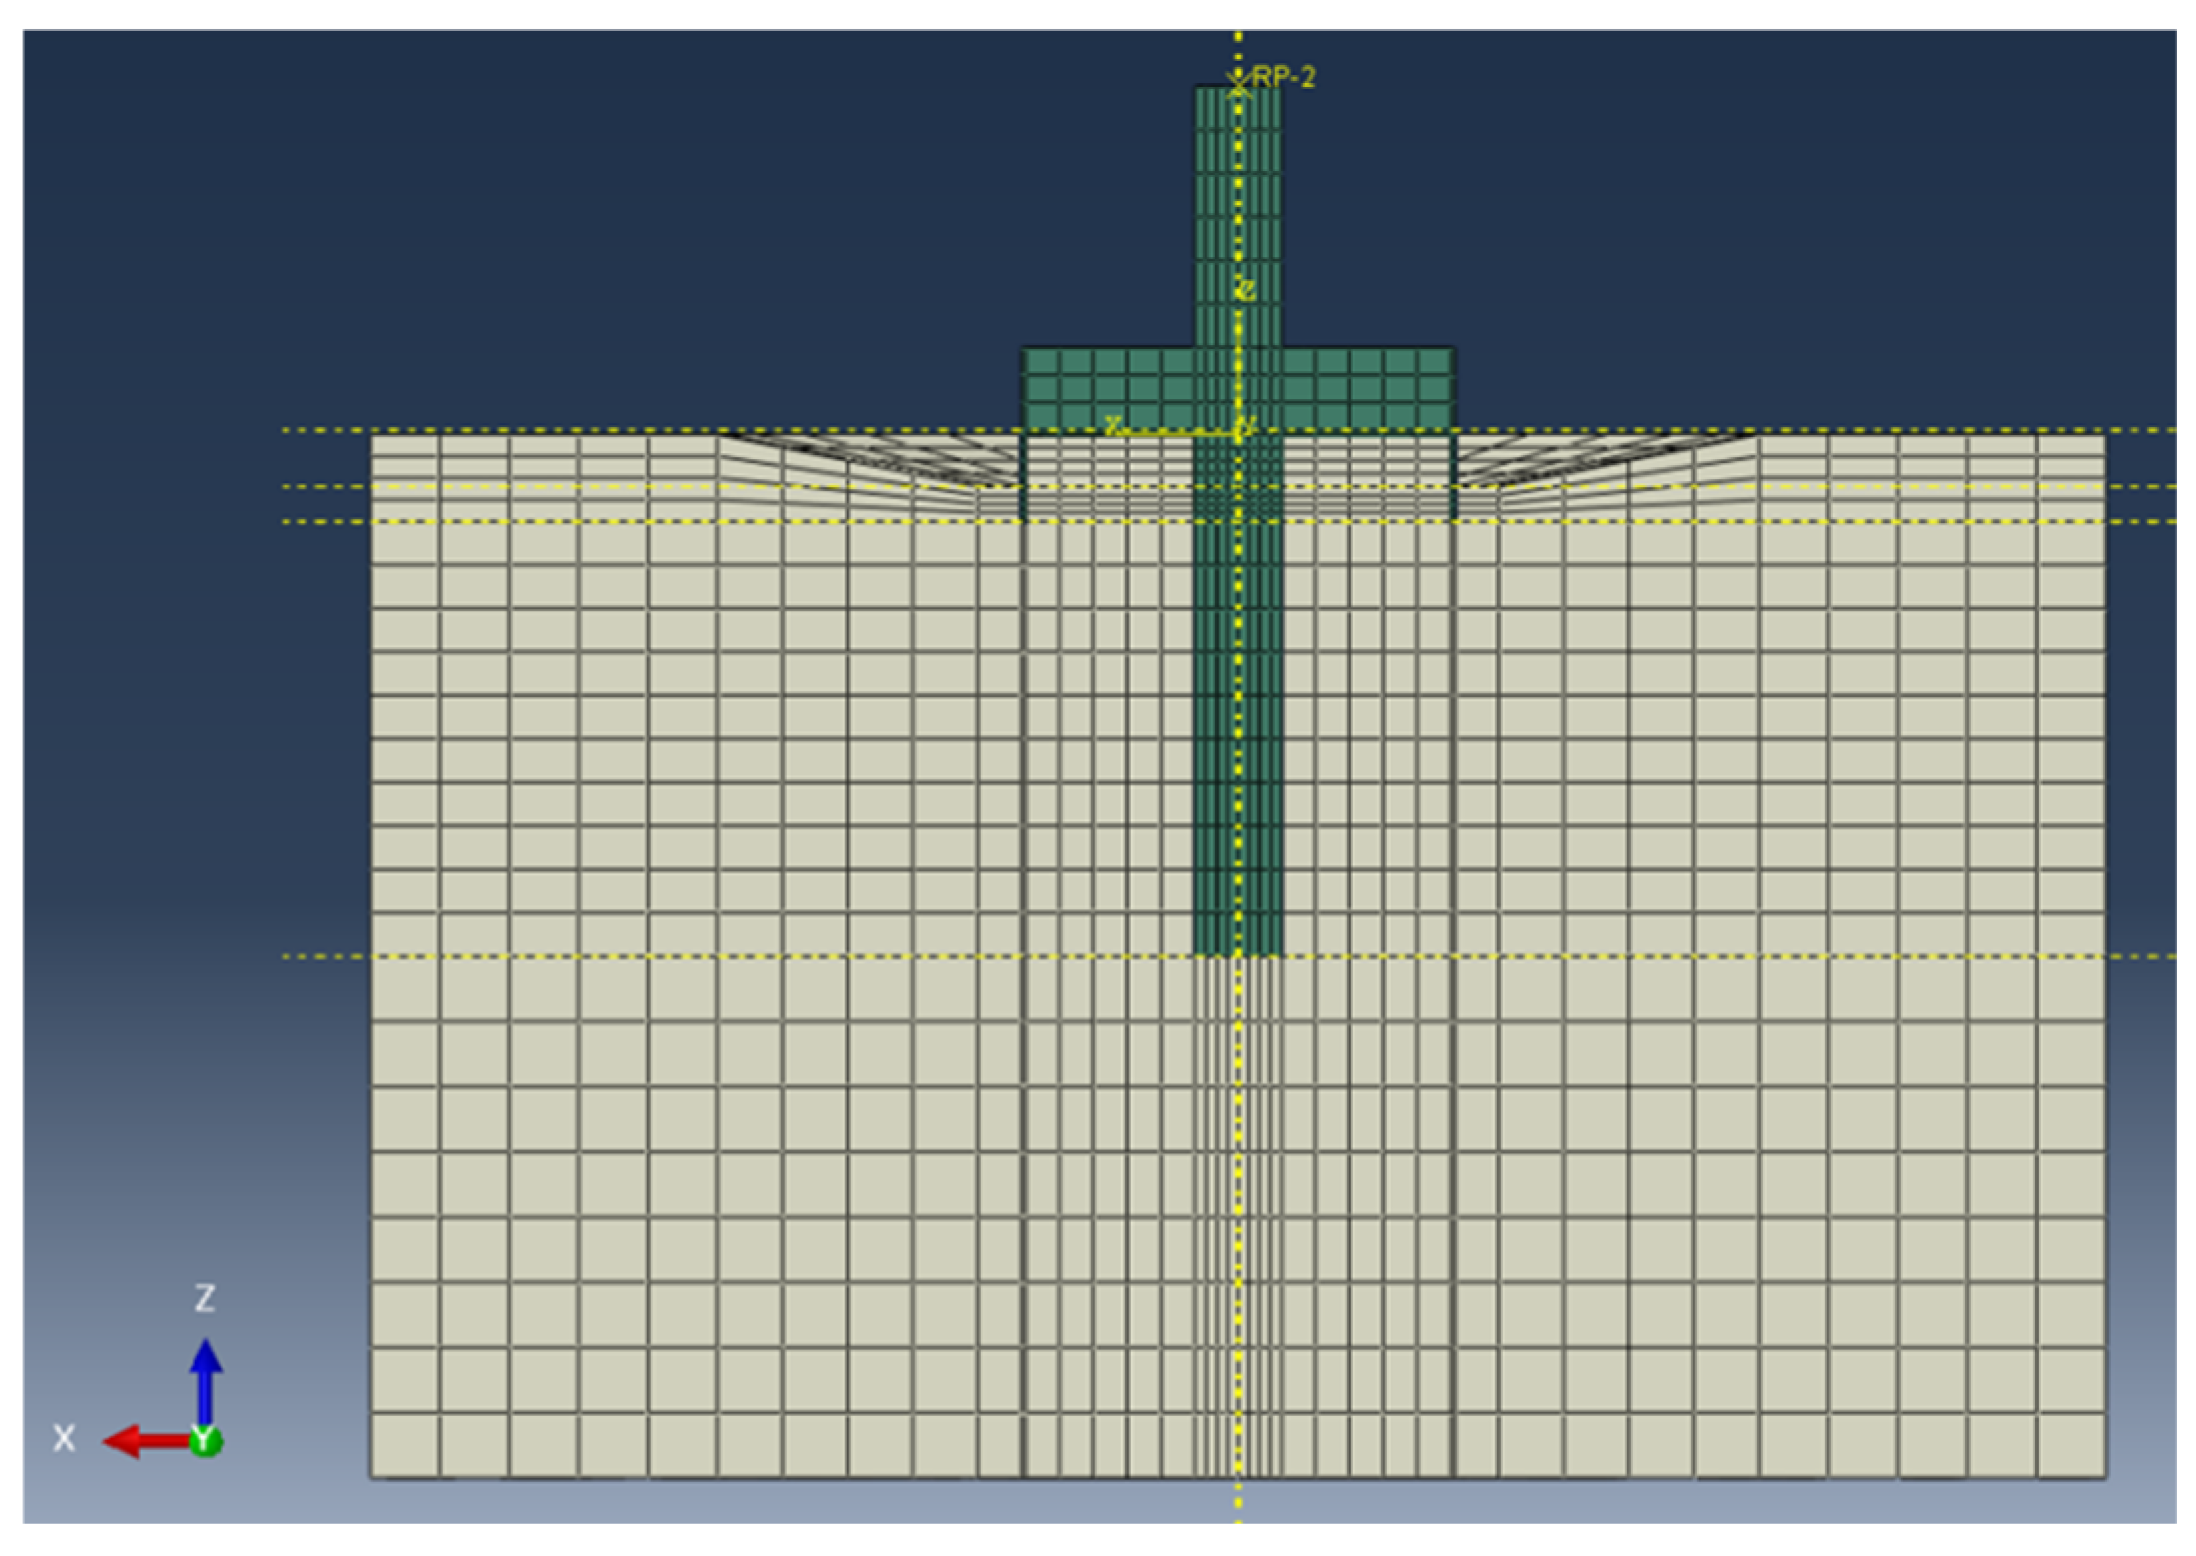
The model employed the following boundary conditions: full vertical constraint at the base, lateral restraint along side boundaries, and suppressed normal displacement at the symmetry plane. Following initial geostatic stress equilibration and removal of scoured soil material, a horizontal displacement load was applied along the negative X-axis through a reference point rigidly coupled to the monopile top. The hybrid foundation mesh utilized structured C3D8R hexahedral elements with three critical refinements: (1) enhanced resolution at high-stress zones, (2) radial-circumferential patterning around the bucket periphery, and (3) graded soil discretization featuring fine elements near the foundation transitioning to coarser elements distally. All elements satisfied strict quality criteria including dihedral angles exceeding 15°, aspect ratios below 10, and distortion values under 0.85 to ensure analysis precision. The front and top view of the mesh are shown in Figure 31 and Figure 32.

4.2. Foundation Bearing Characteristics Analysis

Figure 33 shows that as the scouring depth increases, the soil displacement zone around the MGB hybrid foundation expands, and bending deformation at the monopile base intensifies. However, the horizontal displacement at the monopile base remains similar, attributed to the monopile’s global stiffness, deep soil support, and displacement-controlled loading. Under the same scouring depth, the spatial extent of soil deformation increases with scour range, though less significantly than scouring depth effects.
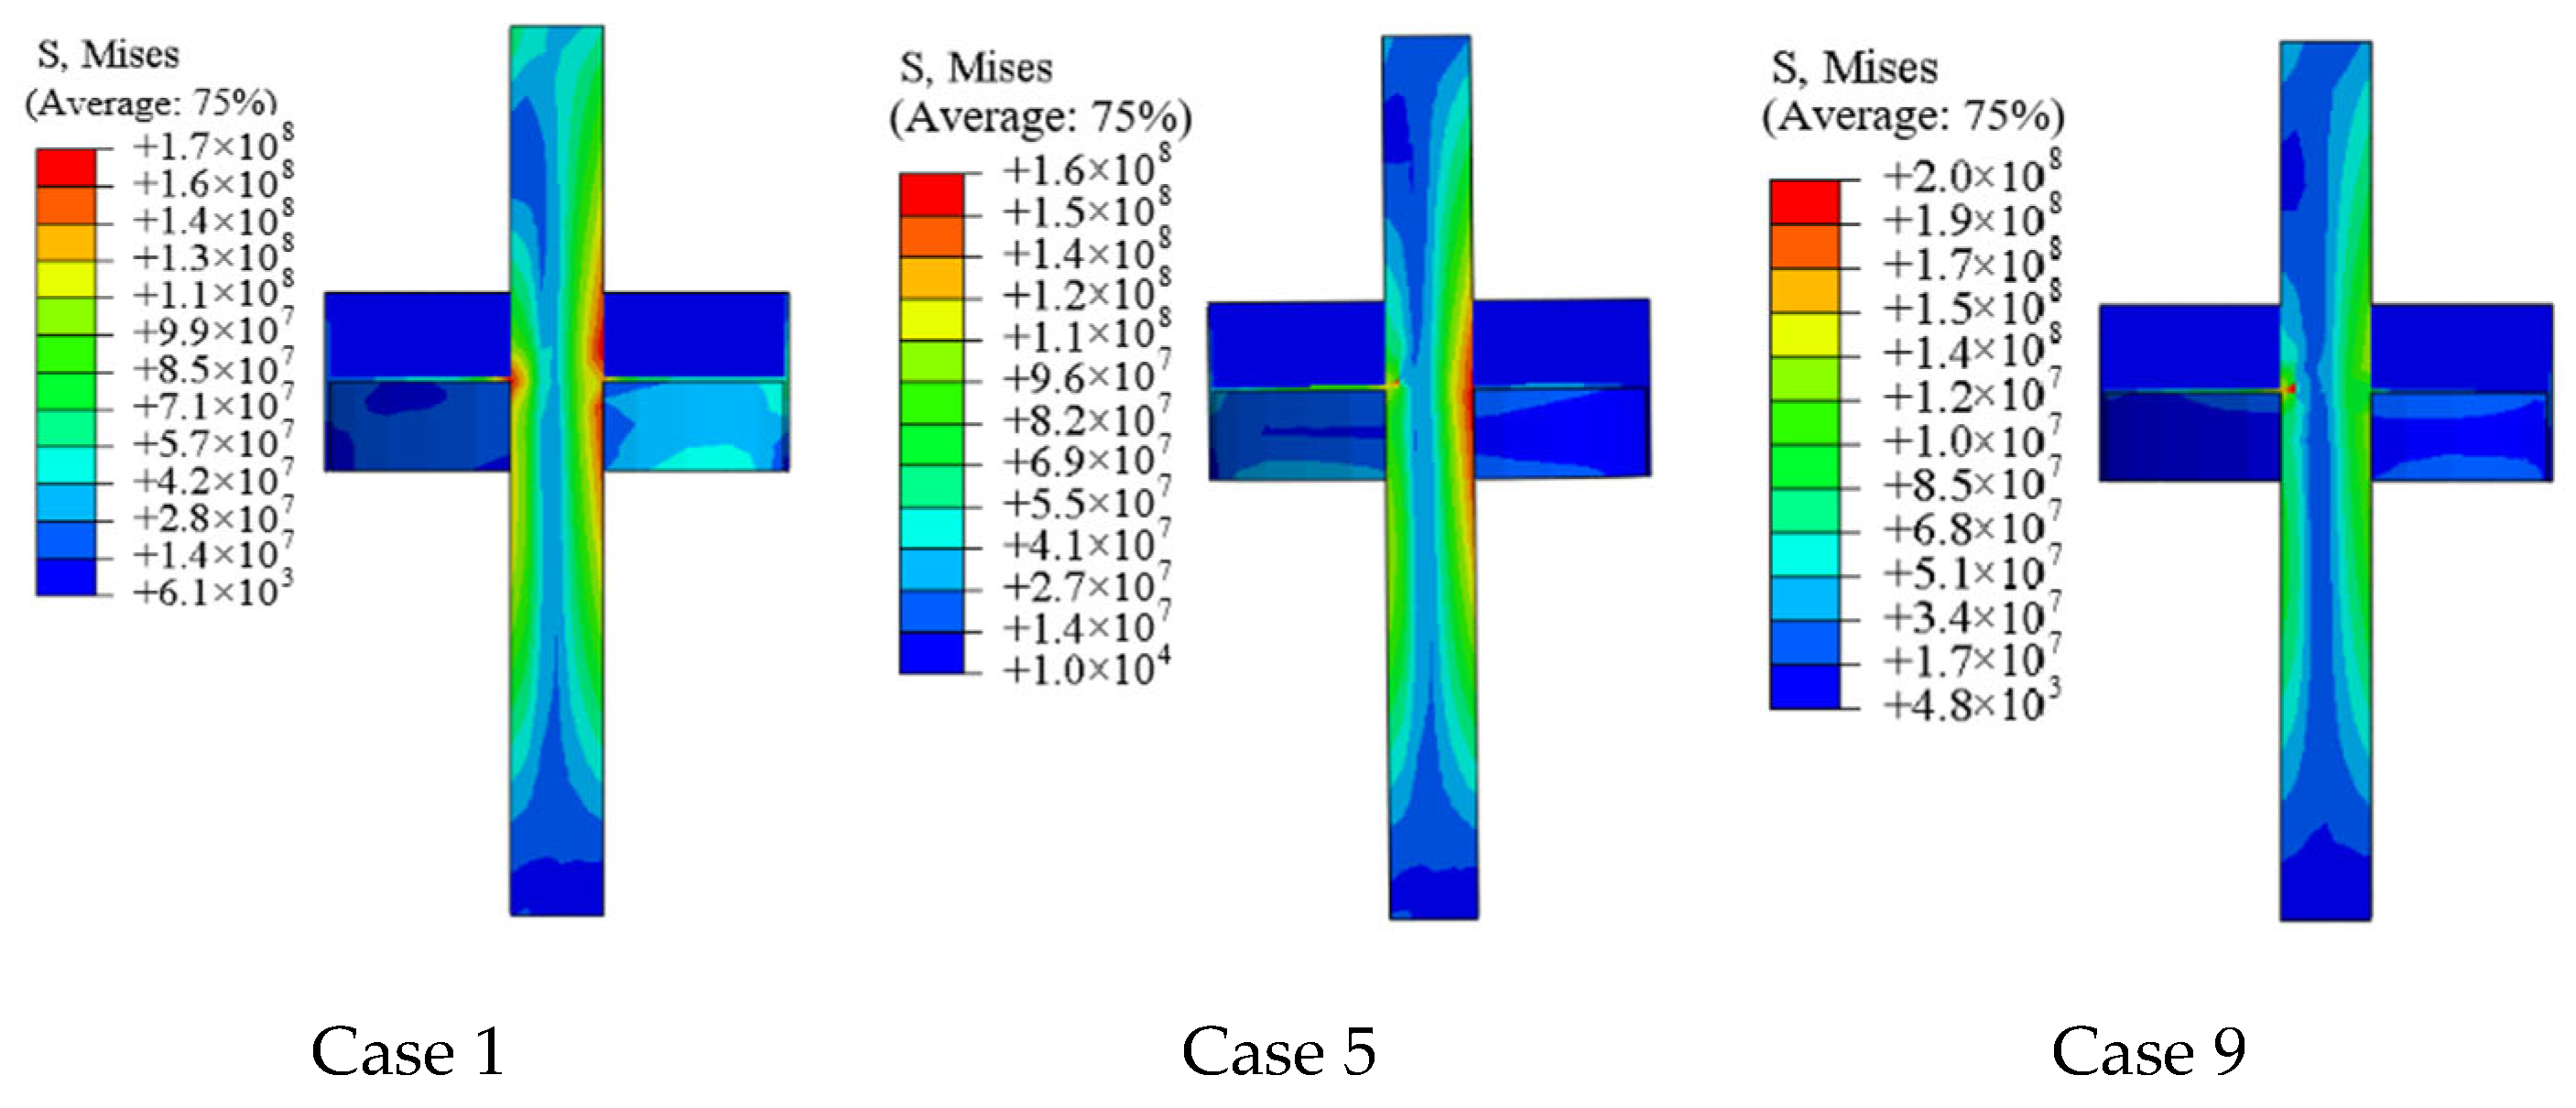
Figure 34 demonstrates a consistent stress distribution pattern characterized by a maximum stress concentration of approximately 170 MPa at the surface of the structure. This localized high-stress region contrasts with the gradually diminishing stress gradient observed along the monopile’s mid-section. The bucket structure maintains comparatively lower stress levels overall, exhibiting significant stress localization solely at its connection interface. These distribution characteristics are governed by the combined influence of structural geometry and material properties: the monopile predominantly resists bending moments while the bucket provides supplementary lateral support.
Figure 35 highlights the soil stress distribution, with high-stress zones concentrated around the monopile tip. The soil near the bucket experiences minimal stress, indicating that soil-structure interaction under horizontal loads is dominated by the monopile-tip and soil contact which differs from the stress distribution without scour [6]. The overturning resistance from the shallow bucket was compromised mainly by the depth of the scouring. The structure-soil system’s load-bearing mechanism involves the monopile transferring bending stresses to the soil via its tip, while the bucket and surrounding soil offer supplementary stability under scouring condition.
Figure 36 displays the displacement-load curves for different simulation cases. The horizontal axis represents the dimensionless displacement ratio U1/D, and the vertical axis represents the horizontal bearing capacity F. All curves initially follow a linear trend (elastic stage), then transition into an elastoplastic stage with gradual curvature, and finally stabilize, indicating proximity to the ultimate bearing state.
The significantly greater influence of scour depth (H1) compared to scour range (H2) on the ultimate bearing capacity is attributed to the fundamental shift in the failure mechanism. A greater scour depth directly reduces the effective embedment depth and lateral support provided by the superficial soil layers to the bucket skirt and the upper monopile. This loss of confinement leads to a reduction in the soil passive resistance and allows for the development of a deeper failure wedge, thereby increasing the bending moment demand on the monopile. In contrast, an increased scour range primarily removes soil farther from the foundation, which has a comparatively smaller impact on the primary soil-structure interaction mechanism governing lateral capacity.
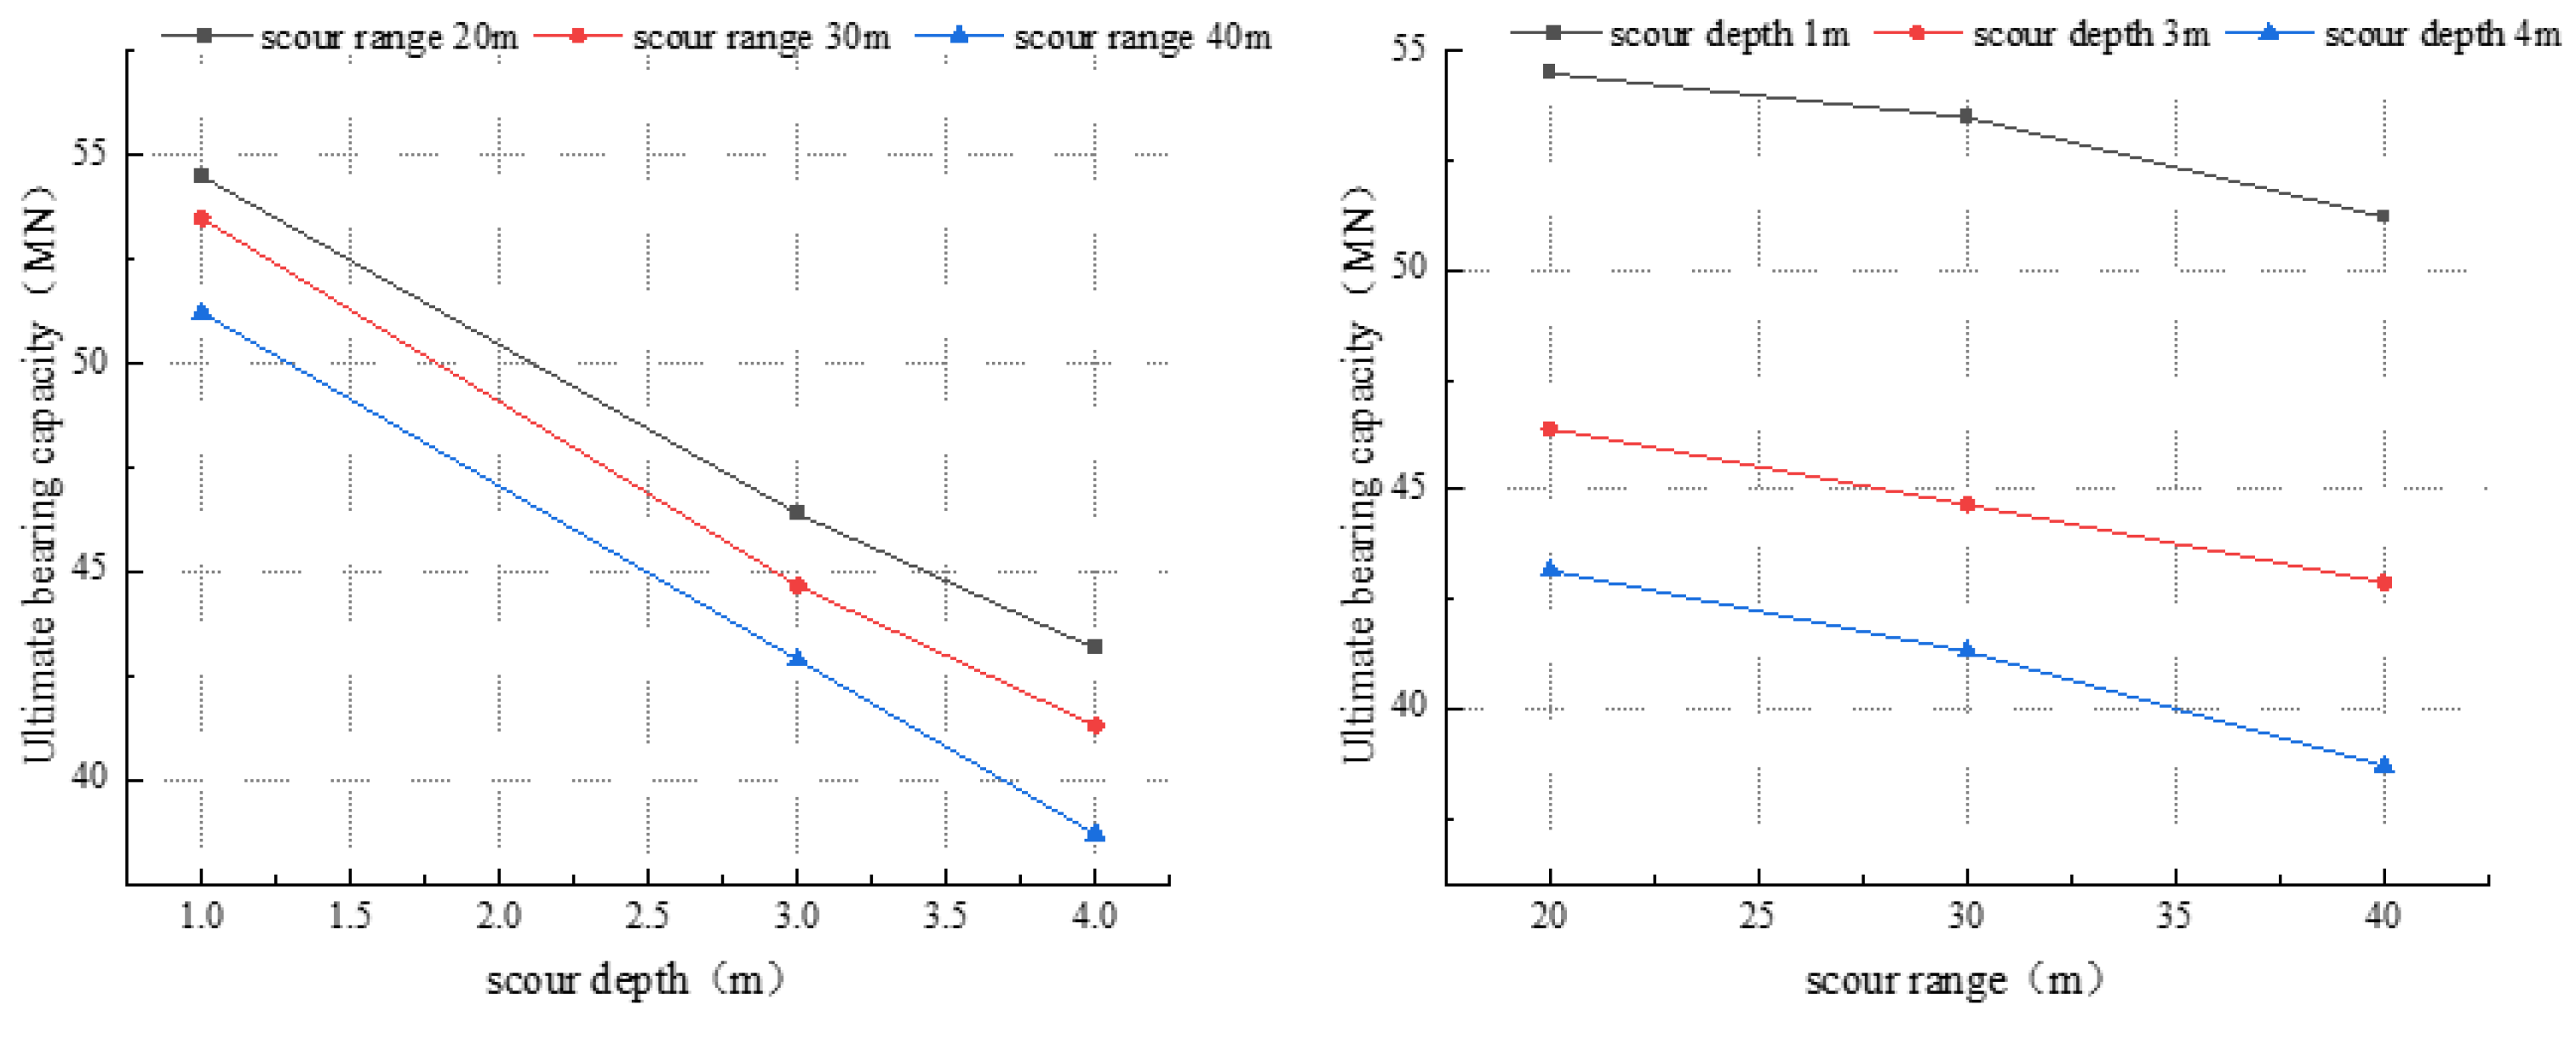
Figure 37 demonstrates the effects of scouring parameters on ultimate bearing capacity. Increased scouring depth and scour range both reduce capacity, with scouring depth exhibiting a more pronounced impact. When scouring depth increases from 1 m to 4 m, ultimate bearing capacity decreases by approximately 20–25%: at a 20-m scour range, capacity drops 21.8% from 55 MN to 43 MN; at 30 m, it decreases 22.6% from 53 MN to 41 MN; and at 40 m, it declines 23.5% from 51 MN to 39 MN. Expanding the scour range from 20 m to 40 m reduces capacity by 5–10%: at a 1-m scouring depth, capacity decreases 7.3% from 55 MN to 51 MN; at 3 m, it falls 6.5% from 46 MN to 43 MN; and at 4 m, it reduces 9.3% from 43 MN to 39 MN.

5. Conclusions and Limitations

This study presents a novel investigation into the scour characteristics and bearing capacity response of the innovative MGB hybrid foundation through an integrated CFD-DEM and FEA numerical framework. The key findings are as follows:
Scour pits around the MGB hybrid foundation exhibit a “horseshoe-shaped structure”, with the deepest scouring occurring at the 45° direction. The scouring process follows a three-stage evolution (“rapid development–deceleration–equilibrium”), and scouring depth increases nonlinearly with flow velocity. Larger bucket diameters and variations in depths exacerbate scouring intensity, though smaller diameters result in sustained low-intensity scouring. Across all operating conditions, scouring profiles share similar morphological characteristics, indicating consistent underlying scouring mechanisms.
The foundation bearing characteristics of the MGB hybrid foundation are jointly influenced by scouring depth and range. When the scouring depth increases from 1 m to 4 m, the ultimate bearing capacity decreases by approximately 20–25%; expanding the scour range from 20 m to 40 m reduces the bearing capacity by about 5–10%. Scouring impacts structural performance by reducing effective embedment depth, increasing bending moments, and altering soil pressure distribution. In engineering design and safety assessments, scouring depth and scour pit range must be comprehensively considered.
Based on the findings of this study, key engineering recommendations for the design and installation of MGB foundations can be made. Firstly, scour protection measures should be prioritized to mitigate the significant reduction in bearing capacity, with a particular focus on preventing deep, localized scour at the foundation’s upstream face, as scour depth was identified as the most critical parameter. Secondly, the ‘gentle slope–flat bottom’ scour morphology identified herein provides a predictable template for designing the extent of scour protection systems. Finally, the relationship between increased bucket diameter and reduced scour depth suggests that optimizing the foundation’s footprint can be an effective integrated scour mitigation strategy, potentially reducing the dependency on external protection measures.
This study acknowledges certain limitations. The scour analysis was conducted under unidirectional steady current conditions, which simplifies the complex hydraulic loading (e.g., combined waves-currents, tidal currents) prevalent in real offshore environments that may alter scour development and morphology. Furthermore, the gravel-filled gravity wheel was simplified as a solid boundary, which may not fully capture complex fluid–gravel interactions. These simplifications provide a foundational understanding, and future work should involve experimental validation and extend to more complex wave-current scenarios.

Author Contributions

Conceptualization, X.L.; Methodology, X.L. and C.W.; Data curation, X.L. and B.Z.; Writing—original draft, X.L.; Writing—review & editing, C.W.; Visualization, B.Z.; Supervision, C.W.; Project administration, C.W. All authors have read and agreed to the published version of the manuscript.

Funding

This work was supported by the Fundamental Research Funds for the Central Universities, China (Grant No. 22120240346).

Data Availability Statement

Data available on request due to restrictions.

Conflicts of Interest

The authors declare no conflict of interest.

References

  1. Gonzalez-Rodriguez, A.G. Review of Offshore Wind Farm Cost Components. Energy Sustain. Dev. 2017, 37, 10–19. [Google Scholar] [CrossRef]
  2. Jensen, K.S.; Petersen, S.J.; Pedersen, R.R. European Offshore Wind Engineering—Past, Present and Future. Proc. Inst. Civ. Eng.-Civ. Eng. 2018, 171, 159–165. [Google Scholar] [CrossRef]
  3. Wu, X.; Hu, Y.; Li, Y.; Yang, J.; Duan, L.; Wang, T.; Adcock, T.; Jiang, Z.; Gao, Z.; Lin, Z.; et al. Foundations of Offshore Wind Turbines: A Review. Renew. Sustain. Energy Rev. 2019, 104, 379–393. [Google Scholar] [CrossRef]
  4. Guo, Y.; Wang, H.; Lian, J. Review of Integrated Installation Technologies for Offshore Wind Turbines: Current Progress and Future Development Trends. Energy Convers. Manag. 2022, 255, 115319. [Google Scholar] [CrossRef]
  5. Li, X.; Zeng, X.; Wang, X. Feasibility Study of Monopile-Friction Wheel-Bucket Hybrid Foundation for Offshore Wind Turbine. Ocean Eng. 2020, 204, 107276. [Google Scholar] [CrossRef]
  6. Li, X.; Zhang, M. Soil-Structure Interaction of a Laterally Loaded Hybrid Foundation for Offshore Wind Turbine. Ocean Eng. 2022, 263, 112197. [Google Scholar] [CrossRef]
  7. Li, X.; Zeng, X.; Yu, X.; Wang, X. Seismic Response of a Novel Hybrid Foundation for Offshore Wind Turbine by Geotechnical Centrifuge Modeling. Renew. Energy 2021, 172, 1404–1416. [Google Scholar] [CrossRef]
  8. Wang, X.; Li, S.; Li, J. Lateral Response and Installation Recommendation of Hybrid Monopile Foundation for Offshore Wind Turbines under Combined Loadings. Ocean Eng. 2022, 257, 111637. [Google Scholar] [CrossRef]
  9. Zou, X.; Jiang, Y.; Wang, Y. Failure Mechanism of Single Pile-Friction Footing Hybrid Foundation under Combined V–H–M Loadings by PIV Experiments and FE Method. Ocean Eng. 2023, 280, 114461. [Google Scholar] [CrossRef]
  10. Qin, B.; Qu, R.; Yang, W.; Xie, Y. A Study on the Scour Surrounding the Fixed Foundation of an Offshore Wind Turbine under Complex Waves, Tidal Currents, and Pile Vibration Conditions. Energies 2024, 17, 1561. [Google Scholar] [CrossRef]
  11. Qin, B.; Xie, Y.; Yang, W.; Qu, R.; Geng, F. A Further Study on the Scour around the Monopile Foundation of Offshore Wind Turbines. Sustain. Energy Technol. Assess. 2023, 57, 103198. [Google Scholar] [CrossRef]
  12. Tang, Z.; Melville, B.; Shamseldin, A.; Guan, D.; Singhal, N.; Yao, Z. Experimental Study of Collar Protection for Local Scour Reduction around Offshore Wind Turbine Monopile Foundations. Coast. Eng. 2023, 183, 104324. [Google Scholar] [CrossRef]
  13. Wang, G.; Xu, S.; Zhang, Q.; Zhang, J. An Experimental Study of the Local Scour Protection Methods around the Monopile Foundation of Offshore Wind Turbines. Ocean Eng. 2023, 273, 113957. [Google Scholar] [CrossRef]
  14. Li, J.; Lian, J.; Guo, Y.; Dong, X.; Gao, Y. Experimental Study on Current-Induced Local Scour and Pre-Embedded Protective Measures of Multi-Bucket Jacket Foundation for Offshore Wind Turbines. Coast. Eng. 2025, 198, 104703. [Google Scholar] [CrossRef]
  15. Chen, H.; Zhang, J.; Hou, D.; Guo, Y. On the Local Scour around a Jacket Foundation under Bidirectional Flow Loading. Ocean Eng. 2024, 310, 118772. [Google Scholar] [CrossRef]
  16. Ji, C.; Zhang, J.; Zhang, Q.; Li, M.; Chen, T. Experimental Investigation of Local Scour Around A New Pile-Group Foundation for Offshore Wind Turbines in Bi-Directional Current. China Ocean Eng. 2018, 32, 737–745. [Google Scholar] [CrossRef]
  17. Mayall, R.O.; McAdam, R.A.; Whitehouse, R.J.S.; Burd, H.J.; Byrne, B.W.; Heald, S.G.; Sheil, B.B.; Slater, P.L. Flume Tank Testing of Offshore Wind Turbine Dynamics with Foundation Scour and Scour Protection. J. Waterw. Port Coast. Ocean Eng. 2020, 146, 04020033. [Google Scholar] [CrossRef]
  18. Barrie, A.; Wang, C.; Liang, F.; Qi, W. Experimental Investigation on the Mechanism of Local Scour around a Cylindrical Coastal Pile Foundation Considering Sloping Bed Conditions. Ocean Eng. 2024, 312, 119225. [Google Scholar] [CrossRef]
  19. Wang, C.; Wu, Q.; Liang, J.; Liang, F.; Yu, X.B. Establishment and Implementation of an Artificial Intelligent Flume for Investigating Local Scour around Underwater Foundations. Transp. Geotech. 2024, 49, 101433. [Google Scholar] [CrossRef]
  20. Kim, Y.-J.; Ngo, D.-V.; Lee, J.-H.; Kim, D.-H. Ultimate Limit State Scour Risk Assessment of a Pentapod Suction Bucket Support Structure for Offshore Wind Turbine. Energies 2022, 15, 2056. [Google Scholar] [CrossRef]
  21. Ma, H.; Chen, C. Scour Protection Assessment of Monopile Foundation Design for Offshore Wind Turbines. Ocean Eng. 2021, 231, 109083. [Google Scholar] [CrossRef]
  22. Menéndez-Vicente, C.; López-Querol, S.; Harris, J.M.; Tavouktsoglou, N.S. Numerical Study on the Stiffening Properties of Scour Protection around Monopiles for Offshore Wind Turbines. Eng. Geol. 2025, 345, 107835. [Google Scholar] [CrossRef]
  23. Menéndez-Vicente, C.; López-Querol, S.; Bhattacharya, S.; Simons, R. Numerical Study on the Effects of Scour on Monopile Foundations for Offshore Wind Turbines: The Case of Robin Rigg Wind Farm. Soil Dyn. Earthq. Eng. 2023, 167, 107803. [Google Scholar] [CrossRef]
  24. Li, J.; Guo, Y.; Lian, J.; Wang, H. Scour Effects on the Bearing Capacity of Multi-Bucket Jacket Foundation for Offshore Wind Turbines. Ocean Eng. 2022, 259, 111848. [Google Scholar] [CrossRef]
  25. Zhao, X.; Zhang, P.; Lv, Y.; Ding, H. Scour Effects on Bearing Capacity of Composite Bucket Foundation for Offshore Wind Turbines. Mar. Georesour. Geotechnol. 2020, 38, 223–237. [Google Scholar] [CrossRef]
  26. Ma, H.; Yang, J.; Chen, L. Effect of Scour on the Structural Response of an Offshore Wind Turbine Supported on Tripod Foundation. Appl. Ocean Res. 2018, 73, 179–189. [Google Scholar] [CrossRef]
  27. Jiang, W.; Lin, C.; Sun, M. Seismic Responses of Monopile-Supported Offshore Wind Turbines in Soft Clays under Scoured Conditions. Soil Dyn. Earthq. Eng. 2021, 142, 106549. [Google Scholar] [CrossRef]
  28. Al-Hammadi, M.; Simons, R.R. Local Scour Mechanism around Dynamically Active Marine Structures in Noncohesive Sediments and Unidirectional Current. J. Waterw. Port Coast. Ocean Eng. 2020, 146, 04019026. [Google Scholar] [CrossRef]
  29. Li, D.; Zheng, Z.; Hu, Z.; Ma, H. Microscopic Investigation of Shape Effect on Local Scour around the Monopile Using CFD-DEM. Comput. Geotech. 2025, 177, 106872. [Google Scholar] [CrossRef]
  30. Ma, H.; Zhang, S.; Li, B. Numerical Investigation of Local Scour around Twin Piles under Steady Current Using CFD-DEM Coupling Method. Comput. Geotech. 2023, 164, 105805. [Google Scholar] [CrossRef]
  31. Zhang, N.; Yu, B.; Yin, S.; Guo, C.; Zhang, J.; Kong, F.; Zhai, W.; Qiu, G. Numerical Investigation of Local Scour Protection around the Foundation of an Offshore Wind Turbine. J. Mar. Sci. Eng. 2024, 12, 692. [Google Scholar] [CrossRef]
  32. Hu, R.; Lu, Y.; Zhao, Z.; Leng, H.; Liu, H. Local Scour Characteristics around Offshore Wind-Turbine Foundations under Nonlinear Waves and Currents. IOP Conf. Ser. Earth Environ. Sci. 2021, 861, 032084. [Google Scholar] [CrossRef]
  33. Zou, X.; Cao, X.; Zhou, C.; Zhou, M.; Zhang, X. Experimental Study on the Bearing Capacity of Large-Diameter Monopile in Sand under Water Flow Condition. Ocean Eng. 2021, 224, 108708. [Google Scholar] [CrossRef]
  34. Zou, X.; Chen, S.; Tu, X.; Yang, Z. Effects of Local Scouring on Load-Bearing Behaviors of Monopile–Friction Wheel Hybrid Foundations on Sandy Deposit Soil under Lateral Loading. Int. J. Geomech. 2024, 24, 04024085. [Google Scholar] [CrossRef]
  35. Cho, Y.-J. Scour Controlling Effect of Hybrid Mono-Pile as a Substructure of Offshore Wind Turbine: A Numerical Study. J. Mar. Sci. Eng. 2020, 8, 637. [Google Scholar] [CrossRef]
  36. Xu, Y. Experimental Investigation of Scour Around Vertical Piles in Steady Currents; Dalian University of Technology: Dalian, China, 2018. [Google Scholar]
  37. Wang, D.; Wang, Y.; Yang, B.; Zhang, W.; Lancaster, N. Statistical Analysis of Sand Grain/Bed Collision Process Recorded by High-Speed Digital Camera. Sedimentology 2008, 55, 461–470. [Google Scholar] [CrossRef]
  38. Zhao, M.; Cheng, L.; Zang, Z. Experimental and Numerical Investigation of Local Scour around a Submerged Vertical Circular Cylinder in Steady Currents. Coast. Eng. 2010, 57, 709–721. [Google Scholar] [CrossRef]
Figure 1. Geometry of the validating model (overall model setup on the left and the sediment around pile on the right).
Jmse 13 01726 g001
Figure 2. Top and side view of the mesh of the CFD model with different mesh sizes.
Jmse 13 01726 g002
Figure 3. Three-dimensional morphology of the scour pit around the monopile at equilibrium state from the CFD-DEM simulation.
Jmse 13 01726 g003
Figure 4. Cross-sectional view of the scour pit in front of the upstream side of the monopile.
Jmse 13 01726 g004
Figure 5. Velocity distribution along water depth at different measurement points in front of the monopile.
Jmse 13 01726 g005
Figure 6. Slope angle of the scour pit in front of the pile.
Jmse 13 01726 g006
Figure 7. Time history of scouring depth of different mesh size.
Jmse 13 01726 g007
Figure 8. Conceptual diagram of the MGB hybrid foundation [5].
Jmse 13 01726 g008
Figure 9. Geometric model of MGB hybrid foundation and its main parameters.
Jmse 13 01726 g009
Figure 10. Top view of the CFD mesh of the MGB foundation model.
Jmse 13 01726 g010
Figure 11. Three-dimensional model of scour pit at the equilibrium stage of the MGB hybrid foundation.
Jmse 13 01726 g011
Figure 12. Top view of scour pit morphological evolution process at different simulation time.
Jmse 13 01726 g012
Figure 13. Cross-section view of the scour pit in front of the bucket of the MGB hybrid foundation at different simulation time.
Jmse 13 01726 g013
Figure 14. Schematic diagram of selection of locations of cross-section.
Jmse 13 01726 g014
Figure 15. Development of maximum scouring depth at different locations around the bucket at different simulation time steps.
Jmse 13 01726 g015
Figure 16. Scouring depths at different cross-section locations.
Jmse 13 01726 g016
Figure 17. Top view of scour pit profile shapes at different flow velocities.
Jmse 13 01726 g017
Figure 18. Cross-section view of scour pit morphology in front of the bucket skirt at different flow velocities.
Jmse 13 01726 g018
Figure 19. Top view of scour pit profile shapes at different bucket diameters.
Jmse 13 01726 g019
Figure 20. Cross-section view of scour pit morphology in front of the bucket skirt at different bucket diameters.
Jmse 13 01726 g020
Figure 21. Top view of scour pit horizontal profile at different bucket heights.
Jmse 13 01726 g021
Figure 22. Cross-section view of scour pit morphology in front of the bucket skirt at different bucket heights.
Jmse 13 01726 g022
Figure 23. Comparison of scouring depth development and scour pit size at different flow velocities.
Jmse 13 01726 g023
Figure 24. Comparison of scouring depth development and scour pit size at different bucket diameters.
Jmse 13 01726 g024
Figure 25. Comparison of scouring depth development and scour pit size with different bucket heights.
Jmse 13 01726 g025
Figure 26. Comparison of particle average velocity and average drag force development at different flow velocities.
Jmse 13 01726 g026
Figure 27. Comparison of particle average velocity development and average drag force at different bucket diameters.
Jmse 13 01726 g027
Figure 28. Comparison of particle average velocity development and average drag force at different bucket heights.
Jmse 13 01726 g028
Figure 29. Domain of the FE model of the MGB hybrid foundation with an idealized scour pit.
Jmse 13 01726 g029
Figure 30. Geometry parameters of the idealized scour pit.
Jmse 13 01726 g030
Figure 31. Front view of the FE mesh of the MGB hybrid foundation with scour pit.
Jmse 13 01726 g031
Figure 32. Top view of the FE mesh of the MGB hybrid foundation with scour pit.
Jmse 13 01726 g032
Figure 33. Horizontal displacement cloud diagrams in different cases.
Jmse 13 01726 g033
Figure 34. Structural stress nephogram for different cases.
Jmse 13 01726 g034
Figure 35. Soil stress nephogram for different cases.
Jmse 13 01726 g035
Figure 36. Lateral load–displacement curves under different scouring conditions.
Jmse 13 01726 g036
Figure 37. Influence of scour pit parameters on ultimate bearing capacity.
Jmse 13 01726 g037
Table 1. DEM model parameters.
Parameter NameParameter Value
Particle diameter d (mm)5
Poisson’s ratio v0.35
Density ρp (kg/m3)2670
Shear modulus G (Pa)5 × 10⁶
Coefficient of restitution e0.45
Static friction coefficient μs0.65
Rolling friction coefficient μr0.01
Time step (s)5 × 10⁻⁵
Data saving interval (s)0.05
Table 2. CFD model parameters.
Parameter NameParameter Value
Flow velocity (m/s)1.6
Outlet relative pressure (Pa)0
Fluid density ρf (kg/m3)1000
Dynamic viscosity ν (Pa·s)1 × 10⁻³
Absolute convergence residual1 × 10−3
Maximum iteration steps500
Time step (s)5 × 10⁻³
Total simulation steps10,000
Table 3. Parameters comparison of the physical experiment and numerical model.
ParameterVID3 ExperimentCFD-DEM
Pile diameter D (m)0.10.1
Flow velocity V (m/s)0.2861.6
Water depth h (m)0.40.4
Median sediment diameter d50 (mm)0.295
Shields number θ0.0360.050
Critical Shields number θcr0.0380.053
Dimensionless θ/θcr0.9550.955
Table 4. Comparison of dimensionless calibration coefficients for different pile diameters.
ParameterD = 0.05D = 0.10D = 0.15
Inflow velocity V1 (m/s)1.51.61.8
Flow velocity V (m/s)1.0728476791.1613065091.230174593
Calibration coefficient C11.3049382761.3777585741.463206938
Calibration coefficient C21.1413273181.2354324571.308696376
Table 5. Parameters of different scouring cases.
Simulation CasesMonopile Diameter Dp/(m)Bucket Diameter Db/(m)Gravity Wheel Height Hg/(m)Bucket Height Hb/(m)Flow Velocity V/(m/s)Water Depth h (m)
10.050.250.050.051.60.4
20.050.250.050.051.20.4
30.050.250.050.051.40.4
40.050.250.050.051.80.4
50.050.250.050.052.00.4
60.050. 150.050.051.60.4
70.050.350.050.051.60.4
80.050.250.050.031.60.4
90.050.250.050.071.60.4
Table 6. Scouring parameters of different simulation cases.
Simulation CasesH1 (m)H2 (m)H3 (m)
11202.5
21302.5
31402.5
43202.5
53302.5
63402.5
74202.5
84302.5
94402.5
Disclaimer/Publisher’s Note: The statements, opinions and data contained in all publications are solely those of the individual author(s) and contributor(s) and not of MDPI and/or the editor(s). MDPI and/or the editor(s) disclaim responsibility for any injury to people or property resulting from any ideas, methods, instructions or products referred to in the content.