Article

Numerical Investigation on Erosion Characteristics of Archimedes Spiral Hydrokinetic Turbine

1
School of Mechanical and Electrical Engineering, Kunming University, Kunming 650214, China
2
School of Mechano-Electronic Engineering, Xidian University, Xi’an 710071, China
3
Green Ecological Water Conservancy and Electric Power Engineering Research Center, Yunnan Water Resources and Hydropower Vocational College, Kunming 650499, China
*
Author to whom correspondence should be addressed.
J. Mar. Sci. Eng. 2025, 13(9), 1707; https://doi.org/10.3390/jmse13091707
Submission received: 6 August 2025 / Revised: 30 August 2025 / Accepted: 2 September 2025 / Published: 4 September 2025
(This article belongs to the Topic Marine Renewable Energy, 2nd Edition)

Abstract

The Archimedes spiral hydrokinetic turbine (ASHT), an innovative horizontal-axis design, holds significant potential for harvesting energy from localized ocean and river currents. However, prolonged operation can result in blade erosion, which reduces efficiency and may lead to operational failures. To ensure reliability and prevent damage, it is essential to accurately identify the locations and progression of wear caused by sand particle impacts. Using a CFD–DPM approach, this study systematically investigates the effects of sand concentration and particle size on erosion rates and distribution across nine ASHT configurations, along with the underlying physical mechanisms. The results indicate that erosion rate increases linearly with sand concentration due to higher particle impact frequency. Erosion zones expand from the blade tip edges toward mid-span regions and areas near the hub as concentration increases. Regarding particle size, the erosion rate increases rapidly and almost linearly for diameters below 0.6 mm, but this growth slows for larger particles due to a “momentum–quantity trade-off” effect. Blade angle also exerts a tiered influence on erosion, following the pattern medium angles > small angles > large angles. Medium angles enhance the synergy between normal and tangential impact components, maximizing erosion. Erosion primarily initiates at the blade tips and edges, with the most severe wear concentrated in these high-impact zones. The derived erosion patterns provide valuable guidance for predicting erosion, optimizing ASHT blade design, and developing effective anti-erosion strategies.

1. Introduction

In recent years, the integration of renewable energy has become essential to advancing industrial development. Among renewable sources, ocean current energy stands out due to its abundance, economic feasibility, renewability, and zero-emission nature, making it a promising alternative to conventional petroleum and coal-based energy [1,2]. Moreover, it has facilitated the expansion of offshore platform deployments, extending operations from coastal zones into deeper oceanic regions [3]. Efforts to reduce ocean observation costs and enhance deployment efficiency have also increased interest in harnessing local ocean current energy for a variety of platforms. Hydrokinetic turbines are especially effective in powering multi-purpose installations, supporting applications such as marine resource exploration, hydrocarbon extraction, surveillance, navigation, and infrastructure development [4]. However, a major challenge remains: high-velocity currents are rare across the vast ocean, making it difficult to capture energy effectively in areas with slow-moving water.
A key factor in designing power systems for offshore platforms is the turbine’s ability to self-start under low current conditions. While several lift-based hydrokinetic technologies—particularly mainstream horizontal-axis (HAHTs) and some vertical-axis (VAHTs) turbines—have reached commercial deployment [5,6], these designs perform best in shallow, high-current areas. They often struggle to self-start when flow is too weak to produce sufficient torque [7], limiting their suitability for many offshore sites. Therefore, a critical operational requirement for offshore power supply is the development of turbines that can initiate autonomously and maintain efficient energy conversion in low-velocity environments [8].
A recent development in this field is the Archimedes spiral hydrodynamic turbine (ASHT), which was specifically designed to address the challenges associated with low-velocity ocean currents [9]. The ASHT operates primarily by harnessing hydrodynamic drag for power generation, placing it within the category of drag-driven turbines. This fundamental operating principle enables stable performance even under very low flow velocities, making it especially suitable for energy extraction in offshore regions with limited current resources.
To date, research on ASHTs has largely focused on their flow field characteristics and energy conversion capabilities. For instance, Suntivarakorn et al. [10] demonstrated that the ASHT exhibits significantly improved power generation under low-flow conditions, outperforming conventional horizontal-axis hydrodynamic turbines (HAHTs). Monatrakul et al. [11] used numerical modeling and CFD simulations to analyze the effect of blade angles on efficiency, showing that adding a collection chamber could further enhance performance. Song and Kang [12] simulated fluid–structure interaction in the ASHT and identified the blade root as the region of highest stress concentration. In a comparative performance study, Monatrakul et al. [13] found that the Archimedean spiral turbine maintains stable energy conversion within flow velocities of 1–2 m/s, whereas standard three-bladed horizontal-axis turbines require stronger currents to reach optimum operation. Zhang et al. [14] evaluated flow blockage effects and compared several compensation methods to improve measurement accuracy, providing valuable insights for future experimental designs. Badawy et al. [15] systematically studied the effect of blade airfoil shape on the energy conversion efficiency of ASHTs through numerical simulations. More recently, Zhang et al. [16] experimentally evaluated ASHT performance under yawed inflow conditions and proposed optimization strategies that increased efficiency enough to power environmental sensors. Additionally, previous work by our research group has yielded three notable findings: First, a ducted variant of the ASHT (DASHT) was shown to exceed the power coefficient of the standard design by 122%, while also improving hydrodynamic performance and system efficiency [17]. Second, entropy-based analysis was used to quantify energy losses during both axial and yawed operations [18]. Third, the attachment of winglets was identified as a potential means of enhancing turbine performance through hydrodynamic refinement [19].
While previous studies have enhanced our understanding of ASHTs, it should be noted that ocean currents near the seabed often transport significant amounts of sediment [20]. As critical energy conversion components in applications such as offshore platforms and Autonomous Underwater Vehicle (AUV) power stations, ASHTs operating in these environments are highly susceptible to sediment erosion, as illustrated in Figure 1. This form of erosion not only reduces turbine performance [21] but also accelerates maintenance requirements and shortens service life [22]. The process is influenced by multiple factors [23,24], and variations in particle size and concentration across different marine regions [25] further contribute to divergent erosion behaviors. Therefore, it is critical to investigate how these parameters influence blade erosion, as this will inform the refinement of blade design and site selection strategies—and in turn, extend operational lifespan. For horizontal axis turbines, at the current stage, most of the literature primarily focuses on the erosion characteristics of wind turbines. For example, Sareen et al. [26] demonstrated that particle size significantly affects both the location and intensity of erosion, whereas particle concentration exerts only a minimal influence on erosion distribution. Additionally, a decrease in particle sphericity increases the critical Stokes number needed to initiate erosion. In a numerical study, Wang et al. [27] found that increased wind speeds amplify wear rates, with the most severe degradation taking place near the blade tips. Using computational and analytical methods, Eisenberg et al. [28] documented real-world coating erosion phenomena, observing that finer particles result in slower material loss and that erosion is less pronounced at the trailing edges than at the leading edges. Herring et al. [29] elucidated the erosion mechanisms affecting protective coatings, noting that the leading edges are primarily subjected to normal impingement, while the blade tips are exposed to both tangential abrasion and normal impact. Despite these findings, research into the erosion behavior of tidal turbine blades operating in multiphase flows remains relatively limited.
Moreover, to the best of our knowledge, no studies to date have investigated erosion in ASHTs. A detailed understanding of how these parameters influence erosion mechanisms is crucial, as it can inform optimized design and site selection strategies, thereby significantly extending blade service life. This research systematically examines the erosion behavior of ASHTs under various sand particle sizes and concentrations, elucidates the underlying mechanisms, and characterizes erosion patterns across different blade angles. The results offer a theoretical foundation for designing erosion-resistant ASHTs and ensuring their long-term operational stability.

2. Mathematical Model

For liquid phase model, the computational methodology employed Reynolds-Averaged Navier–Stokes (RANS) formulations, with the fundamental conservation equations expressed below:
u ¯ i x i = 0
ρ u ¯ i t + u j u ¯ i x j = p ¯ x i + μ x j u ¯ i x j + u ¯ j x i + τ i j x j
τ i j = ρ u i u j ¯
ρ u i u j ¯ = μ t u ¯ i x j + u ¯ j x i 2 3 μ t u ¯ k x k δ i j 2 3 ρ k δ i j
in these formulations: u ¯ indicates the mean velocity component (m/s) over time, t corresponds to temporal duration (s), ρ signifies the mass per unit volume (kg/m3) of the fluid medium, P ¯ stands for the mean pressure field (Pa), μ represents the Newtonian viscosity coefficient (N·s/m2), while μt characterizes turbulent viscosity (N·s/m2). The term τij corresponds to the turbulent stress tensor components (Pa), and δij signifies the Kronecker delta operator. The coordinate indices (i, j, k) reference the orthogonal axes in three-dimensional space.
In the discrete phase modeling framework, particle trajectory calculations are derived from fundamental Newtonian mechanics, with the governing kinematic relationships expressed below [30]:
d V P d t = ρ P ρ f g ρ P + F D + F LS + F P + F add + F c
In these formulations, VP denotes the velocity magnitude of individual particles while ρP corresponds to their material density. The various force components include FD (fluid resistance force), FP (supplementary applied force), Fadd (apparent mass effect), FLS (transverse fluid dynamic force), and Fc (interparticle interaction force).
For modeling surface deterioration, the numerical analysis adopts the Mclaury algorithm [31], specifically developed for water erosion prediction. The governing relationship for erosion intensity E is presented subsequently:
E = A V n f β
In this formulation, the material-dependent constant A (1.997 × 10⁻⁷) is derived from carbon steel’s Brinell hardness measurement. The equation incorporates particle striking speed V and incorporates an experimentally determined factor n (1.73) that characterizes material response [32]. The angular dependence is accounted for through impact angle β and its associated functional relationship f(β), where
f β = 13.3 β 2 + 7.85 β ; β 15 ° 1.09 cos 2 β sin β + 0.125 sin 2 β + 1 ; β > 15 °
Momentum loss occurs when particles impinge on the wall, and this factor must be taken into account when determining the trajectory of reflected particles. The coefficient of restitution (e) is defined as the ratio of the velocity components of a particle after collision to the corresponding components before collision. In this study, the Grant-Tabakoff rebound model is employed for particle tracking calculations [33], and the expression for the coefficient of restitution is as follows:
e n = 0.993 1.76 β + 1.56 β 2 0.49 β 3
e t = 0.998 1.66 β + 2.11 β 2 0.67 β 3
where n and t denote the normal and tangential directions, respectively, while β represents the particle impact angle.
The hydrodynamic assessment of the ASHT involves two critical performance metrics: the power coefficient (CP) and tip speed ratio (TSR). CP quantifies the turbine’s energy extraction efficiency by comparing its actual power output with the theoretically available hydro power, mathematically expressed as:
C P = P 0.5 ρ A V 0 3
The tip speed ratio is defined by:
T S R = π n D 60 V 0
In this formulation, P denotes the mechanical power generation (W), while V0 corresponds to the incident flow speed (m/s). The rotational characteristics are described by n (revolutions per minute), with A representing the projected frontal area (m2) and D indicating the turbine’s characteristic dimension (m).

3. Numerical Computational Model

3.1. CFD Modeling

This study simulates the complex solid–liquid multiphase flow around ASHT and resolves the flow hydrodynamics using a Reynolds-Averaged Navier–Stokes (RANS) framework: specifically, the ANSYS Fluent 17.1 software (Ansys Inc., Canonsburg, PA, USA) is employed to solve the RANS equations via the finite-volume method for this purpose. The continuous liquid phase is modeled as an incompressible fluid, and the sand particles are treated as a discrete phase under the following simplifying assumptions: (1) the particles are spherical and non-interacting, (2) inlet particle distributions and velocities are uniform, and (3) turbine operation is steady-state. The Shear Stress Transport k-ω (SST k-ω) turbulence model [34] is employed for its well-established accuracy in capturing flow separation, adverse pressure gradients, and boundary layer behavior near rotating blades—all critical for predicting hydrodynamic performance. To handle turbine rotation within the computational domain, the Multi Reference Frame (MRF) approach is applied. Pressure–velocity coupling is resolved using the COUPLED scheme to ensure solution consistency, while convective fluxes are discretized with second-order upwind formulations. All simulations are performed using double-precision arithmetic to minimize numerical errors. Upon convergence of the flow field, discrete phase modeling (DPM) [35,36] is initiated, releasing particles at the inlet with velocities consistent with the local flow conditions.

3.2. Geometry of the ASHT

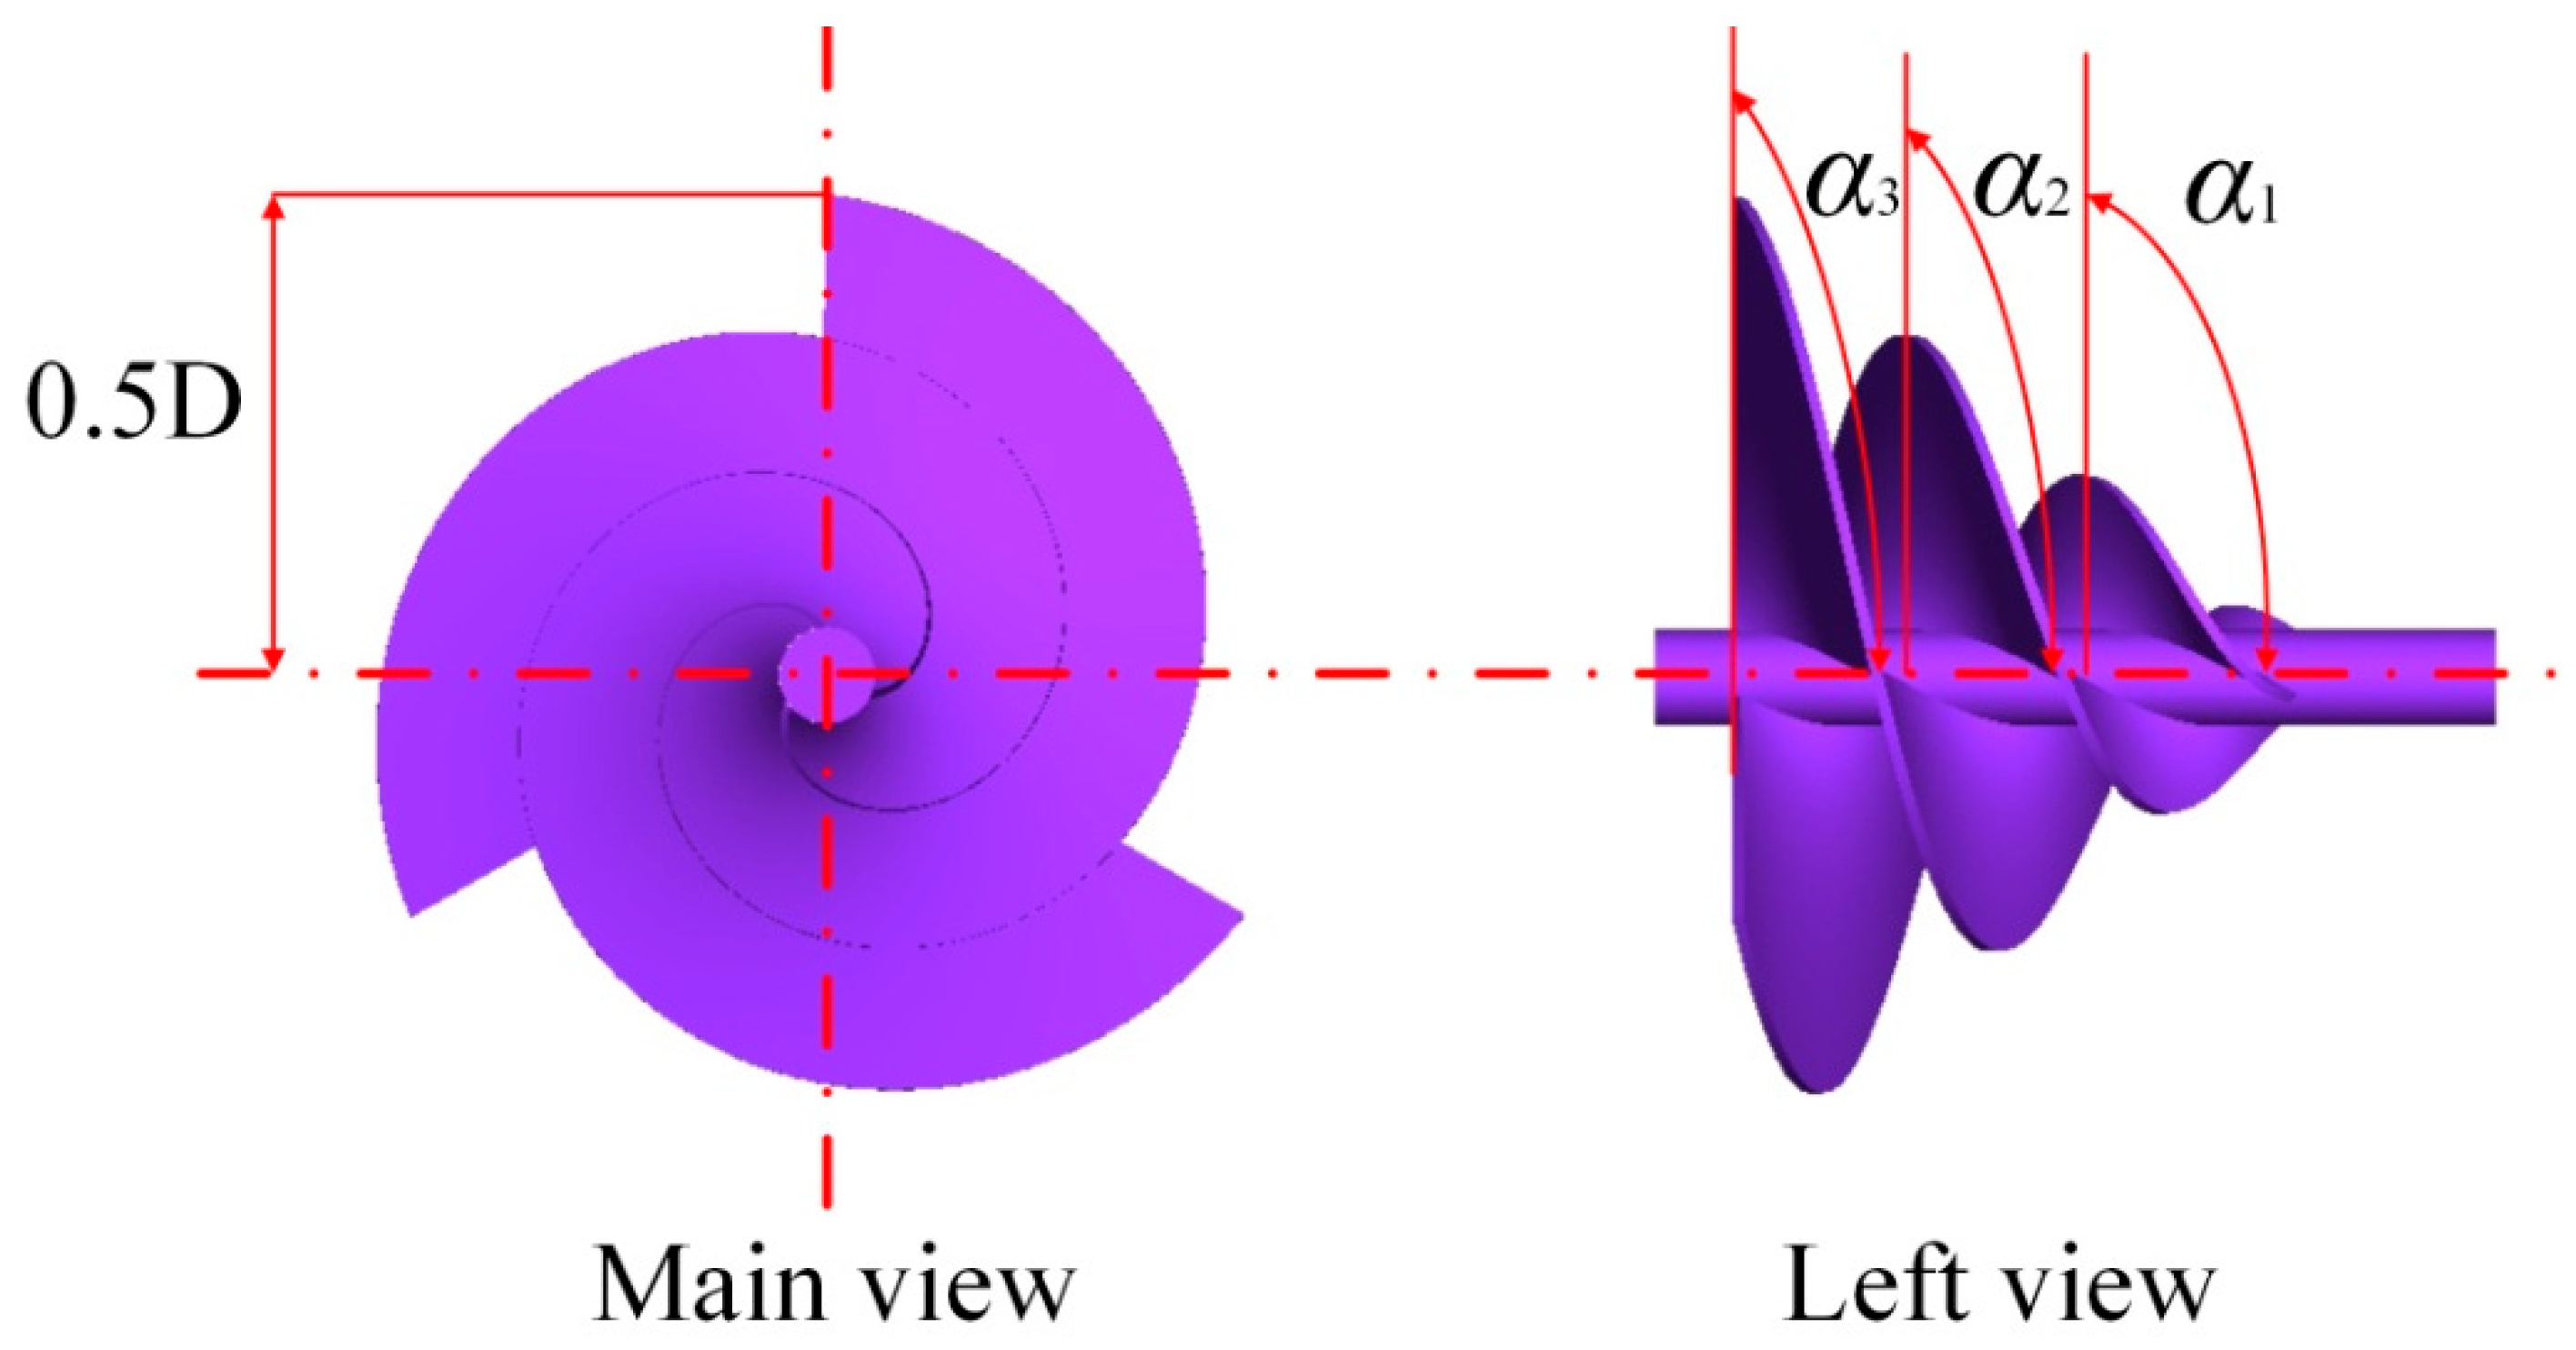
This study employs SolidWorks (2019) software to model nine distinct ASHT configurations, which are differentiated solely by blade angles; each turbine rotor comprises three blades—with a diameter of 250 mm, a thickness of 3.5 mm, an aspect ratio (L/D) of 0.88, and a fixed pitch of 70 mm—mounted on a 25 mm diameter shaft at an angular spacing of 120°. The blade angles (α1, α2, α3) for each ASHT were systematically varied, utilizing six discrete angles (15°, 30°, 45°, 60°, 75°, 90°) to generate the nine designs. A “x-x-x” triplet notation specifies the angular configuration of each ASHT (e.g., “15-30-45” denotes α1 = 15°, α2 = 30°, α3 = 45°). Based on angular distribution, the designs are categorized into two types: (1) Fixed-Angle Configuration: All blades share identical pitch angles. (2) Variable-Angle Configuration: Blade angles progressively increase from α1 to α3, shown in Figure 2 (90-90-90).

3.3. Computational Domain

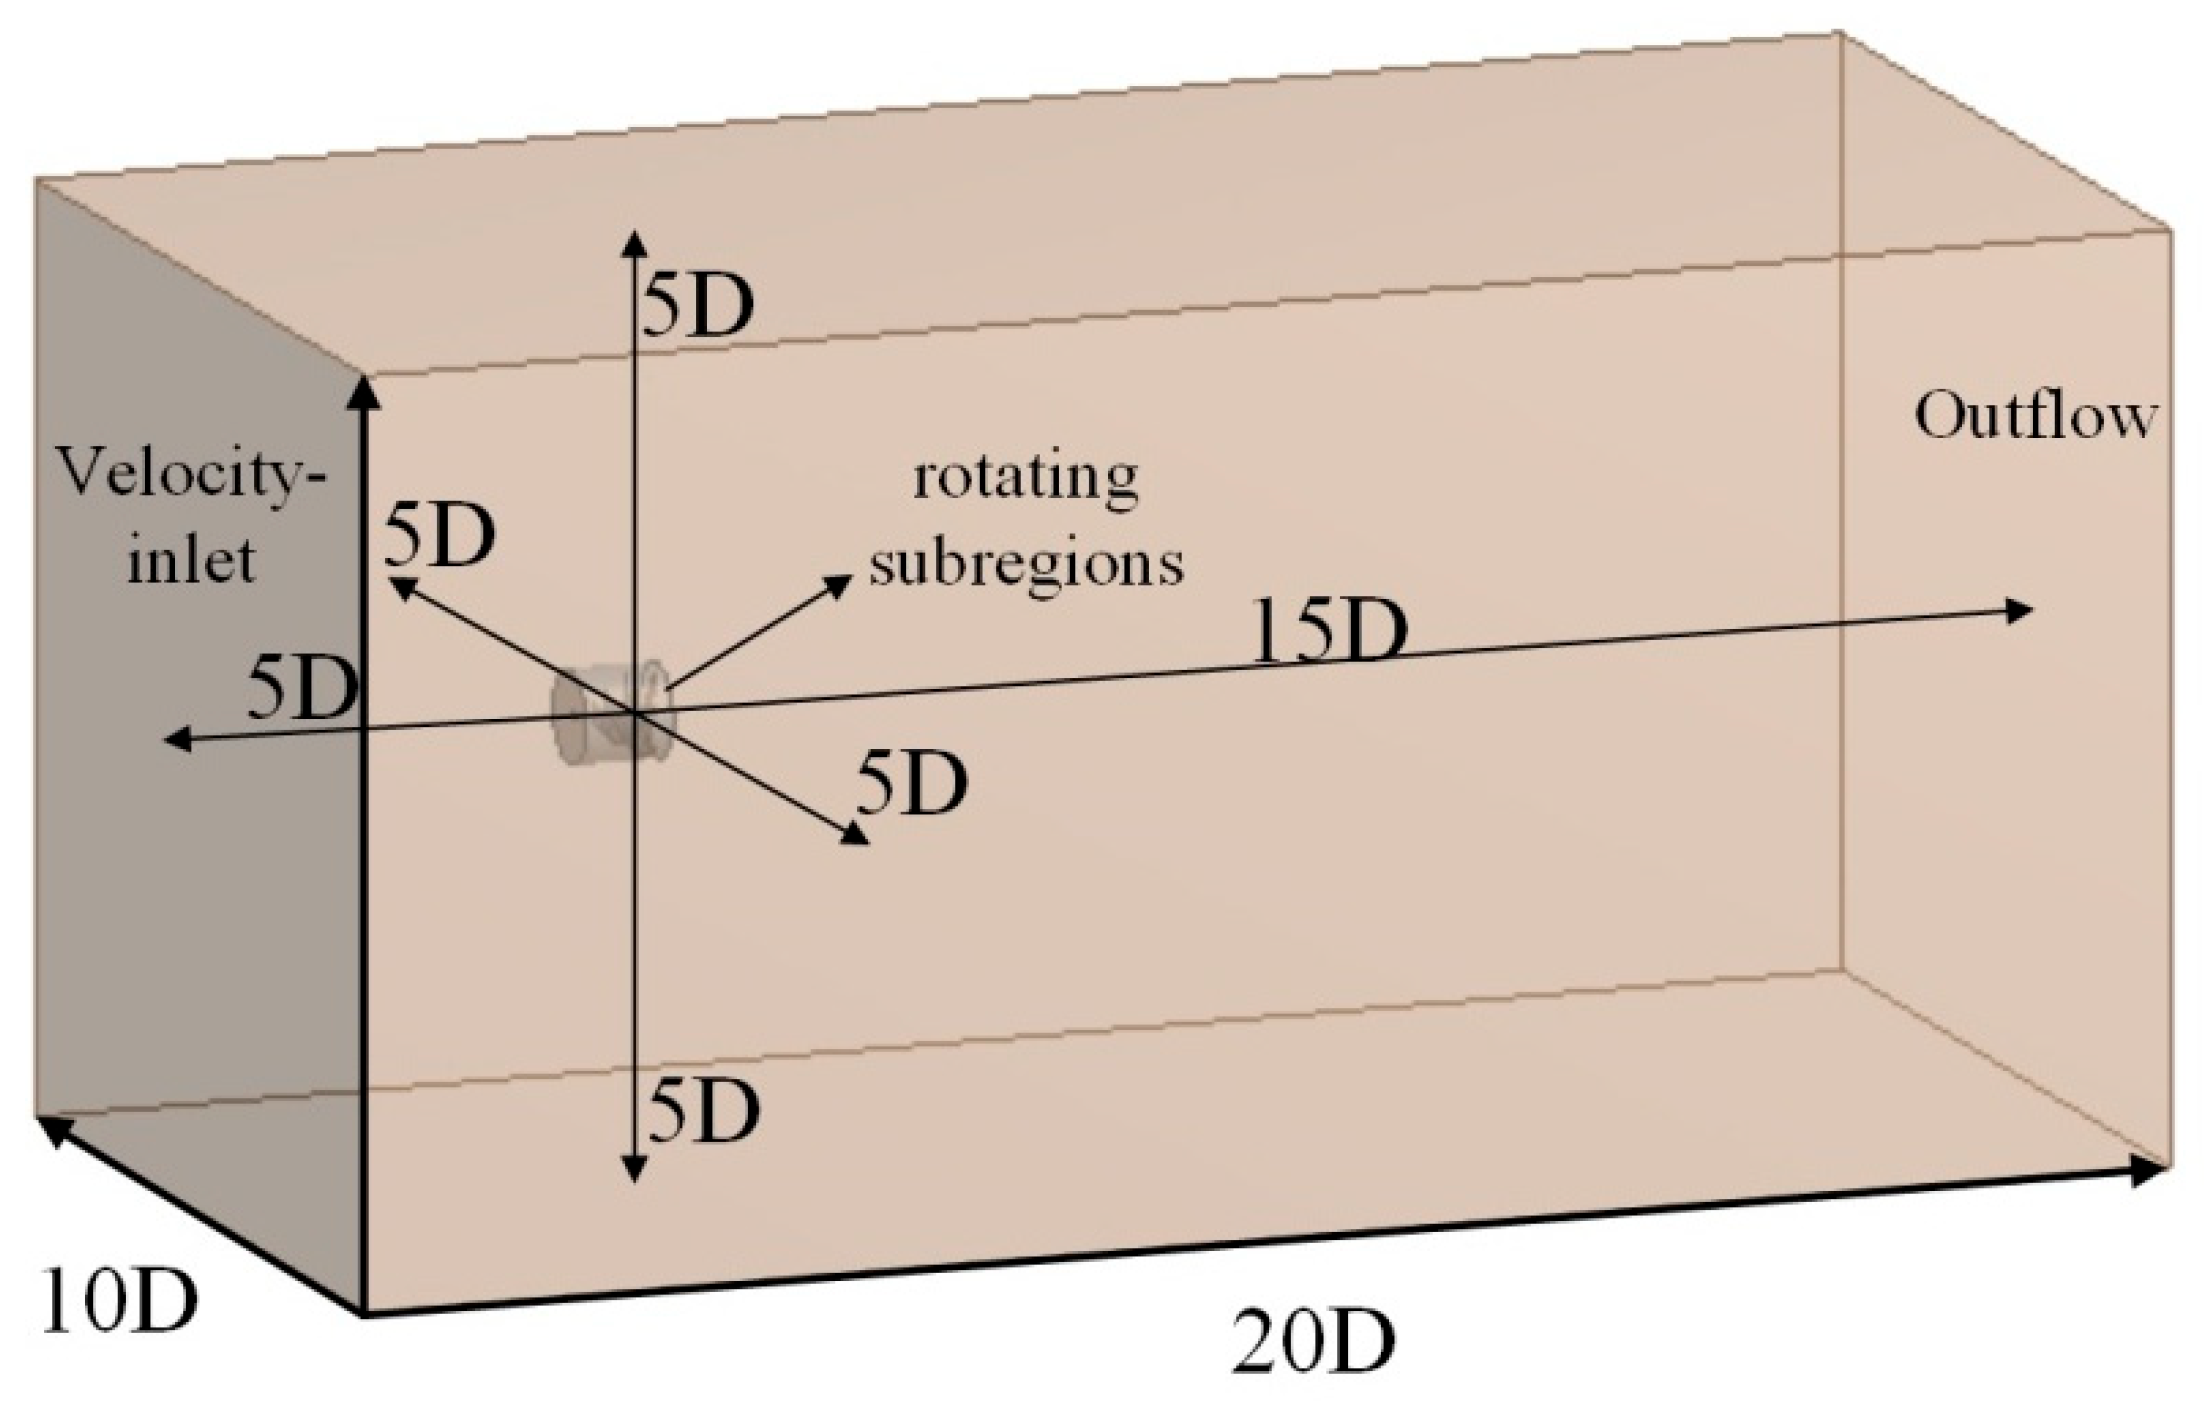
Figure 3 presents the computational domain used for the ASHT simulations. The domain is divided into stationary and rotating subregions. A cylindrical rotating subdomain facilitates relative motion at the shared interfaces, enabling fluid data exchange—essential for capturing rotor–flow interactions (in subsequent calculations, the TSR is set to 1.5). The dimensions of the rotating subdomain exceed both the shaft length and blade diameter (D) of the ASHT to minimize confinement effects. A uniform inlet velocity (V0 = 1.0 m/s) is prescribed, and an outflow condition is applied at the outlet. The turbine hub is positioned 5D downstream from the inlet and 10D upstream from the outlet, consistent with established practices to ensure adequate hydrodynamic development. Also, the distance of turbine hub from the ground is 5D. Boundary conditions are designed to reflect physical realism: no-slip conditions are imposed on all turbine surfaces, while the external boundary of the stationary domain is treated as a symmetry (free-slip) plane to enhance computational efficiency without compromising the accuracy of the flow physics. In addition, the velocity of particles at the injection surface matches that of the surrounding fluid. Relevant simulation parameters are summarized in Table 1.

3.4. Computational Mesh

The quality of the computational mesh is critical to the accuracy of simulation results, as its properties directly affect the reliability of the outcomes. While structured grids are often limited by their labor-intensive generation process, unstructured grids provide a more efficient alternative due to their capacity for automated generation [37]. Nevertheless, careful attention must be paid to mesh quality metrics—such as skewness, aspect ratio, and orthogonality, particularly in relation to mesh density—as poor values (e.g., high skewness) can introduce numerical inaccuracies and distort flow field representations. In this study, an unstructured grid (ICEM (17.1) software) was used to discretize the computational domain, which includes both stationary and rotating regions. The mesh quality parameters were maintained within ranges consistent with those reported in existing literature [38,39].
To accurately resolve boundary layer behavior—especially near blade surfaces, where the flow exhibits significant velocity gradients, separation, and rotational effects—ten prism layers were applied along with a smoothing transition algorithm. This setup was designed to capture adverse pressure gradients and rapid flow variations around the ASHT blades. The first prism layer height was set to 0.02 mm with a growth rate of 1.10, ensuring a smooth dimensional transition between the prism layers and the adjacent polyhedral elements, thereby improving boundary layer resolution.
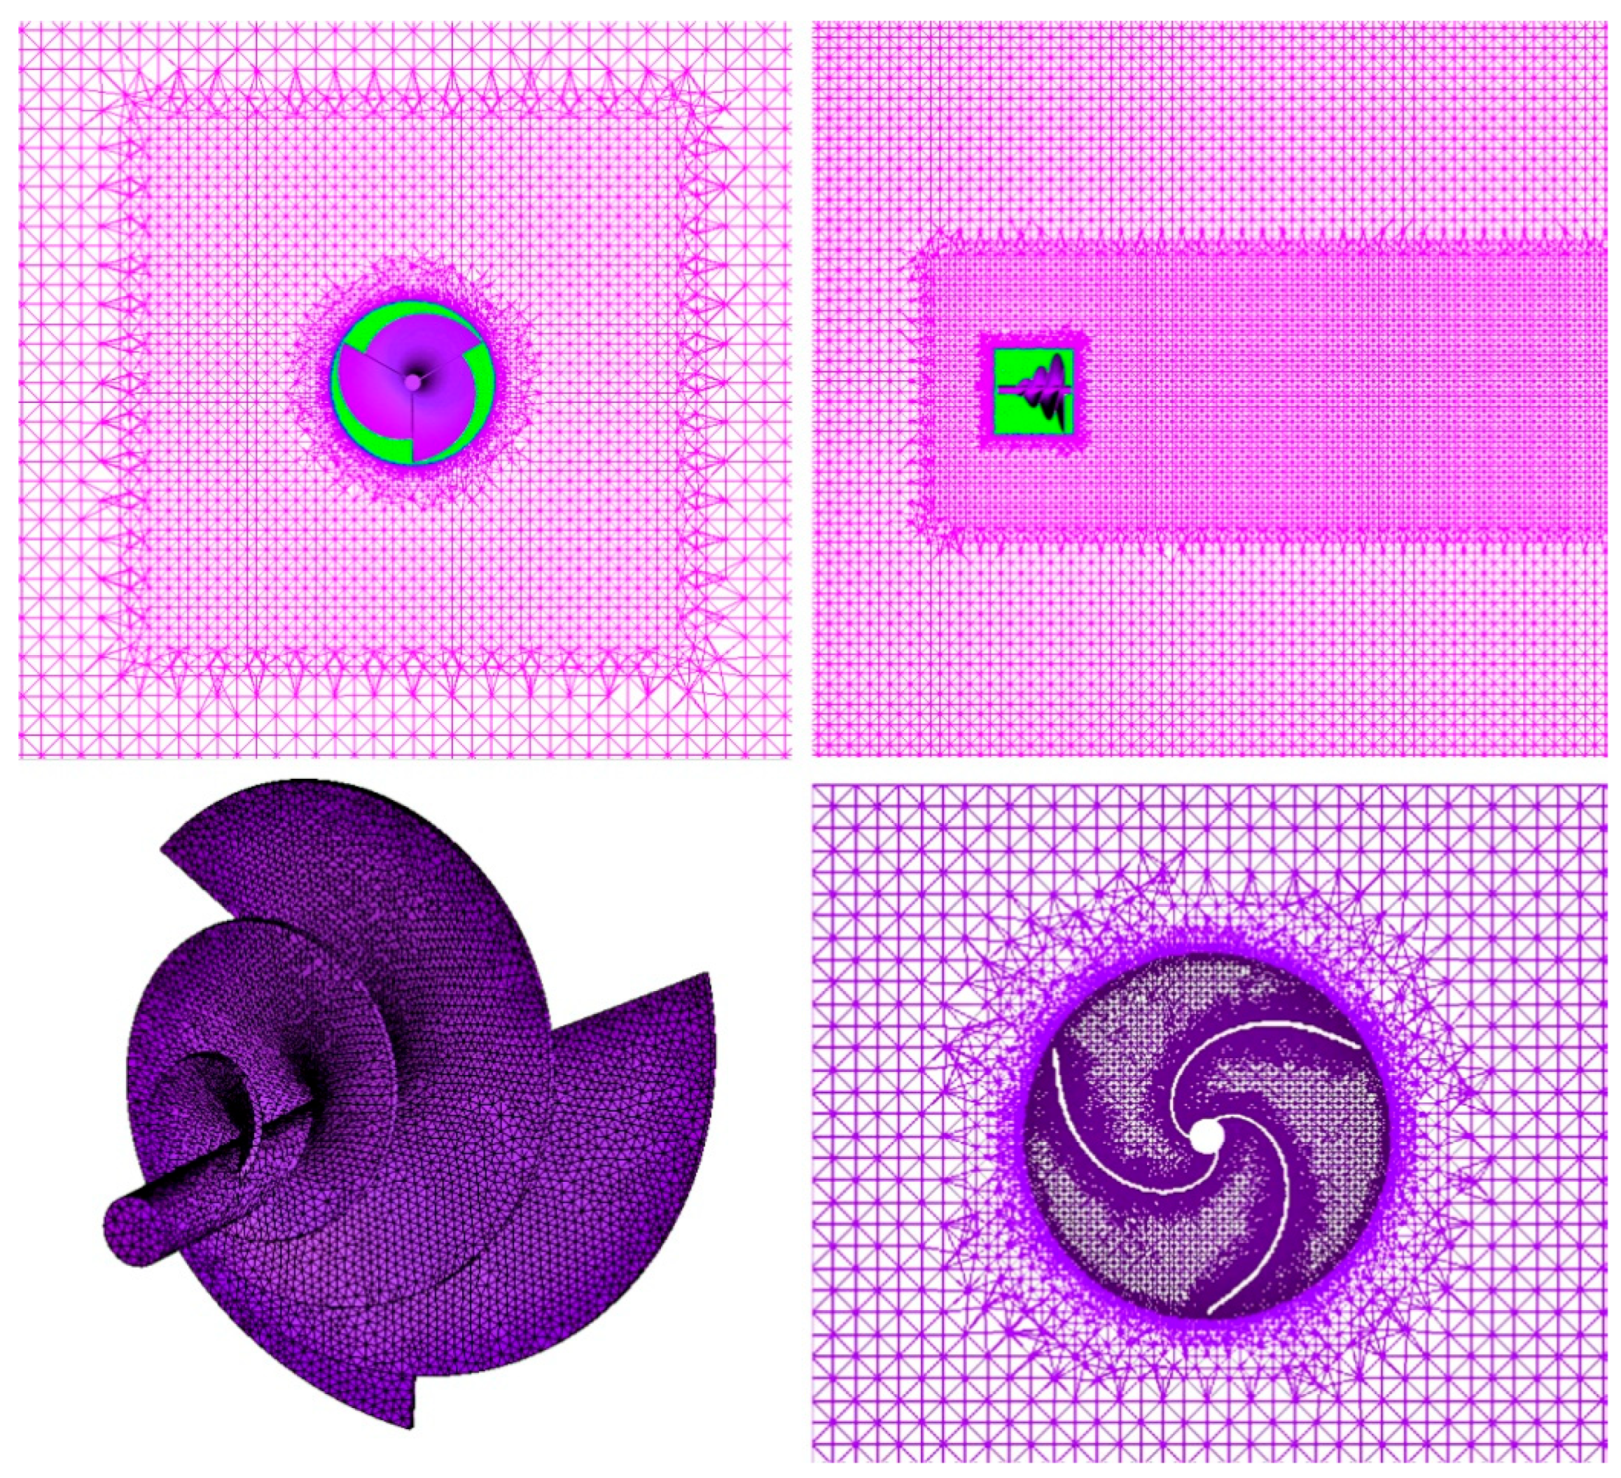
A key parameter in turbulence modeling is Y+, which represents the non-dimensional distance from a wall to the first mesh node within the turbulent boundary layer. For the SST k-ω model, it is generally recommended to maintain Y+ ≤ 15 [40] to ensure adequate resolution of near-wall flow structures, requiring the first cell layer to reside within the viscous sublayer. In this work, a more stringent value of Y+ ≤ 1 was enforced—exceeding the typical requirement of Y+ < 3—to prevent accuracy loss associated with insufficient boundary layer resolution. Figure 4 illustrates the spatial discretization layout around an ASHT, highlighting both volumetric and surface mesh features.
Given the complex geometry of the ASHT, mesh refinement was focused around the blade surfaces, rotor regions, and downstream wake areas to accurately resolve intricate flow structures. This targeted refinement strategy, combined with the prism layer configuration, ensures high-resolution capture of high-gradient flow features. To validate mesh independence, five distinct mesh configurations—denoted as 90-90-90 at TSR = 1.5—were evaluated using the metrics outlined in Table 2. The findings reveal only minor variations once the cell number exceeds 5 × 10⁶, which suggests that further enhancements to mesh resolution would exert a negligible impact on the hydrodynamic performance of the turbine. Therefore, the Mesh-4 was selected for all subsequent simulations to balance computational accuracy and efficiency.

3.5. Model Validation

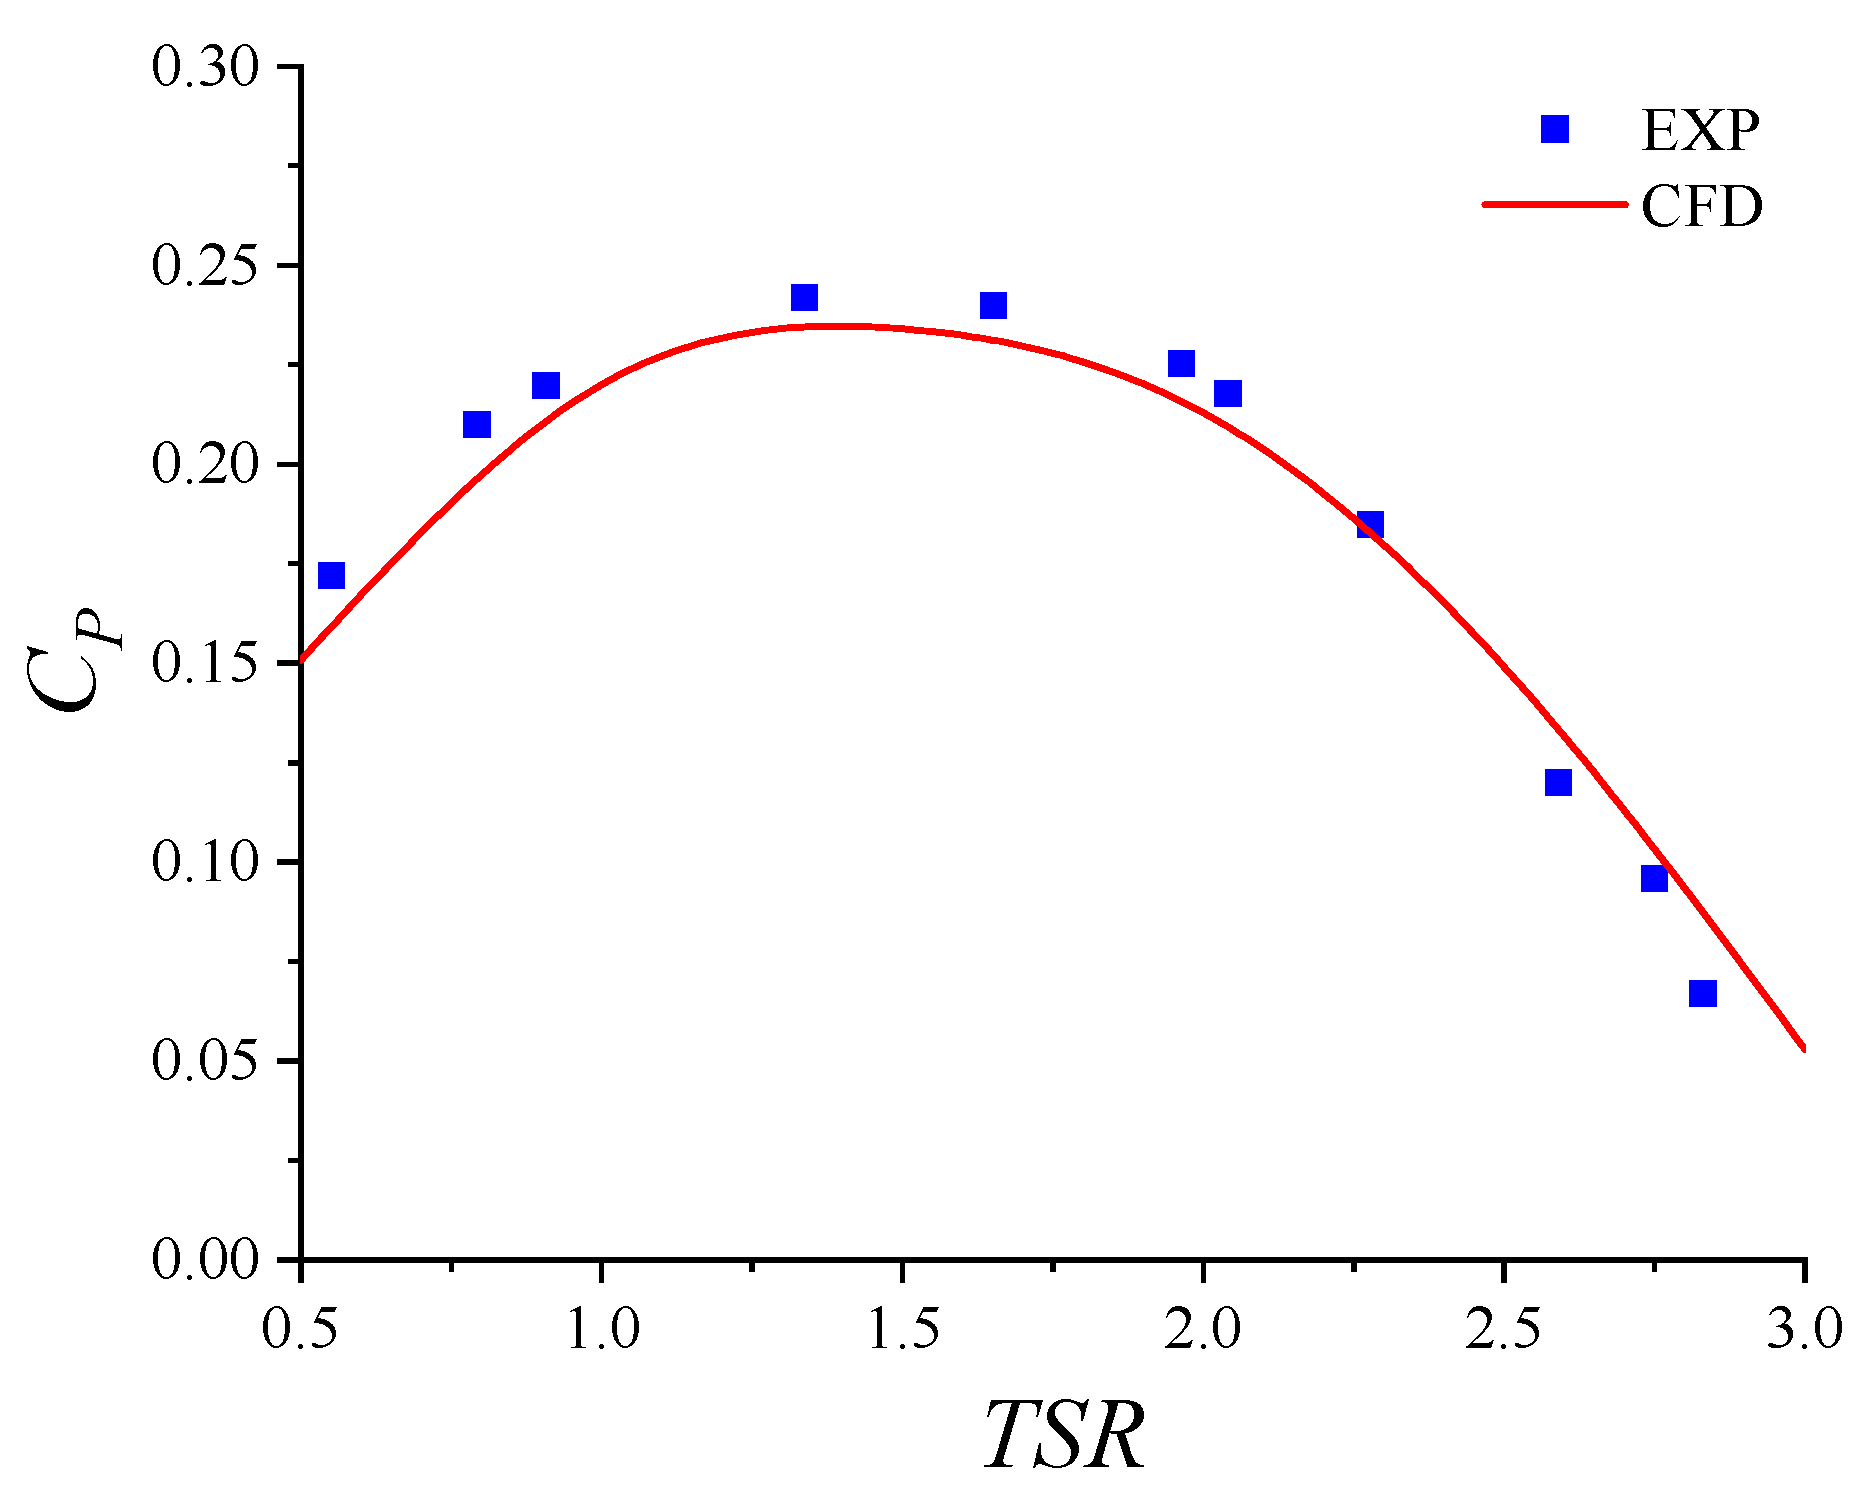
To validate the numerical model used in this study, Figure 5 compares the power coefficient for the 30-45-60 configuration from the current CFD simulations with experimental data [41]. Across the entire operating range, the CFD results show close agreement with the experimental measurements, with only slight variations observed. The deviation in the peak power coefficient between the two datasets is limited to +1.37%, demonstrating strong consistency. The minor discrepancies can be attributed to several factors affecting both numerical and experimental outcomes, such as the precision limitations of measurement instruments, ambient temperature fluctuations influencing flow density, inherent simplifications in the turbulence model, the omission of frictional mechanical losses in the CFD analysis, and measurement inaccuracies arising from the laboratory setup. Despite these factors, the overall agreement between the computational and experimental results is excellent, confirming the reliability and accuracy of the numerical approach and model parameters adopted in this work.

4. Results

4.1. Flow Field Analysis

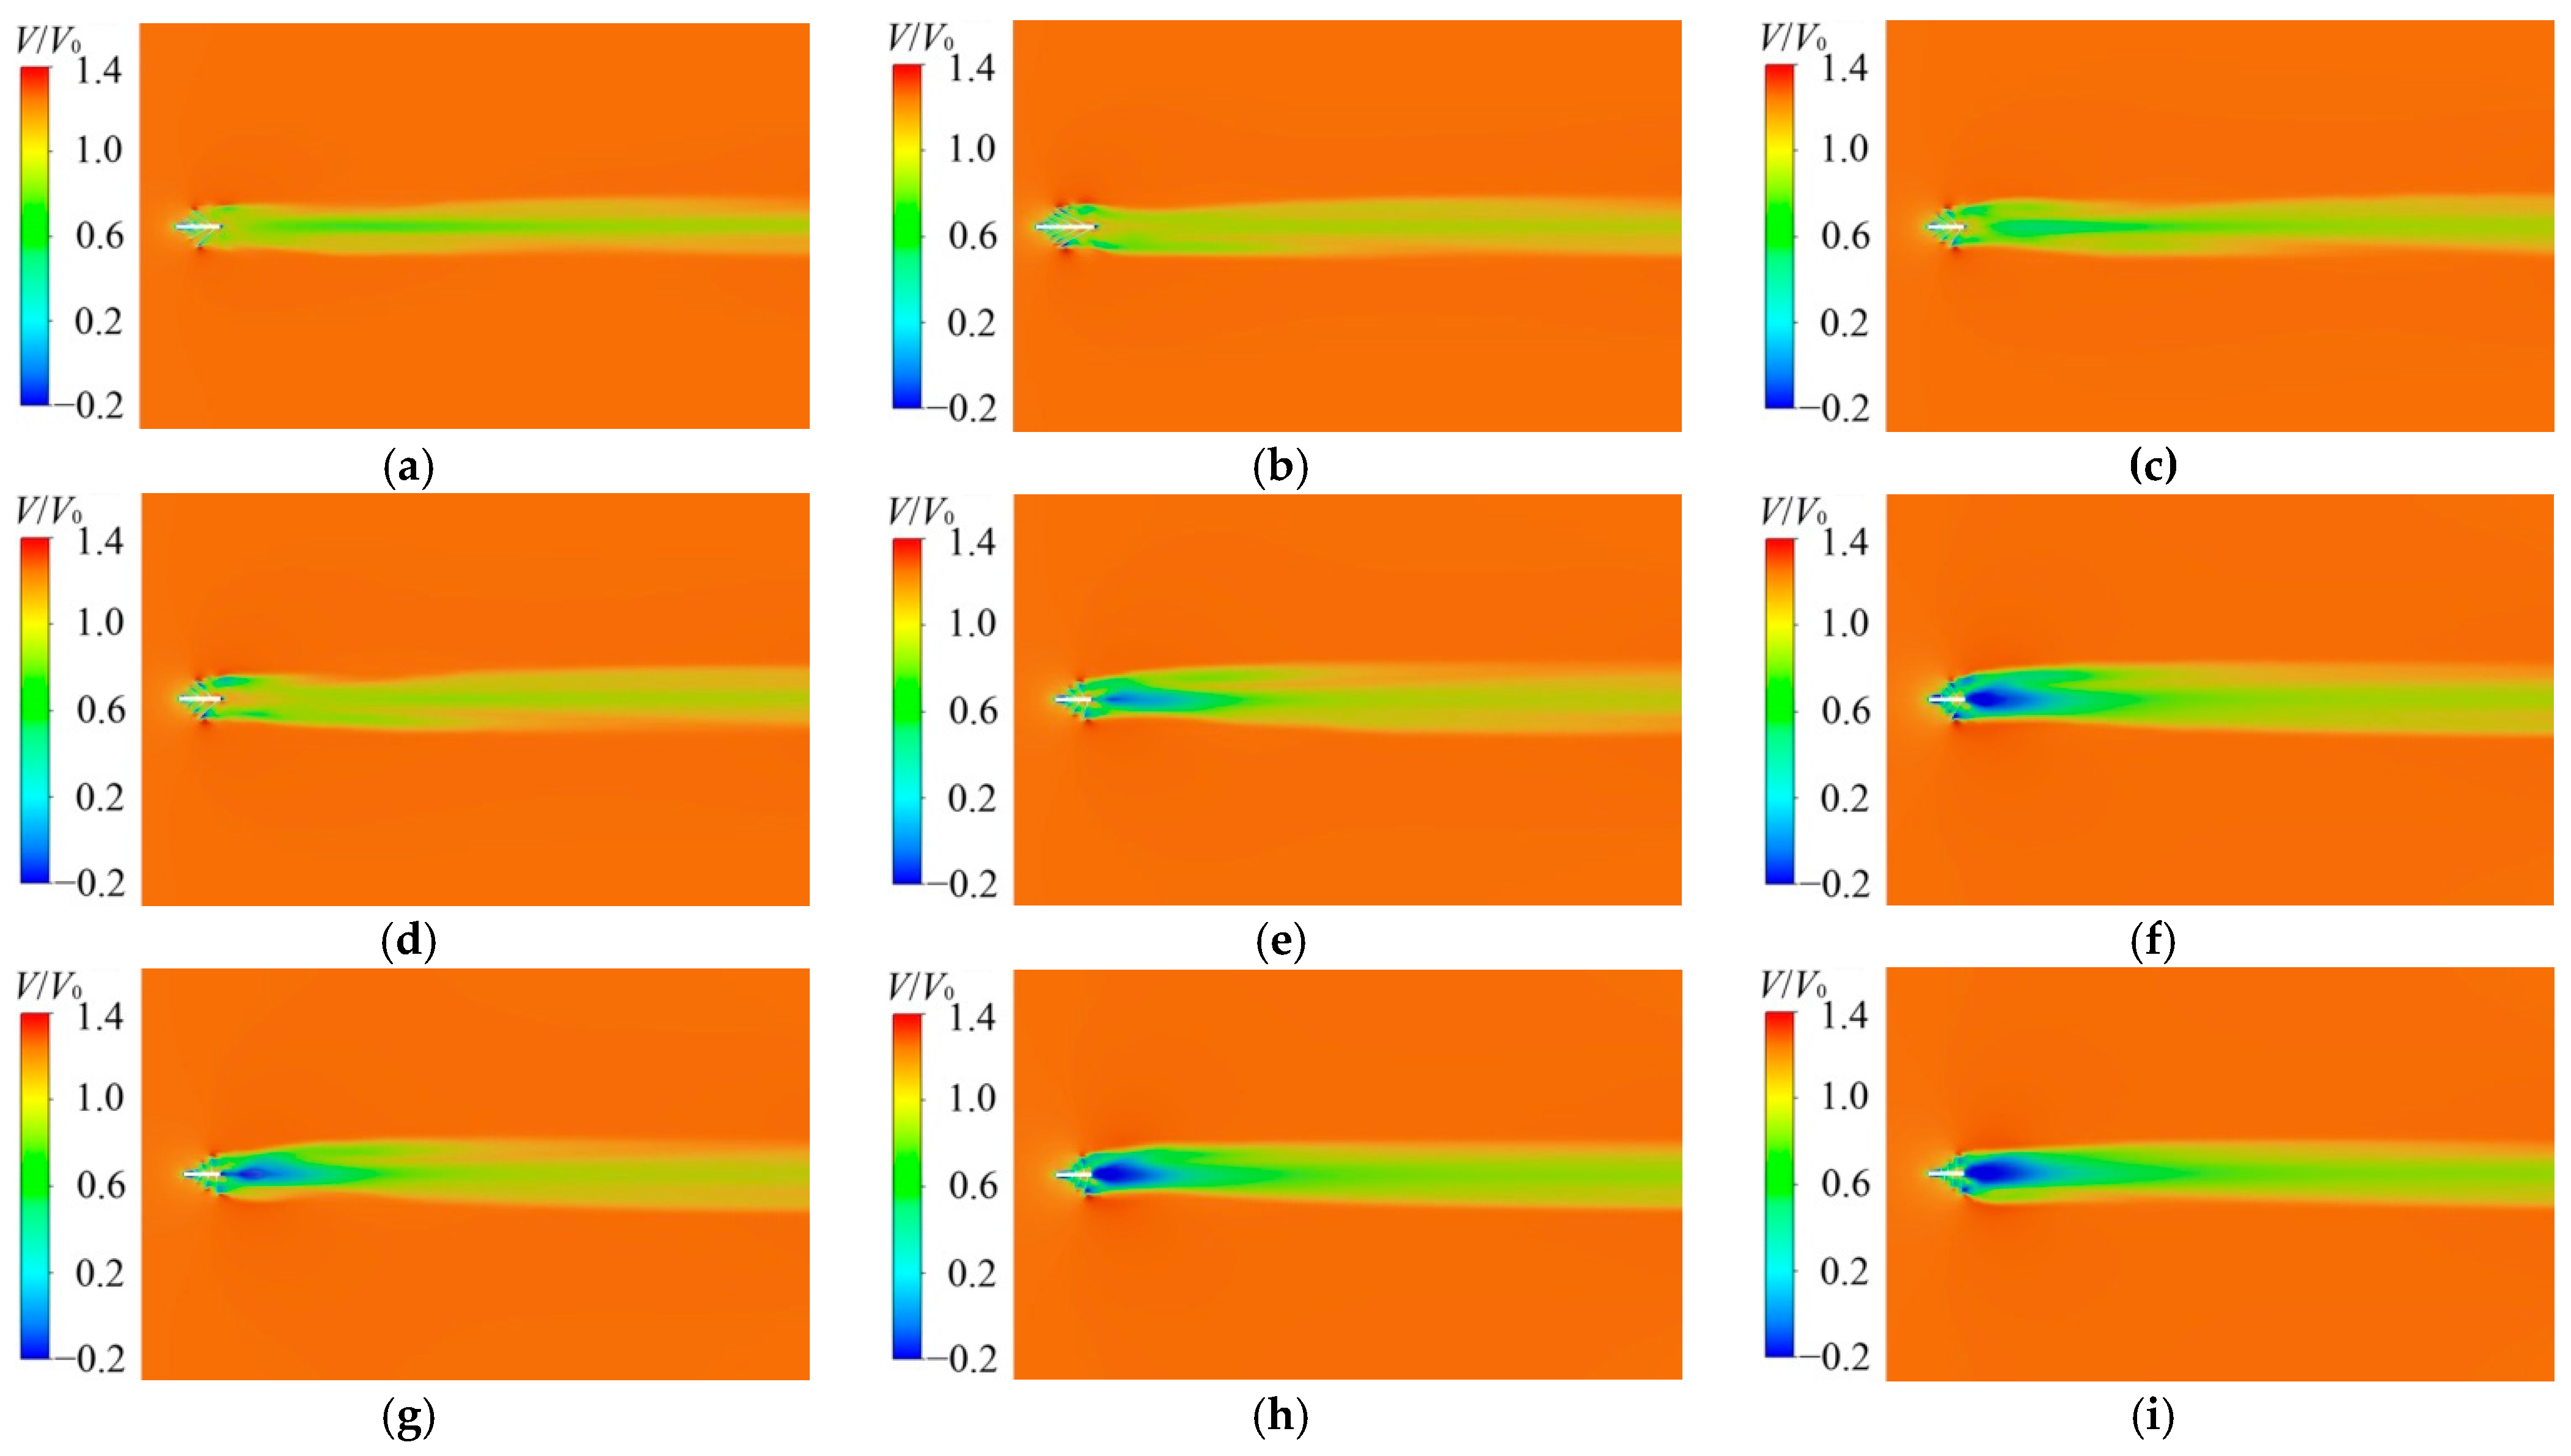
Figure 6 displays the velocity contours for the nine ASHT configurations at a TSR of 1.5. All configurations exhibit consistent flow characteristics: high velocities (indicated in red) occur near the blade tips, while low velocities (blue) and significant flow separation are observed near the hub. From a hydrodynamic perspective, the rotational motion of the impeller transfers kinetic energy to the fluid via the helical blade structure. The highest linear velocity at the blade tips drives rapid fluid motion across the blade surfaces. Conversely, the stationary hub generates a wake that impedes flow, resulting in reduced local velocity and flow separation. These flow patterns arise from the interaction between the pressure gradient and the blade geometry. According to fluid dynamics principles, the incoming flow is accelerated along the pressure side of the blades toward the tips (corresponding to the high-velocity regions), while lower pressure on the suction side draws flow inward (contributing to the low-velocity zones near the hub). Notably, the flow fields exhibit considerable spatial heterogeneity among the nine turbines, strongly influenced by blade angle. Small blade angles (e.g., 15-30-45, 30-30-30) promote smooth flow along the helical surfaces, reducing flow resistance and turbulence. Consequently, the low-velocity region near the hub is relatively constrained. Medium blade angles (e.g., 30-45-60, 45-45-45, 45-60-75) lead to an expanded low-velocity zone and moderately increased turbulence. In contrast, large blade angles (e.g., 60-75-90, 75-75-75, 90-90-90) significantly obstruct the incoming flow, preventing smooth passage over the blades and intensifying flow separation. The 90-90-90 configuration, in particular, shows the most extensive low-velocity wake region with pronounced reverse flow near the hub.

4.2. Effect of Sand Concentration on Erosion Rate

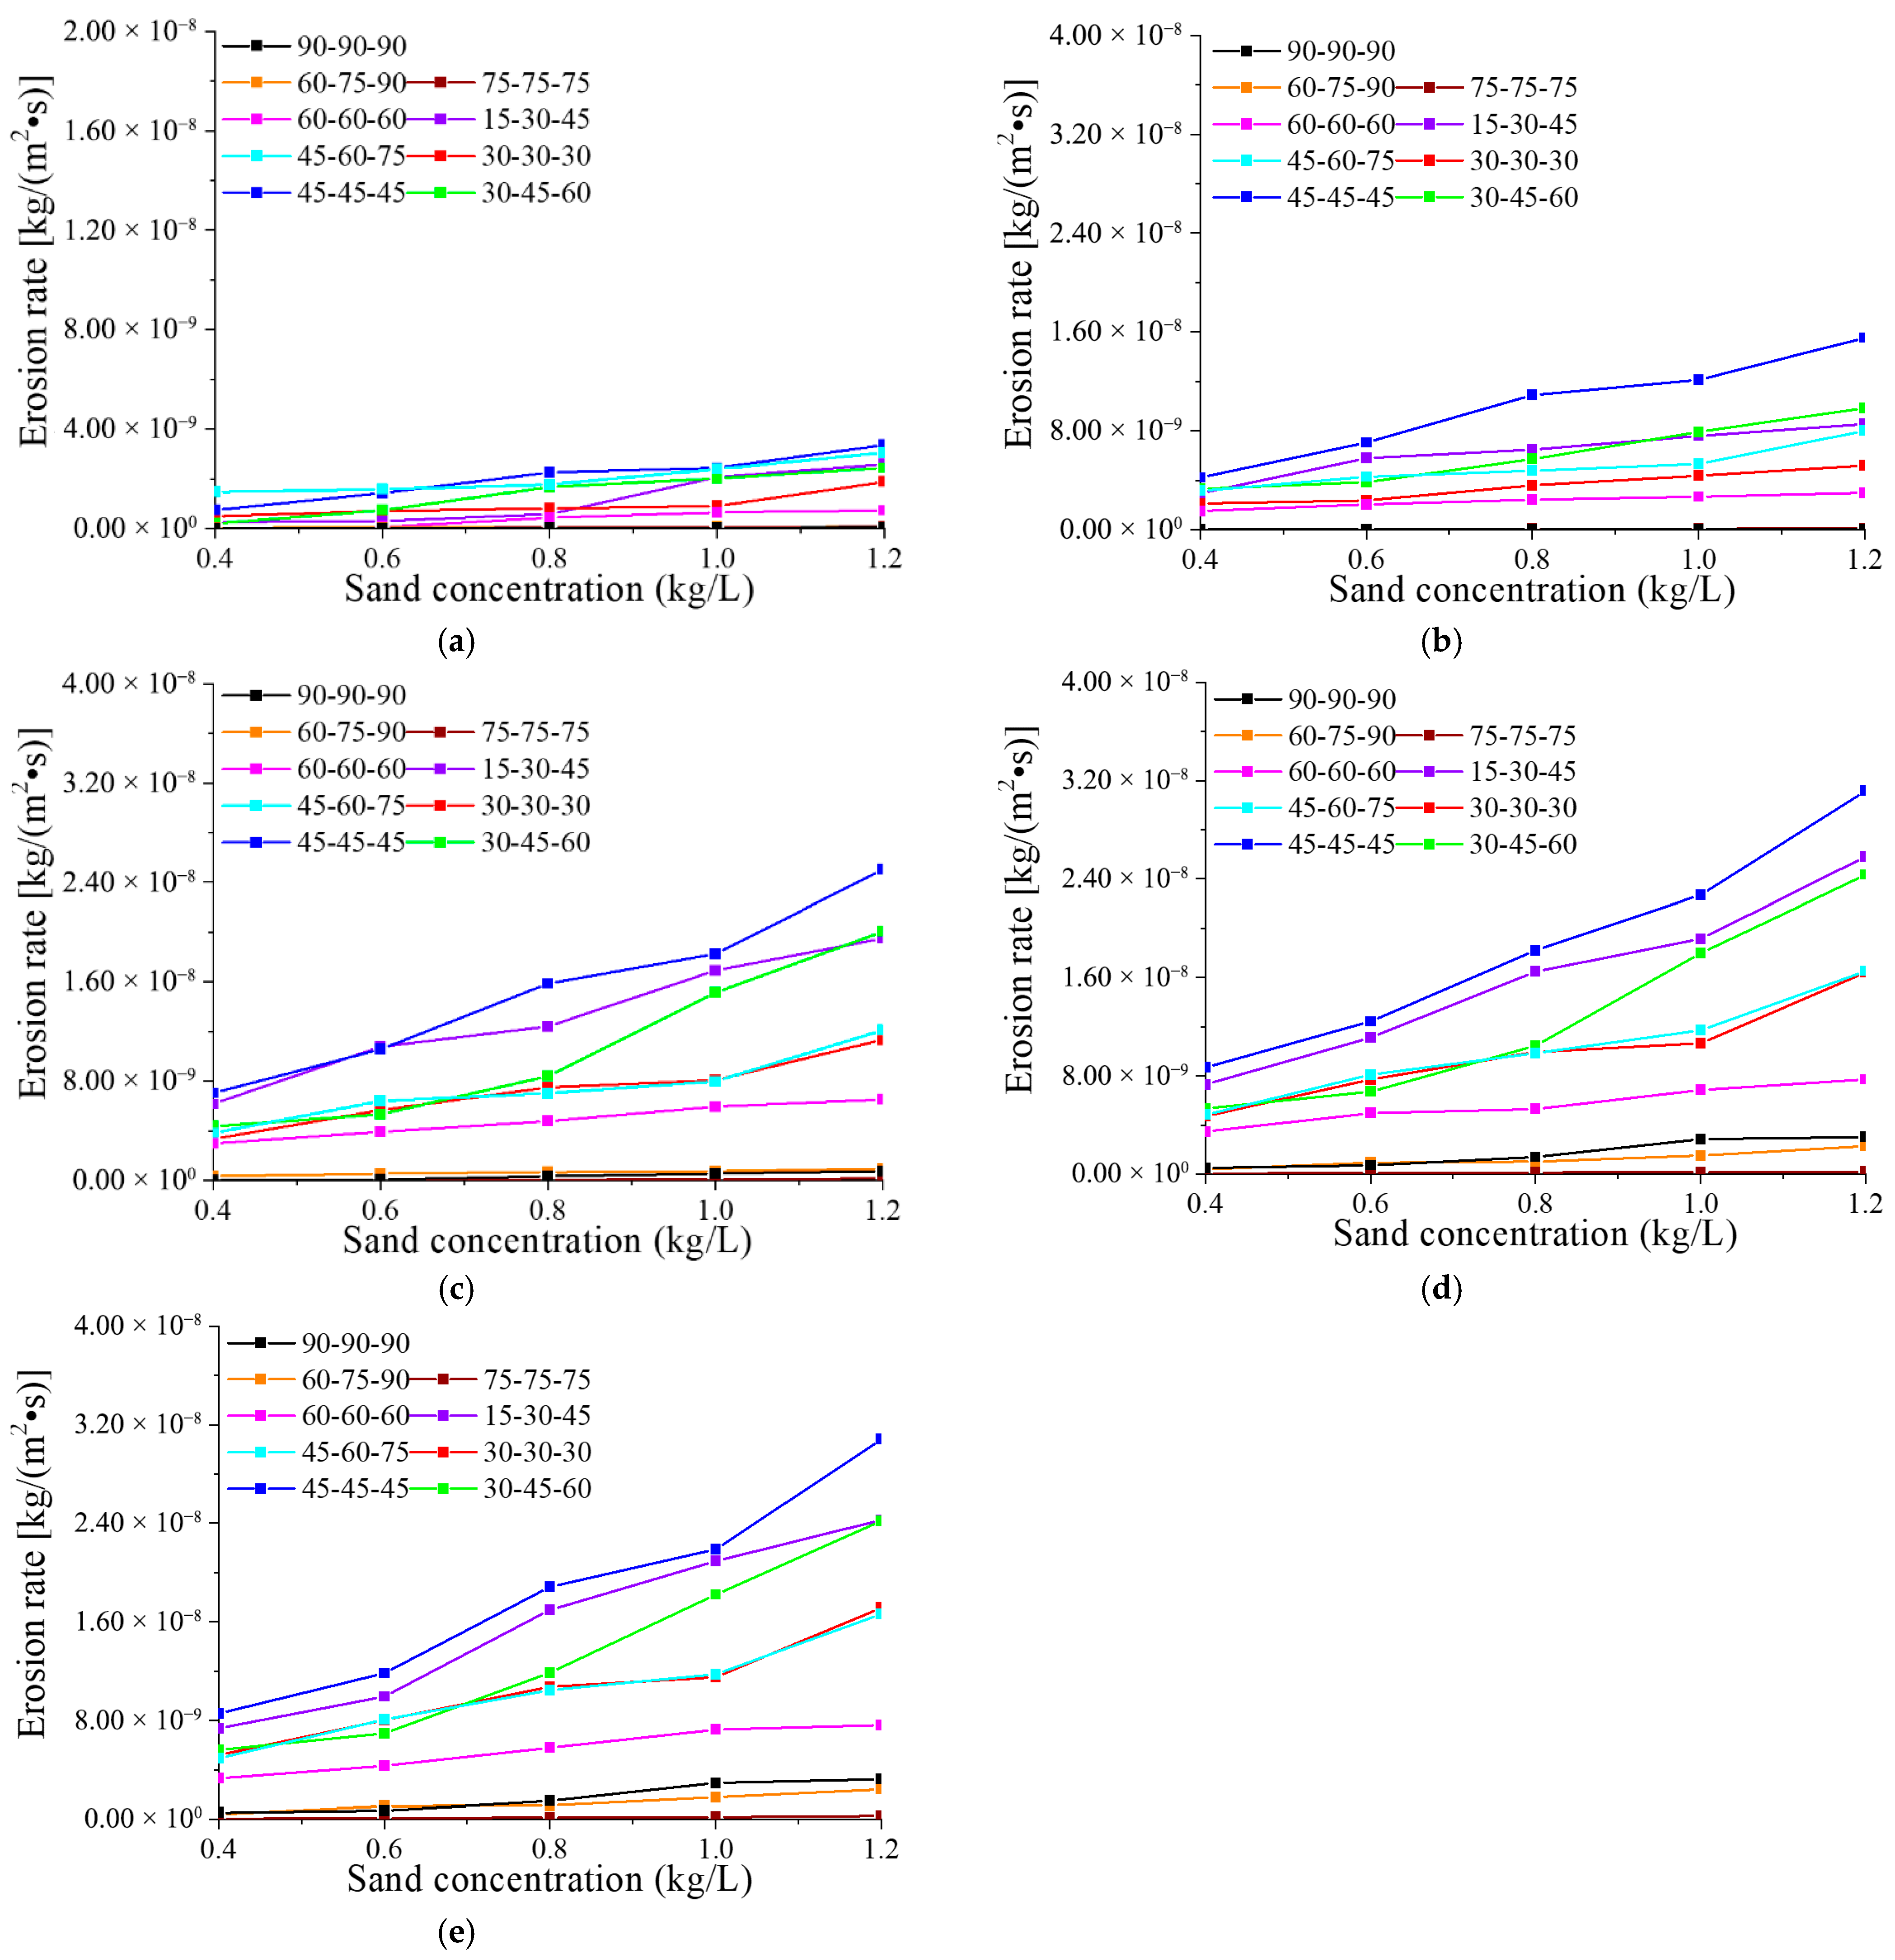
Figure 7 shows the erosion rate as a function of sand concentration (0.4–1.2 kg/L, 4.00 × 10⁸ mg/m3–1.20 × 109 mg/m3, 4.00 × 10⁵ ppm–1.20 × 10⁶ ppm) for nine ASHT configurations, each evaluated at sand sizes (SS) of 0.2 mm (a), 0.4 mm (b), 0.6 mm (c), 0.8 mm (d), and 1.0 mm (e). All subfigures (a–e) display a consistent pattern: regardless of sand size or turbine configuration, the erosion rate increases monotonically with sand concentration, showing a strong linear relationship. Specifically, as sand concentration rises from 0.4 kg/L to 1.2 kg/L, each curve exhibits a near-linear upward trend with stable slope and no significant deviation. For a fixed sand size, higher concentrations result in a proportional increase in the number of particles striking the blade surface per unit time. When concentration doubles, the number of impacting particles also approximately doubles, while the kinetic energy per impact remains largely unchanged. This leads to the observed linear dependence of erosion rate on concentration. Notably, this linear behavior remains consistent across all sand sizes tested, indicating that within the moderate concentration range examined—below the threshold where significant particle-particle interactions occur—the effect of inter-particle interference on erosion is negligible. Thus, the erosion rate is primarily governed by impact frequency, consistent with the well-established principle in erosion theory that erosion rate varies linearly with concentration under dilute conditions.
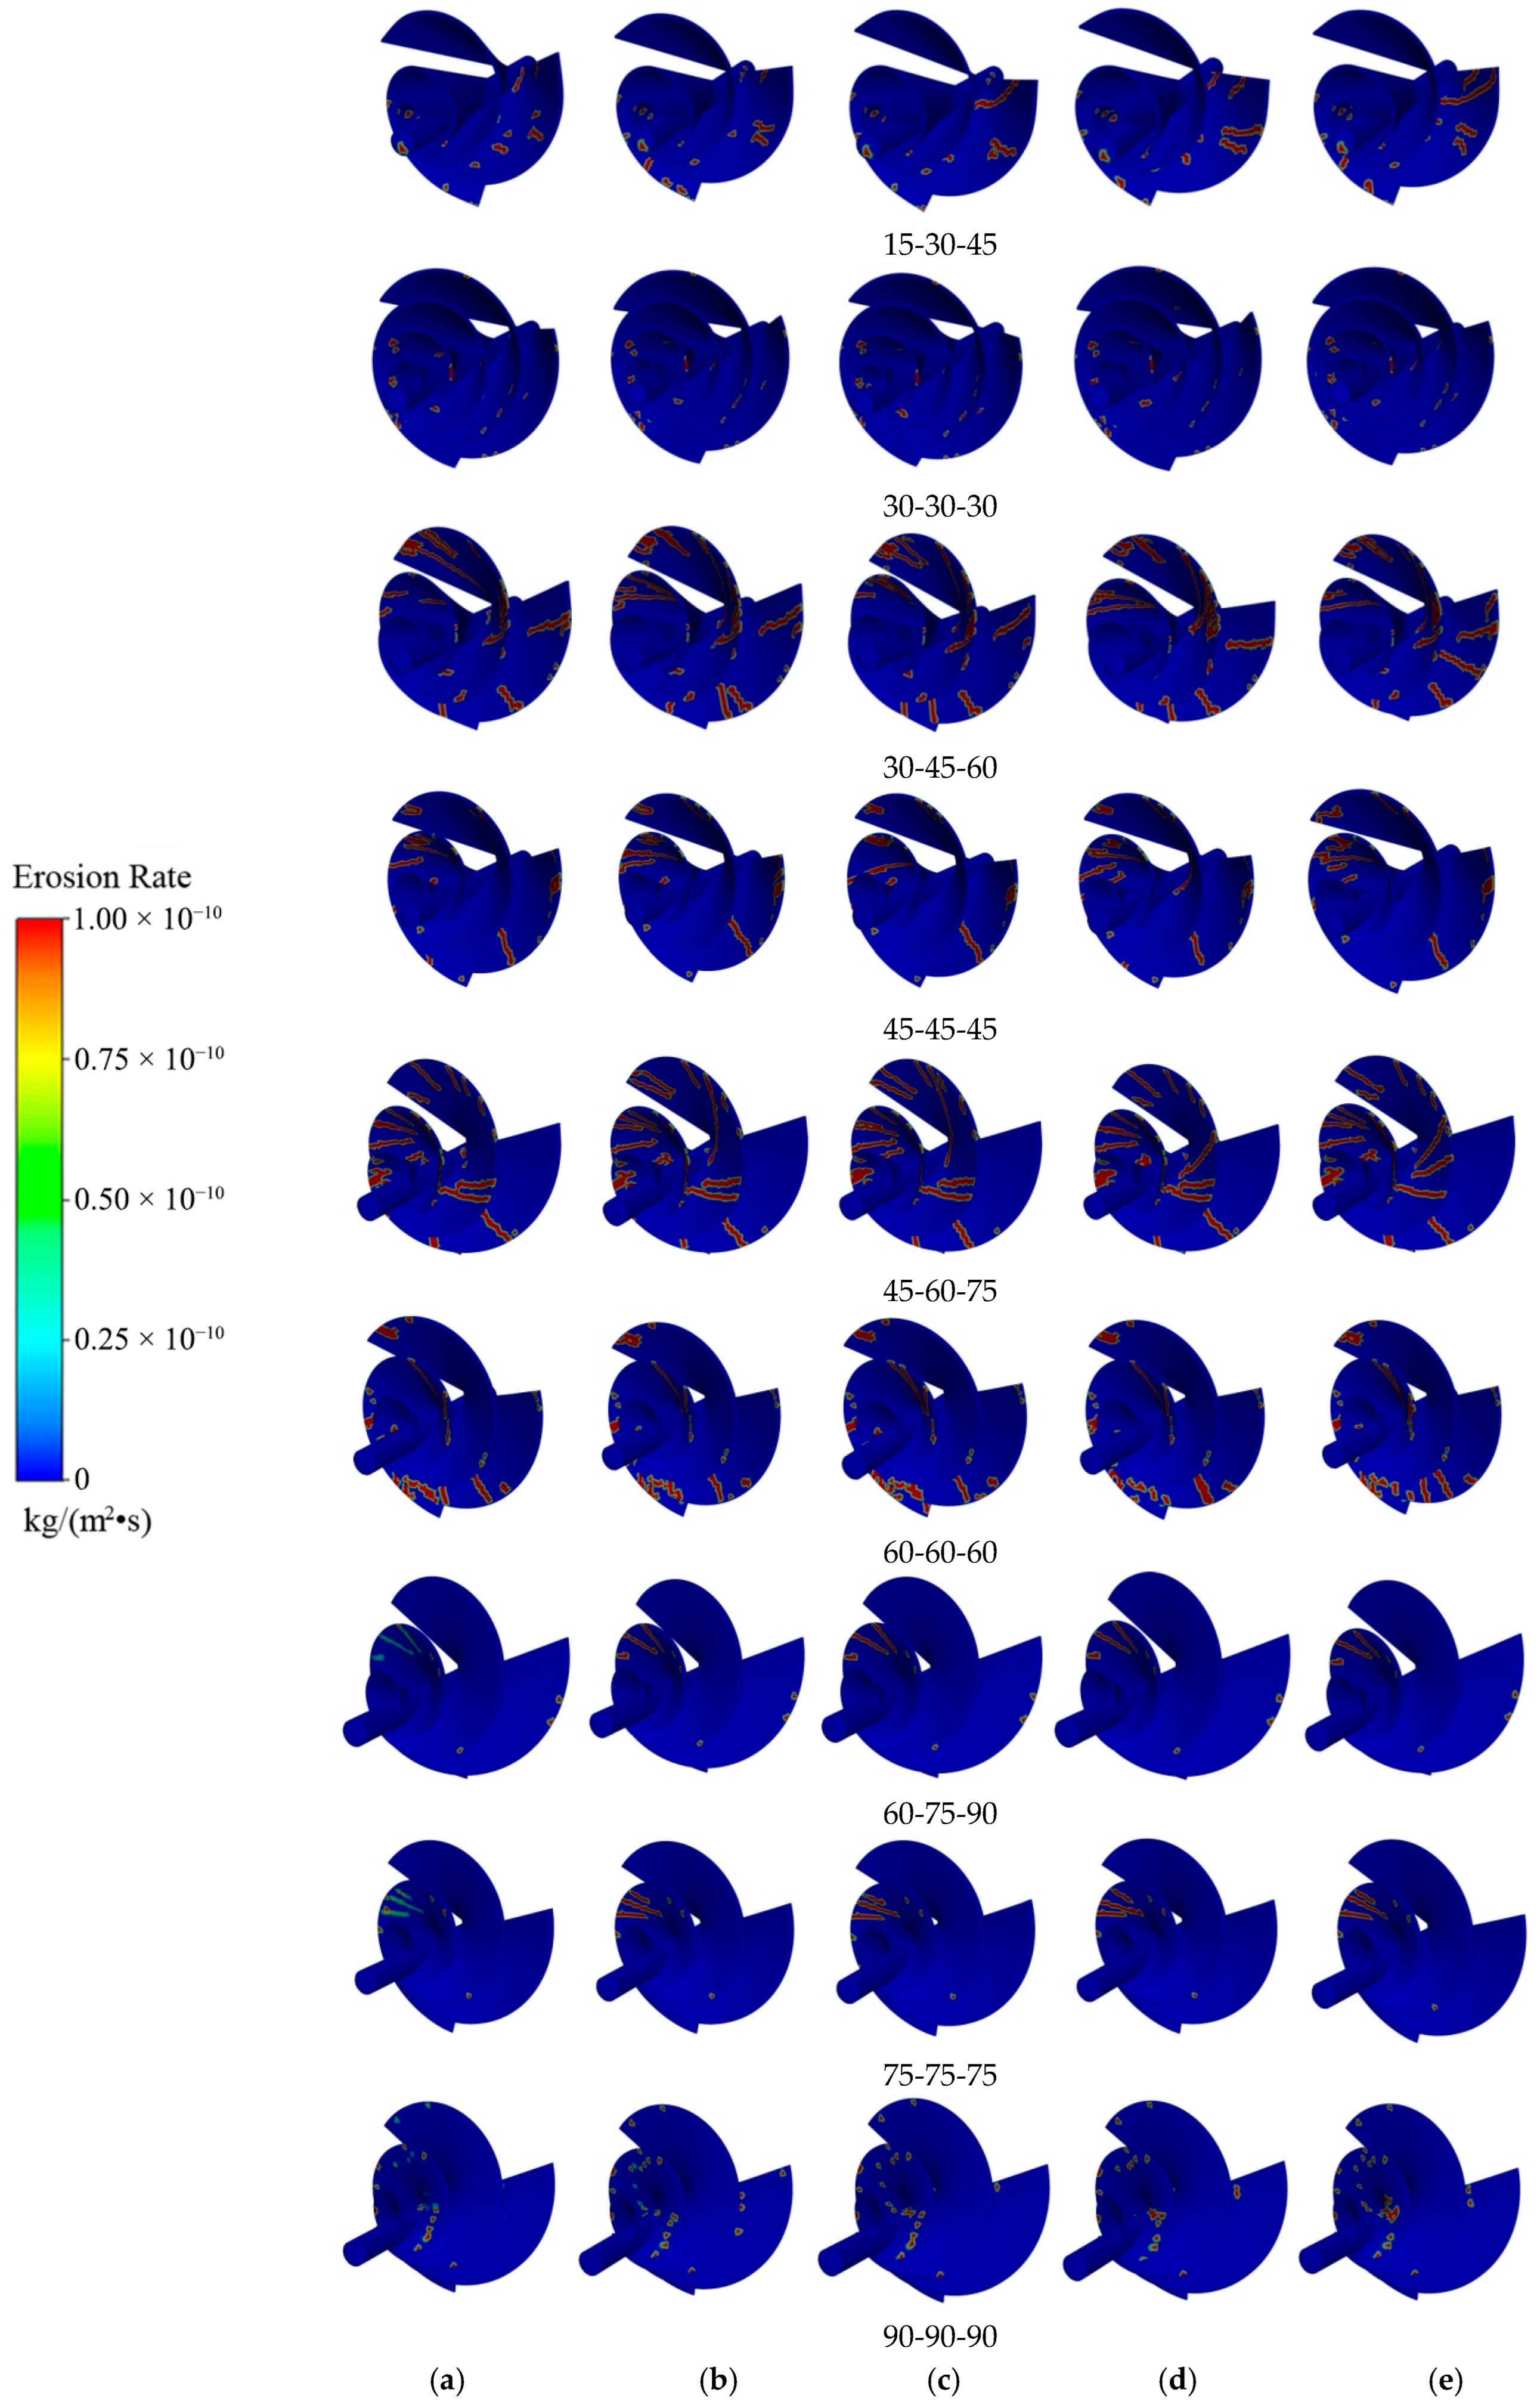
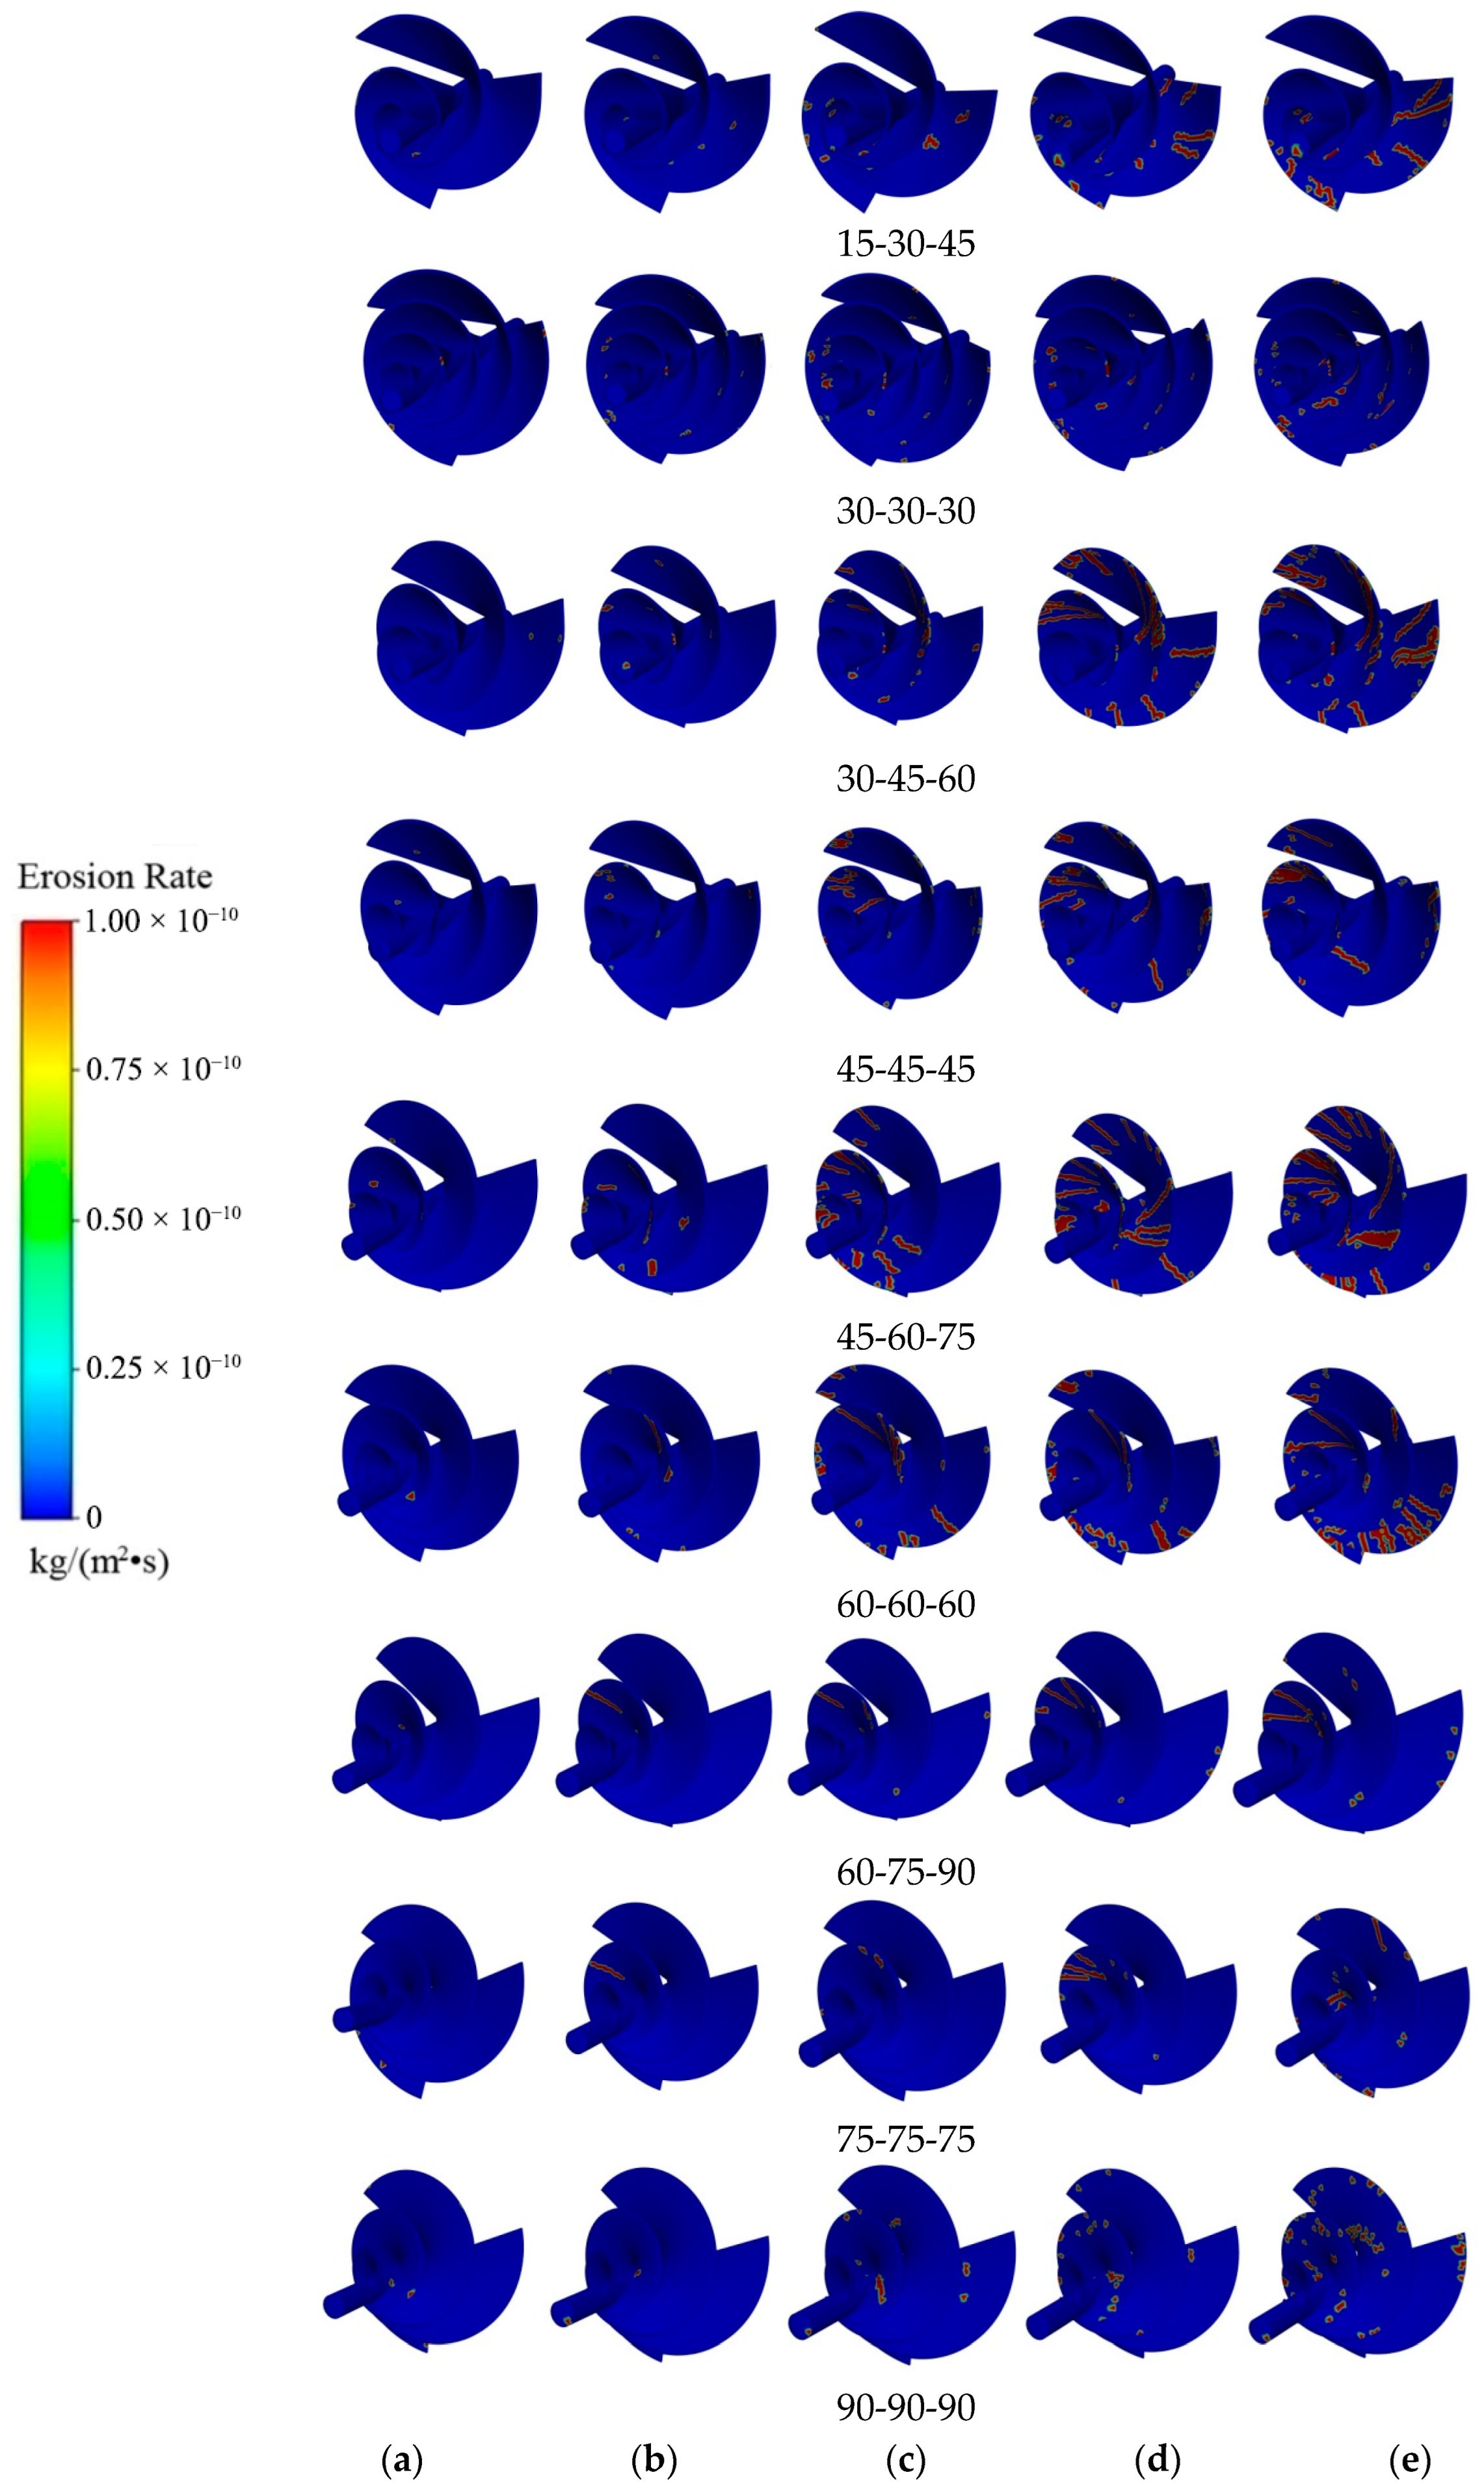
Figure 8 shows the erosion distribution contours for the nine ASHT configurations under a fixed sand size of 0.8 mm and sand concentrations (SC) of 0.4 kg/L (a), 0.6 kg/L (b), 0.8 kg/L (c), 1.0 kg/L (d), and 1.2 kg/L (e). At low concentration (SC = 0.4 kg/L (4.00 × 10⁸ mg/m3, 4.00 × 10⁵ ppm), Figure 8a), erosion is concentrated in the “high-impact zones” of the blades—particularly near the tip edges, where rotational linear velocity is highest, resulting in maximum particle impact energy. The underlying mechanism is that under low-concentration conditions, the limited number of sand particles preferentially strikes regions where kinetic energy is highest and impact trajectories are nearly perpendicular to the blade surface. In contrast, the “low-impact zones” near the hub show little to no erosion due to the infrequent arrival of particles. As concentration increases, erosion expands into sub-high-impact zones, particularly the mid-span regions between the tips and the hub. This occurs because higher particle density increases the number of particles per unit volume. Sand particles that were previously unable to reach these areas—due to deflected trajectories or insufficient energy—now impact more frequently, effectively enlarging the “erosion radius” within the flow field. Consequently, erosion spreads from the high-energy core toward surrounding regions. At SC = 0.8 kg/L (8.00 × 10⁸ mg/m3, 8.00 × 10⁵ ppm) (Figure 8c), erosion has largely covered the main upstream surfaces of the blades, with significant erosion also appearing near the hub and areas where the blade’s helical curvature changes abruptly. By this concentration, most susceptible impact sites have been activated, and the spatial expansion of erosion begins to slow. When sand concentration exceeds 0.8 kg/L (4.00 × 10⁸ mg/m3, 4.00 × 10⁵ ppm), the spatial pattern of erosion shows little further migration across all configurations; instead, erosion intensity increases linearly. Additional particles are constrained by the existing flow velocity and pressure fields and cannot effectively reach previously unaffected “blank zones,” which typically lie in flow shadows or structurally shielded low-flux regions.

4.3. Effect of Sand Size on Erosion Rate

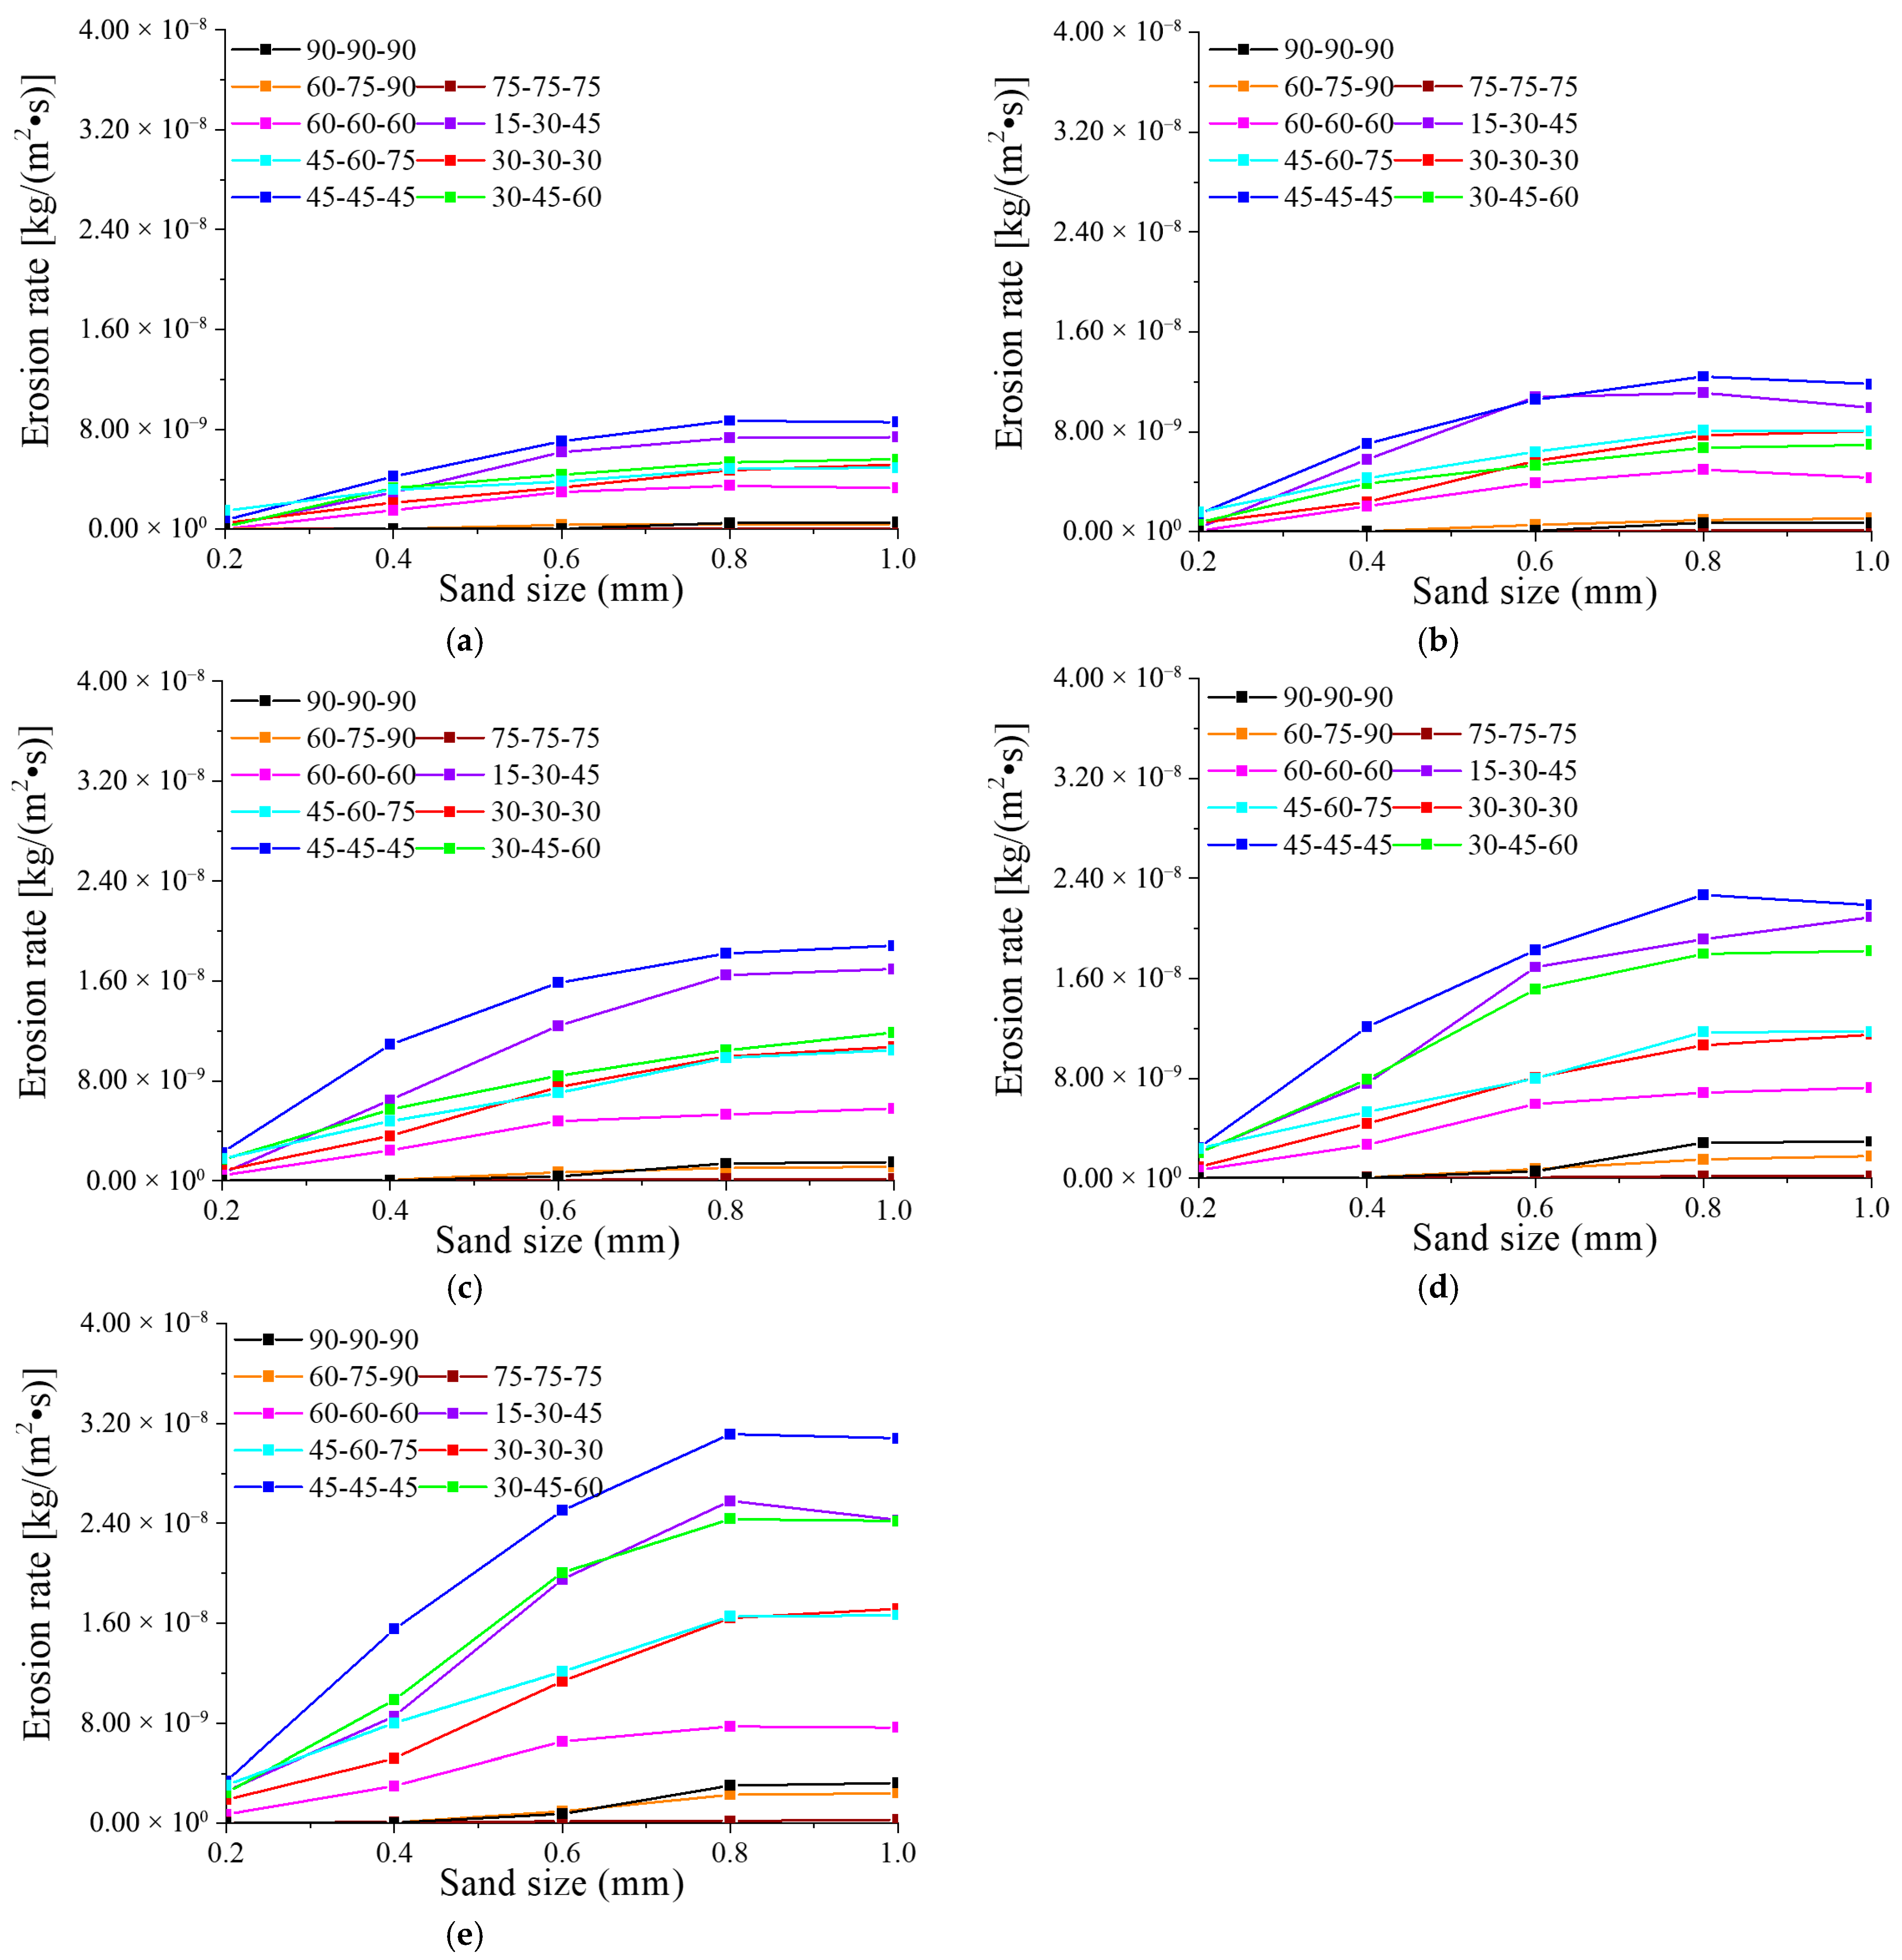
Figure 9 shows the erosion rate as a function of sand particle diameter (0.2–1.0 mm) for nine ASHT configurations, each under sand concentrations (SC) of 0.4 kg/L (a), 0.6 kg/L (b), 0.8 kg/L (c), 1.0 kg/L (d), and 1.2 kg/L (e). All subfigures (a–e) consistently reveal a non-linear trend: the erosion rate generally increases with particle diameter, but the rate of increase varies considerably across different size ranges. For particle diameters below 0.6 mm, the erosion rate increases rapidly and almost linearly with diameter, exhibiting a steep and consistent slope. For example, at SC = 1.2 kg/L (1.20 × 10⁹ mg/m3)(Figure 9e), the erosion rate for the 45-45-45 configuration rises from approximately 3.3 × 10⁻⁹ kg/(m2·s) to 2.5 × 10⁻⁸ kg/(m2·s) as diameter increases from 0.2 mm to 0.6 mm—an increase of 678%. The underlying mechanism is that smaller particles possess low momentum and are more likely to be deflected by the viscous-dominated boundary layer on the blade surface, reducing their ability to impact effectively. As diameter increases, particle momentum rises significantly, improving their capacity to penetrate the boundary layer. This results in both a higher rate of effective impacts per unit time and greater kinetic energy per impact, collectively driving the sharp increase in erosion. For diameters exceeding 0.6 mm, the erosion rate increases at a noticeably slower rate, and the curve begins to plateau. Again considering the 45-45-45 configuration, the erosion rate increases from 2.5 × 10⁻⁸ kg/(m2·s) to only about 3.1 × 10⁻⁸ kg/(m2·s) as diameter grows from 0.6 mm to 1.0 mm—a mere 24% increase. This behavior can be attributed to amomentum–quantity trade-off effect: although larger particles carry higher momentum and impart greater impact force, the number of particles per unit volume decreases under constant mass concentration. Consequently, the total number of particles striking the blades per unit time is reduced. Beyond 0.6 mm, the declining particle count gradually offsets the benefit of increased momentum, leading to a slower and eventually stabilizing erosion rate. It is worth mentioning that the overall trend shows an increase in erosion rate with particle size, with minor decreases observed in a few cases at the largest diameters (0.8–1.0 mm).
Figure 10 shows the erosion contours for the nine ASHT configurations under a fixed sand concentration of 1.0 kg/L (1.0 × 10⁹ mg/m3, 1.0 × 10⁶ppm) and sand sizes (SS) of 0.2 mm (a), 0.4 mm (b), 0.6 mm (c), 0.8 mm (d), and 1.0 mm (e). The erosion rate increases with particle size across all configurations. Notably, higher sand concentrations correlate with a slower increase in erosion rate as particle size grows; beyond a certain diameter, the rate of erosion growth declines. For particles smaller than 0.6 mm, the erosion rate rises steadily with diameter. At SS = 0.2 mm (Figure 10a), erosion is localized along the blade edges, with high-erosion areas (dark zones) covering only a small portion of the surface. At SS = 0.4 mm (Figure 10b), these high-erosion zones expand toward the blade tips and mid-sections of the upstream faces. By SS = 0.6 mm (Figure 10c), high-erosion regions further extend into corners and curved areas of the helical blade structure. As previously explained, smaller particles (≤0.6 mm) possess lower momentum and are more susceptible to boundary layer effects, limiting their effective impact to high-energy zones such as the blade edges. Their small mass also results in relatively low kinetic energy per impact. Once the particle size exceeds 0.6 mm, the growth rate of erosion slows. By this point, high-erosion zones have expanded to cover most of the blade surface, including mid-span regions between the tips and the hub.

5. Discussion

A review of Figure 7 and Figure 9 reveals a consistent pattern across all subfigures (a–e): the relationship between blade angle and erosion rate is non-monotonic. Instead, a tiered pattern emerges relative to medium angles, characterized by: Medium angles > Small angles > Large angles. Specifically, configurations with large blade angles (e.g., 90-90-90, 75-75-75, 60-75-90) exhibit significantly lower erosion rates than those with medium angles (e.g., 30-45-60, 45-45-45, 45-60-75). This difference is especially pronounced under conditions of high sand concentration and large particle size. For instance, at a sand diameter of 0.8 mm and a concentration of 1.0 kg/L (Figure 7d), the erosion rate of the 75-75-75 configuration is only 1.7 × 10⁻¹⁰ kg/(m2·s), while that of the 45-45-45 configuration reaches 2.3 × 10⁻⁸ kg/(m2·s)—an increase of 135%. These results underscore the decisive role of blade angle in regulating erosion: medium-angle blades produce an impact angle range that favors efficient material removal, whereas large-angle blades significantly reduce erosion efficiency.
Further analysis of Figure 8 and Figure 10 shows that for medium-angle ASHTs (e.g., 45-45-45), erosion zones cover the entire blade surface. High-intensity erosion cores form particularly along the blade edges, the mid-section of the flow-impact surface, and bends in the helical structure. Within this angle range, the normal component of particle impact increases, promoting plastic deformation, while the tangential component remains sufficiently high to effectively remove deformed material or fragments. This synergy maximizes the erosion rate. In contrast, for small-angle configurations (e.g., 30-30-30), particles primarily skim the surface with a dominant tangential component, resembling micro-cutting. This results in less plastic deformation and lower fragment removal, yielding an erosion rate lower than that of medium-angle designs. For large-angle configurations (e.g., 75-75-75), erosion remains confined to blade edges and localized areas on the flow-impact surface. Even at a sand concentration of 1.2 kg/L (Figure 8e), high-erosion zones remain limited, with negligible erosion near the hub. Here, impact angles approach 90°, emphasizing the normal component. Particles act like “hammers,” creating pits, but the lack of a sufficient tangential component inhibits material removal. As a result, erosion zones fail to expand, and overall erosion intensity remains low.
Based on the correlation between blade angle and erosion patterns shown in Figure 7, Figure 8, Figure 9 and Figure 10, along with the underlying impact mechanisms and material responses, the following anti-erosion strategies are recommended: Blade Angle Selection: Since blade angle critically influences erosion rates, large-angle configurations should be prioritized during design (without compromising efficiency) to reduce tangential cutting and lower overall erosion. Graded Wear-Resistant Coating: Apply a dual-material coating to vulnerable areas: use high-hardness ceramics to resist tangential wear and tough metals to absorb normal impacts. Ensure metallurgical bonding with the substrate to prevent spallation. Fillet Optimization: Introduce smooth fillets at regions with abrupt curvature changes (e.g., helical bends) to minimize flow separation, particle trapping, and localized impact, thereby extending service life.
Furthermore, the erosion characteristics of conventional turbines (e.g., Francis and Pelton turbines) differ from those of the ASHT. In Francis turbines, erosion is predominantly observed on guide vanes and runner blades [42]. Pelton turbines experience significant erosion on buckets, with mass loss directly correlated to silt size and concentration [43]. In contrast, the ASHT designed for low-velocity flows exhibits a linear increase in erosion rate with sand concentration, consistent with findings in Francis turbines [44]. However, the ASHT shows a unique non-linear response to particle size, which is less pronounced in impulse turbines like Pelton, where larger particles cause more severe damage without such a saturation effect. Moreover, the erosion distribution in ASHTs is highly influenced by blade angle. This is distinct from Francis turbines, where erosion is more uniform across the runner blades and heavily influenced by flow separation and vortex formation.
On the other hand, it is worth mentioning that this study employed numerical simulations based on the CFD-DPM approach to investigate the erosion characteristics of ASHT. However, several limitations should be acknowledged. First, the simulations assumed spherical, non-interacting sand particles, which may not fully represent the irregular shapes and inter-particle collisions occurring in real sediment-laden flows. Second, the material erosion model used herein is based on empirical constants derived from carbon steel, which may vary for other blade materials or coatings. Third, the study focused on steady-state conditions and uniform inlet particle distributions, which might differ from transient or non-uniform real-world ocean environments. Future work could include experimental validation and more advanced multiphase models to enhance predictive accuracy.

6. Conclusions

This study numerically investigates the erosion characteristics of ASHTs across multiple configurations, with a focus on flow field behavior and the influence of sand concentration, sand size, and blade angles on erosion rates. The main findings are summarized as follows:
(1)
All ASHT configurations exhibit consistent flow field patterns, characterized by high-velocity regions near the blade tips and low-velocity zones with flow separation near the hub—attributed to wake effects. Blade angle significantly affects flow heterogeneity: small angles reduce flow resistance and turbulence, thereby minimizing low-velocity regions near the hub; large angles enhance flow separation and expand wake regions, even resulting in reverse flow.
(2)
Erosion rate increases linearly with sand concentration for all configurations and sand sizes, due to a proportional rise in particle impact frequency. As concentration increases, erosion zones expand from the blade tip edges toward mid-span regions and areas adjacent to the hub. This expansion stabilizes once sand concentration exceeds 0.8 kg/L.
(3)
Erosion rate demonstrates non-linear growth with increasing sand size. For particles smaller than 0.6 mm, the erosion rate increases rapidly and nearly linearly, owing to improved boundary layer penetration and higher kinetic energy per impact. For particles larger than 0.6 mm, the growth rate declines as a result of a “momentum–quantity trade-off”: although individual particles carry greater momentum, the total number of particles—and thus impact events—decreases, leading to a plateau in erosion rate.
(4)
Blade angle significantly influences erosion rate in a tiered relationship: medium angles > small angles > large angles. Medium angles promote an optimal balance between normal and tangential impact components, maximizing material removal. In contrast, large angles produce predominantly normal impacts, which limit erosion due to insufficient tangential action for material removal. Small angles result in reduced erosion efficiency because of weaker plastic deformation and limited fragment generation.
Building upon the findings of this numerical study, future work will focus on experimental validation and real-field applications. An experimental campaign is planned to test the proposed anti-erosion measures—including large-angle blade configurations, graded coatings, and fillet optimization—in a controlled sediment erosion loop. Accelerated life testing will be conducted to quantitatively evaluate service life extension and efficiency retention under continuous sediment-laden flow. Furthermore, while the proposed measures (large blade angles, graded coatings, and fillet optimization) are derived from the identified erosion mechanisms and are expected to significantly extend service life and maintain efficiency, their quantitative effectiveness requires further validation through long-term experimental studies or advanced numerical models incorporating coating failure mechanics. Therefore, field trials of optimized ASHT prototypes in real marine environments, particularly sediment-rich shallow seas or deep-sea current energy test sites, are envisaged to provide critical validation and operational data under realistic conditions.

Author Contributions

Conceptualization, K.S.; methodology, K.S. and L.W.; software, H.H. and L.W.; validation, H.H.; formal analysis, K.S.; investigation, K.S.; resources, K.S.; data curation, K.S.; writing—original draft preparation, K.S.; writing—review and editing, L.W. and Y.W.; visualization, Y.W.; supervision, Y.W.; project administration, K.S.; funding acquisition, K.S. All authors have read and agreed to the published version of the manuscript.

Funding

This work was supported by the Yunnan Fundamental Research Project (grant no. 202501AT070072), the Yunnan Water Resources and Hydropower Vocational College Research Project (grant no. 2025YSZSYS008), the Yunnan Key Laboratory of Intelligent Logistics Equipment and System (grant no. 202449CE34008), the Yunnan Shen Weiming Academician Workstation (grant no. 202505AF350084), and the Xingdian Talent Support Program of Yunnan Province (grant no. XDYC-QNRC-2023-0159).

Institutional Review Board Statement

Not applicable.

Informed Consent Statement

Not applicable.

Data Availability Statement

The data presented in this study are available on request from thecorresponding author.

Conflicts of Interest

The authors declare no conflicts of interest.

References

  1. Hussain, J.; Rittmann, B.E. Algae as a source of renewable energy: Opportunities, challenges, and recent developments. Sustain. Energy Fuels 2023, 7, 2515–2544. [Google Scholar] [CrossRef]
  2. Imbayah, I.; Hasan, M.; El-Khozondare, H.; Khalee, M.; Alsharif, A.; Ahmed, A.A. Review paper on green hydrogen production, storage, and utilization techniques in Libya. J. Sol. Energy Sustain. Dev. 2024, 13, 1–21. [Google Scholar] [CrossRef]
  3. Matos, T.; Rocha, J.L.; Martins, M.S.; Gonçalves, L.M. Enhancing Sea Wave Monitoring Through Integrated Pressure Sensors in Smart Marine Cables. J. Mar. Sci. Eng. 2025, 13, 766. [Google Scholar] [CrossRef]
  4. Manolache, A.I.; Andrei, G. A comprehensive review of multi-use platforms for renewable energy and aquaculture integration. Energies 2024, 17, 4816. [Google Scholar] [CrossRef]
  5. Reddy, K.B.; Bhosale, A.C.; Saini, R.P. Performance parameters of lift-based vertical axis hydrokinetic turbines-A review. Ocean Eng. 2022, 266, 113089. [Google Scholar] [CrossRef]
  6. Zhang, D.; Guo, P.; Wang, H.; Hu, Q.; Li, J.; Shams, A. Multi-objective optimization of a banki hydrokinetic turbine for deep-sea power supply: Experimental and numerical investigation. J. Clean. Prod. 2024, 441, 140953. [Google Scholar] [CrossRef]
  7. Satrio, D.; Utama, I.K.A.P. Experimental investigation into the improvement of self-starting capability of vertical-axis tidal current turbine. Energy Rep. 2021, 7, 4587–4594. [Google Scholar] [CrossRef]
  8. Gao, R.J.; Chen, J.H.; Zhang, J.J.; Zhou, S.Y.; Xu, H.F.; Wu, J.D.; Qian, X.H. Hydrodynamic study on energy capturing performance of horizontal axis blades under sub-low speed tidal current. China Ocean Eng. 2020, 34, 374–386. [Google Scholar] [CrossRef]
  9. Bakırcı, M.; Yılmaz, S. Theoretical and computational investigations of the optimal tip-speed ratio of horizontal-axis wind turbines. Eng. Sci. Technol. Int. J. 2018, 21, 1128–1142. [Google Scholar] [CrossRef]
  10. Suntivarakorn, R.; Wanchat, S.; Monatrakul, W. An experimental study of electricity generation using a horizontal spiral turbine. Energy Procedia 2016, 100, 532–536. [Google Scholar] [CrossRef]
  11. Monatrakul, W.; Suntivarakorn, R. Effect of blade angle on turbine efficiency of a Spiral Horizontal Axis Hydro Turbine. Energy Procedia 2017, 138, 811–816. [Google Scholar] [CrossRef]
  12. Song, K.; Kang, Y. Fluid-Structure Interactions Analysis of a Drag-Type Horizontal Axis Hydraulic Turbine. J. Phys. Conf. Ser. 2022, 2404, 012001. [Google Scholar] [CrossRef]
  13. Monatrakul, W.; Senawong, K.; Sritram, P.; Suntivarakorn, R. A Comparison Study of Hydro-Compact Generators with Horizontal Spiral Turbines (HSTs) and a Three-Blade Turbine Used in Irrigation Canals. Energies 2023, 16, 2267. [Google Scholar] [CrossRef]
  14. Zhang, D.; Guo, P.; Cheng, Y.; Hu, Q.; Li, J. Analysis of blockage correction methods for high-solidity hydrokinetic turbines: Experimental and numerical investigations. Ocean Eng. 2023, 283, 115185. [Google Scholar] [CrossRef]
  15. Badawy, Y.E.; Nawar, M.A.; Attai, Y.A.; Mohamed, M. Co-enhancements of several design parameters of an archimedes spiral turbine for hydrokinetic energy conversion. Energy 2023, 268, 126715. [Google Scholar] [CrossRef]
  16. Zhang, D.; Guo, P.; Qian, Y.; Qiao, H.; Li, J. Analysis and optimization of a deep-water in-situ power generation system based on novel ductless Archimedes screw hydrokinetic turbines. Renew. Energy 2024, 225, 120235. [Google Scholar] [CrossRef]
  17. Song, K.; Huan, H.T.; Wei, L.C.; Liu, C.X. A comparative study of hydrodynamic performance between ducted and non-ducted Archimedes spiral hydrokinetic turbines. Ocean Eng. 2024, 306, 118087. [Google Scholar] [CrossRef]
  18. Song, K.; Huan, H.T.; Wei, L.C.; Liu, C.X. Investigation of the effect of blade angle of Archimedes spiral hydrokinetic turbine based on hydrodynamic performance and entropy production theory. Ocean Eng. 2025, 324, 120731. [Google Scholar] [CrossRef]
  19. Song, K.; Huan, H.T.; Wei, L.C.; Liu, C.X. Enhancing the Performance of Novel Archimedes Spiral Hydrokinetic Turbines Utilizing Blade Winglets in Deep-Sea Power Generation for Autonomous Underwater Vehicles. Drones 2025, 9, 72. [Google Scholar] [CrossRef]
  20. Gao, Y.; Liu, H.; Lin, Y.; Gu, Y.; Wang, S. Numerical investigation of the erosion behavior in blades of tidal current turbine. J. Renew. Sustain. Energy 2022, 14, 044502. [Google Scholar] [CrossRef]
  21. Padhy, M.K.; Saini, R.P. Study of silt erosion on performance of a Pelton turbine. Energy 2011, 36, 141–147. [Google Scholar] [CrossRef]
  22. Zhou, W.; Chai, J.; Xu, Z.; Cao, C.; Wu, G.; Yao, X. Numerical simulation of solid-liquid two-phase flow and wear prediction of a hydraulic turbine high sediment content. Exp. Tech. 2023, 47, 281–293. [Google Scholar] [CrossRef]
  23. Pereira, G.C.; de Souza, F.J.; de Moro Martins, D.A. Numerical prediction of the erosion due to particles in elbows. Powder Technol. 2014, 261, 105–117. [Google Scholar] [CrossRef]
  24. Mansouri, A.; Arabnejad, H.; Shirazi, S.A.; McLaury, B.S. A combined CFD/experimental methodology for erosion prediction. Wear 2015, 332–333, 1090–1097. [Google Scholar] [CrossRef]
  25. Ying, L.L.; Yao, Y.; Lai, F.; Liu, J.; Ge, W.; Yao, Y. Suspended sediment simulation and water purification scheme research of turbid archipelago. In Proceedings of the OCEANS 2016, Shanghai, China, 10–13 April 2016; pp. 1–5. [Google Scholar]
  26. Sareen, A.; Sapre, C.A.; Selig, M.S. Effects of leading edge erosion on wind turbine blade performance. Wind Energy 2014, 17, 1531–1542. [Google Scholar] [CrossRef]
  27. Wang, J.; Gao, J.; Zhang, Y.; Cui, H. Analysis of the Sand Erosion Effect and Wear Mechanism of Wind Turbine Blade Coating. Energies 2024, 17, 413. [Google Scholar] [CrossRef]
  28. Eisenberg, D.; Laustsen, S.; Stege, J. Wind turbine blade coating leading edge rain erosion model: Development and validation. Wind Energy 2018, 21, 942–951. [Google Scholar] [CrossRef]
  29. Herring, R.; Dyer, K.; Martin, F.; Ward, C. The increasing importance of leading edge erosion and a review of existing protection solutions. Renew. Sustain. Energy Rev. 2019, 115, 109382. [Google Scholar] [CrossRef]
  30. Peng, W.; Cao, X. Numerical simulation of solid particle erosion in pipe bends for liquid–solid flow. Powder Technol. 2016, 294, 266–279. [Google Scholar] [CrossRef]
  31. McLaury, B.S.; Shirazi, S.A.; Shadley, J.R.; Rybicki, E.F. Modeling erosion in chokes. ASME-Publ.-Fed 1996, 236, 773–782. [Google Scholar]
  32. Shen, Z.; Chu, W.; Li, X.; Dong, W. Sediment erosion in the impeller of a double-suction centrifugal pump–A case study of the Jingtai Yellow River Irrigation Project, China. Wear 2019, 422–423, 269–279. [Google Scholar] [CrossRef]
  33. Grant, G.; Tabakoff, W. Erosion prediction in turbomachinery resulting from environmental solid particles. J. Aircr. 1975, 12, 471–478. [Google Scholar] [CrossRef]
  34. Menter, F.R. Two-equation eddy-viscosity turbulence models for engineering applications. AIAA J. 1994, 32, 1598–1605. [Google Scholar] [CrossRef]
  35. Zahari, N.M.; Zawawi, M.H.; Sidek, L.M.; Mohamad, D.; Itam, Z.; Ramli, M.Z.; Rashid, M. Introduction of discrete phase model (DPM) in fluid flow: A review. In AIP Conference Proceedings; AIP Publishing LLC: New York, NY, USA, 2018; p. 020234. [Google Scholar]
  36. Chang, P.; Xu, G.; Zhou, F.; Mullins, B.; Abishek, S. Comparison of underground mine DPM simulation using discrete phase and continuous phase models. Process Saf. Environ. Prot. 2019, 127, 45–55. [Google Scholar] [CrossRef]
  37. Lawson, M.J.; Li, Y.; Sale, D.C. Development and verification of a computational fluid dynamics model of a horizontal-axis tidal current turbine. In Proceedings of the International Conference on Offshore Mechanics and Arctic Engineering, Rotterdam, The Netherlands, 19–24 June 2011; pp. 711–720. [Google Scholar]
  38. Moshfeghi, M.; Shams, S.; Hur, N. Aerodynamic performance enhancement analysis of horizontal axis wind turbines using a passive flow control method via split blade. J. Wind Eng. Ind. Aerodyn. 2017, 167, 148–159. [Google Scholar] [CrossRef]
  39. Al-Dabbagh, M.A.; Yuce, M.I. Numerical evaluation of helical hydrokinetic turbines with different solidities under different flow conditions. Int. J. Environ. Sci. Technol. 2019, 16, 4001–4012. [Google Scholar] [CrossRef]
  40. Moshfeghi, M.; Song, Y.J.; Xie, Y.H. Effects of near-wall grid spacing on SST-K-ω model using NREL Phase VI horizontal axis wind turbine. J. Wind Eng. Ind. Aerodyn. 2012, 107–108, 94–105. [Google Scholar] [CrossRef]
  41. Kamal, A.M.; Nawar, M.A.; Attai, Y.A.; Mohamed, M.H. Blade design effect on Archimedes Spiral Wind Turbine performance: Experimental and numerical evaluations. Energy 2022, 250, 123892. [Google Scholar] [CrossRef]
  42. Kumar, P.; Singal, S.K.; Gohil, P.P. A technical review on combined effect of cavitation and silt erosion on Francis turbine. Renew. Sustain. Energy Rev. 2024, 190, 114096. [Google Scholar] [CrossRef]
  43. Patel, K.; Desai, J.; Chauhan, V.; Charnia, S. Development of Francis turbine using computational fluid dynamics. In Proceedings of the 11st Asian International Conference on Fluid Machinery and 3rd Fluid Power Technology Exhibition, Chennai, India, 21–23 November 2011; pp. 1–3. [Google Scholar]
  44. Noon, A.A.; Kim, M.H. Erosion wear on Francis turbine components due to sediment flow. Wear 2017, 378–379, 126–135. [Google Scholar] [CrossRef]
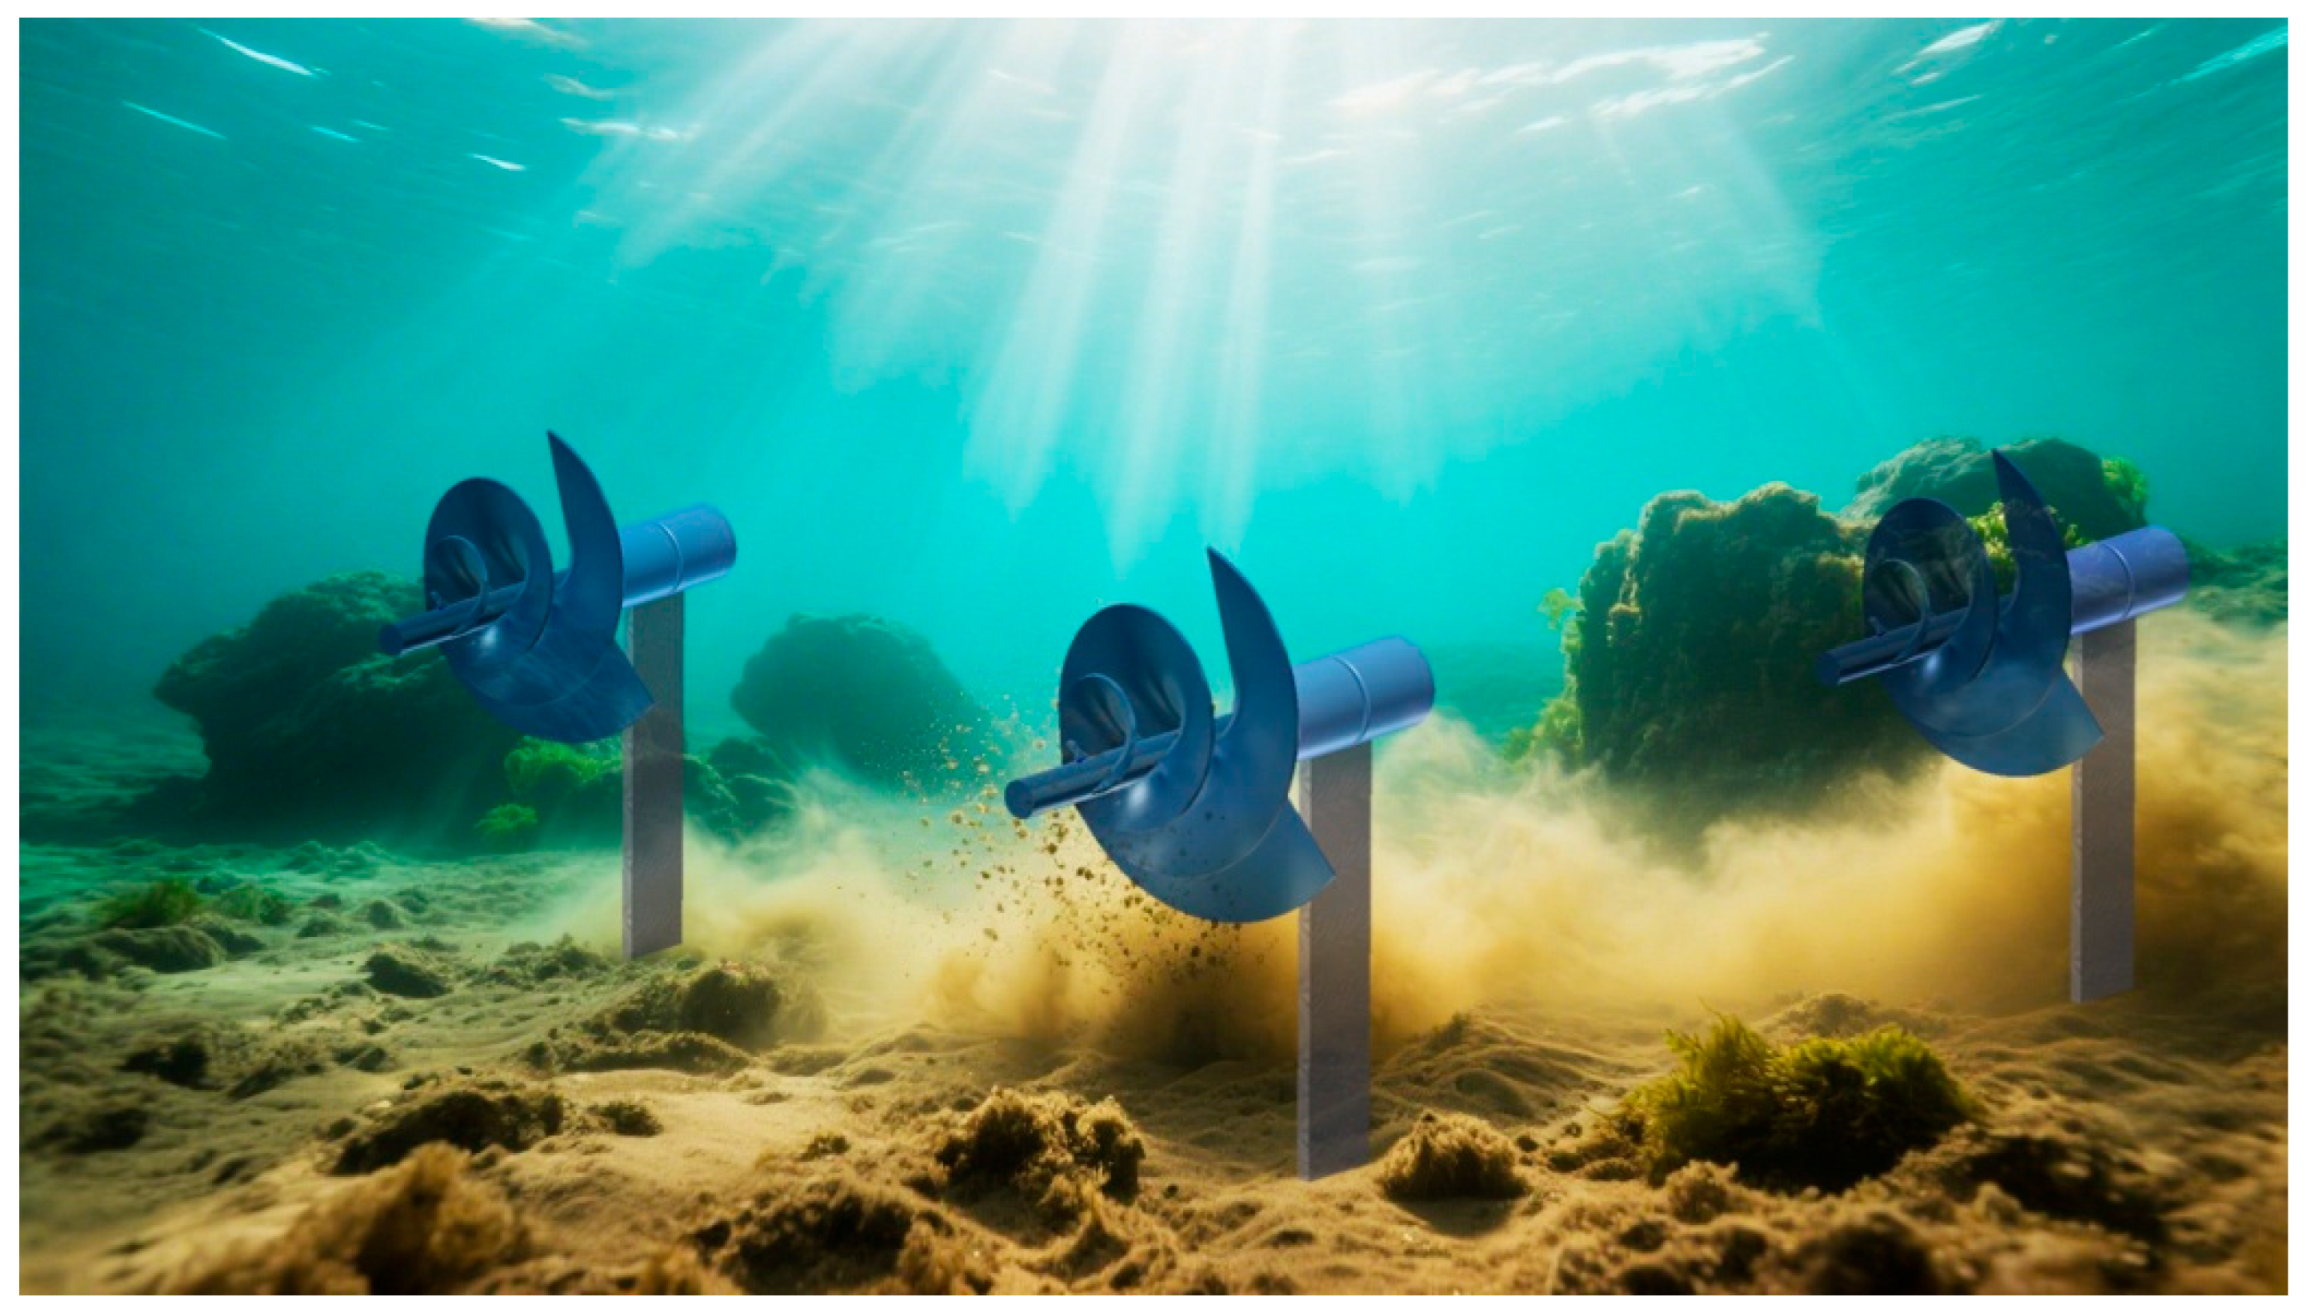
Figure 1. Schematic diagram of ASHTs in a sediment-laden sea environment.
Jmse 13 01707 g001
Figure 2. Schematic view of an ASHT of 90-90-90.
Jmse 13 01707 g002
Figure 3. Computational domain of an AHST.
Jmse 13 01707 g003
Figure 4. Volume mesh and surface mesh around an ASHT.
Jmse 13 01707 g004
Figure 5. Comparison between the experimental value and the CFD value.
Jmse 13 01707 g005
Figure 6. Velocity contours of the ASHTs at a TSR of 1.5: (a) 15-30-45; (b) 30-30-30; (c) 30-45-60; (d) 45-45-45; (e) 45-60-75; (f) 60-60-60; (g) 60-75-90; (h) 75-75-75; (i) 90-90-90.
Jmse 13 01707 g006
Figure 7. Erosion rate curves of ASHTs with sand size at different sand concentrations: (a) SS = 0.2 mm; (b) SS = 0.4 mm; (c) SS = 0.6 mm; (d) SS = 0.8 mm; (e) SS = 1.0 mm.
Jmse 13 01707 g007
Figure 8. Erosion rate distribution of ASHTs with sand size of 0.8 mm at different sand concentrations: (a) SC = 0.4 kg/L; (b) SC= 0.6 kg/L; (c) SC = 0.8 kg/L; (d) SC = 1.0 kg/L; (e) SC = 1.2 kg/L.
Jmse 13 01707 g008
Figure 9. Erosion rate curves of ASHTs with sand concentration at different sand sizes: (a) SC = 0.4 kg/L; (b) SC = 0.6 kg/L; (c) SC = 0.8 kg/L; (d) SC = 1.0 kg/L; (e) SC = 1.2 kg/L.
Jmse 13 01707 g009
Figure 10. Erosion rate distribution of ASHTs with sand concentration of 1.0 kg/L at different sand sizes: (a) SS = 0.2 mm; (b) SS = 0.4 mm; (c) SS = 0.6 mm; (d) SS = 0.8 mm; (e) SS = 1.0 mm.
Jmse 13 01707 g010
Table 1. Summary of fluid, wall, and particle properties.
Description ValueValue
Fluid density1025 kg/m3
Wall materialcarbon steel
Wall density7850
Sand density2650
Sand shapeSpherical
Table 2. Mesh independence assessment.
MeshTotal CellsCPRelative Error%
12,957,9120.1952.50
23,819,8230.2000.99
34,275,3110.2020.98
45,131,2340.2040.49
56,297,2350.2050
Disclaimer/Publisher’s Note: The statements, opinions and data contained in all publications are solely those of the individual author(s) and contributor(s) and not of MDPI and/or the editor(s). MDPI and/or the editor(s) disclaim responsibility for any injury to people or property resulting from any ideas, methods, instructions or products referred to in the content.