Article

Gas Hydrate Exploration Using Deep-Towed Controlled-Source Electromagnetics in the Shenhu Area, South China Sea

by
Jianping Li
1,2,
Zhongliang Wu
1,2,*,
Xi Chen
1,2,
Jian’en Jing
3,
Ping Yu
1,2,
Xianhu Luo
1,2,
Mingming Wen
1,2,
Pibo Su
1,2,
Kai Chen
3,
Meng Wang
3,
Yan Gao
1,2 and
Yao Zhang
1,2
1
Guangzhou Marine Geological Survey, China Geological Survey, Guangzhou 511458, China
2
Key Laboratory of Marine Mineral Resources, Ministry of Natural Resources, Guangzhou 511458, China
3
School of Geophysics and Information Technology, China University of Geosciences, Beijing 100083, China
*
Author to whom correspondence should be addressed.
J. Mar. Sci. Eng. 2025, 13(9), 1665; https://doi.org/10.3390/jmse13091665
Submission received: 18 July 2025 / Revised: 22 August 2025 / Accepted: 28 August 2025 / Published: 29 August 2025

Abstract

This study presents the first application of a deep-towed transmitter–receiver marine controlled-source electromagnetic (TTR-MCSEM) system for gas hydrate exploration in the Shenhu area of the South China Sea. High-resolution electromagnetic data were acquired along a 13 km transect using dynamic source–receiver offsets and a 500 A transmitter. The results reveal the following: (1) unprecedented near-seafloor resolution (20~100 m) for the precise delineation of hydrate-bearing caprock, surpassing conventional ocean-bottom electromagnetic systems; (2) laterally continuous high-resistivity anomalies (~10 Ω·m) extending from the base of the gas hydrate stability zone to the seafloor, which correlate with seismic bottom-simulating reflector (BSR) distributions and suggest heterogeneous hydrate saturation; and (3) fault-controlled fluid migration pathways that supply hydrate reservoirs and lead to seabed methane seepage at structural highs. Through 2D inversion, we show that the inverted resistivity values (~10 Ω·m) are slightly higher than those obtained from resistivity logs (~5 Ω·m). Saturation values derived from inverted resistivity exhibit remarkable consistency with well-log-based measurements. The high efficiency of the system confirms its potential for the transformative quantitative assessment of hydrate systems, seafloor massive sulfides, and marine geohazards.

1. Introduction

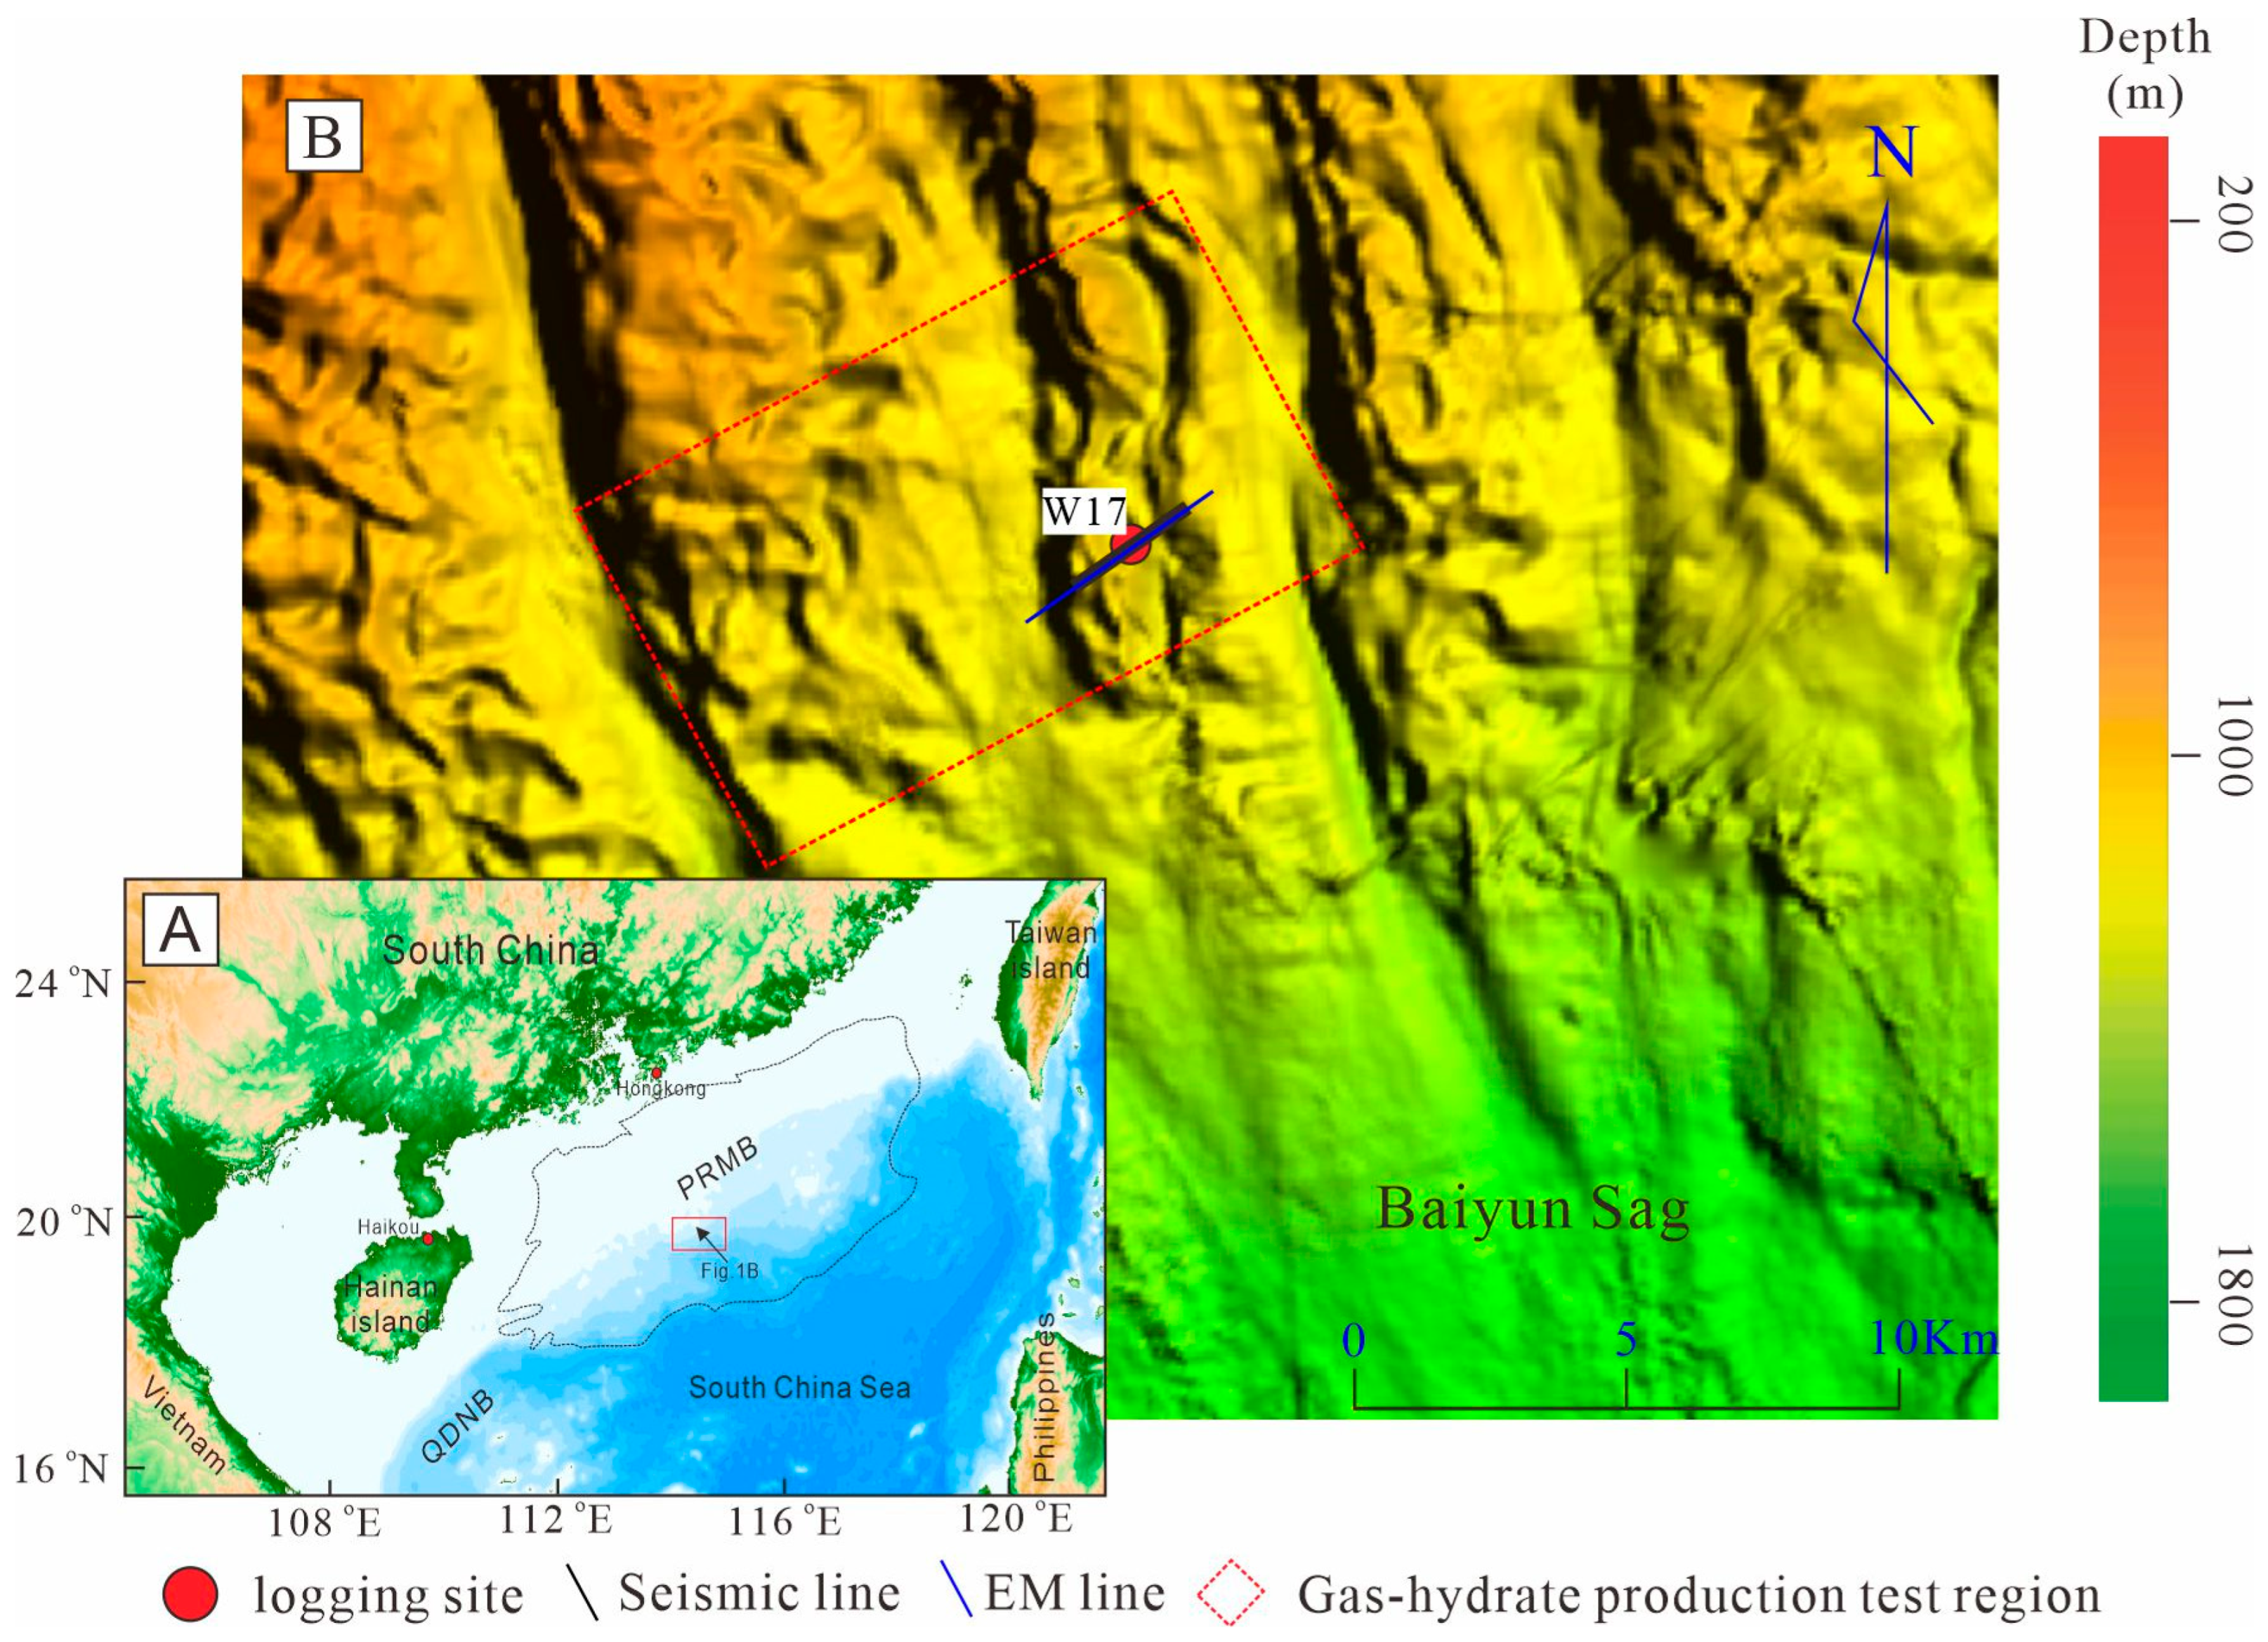
Natural gas hydrates are ice-like compounds composed of methane and water, formed under low-temperature and high-pressure conditions. They are widely distributed in continental margin sediments and permafrost regions worldwide [1]. As a significant potential energy resource and critical environmental factor, gas hydrates have attracted global interest. The Shenhu area, located on the northern slope of the South China Sea and structurally adjacent to the Zhu II Depression of the Pearl River Mouth Basin, is a key target for marine gas hydrate exploration in China (Figure 1A). Due to rapid neogene sedimentation, high hydrocarbon generation potential, and active deep fluid migration along faults, the Shenhu area hosts a unique gas hydrate accumulation system [2,3]. Since 2007, the Guangzhou Marine Geological Survey (GMGS, Guangzhou, China) has conducted three drilling expeditions (GMGS1, GMGS3, and GMGS4), recovering high-saturation hydrate samples. In 2018, China’s first offshore gas hydrate production test was conducted here in silt-clay sequences [4].
Geophysical techniques—including seismic, controlled-source electromagnetic (CSEM) and gravity methods—provide critical constraints for mapping sub-seafloor sediment architectures and identifying zones with anomalous physical properties [5]. Among these, the seismic-derived bottom-simulating reflector (BSR) is a key indicator of gas hydrate presence, typically marking the base of the gas hydrate stability zone (GHSZ) within sedimentary sequences [6]. However, extensive well-log data from global hydrate exploration campaigns reveal that BSR occurrence alone is insufficient to confirm hydrate presence, as it exhibits false-positive rates exceeding 40% on passive continental margins [7].
Seismic methods have dominated gas hydrate exploration in the South China Sea, providing high-resolution structural images and identifying key indicators such as BSRs, amplitude blanking zones, and velocity anomalies [8,9,10,11]. However, under complex geological conditions, seismic data often struggle to resolve shallow hydrate reservoirs and fluid migration pathways simultaneously. In contrast, controlled-source electromagnetics (CSEM) exhibits high sensitivity to resistive anomalies (e.g., hydrates) and offers superior resolution compared to potential-field methods, making it a vital non-seismic tool for marine exploration [12,13,14,15,16]. CSEM is particularly effective in delineating the upper boundary of the hydrate stability zone [17] and vertical hydrate distribution [18], with demonstrated success in hydrate surveys [19,20,21,22,23,24]. Significant progress has been made in China regarding the application of marine CSEM for gas hydrate exploration and structural imaging [25,26,27,28,29].
Figure 1. (A) Geographical location of the Shenhu area in the Pearl River Mouth Basin (PRMB) of the northern South China Sea (SCS); (B) submarine geomorphology and locations of boreholes drilled in the trial production gas hydrate reservoir in the Shenhu area. The dashed box indicates the gas hydrate production test site, the black line represents the seismic line, and the blue line indicates the marine CSEM line (modified from Zhang, 2020 [9]).
Jmse 13 01665 g001
There are two primary marine CSEM approaches: (1) traditional ocean-bottom electromagnetics (OBEM), in which a horizontal electric dipole source is towed 20–100 m above the seafloor and receivers are deployed on the seabed; and (2) fully towed marine CSEM (TTR-MCSEM), in which both transmitters and receivers are towed near the seafloor. TTR-MCSEM offers two key advantages: (i) enhanced navigation accuracy that reduces positional uncertainty—a major limitation in long-offset CSEM inversion [30]—and improves survey efficiency [31,32,33,34]; and (ii) higher near-seafloor resolution, despite shallower penetration compared to OBEM, as demonstrated in hydrate explorations in the Black Sea and North Sea [19,35,36]. Beyond deepwater applications, towed CSEM systems also show significant advantages in shallow-water exploration [37]. Their high-resolution capabilities have enabled the successful detection of submarine freshwater reservoirs, particularly through resistivity contrasts exceeding 20 Ω·m between saline pore fluids and freshwater lenses [38,39].

2. Geologic Setting

The study area is situated within the Baiyun Sag in the southern part of the Pearl River Mouth Basin (PRMB) (Figure 1B), a major hydrocarbon-bearing depocenter on the northern slope of the South China Sea. Tectonically, the sag has evolved through two main phases: (1) a syn-rift phase from the Late Cretaceous/Paleogene to the Early Oligocene, subdivided into three episodes [8], and (2) a post-rift phase from the Late Oligocene to the present (Figure 1B). The Dongsha Event (~10.5 Ma, associated with the Taiwan Orogeny) represents the youngest significant tectonic episode, while Pliocene–Pleistocene tectonic quiescence facilitated optimal gas hydrate accumulation and preservation [40]. This regime is characterized by differential subsidence and sediment loading between depocenters and flanks, with submarine fans and gravity-flow sands constituting the primary hydrate reservoirs [8]. Importantly, multiple faults transect the gas hydrate stability zone [3], influencing fluid migration pathways.
The sediments hosting gas hydrates in the study area comprise four distinct lithotypes: siliceous–calcareous clayey silt, calcareous–siliceous clayey silt, calcareous silt, and calcareous clayey silt. Free gas accumulates predominantly as dispersed phases within the gas hydrate stability zone (GHSZ), with limited migration along fault conduits [2,3]. Notably, gas chimneys identified beneath the stability zone lack overlying fault development (Figure 1B), promoting the formation of dispersed hydrate morphologies. Both shallow biogenic and deep thermogenic gases migrate to the base of the GHSZ, diffusing into sediment pore spaces. The absence of fracture networks facilitates heterogeneous hydrate accumulation. Core sampling at site W17—targeting intervals from the seafloor to 50–100 m below seismically imaged bottom-simulating reflectors (BSRs)—was guided by log response anomalies from pilot wells [10]. Fifteen additional sites exhibited hydrate indicators in logging-while-drilling (LWD) data. At Station W17 (water depth: 1465–1475 m), analyses of core samples and infrared thermography (1490–1510 m; Figure 2) revealed that calcareous clayey medium-to-coarse silts host finely disseminated hydrate particles. Key sedimentary structures include lenticular, soup-like, and porridge-type morphologies, with subcooling anomalies (ΔT = 10–12 °C) confirming in situ dissociation. Importantly, the hydrates show homogeneous pore-space distribution, indicating uniform saturation regimes [11].

3. Data Acquisition

From September 9 to 17, 2024, GMGS conducted a TTR-MCSEM trial in the Shenhu hydrate zone aboard the R/V Haiyang Dizhi SiHao. This survey represents the first deep-towed CSEM study in this area. The 13.0 km line (Figure 1B), oriented at 58.5°, crossed the validated hydrate-rich Well W17 within the gas hydrate production test site [4]. The TTR-MCSEM system was jointly developed by GMGS and the China University of Geosciences (Beijing), building upon existing research equipment [41,42,43,44]. As shown in Figure 2, the system consists of a deck unit (step-up transformer, communication module, and server), a towed transmitter (high-voltage delivery system, chopping circuit, and 500 A output), and towed receivers (axial electric field sensors). The transmitter is equipped with a depressor, transformer, control unit, low-impedance antenna, altimeter, and ultra-short baseline (USBL) beacon.
The transmitting system is also equipped with remote telemetry, transmitted current acquisition, power supply management, attitude and orientation acquisition, altitude monitoring above the seabed, acoustic communication with the towfish tail marker, transmitted voltage acquisition, and auxiliary data acquisition [41]. The towed receiver system comprises a deck control unit, a towed master acquisition station, multiple slave electromagnetic acquisition stations, a neutrally buoyant cable, and a tail buoy. It supports connectivity with up to five slave nodes. Each slave node measures and records the axial electric field component along with motion attitude data. The deck control unit facilitates power control, GPS timing, and data monitoring. The master acquisition station is responsible for command transmission, time synchronization, data storage and uplink, and power management. Each slave acquisition station integrates a low-noise electric field sensor, a data acquisition module, an altimeter, and a motion sensor. The acquisition stations are interconnected via the neutrally buoyant cable, enabling real-time bidirectional communication of commands and data [42]. The master node aggregates data packets from all slave stations and transmits them to the deck unit via a fiber-optic cable. A PC can access the deck unit through an Ethernet connection. The deck unit and the master acquisition station are linked by an electro-optical deep-tow cable, which integrates three optical fibers and 220 VAC power transmission. This cable supplies 220 VAC power and Ethernet connectivity to the subsea acquisition stations. The master acquisition station primarily performs AC/DC and electro-optical conversion, providing Ethernet communication and 48 VDC power to the downstream slave stations while simultaneously recording attitude, altitude, and depth information [43,44].
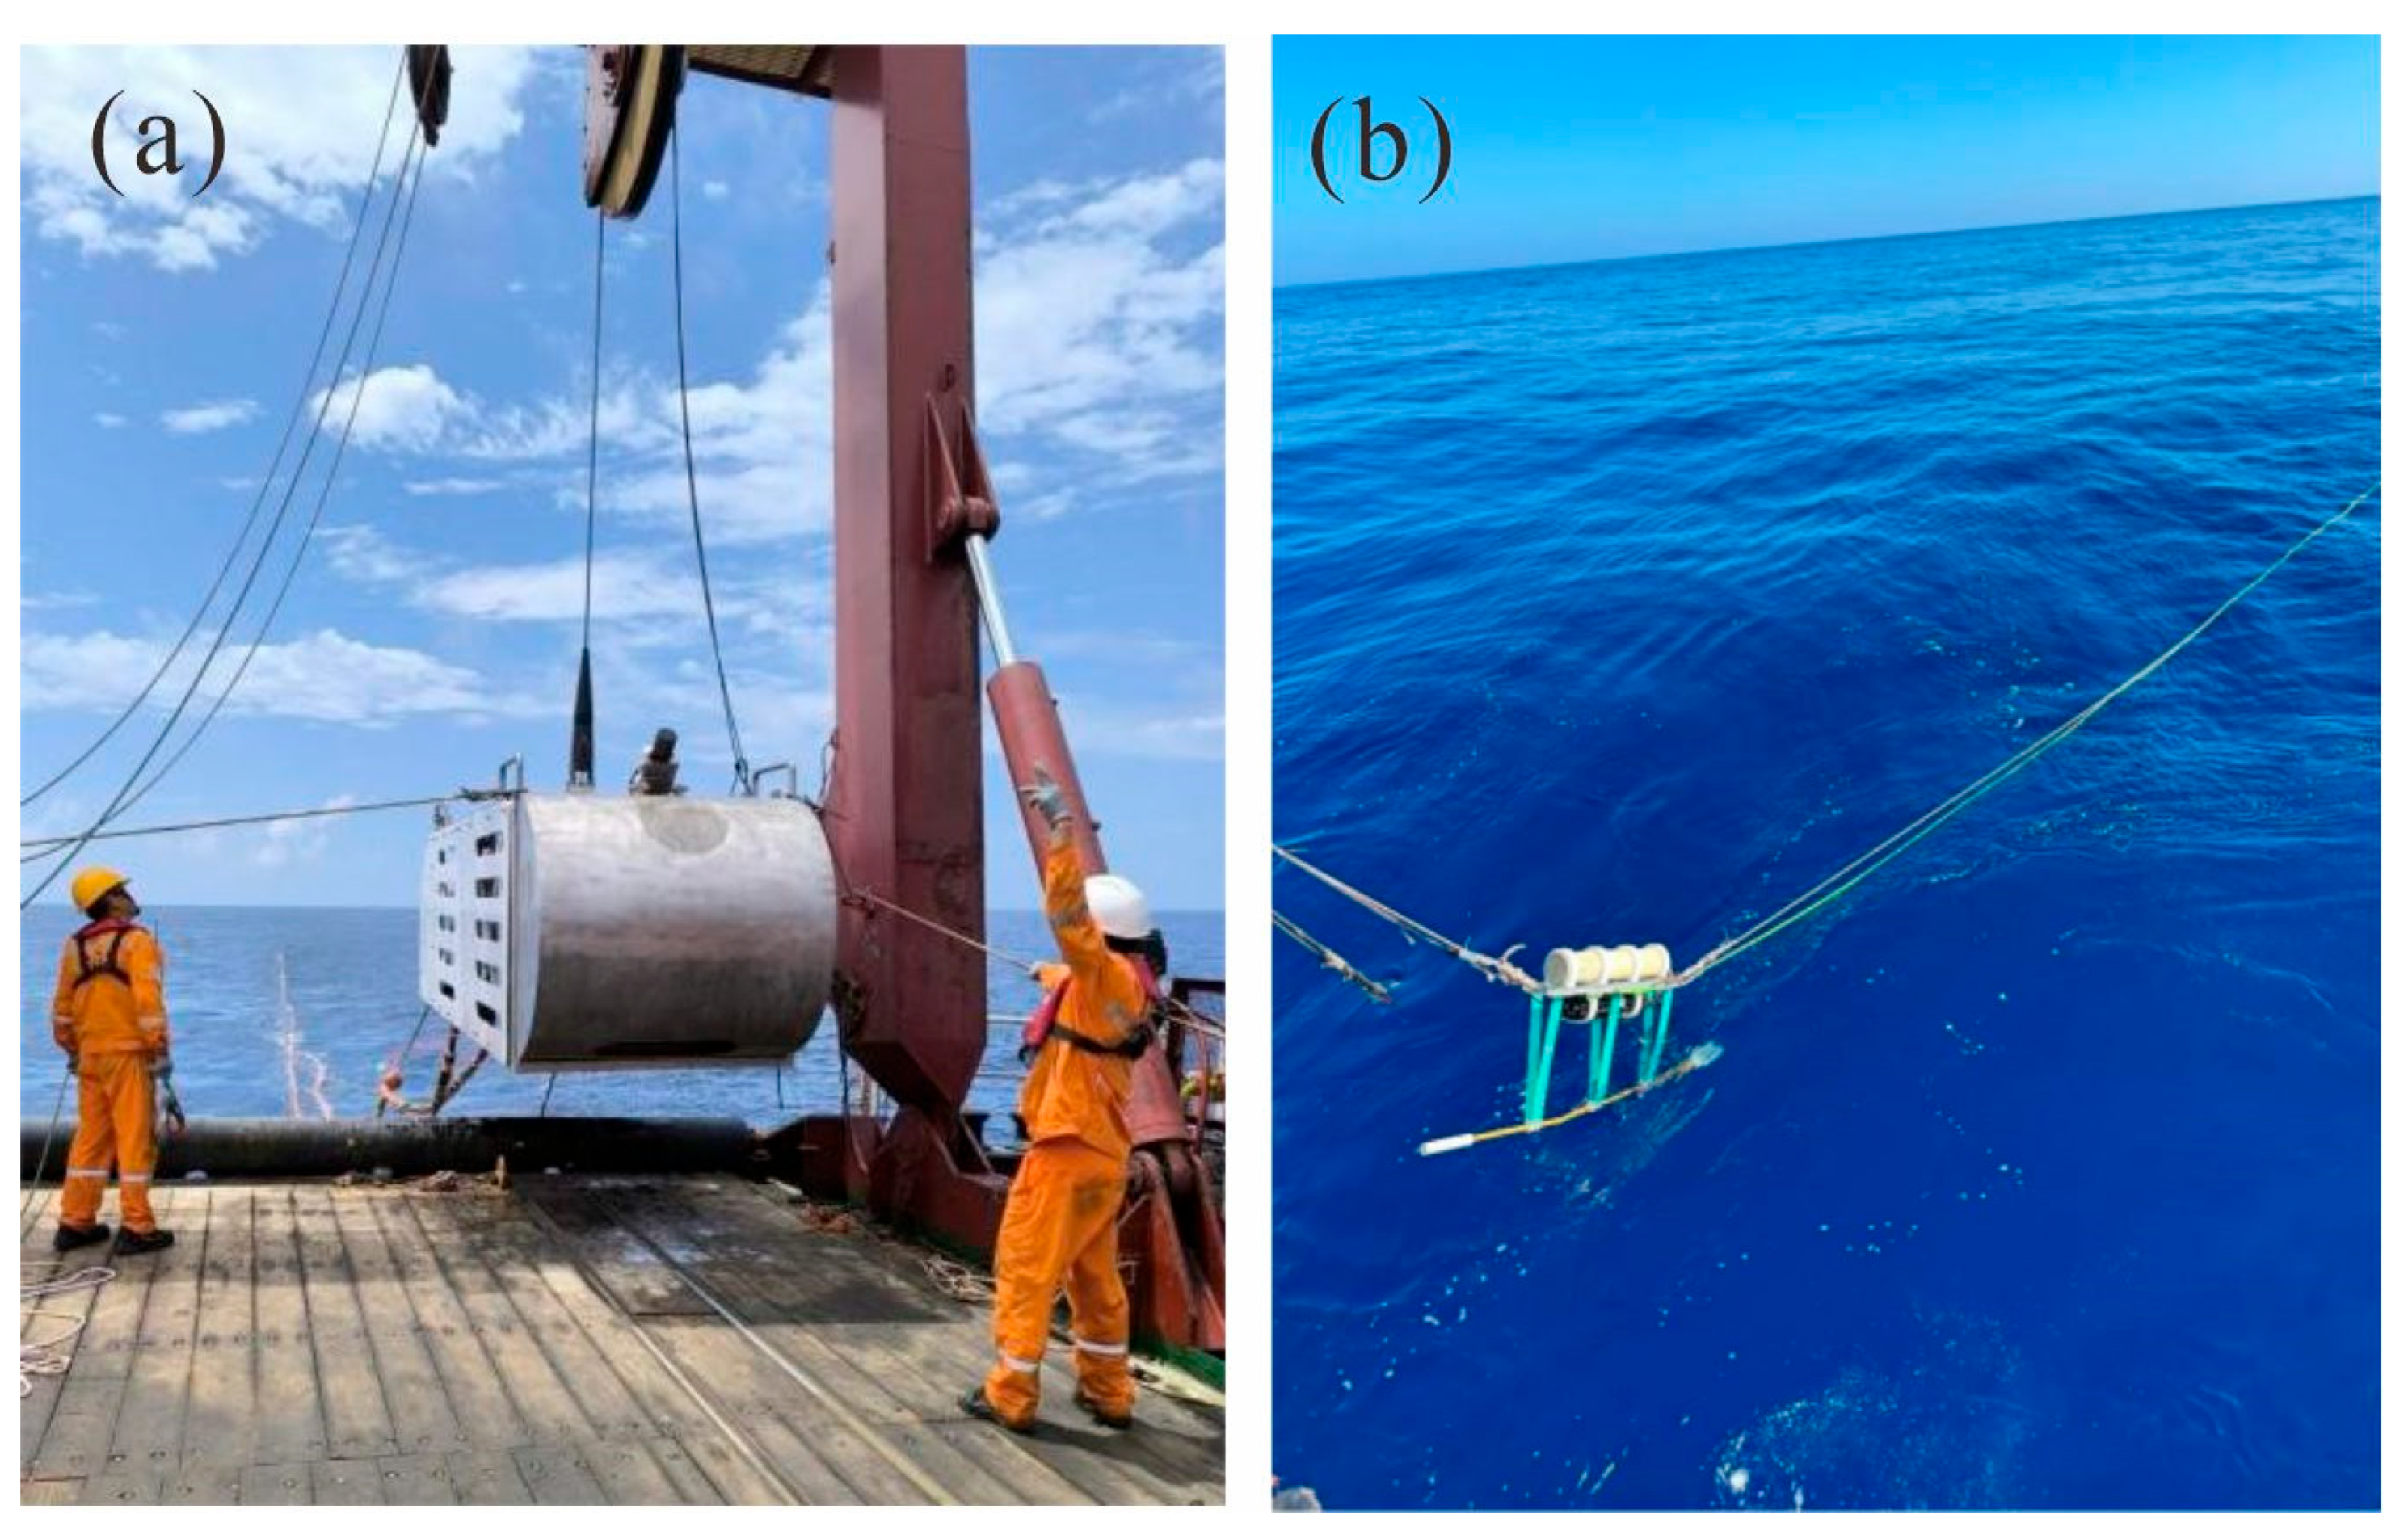
The TTR-MCSEM acquisition system was designed with reference to the Vulcan system [31]. The transmitter broadcast a 500 A “waveform-D” [45] at a fundamental frequency of 0.5 Hz using a 100 m antenna, yielding a dipole moment of 50 kA·m. A stable tow altitude of 50 ± 10 m above the seafloor was maintained (Figure 3a). Three axial electric field receiver nodes were towed at fixed offsets of 346 m (R1), 396 m (R2), and 446 m (R3) behind the transmitter. Each EM receiver recorded the inline horizontal electric field on a 2 m dipole at a sampling rate of 1000 Hz to capture full-spectrum CSEM responses (Figure 3b). After completing the towed-source transmission, all deployed electromagnetic receivers were recovered, and time-series data of the artificially generated electromagnetic fields were successfully acquired from 15 survey stations.
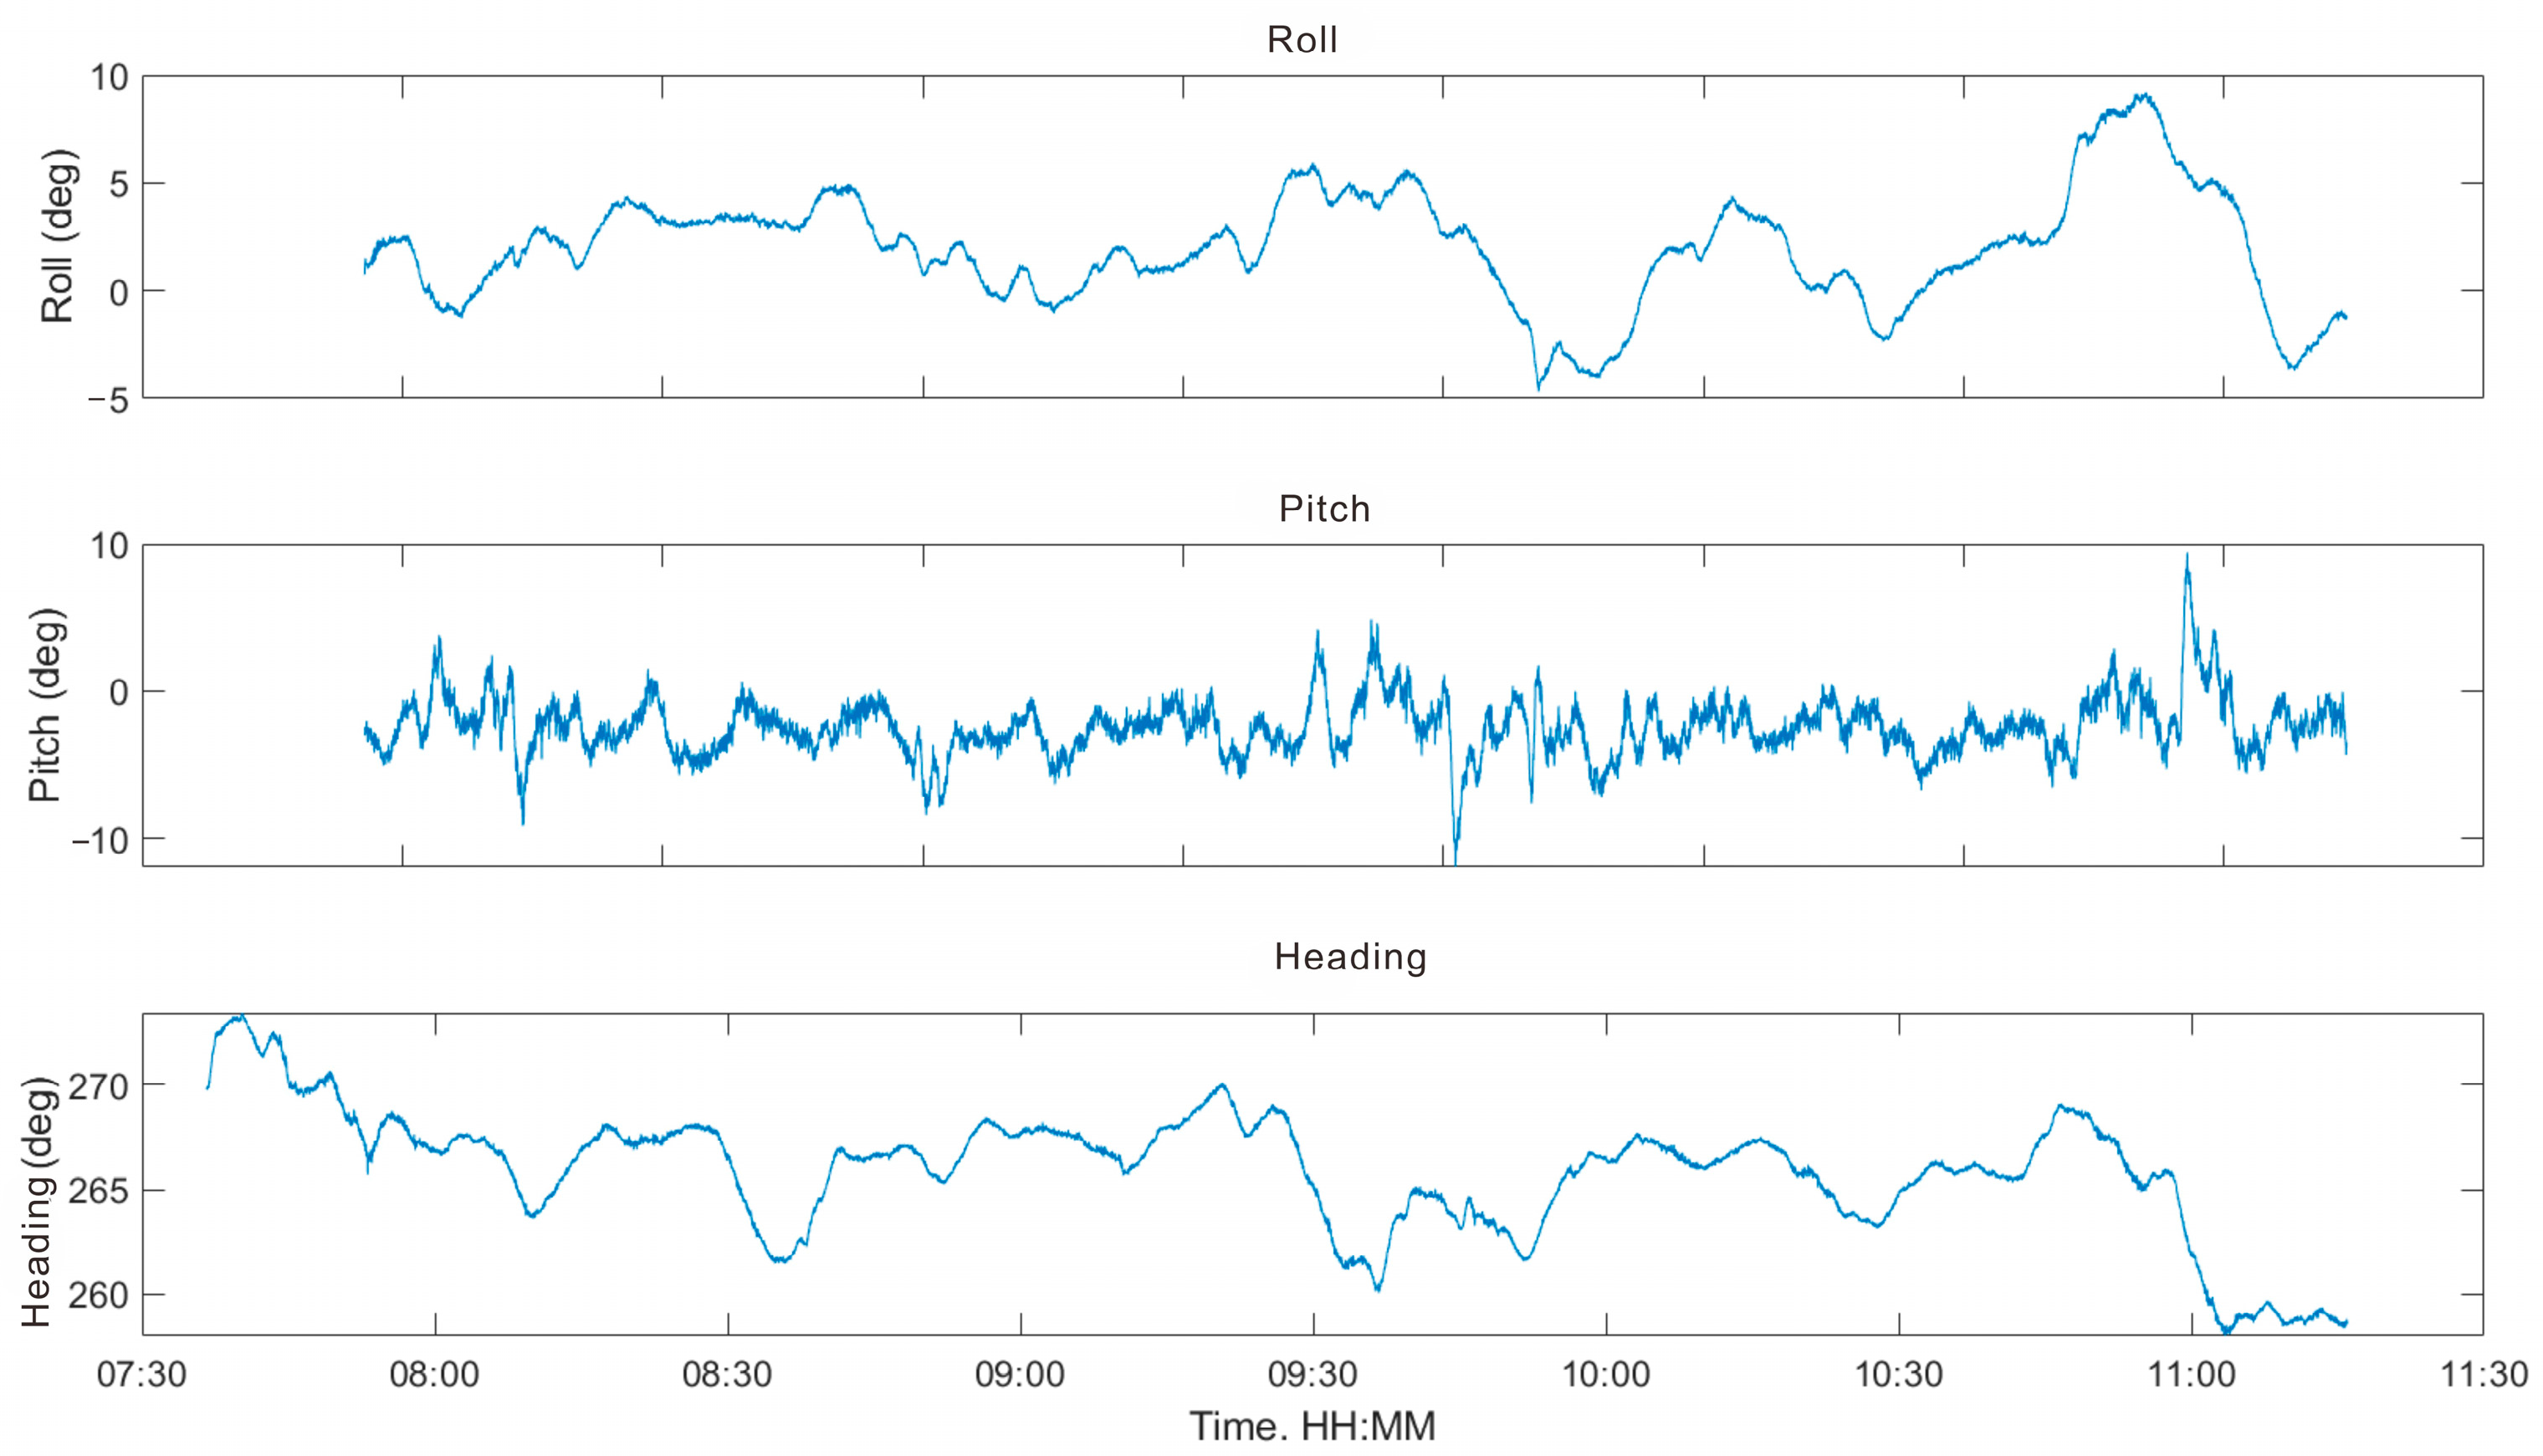
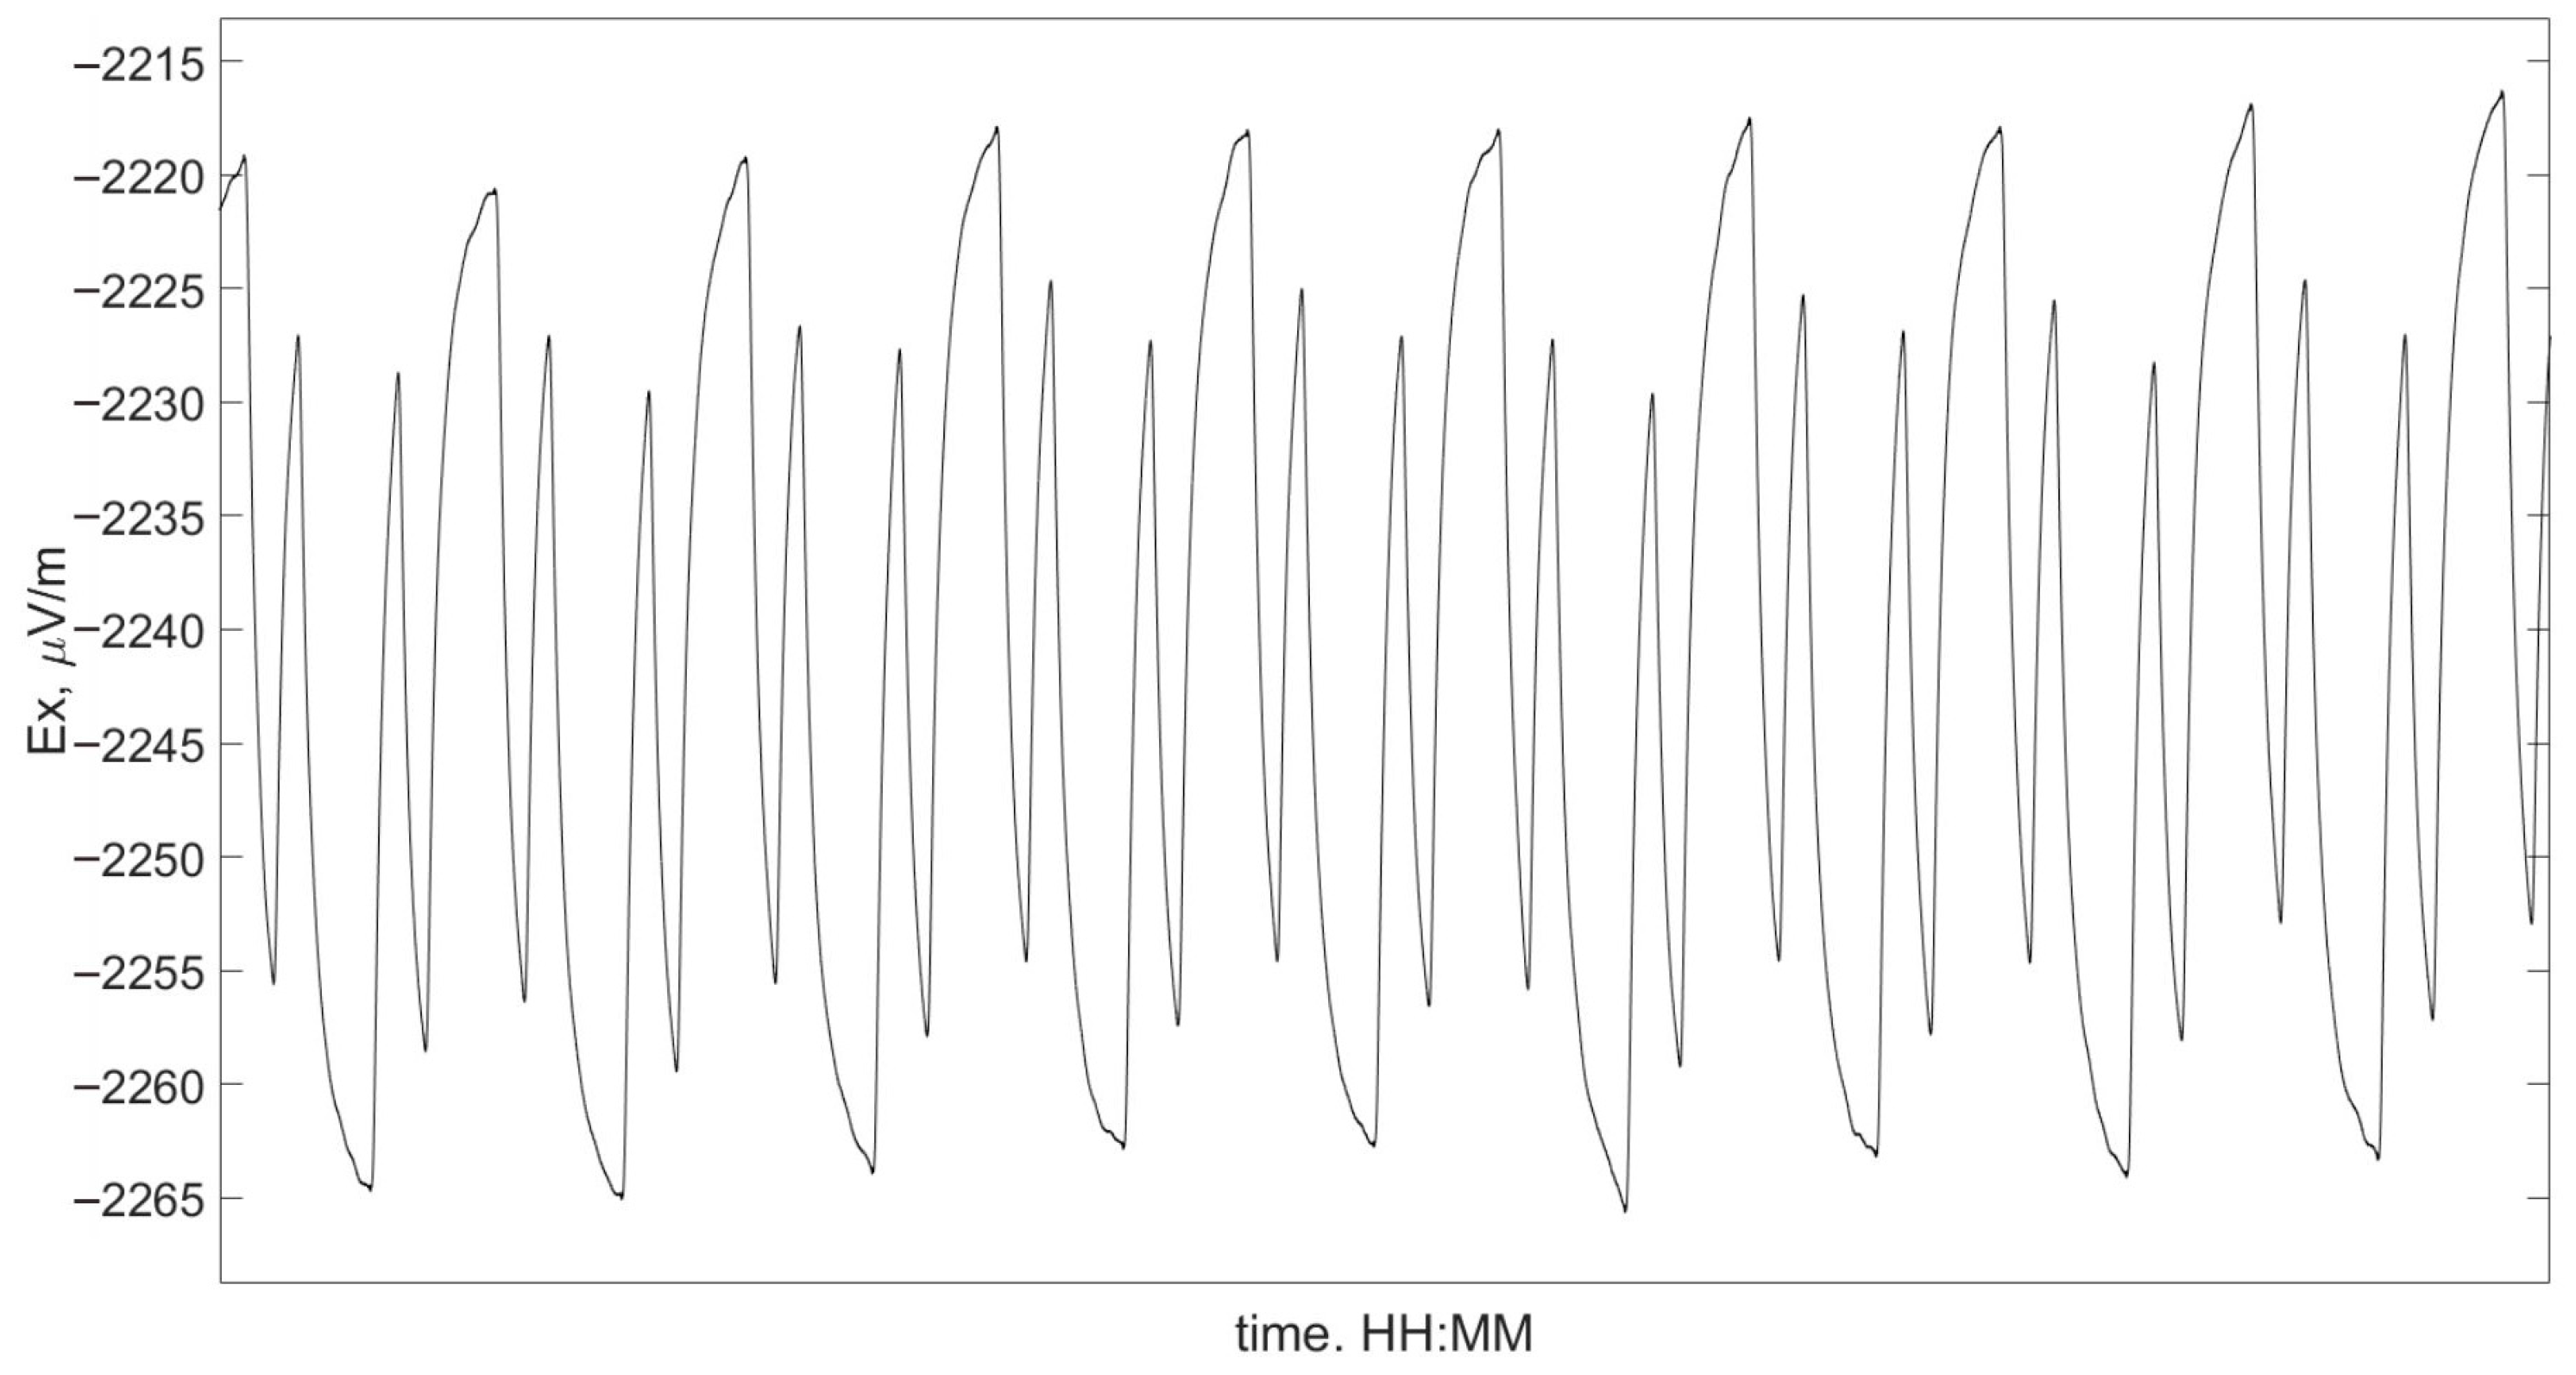
The system maintained a mean towing velocity of 1.0 m/s (2 knots), with variations within ±0.1 knot. Precise transmitter positioning was achieved using inverted long-baseline (iLBL) acoustic navigation, ensuring spatial uncertainties of less than 1 m, which is critical for preserving long-offset amplitude integrity. Attitude sensors on the receivers (Figure 4) recorded roll, pitch, and yaw for motion correction, while pressure sensors monitored depth. These data were used in the inversion process to improve accuracy. A segment of electric field time-series data was extracted from the raw dataset, and the corresponding curve is plotted in Figure 5. As shown, the artificially generated electric field exhibits a smooth sinusoidal waveform, indicating high data quality.

4. Data Processing and Inversion

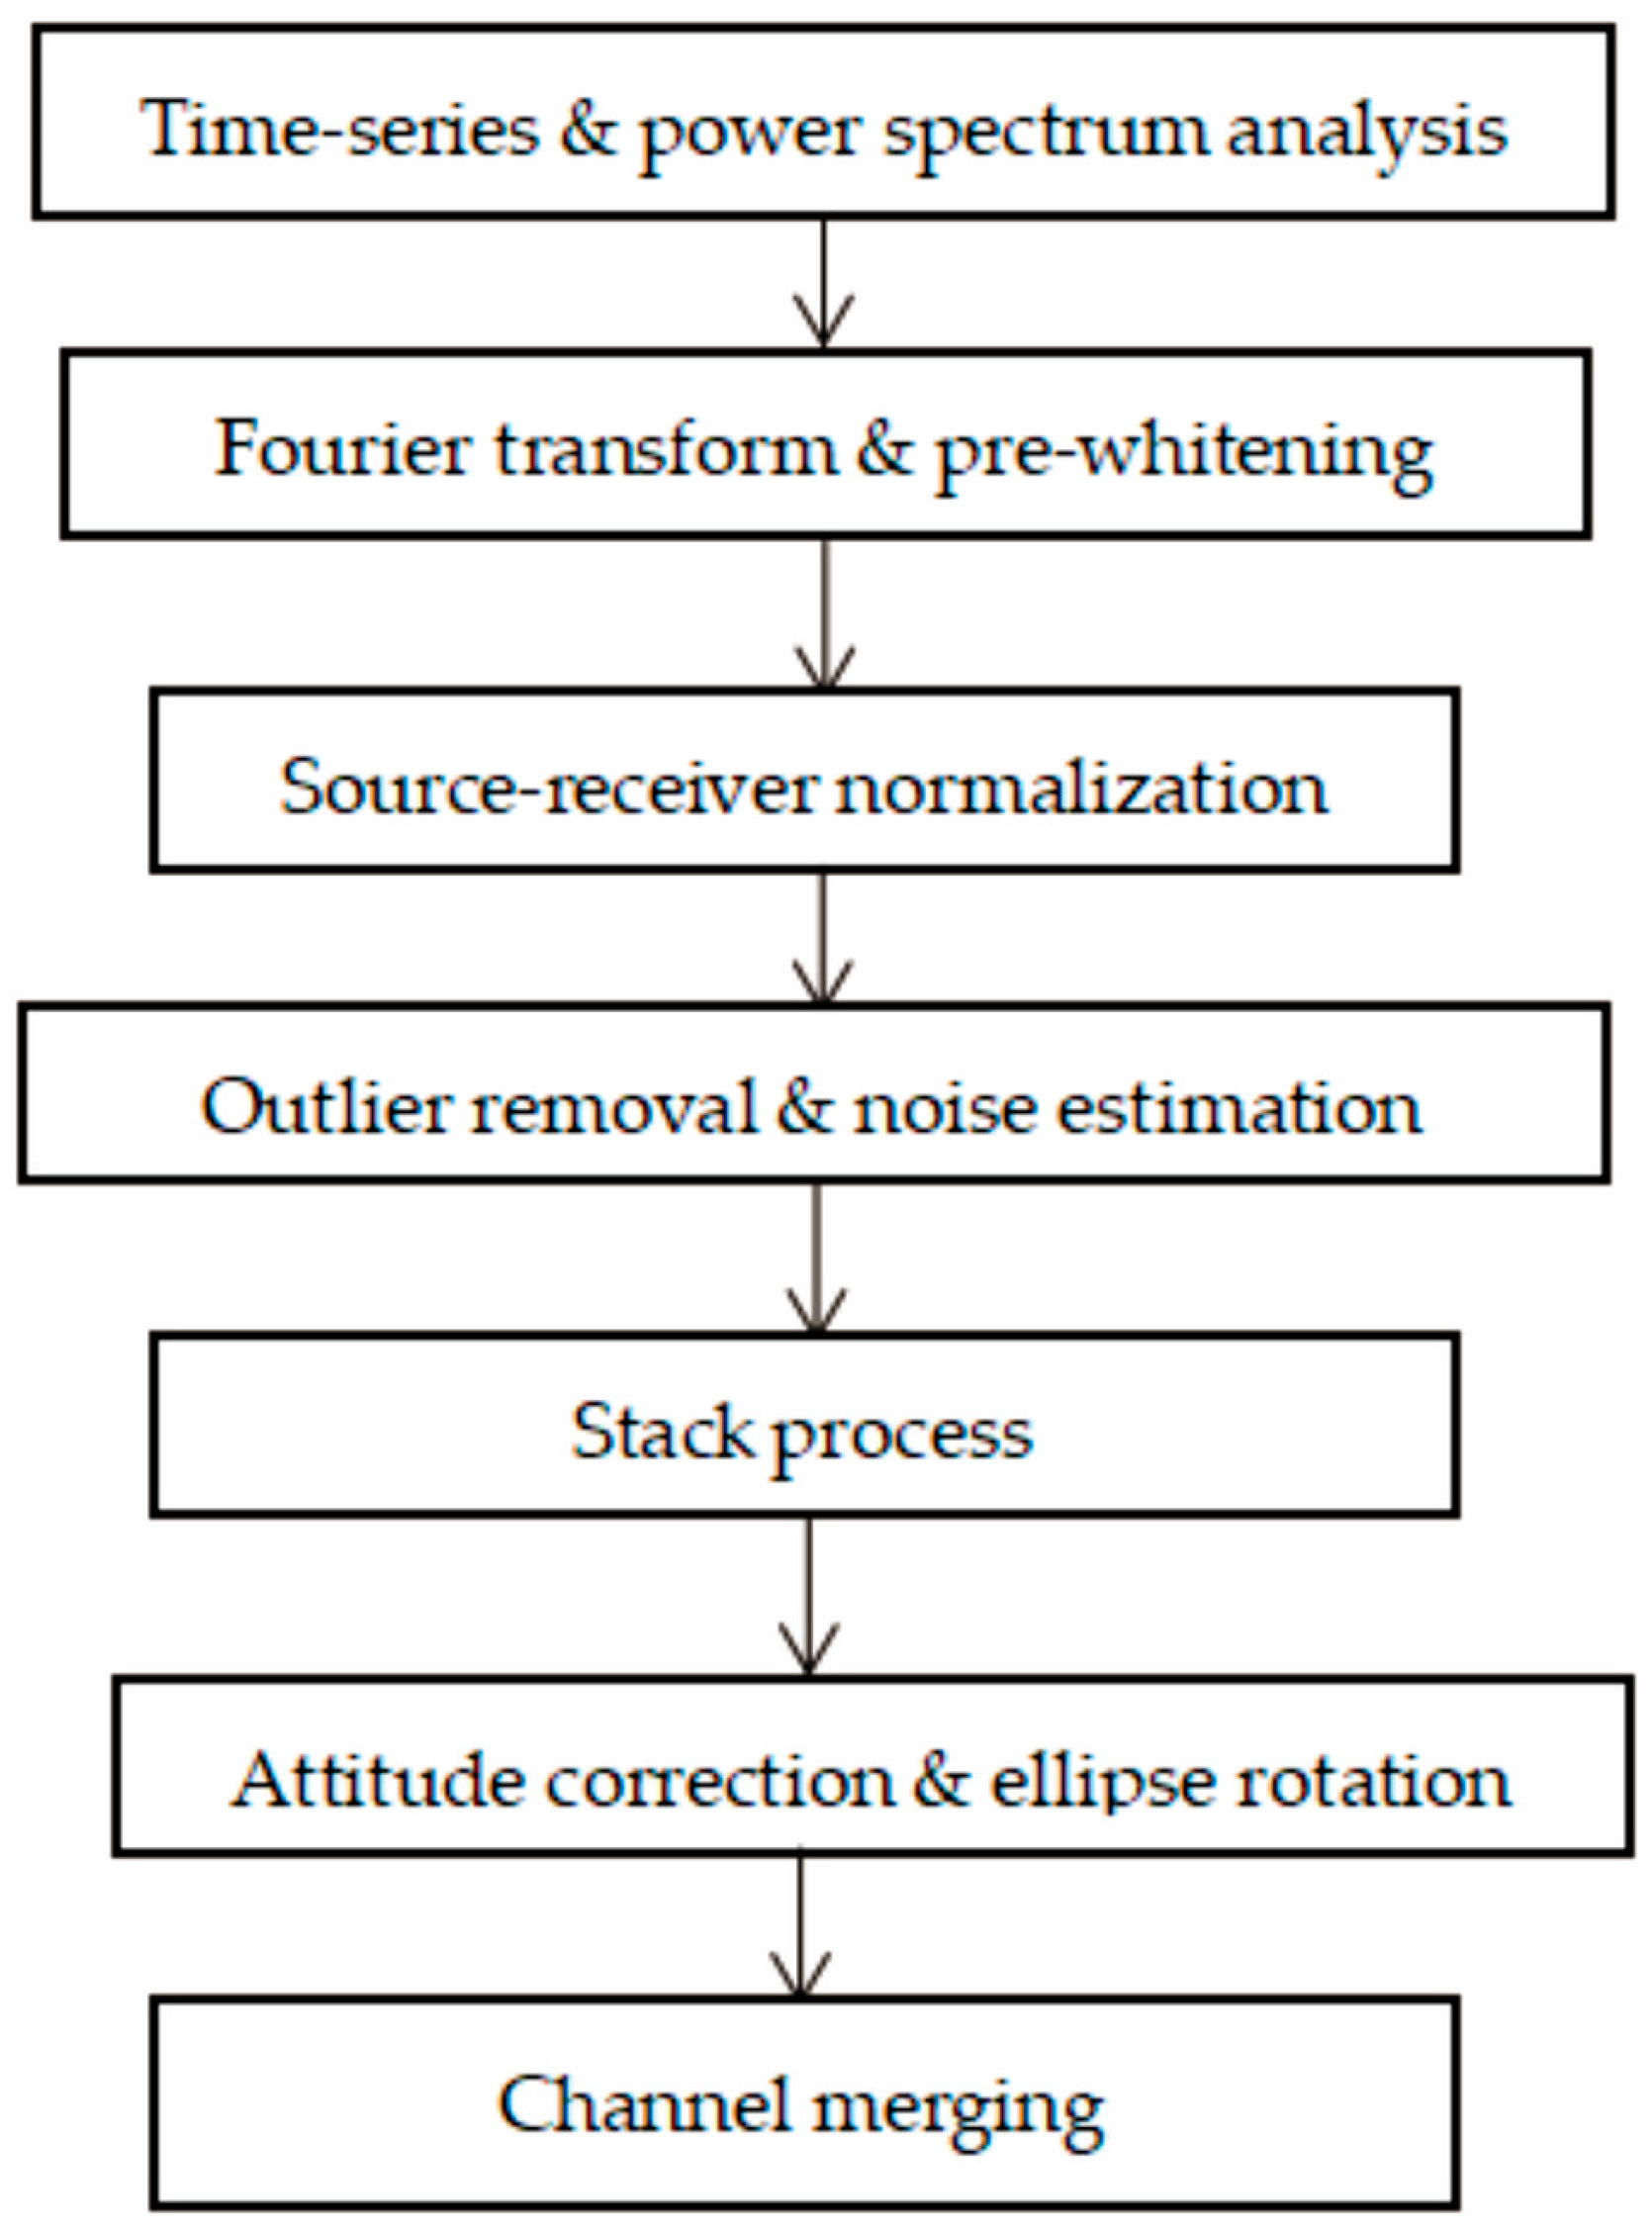
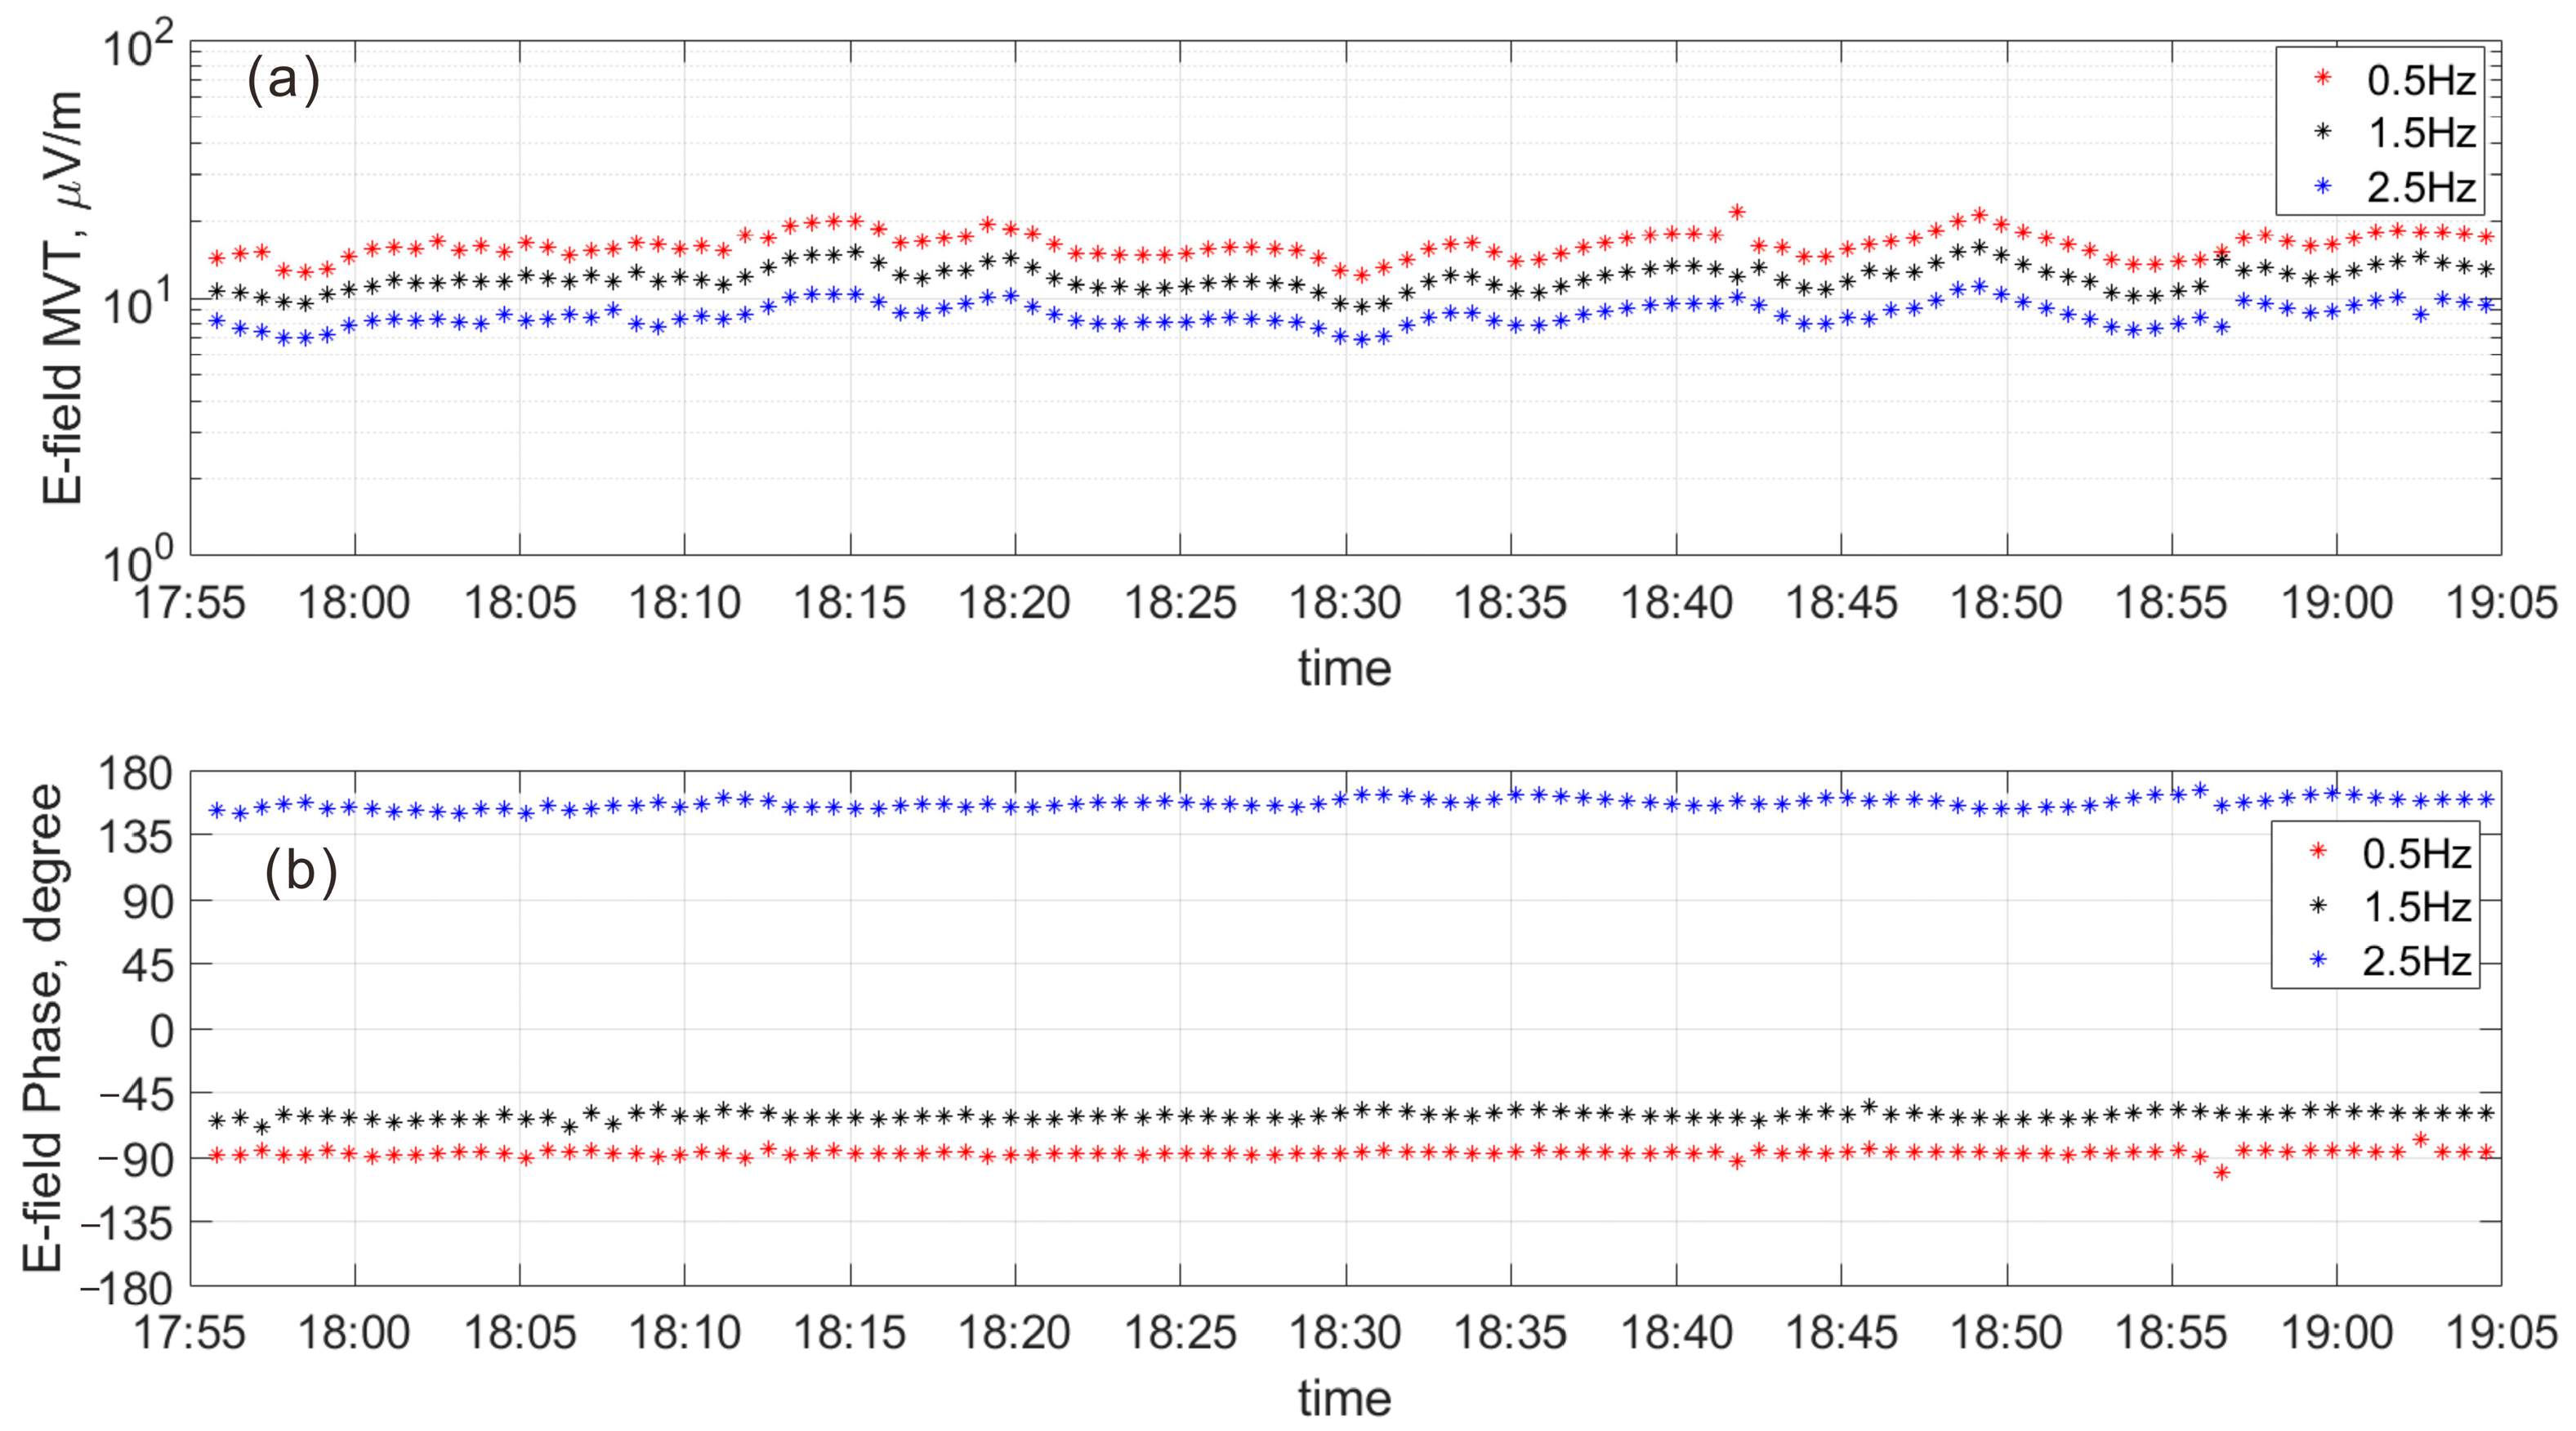
For preprocessing the marine CSEM data, we adopted a method based on the Fast Fourier Transform (FFT) as introduced by Myer et al. (2011) [45]. The data processing workflow is summarized in Figure 6 [46]. First, the Fourier spectrum of the electromagnetic field time series was computed via FFT to obtain the amplitude and phase. In the frequency domain, the frequency response function of the acquisition circuitry was determined through calibration. This calibration information was then used to correct the amplitude and phase of the electric field after FFT processing, yielding the true electric field data. The same method was applied to compute the amplitude and phase of the current data. The electromagnetic field data were then normalized by the electric dipole moment, and finally, navigation data were merged. Amplitude spectra at 0.5, 1.5, and 2.5 Hz showed robust signals (Figure 7). However, due to clock drift issues, the phase data from this survey could not be utilized.
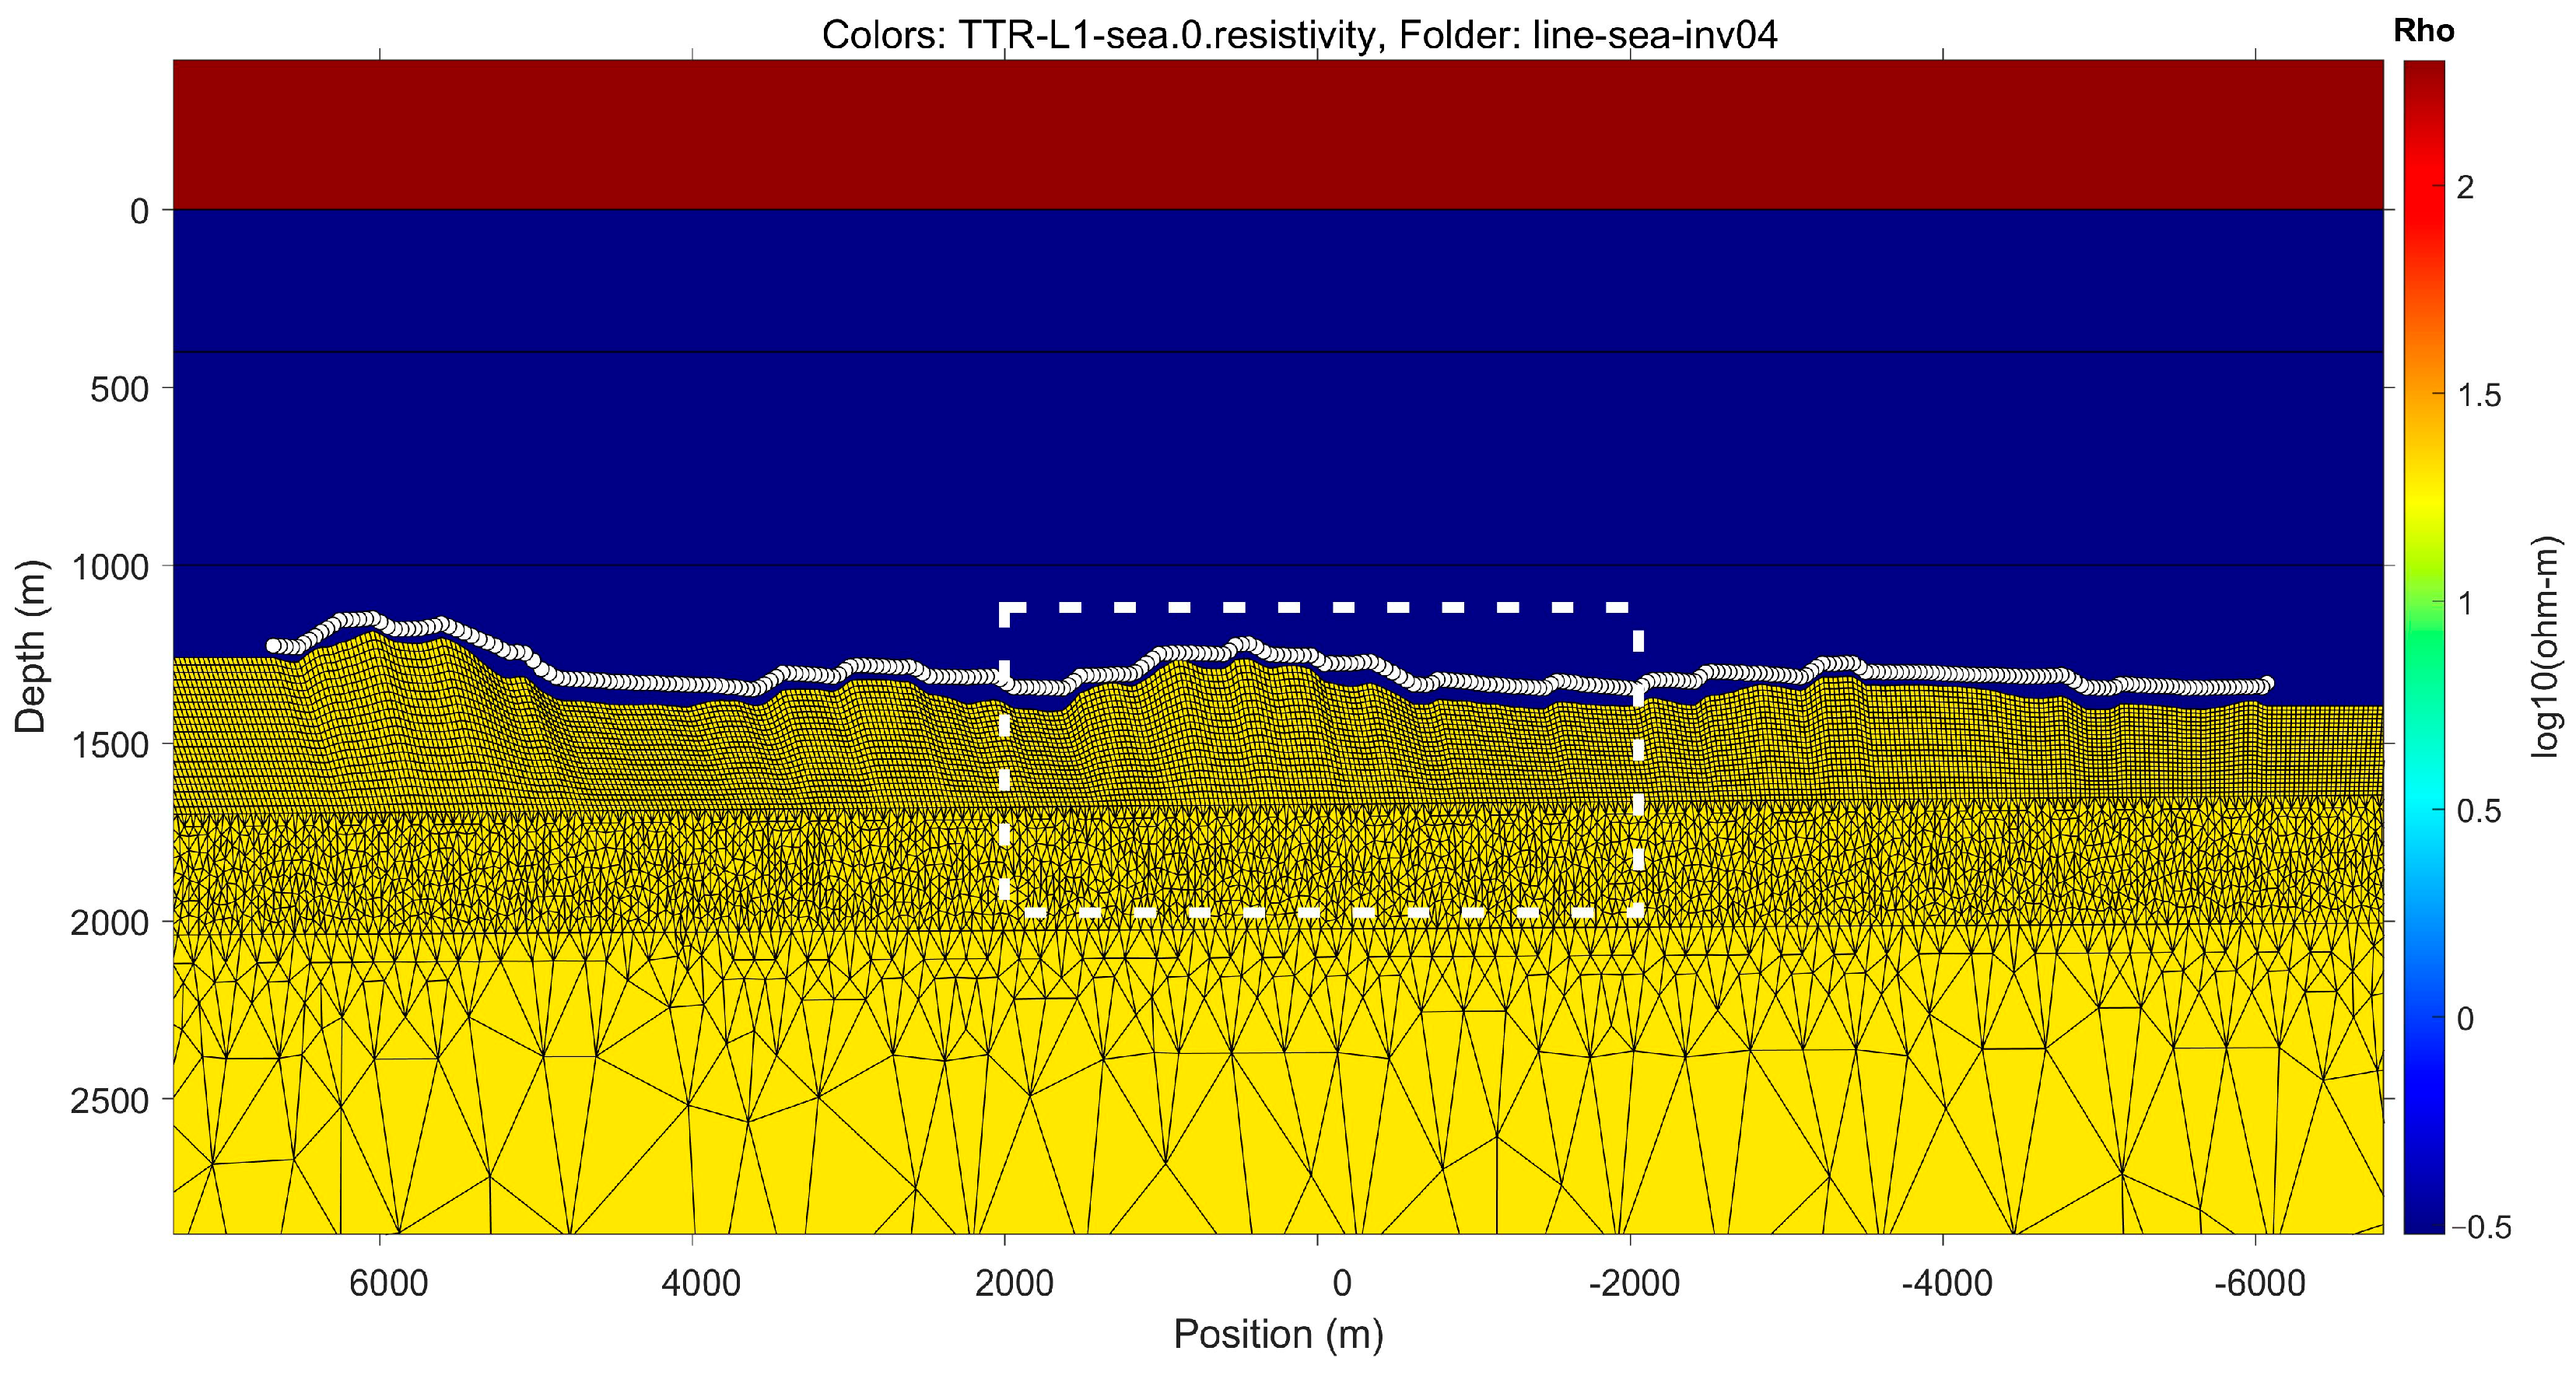
Two-dimensional inversion was performed using MARE2DEM [47,48] with Occam regularization. This method seeks the simplest or smoothest model that fits the data within a given tolerance, thereby avoiding overfitting. Applying Occam’s inversion algorithm to marine CSEM data enables the recovery of smooth geoelectrical models while preserving major structural features, thus preventing the generation of spurious resistivity anomalies. The mesh combined quadrilaterals (incorporating bathymetry) and triangles (Figure 8), with cell sizes of 20 × 20 m in the shallow hydrate zone.
Above sea level, an air layer with a thickness of 100 km was included, and assigned a constant resistivity of 1013 Ω·m. To optimize the resolution of subsea resistivity, seawater resistivity stratification was determined during inversion [49]. Here, stratified resistivity values for the seawater layer were derived from conductivity–temperature–depth (CTD) measurements and set as fixed parameters in subsequent inversions. The starting model assumed seawater conductivity overlying sediments with a resistivity of 5 Ω·m. The vertical stratification of the seawater into three layers (0.2 Ω·m, 0.24 Ω·m, and 0.3 Ω·m) based on CT-derived resistivity profiles (Figure 9) significantly improved inversion accuracy. Data errors were set to 5% of the amplitudes or calculated standard deviations. After 10 iterations, the root mean square (RMS) misfit decreased from 2.9 to 1.05. Figure 10 shows the final fit results and normalized residuals, indicating good agreement between the model response and the measured data. As shown in Figure 10a, the RMS error stabilized, indicating convergence of the inversion process.
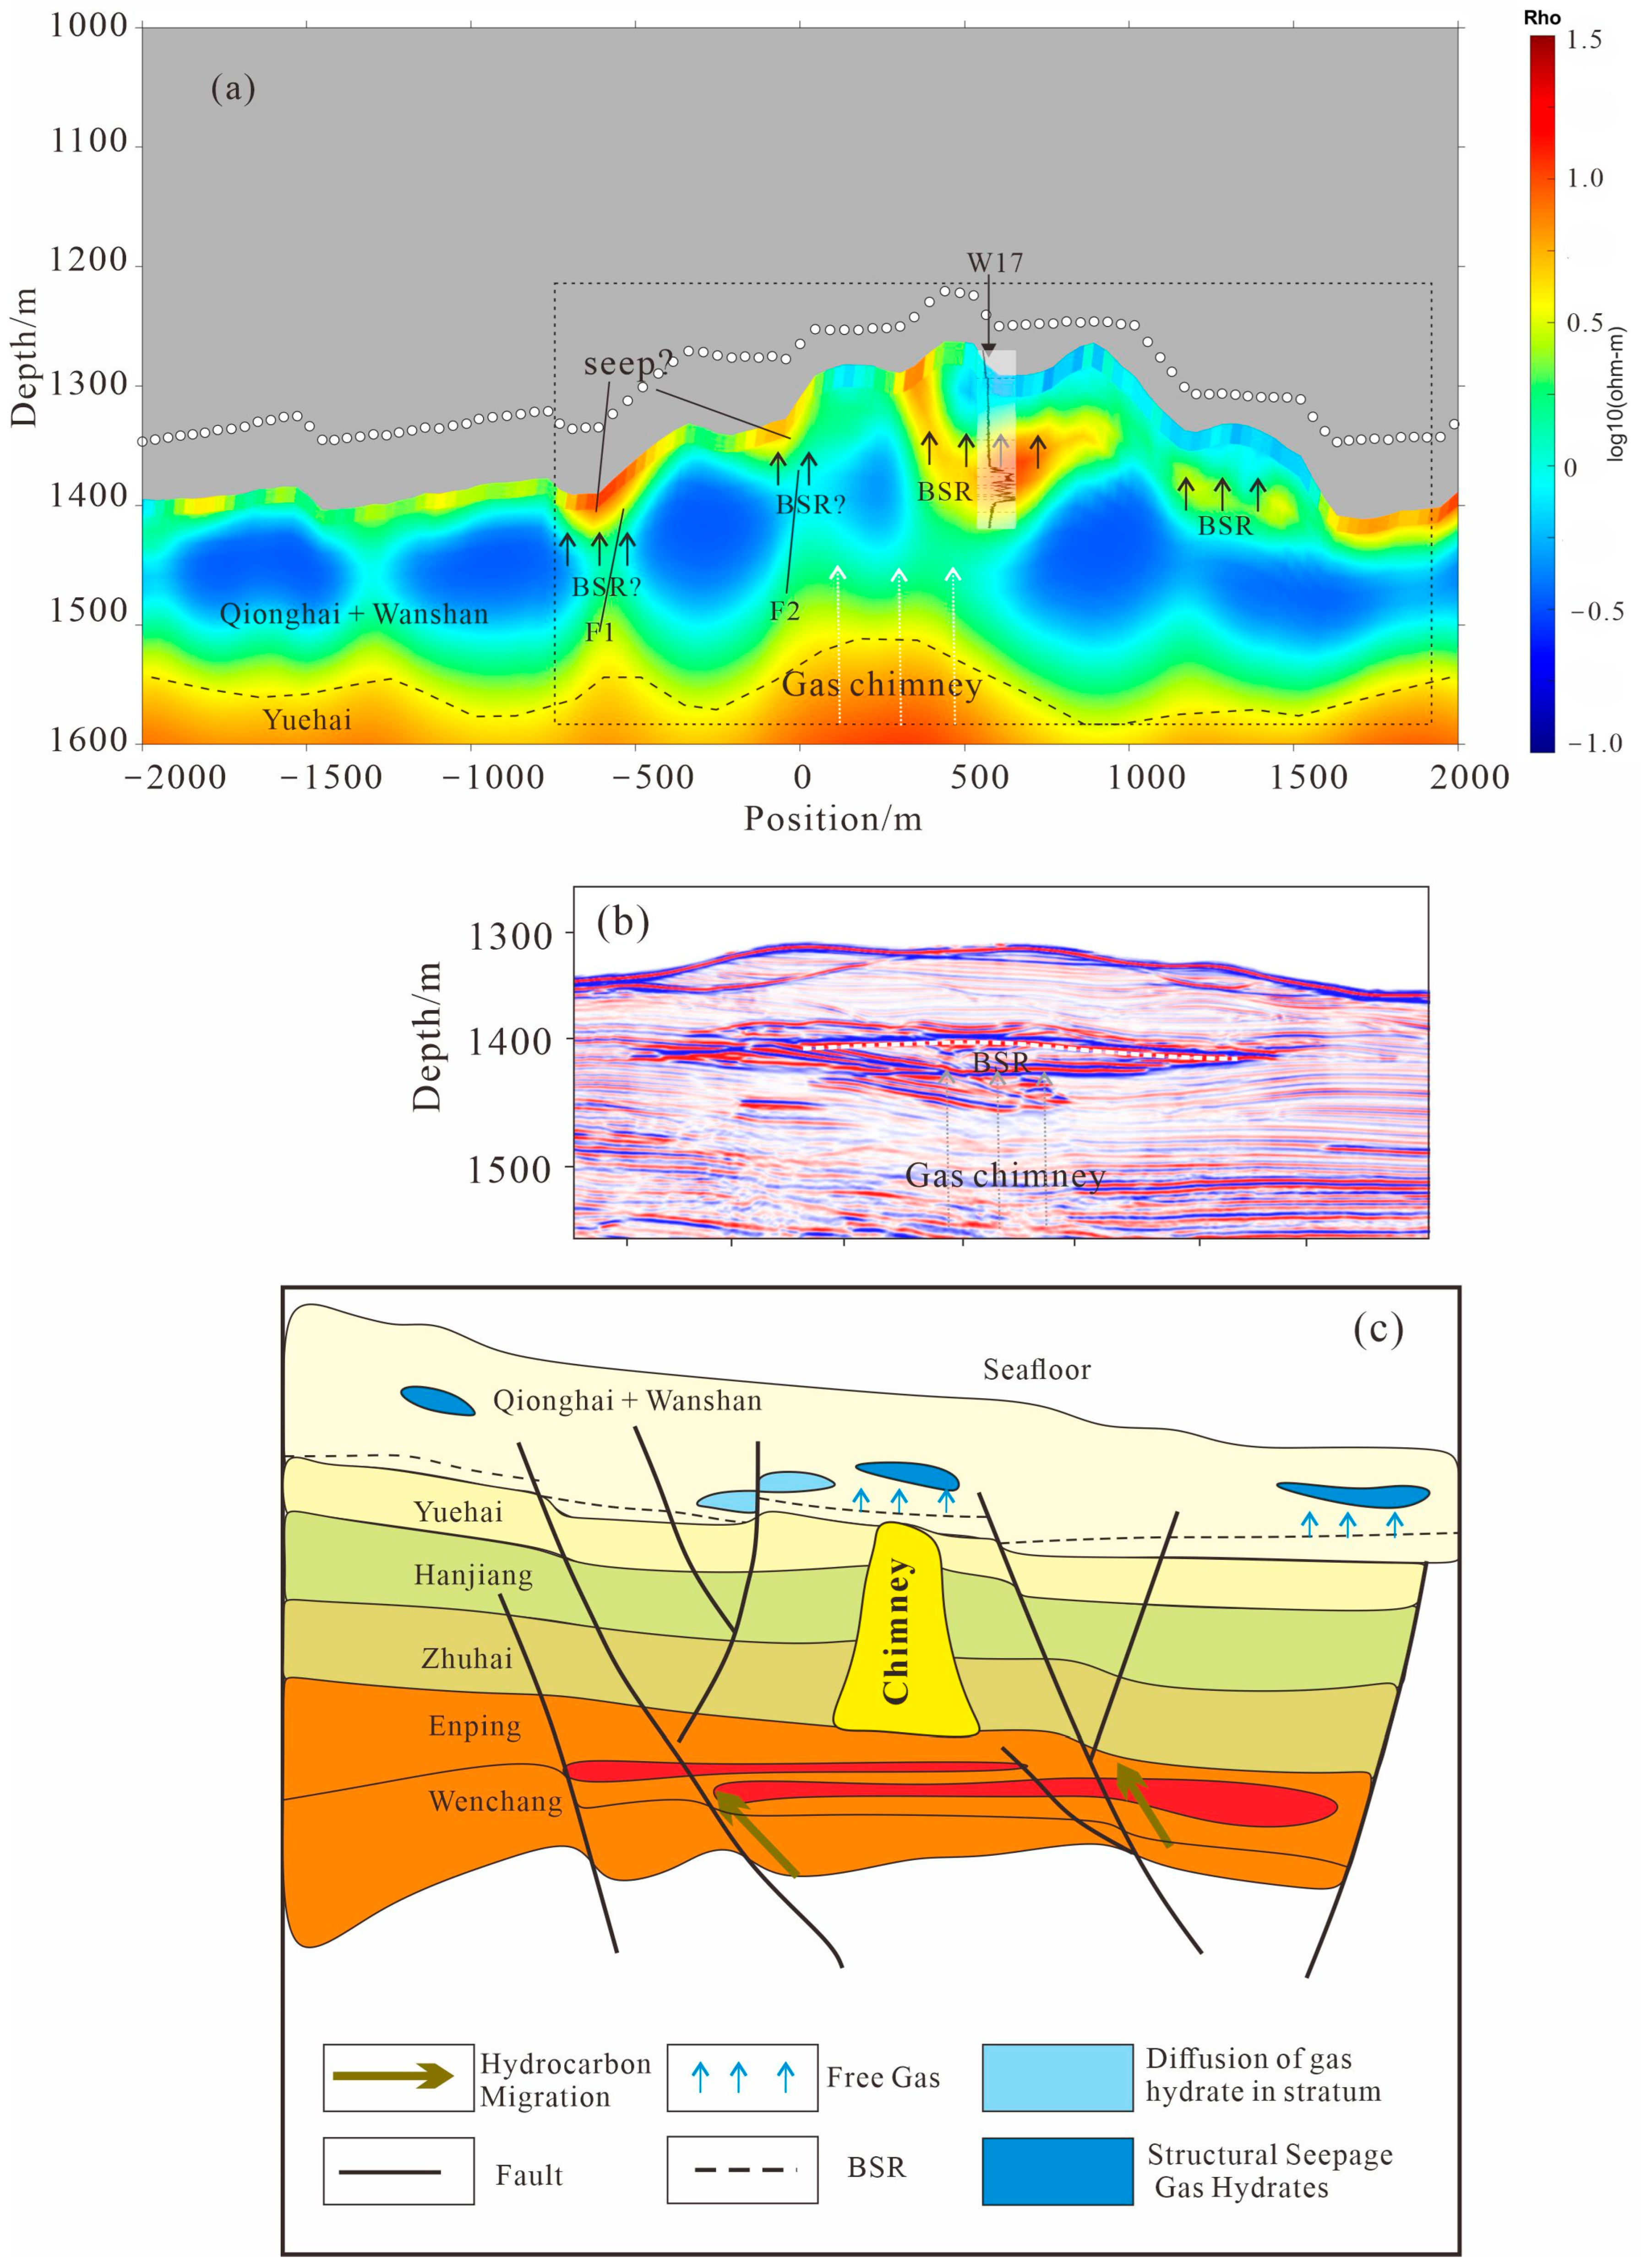
Figure 11 shows the resistivity profile, which correlates well with the seismic BSR. The penetration depth is limited to approximately 200 m below the seafloor due to the maximum offset of 446 m. Inversion results from Line EM (Figure 1B) provide compelling evidence for gas hydrate occurrence within the survey area. The resistivity anomalies show good agreement with seismic reflection features, particularly corresponding to the bottom-simulating reflector (BSR), confirming the robustness and reliability of the inversion results (Figure 11b). The highest resistivity value (~10 Ω·m) was observed at Hydrate Ridge (around meter 300–900). A comparative analysis with logging data from W17 along the electromagnetic profile (Figure 11a) shows that the resistivity logs increase at approximately 80 m below the seafloor, corresponding to a gas hydrate-bearing interval about 80 m thick. The inverted resistivity also exhibits a high-resistivity anomaly in this interval, which is moderately higher than the resistivity log measurements (~5 Ω·m) reported in [3]. Laterally continuous resistive anomalies extend from the base of the hydrate stability zone (HSZ) to the seafloor (Figure 11a). In contrast, between meters 1000 and 1500, weak and discontinuous resistors are observed across all survey lines, with the most prominent anomalies concentrated on the southeastern flank. At meter −600 and 0, a narrow vertical resistor extends to the seafloor from a broad tabular resistor just above the base of the HSZ, interpreted as a methane seep.
High-resistivity conduits (approximately 10–30 Ω·m) observed beneath the gas hydrate stability zone correspond to seismically chaotic zones (gas chimneys), confirming the coexistence of gas hydrate and free gas within the reservoir in the study area. The resistivity profiles reveal several large listric faults flanking the gas hydrate reservoir. These faults are interpreted as pathways for the migration of thermogenic gas and are inferred to significantly control the distribution of both gas hydrate and free gas in the Shenhu area [50]. Moreover, these faults extend vertically upward to the seafloor, potentially facilitating the seepage of dissociated methane gas into the water column (Figure 11c).
Figure 11. (a) Two-dimensional resistivity inversion; (b) corresponding seismic section; (c) formation model of gas hydrates in Shenhu area, South China Sea (Modified from Yang et al., 2017 [51]). The ’?’ indicates that the inferred BSR is relatively weak and has greater uncertainty.
Jmse 13 01665 g011

5. Discussion

A primary objective in natural gas hydrate resource assessment is to quantify the saturations of both free gas and gas hydrate using pore-water chloride anomalies, resistivity measurements, and seismic data [6]. Hydrate-bearing sediments are characterized by high compressional-wave velocity and impedance, elevated resistivity, and slight density anomalies [51]. Among these, resistivity enhancement is the most prominent identifiable physical property in hydrate-bearing formations [52]. In this study, saturation estimates target large-scale sediment volumes, covering tens to hundreds of meters vertically. Archie’s equation [53] was reformulated to determine the pore fraction of hydrate as follows:
S h = 1 ( a R w ϕ m R t ) 1 n
where Sh is the pore space hydrate saturation, Rw is the pore fluid resistivity, ϕ is the formation porosity, and Rt is the measured formation resistivity. As shown in Table 1, the saturation index (n) is 2.00 in the Shenhu study area and close to 2.00 in adjacent areas. Therefore, we take the saturation exponent n to be 2.0, the cementation exponent m to be 2.5 [54], and the tortuosity factor a is assumed to be 1. Uncertainties in Archie parameters, especially the cementation exponent m, propagate into hydrate saturation Sh estimates. However, the dominant error source originates from inverted formation resistivity. The Occam inversion scheme constrains solutions to the most conservative resistivity model compatible with the observed data and error statistics. This approach ensures that all resistive features in the output model are data-driven. Importantly, the smoothing regularization inherent in Occam’s method generates resistivity minima, meaning that Sh calculated via Archie’s equation represents a lower-bound estimate for any given parameter set (m, n, a).
Based on a petrophysical analysis of legacy well logs, we adopted a porosity of 32% for subsequent modeling [10]. Using Archie’s equation and the parameters specified above, we calculated a gas hydrate saturation (Sh) of 0.45 based on the maximum inverted reservoir resistivity (10 Ω·m). This value closely matches the well-log-derived saturation of 0.40 [8].
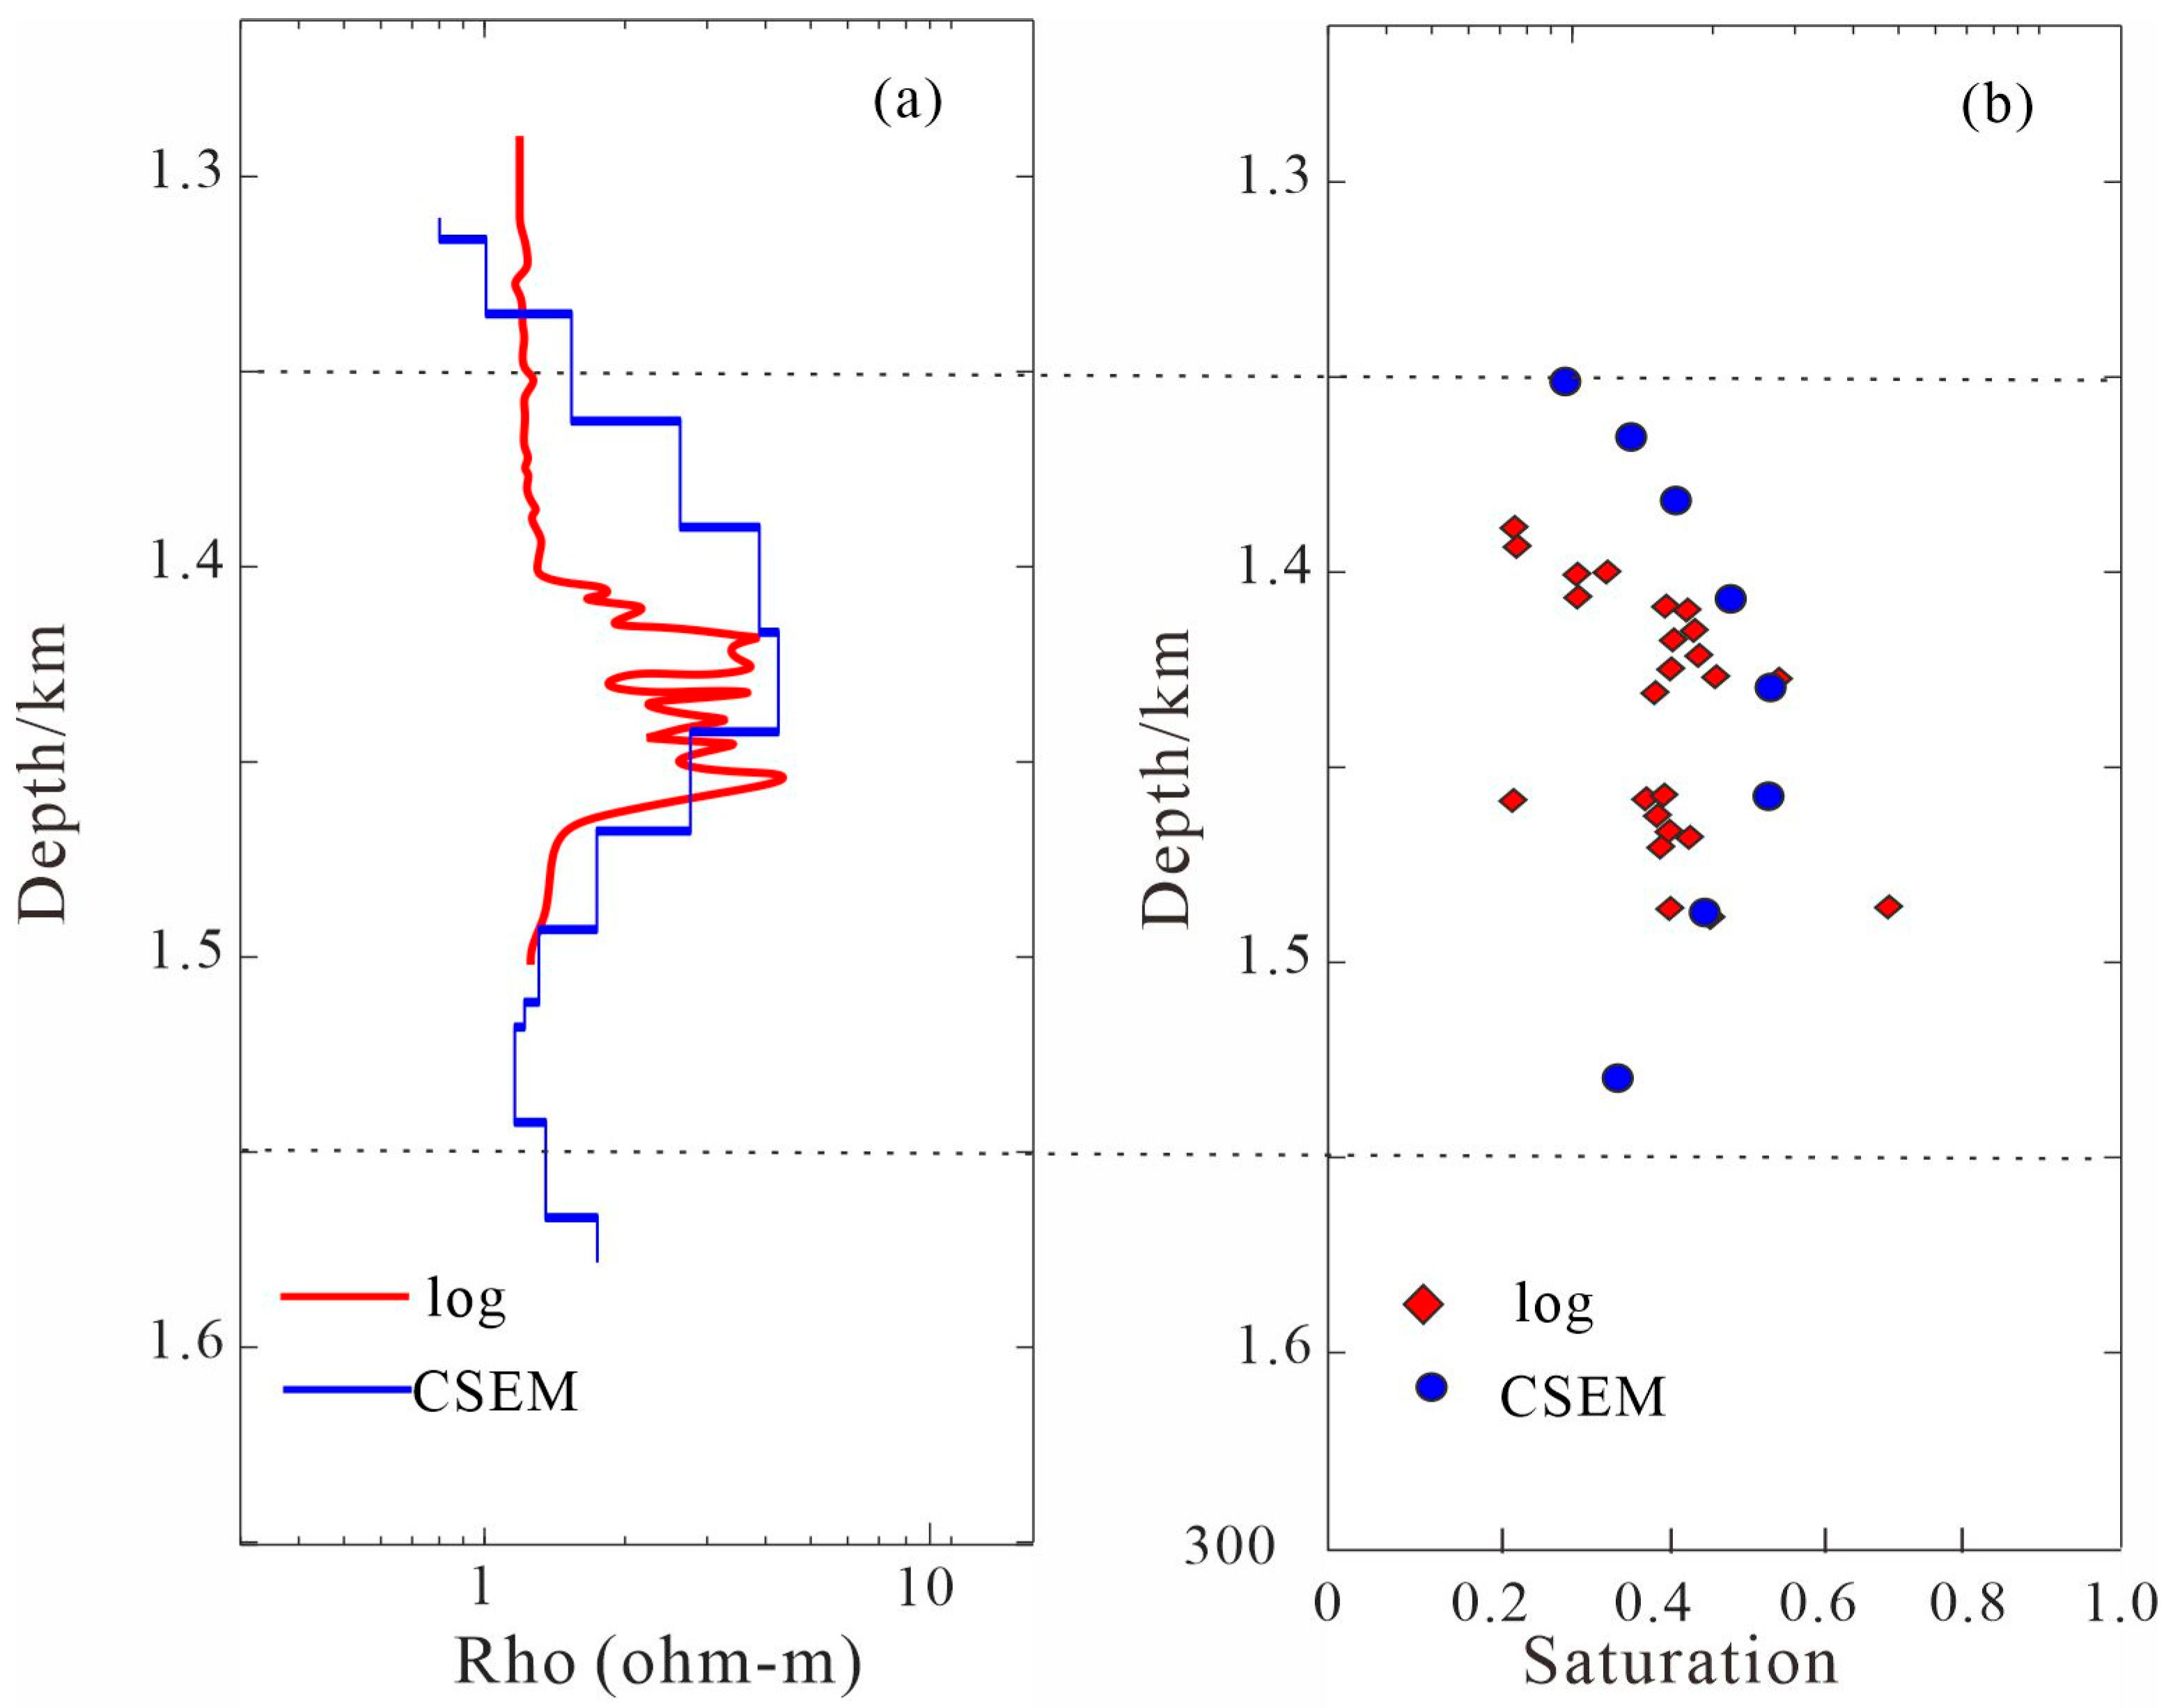
The inverted resistivity profile along the electromagnetic line crossing Well W17 was extracted and compared with the logged resistivity curve, as shown in Figure 12a. The logged resistivity within the gas hydrate reservoir ranges from 2.5 to 5 Ω·m. Although the inverted resistivity values are slightly higher than those from the logs, the overall trends are consistent. The saturation of the gas hydrate interval was estimated using Equation (1) (Figure 12b). The saturation derived from the inverted resistivity profile ranged between 20% and 50%, aligning well with saturation estimates of gas hydrate and associated free gas obtained from well logs. Specifically, the log-derived gas hydrate saturation in W17 varies from 0 to 76%, with an average value of 33.0% [3]. The resistivity-based saturation shows strong agreement with the log calculations, deviating by less than 5% from the average log-derived saturation.

6. Conclusions

Our study demonstrates that the deep-towed transmitter–receiver marine controlled-source electromagnetic (TTR-MCSEM) system enables efficient basin-scale characterization of methane hydrate saturation in marine sediments. When integrated with seismic structural constraints, TTR-MCSEM data reveal critical gas migration pathways in hydrate-bearing systems. In the Shenhu area, fault zones provide effective conduits that supply hydrate reservoirs and lead to seabed methane seepage along basin flanks, whereas unfaulted horizontal sediments lack sufficient migration capacity for significant hydrate formation.
The continuous acquisition capability enhances operational efficiency, and the unprecedented near-seafloor resolution (20–100 m depth) allows the precise delineation of hydrate-bearing caprock. A comparative analysis between the resistivity profile and drilling results demonstrates a clear correlation: intervals where gas hydrates were encountered during drilling correspond to high-resistivity anomalies (~5 Ω·m) in the TTR-MCSEM inversion. In contrast, no distinct resistive anomalies are observed in zones without hydrate occurrences. The saturation estimated from the inverted resistivity ranged between 0.2 and 0.5, showing excellent agreement with the average log-derived saturation of 0.33. This consistency significantly enhances the reliability of the interpretation.
Resistivity profiles correlate strongly with seismic BSR distribution and reveal heterogeneous hydrate saturation. Localized anomalies adjacent to seabed seepage sites help map fluid migration networks. These findings confirm the transformative potential of TTR-MCSEM for the quantitative assessment of hydrate systems, seafloor massive sulfides, and marine geohazards. However, the limited transmitter–receiver offset in the current configuration resulted in insufficient resolution at depth. To enhance deep imaging capability, future surveys should incorporate more receiver nodes and employ longer offsets tailored to specific exploration objectives.

Author Contributions

Conceptualization, Z.W. and M.W. (Meng Wang); methodology, P.Y., X.L. and P.S.; investigation, Y.G., Y.Z. and X.C.; writing—original draft preparation, J.L.; writing—review and editing, K.C.; supervision, J.J.; project administration, Z.W.; funding acquisition, M.W. (Mingming Wen). All authors have read and agreed to the published version of the manuscript.

Funding

This research was funded by the Dedicated Fund for Marine Economic Development in Guangdong Province (Grant No. GDNRC [2023]40), NSFC Project Topic: Integration and Engineering Application of Intelligent Coordinated Control for Deep-Sea Resource Exploration (Grant No. 62333019), Hainan Province Key Research and Development Project (Grant No. ZDYF2024GXJS002), the National Key Research and Development Program of China (Grant No. 2022YFC2807901) and the China Geological Survey (DD20221912).

Data Availability Statement

Research data is available from the corresponding author upon reasonable request.

Acknowledgments

The authors thank Kerry Key for providing the inversion codes MARE2DEM: https://bitbucket.org/mare2dem/ (accessed on 20 August 2024).

Conflicts of Interest

The authors declare no conflicts of interest.

References

  1. Kvenvolden, K.A. Gas Hydrates—Geological Perspective and Global Change. Rev. Geophys. 1993, 31, 173–187. [Google Scholar] [CrossRef]
  2. Fang, Y.; Lu, J.; Liang, J.; Kuang, Z.; Cao, Y.; Chen, D. Numerical Studies of Gas Hydrate Evolution Time in Shenhu Area in the Northern South China Sea. China Geol. 2019, 2, 49–55. [Google Scholar] [CrossRef]
  3. Liang, J.; Meng, M.; Liang, J.; Ren, J.; He, Y.; Li, T.; Xu, M.; Wang, X. Drilling Cores and Geophysical Characteristics of Gas Hydrate-Bearing Sediments in the Production Test Region in the Shenhu Sea, South China Sea. Front. Earth Sci. 2022, 10, 911123. [Google Scholar] [CrossRef]
  4. Li, J.; Ye, J.; Qin, X.; Qiu, H.; Wu, N.; Lu, H.; Xie, W.; Lu, J.; Peng, F.; Xu, Z.; et al. The First Offshore Natural Gas Hydrate Production Test in South China Sea. China Geol. 2018, 1, 5–16. [Google Scholar] [CrossRef]
  5. Waite, W.F.; Santamarina, J.C.; Cortes, D.D.; Dugan, B.; Espinoza, D.N.; Germaine, J.; Jang, J.; Jung, J.W.; Kneafsey, T.J.; Shin, H.; et al. Physical Properties of Hydrate-bearing Sediments. Rev. Geophys. 2009, 47, 2008RG000279. [Google Scholar] [CrossRef]
  6. Lu, S.; McMechan, G.A. Estimation of Gas Hydrate and Free Gas Saturation, Concentration, and Distribution from Seismic Data. Geophysics 2002, 67, 582–593. [Google Scholar] [CrossRef]
  7. Sloan, E.D. Fundamental Principles and Applications of Natural Gas Hydrates. Nature 2003, 426, 353–359. [Google Scholar] [CrossRef] [PubMed]
  8. Su, P.; Liang, J.; Peng, J.; Zhang, W.; Xu, J. Petroleum Systems Modeling on Gas Hydrate of the First Experimental Exploitation Region in the Shenhu Area, Northern South China Sea. J. Asian Earth Sci. 2018, 168, 57–76. [Google Scholar] [CrossRef]
  9. Zhang, W.; Liang, J.; Wei, J.; Lu, J.; Su, P.; Lin, L.; Huang, W. Origin of Natural Gases and Associated Gas Hydrates in the Shenhu Area, Northern South China Sea: Results from the China Gas Hydrate Drilling Expeditions. J. Asian Earth Sci. 2019, 183, 103953. [Google Scholar] [CrossRef]
  10. Zhang, W.; Liang, J.; Wei, J.; Lu, J.; Su, P.; Lin, L.; Huang, W.; Guo, Y.; Deng, W.; Yang, X.; et al. Geological and Geophysical Features of and Controls on Occurrence and Accumulation of Gas Hydrates in the First Offshore Gas-Hydrate Production Test Region in the Shenhu Area, Northern South China Sea. Mar. Pet. Geol. 2020, 114, 104191. [Google Scholar] [CrossRef]
  11. Zhang, W.; Liang, J.; Wan, Z.; Su, P.; Huang, W.; Lin, L. Dynamic Accumulation of Gas Hydrates Associated with the Channel-Levee System in the Shenhu Area, Northern South China Sea. Mar. Pet. Geol. 2020, 117, 104354. [Google Scholar] [CrossRef]
  12. Constable, S. Ten Years of Marine CSEM for Hydrocarbon Exploration. Geophysics 2010, 75, 75A67–75A81. [Google Scholar] [CrossRef]
  13. Constable, S. Perspectives on Marine Electromagnetic Methods. Perspect. Earth Space Sci. 2020, 1, e2019CN000123. [Google Scholar] [CrossRef]
  14. Constable, S.; Lu, R.; Stern, L.A.; Du Frane, W.L.; Roberts, J.J. Laboratory Electrical Conductivity of Marine Gas Hydrate. Geophys. Res. Lett. 2020, 47, e2020GL087645. [Google Scholar] [CrossRef]
  15. Constable, S.; Orange, A.; Myer, D. Marine Controlled-Source Electromagnetic of the Scarborough Gas Field—Part 3: Multicomponent 2D Magnetotelluric/Controlled-Source Electromagnetic Inversions. Geophysics 2019, 84, B387–B401. [Google Scholar] [CrossRef]
  16. Constable, S.; Srnka, L.J. An Introduction to Marine Controlled-Source Electromagnetic Methods for Hydrocarbon Exploration. Geophysics 2007, 72, WA3–WA12. [Google Scholar] [CrossRef]
  17. Goto, T.; Kasaya, T.; Machiyama, H.; Takagi, R.; Matsumoto, R.; Okuda, Y.; Satoh, M.; Watanabe, T.; Seama, N.; Mikada, H.; et al. A Marine Deep-Towed DC Resistivity Survey in a Methane Hydrate Area, Japan Sea. Explor. Geophys. 2008, 39, 52–59. [Google Scholar] [CrossRef]
  18. Evans, R.L. Using CSEM Techniques to Map the Shallow Section of Seafloor: From the Coastline to the Edges of the Continental Slope. Geophysics 2007, 72, WA105–WA116. [Google Scholar] [CrossRef]
  19. Gehrmann, R.A.S.; Schnabel, C.; Engels, M.; Schnabel, M.; Schwalenberg, K. Combined Interpretation of Marine Controlled Source Electromagnetic and Reflection Seismic Data in the German North Sea: A Case Study. Geophys. J. Int. 2019, 216, 218–230. [Google Scholar] [CrossRef]
  20. Jing, J.; Chen, K.; Deng, M.; Zhao, Q.; Luo, X.; Tu, G.; Wang, M. A Marine Controlled-Source Electromagnetic Survey to Detect Gas Hydrates in the Qiongdongnan Basin, South China Sea. J. Asian Earth Sci. 2019, 171, 201–212. [Google Scholar] [CrossRef]
  21. Schwalenberg, K.; Gehrmann, R.A.S.; Bialas, J.; Rippe, D. Analysis of Marine Controlled Source Electromagnetic Data for the Assessment of Gas Hydrates in the Danube Deep-Sea Fan, Black Sea. Mar. Pet. Geol. 2020, 122, 104650. [Google Scholar] [CrossRef]
  22. Schwalenberg, K.; Rippe, D.; Koch, S.; Scholl, C. Marine-controlled Source Electromagnetic Study of Methane Seeps and Gas Hydrates at Opouawe Bank, Hikurangi Margin, New Zealand. J. Geophys. Res. Solid Earth 2017, 122, 3334–3350. [Google Scholar] [CrossRef]
  23. Weitemeyer, K.A.; Constable, S.C.; Key, K.W.; Behrens, J.P. First Results from a Marine Controlled-source Electromagnetic Survey to Detect Gas Hydrates Offshore Oregon. Geophys. Res. Lett. 2006, 33, 2005GL024896. [Google Scholar] [CrossRef]
  24. Weitemeyer, K.A.; Constable, S.; Tréhu, A.M. A Marine Electromagnetic Survey to Detect Gas Hydrate at Hydrate Ridge, Oregon: EM at Hydrate Ridge. Geophys. J. Int. 2011, 187, 45–62. [Google Scholar] [CrossRef]
  25. Jing, J.E.; Wu, Z.L.; Deng, M.; Zhao, Q.X.; Luo, X.H.; Tu, G.H.; Chen, K.; Wang, M. Experiment of marine controlled source electromagnetic detection in a gas hydrate prospective region of the South China Sea. Chin. J. Geophys. 2016, 59, 2564–2572. (In Chinese) [Google Scholar] [CrossRef]
  26. Jing, J.E.; Zhao, Q.X.; Deng, M.; Luo, X.H.; Chen, K.; Wang, M.; Tu, G.H. A study on natural gas hydrates and their forming model using marine controlled source electromagnetic survey in the Qiongdongnan Basin. Chin. J. Geophys. 2018, 61, 4677–4689. (In Chinese) [Google Scholar] [CrossRef]
  27. Jing, J.E.; Zhao, Q.X.; Luo, X.H.; Liu, C.G.; Chen, K.; Wang, M.; Deng, M.; Wu, Z.L. A marine controlled-source electromagnetic imaging of gas hydrates and gas sources in the Shenhu area, South China Sea. Acta Geol. Sin. 2024, 98, 2694–2708. (In Chinese) [Google Scholar]
  28. Duan, S.M.; Li, Y.G.; Wu, Z.Q.; Pei, J.X. Structural imaging of marine carbonatite strata in the South Yellow Sea Basin based on marine CSEM technology. Chin. J. Geophys. 2025, 68, 1555–1566. (In Chinese) [Google Scholar] [CrossRef]
  29. Liu, C.; Jing, J.; Zhao, Q.; Luo, X.; Chen, K.; Wang, M.; Deng, M. High-Resolution Resistivity Imaging of a Transversely Uneven Gas Hydrate Reservoir: A Case in the Qiongdongnan Basin, South China Sea. Remote Sens. 2023, 15, 2000. [Google Scholar] [CrossRef]
  30. Key, K.; Constable, S. Inverted Long-Baseline Acoustic Navigation of Deep-Towed CSEM Transmitters and Receivers. Mar. Geophys. Res. 2021, 42, 6. [Google Scholar] [CrossRef]
  31. Constable, S.; Kannberg, P.K.; Weitemeyer, K. Vulcan: A Deep-towed CSEM Receiver. Geochem. Geophys. Geosyst. 2016, 17, 1042–1064. [Google Scholar] [CrossRef]
  32. Kannberg, P.K.; Constable, S. Characterization and Quantification of Gas Hydrates in the California Borderlands. Geophys. Res. Lett. 2020, 47, e2019GL084703. [Google Scholar] [CrossRef]
  33. King, R.B.; Constable, S. How Low Can You Go: An Investigation of Depth Sensitivity and Resolution Using Towed Marine Controlled-source Electromagnetic Systems. Geophys. Prospect. 2023, 71, 722–733. [Google Scholar] [CrossRef]
  34. Zhdanov, M.S.; Anderson, C.; Endo, M.; Cox, L.H.; Čuma, M.; Wilson, G.A.; Black, N.; Gribenko, A.V. 3D Inversion of Towed Streamer EM Data: A Model Study of the Harding Field with Comparison to CSEM. First Break. 2012, 30, 71–74. [Google Scholar] [CrossRef]
  35. King, R.B.; Constable, S.; Maloney, J.M. A Case Study in Controlled Source Electromagnetism: Near Seabed Hydrocarbon Seep Systems of Coal Oil Point, California, USA. Mar. Pet. Geol. 2022, 139, 105636. [Google Scholar] [CrossRef]
  36. Attias, E.; Weitemeyer, K.; Hölz, S.; Naif, S.; Minshull, T.A.; Best, A.I.; Haroon, A.; Jegen-Kulcsar, M.; Berndt, C. High-Resolution Resistivity Imaging of Marine Gas Hydrate Structures by Combined Inversion of CSEM Towed and Ocean-Bottom Receiver Data. Geophys. J. Int. 2018, 214, 1701–1714. [Google Scholar] [CrossRef]
  37. Sherman, D.; Kannberg, P.; Constable, S. Surface Towed Electromagnetic System for Mapping of Subsea Arctic Permafrost. Earth Planet. Sci. Lett. 2017, 460, 97–104. [Google Scholar] [CrossRef]
  38. Attias, E.; Constable, S.; Sherman, D.; Ismail, K.; Shuler, C.; Dulai, H. Marine Electromagnetic Imaging and Volumetric Estimation of Freshwater Plumes Offshore Hawai’i. Geophys. Res. Lett. 2021, 48, e2020GL091249. [Google Scholar] [CrossRef]
  39. Micallef, A.; Person, M.; Haroon, A.; Weymer, B.A.; Jegen, M.; Schwalenberg, K.; Faghih, Z.; Duan, S.; Cohen, D.; Mountjoy, J.J.; et al. 3D Characterisation and Quantification of an Offshore Freshened Groundwater System in the Canterbury Bight. Nat. Commun. 2020, 11, 1372. [Google Scholar] [CrossRef]
  40. Liang, J.; Zhang, Z.; Su, P.; Sha, Z.; Yang, S. Evaluation of Gas Hydrate-Bearing Sediments below the Conventional Bottom-Simulating Reflection on the Northern Slope of the South China Sea. Interpretation 2017, 5, SM61–SM74. [Google Scholar] [CrossRef]
  41. Wang, M.; Deng, M.; Wu, Z.; Luo, X.; Jing, J.; Chen, K. The Deep-Tow Marine Controlled-Source Electromagnetic Transmitter System for Gas Hydrate Exploration. J. Appl. Geophys. 2017, 137, 138–144. [Google Scholar] [CrossRef]
  42. Wang, M.; Wu, Z.L.; Yu, P.; Deng, M.; Ren, Z.B.; Wang, C.T. 2000A class marine controlled source electromagnetic transmitter system. Chin. J. Geophys. 2024, 67, 4482–4492. (In Chinese) [Google Scholar] [CrossRef]
  43. Wang, M.; Deng, M.; Yu, P.; Yin, C.C.; Chen, K.; Luo, X.H. High-power time-frequency transmission and multi-chain cable multi-componentelectromagnetic system for deeprwater exploration. Chin. J. Geophys. 2022, 65, 3664–3673. [Google Scholar] [CrossRef]
  44. Chen, K.; Jing, J.E.; Zhao, Q.X.; Luo, X.H.; Tu, G.H.; Wang, M. Ocean bottom EM receiver and application for gas hydrate detection. Chin. J. Geophys. 2017, 60, 4262–4272. (In Chinese) [Google Scholar] [CrossRef]
  45. Myer, D.; Constable, S.; Key, K. Broad-Band Waveforms and Robust Processing for Marine CSEM Surveys: CSEM Waveforms and Processing. Geophys. J. Int. 2011, 184, 689–698. [Google Scholar] [CrossRef]
  46. Li, Y.G.; Duan, S.M. Data Preprocessing of Marine Control led—Source Electromagnetic Data. Period. Ocean Univ. China 2014, 44, 106–112. (In Chinese) [Google Scholar] [CrossRef]
  47. Key, K. MARE2DEM: A 2-D Inversion Code for Controlled-Source Electromagnetic and Magnetotelluric Data. Geophys. J. Int. 2016, 207, 571–588. [Google Scholar] [CrossRef]
  48. Li, Y.; Key, K. 2D Marine Controlled-Source Electromagnetic Modeling: Part 1—An Adaptive Finite-Element Algorithm. Geophysics 2007, 72, WA51–WA62. [Google Scholar] [CrossRef]
  49. Key, K. 1D Inversion of Multicomponent, Multifrequency Marine CSEM Data: Methodology and Synthetic Studies for Resolving Thin Resistive Layers. Geophysics 2009, 74, F9–F20. [Google Scholar] [CrossRef]
  50. Tinivella, U.; Carcione, J.M. Estimation of Gas-Hydrate Concentration and Free-Gas Saturation from Log and Seismic Data. Lead. Edge 2001, 20, 200–203. [Google Scholar] [CrossRef]
  51. Yang, S.X.; Liang, J.Q.; Lu, J.A.; Qu, C.W.; Liu, B. New understandings on the characteristics and controlling factors of gas hydrate reservoirs in the Shenhu area on the northern slope of the South China Sea. Earth Sci. Front. 2017, 24, 1–14. (In Chinese) [Google Scholar]
  52. Wang, X.; Wu, S.; Guo, Y.; Yang, S.; Gong, Y. Geophysical Indicators of Gas Hydrate in the Northern Continental Margin, South China Sea. J. Geol. Res. 2011, 2011, 359597. [Google Scholar] [CrossRef]
  53. Archie, G.E. The Electrical Resistivity Log as an Aid in Determining Some Reservoir Characteristics. Trans. AIME 1942, 146, 54–62. [Google Scholar] [CrossRef]
  54. Collett, T.S.; Ladd, J. 19. Detection of gas hydrate with downhole logs and assessment of gas hydrate concentrations (saturations) and gas volumes on the Blake Ridge with electrically resistivity log data. In Proceedings of the Ocean Drilling Program, Scientific Results, College Station, TX, USA, 12 June 2000; Volume 164. [Google Scholar]
  55. Kang, D.; Lu, J.; Zhang, Z.; Liang, J.; Kuang, Z.; Lu, C.; Kou, B.; Lu, Q.; Wang, J. Fine-Grained Gas Hydrate Reservoir Properties Estimated from Well Logs and Lab Measurements at the Shenhu Gas Hydrate Production Test Site, the Northern Slope of the South China Sea. Mar. Pet. Geol. 2020, 122, 104676. [Google Scholar] [CrossRef]
  56. Liu, T.; Liu, X.; Zhu, T. Joint Analysis of P-Wave Velocity and Resistivity for Morphology Identification and Quantification of Gas Hydrate. Mar. Pet. Geol. 2020, 112, 104036. [Google Scholar] [CrossRef]
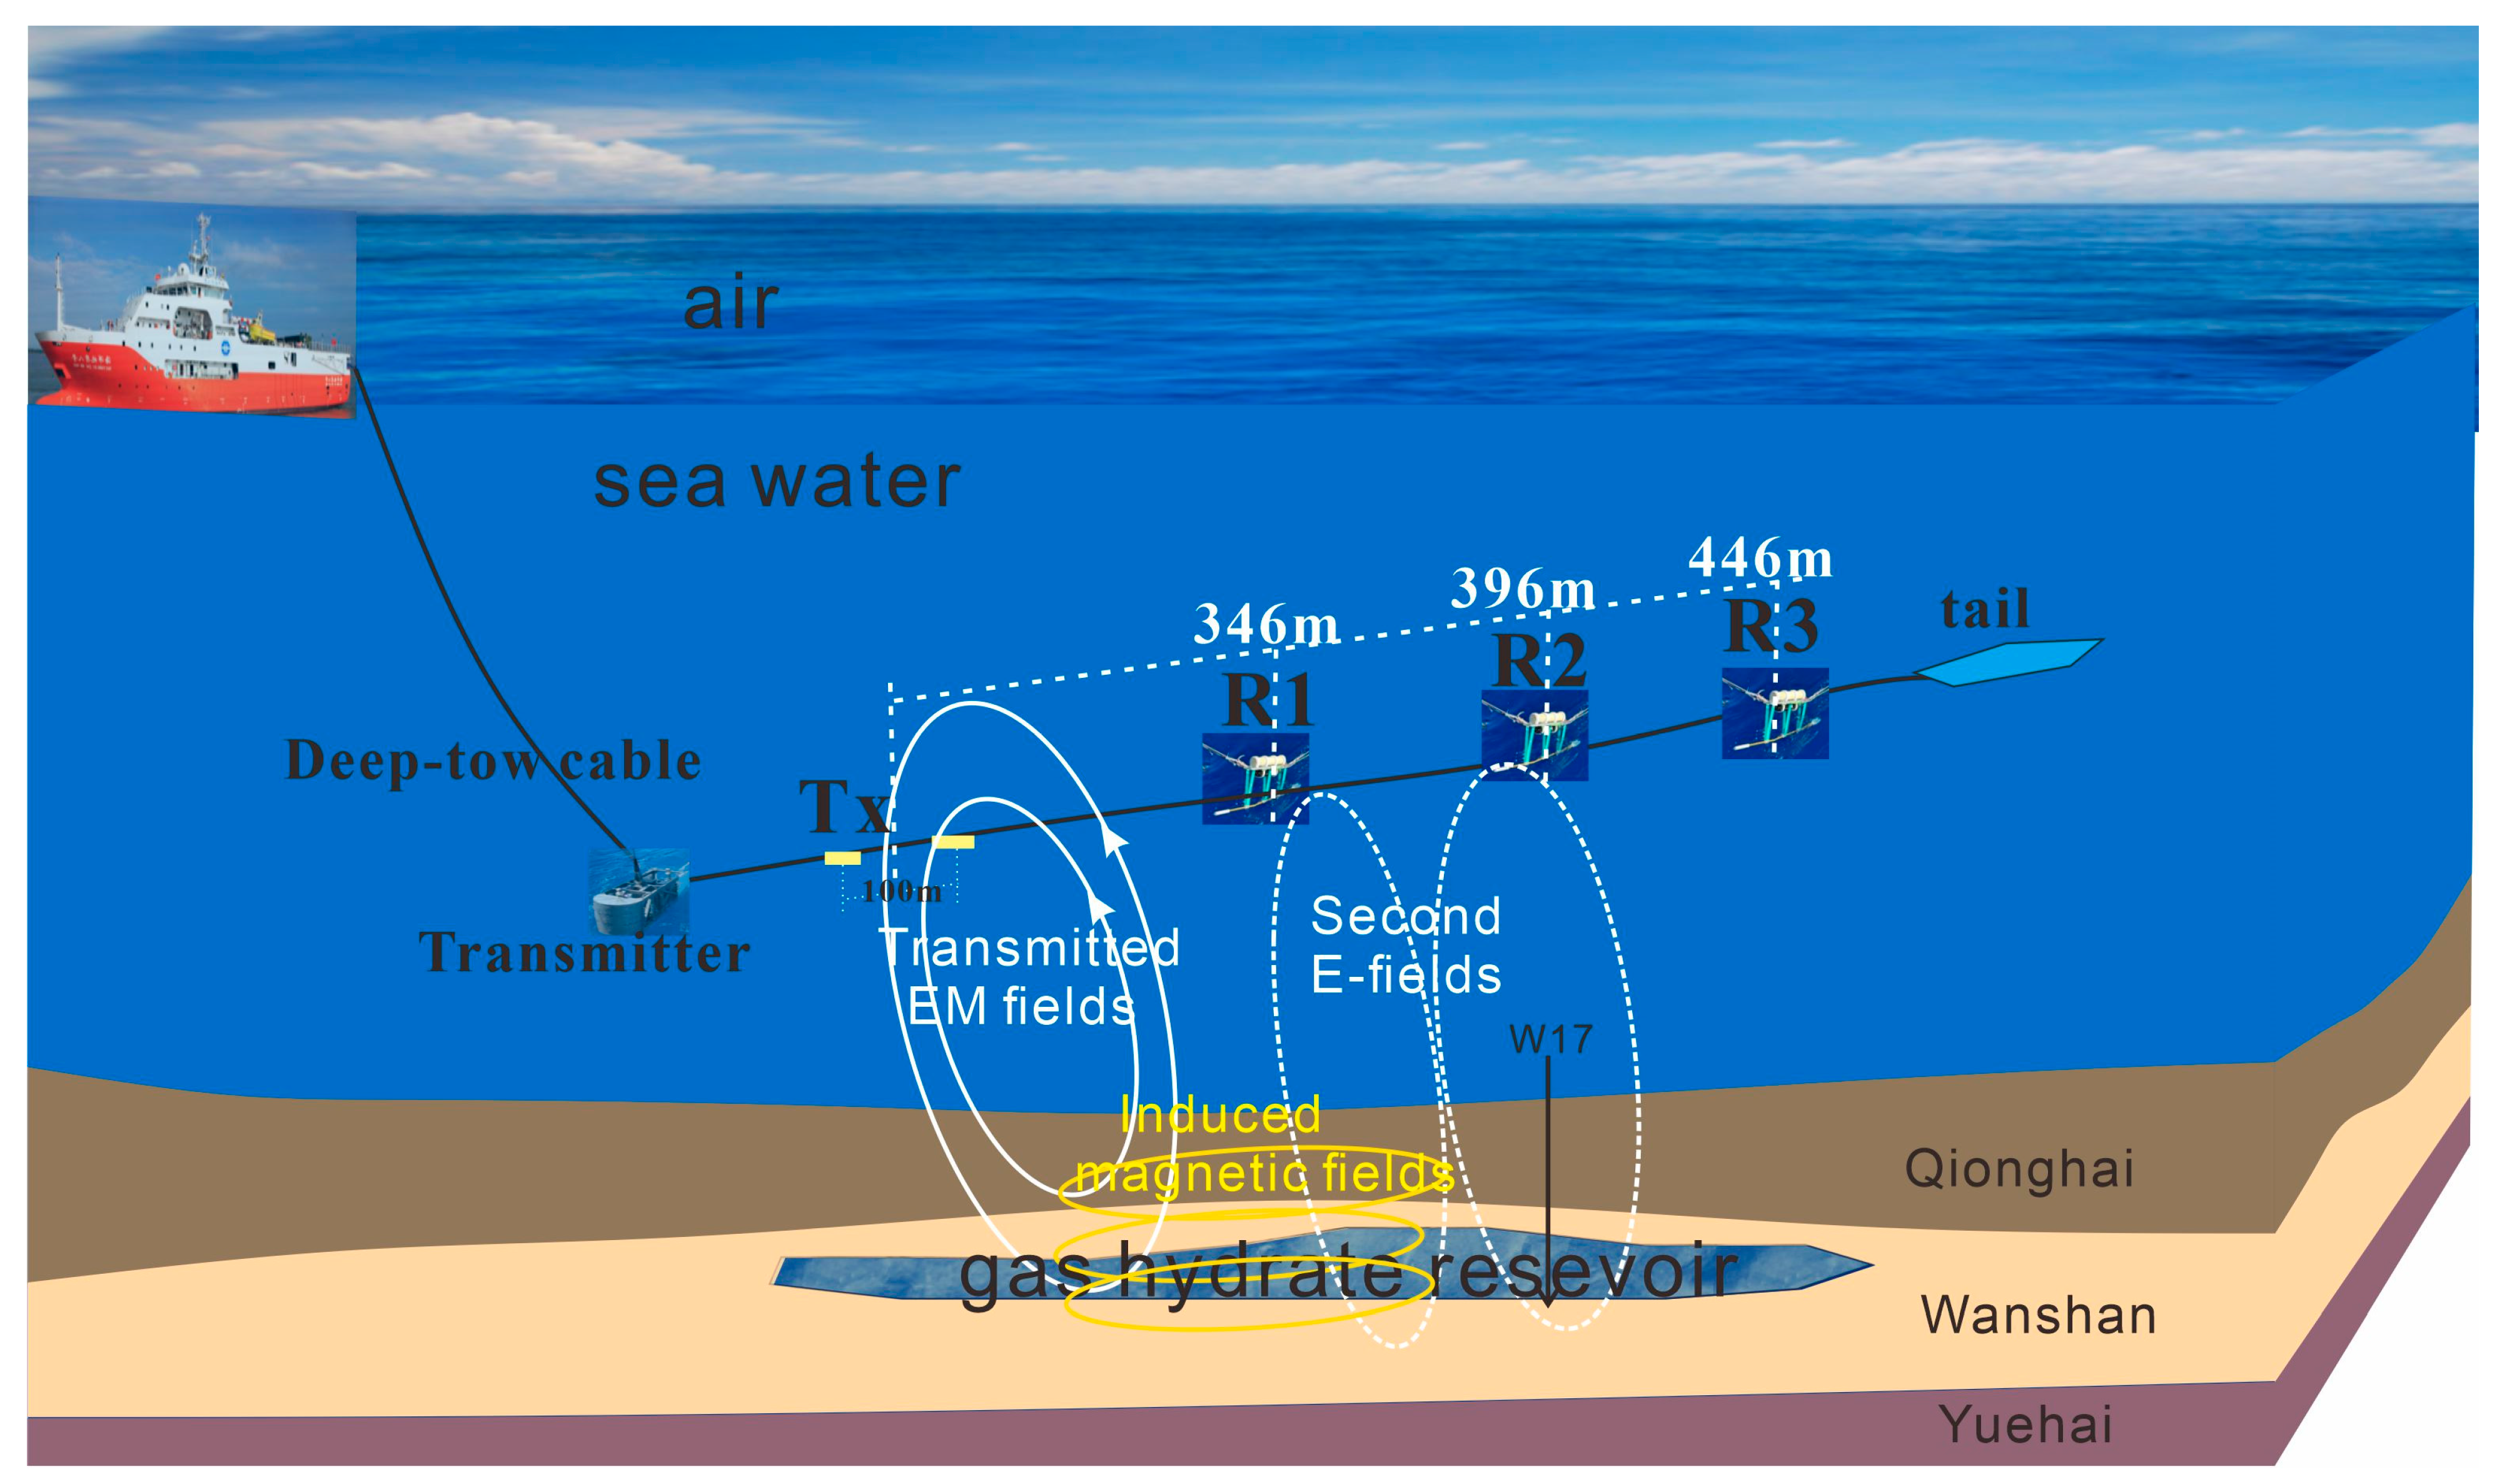
Figure 2. Schematic of the deep-towed marine controlled-source electromagnetic (TTR-MCSEM) system.
Jmse 13 01665 g002
Figure 3. TTR-MCSEM system components: (a) towed transmitter; (b) towed receiver.
Jmse 13 01665 g003
Figure 4. Attitude angles (roll, pitch, and yaw) of receiver R2 during towing.
Jmse 13 01665 g004
Figure 5. Raw electric field time series recorded by receiver R2 at 0.5 Hz.
Jmse 13 01665 g005
Figure 6. CSEM data preprocessing flow.
Jmse 13 01665 g006
Figure 7. (a) Amplitude and (b) phase spectra at R2 for 0.5 Hz.
Jmse 13 01665 g007
Figure 8. Initial resistivity model for 2D inversion of MCSEM data. The dashed box in the figure indicates the key interpretation area.
Jmse 13 01665 g008
Figure 9. Measured seawater resistivity profile (CTD).
Jmse 13 01665 g009
Figure 10. Inversion convergence: (a) RMS misfit and (b) model roughness.
Jmse 13 01665 g010
Figure 12. (a) Comparison between the resistivity log from Well W02 and the CSEM inverted resistivity; (b) vertical variations in the gas hydrate saturation in sites W17 (modified from Liang, 2022 [3]).
Jmse 13 01665 g012
Table 1. Archie’s empirical saturation index in the Shenhu study region [29].
RegionnData Source
Shenhu (SH2)2.00Wang et al. (2011) [52]
W11-17 and SHSC-41.94Kang et al. (2020) [55]
Pearl River Mouth Basin2.00Liu et al. (2020) [56]
Disclaimer/Publisher’s Note: The statements, opinions and data contained in all publications are solely those of the individual author(s) and contributor(s) and not of MDPI and/or the editor(s). MDPI and/or the editor(s) disclaim responsibility for any injury to people or property resulting from any ideas, methods, instructions or products referred to in the content.