Article

Novel Application of Ultrashort Pulses for Underwater Positioning in Marine Engineering

1
Guangdong-Hong Kong-Macao Greater Bay Area Institute of Artificial Intelligence Application Technology, Shenzhen Polytechnic University, Shenzhen 518055, China
2
School of Marine Technology and Surveying, Jiangsu Ocean University, Lianyungang 222005, China
3
Guangdong Key Laboratory of Urban Informatics, Shenzhen University, Shenzhen 518060, China
*
Author to whom correspondence should be addressed.
J. Mar. Sci. Eng. 2025, 13(9), 1651; https://doi.org/10.3390/jmse13091651
Submission received: 15 July 2025 / Revised: 12 August 2025 / Accepted: 25 August 2025 / Published: 28 August 2025
(This article belongs to the Section Ocean Engineering)

Abstract

Noise interference and multipath effects in complex marine environments seriously constrain the performance of hydroacoustic positioning systems. Traditional millisecond-level signal application and processing methods are widely used in existing research; however, it is difficult to meet the requirements of centimeter-level positioning accuracy in marine engineering. To address this problem, this study proposes a hydroacoustic positioning method based on a short baseline system for the cooperative reception of multi-channel signals. The method adopts ultra-short pulse signals with microsecond pulse width, and significantly improves the system signal-to-noise ratio and anti-interference capability through multi-channel signal alignment and coherent superposition techniques; meanwhile, a joint energy gradient-phase detection algorithm is designed, which solves the instability problem of the traditional cross-correlation algorithm in the detection of ultra-short pulse signals through the identification of signal stability intervals and accurate phase estimation. Simulation verification shows that the 8-hydrophone × 4-channel configuration can achieve 36.06% signal-to-noise gain under harsh environmental conditions (−10 dB), and the performance of the joint energy gradient-phase detection algorithm is improved by about 19.1% compared with the traditional method in an integrated manner. Marine tests further validate the engineering practicability of the method, with an average SNR gain of 2.27 dB achieved for multi-channel signal reception, and the TDOA estimation stability of the new algorithm is up to 32.0% higher than that of the conventional method, which highlights the significant advantages of the proposed method in complex marine environments. The results show that the proposed method can effectively mitigate the noise interference and multipath effects in complex marine environments, significantly improve the accuracy and stability of hydroacoustic positioning, and provide reliable technical support for centimeter-level accuracy applications in marine engineering.

1. Introduction

Underwater positioning technology serves as a critical enabler for marine engineering applications by providing three-dimensional coordinate determination, real-time attitude parameter estimation, and movement trajectory tracking of underwater targets. These capabilities directly support essential operations including subsea facility deployment, equipment manipulation, and path planning, making underwater positioning technology indispensable for modern ocean engineering development [1,2,3,4]. Due to the rapid attenuation of electromagnetic waves in the water medium, GNSS signals cannot be directly received in underwater environments. The modern underwater positioning system usually adopts a multi-technology fusion program [5]. The mainstream technologies include GNSS-inertial positioning combined systems, GNSS-visual assisted positioning systems, GNSS-rigid structure conduction systems, and GNSS-acoustic positioning integrated systems. Among these, the inertial positioning system has high data update rate but serious error accumulation [6]; visual assisted positioning has high accuracy but is limited by the water quality [7]; the rigid structure conduction system has high accuracy but is constrained by the depth of water [8]; and the GNSS-acoustic positioning integrated system, with the characteristics of low attenuation of acoustic wave propagation, has the advantages of strong penetration and large applicable water depth range, and it is not affected by the turbidity of the water body and has the best performance in robustness and applicability. It has become the mainstream solution in current underwater positioning technology, but it still faces the technical challenge of accuracy enhancement in actual engineering applications [9,10,11].
Specifically, although GNSS technology has achieved centimeter-level positioning accuracy in both land and marine environments, the overall positioning accuracy of the integrated GNSS-acoustic system is mainly limited by the accuracy bottleneck in the acoustic positioning link [12]. The technical challenges faced by the acoustic positioning system present a hierarchical problem–cause relationship: interface reflections (reflections from the sea surface, seabed, and scatterers) in the marine environment produce serious multipath effects, which cause the same signal to reach the receiver through multiple reflection paths [13]; existing millisecond-duration acoustic signals typically achieve meter-level positioning accuracy, which fails to meet the centimeter-level precision requirements in marine engineering applications. To overcome this fundamental limitation and improve temporal resolution for distinguishing multipath reflections, researchers have adopted microsecond ultrashort pulse signals. However, this approach introduces new technical challenges. Microsecond signals, with pulse widths as short as 10 μ s, exhibit a flat spectral energy distribution lacking prominent frequency-domain features, which renders traditional frequency-domain filtering methods ineffective for noise suppression [14]. Furthermore, their weak signal energy makes them highly susceptible to environmental noise [15] from multiple sources, including mechanical vibration, surface wave interactions, and marine biological sounds, which severely degrades the signal-to-noise ratio. Additionally, conventional cross-correlation algorithms face fundamental limitations in accurately estimating arrival times for such ultrashort pulses, with detection errors reaching several microseconds, which are incompatible with centimeter-level positioning requirements [16]. Therefore, the detection and precise time estimation of microsecond-scale ultrashort pulse signals in complex marine noise environments has become the key technical bottleneck limiting underwater acoustic positioning accuracy.
To address the above problems, this study proposes a novel ultrashort pulse application method for enhancing underwater positioning in ocean engineering. The method is based on the short baseline system architecture. For the key problems of the microsecond signal’s inconspicuous frequency domain characteristics and the failure of traditional filtering methods, the signal-to-noise ratio of the system is directly improved in the time domain by increasing the number of receiving channels and adopting the signal alignment and coherent superposition technique, which effectively solves the interference effect of environmental noise on the microsecond signal. At the same time, a joint energy gradient-phase detection algorithm is designed to quickly identify the signal stability interval through energy gradient analysis, and to achieve high-precision time delay measurement by using precision phase estimation, which breaks through the technical bottleneck of traditional algorithms in the detection of microsecond signals. The experimental results show that the method effectively solves the problem of high-precision detection of microsecond signals, and provides technical support for the application of centimeter-level precision in hydroacoustic positioning systems.
The contributions (novelty) of this work are as follows:
  • Aiming at the fundamental problems of microsecond ultrashort pulse signals with unremarkable spectral characteristics and the failure of traditional filtering methods, as well as the noise interference and multipath effects in the complex marine environment, a multi-channel receiving architecture based on a short baseline system was designed to directly improve the system signal-to-noise ratio in the time domain through signal alignment and coherent superposition techniques. Simulation results show that an 8-channel hydrophone array configuration can achieve a 36.06% signal-to-noise gain in a harsh environment (−10 dB).
  • Innovatively combining energy gradient analysis and phase compensation techniques, a novel detector algorithm is proposed to solve the instability problem of the traditional mutual correlation algorithm in the detection of ultra-short pulse signals at the microsecond level. The algorithm achieves high-precision time delay measurement by identifying the signal stability interval and performing accurate phase estimation. Simulation results show that, compared with the traditional inter-correlation method, the new algorithm achieves an overall improvement in key performance indicators: a 1.24 times improvement in RMSE, a 1.30 times improvement in MAE, a 1.17 times improvement in standard deviation, a 1.18 times improvement in maximum error, and a 19.1% improvement in overall performance.
  • Systematic validation tests were carried out in real marine environments to demonstrate the engineering practicability of the proposed method. The test results show that the multi-channel signal reception method achieves an average signal-to-noise ratio improvement of 2.27 dB, and the TDOA estimation stability of the joint energy gradient-phase detection algorithm is improved by 4.4% to 32.0% compared with that of the traditional method for different channel combinations, which verifies the reliability and superiority of the technical solution in the actual complex marine environment.
The rest of the paper is organized as follows: Section 2 describes our proposed method in detail. Section 3 reports the experimental results. Section 4 summarises the findings of this study. Section 5 indicates future research directions.

2. Methods

In this study, three aspects of signal design, multi-channel signal superposition methods, and detector processing techniques are investigated. The research methodology in this chapter will be discussed in detail around these three key technology lines.

2.1. Signal Design

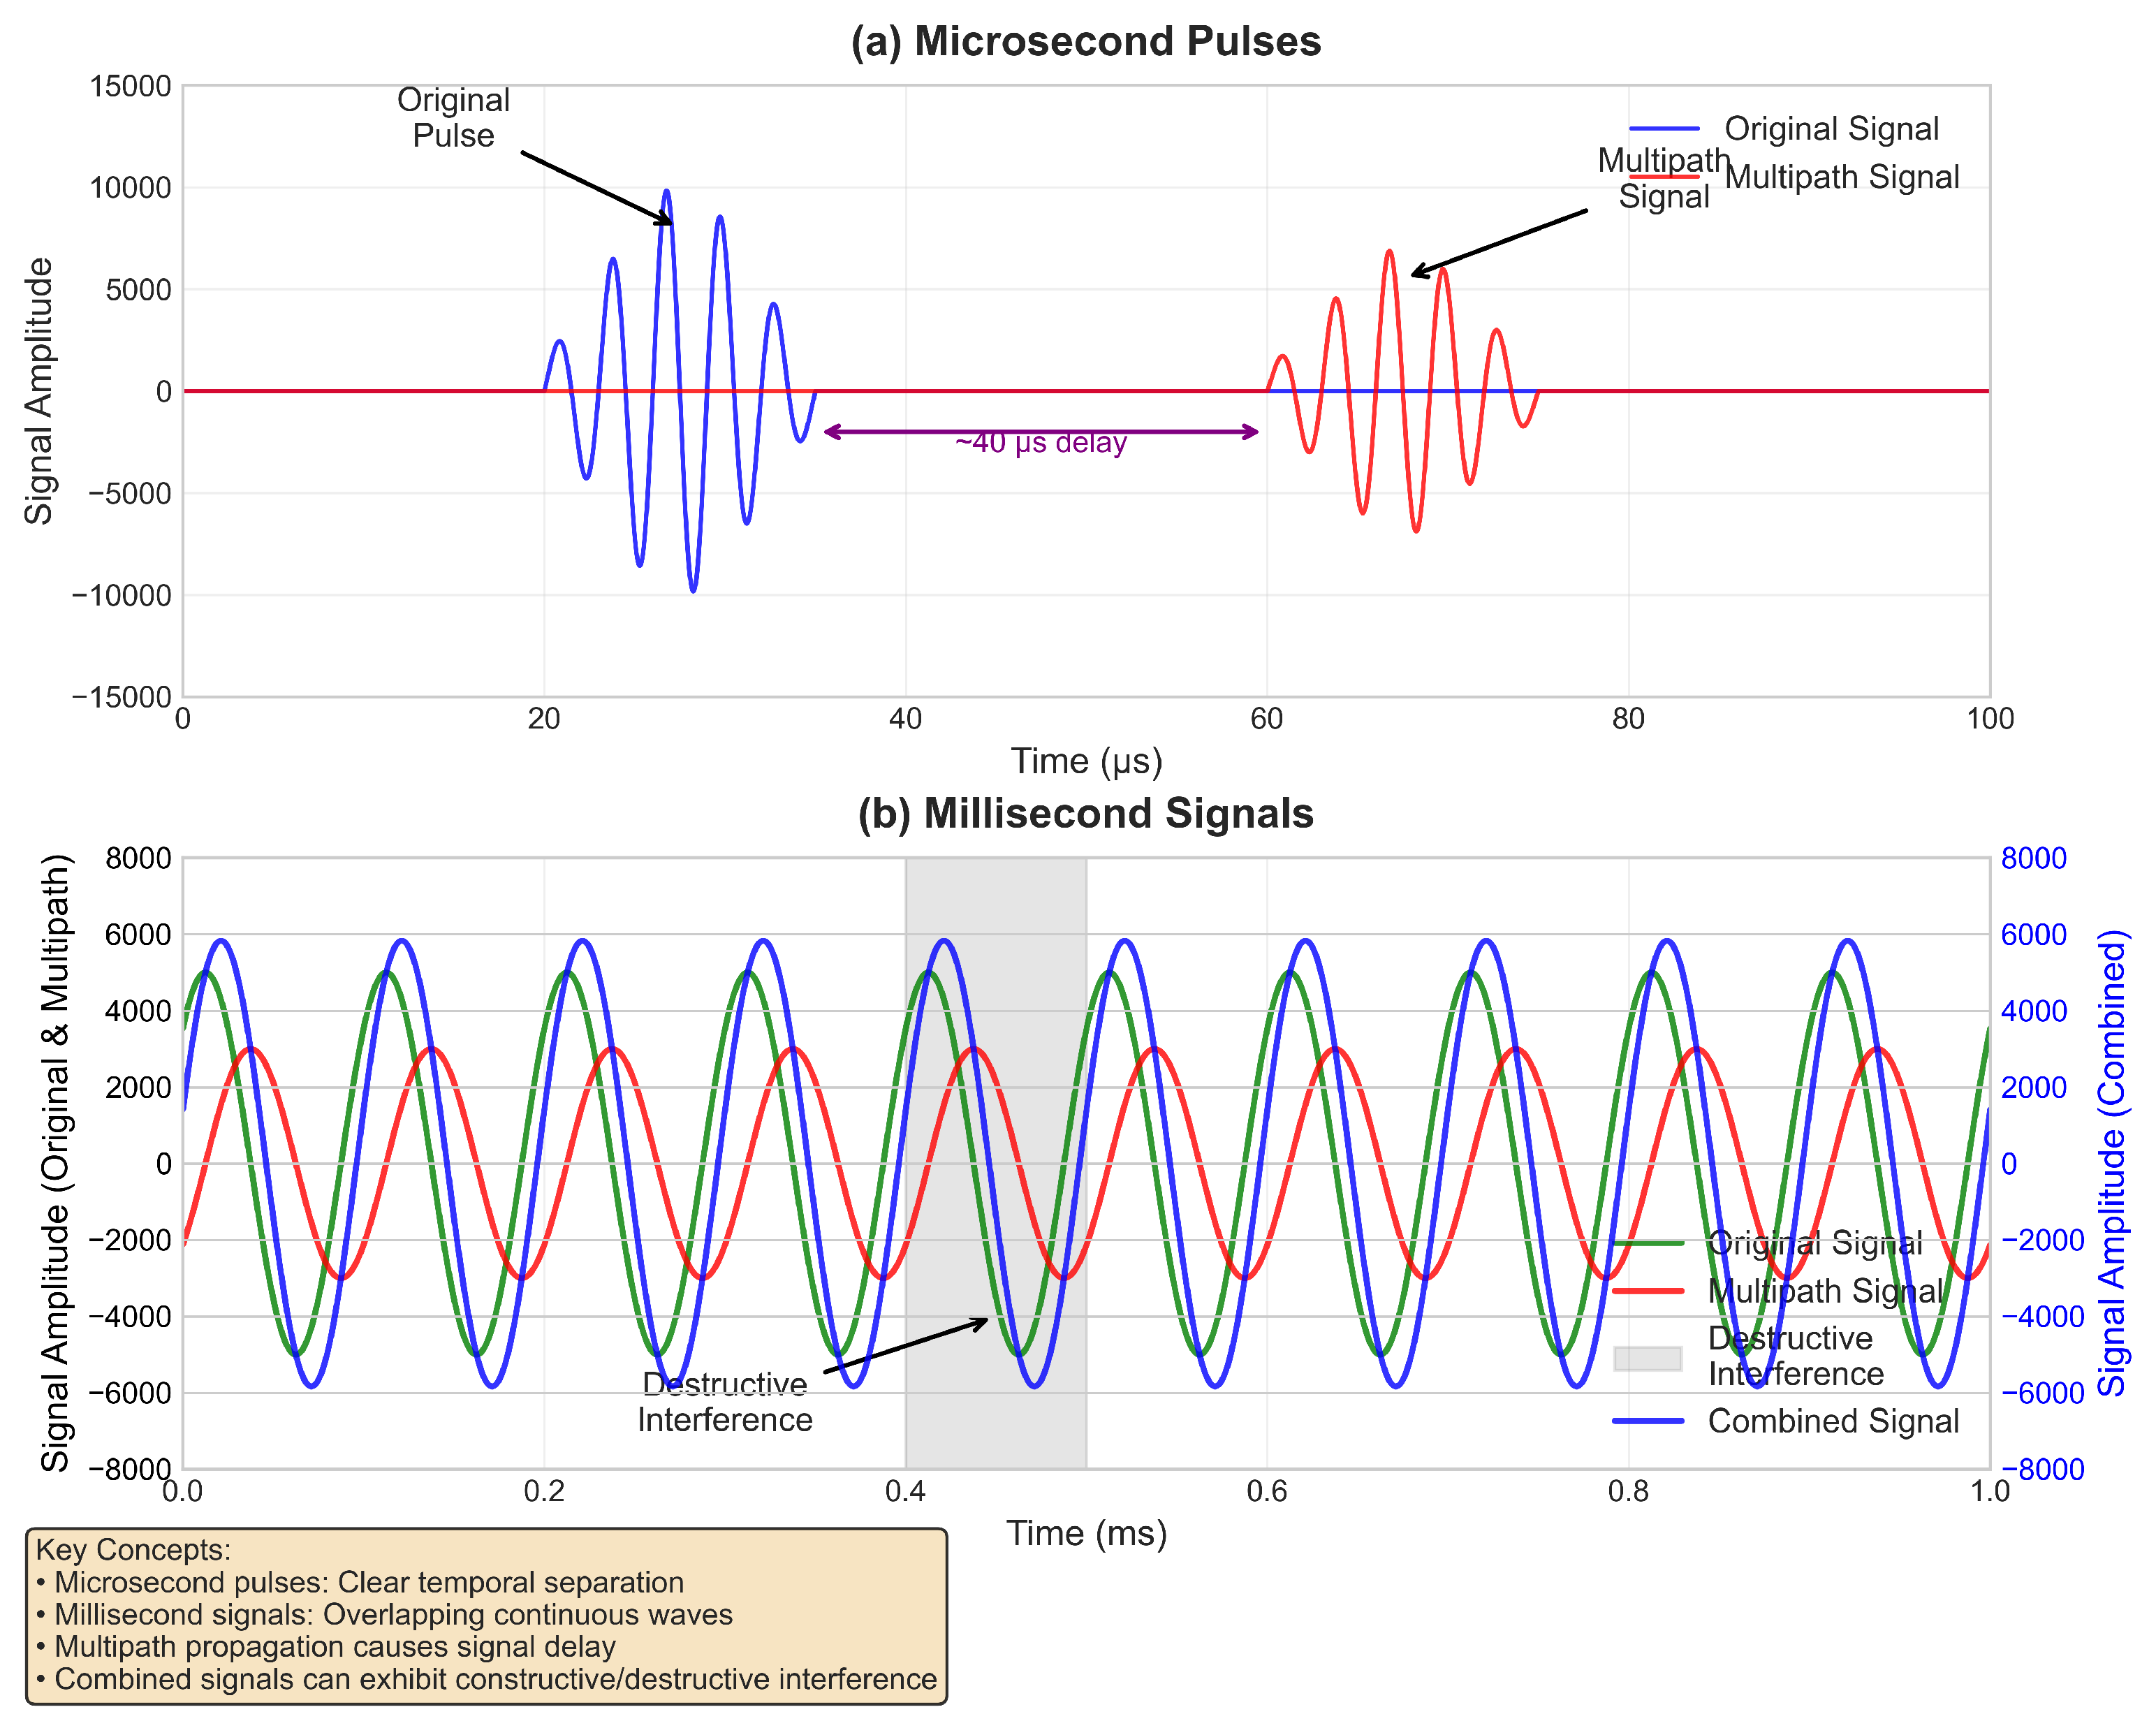
To address the key technological bottlenecks of the traditional millisecond acoustic signal in underwater positioning, such as serious multipath interference and insufficient time resolution, this study proposes to use an ultrashort pulse train with microsecond pulse width as the acoustic source signal. Based on the intrinsic correlation between signal time domain characteristics and multipath suppression capability [17], this design scheme achieves two core technological breakthroughs by significantly shortening the pulse width: effective suppression of the multipath effect and significant improvement of time resolution, thus providing a theoretical basis for achieving centimeter-level underwater positioning accuracy (Figure 1).
From a theoretical perspective, the distinguishability of multipath signals is determined by whether the temporal separation between multipath and direct signals exceeds the transmitted pulse duration. When employing a 10 μ s pulse width, acoustic propagation theory demonstrates that effective signal separation can be achieved when the path difference between multipath and direct signals exceeds merely 7.5 mm. This criterion is readily satisfied in typical marine environments, thereby providing a robust theoretical foundation for multipath interference suppression. Furthermore, compared to conventional millisecond-duration signals, the microsecond pulse width represents a two-order-of-magnitude improvement in temporal resolution, which directly translates to a quantum leap in system positioning accuracy.
Based on the aforementioned theoretical analysis, this study implements a pulsed continuous wave (CW) signal as the specific realization scheme. The signal parameter selection follows a multi-constraint optimization approach: a center frequency of 200 kHz is selected to maximize the signal-to-noise ratio at 100 m water depth, accounting for both noise characteristics and propagation loss properties of the underwater acoustic channel. The pulse width is configured at 10 μ s with adjustable options of 25/50/80 μ s to accommodate the trade-off between temporal resolution requirements and signal detection reliability across diverse marine environments. The sampling frequency is established at 1 MHz, which not only satisfies the Nyquist sampling criterion but also provides adequate computational margin for advanced signal processing algorithms. The core technical parameters are summarized in Table 1.

2.2. Multi-Channel Signal Fusion

Leveraging the fundamental distinction between signal coherence and noise incoherence in underwater acoustic environments [18], this study proposes a multi-channel signal superposition methodology that integrates template cross-correlation with maximum ratio combining (MRC). The proposed approach exploits a priori knowledge of acoustic source signals to achieve adaptive weight allocation, thereby enhancing signal quality. The processing flow is illustrated in Figure 2.

2.2.1. Alignment

Given the compact spatial configuration of the multi-channel sensor array, the received signals across channels exhibit high waveform similarity, differing primarily in temporal delays [19]. This study employs a cross-correlation-based signal alignment methodology, with implementation procedures as follows:
Step 1: Select the middle channel of each hydrophone as the reference signal s i mid ( t )
Step 2: Compute the cross-correlation function between each channel and the designated reference channel to quantify temporal offsets.
R i j , i mid ( τ ) = s i j ( t ) s i mid ( t + τ ) d t
Step 3: Determine the delay corresponding to the maximum value of the cross-correlation function.
Δ ^ τ i j = arg max τ R i j , i mid ( τ )
Step 4: Time-shift compensation for each channel signal.
s i j aligned ( t ) = s i j ( t + Δ ^ τ i j )
To enhance alignment precision, interpolation techniques are employed to estimate sub-sample temporal offsets, thereby achieving finer resolution than the native sampling interval.

2.2.2. Signal Superposition Approach

Based on the temporally aligned multi-channel signals, this study employs a dual-metric weighting strategy that evaluates channel quality through signal correlation and signal-to-noise ratio assessment to optimize weight distribution.
Using the predicted source template signal s temp ( t ) , the normalized correlation number of each channel signal is calculated to assess the signal quality. For the aligned channel signal s i j aligned ( t ) , the normalized correlation number is as follows:
ρ i j = max t | C i j ( t ) | | s temp ( t ) | 2 d t · | s i j aligned | 2 d t
where C i j ( t ) = s temp ( τ ) s i j aligned ( t + τ ) d τ is the cross-correlation function, where s temp ( τ ) is a τ μ s CW pulse at 200 kHz . The coefficient ρ i j [ 0 , 1 ] reflects how well the channel signal matches the ideal signal.
On this basis, the instantaneous signal-to-noise ratio (SNR) of each channel is estimated by short-time power spectrum γ i j ( t ) = P s , i j ( t ) P n , i j ( t ) . In view of the extremely low duty cycle of the microsecond pulse signal, the environmental noise is sampled before and after the pulse in the time period from 2 τ to 1000 μ s by using the ’lead–follow’ dual window method to avoid the interference of the pulse trailing, and the EWMA method is introduced to smoothly update the noise power estimation, which enhances the system’s adaptability to the non-stationary characteristics of the marine environment.
Combined with the MRC principle, the weighting coefficients of each channel are jointly determined by the signal match and the signal-to-noise ratio:
ω i j ( t ) = ρ i j ( t ) · γ i j ( t ) k = 1 N ρ i k ( t ) · γ i j ( t )
The final fusion signal is as follows:
s i ^ ( t ) = j = 1 n ω i j ( t ) · s i j aligned ( t )
The method ensures that high-quality channels are given more weight, while suppressing the influence of channels that are heavily affected by interference to maximize signal quality.

2.3. Detection Method

Conventional detection methods in underwater acoustic positioning systems primarily include energy detection, correlation detection, and matched filtering techniques [20]. Energy detection determines signal arrival by establishing amplitude thresholds; however, initial amplitude fluctuations in ultra-short pulse signals are susceptible to noise interference, and the inability to exploit phase information results in limited temporal estimation accuracy [21]. While correlation detection exhibits certain noise immunity, incomplete phase sampling of ultra-short pulses introduces phase ambiguity, and conventional correlation algorithms cannot adequately address phase discontinuities at signal onset [22]. Matched filtering demonstrates sensitivity to waveform distortion, where hardware sampling constraints and the inherent instability of ultra-short pulses degrade matching performance [23].
The fundamental limitation of these conventional approaches lies in their inability to effectively identify and exploit stable intervals within ultra-short pulse signals. In the presence of amplitude fluctuations, phase discontinuities, and waveform distortion, accurate determination of the first-arrival waveform within the signal’s stable region becomes challenging, consequently compromising positioning accuracy.
Addressing the limitations of traditional detection techniques, this study introduces a hybrid detection methodology combining energy gradient analysis with phase-based estimation. The approach systematically identifies stable signal intervals to isolate the first-arrival waveform segment, then exploits phase information to achieve high-precision temporal localization. This integrated framework effectively mitigates the technical challenges associated with ultra-short pulse signal detection.
The method mainly consists of two key technical aspects: stable interval identification and phase-accurate estimation. In terms of stable interval identification, the signal gradient analysis technique is introduced in this study.
The signal gradient is defined as follows:
s ( t ) = s ( t ) s ( t 1 )
Based on the gradient values, it is possible to locate parts of the signal where the energy is not stable:
  • Signal Energy Rising Interval: [ t i , t j ] | t [ t i , t j ] , s ( t ) > η p
  • Signal energy drop interval: [ t k , t l ] | t [ t k , t l ] , s ( t ) < η n
where η p and η n are positive and negative gradient thresholds.
By analyzing these gradient change patterns, the stabilization phase of the signal can be accurately identified, providing a reliable data base for subsequent accurate time estimation.
After obtaining the stable signal segments, and in order to achieve accurate time estimation, this study uses the least squares method to fit a sine wave to the signal in the stable interval. It is assumed that the received signal can be expressed as follows:
x [ n ] = A cos ( ω n + ϕ ) + ϵ [ n ] , n = 0 , 1 , , 24
where ω = 2 π f c / f s is the normalized angular frequency, f c is the center frequency and f s is the sampling frequency.
By constructing the orthogonal basis functions:
s [ n ] = sin ( ω n ) , c [ n ] = cos ( ω n )
Calculate the projection of the signal with respect to the basis function and the energy of the basis function:
S x s = n = 0 24 x [ n ] s [ n ] , S x c = n = 0 24 x [ n ] c [ n ]
S s s = n = 0 24 s [ n ] s [ n ] , S c c = n = 0 24 c [ n ] c [ n ]
The fitting coefficients can be obtained:
a = S x s / S s s , b = S x c / S c c
The corresponding amplitude and phase parameters are then extracted:
A ^ = a 2 + b 2 , ϕ ^ = arctan ( b , a )
The phase compensation time delay is as follows:
Δ t phase = ϕ ^ 2 π f c
The final signal arrival time is as follows:
Δ t arrival = t peak Δ t phase · f s
Integrating the established mathematical models, the multi-channel signal processing Algorithm 1 proceeds as follows:
Algorithm 1: Multi-channel Signal Processing Algorithm
  • Require: Data file directory; Sampling frequency f s ; Center frequency f c ; Pulse width pulse_width
  • Ensure: TOA_All: Precise arrival times matrix
  • 1: Step 1: Initialize environment parameters
  • 2: Create template signal
  • 3: Apply bandpass filter to template
  • 4: Normalize template
  • 5: Step 2: For each data file
  • 6: Read file header information (gain, sampling rate)
  • 7: Read data
  • 8: Initialize TOA matrix ( m × n )
  • 9: Step 3: Signal alignment for multi-channel data
  • 10: Select mid-channel as reference for each hydrophone
  • 11: Calculate cross-correlation between each channel and reference
  • 12: Find delay at maximum correlation position
  • 13: Apply time shift compensation to align signals
  • 14: Step 4: Signal fusion using weighted combination
  • 15: Calculate normalized correlation coefficient for each channel
  • 16: Estimate signal and noise power for each channel
  • 17: Compute SNR as γ
  • 18: Calculate weights based on correlation and SNR
  • 19: Perform weighted sum of aligned signals
  • 20: Step 5: For each channel (i = 1∼m)
  • 21: Calculate cross-correlation between raw signal and template
  • 22: Normalize cross-correlation result
  • 23: For each second of data ( sec = 1 to n):
  • 24:      a. Find maximum peak position within the second
  • 25:      b. Extract local signal and remove mean
  • 26:      c. Call SeakPeak function for precise peak detection:
  • 27:         i. Find all peaks using prominence threshold = 0.1
  • 28:         ii. Apply minimum peak separation = 4 samples
  • 29:         iii. Filter peaks: retain only peaks 0.1 × max ( signal )
  • 30:         iv. Calculate gradient and find stable regions
  • 31:         v. Extract waveform segment and fit sine wave
  • 32:         vi. Apply phase compensation if | A fit | > 0.1
  • 33:         vii. Calculate precise arrival time using phase compensation
  • 34:      d. Record arrival time to TOA_All matrix
  • 35: Step 6: Save results to output file
Subfunction 1: FindStableRegions
  • Find indices where gradient is greater than η p = 10 and less than η p = −10
  • Group consecutive indices to form stable regions
  • Return the start of first positive gradient region and end of last negative gradient region
Subfunction 2: FitSineWave
  • Construct basis functions sin ( ω n ) and cos ( ω n )
  • Calculate signal projections onto basis functions
  • Calculate amplitude and phase
Subfunction 3: EstimateNoisePower
For each detected pulse:
  • Extract pre-pulse window (pulse peak 1000 μ s to pulse peak 2 · τ )
  • Extract post-pulse window (pulse peak + 2 · τ to pulse peak + 1000 μ s)
  • Calculate mean energy as P measured
  • Update noise power using EWMA: P updated = α · P measured + ( 1 α ) · P previous , α = 0.1

3. Experiment

3.1. Simulation Experiment

To validate the effectiveness of the proposed multi-channel signal fusion methodology and the joint energy-gradient phase detection algorithm, a comprehensive numerical simulation based on the short baseline positioning system is conducted. The simulation focuses on investigating two critical technical aspects:
1.
The gain effect of multi-channel stacking in a low signal-to-noise ratio environment.
2.
Accuracy enhancement of the new detector algorithm over the conventional inter-correlation method.

3.1.1. Simulation Experiment Design

This simulation is based on the construction of a short baseline system of 8 hydrophones, each equipped with 4 receiver channels, forming a 32-channel simultaneous acquisition system. The hydrophone configuration employs a quadruple-channel architecture where four independent receiving elements are uniformly distributed in a circular configuration within each hydrophone. This symmetric four-channel arrangement within each hydrophone unit enhances spatial sampling and provides improved directional sensitivity. The key parameters are set as Table 2 and Table 3.
The steps for implementation are as follows:
Step 1: Signal generation and propagation modeling
A template signal featuring a three-phase envelope structure is generated, comprising a rising phase (25 μ s), a stable phase (35 μ s), and a decay phase (60 μ s), with pulse signals transmitted at 1-s intervals to construct a 6-s test sequence.
Step 2: Multi-channel signal reception simulation
Channel-specific propagation delays are computed based on hydrophone array geometry and source bearing, with additive noise and multipath interference incorporated to synthesize realistic 32-channel received signals.
Step 3: Signal Processing and Algorithm Validation
The evaluation encompasses both signal-to-noise ratio enhancement and detection algorithm performance assessment. Initially, the signal-to-noise ratios before and after multi-channel fusion are compared to evaluate the effectiveness of the proposed superposition technique. Subsequently, the fused signals are processed using both conventional cross-correlation methods and the proposed joint energy-gradient phase detection algorithm. Performance comparison focuses on two critical metrics: detection accuracy and algorithmic stability, thereby validating the efficacy and advantages of the developed detection approach. Please refer to Multi-channel Signal Processing Algorithm for the specific algorithm flow.

3.1.2. Simulation Results and Analysis

In this section, simulation experiments are conducted to verify the effect of multi-channel signal superposition and the performance of the joint energy gradient-phase detection algorithm s. Comparative analyses are conducted with the traditional cross-correlation methods, focusing on the algorithm’s performance in the detection of microsecond pulsed signals and the estimation of time delays.
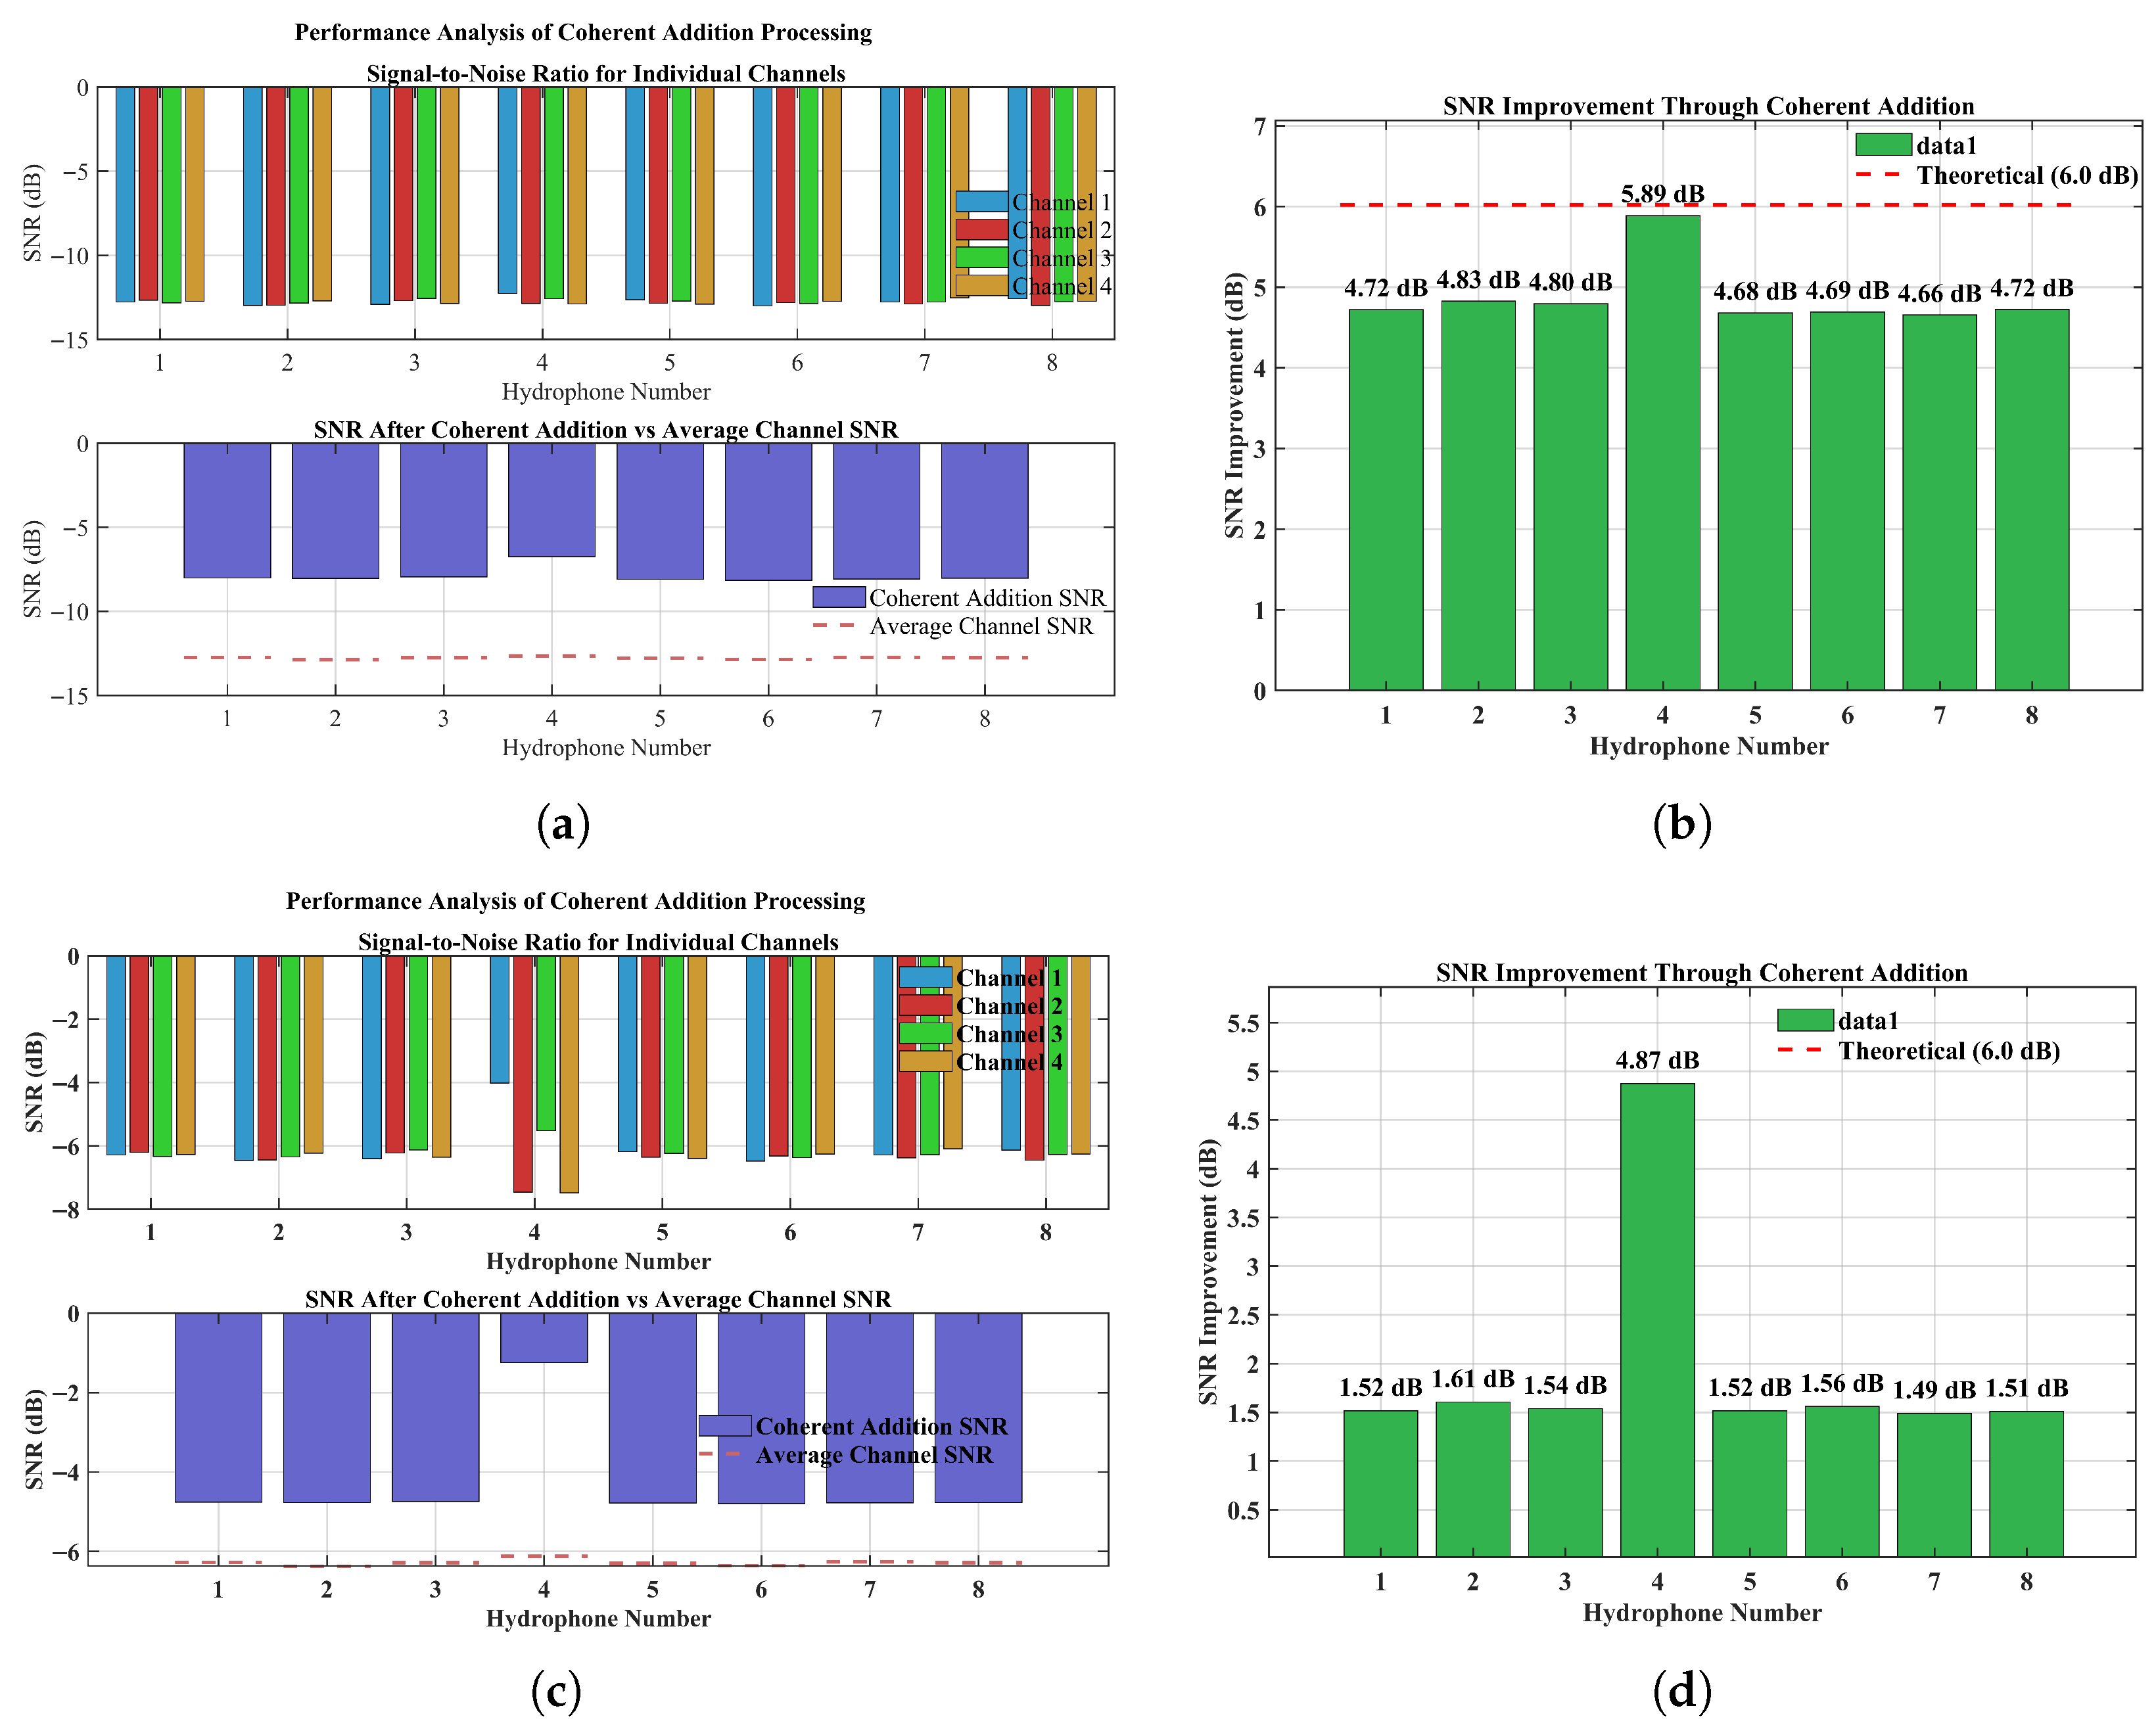
In order to verify the effectiveness of multi-channel cooperative reception, the changes in the signal-to-noise ratio before and after the superposition of the signals of each channel are tested under the conditions of −10 dB and 0 dB ambient noise, respectively, and the results are shown in Figure 3.
The simulation results demonstrate that the joint energy-gradient phase detection algorithm exhibits robust detection stability and superior accuracy when processing ultra-short pulse signals. Simulation results show that coherent accumulation of multi-channel signals after alignment can significantly improve the signal-to-noise ratio. Under −10 dB harsh noise environment, the SNR improvement reaches 36.06%; under 0 dB better environment, 24.40% improvement can still be obtained.
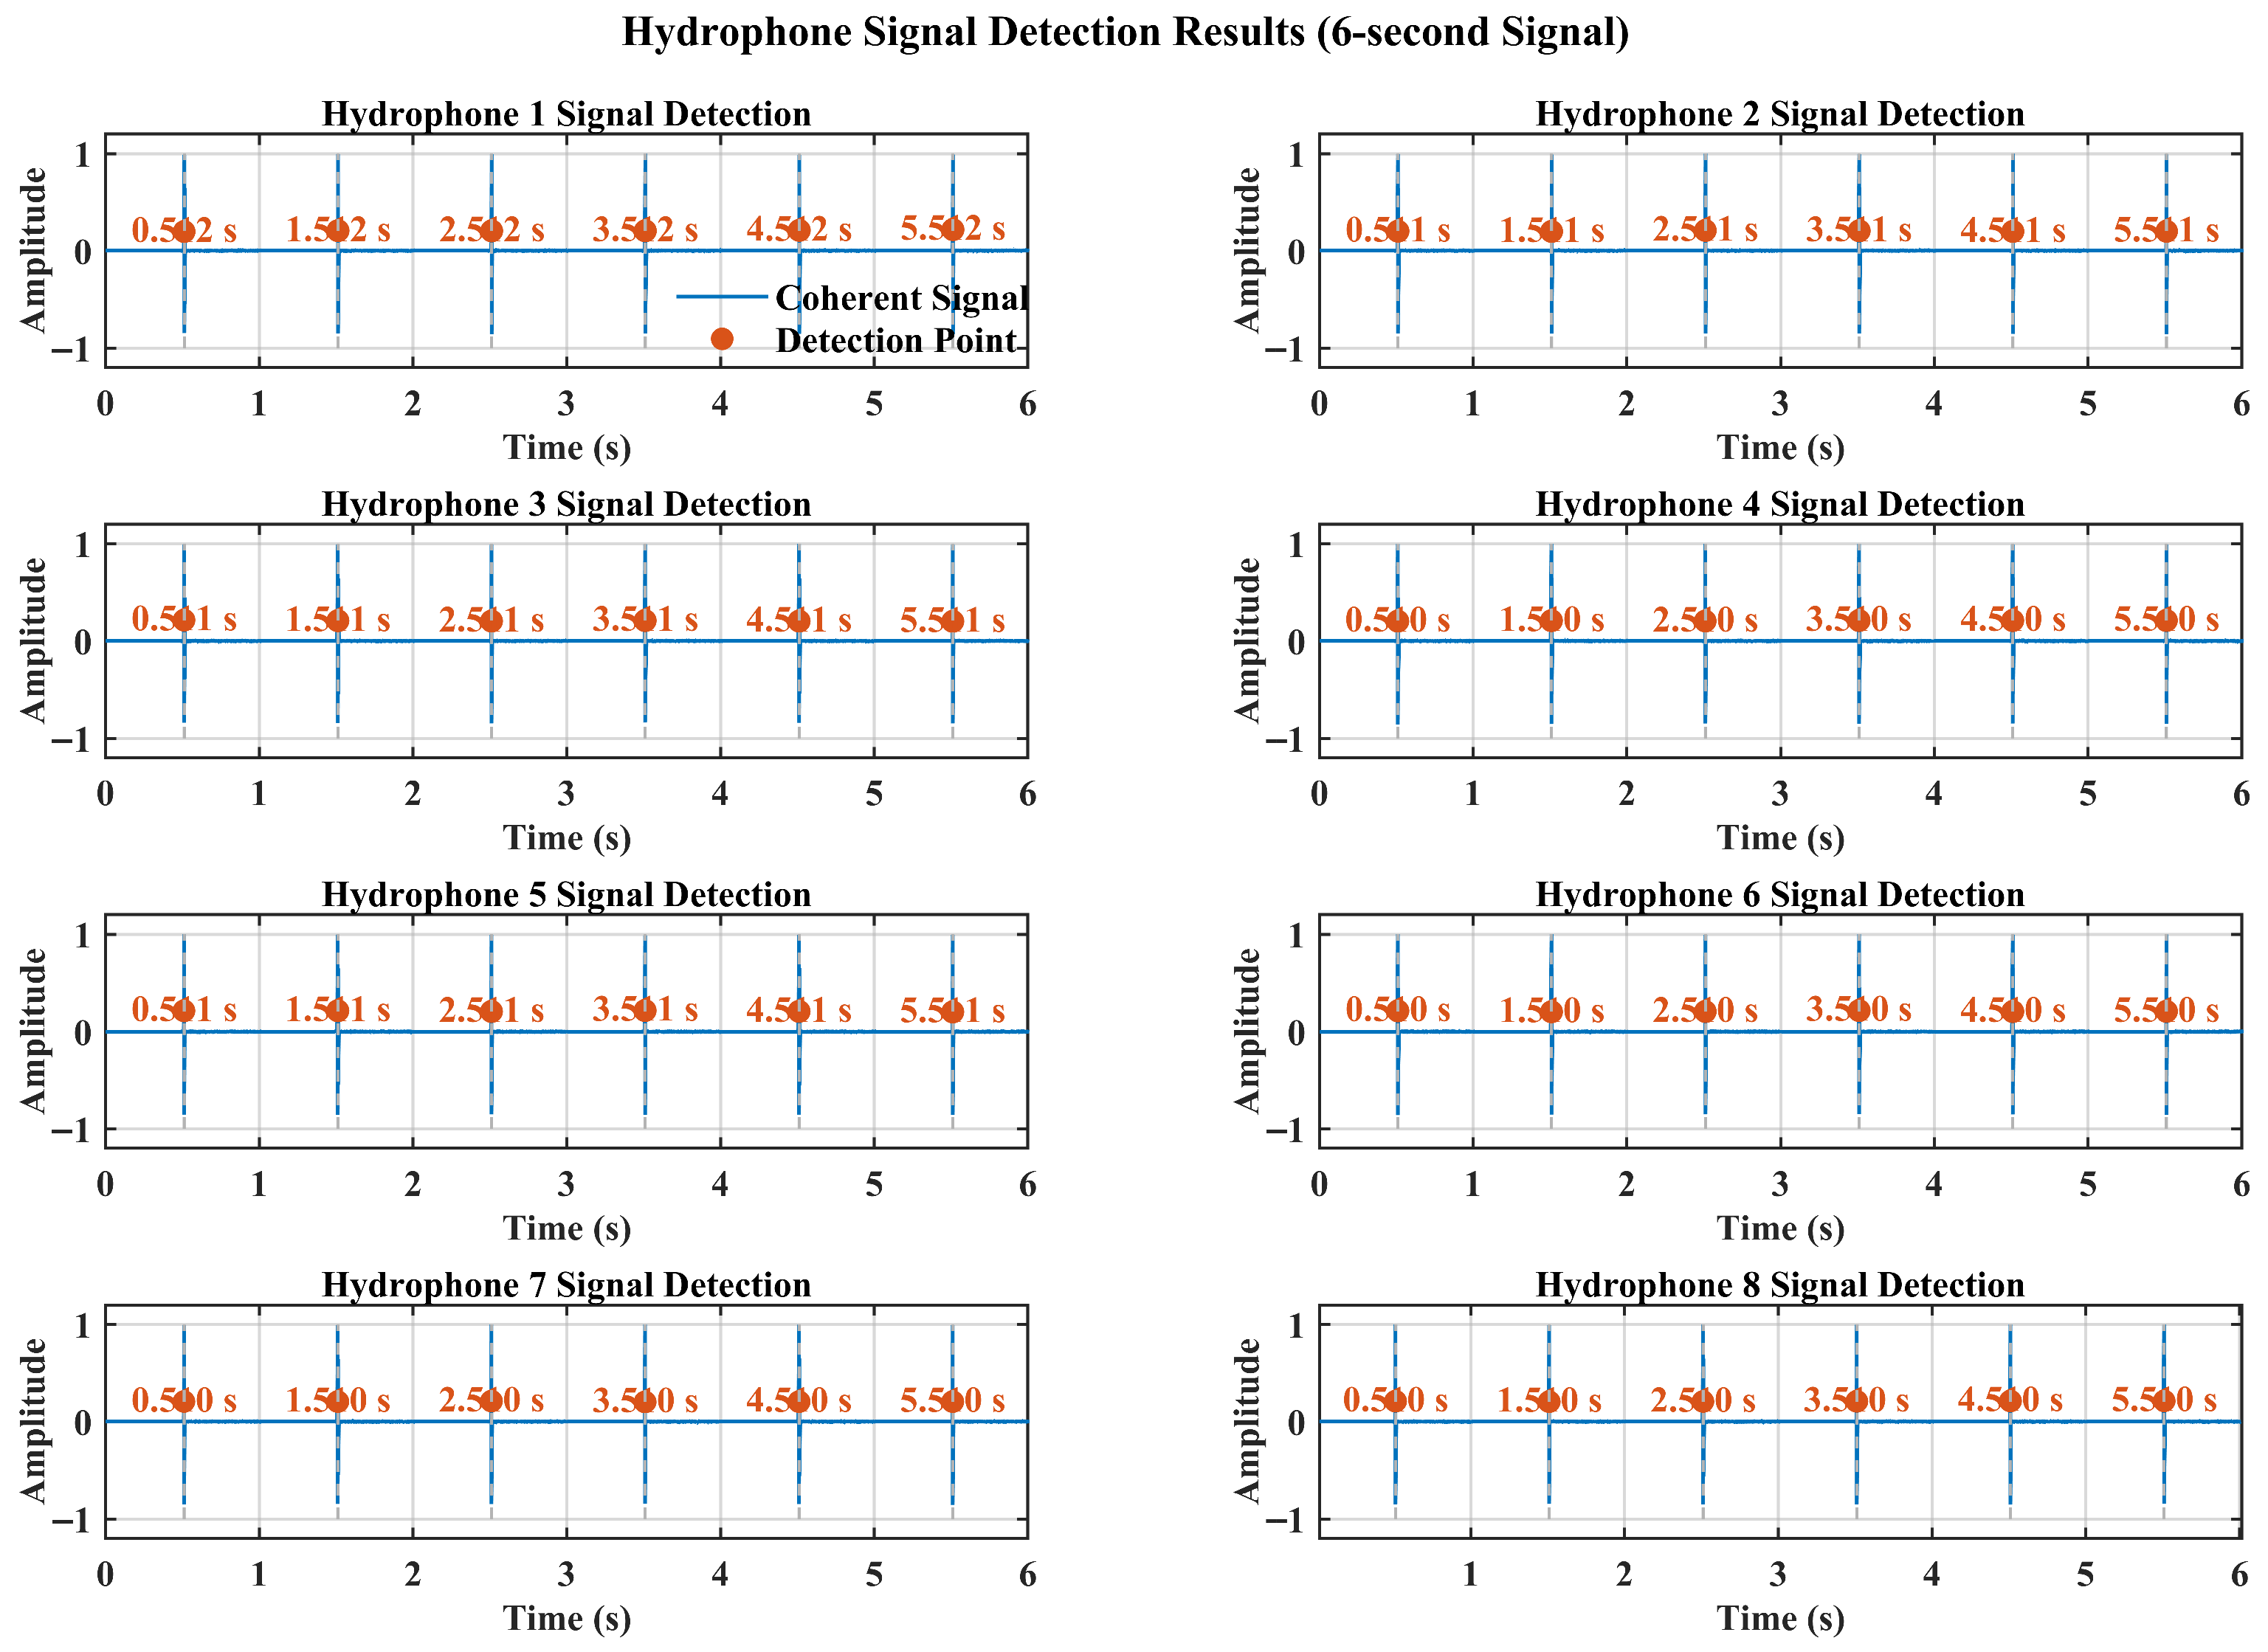
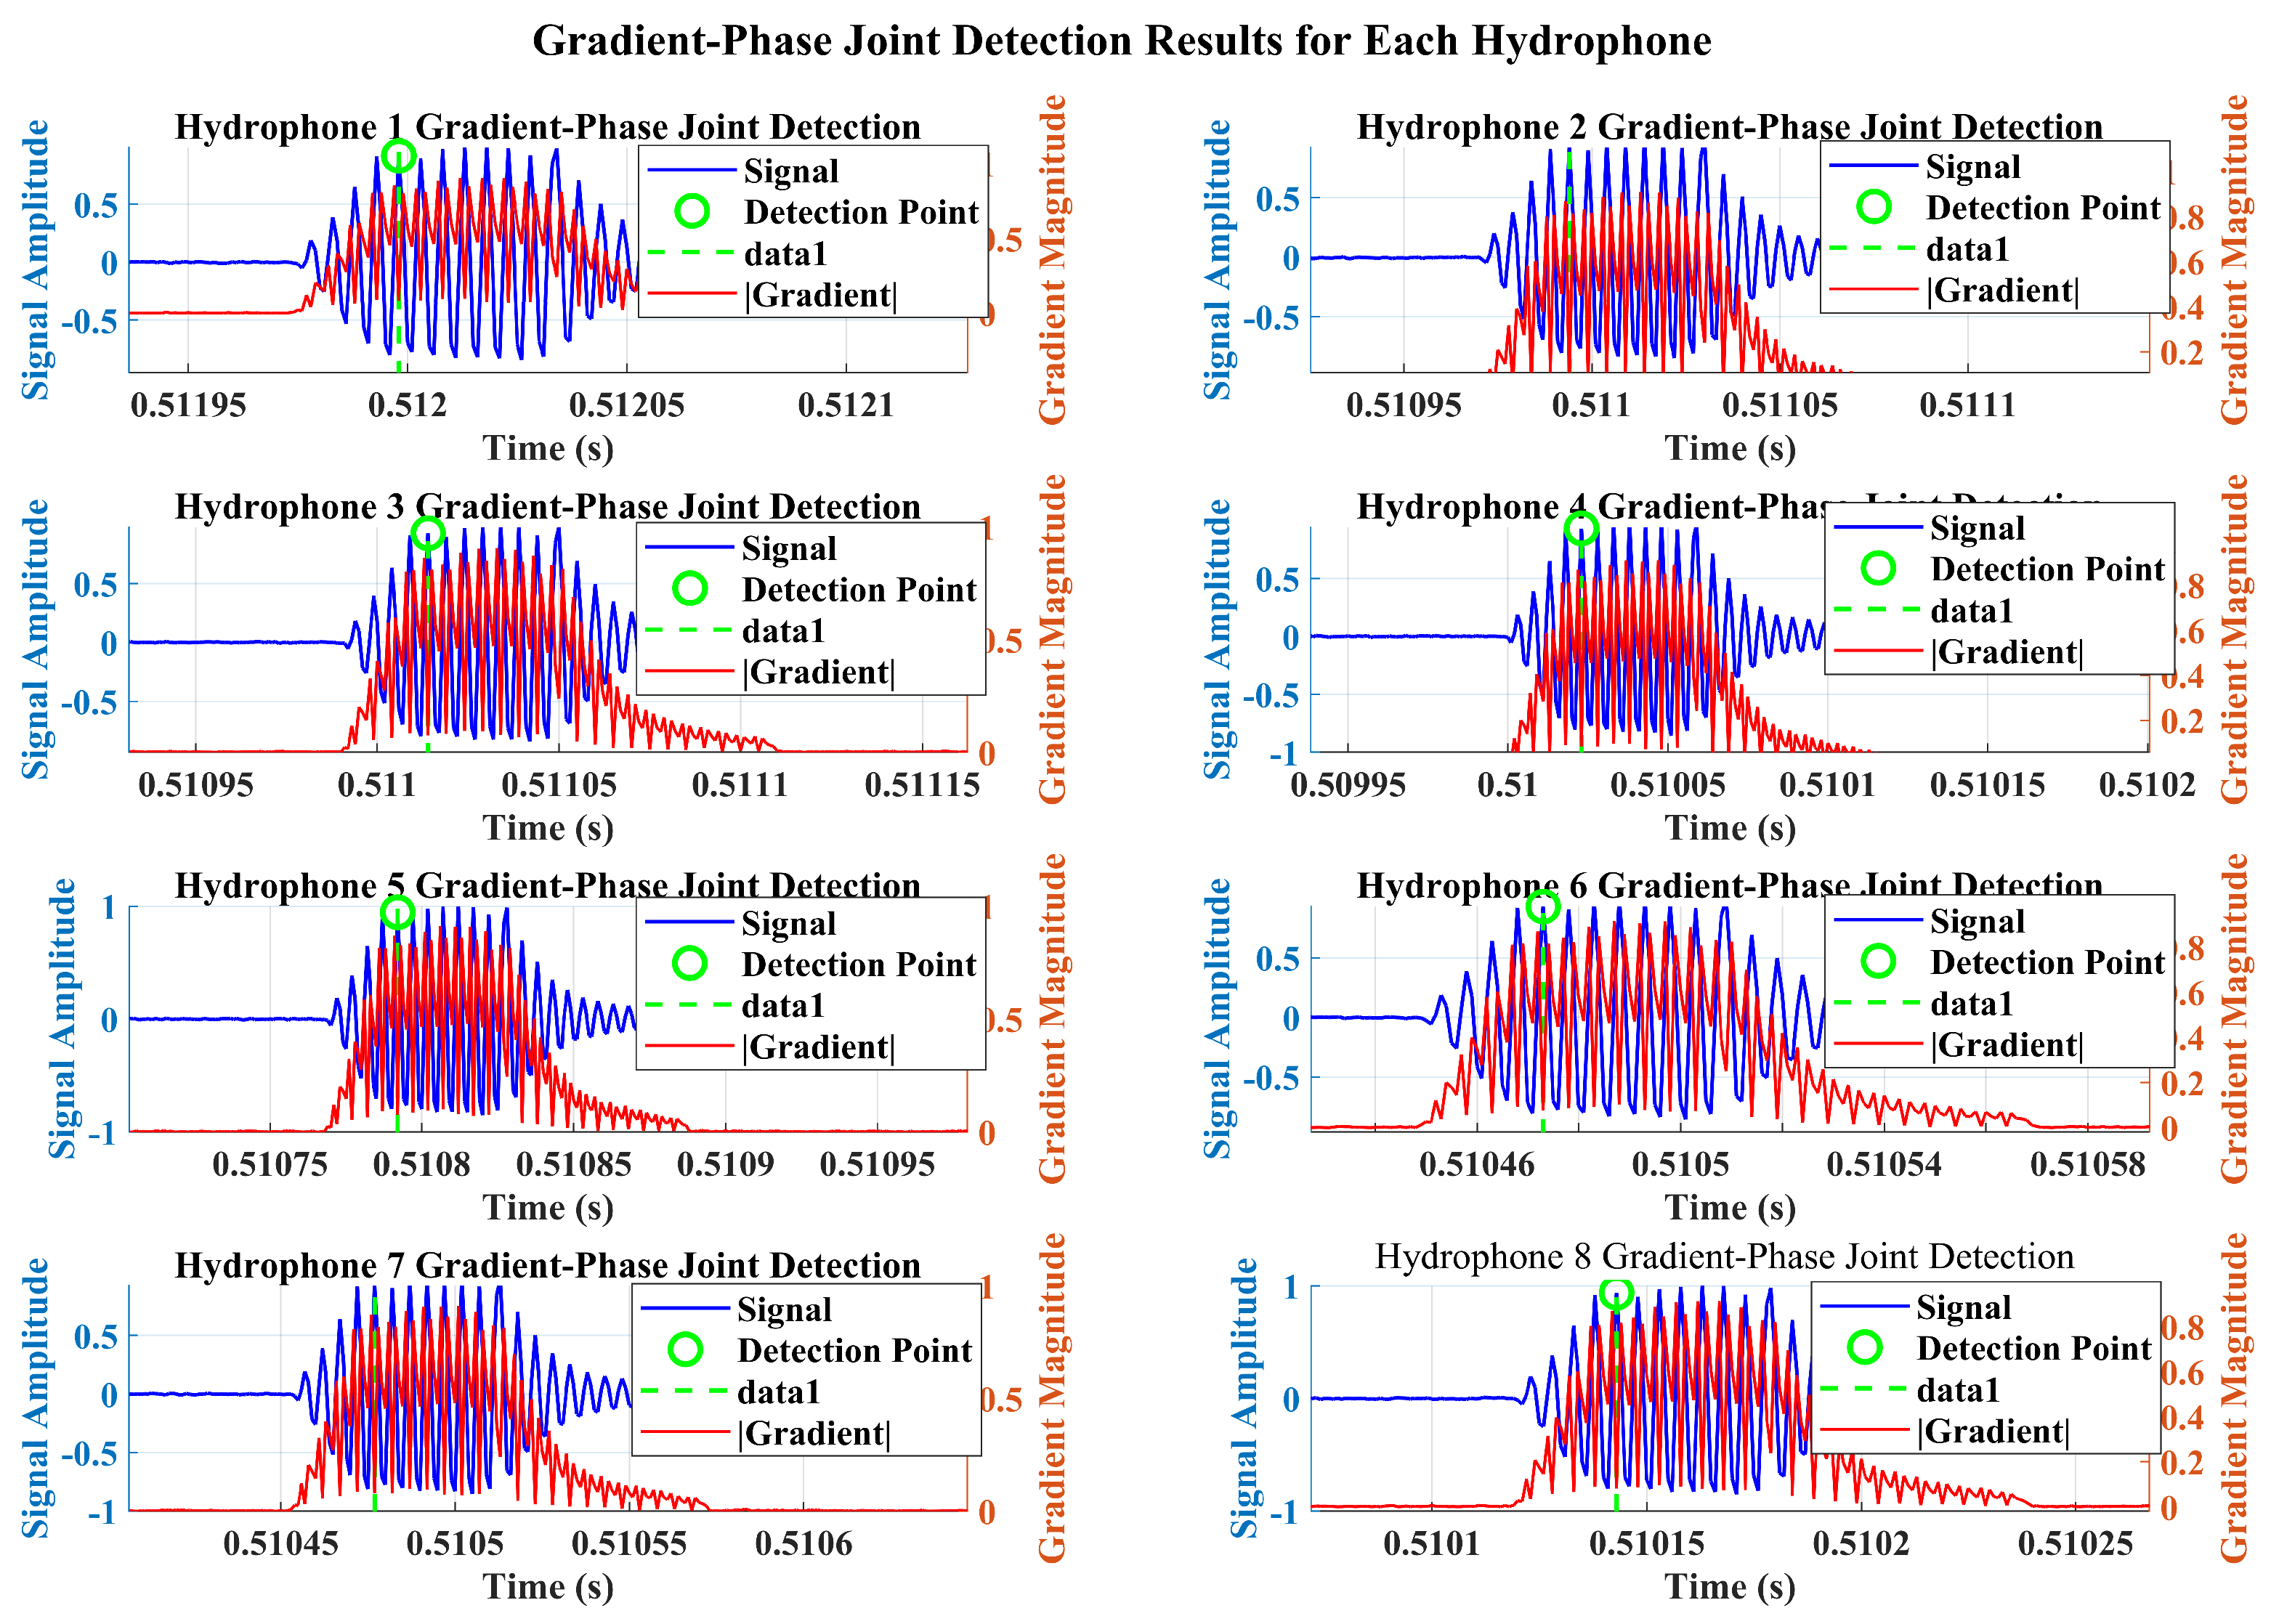
The detection performance of the proposed joint energy-gradient phase algorithm is evaluated using ultra-short pulse signals, with comprehensive performance metrics and detailed detection outcomes presented in Figure 4 and Figure 5, respectively.
The simulation results demonstrate that the joint energy-gradient phase detection algorithm exhibits robust detection stability and superior accuracy when processing ultra-short pulse signals.
To further validate algorithm performance, TDOA calculations are performed using hydrophone 4 as the reference channel, with systematic comparison of detection timing and delay estimation accuracy between the proposed algorithm and conventional cross-correlation methods. Comparative detection performance is summarized in Table 4.
Analysis of the data presented in Table 4 reveals that both detection methods achieve successful signal identification in the majority of test cases, albeit with systematic differences in performance characteristics. The joint energy-gradient phase detection algorithm consistently identifies signal arrival times approximately 29 μ s later than the conventional cross-correlation approach. This temporal offset demonstrates remarkable stability and consistency across measurements, indicating an intrinsic algorithmic difference in signal feature extraction rather than stochastic error propagation. Notably, the cross-correlation method exhibits detection inconsistencies across certain hydrophone channels (highlighted entries in Table 4), thereby demonstrating the inherent stability limitations of traditional detection methodologies.
To comprehensively evaluate algorithmic performance, TDOA estimation results from both approaches are compared against theoretical reference values, with comparative analysis presented in Figure 6.
Figure 6a illustrates the TDOA estimation accuracy performance of both detection algorithms across eight hydrophone positions. Experimental analysis demonstrates that the joint energy-gradient phase algorithm (blue circles) and conventional cross-correlation method (orange diamonds) successfully track the theoretical reference values (green squares). However, the proposed energy-gradient phase approach exhibits superior overall tracking precision compared to the traditional methodology. The magnified view of the H1–H3 interval demonstrates that within high-magnitude TDOA regions, the energy-gradient phase algorithm achieves significantly reduced deviation from theoretical values relative to the conventional cross-correlation approach.
Figure 6b provides a detailed analysis of the absolute error at each hydrophone location. The data show that at position H1, the absolute error of the energy gradient-phase method is 0.028 ms, which is 17.6% less compared to 0.034 ms for the mutual correlation method; at position H3, the errors of the two methods are 0.017 ms and 0.024 ms, respectively, with the former 29.2% less compared to the latter. At position H8, the two methods both reach the lowest error level of 0.00009 ms, indicating that the performance of the algorithms converges in this geometric configuration.
The algorithmic differences are further quantified by the statistical analysis of the performance metrics in Figure 6c. The energy gradient-phase method outperforms the conventional method in four key metrics: the RMSE decreases from 0.0167 ms to 0.0135 ms, the MAE decreases from 0.0125 ms to 0.0096 ms, the standard deviation decreases from 0.012 ms to 0.0102 ms, and the maximum error decreases from 0.0334 ms to 0.0284 ms.
The performance summary in Figure 6d shows that the combined energy gradient-phase detection method achieves an overall performance improvement over the conventional inter-correlation method: 1.24-fold improvement in RMSE, 1.30-fold improvement in MAE, 1.17-fold improvement in standard deviation, and 1.18-fold improvement in maximum error. Statistical significance testing confirms that these performance improvements are statistically significant (t = 3.892, p = 0.015 < 0.05), providing robust evidence for the superiority of the proposed method over conventional approaches. A comprehensive evaluation based on the RMSE improvement multiple shows that the new method achieves an overall performance improvement of 19.1% (formula: R = ( 1 1 RMSE ) × 100 % , where R is the RMSE improvement multiple), which verifies the effectiveness and superiority of the joint energy gradient-phase detection algorithm for the TDOA estimation task.
The simulation experiment results verify the effectiveness of the proposed technical scheme. The multi-channel cooperative reception strategy can significantly improve the signal quality under low SNR conditions, with a SNR gain of 36.06% under the worst environment ( 10 dB), and still 24.40% under the better environment (0 dB). The joint energy gradient-phase detection algorithm shows a significant advantage over the traditional mutual correlation method in terms of delay estimation accuracy, with a comprehensive performance improvement of 19.1%, as well as a significant improvement in detection stability. These results fully demonstrate the technical advantages of the proposed algorithm in microsecond hydroacoustic pulse signal detection.
3.2. Real-Life Experiments

To validate the effectiveness of the proposed multi-channel signal fusion methodology and joint energy-gradient phase detection algorithm in realistic marine environments, field trials were conducted in Zhuhai City, Guangdong Province, China, during January 2025.

3.2.1. Marine Environment and Equipment Configuration

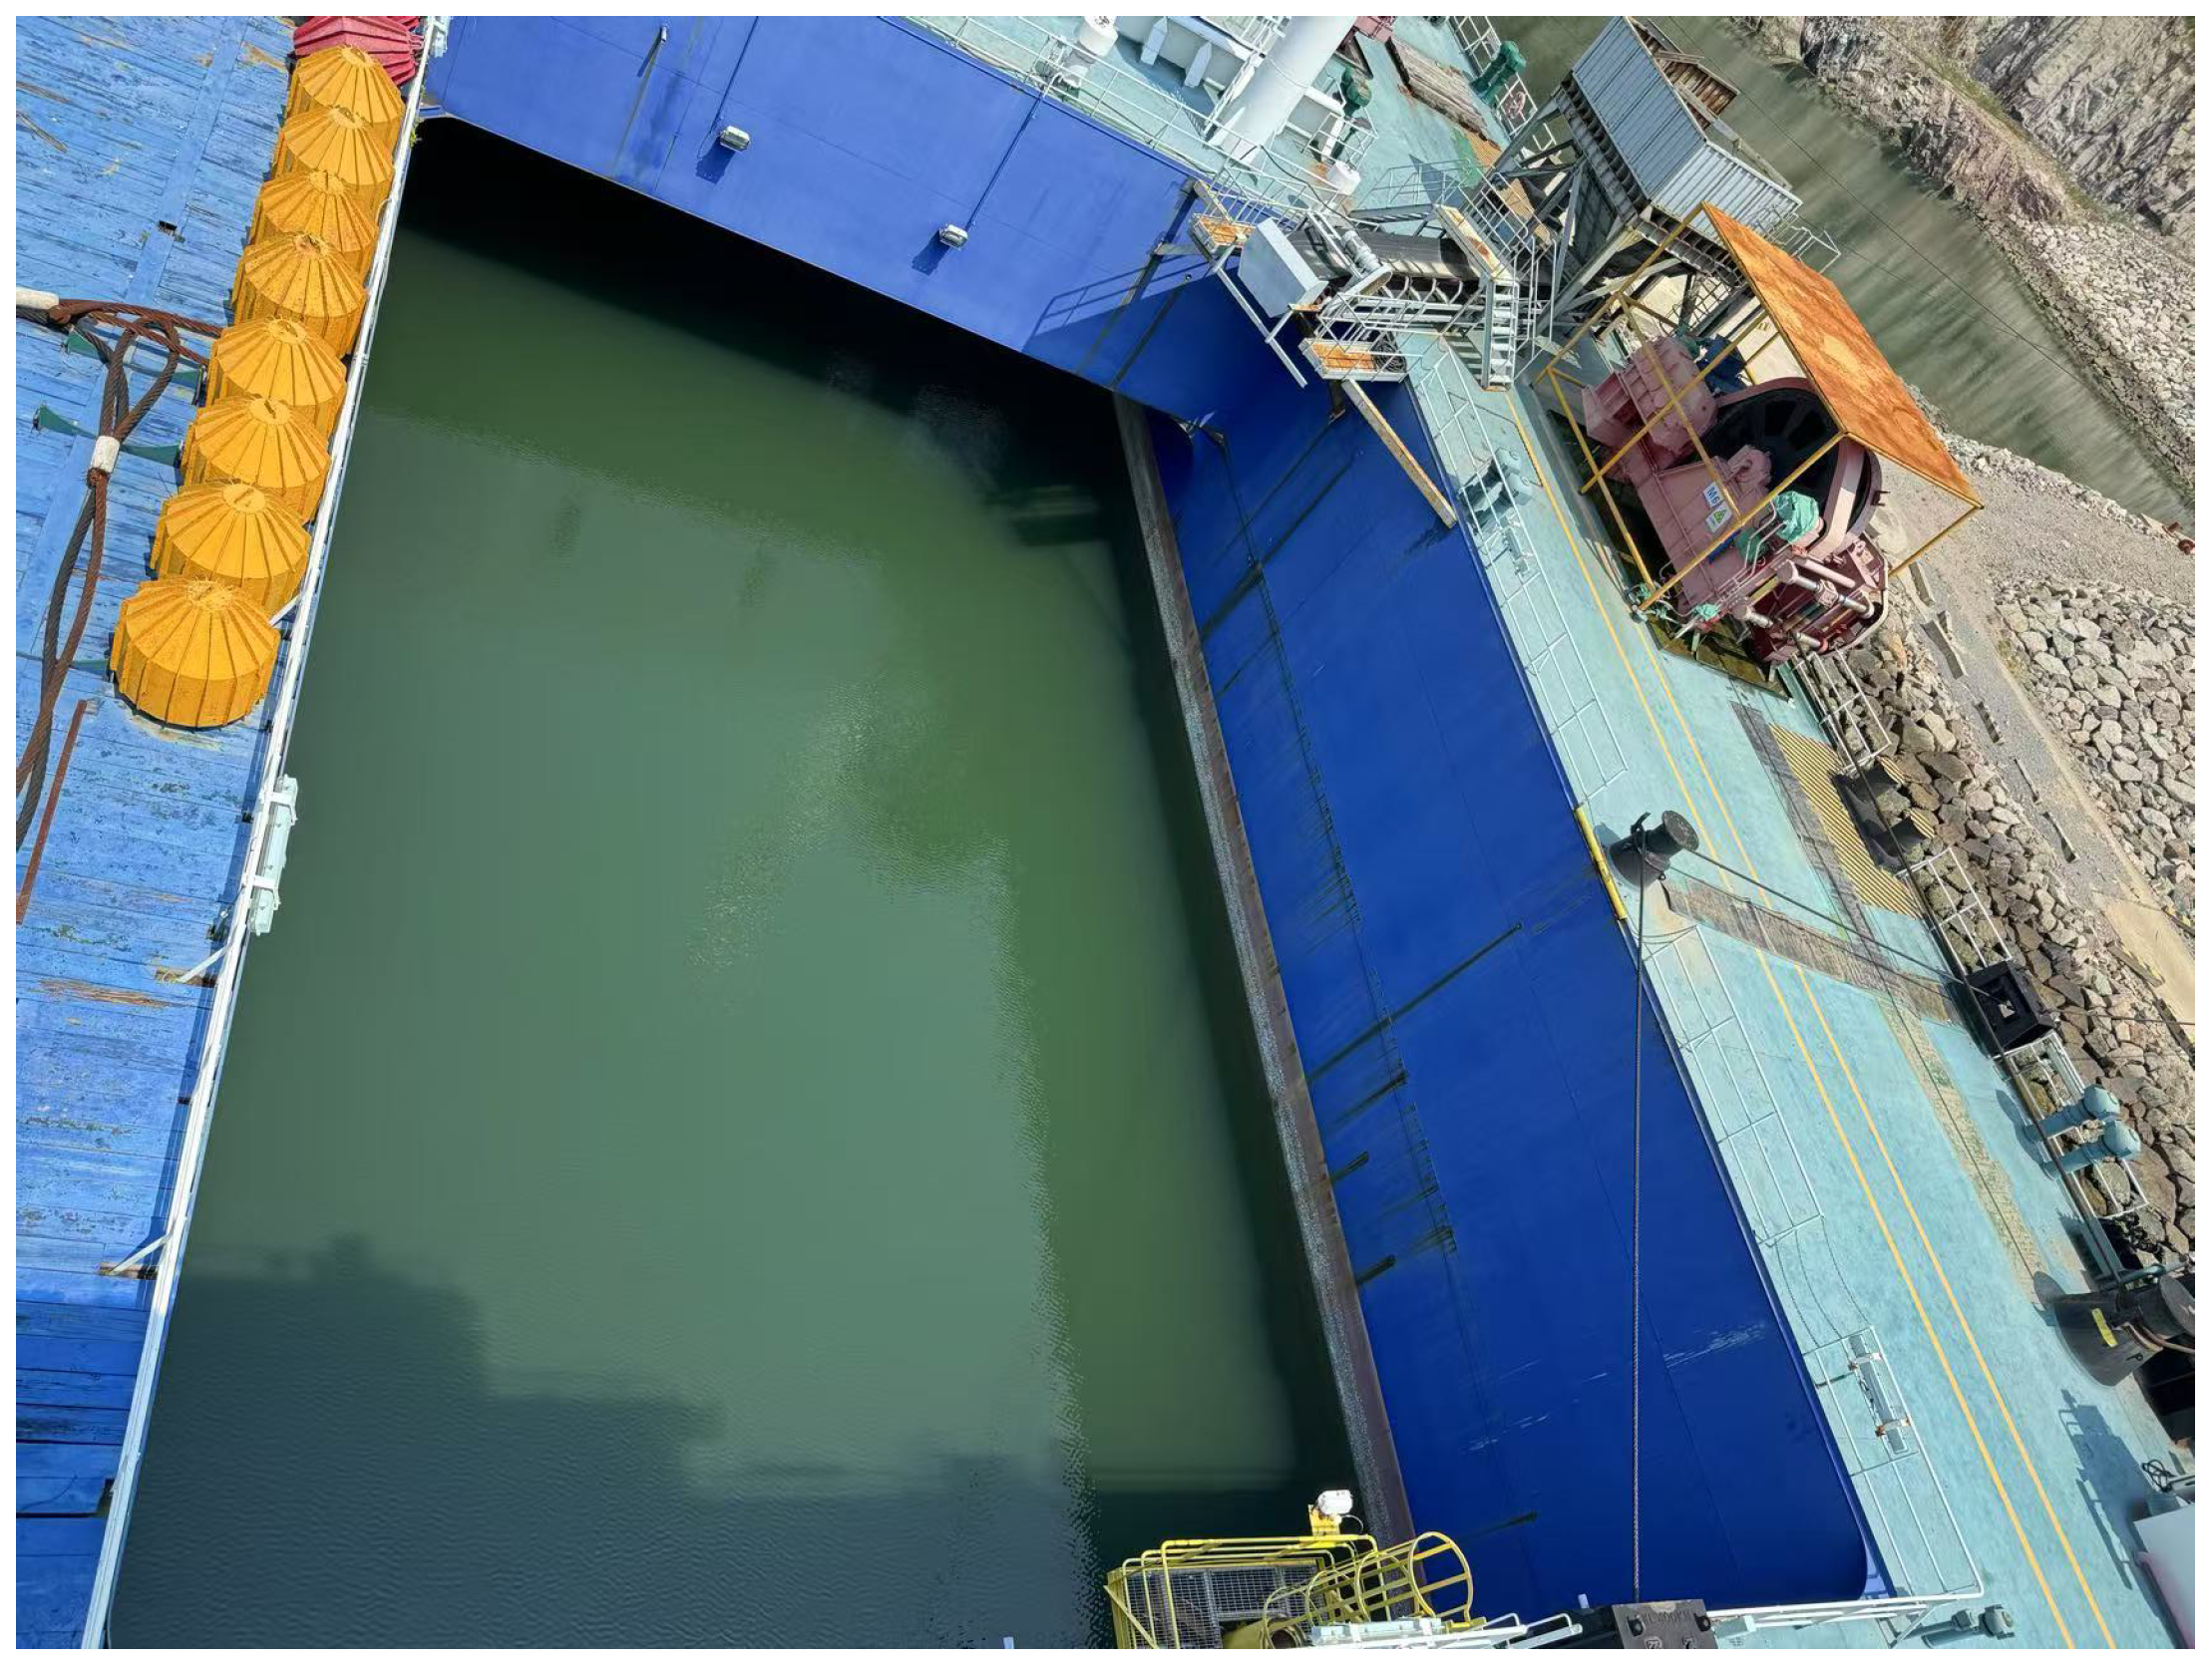
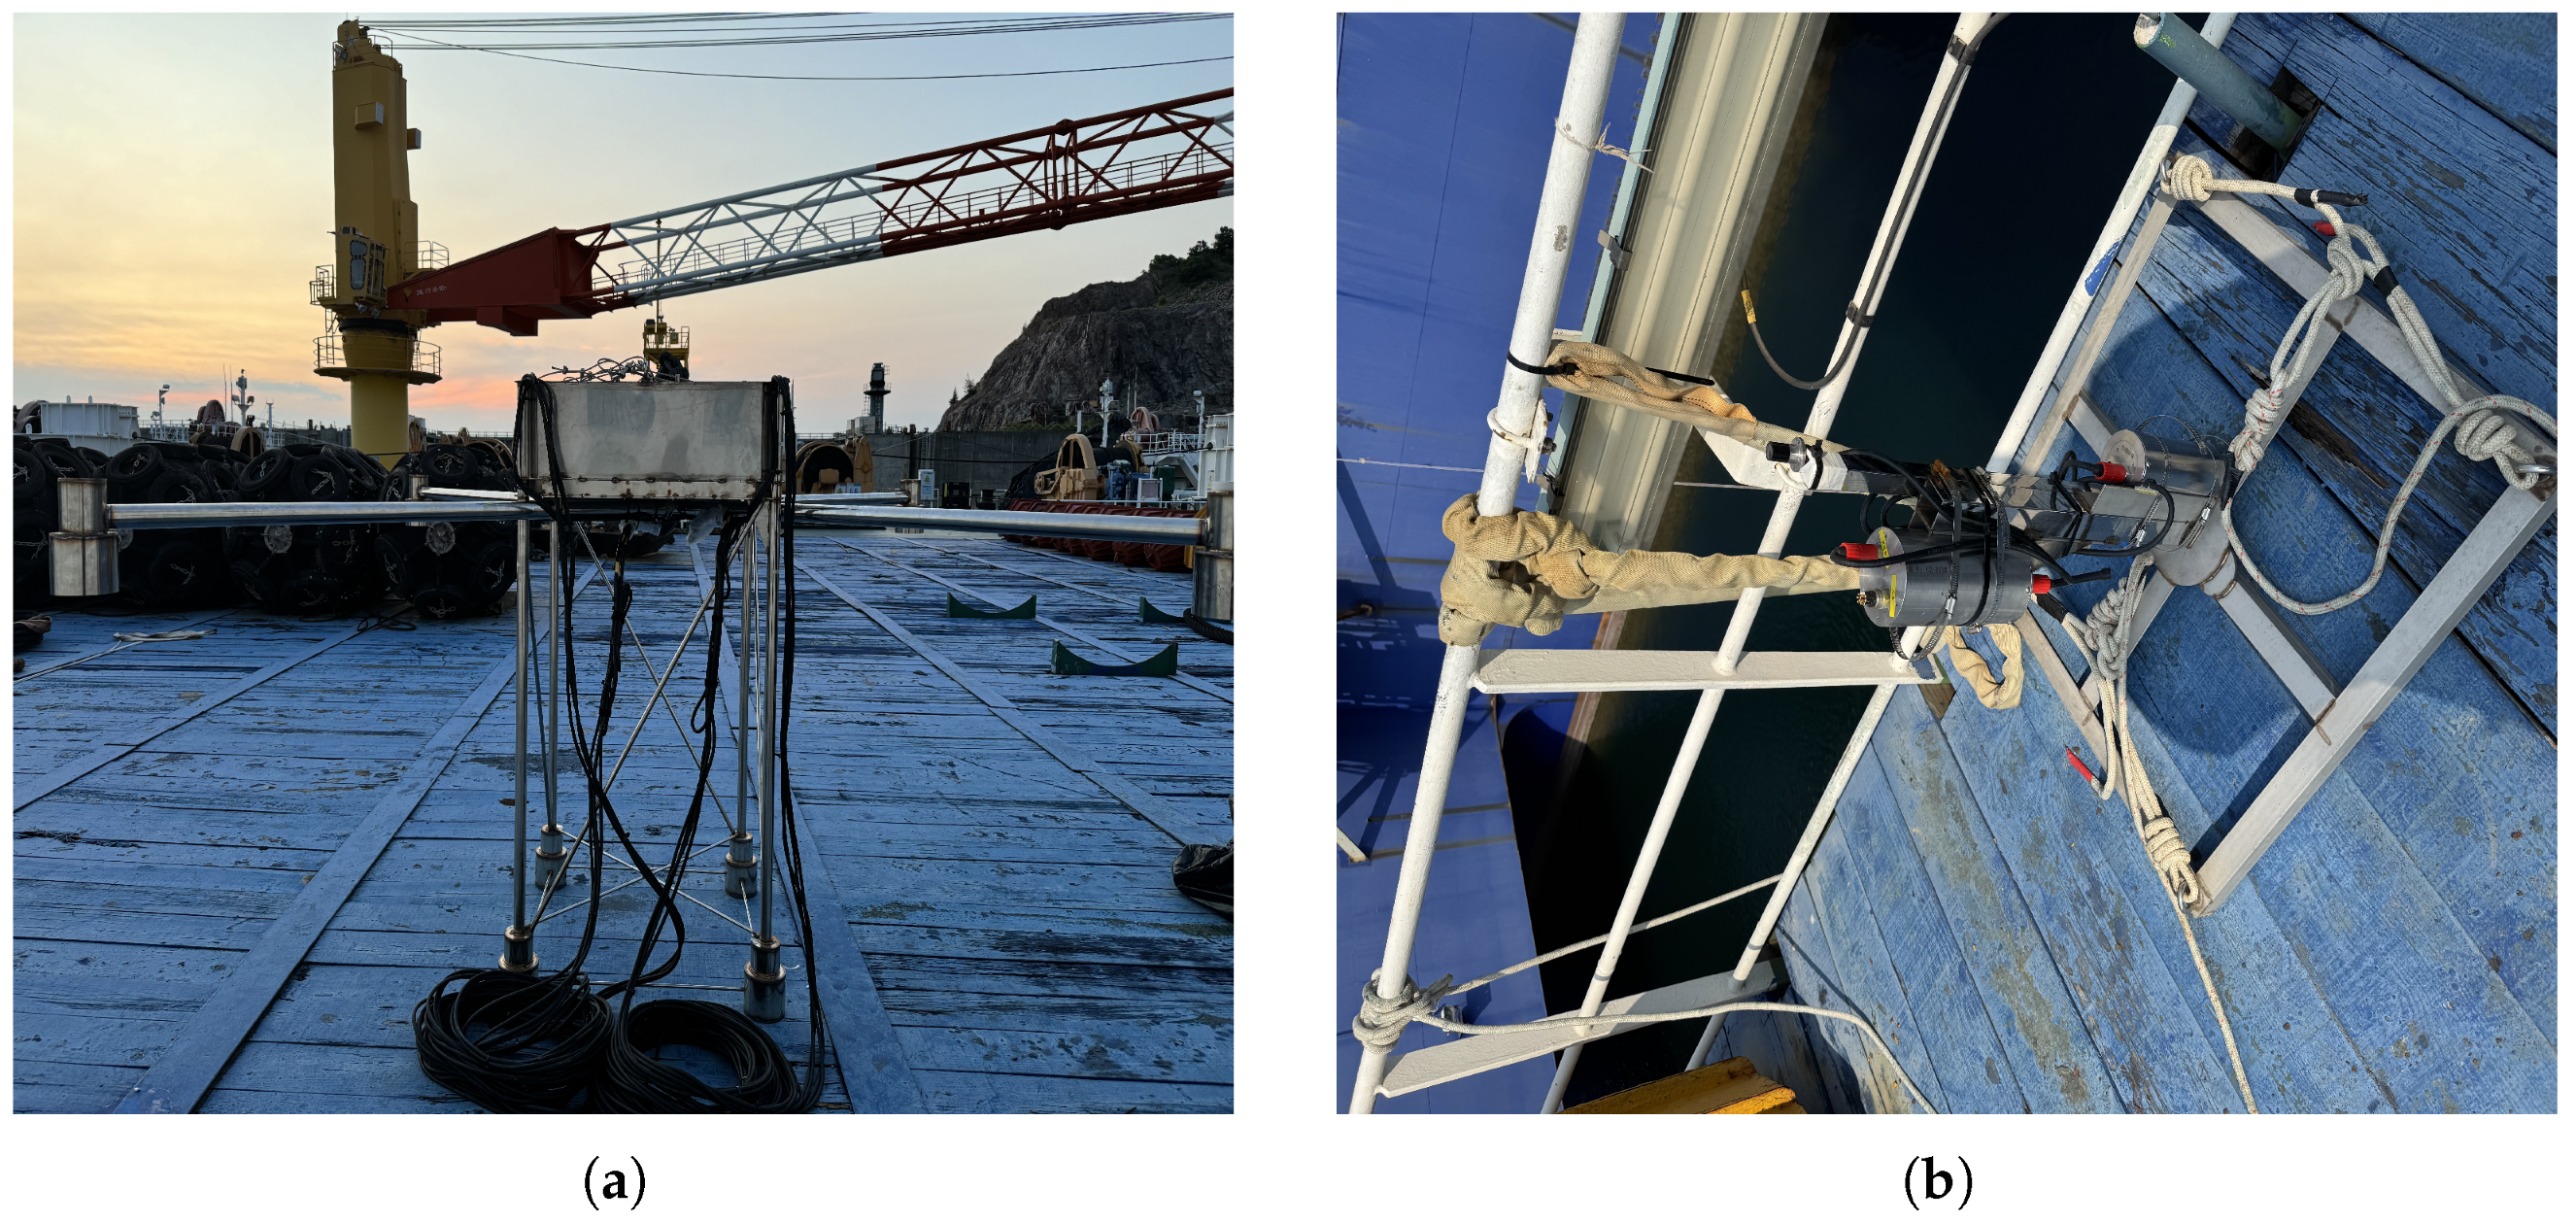
Field experiments were conducted in a harbor basin located in Zhuhai, Guangdong Province, China, characterized by a maximum water depth of 14 m and a gravel substrate that closely approximates realistic operational environments. The experimental configuration is illustrated in Figure 7.
The experimental validation employs a proprietary underwater differential sonar positioning system developed for this research. The system specifications include an 8-element hydrophone array, signal pulse width of 80 μ /s, and carrier frequency of 200 kHz. The hydrophone array is mounted on a rigid metal framework measuring 2.4 m × 2.4 m × 1.6 m, with the acoustic source positioned beneath the array configuration. The system interconnection diagram is presented in Figure 8, while the detailed structure of the acoustic source and hydrophone elements is illustrated in Figure 9.
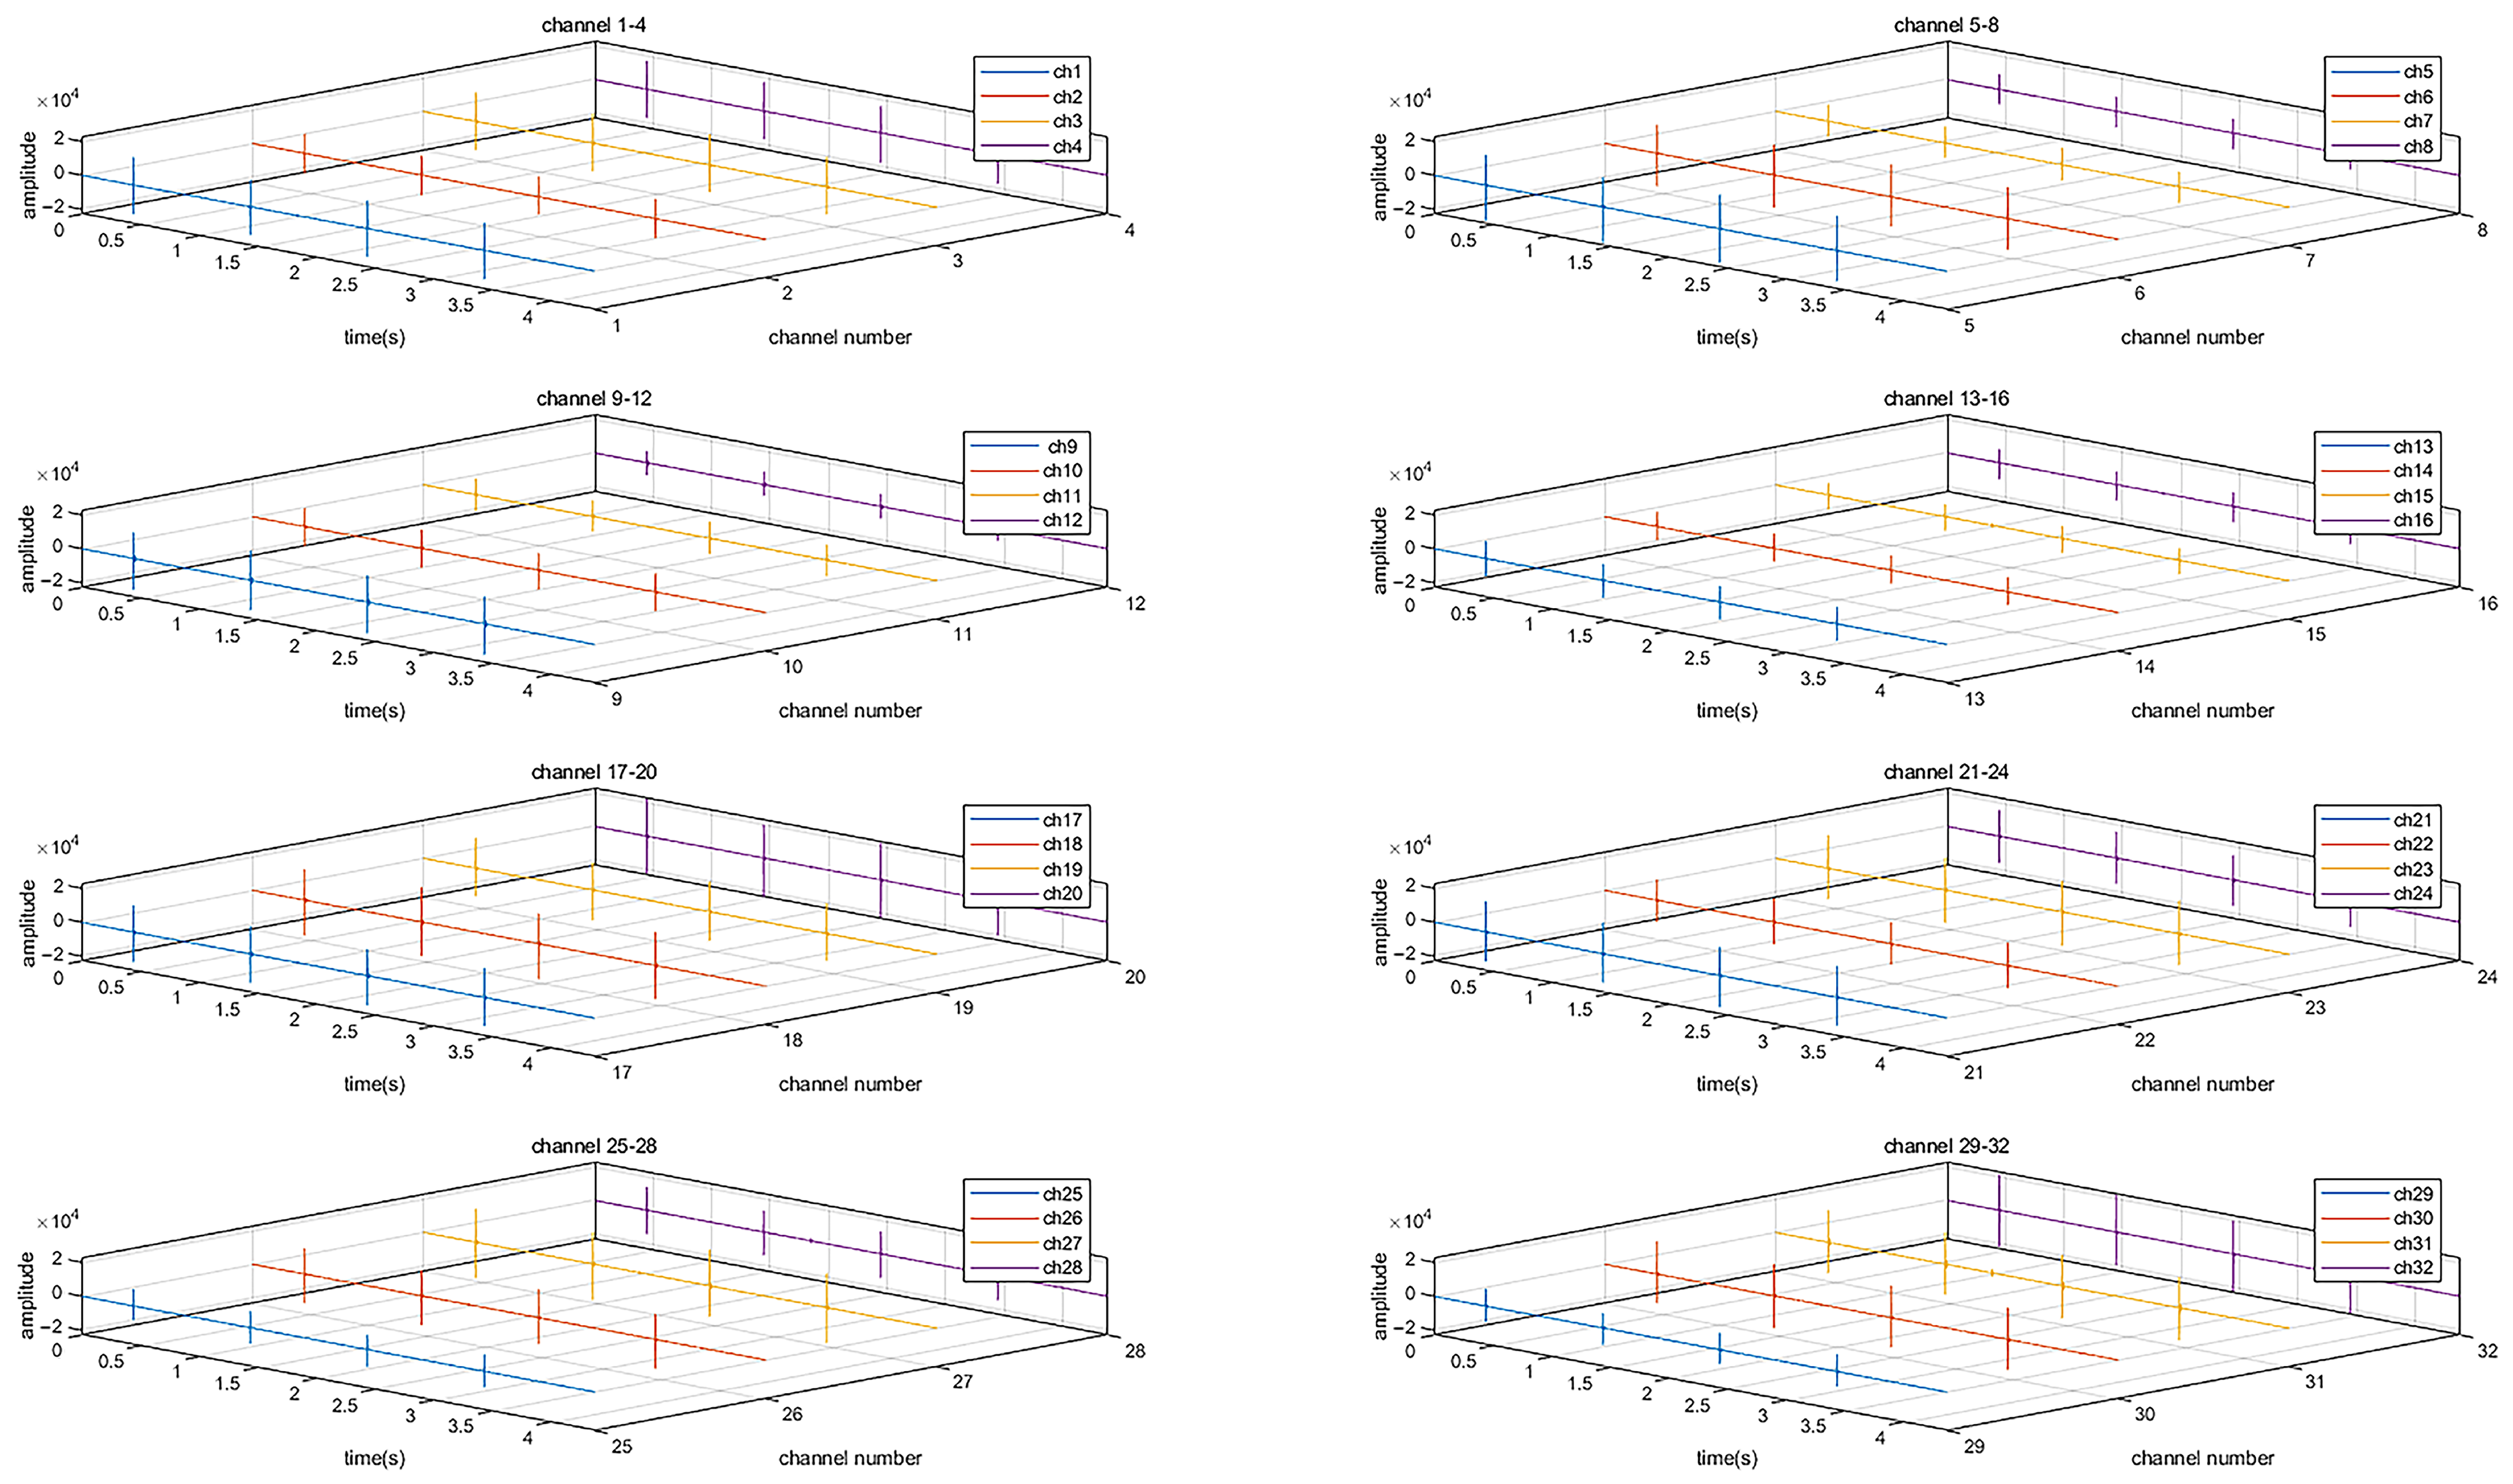
A standardised process was used to ensure data quality: A Topcon GTS-1000 total station was used to accurately calibrate the hydrophone array, with the repeat measurement error controlled to within 5 mm; underwater data were collected; and a secondary calibration was carried out after leaving the water to ensure that the difference between the pre- and post-calibration results was less than 10 mm. A total of 41 files were collected for a total of 8 s each, with a total length of 328 s, to obtain a complete 32-channel The data are shown in Figure 10 (the first 4 s of a file is shown as an example).

3.2.2. Test Results and Analyses

Dataset 5 is utilized to demonstrate the efficacy of coherent signal fusion processing. Figure 11 presents the temporal alignment and superposition results for four-channel signals acquired by hydrophone 1. The extracted pulse segments exhibit consistent waveform characteristics across all channels, validating the effectiveness of the synchronization algorithm. Signal-to-noise ratio analysis reveals measurable enhancement following coherent combining, with the overall SNR improving from 37.0 dB to 38.7 dB, representing a 1.7 dB gain.
Comprehensive analysis results are presented in Figure 12. The coherent signal fusion technique achieves substantial SNR enhancement, with a mean improvement of 2.27 dB across all datasets. Median SNR values demonstrate significant enhancement from 37 dB to 42 dB, representing a 5 dB performance gain. Box plot analysis indicates that the post-processing SNR distribution approaches normality, demonstrating improved statistical characteristics.
Notably, certain hydrophone-temporal combinations exhibited SNR degradation, which can be attributed to several factors including phase misalignment arising from signal synchronization errors, inter-channel signal quality variations, and spatial limitations on coherent gain under high SNR conditions.
The experimental configuration maintained relatively stable conditions, with the acoustic source fixed at a constant depth position and minimal hydrophone array perturbation at the water surface. Under these controlled conditions, TDOA calculations were performed using hydrophone 1 as the temporal reference, with detection stability assessed through standard deviation analysis.
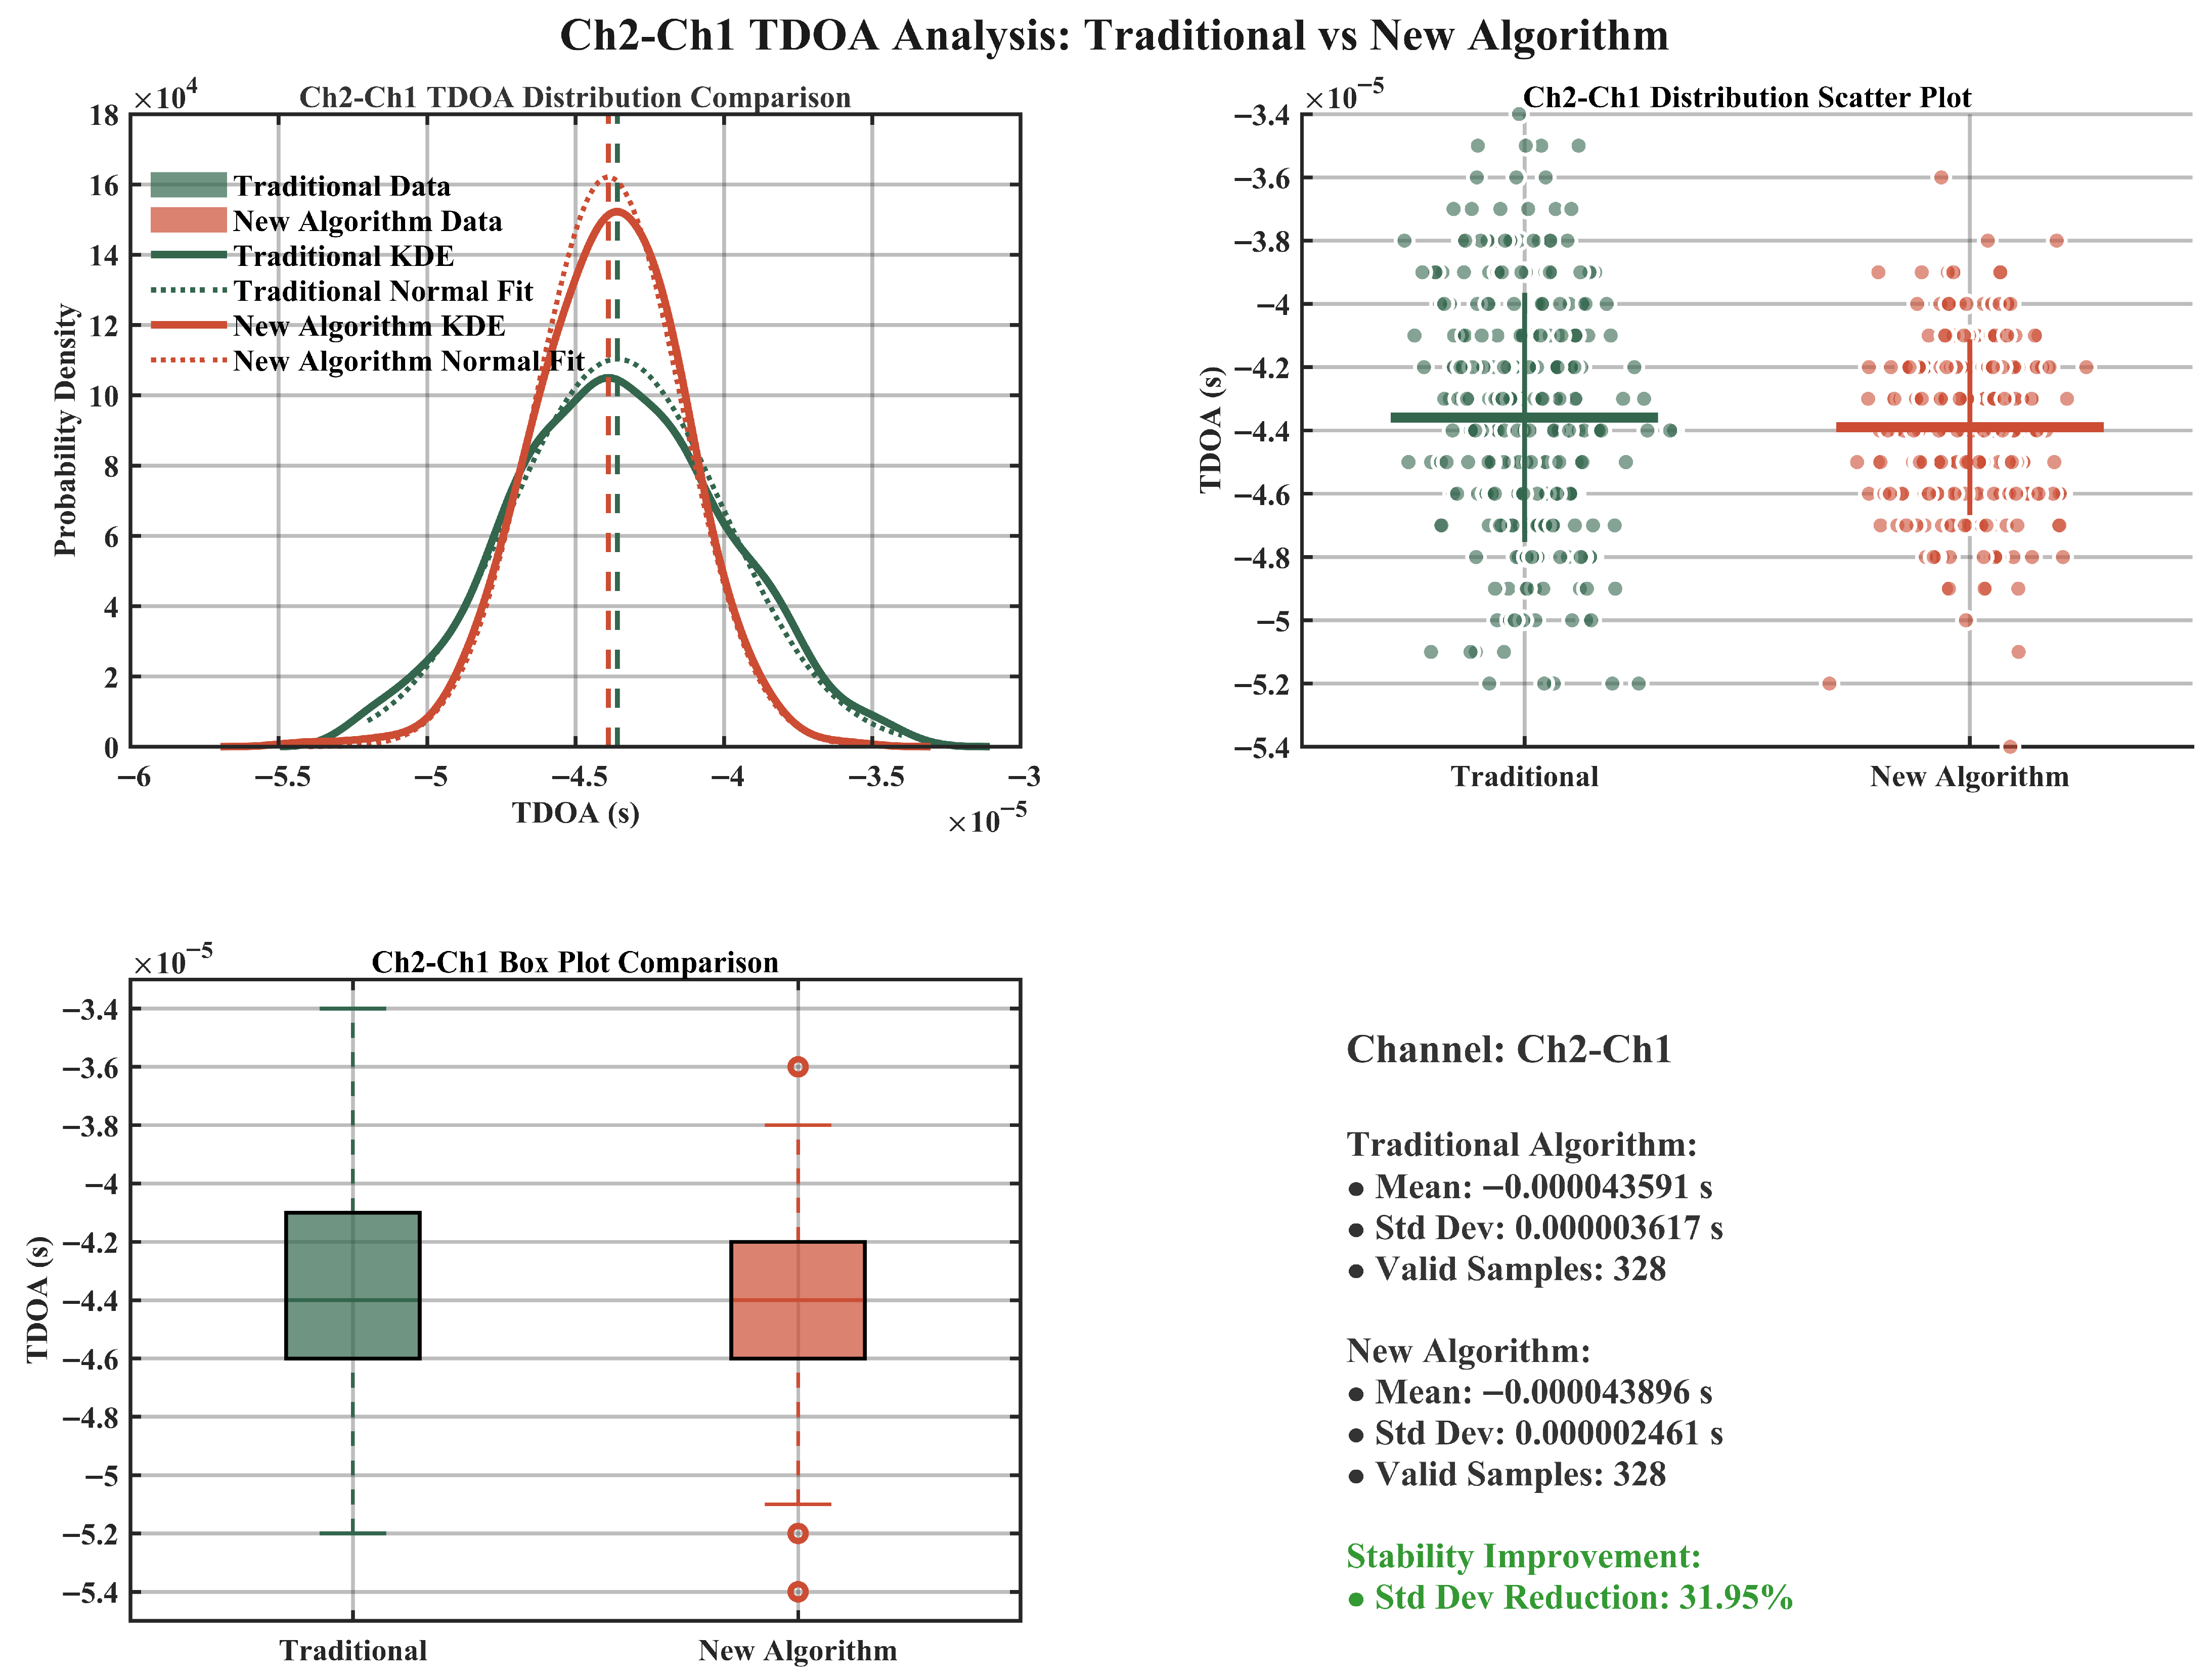
Figure 13 presents detailed comparative results for the Ch2-Ch1 channel pair. The joint energy-gradient phase detection algorithm achieves a TDOA standard deviation of 0.000002461 s, compared to 0.000003617 s for conventional cross-correlation, representing a 31.95% stability improvement. Distribution histogram analysis reveals that the proposed algorithm exhibits significantly enhanced concentration of TDOA estimates with markedly reduced variance. Scatter plot and box plot visualizations further confirm the algorithm’s superiority in outlier suppression and data clustering enhancement.
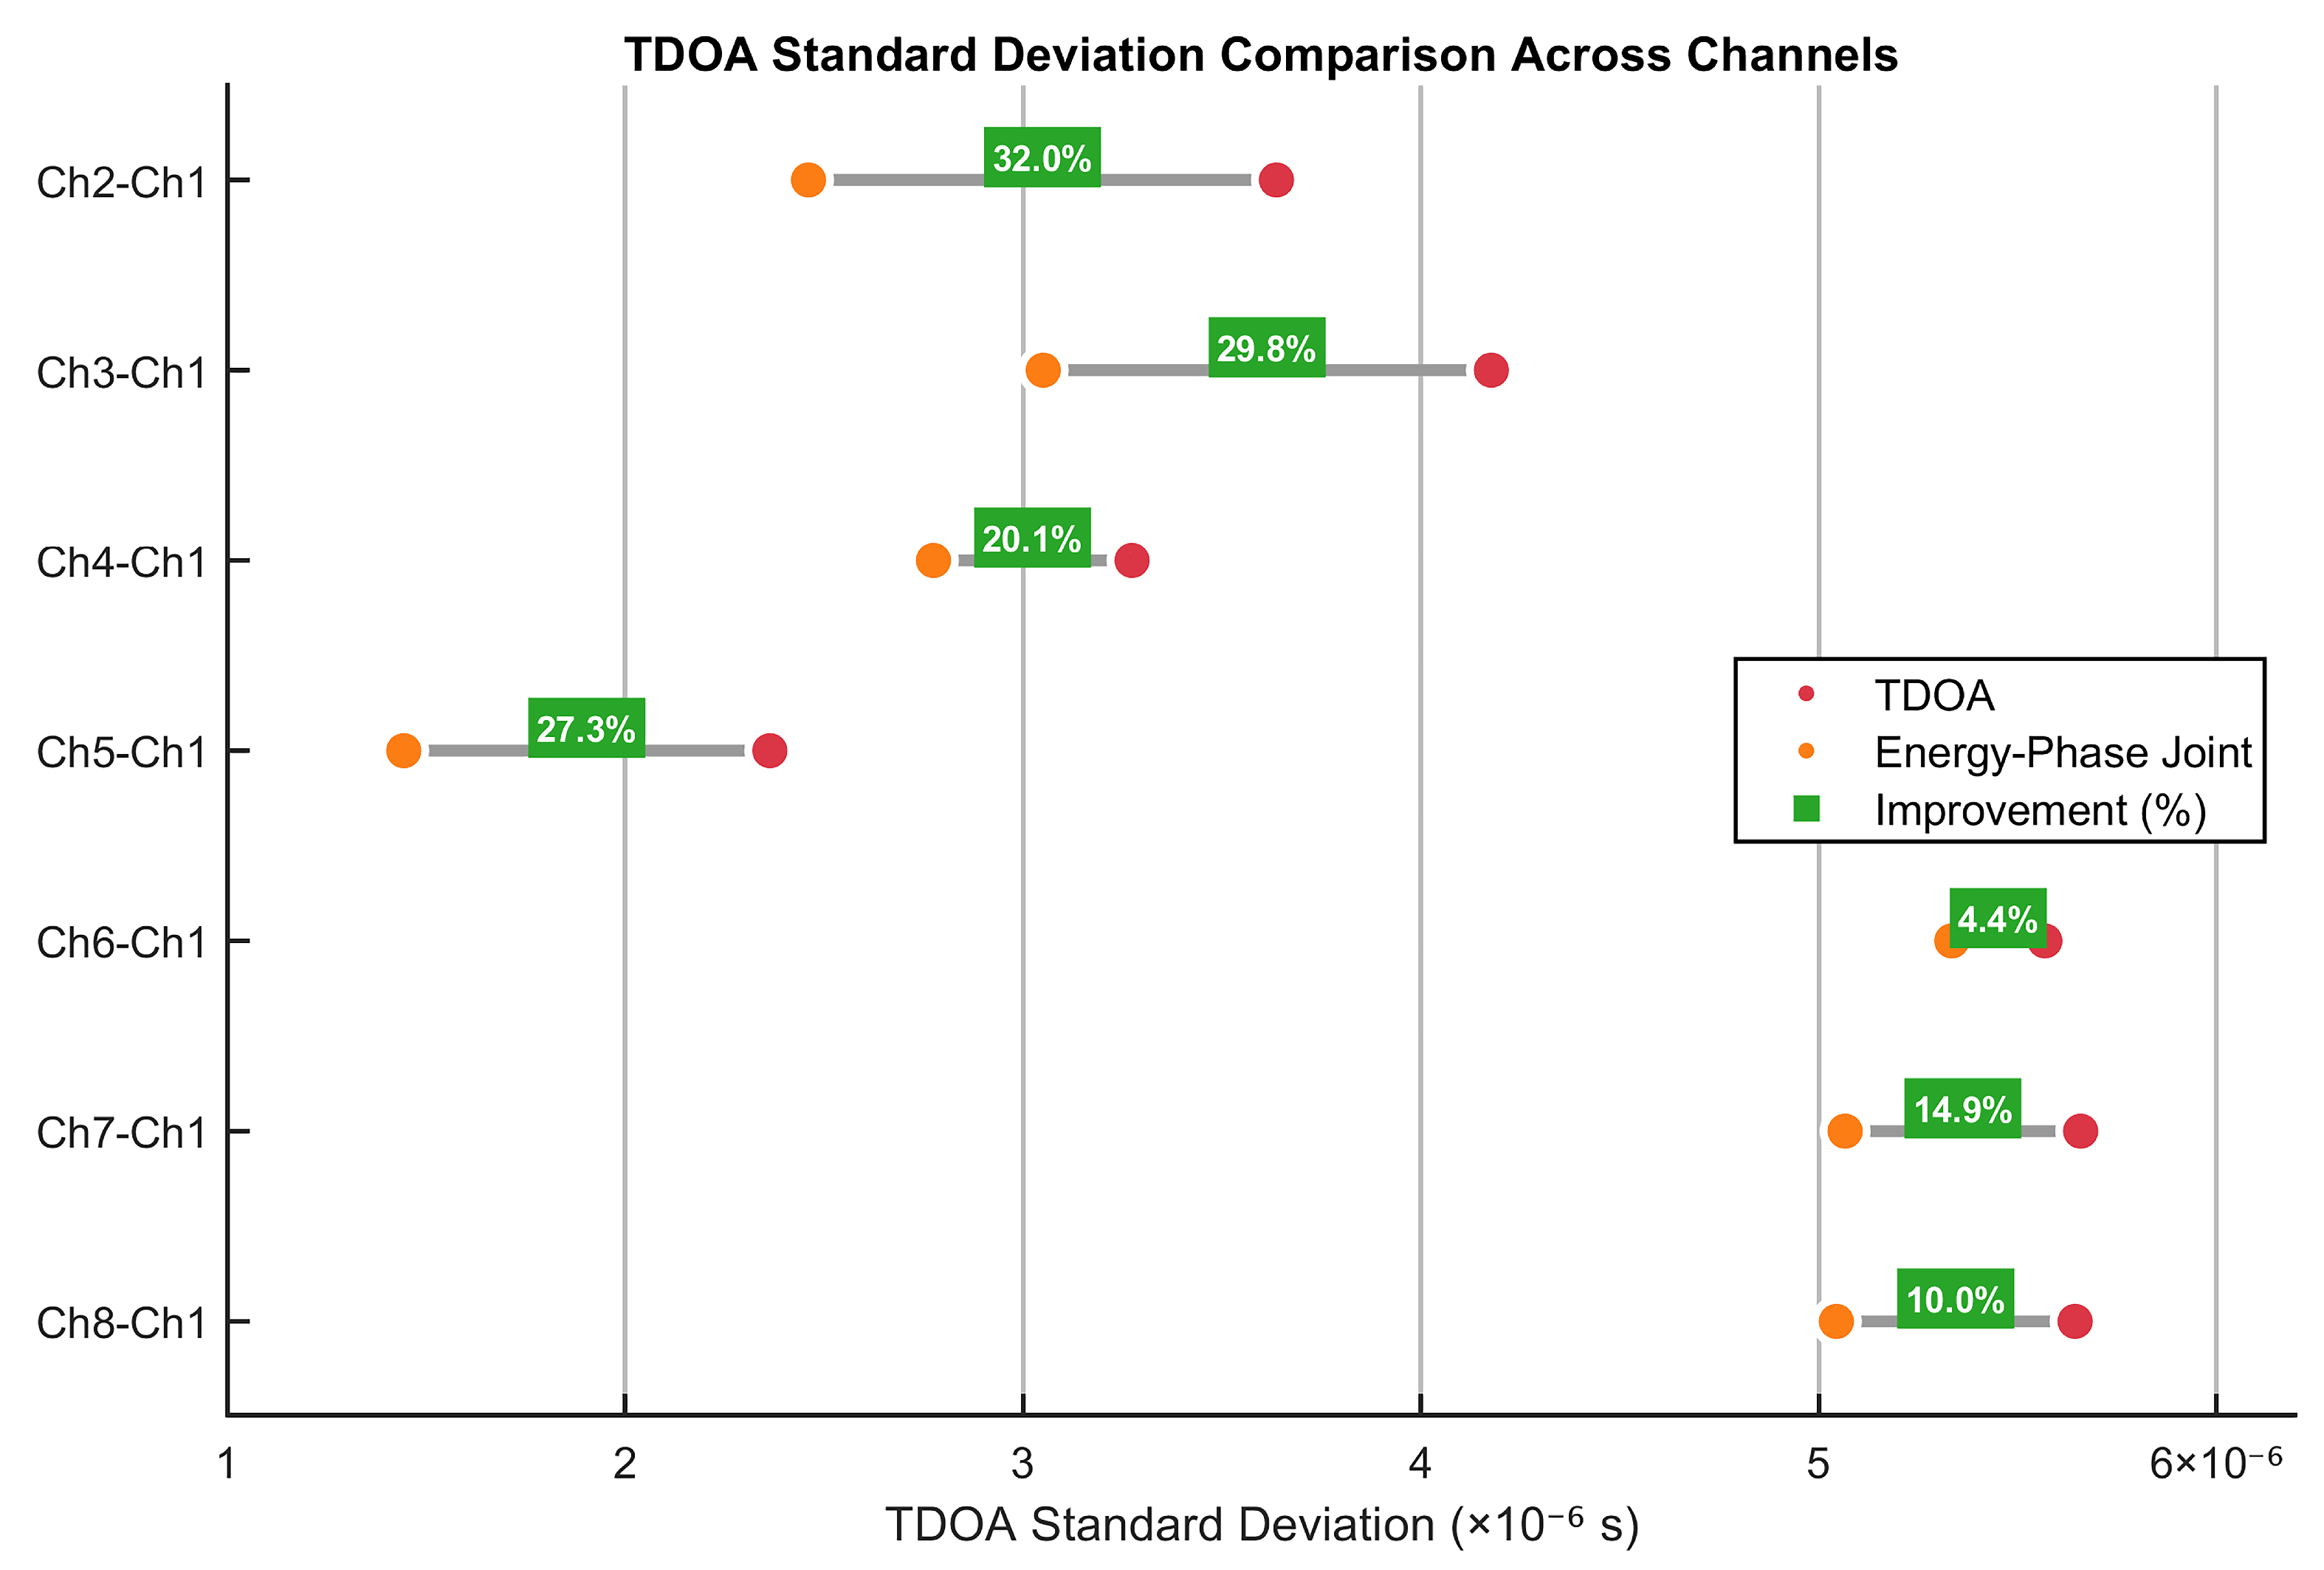
Statistical analysis presented in Figure 14 demonstrates that the proposed algorithm achieves substantial TDOA stability enhancement across all seven channel pairs. Stability improvements range from 4.4% to 32.0%, with channels Ch2-Ch1, Ch3-Ch1, and Ch5-Ch1 exhibiting the most pronounced enhancement, achieving 32.0%, 29.8%, and 27.3% improvement, respectively. These results conclusively demonstrate that the joint energy-gradient phase detection algorithm possesses superior noise immunity and enhanced temporal estimation stability compared to conventional cross-correlation methods, thereby providing robust technical foundation for practical underwater acoustic positioning system deployment.

4. Conclusions

Noise interference and multipath effects in complex marine environments severely constrain the performance and accuracy of underwater acoustic positioning systems. To address this problem, this study proposes an underwater acoustic positioning method based on multi-channel signal cooperative reception and conducts a series of simulations and ocean experiments. The main conclusions are as follows:
(1)
Quantitative analysis of simulation experiments demonstrates that multi-channel signal stacking technology exhibits significant environmental adaptability. Under harsh noise conditions of −10 dB, an 8-channel hydrophone array configuration achieves 36.06% SNR gain; under better environmental conditions of 0 dB, a 24.40% performance improvement can still be obtained. Ocean experiments further validated the practicality of this technology, achieving an average SNR improvement of 2.27 dB in actual marine environments, with the median SNR improving from 37 dB to 42 dB, an improvement of approximately 5 dB.
(2)
The energy-gradient-phase joint detection algorithm achieves comprehensive improvements in time delay estimation accuracy compared to traditional cross-correlation methods. Simulation data shows: RMSE decreased from 0.0167 ms to 0.0135 ms (19.2% improvement), MAE decreased from 0.0125 ms to 0.0096 ms (23.2% improvement), standard deviation decreased from 0.012 ms to 0.0102 ms (15.0% improvement), and maximum error decreased from 0.0334 ms to 0.0284 ms (15.0% improvement). In error analysis at various hydrophone positions, H1 position error decreased from 0.034 ms to 0.028 ms (17.6% improvement), and H3 position error decreased from 0.024 ms to 0.017 ms (29.2% improvement), with overall performance improvement of 19.1%.
(3)
TDOA stability analysis from ocean experiments shows that the new algorithm achieved significant improvements across all seven channel pairs, but its improvement magnitude exhibits position-dependent characteristics. Specific data indicates the following: Ch2-Ch1 channel stability improved by 32.0% (standard deviation decreased from 0.000003617 s to 0.000002461 s), Ch3-Ch1 channel improved by 29.8%, Ch5-Ch1 channel improved by 27.3%, while Ch6-Ch1 channel improved by 4.4%. This variability reflects the influence of different hydrophone positions on algorithm performance, providing an important reference for system optimization design.
Research results demonstrate that the proposed underwater acoustic positioning method based on multi-channel signal cooperative reception can effectively mitigate noise interference and multipath effects in complex marine environments, significantly improving the accuracy and stability of underwater acoustic positioning, providing an innovative technical solution for high-precision underwater positioning applications in marine engineering.

5. Discussion

The proposed underwater acoustic positioning method based on multi-channel signal cooperative reception has achieved significant results in both simulation and ocean experiments. However, critical analysis of these results reveals both advances and limitations that warrant deeper examination.
Multi-channel signal stacking technology demonstrates obvious environmental adaptability characteristics with non-linear performance scaling. Simulation results indicate that the gain effect of signal stacking is inversely related to the original signal quality: under harsh environmental conditions (−10 dB), the SNR improvement reaches 36.06%, while under better conditions (0 dB), the improvement decreases to 24.40%. This non-linear relationship suggests that the technology exhibits diminishing returns as baseline signal quality improves, indicating optimal deployment scenarios. Ocean experiments verified this trend, with an average SNR improvement of 2.27 dB, although effects varied across different hydrophone-temporal combinations. The variability in performance across different configurations reveals that environmental adaptability is spatially dependent, suggesting that this technology has greater application value in low SNR environments, which aligns with the practical requirements of complex environmental operations in marine engineering.
The performance of the energy-gradient-phase joint detection algorithm exhibits an obvious position dependency that represents a fundamental characteristic rather than a limitation. Ocean experiment results show that the new algorithm achieved TDOA stability improvements across all 7 channel pairs, but with significant variation in improvement magnitude, ranging from 4.4% to 32.0%. The position-dependent performance variation (4.4–32.0% improvement) can be attributed to three primary factors: (1) Array Geometry Effects: The rectangular array configuration creates asymmetric signal paths. Central hydrophone pairs (Ch2-Ch1, Ch3-Ch1) benefit from more symmetric multipath patterns, resulting in better correlation stability (>29% improvement). (2) Zhuhai Harbor Environmental Factors: Water depth (14 m) creates strong surface/bottom reflections with 18.7 ms round-trip time; gravel substrate generates coherent echoes; harbor walls create lateral reflections affecting edge hydrophones more significantly. (3) Due to the limited directional response of each hydrophone channel (30° rather than omnidirectional), signals arriving from different incident angles exhibit varying characteristics. This angular dependency renders fixed gradient threshold values inadequate for meeting the detection requirements across all hydrophone elements.
The systematic variation in performance across array positions reveals that uniform algorithmic parameters cannot optimize system-wide performance. Different signals should adopt different positive and negative gradient thresholds, but currently positive and negative gradient thresholds use fixed numerical settings. This static approach represents a design compromise that prioritizes computational efficiency over adaptive optimization. The strategy struggles to achieve optimal performance when facing different signal response characteristics, marine environmental conditions, signal propagation characteristics, and noise level variations. An analysis of the experimental data suggests that performance optimization requires position-specific parameter tuning.
While the energy-gradient-phase method demonstrates overall superior stability, its performance improvement potential remains constrained by fixed gradient threshold settings. In simulation results, the cross-correlation method exhibited detection inconsistencies on certain hydrophones (such as the anomalous values highlighted in bold in Table 4). The consistency of our method across all measurements indicates algorithmic robustness, but the magnitude of improvement varies significantly with geometric and environmental factors. This suggests that the current approach has reached the performance ceiling achievable with static parameters.
Future Optimization Pathways: Therefore, to overcome the limitations of fixed gradient threshold settings, it is recommended to introduce adaptive gradient identification technology based on deep learning. The integration of machine learning represents a paradigm shift from deterministic to adaptive processing. By constructing neural network models that comprehensively utilize multi-dimensional information such as signal time–frequency characteristics, energy distribution, and noise levels, intelligent dynamic adjustment of gradient thresholds can be achieved. This adaptive mechanism addresses the fundamental limitation identified in our analysis—the inability to optimize parameters for varying geometric and environmental conditions. Additionally, by integrating more signal characteristic parameters, such as spectral characteristics and phase consistency indicators, it is expected to construct more robust and intelligent detection algorithms that can dynamically respond to the position-dependent performance variations observed in our experiments.

Author Contributions

Conceptualization, M.G., Z.C. and D.Z.; Methodology, M.G. and Z.C.; Software, K.L. and Z.C.; Visualization, K.L. and K.Y.; Formal analysis, K.L. and K.Y.; Writing—original draft, K.L.; Writing—review and editing, K.L., J.S., K.Y. and H.Z.; Funding acquisition, M.G. All authors have read and agreed to the published version of the manuscript.

Funding

This work was supported by the Guangdong Basic and Applied Basic Research Foundation Project (2025A1515011370); Shenzhen Science and Technology Program (Grants: JCYJ20220818095816035, JSGG20220831103800001); Nature Science Foundation of Shenzhen Province (Grant: RCBS20221008093252090); Shenzhen Polytechnic University—Enterprise Joint R&D Center (602331020PQ); Research on Topography and Geomorphology Protection and Ecological Service Value of Marine Areas and Islands in Jiangsu Province (JSZRKJ202421).

Institutional Review Board Statement

The study was conducted in accordance with the Declaration of Helsinki. Ethical review and approval were waived for this study due to the nature of the technical research not involving humans or animals.

Informed Consent Statement

Not applicable.

Data Availability Statement

The data presented in this study are available on request from the corresponding author. The data are not publicly available due to [privacy/proprietary reasons].

Acknowledgments

The authors acknowledge the support provided by the testing facilities and equipment in Zhuhai, Guangdong Province, China.

Conflicts of Interest

The authors declare no conflicts of interest.

Abbreviations

The following abbreviations are used in this manuscript:
GNSSGlobal Navigation Satellite System
SNRSignal-to-Noise Ratio
TDOATime Difference of Arrival
TOATime of Arrival
CWContinuous Wave
MRCMaximum Ratio Combining
RMSERoot Mean Square Error
MAEMean Absolute Error
EWMAExponentially Weighted Moving Average

References

  1. Leonard, J.J.; Bahr, A. Autonomous underwater vehicle navigation. In Springer Handbook of Ocean Engineering; Springer: Berlin/Heidelberg, Germany, 2016; pp. 341–358. [Google Scholar]
  2. Bürgmann, R.; Chadwell, D. Seafloor geodesy. Ann. Rev. Earth Planet. Sci. 2014, 42, 509–534. [Google Scholar] [CrossRef]
  3. Beemaraj, S.B.; Muhammed, B.; Joshi, A.; Coche, E.; Chanet, A. A framework for early-stage automated layout design of subsea production system. Ocean Eng. 2024, 297, 117175. [Google Scholar] [CrossRef]
  4. DeSanto, J.B.; Sandwell, D.T.; Chadwell, C.D. Seafloor geodesy from repeated sidescan sonar surveys. J. Geophys. Res. Solid Earth 2016, 121, 4800–4813. [Google Scholar] [CrossRef]
  5. Otero, P.; Hernández-Romero, Á.; Luque-Nieto, M.Á.; Ariza, A. Underwater positioning system based on drifting buoys and acoustic modems. J. Mar. Sci. Eng. 2023, 11, 682. [Google Scholar] [CrossRef]
  6. Abdel-Hamid, W.; Noureldin, A.; El-Sheimy, N. Adaptive fuzzy prediction of low-cost inertial-based positioning errors. IEEE Trans. Fuzzy Syst. 2007, 15, 519–529. [Google Scholar] [CrossRef]
  7. Liu, X.; Chen, M.K.; Chu, C.H.; Zhang, J.; Leng, B.; Yamaguchi, T.; Tanaka, T.; Tsai, D.P. Underwater binocular meta-lens. ACS Photonics 2023, 10, 2382–2389. [Google Scholar] [CrossRef]
  8. Guan, M.; Sun, R.; Huang, Z.; Zhang, D.; Jiang, L.; Yu, S.; Cao, J.; Lu, K. Tube deformation measurement with camera and laser. Measurement 2025, 243, 116322. [Google Scholar] [CrossRef]
  9. Zhao, S.; Wang, Z.; Nie, Z.; He, K.; Ding, N. Investigation on total adjustment of the transducer and seafloor transponder for GNSS/Acoustic precise underwater point positioning. Ocean Eng. 2021, 221, 108533. [Google Scholar] [CrossRef]
  10. Spiess, F.N. Analysis of a possible sea floor strain measurement system. Mar. Geod. 1985, 9, 385–398. [Google Scholar] [CrossRef]
  11. Spiess, F.N.; Chadwell, C.D.; Hildebrand, J.A.; Young, L.E.; Purcell, G.H., Jr.; Dragert, H. Precise GPS/Acoustic positioning of seafloor reference points for tectonic studies. Phys. Earth Planet. Inter. 1998, 108, 101–112. [Google Scholar] [CrossRef]
  12. Qin, X.; Yang, Y.; Sun, B. The refined resilient model for underwater acoustic positioning. Ocean Eng. 2022, 266, 112795. [Google Scholar] [CrossRef]
  13. Huang, S.H.; Yang, T.C.; Huang, C.F. Multipath correlations in underwater acoustic communication channels. J. Acoust. Soc. Am. 2013, 133, 2180–2190. [Google Scholar] [CrossRef] [PubMed]
  14. Wenz, G.M. Acoustic ambient noise in the ocean: Spectra and sources. J. Acoust. Soc. Am. 1962, 34, 1936–1956. [Google Scholar] [CrossRef]
  15. Ni, Y.; Chen, H. Time Frequency Analysis of Underwater Carrier-Free Pulse. In Proceedings of the International Conference on Information Computing and Applications, Chengde, China, 14–16 September 2012; pp. 548–555. [Google Scholar]
  16. Zhang, T.; Shi, H.; Chen, L.; Li, Y.; Tong, J. AUV positioning method based on tightly coupled SINS/LBL for underwater acoustic multipath propagation. Sensors 2016, 16, 357. [Google Scholar] [CrossRef] [PubMed]
  17. Zhang, G.; Hovem, J.M.; Dong, H.; Zhou, S.; Du, S. An efficient spread spectrum pulse position modulation scheme for point-to-point underwater acoustic communication. Appl. Acoust. 2010, 71, 11–16. [Google Scholar] [CrossRef]
  18. Roux, P.; Kuperman, W.A.; NPAL Group. Extracting coherent wave fronts from acoustic ambient noise in the ocean. J. Acoust. Soc. Am. 2004, 116, 1995–2003. [Google Scholar] [CrossRef]
  19. Akao, T.; Watanabe, K.; Kojima, S.; Katsuno, M.; Maruta, K.; Ahn, C.J. Reducing channel spatial correlation by rotating planar antenna array. ICT Express 2019, 5, 271–275. [Google Scholar] [CrossRef]
  20. Stojanovic, M.; Preisig, J. Underwater acoustic communication channels: Propagation models and statistical characterization. IEEE Commun. Mag. 2009, 47, 84–89. [Google Scholar] [CrossRef]
  21. Chu, H.; Li, C.; Wang, H.; Wang, J.; Tai, Y.; Zhang, Y.; Yang, F.; Benezeth, Y. A deep-learning based high-gain method for underwater acoustic signal detection in intensity fluctuation environments. Appl. Acoust. 2023, 211, 109513. [Google Scholar] [CrossRef]
  22. Dajun, S.; Jia, G.; Jucheng, Z.; Yunfeng, H. Design of high accuracy ultra short baseline underwater acoustic position system. In Proceedings of the 2017 IEEE International Conference on Signal Processing, Communications and Computing (ICSPCC), Xiamen, China, 22–25 October 2017; pp. 1–4. [Google Scholar]
  23. Hermand, J.P.; Roderick, W.I. Acoustic model-based matched filter processing for fading time-dispersive ocean channels: Theory and experiment. IEEE J. Ocean. Eng. 1993, 18, 447–465. [Google Scholar] [CrossRef]
Figure 1. Microsecond vs. millisecond pulses.
Jmse 13 01651 g001
Figure 2. Multi-channel superimposed signal flow.
Jmse 13 01651 g002
Figure 3. Multi-channel signal superposition effect. (a,b) Ambient noise at −10 dB. (c,d) Ambient noise at 0 dB.
Jmse 13 01651 g003
Figure 4. Joint energy gradient-phase detection algorithm (overall).
Jmse 13 01651 g004
Figure 5. Joint energy gradient-phase detection algorithm (specific).
Jmse 13 01651 g005
Figure 6. Algorithm comparison chart.
Jmse 13 01651 g006
Figure 7. Test environment diagram.
Jmse 13 01651 g007
Figure 8. Device connection methods.
Jmse 13 01651 g008
Figure 9. Schematic diagram of the test components (hydrophone components on the left (a), sound source components on the right (b)).
Jmse 13 01651 g009
Figure 10. 32-channel data.
Jmse 13 01651 g010
Figure 11. Third-second coherent fusion plot for hydrophone No. 1.
Jmse 13 01651 g011
Figure 12. General representation of signal superposition effects (Document 5).
Jmse 13 01651 g012
Figure 13. Ch2-Ch1 TDOA analysis complete.
Jmse 13 01651 g013
Figure 14. Comparison of the performance of the two algorithms (overall).
Jmse 13 01651 g014
Table 1. Microsecond-level acoustic pulse signal parameters.
Signal Form f c (kHz) f s (MHz) τ ( μ s)
Pulse CW signal200110/25/50/80
Table 2. Environment noise settings.
ParameterValueUnit
SNR Range−10∼0dB
Background NoiseGaussian white noise + narrowband interference
Seafloor Reflection0.65
Water Surface Reflection0.45
Table 3. Acoustic signal parameters.
ParameterValueUnit
Carrier Frequency200kHz
Pulse Width80 μ s
Sampling Frequency1MHz
Source Azimuth45
Source Elevation30
Table 4. Time detection comparison table.
HydrophoneMethodPulse1Pulse2Pulse3Pulse4Pulse5Pulse6
H1Gradient0.5119651.5119652.5119653.5119654.5119655.511965
Cross0.5119361.5119362.5119363.511931a4.5119365.511936
H2Gradient0.5109971.5109972.5109973.5109974.5109975.510997
Cross0.5109631.5109682.5109683.5109684.5109685.510968
H3Gradient0.5109721.5109722.5109723.5109724.5109725.510972
Cross0.5109431.5109432.5109433.5109434.5109435.510943
H4Gradient0.5100331.5100332.5100333.5100334.5100335.510033
Cross0.5100091.5100092.510004a3.509996a4.510004a5.510009
H5Gradient0.5107961.5107962.5107963.5107964.5107965.510796
Cross0.5107671.5107672.5107673.5107674.5107675.510767
H6Gradient0.5104681.5104682.5104683.5104684.5104685.510468
Cross0.5104391.5104392.510444a3.5104394.5104395.510439
H7Gradient0.5104661.5104662.5104663.5104664.5104665.510466
Cross0.5104371.5104372.5104373.5104374.5104375.510437
H8Gradient0.5101531.5101532.5101533.5101534.5101535.510153
Cross0.5101241.5101242.5101243.510129a4.5101245.510124
a Bold values indicate detection time differences/deviations from the expected regular pattern.
Disclaimer/Publisher’s Note: The statements, opinions and data contained in all publications are solely those of the individual author(s) and contributor(s) and not of MDPI and/or the editor(s). MDPI and/or the editor(s) disclaim responsibility for any injury to people or property resulting from any ideas, methods, instructions or products referred to in the content.