Article

Hydrodynamic Numerical Analysis of AUV Underwater Docking with Conical Docking Bay

1
School of Mechanical Engineering, Jiangsu University of Science and Technology, Zhenjiang 212100, China
2
Marine Equipment and Technology Institute, Jiangsu University of Science and Technology, Zhenjiang 2121000, China
*
Author to whom correspondence should be addressed.
J. Mar. Sci. Eng. 2025, 13(9), 1645; https://doi.org/10.3390/jmse13091645
Submission received: 18 July 2025 / Revised: 26 August 2025 / Accepted: 27 August 2025 / Published: 28 August 2025
(This article belongs to the Section Ocean Engineering)

Abstract

Aiming at the underwater docking process of an autonomous underwater vehicle (AUV) and conical docking bay, this paper systematically analyzes the influence of docking geometry parameters and ocean current conditions on hydrodynamic characteristics. By establishing a three-dimensional mathematical model and using computational fluid dynamics (CFD) methods, this study focused on investigating the effects of the taper angle and diameter of the docking chamber inlet, as well as the magnitude and direction angle of ocean currents, on the docking resistance, lift, velocity field, and pressure field distribution of an AUV. The results show the following: increasing the dock inlet taper can reduce the AUV docking drag; the dock inlet diameter is positively correlated with the AUV docking drag; the larger the current speed is, the more drastic the change of the AUV drag is; the larger the current direction angle is, the larger the velocity difference between the upper and lower flow fields of the AUV is, leading to a significant lift effect. The research results provide a theoretical basis for the structure optimization and control strategy design of AUV underwater docking systems.

1. Introduction

Autonomous underwater vehicles (AUVs), with the advantage of having no cable constraint, have shown broad application prospects in the fields of ocean exploration, environmental monitoring, and military reconnaissance [1,2,3,4]. Compared with Remotely Operated Vehicles (ROVs), AUVs have stronger autonomy and flexibility, and are able to perform tasks and collect data independently in the deep sea and remote areas, free from the limitation of physical connection with the mother ship [5]. However, due to their platform size and load capacity, AUVs usually carry limited energy reserves. After a long period of operation, there is an urgent need for energy replenishment and data interaction [6,7,8]. Therefore, the accurate docking and reliable recovery of AUVs have become the core links of the execution of their missions, directly related to their continuous operation capability, efficient information transfer, and equipment maintenance guarantee [9].
The recovery of AUVs after accomplishing their missions is a critical aspect of their operation, as it requires energy replenishment, data processing, and maintenance [10,11]. Over the years, researchers have proposed various methods for recovering AUVs, which can be categorized into three types of AUV recovery systems: underwater static recovery systems, underwater mobile recovery systems, and surface recovery systems [12,13,14]. Surface mother ship recovery usually involves the AUV returning to a predetermined area and approaching the mother ship for recovery, where it is lifted using cranes and other equipment on the surface ship [15,16,17,18]. An AUV underwater static recovery system refers to the deployment of a static recovery platform at a specified location underwater, typically the Odyssey-IIB system of the U.S. [19] or the Marine-bird system of Kawasaki Heavy Industries, Japan [20]. AUV underwater mobile recovery systems are mostly used in the military field, usually using a submarine as the mobile recovery platform, with the submarine’s torpedo tube or external towing device as the mobile recovery device. AUV underwater mobile recovery systems have been studied previously, mainly the Sea Owl SUBROV system using ROV docking and the LMRS system using robotic arm docking [21,22].
Typical structures of underwater static recovery devices generally utilize a docking bay equipped with a conical horn guidance port, which utilizes a physical collision guidance mechanism to effectively enhance the docking success rate of AUVs within a specific initial attitude deviation range [23,24,25]. In 2000, WHOI developed a first-generation docking system for REMUS [26,27]. In 2006, a second-generation docking system was developed [28], using a combination of acoustic and optical guidance. In 2007, MBARI created an underwater docking station for Bluefin [29], equipped with an acoustic guidance beacon and camera. It utilizes a conical capture port with inductive power transfer and wireless data telemetry. In 2014, the University of Girona investigated an autonomous docking method for fixed-base and intervening AUVs [30]. In 2015, Harbin Engineering University developed an AUV docking station and conducted sea trials in Yantai, Shandong Province. In 2016, Zhejiang University conducted a visually guided Dolphin II AUV terminal docking experiment based on visual guidance [31].
The hydrodynamic interaction between the AUV and the recovery device is a critical factor that must be considered in the recovery process [32,33]. Hydrodynamic interactions can affect the recovery process in different ways, including problems such as long recovery times, recovery failures, and even collisions between the AUV and the recovery device. The study of hydrodynamic problems related to AUV docking has also received great attention from researchers [34,35]. Wu et al. [36] studied the docking of an AUV with a conical pier, and various factors such as different velocities, accelerations, pier shapes, skidding modes, crossflow from different directions, and rudder angle. Their results show that an unclosed dock tends to reduce the drag of the AUV and decelerating at a constant velocity facilitates successful docking. In addition, Meng et al. [37,38] conducted extensive research on underwater docking of AUVs. This included exploring the effects of various docking methods and different structural forms of the docking device on the recovery process, as well as investigating the hydrodynamic interactions between the AUV and the docking device at rest and during motion. Their work has yielded important results, including the observation that mounting the docking device in the middle of the submarine provides optimal stability and that the velocity of the AUV plays a crucial role in the recovery process. Luo et al. [39] focused on the study of the hydrodynamic interactions between the AUV and the submarine during the recovery process under static conditions using the CFD method. The presence of the submarine significantly affects the motion characteristics of the AUV, and the sailing speed and relative position are the core factors that make it difficult for the AUV to approach safely. Xu et al. [40] revealed the hydrodynamic characteristics of bionic AUVs in the submarine boundary layer through numerical simulation, clarified the optimal connection site, and quantified the influence law of the proximity interaction of underwater vehicles at different scales, which provides a theoretical basis for the development of a dynamic docking system. Therefore, it is crucial to study the hydrodynamic interactions between the AUV and the recovery device to ensure a successful and safe recovery process [41,42]. This requires the consideration of several factors such as the size and shape of the AUV, the hydrodynamic characteristics of the recovery device, and the surrounding water currents.
This study aims to comprehensively analyze the hydrodynamic characteristics of the underwater docking between an AUV and conical dock, and clarify the influence laws of different factors on the docking process. The innovation lies in the comprehensive consideration of the coupling effect of multiple factors (such as the shape of the dock, the water velocity, the motion state of the AUV, etc.), the establishment of a more accurate hydrodynamic model, and the proposal of targeted optimization measures. This paper is divided into five sections. Section 1 describes the AUV docking system and its hydrodynamic problems. Section 2 describes the numerical approach to the AUV approach to the dock. Section 3 discusses the interference from the shape of the docking bay guide cover. Section 4 considers current magnitude and directional hydrodynamics. Conclusions are drawn in Section 5.

2. Geometric Models and Numerical Methodology

2.1. Numerical Model

As shown in Figure 1, the AUV consists of a torpedo-shaped body and a control rudder with a diameter of 0.32 m and an overall length of 4 m. The docking bay consists of an inlet-guided flare and an internal acrylic tube. The flared inlet is approximately 4.375 times the diameter of the AUV and is used to guide the AUV into the internal tubes for initial immobilization. During the docking process, the AUV starts from the initial position O (about double the length of the AUV from the docking bay entrance), arrives at the internal duct entrance B via the entrance A, and finally moves to the end of the docking bay at point C, where an elastic collision occurs at the end of the docking bay. The lengths of OA, OB, and OC are about 4m, 4.6m, and 7.5m, respectively.

2.2. Governing Equation

The RANS equation is used to model the transient pulsation characteristics in incompressible fluid flow. In the Reynolds averaging method, the flow field variables in the instantaneous Navier–Stokes equations are decomposed into mean and pulsation components. After substituting the above decomposition into the original instantaneous continuity and momentum equations and time averaging, the mean momentum equations in integral form, which are RANS equations, are achieved as follows:
u i ¯ x i = 0
ρ u i ¯ t + ρ u ¯ i u ¯ j x j = ρ f i ¯ p ¯ x i + ρ ν 2 u i ¯ x i x j ρ u i u j ¯ x i
where u i ¯ is the time-averaged velocity component, u i is the turbulent pulsating velocity component with respect to the time-averaged fluid velocity, p ¯ denotes the pressure, f i ¯ is the mass-force component, and u i u j ¯ is the time-averaged Reynolds stress.
After the introduction of the Reynolds average, the equation is augmented with the Reynolds stress term, rendering it unclosed and unsolvable. To enable the equation to be solved, researchers have proposed numerous turbulence models to close the equation. Among them, the k-ε model has the advantages of a fast convergence rate, low memory requirements, and good performance in solving external flow problems around complex geometries, and has been widely used in engineering practice.
The k-ε model is a two-equation model that requires solving the transport equations for turbulent kinetic energy k and turbulent dissipation rate ε in order to determine the turbulent eddy viscosity coefficient, turbulent kinetic energy k, and turbulent dissipation rate ε. It is defined as follows:
k = u i u j ¯ 2 = 1 2 u 2 ¯ + v 2 ¯ + w 2 ¯ ε = u ρ u j x k u i x k ¯
For standards, we used the k-ε model, whose transport equation is
ρ k t + ρ k u i x i = x j μ + μ t σ k k x j + G k + G b ρ ε Y M + S k ρ ε t + ρ ε u i x i = x j μ + μ t σ ε ε x j + C 1 ε ε k G k + C 3 ε G b C 2 ε ρ ε 2 k + S ε
In the equation, G k represents the turbulent kinetic energy generated by the average velocity gradient; G b represents the turbulent kinetic energy generated by buoyancy; Y M denotes the effect of turbulent pulsations on the total dissipation rate; C 1 ε , C 2 ε , and C 3 ε are empirical constants; σ k and σ ε represent the Prandtl numbers corresponding to turbulent kinetic energy and turbulent dissipation rate, respectively; and S k and S ε are custom source terms.

2.3. Boundary Condition

When using FLUENT for AUV hydrodynamic simulation, an appropriate virtual boundary is established as follows: Fix the AUV in the computational domain. Water flows at a certain velocity from the side of the computational domain and then exits from the zero-pressure side. The flow around the AUV is thus converted into an internal flow problem. The corresponding equation can also be solved within the space formed between the calculation domain and AUV.
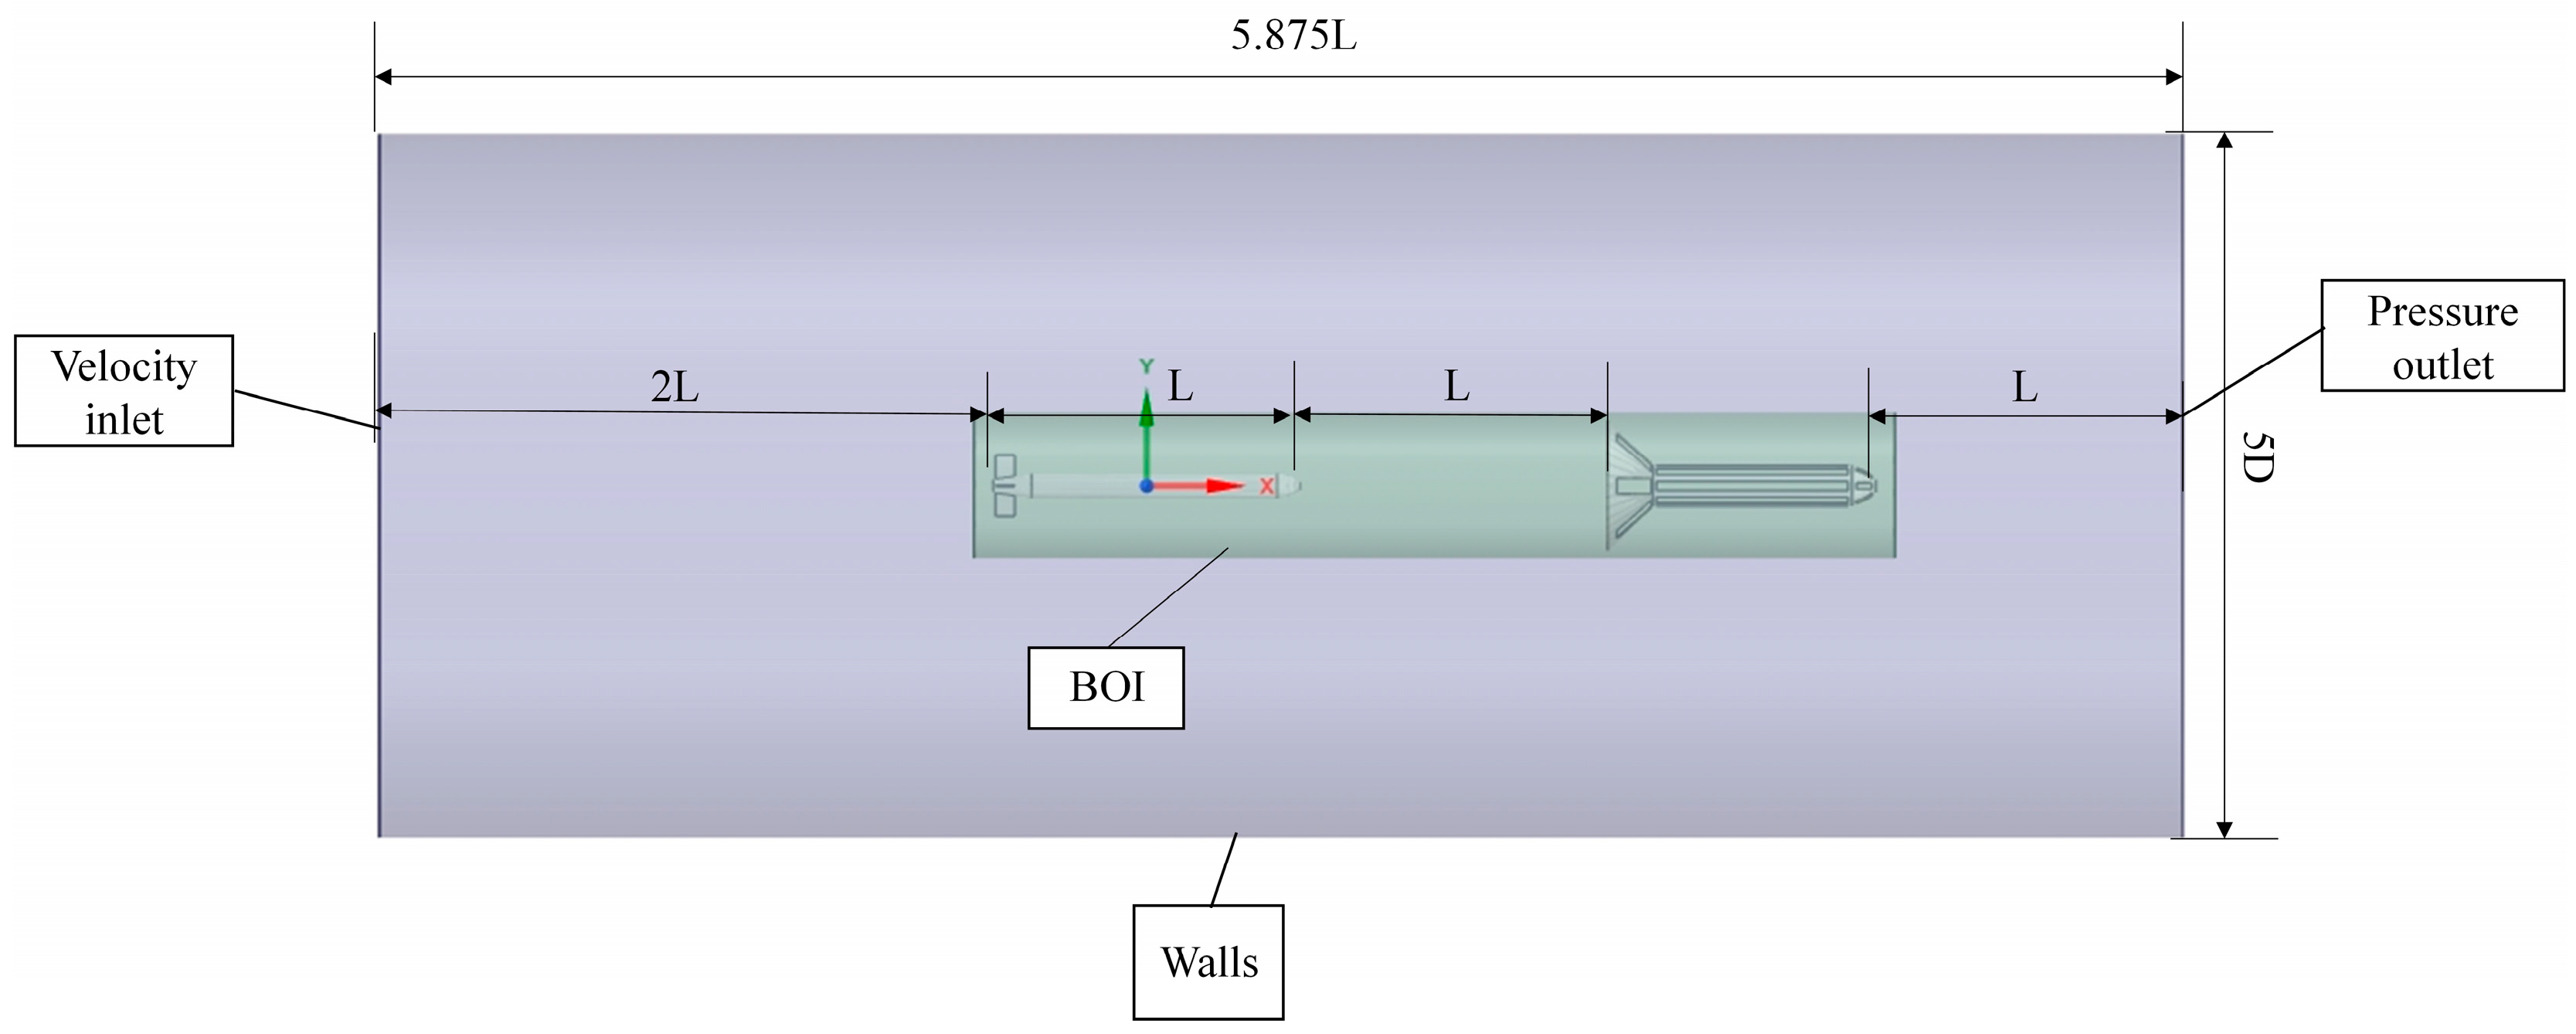
The domain is a cylindrical computational space as shown in Figure 2. Its dimensions are φ 5D × 6L, where D is the diameter of the conical dock entrance nozzle and L is the length of the AUV. The domain is approximately twice the length of the stern of the AUV, one times the length between the AUV and the dock, and one times the length behind the AUV. Walls: A free-slip boundary was chosen for the outer wall of the fluid domain, and a no-slip solid-wall boundary was chosen for the AUV wall so that the fluid velocity was the same as the velocity at that point in the AUV.

2.4. Meshing

In numerical simulations of underwater docking between an AUV and a docking chamber, the dynamic overlapping grid update method can effectively handle grid deformation during AUV docking. This method achieves accurate transmission of physical information between different grids by constructing overlapping grid regions between multiple objects, such as the AUV and docking chamber, and dynamically updating grid positions, overlapping relationships, and interpolation connections at each time step. This ensures the continuity and accuracy of flow field calculations, providing reliable numerical support for docking processes in complex flow environments.
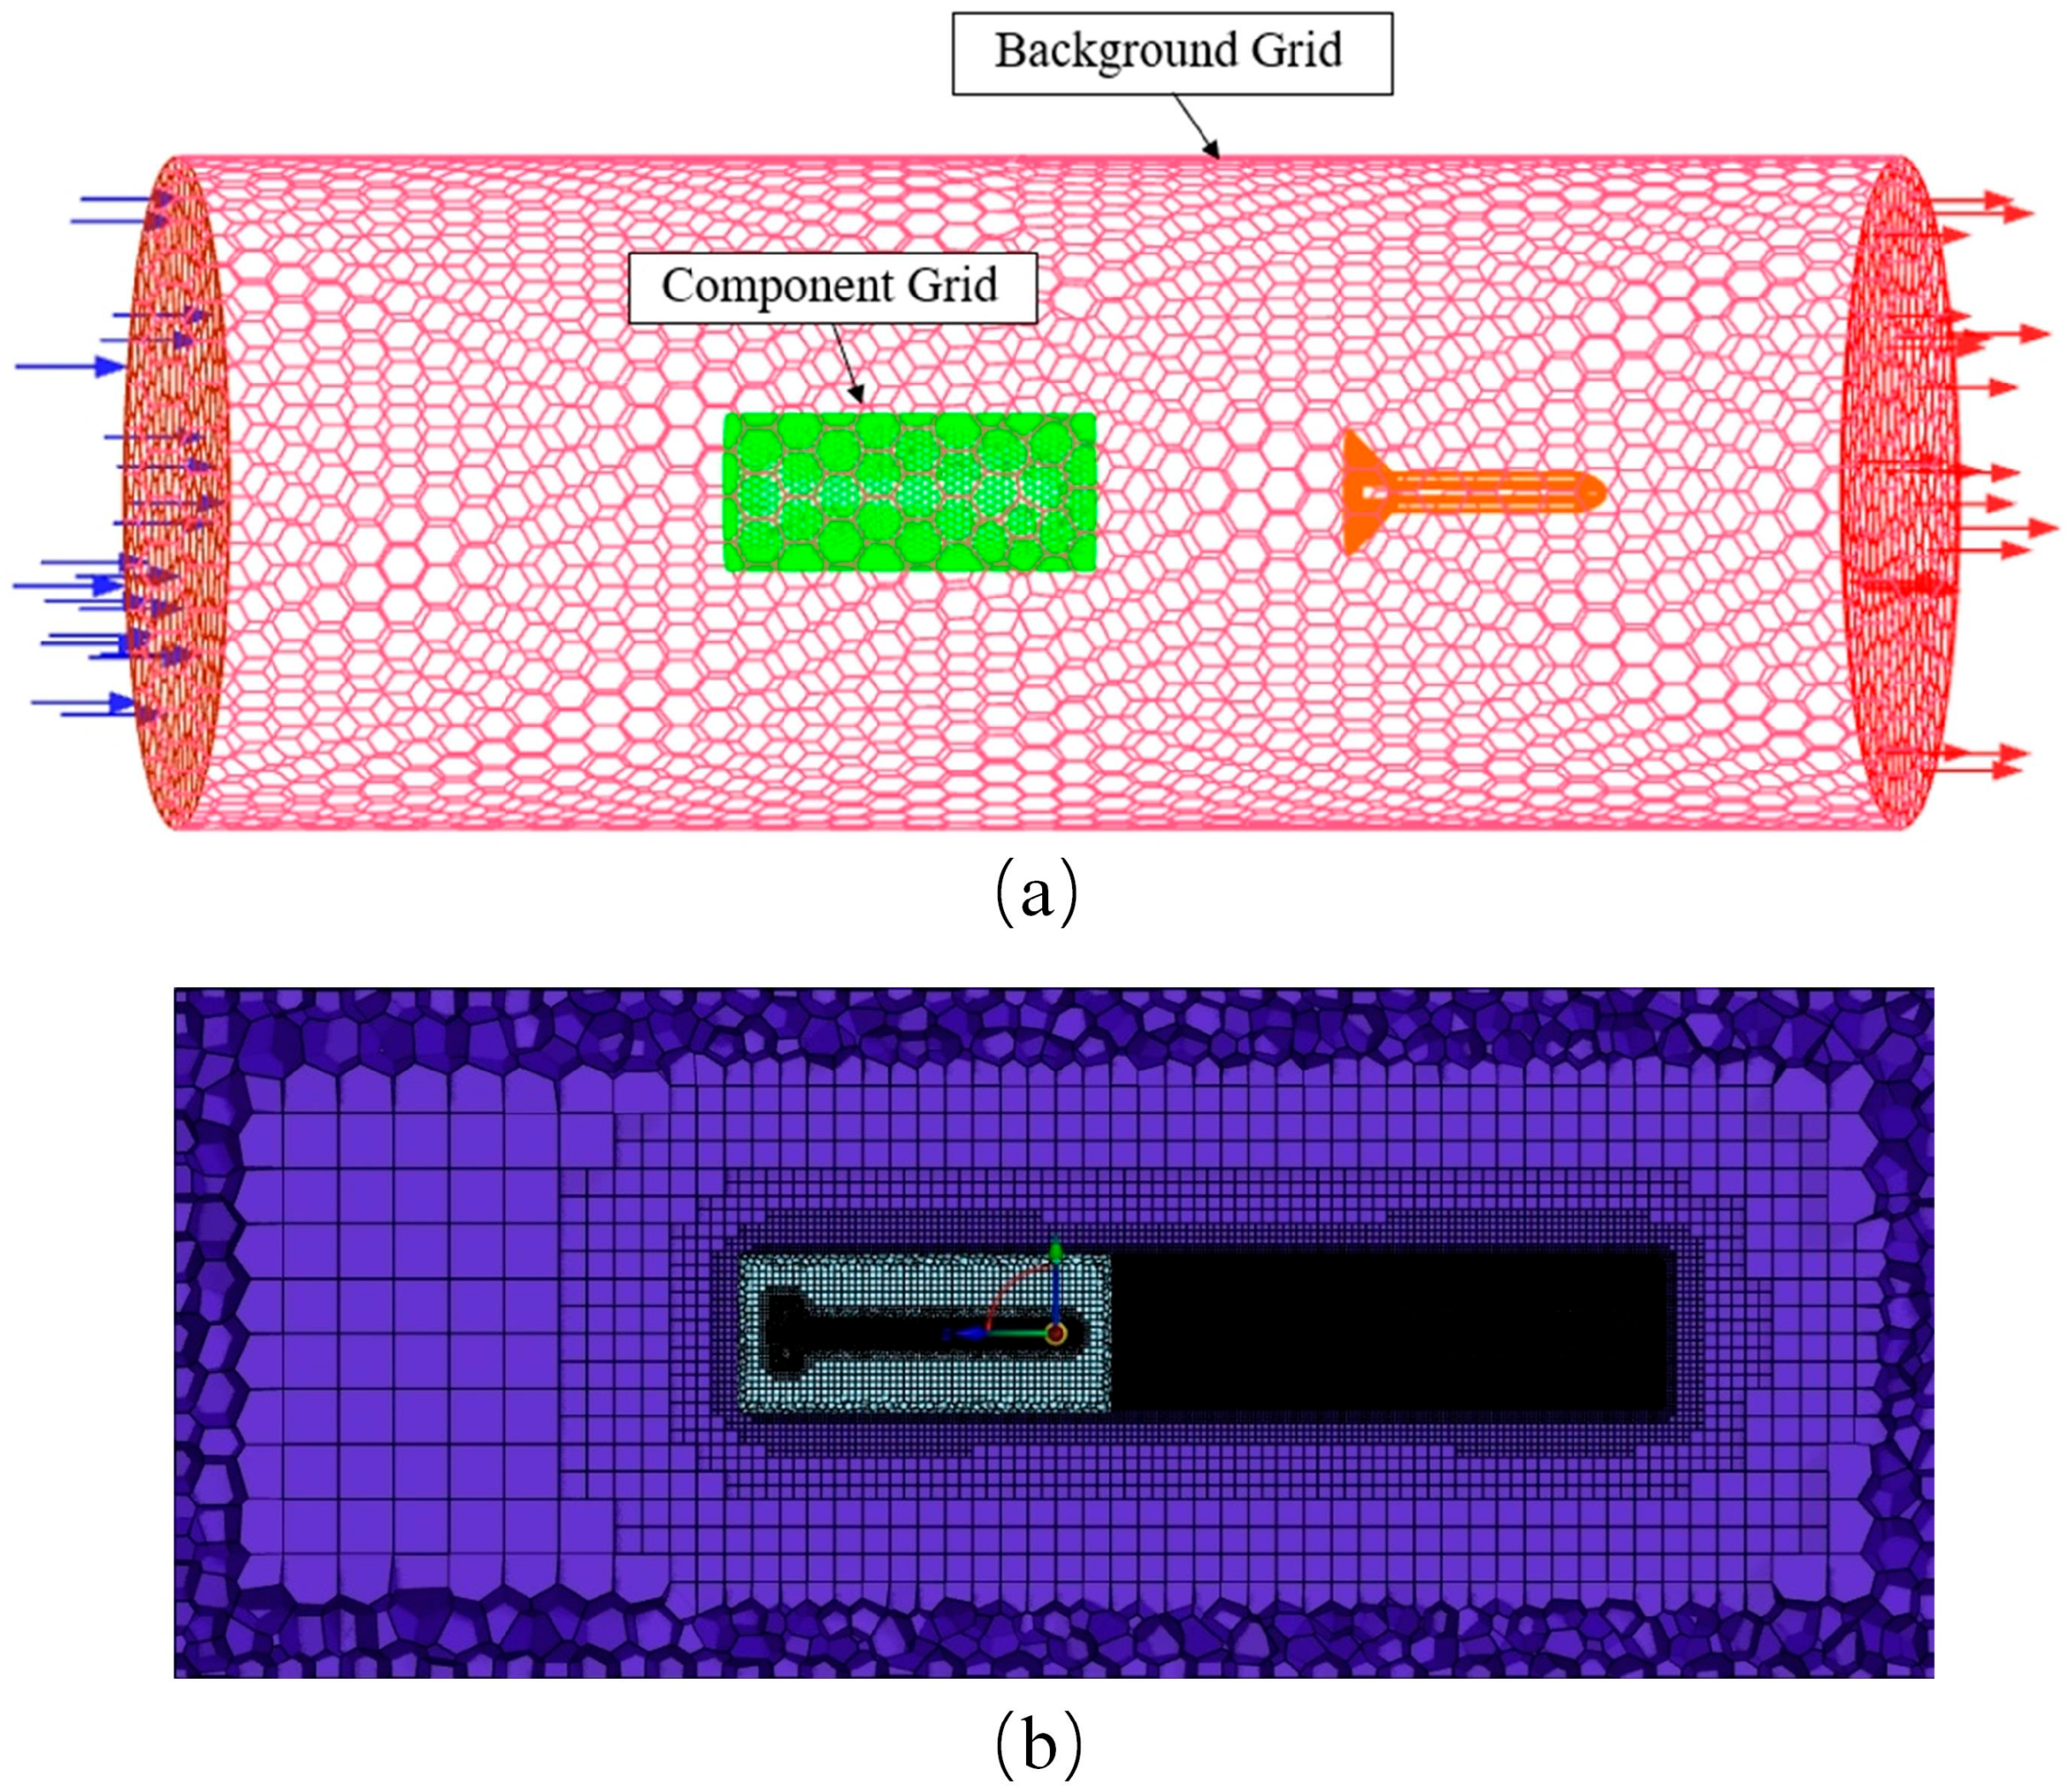
Figure 3a shows the total domain grid, which includes a background grid and a component grid. Its internal grid is constructed using a hybrid grid, which is represented in the cutting plane (Figure 3b). The hybrid grid is applied to steady-state and unsteady-state flows, such as prismatic/tetrahedral/hexahedral grids [43,44] and tetrahedral/adaptive Cartesian/prismatic grids. The hybrid grid with prismatic grids captures the boundary layer, tetrahedral grids adapt to complex geometries, and Cartesian or hexahedral grids adjust the far field to reduce the number of grids. For regions with prominent or fine geometric features in the AUV and docking device model, density boxes should be used to locally refine the mesh, optimizing mesh quality. The final generated mesh count is 3.78 million; after smoothing optimization, the mesh quality exceeds 0.36, meeting quality requirements and suitable for use as a simulation analysis mesh model.
In this study, the mixed mesh consists of a prismatic layer mesh surrounding the autonomous underwater vehicle (AUV) and a tetrahedral mesh filling the peripheral region. This mesh is suitable for large displacement movements of objects and movements in any direction. The hybrid mesh-generation process comprises four steps: first, an Octree method is used to generate the surface mesh; second, the prismatic layer advancement method is applied in the near-wall region to generate prismatic layer meshes, enabling precise simulation of boundary layer flow; third, the front-advancement method is employed in the far-wall region to generate tetrahedral meshes, accommodating complex geometric deformations; finally, multiple subdomains are merged into a single continuous computational domain. The entire computational domain comprises two fluid regions: a prismatic mesh region that moves rigidly with the object and a tetrahedral mesh region that undergoes dynamic deformation.

2.5. Grid and Time-Step Dependency Study

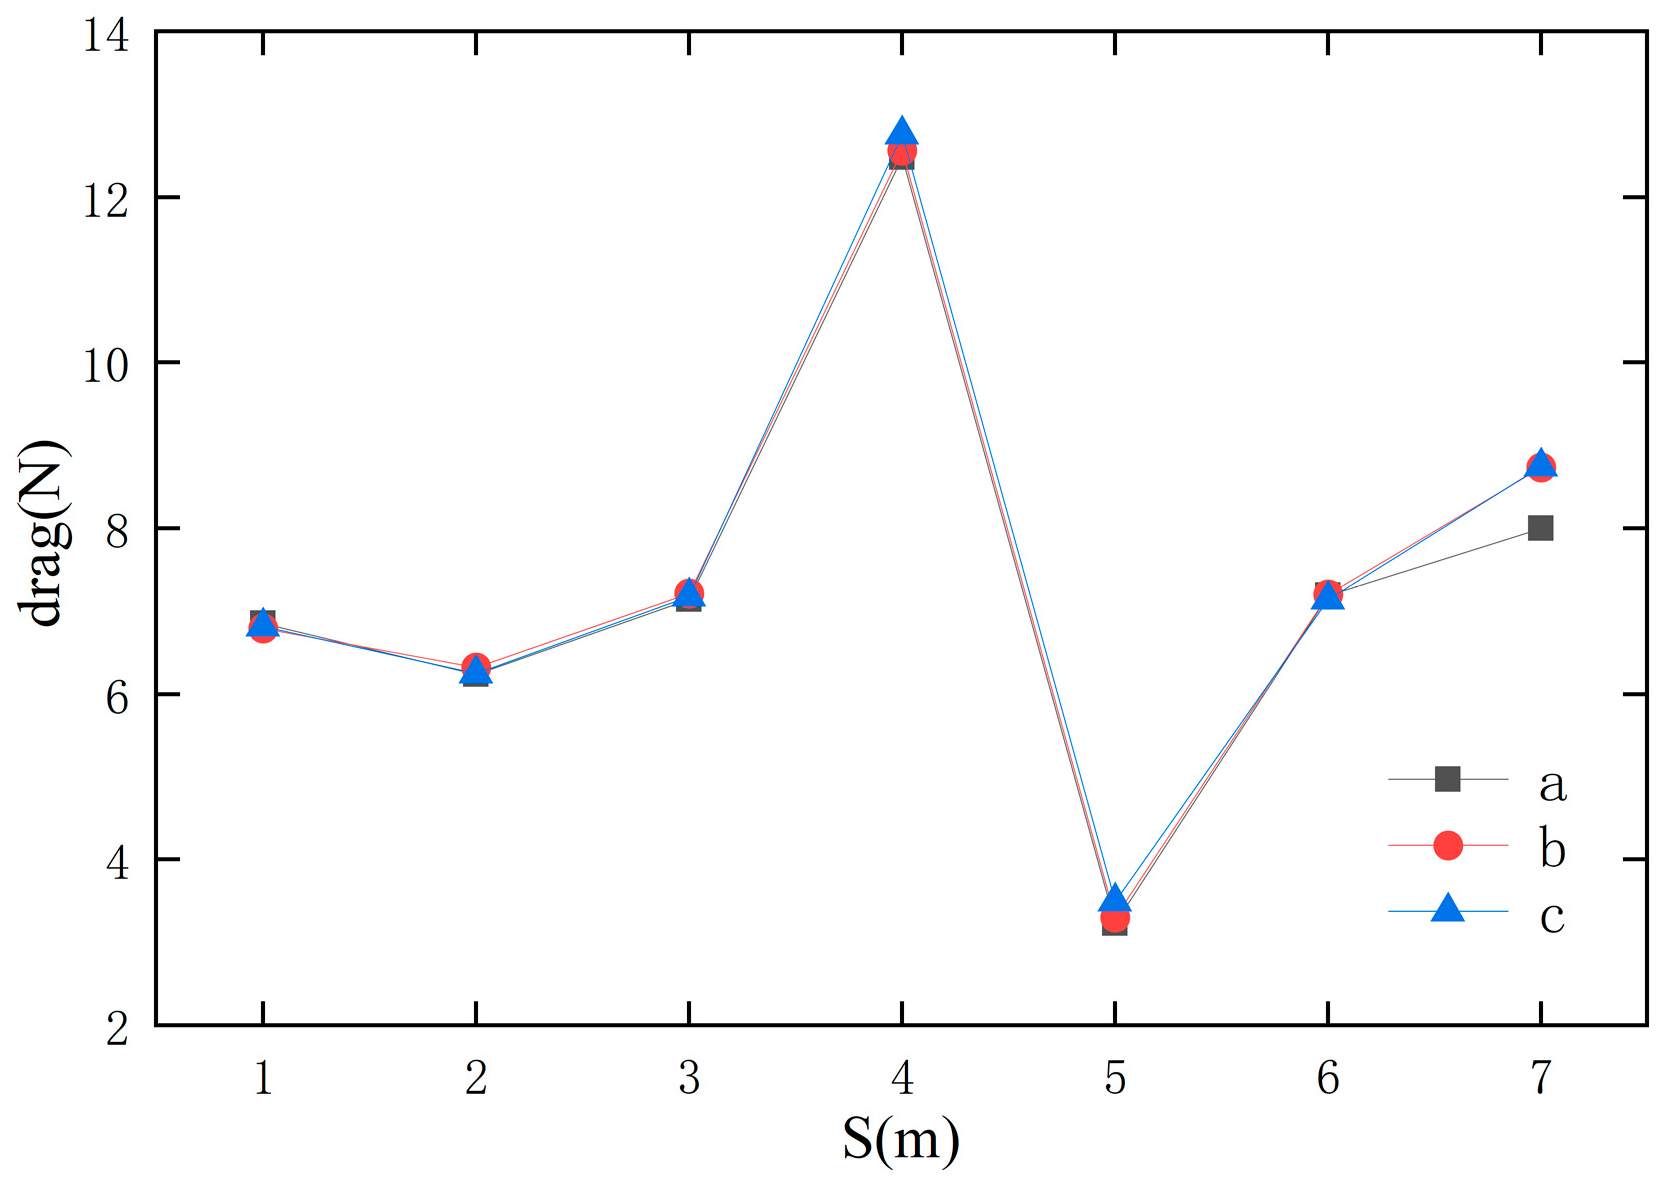
The mesh topology and size directly affect the computational accuracy, and this paper focuses on the effects of the mesh topology type and the number of meshes through mesh dependency analysis. Two mesh schemes are adopted: hybrid mesh (Figure 4a) and pure tetrahedral mesh (Figure 4b). The latter contains only tetrahedral cells in the whole computational domain, which is both efficient in generation and adaptable to the motion boundary. For the AUV linear motion condition, the flow field characteristics are computed separately for the two topologies: Figure 5 compares the hybrid mesh (A: 193 × 104; B: 251 × 104; C: 378 × 104; D: 552 × 104) versus a pure tetrahedral mesh (E: 449 × 104) at coarse and fine mesh scales, and Figure 6 illustrates the results of the time-step sensitivity analyses (a: 500 steps; b: 1000 steps; c: 2000 steps).
A hybrid mesh with a hexahedral mesh capturing the boundary layer can be more accurate in terms of drag. The hexahedral mesh can more accurately predict the velocity in viscous fluids, and due to viscosity and pressure on the boundary layer, the velocity in viscous fluids is smaller than that in ideal fluids. Grid-independence analysis shows that when the grid size exceeds 3 million cells, the difference between the sparsest and the densest grid calculation results is only 1.18%; in the time-step verification, the maximum difference between 500 and 2000 steps is controlled within 1%. This double verification confirms the engineering reliability of the simulation results. Based on the balance of computational efficiency and accuracy, the subsequent optimization adopts a medium grid size of 3.78 million cells and a 1000-step time-step configuration.

3. Results and Discussion

3.1. Inlet Nozzle Taper

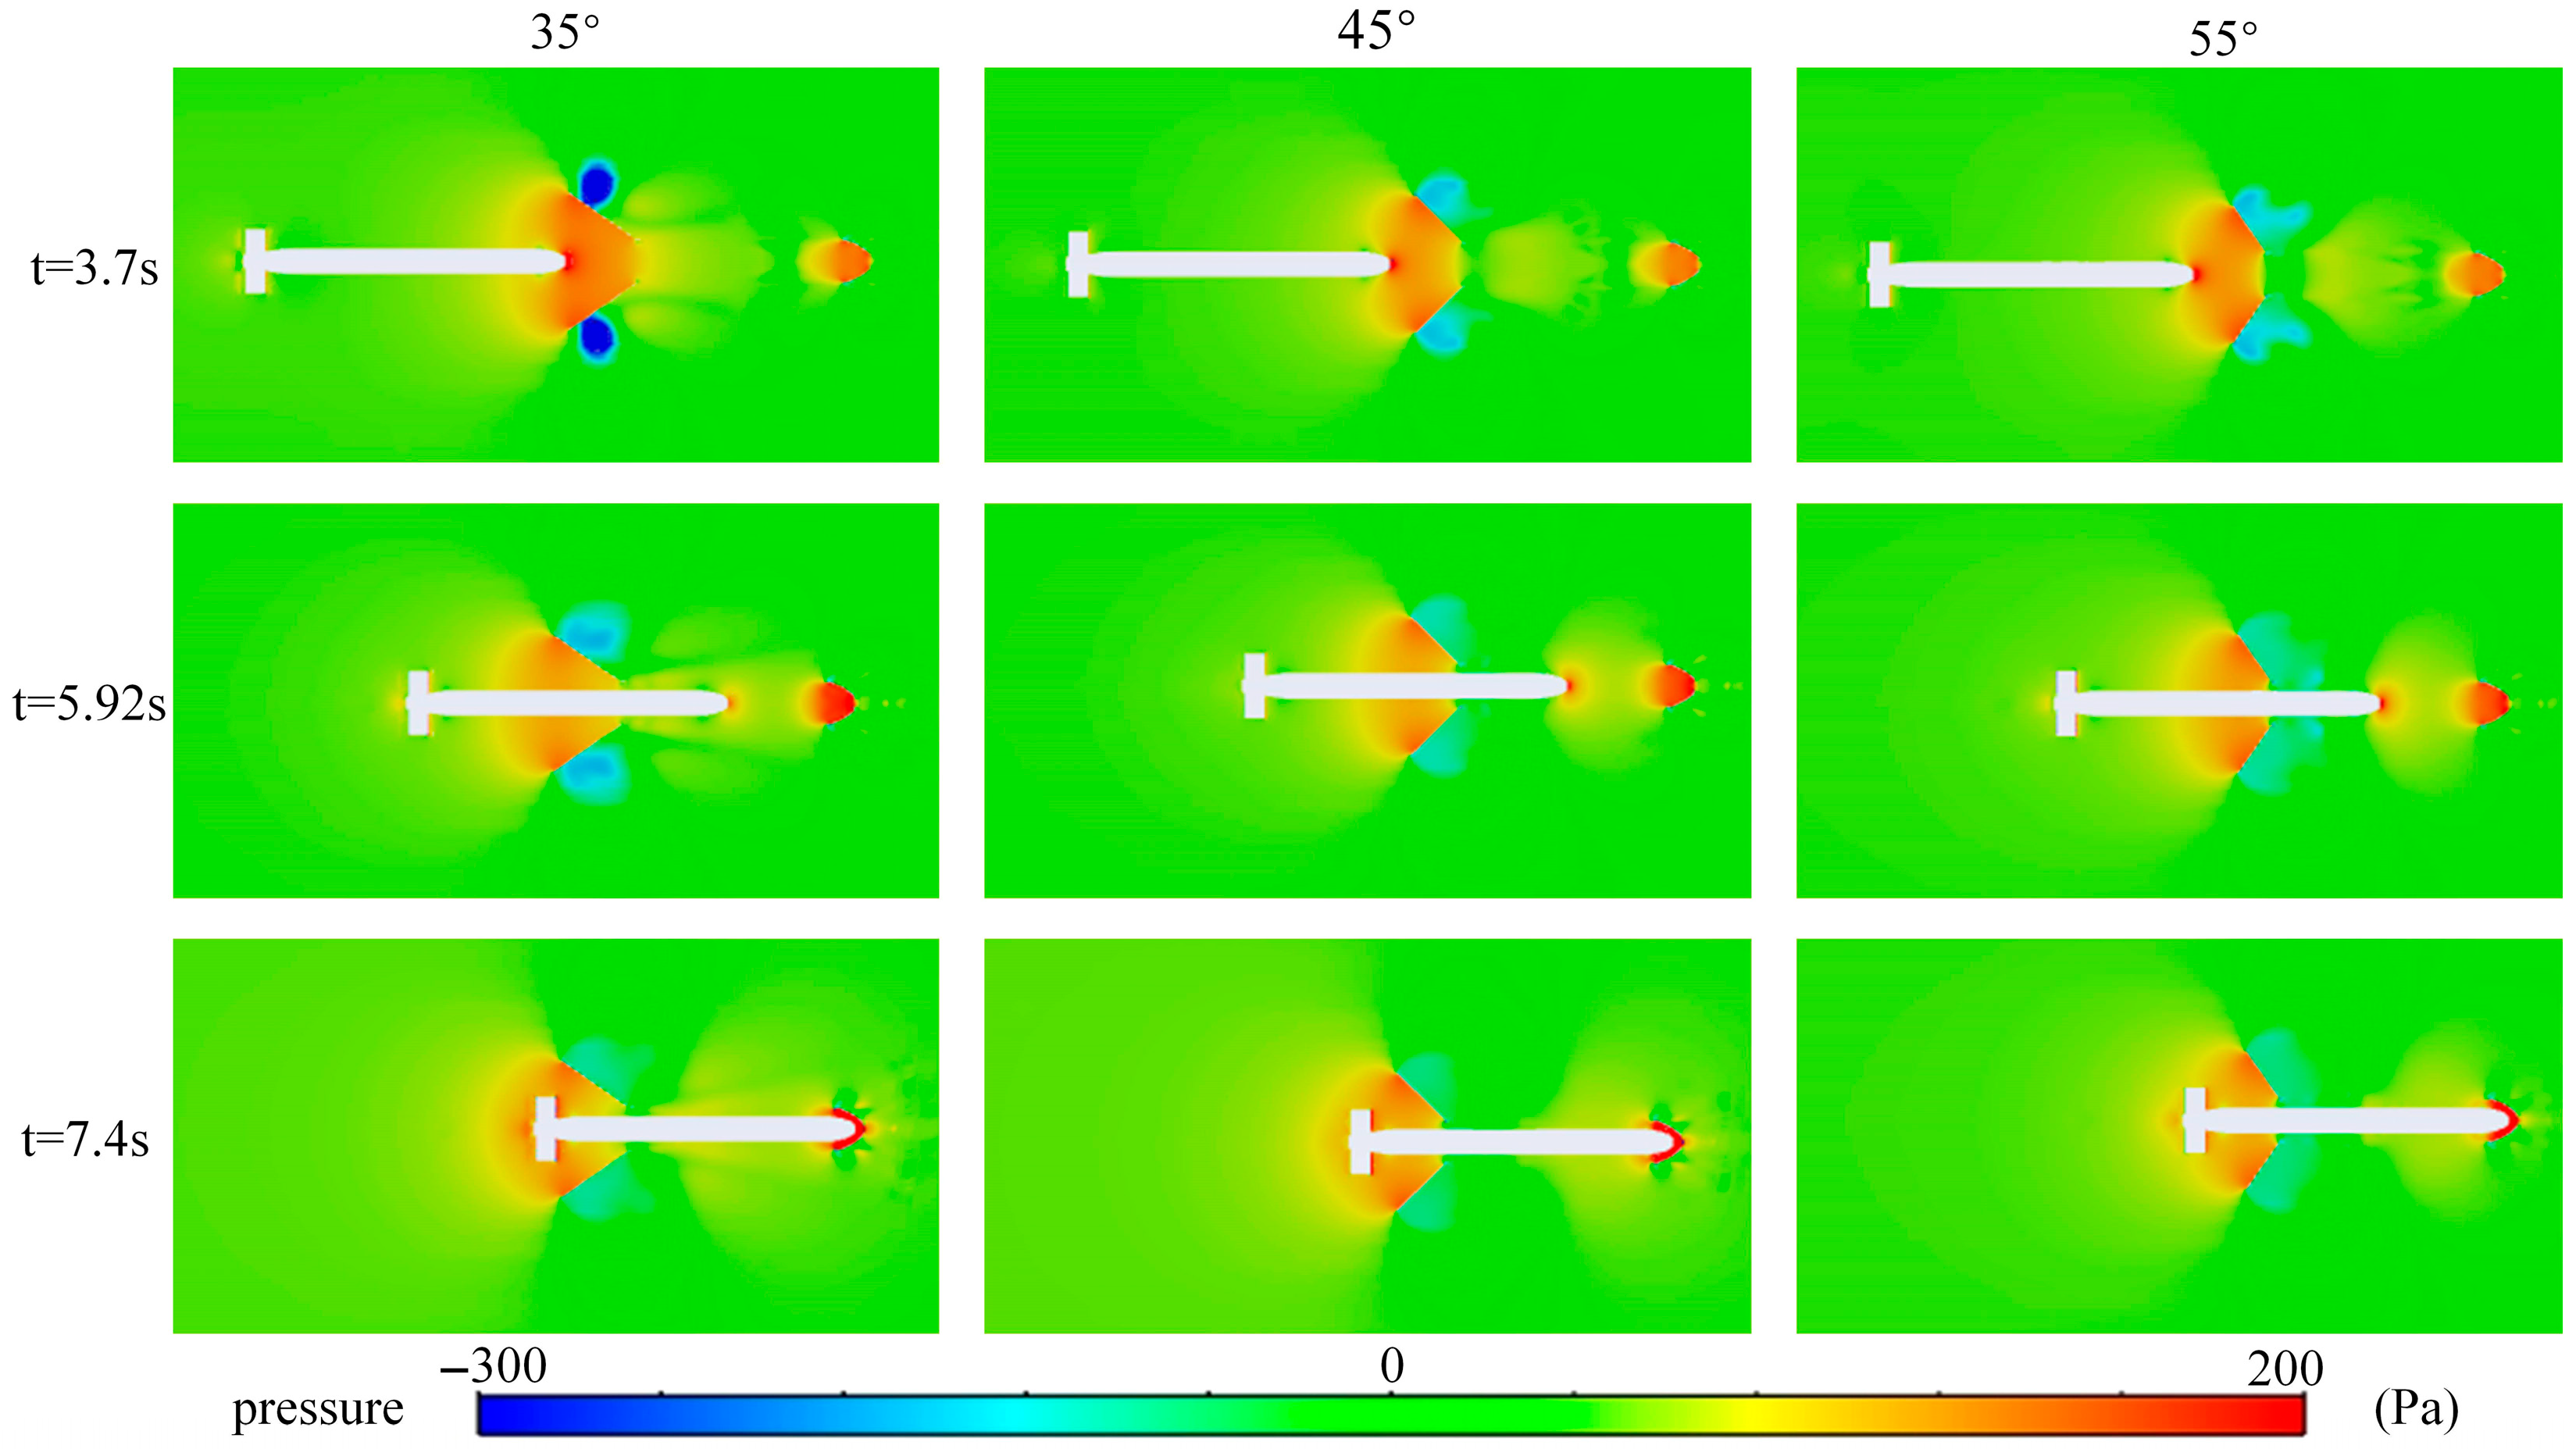
In order to analyze the effect of the shape of the docking bay inlet on the hydrodynamic behavior of the AUV, three inlet nozzles with different tapers were first designed: the taper angles were 35°, 45°, and 55°. The AUV was docked at a constant velocity (1 m/s) in a positive ocean current (0.5 m/s), and the inlet diameter was fixed at 1700 mm for all designs to facilitate the comparison of the effects of different inlet tapers.
Figure 7 shows the pressure clouds at three typical moments during the docking of the AUV to the three different inlet taper docking bays. As the AUV approaches the nozzle (t = 3.7 s), two high-pressure regions appear at the head and tail of the docking bay, respectively. As the AUV passes through the nozzle (t = 5.92 s), the high pressures inside the docking unit’s guiding hood decrease. The figure shows that the smaller the docking bay entrance taper, the more significant the wall pressure effect becomes. This is due to the velocity-induced fluid impact and extrusion, which causes the fluid in the inlet region to be extruded, which in turn generates a reaction force on the AUV head and the inside of the conical guide cover, forming a high-pressure region. At the same time, most of the middle area of the docking bay shows a low-pressure region, which is caused by the blocking effect of the inlet, resulting in the deceleration of the fluid as it passes through this region, which leads to a sharp decrease in the differential pressure resistance when the AUV arrives at this region. For a funnel-type recovery device, the drag decreases rapidly as the AUV approaches this low-pressure region, contributing to a higher capture-docking success rate, and the extent of this low-pressure region expands as the inlet taper increases. In addition, the backside of the inlet creates a small negative-pressure zone due to some of the fluid being blocked from passing through, a phenomenon that is particularly noticeable at a 35° taper. When the AUV arrives at the aft part of the docking bay (t = 7.4 s), the aft part interacts with the fluid due to the impact of the ocean current and the current pressure caused by the movement of the AUV, forming a positive pressure zone and experiencing high pressure. At this point, the effect of the inlet taper on the pressure in the wake becomes negligible.
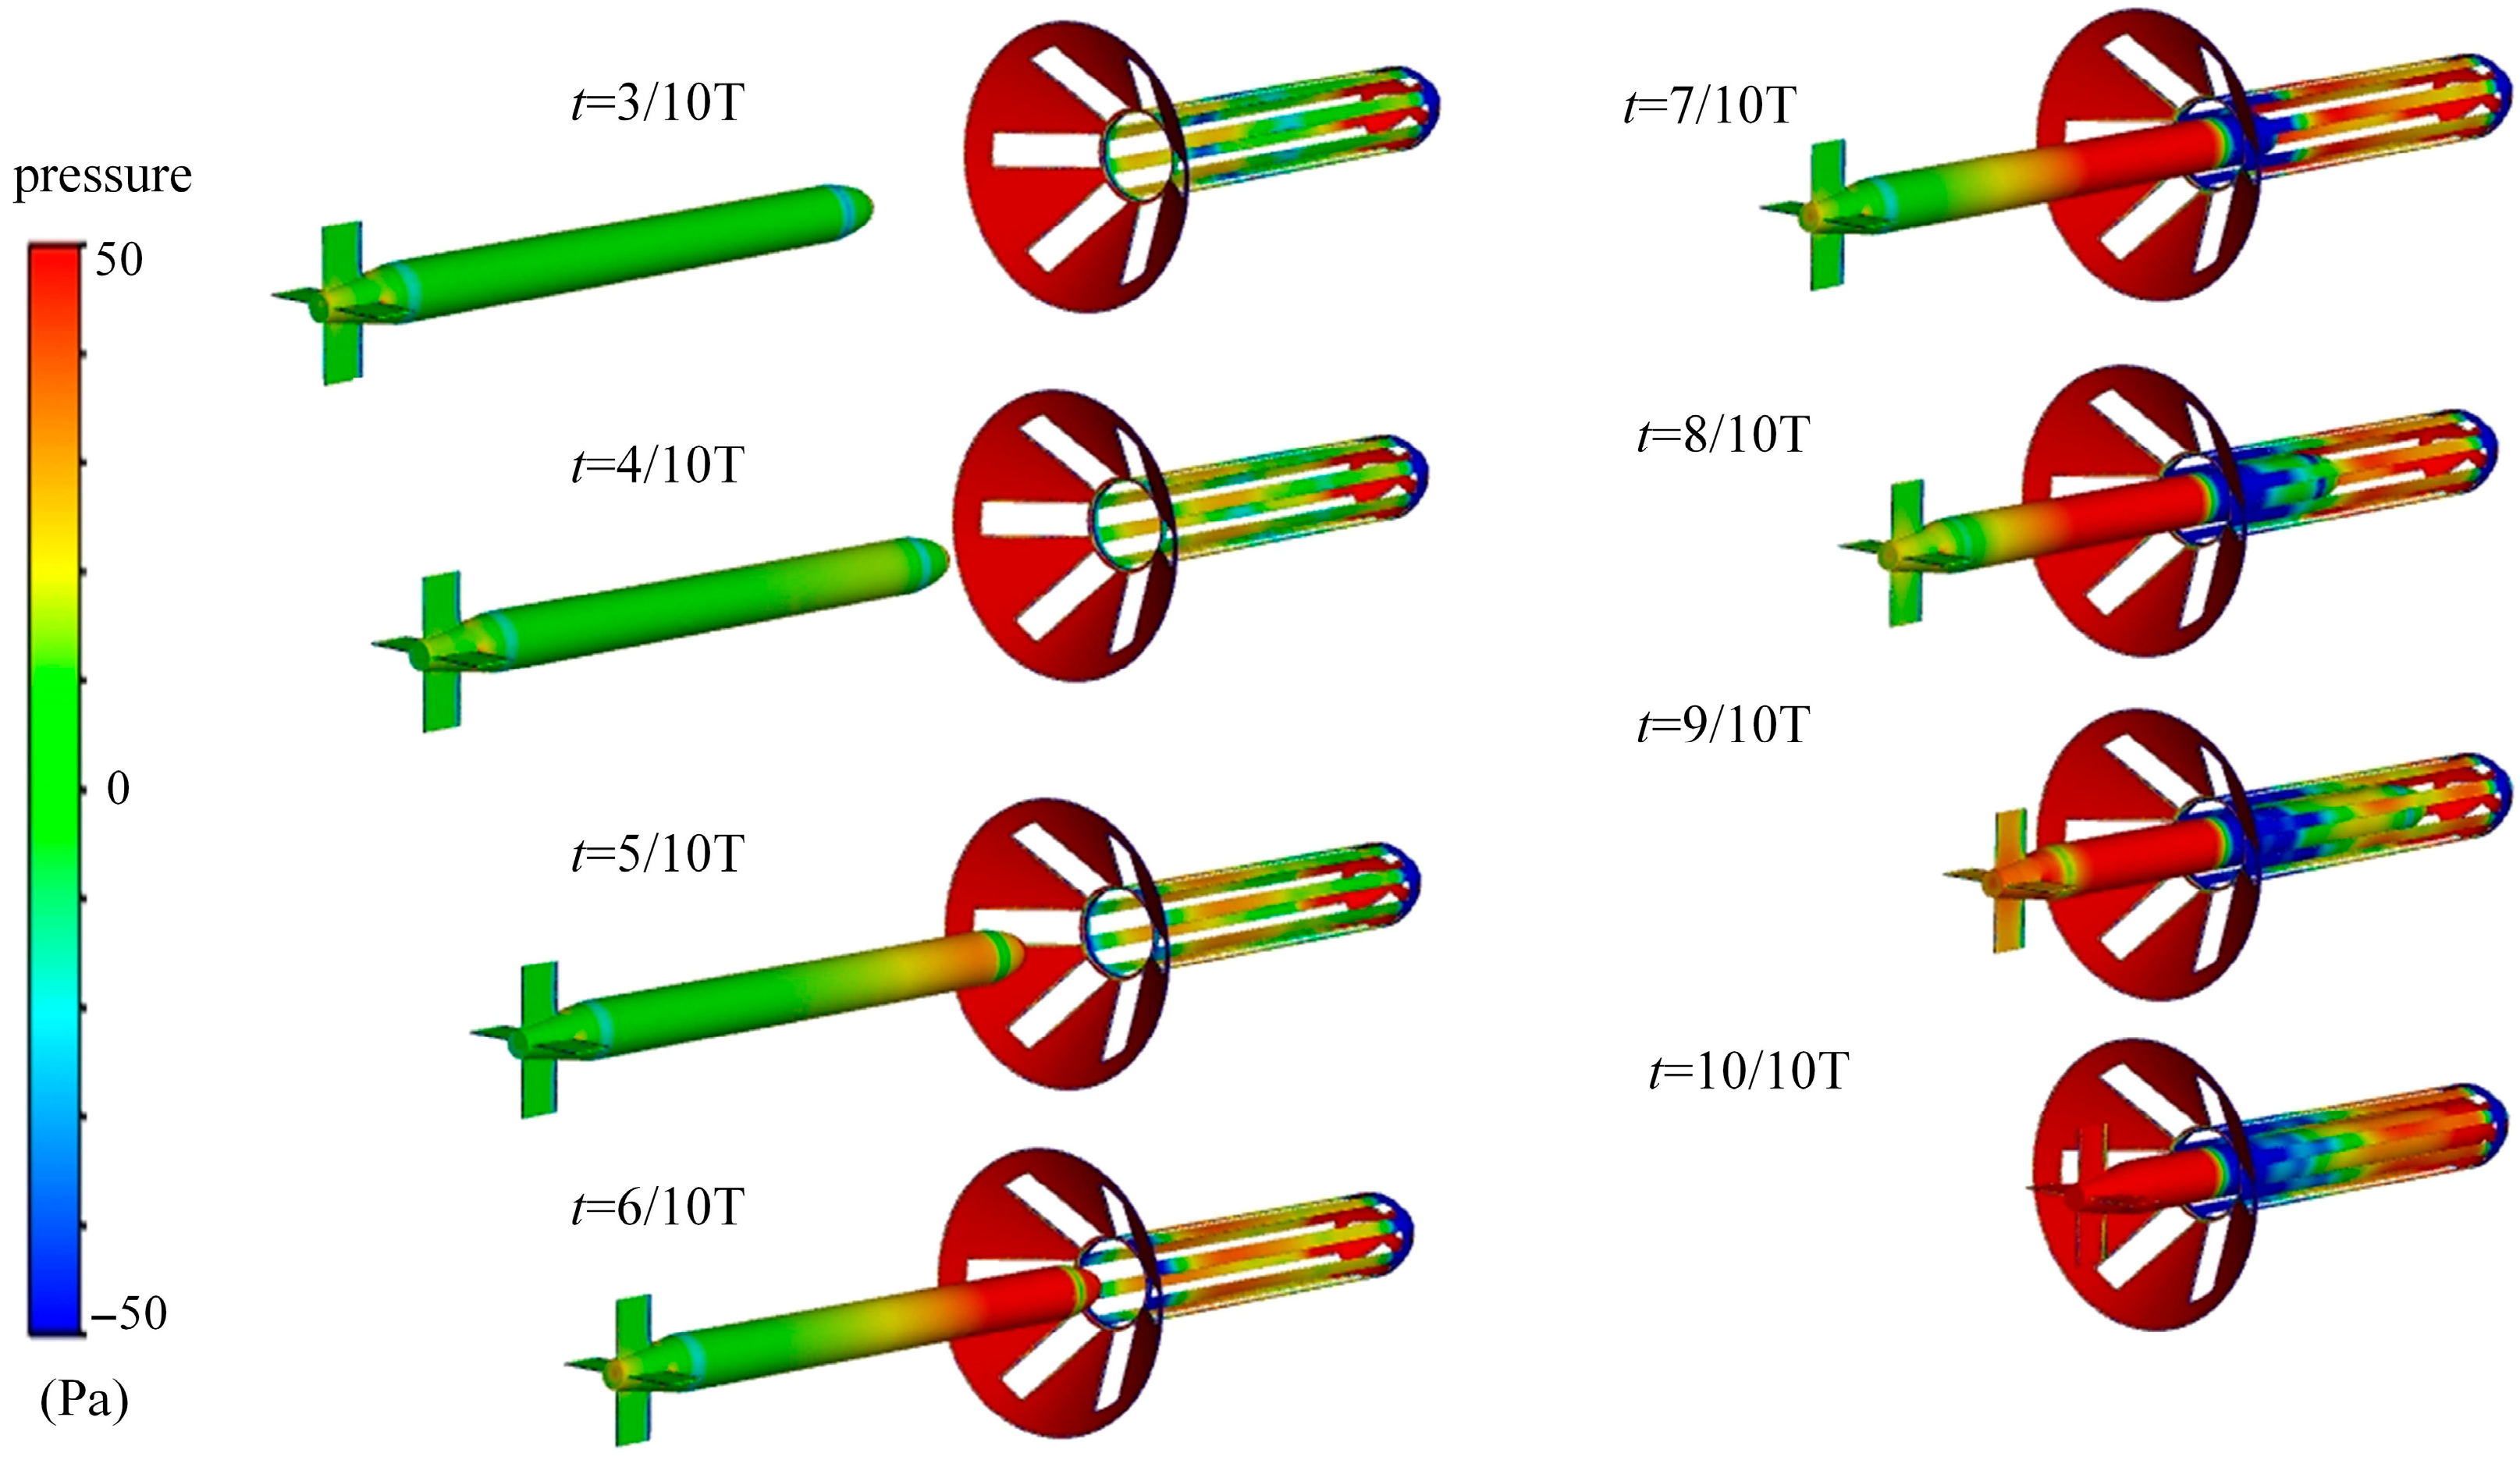
Figure 8 illustrates the three-dimensional pressure cloud for the uniform docking process of the AUV. Before t = 4/10T, the docking basin has little effect on the AUV due to the distance, and the pressure changes in the vicinity of the docking bay and the AUV are not significant. As shown in the figure, there are three distinct pressure regions on the surface of the AUV—the head transition section, the parallel midbody, and the tail transition section—with the parallel midbody pressure being slightly higher. Before the AUV arrives at point B, the head transition section is in a low-pressure region, the range of this low-pressure region expands as the AUV approaches the recovery unit, and the pressure value rises accordingly. This low pressure in the head transition indicates that the pressure at the head station of the AUV is increasing. The high pressure at the head acts on the fluid and drives it to the tail; the stronger the high pressure, the lower the low pressure in the neighboring head transitions, resulting in an increase in the local flow velocity and frictional resistance, which in turn increases the overall drag of the AUV. When the head of the AUV enters the nozzle of the recovery device, the nozzle area shows a high-pressure distribution; when the parallel midbody enters the nozzle, the head of the AUV turns to a low-pressure distribution. This suggests that the recovery device has opposite effects before and after the AUV crosses the B-point: before the B-point it hinders navigation, while after the B-point it produces an adsorption effect to facilitate docking.
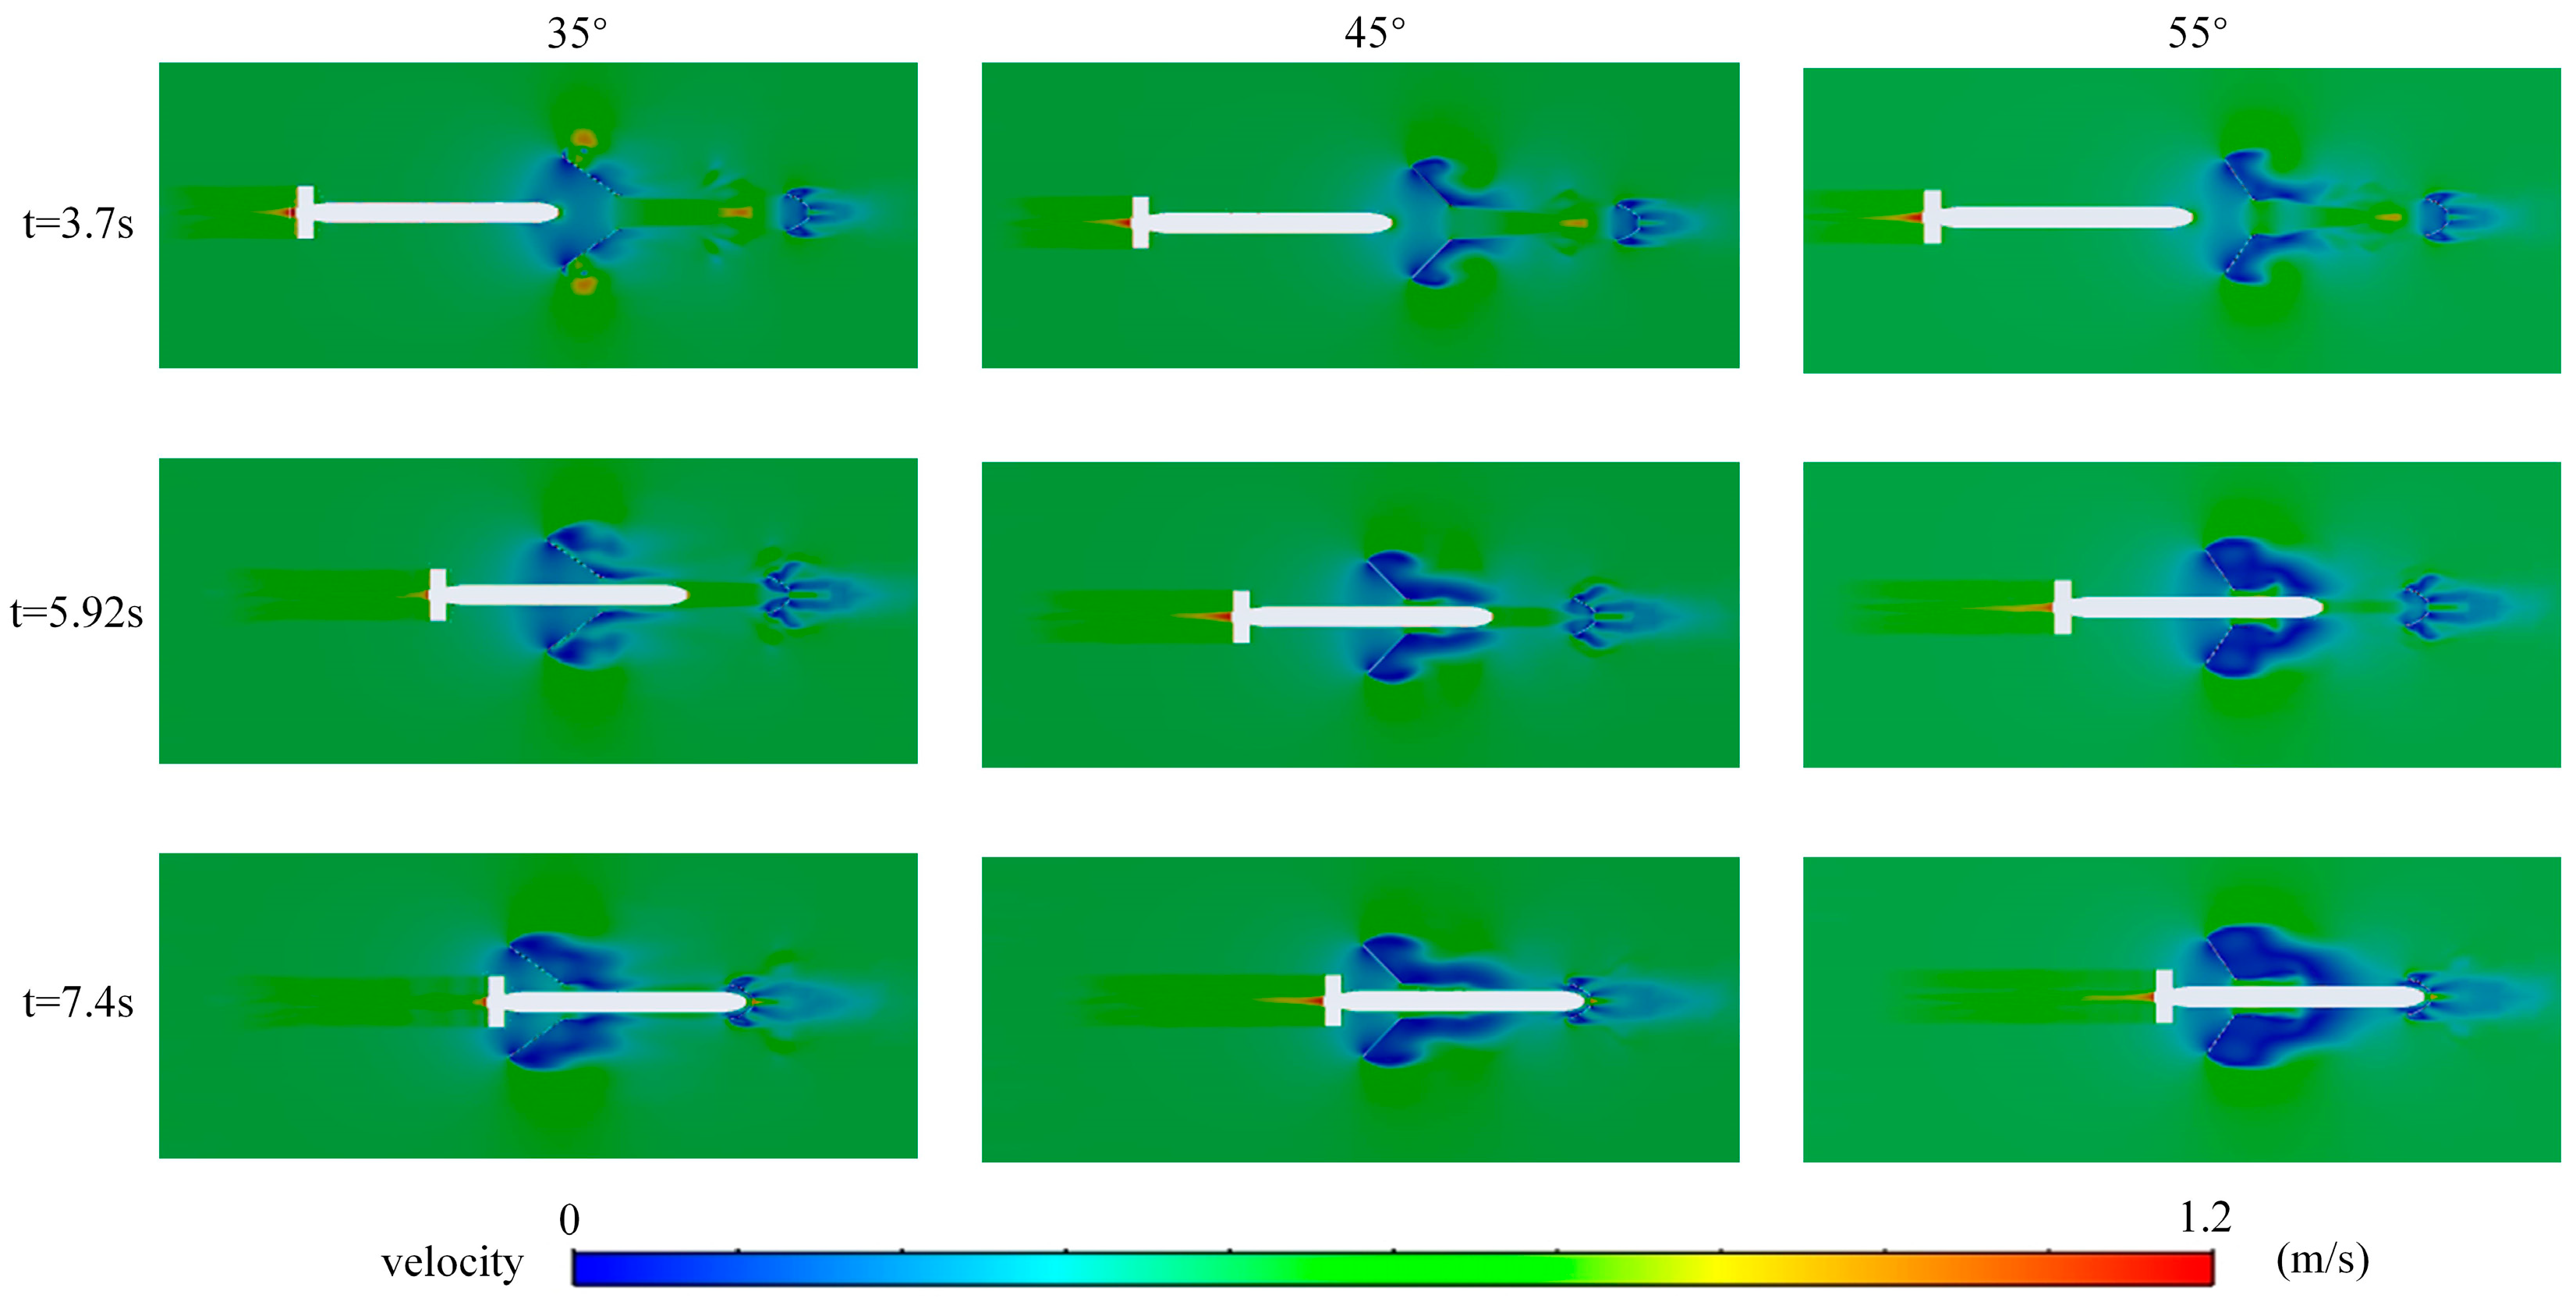
Figure 9 shows the velocity clouds at three typical moments during the docking of the AUV to three different inlet taper docking bays. As shown in the figure, as the AUV gradually approaches the docking bay, the inlet guiding shroud exerts a blocking effect on the fluid, creating a localized low-velocity region at the inlet. At the moment of t = 3.7 s, the fluid flow velocity in the head region of the AUV is low, while the flow velocity in the tail region is high, and this velocity distribution is favorable for the AUV to enter the docking device smoothly. In addition, the larger the taper of the docking bay entrance, the stronger the resistance the fluid suffers when passing through the entrance guiding hood, leading to a further reduction in the fluid velocity behind the guiding hood, and the range of the low-speed influence area is also expanded. When the AUV approaches the recovery device from a long distance, its surface friction resistance increases accordingly. At the same time, the flow of water past the recovery device creates a region of turbulence on its rear side, which causes a significant increase in the relative velocity of the fluid in that region. The pressure change is closely related to the velocity distribution, with the high-pressure region inside the guidance canopy corresponding to the low-flow velocity region.
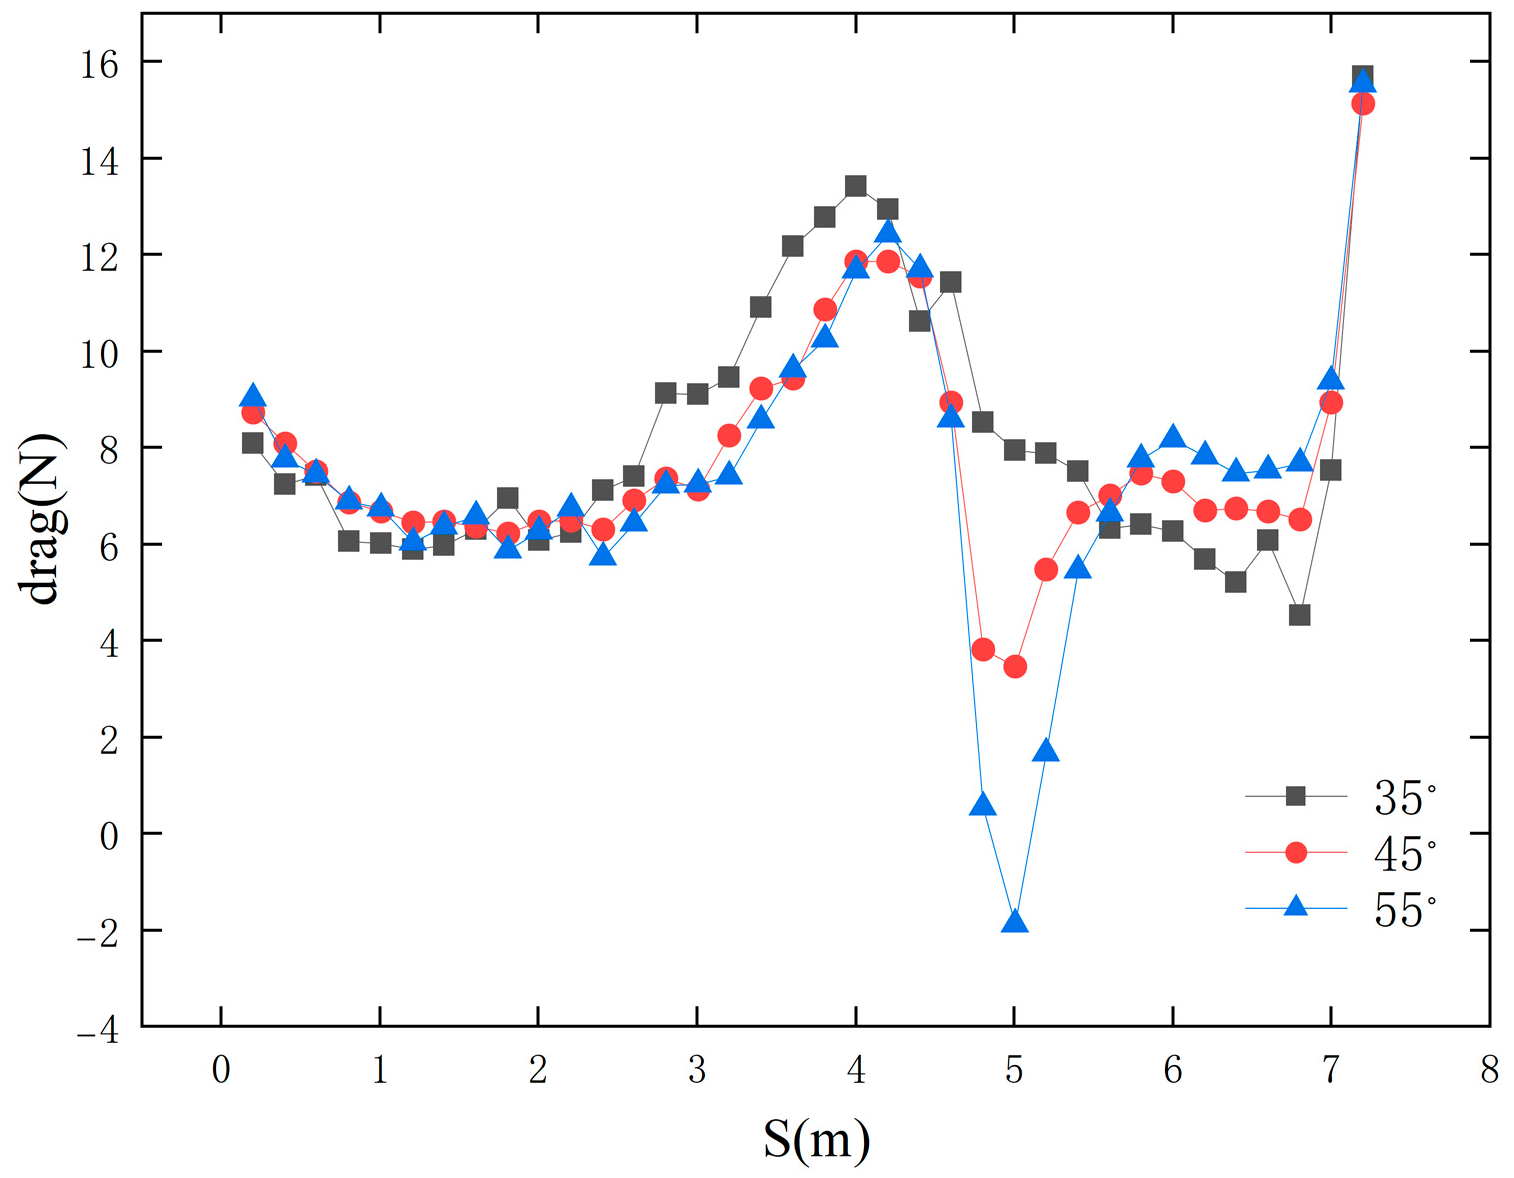
Figure 10 illustrates the point–line plots of drag change corresponding to the running distance (d = 1, 2, 3, 4, 5, 6, 7 m) during docking of the AUV to the docking bay with three different inlet tapers. The decrease in AUV drag during the initial 1 m originates from the fact that the ocean current moves in the same direction as the AUV, reducing the relative velocity of the fluid. In the far-field stage (d = 1–3 m) the drag remains stable; near the nozzle inlet (d ≈ 4 m) the drag rises sharply, and at point A (inlet plane) it reaches about twice the drag at d = 2 m. The drag decreases after crossing point B (nozzle critical position); the drag increases again when entering the inner tube section (near point C), which is due to the blockage of the current at the aft end of the docking bay. Comparing the different tapers, the docking resistance is lowest at the 55° entrance and highest at the 35° entrance. Increasing the docking bay entrance taper can reduce the docking resistance and shorten the docking time.

3.2. Inlet Nozzle Size

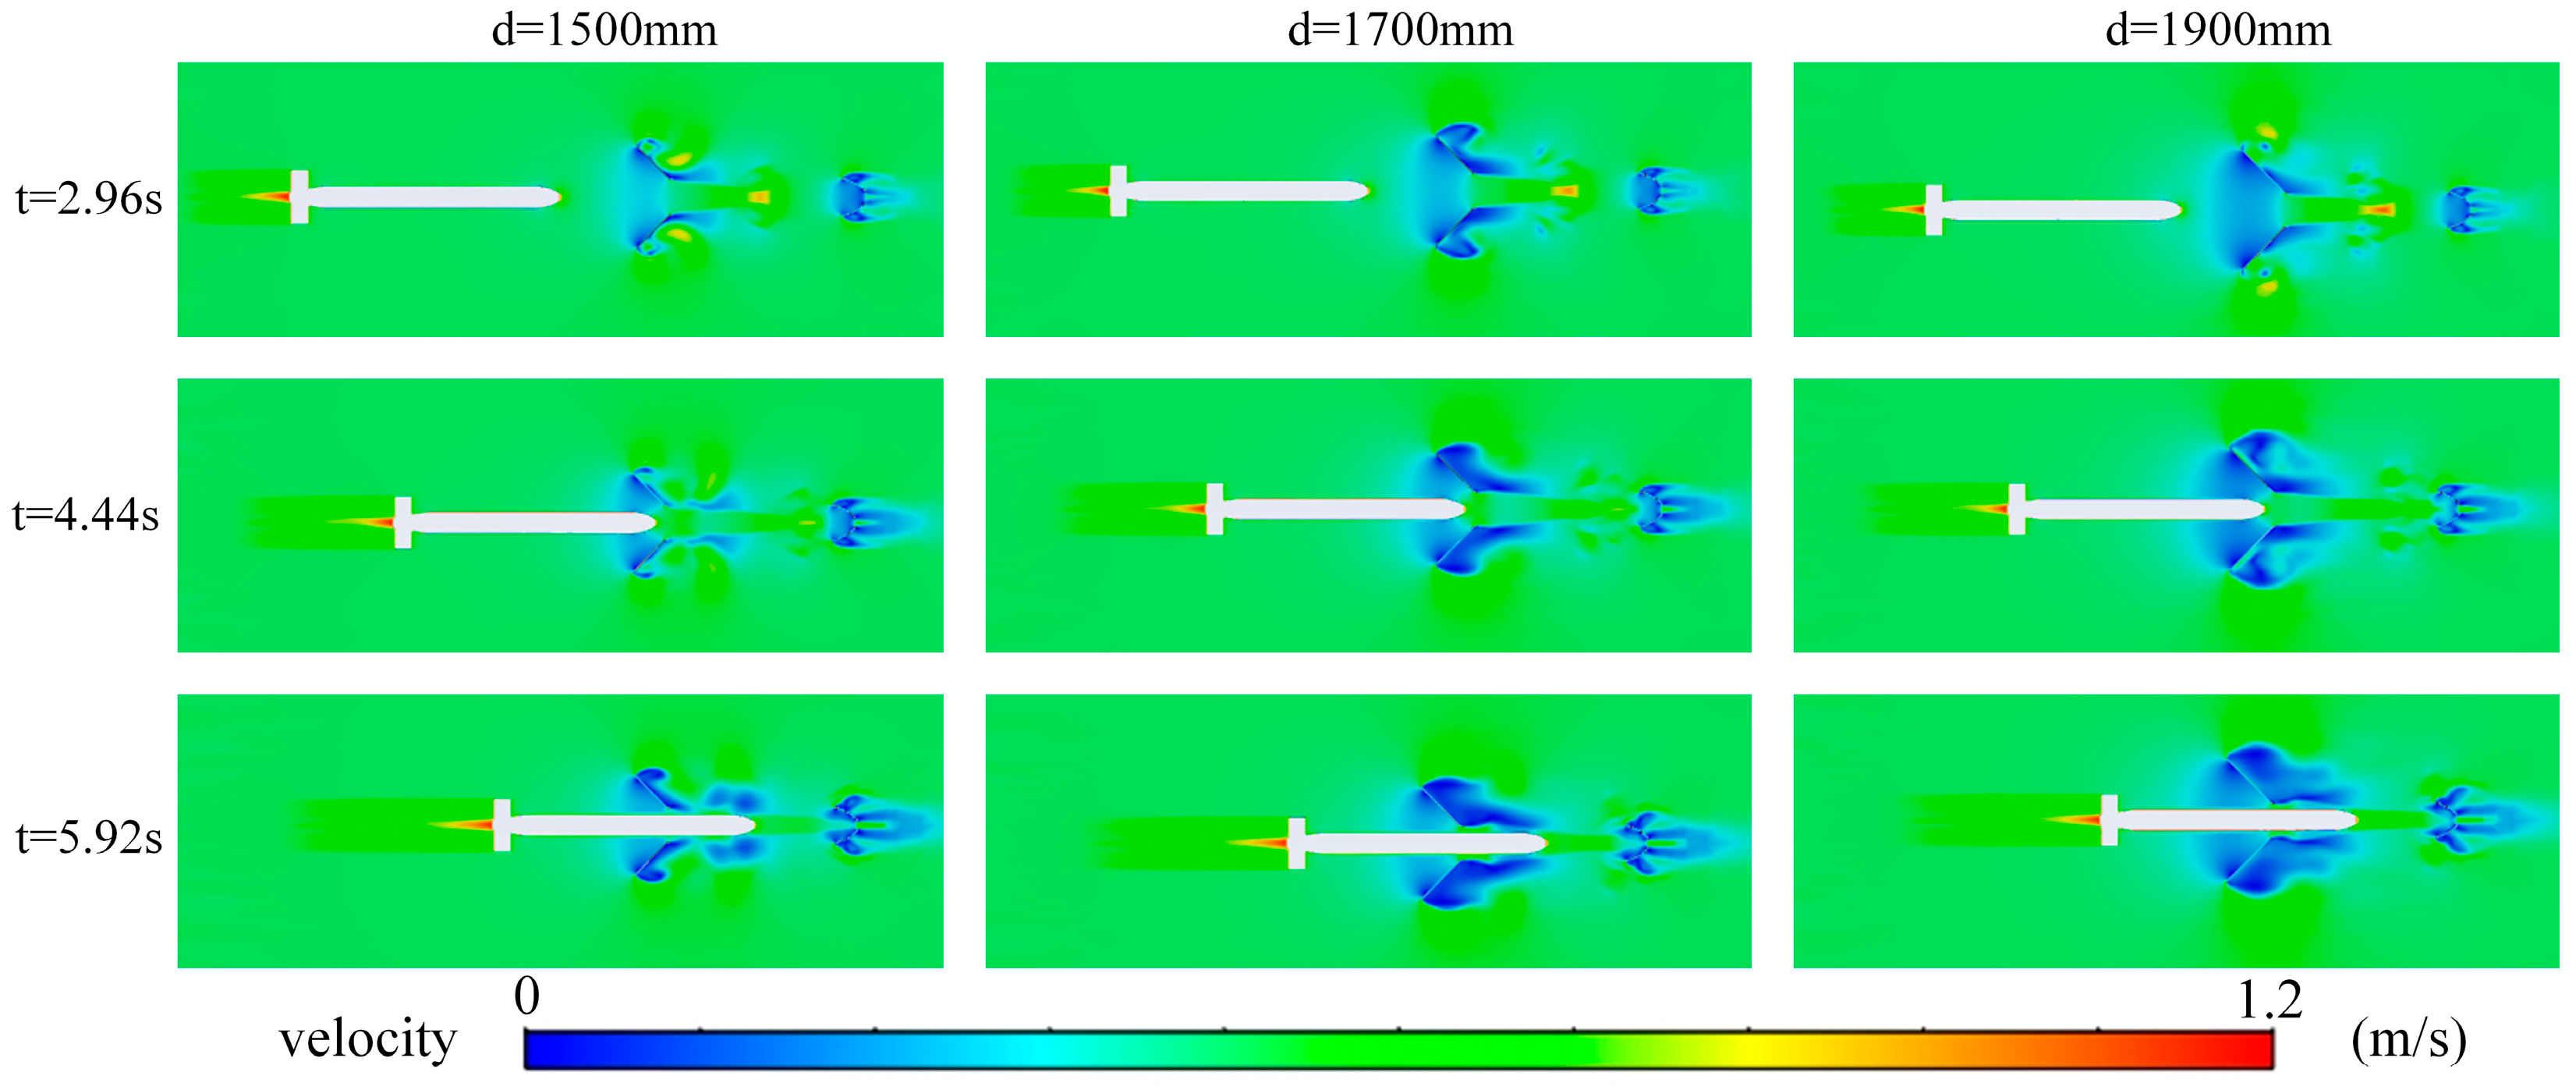
The hydrodynamic characteristics of the AUV docking process are not only affected by the inlet taper of the recovery device, but also by the inlet diameter. The aim of this section is to analyze the effect of inlet diameter on the hydrodynamics, and for this purpose three sets of inlet nozzles with different diameters (left: 1500 mm; middle: 1700 mm; right: 1900 mm), all with an inlet taper of 45°, were set up in order to facilitate comparisons between the different inlet diameters.
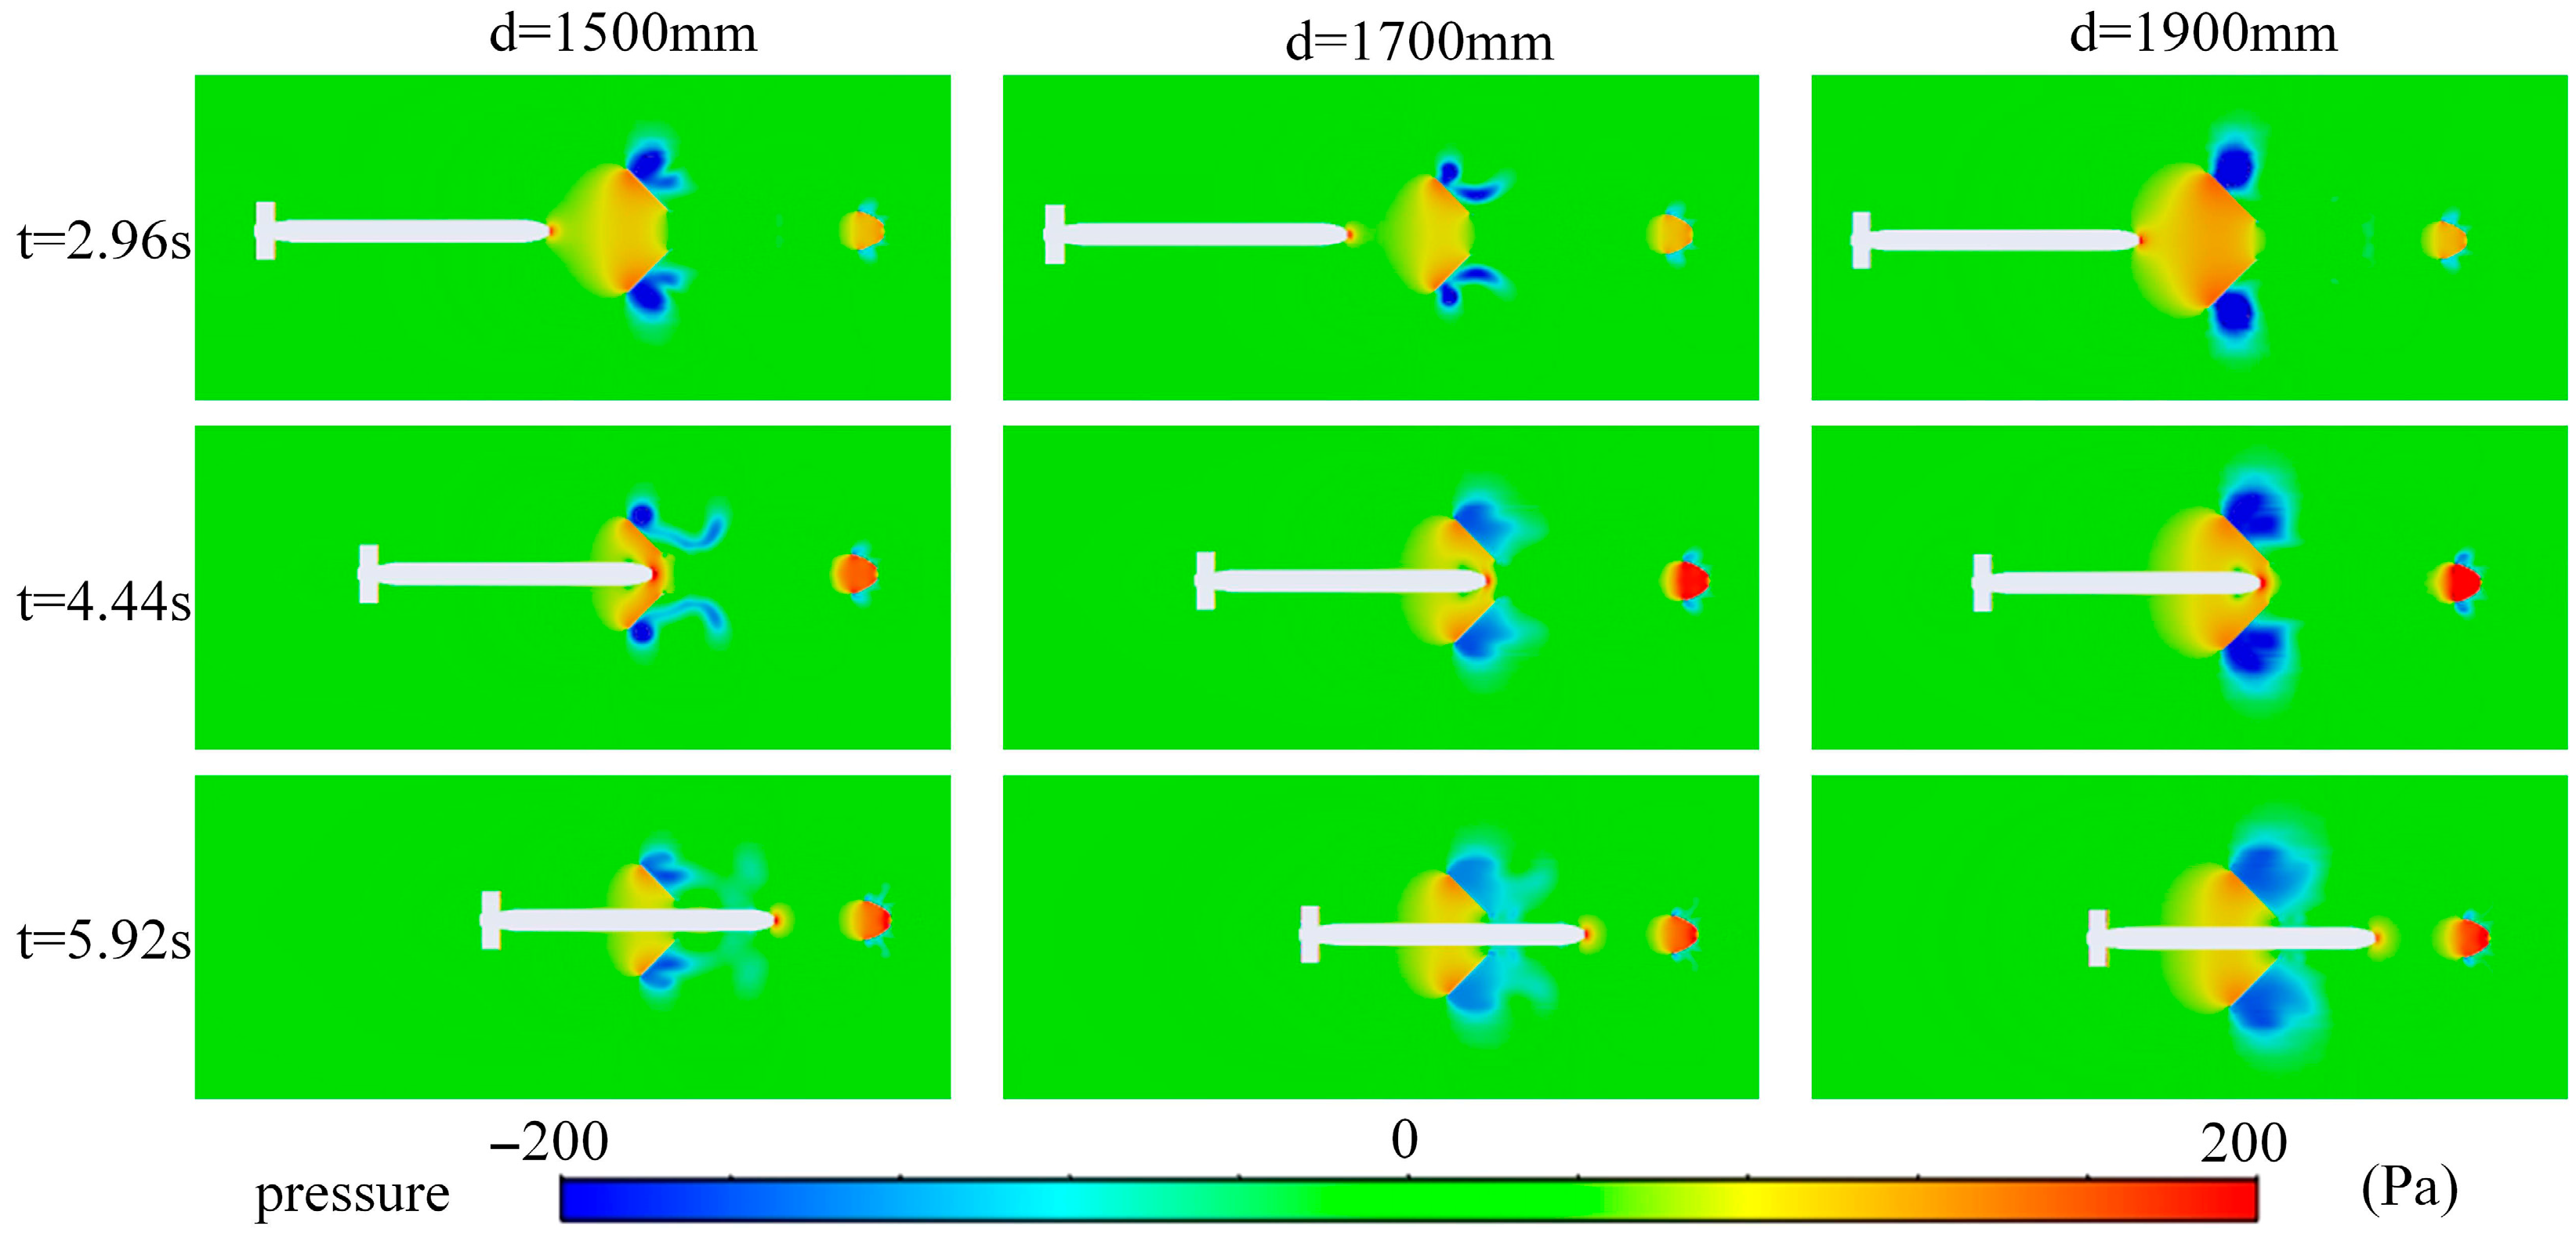
Figure 11 illustrates the pressure contour distributions at the three locations. When the AUV is close to the nozzle, the head and tail of the docking bay show high-pressure areas (t = 2.96 s). As the head of the AUV enters the dock, the pressure distributed around the nozzle increases. The narrower the cross-section, the higher the pressure (t = 4.44 s), which means that it is difficult for the AUV to pass through the nozzle. However, when the AUV head passes through the nozzle and enters the inner tube, the pressure distribution at the nozzle is reversed: the narrower the cross-section, the lower the pressure, creating a pressure gradient that pushes the AUV forward. At the stage when the AUV approaches the aft part of the docking bay (t = 5.92 s), the pressure in the aft part increases due to the fluid squeezing between the head and the aft part of the AUV. In addition, increasing the diameter of the docking bay inlet increases the drag on the AUV.
Figure 12 illustrates the velocity contour distributions at three locations. As the AUV approaches the docking bay, the flow velocity decreases in the vicinity of the guiding hood. During docking, a low-flow-velocity region is formed at both the head and tail of the docking bay, which is caused by the geometrical configuration of the guiding hood that interferes with the flow field by directing the fluid to create boundary layer separation and vortex dissipation phenomena, which in turn creates a buffer flow field with a significant flow velocity gradient in the openings and the tail region. The difference in velocities around the head of the AUV leads to an increase in drag. In addition, there is fluid leakage from the nozzle gap. It is worth noting that the larger the inlet diameter, the stronger the interference effect of the guiding hood on the flow field, the wider the range of low-flow-velocity zones produced, and the smoother the flow gradient, which is more conducive to the smooth entry of the AUV into the docking device.
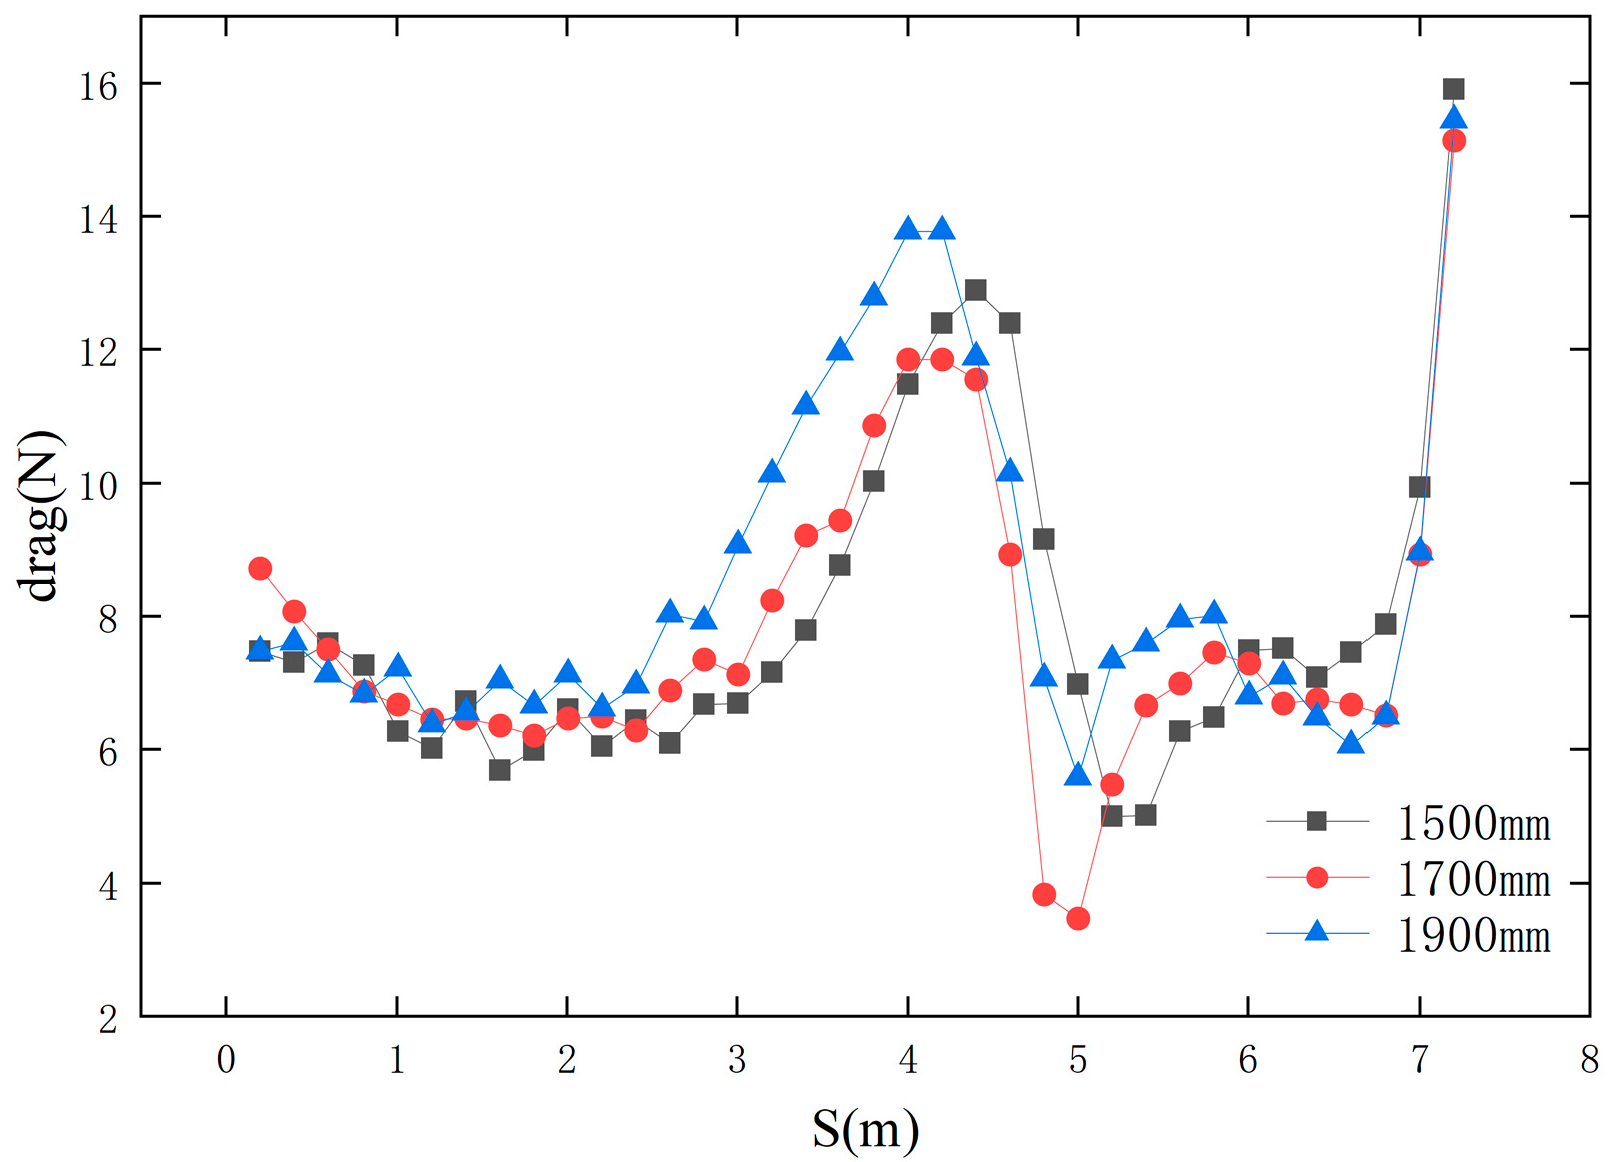
During the total time (7.4 s) that the AUV completed docking at a constant velocity (1 m/s), the variation in its drag with distance traveled is shown in Figure 13. The drag initially increases smoothly with distance until it reaches the nozzle inlet plane (point A). The drag then tends to oscillate upward and reaches a peak (maximum drag increment of about 6.8%) before crossing point B (nozzle critical position). Once the AUV enters the inner tube section of the recovery unit, the drag starts to decrease. The above phenomenon reveals the dual role of the nozzle: resistance (impeding motion) when in front of the AUV, and adsorption (pushing forward) when the AUV crosses. As the AUV continues to approach the aft end of the docking bay, the pressure at the aft end increases again. Comparing the different inlet diameters, the docking resistance of the 1900 mm diameter docking bay is the largest, while that of the 1500 mm diameter bay is the smallest, indicating that reducing the docking bay inlet diameter can effectively reduce the docking resistance.

4. Effects from Ocean Currents

4.1. Docking Under Co-Directional Varying-Velocity Currents

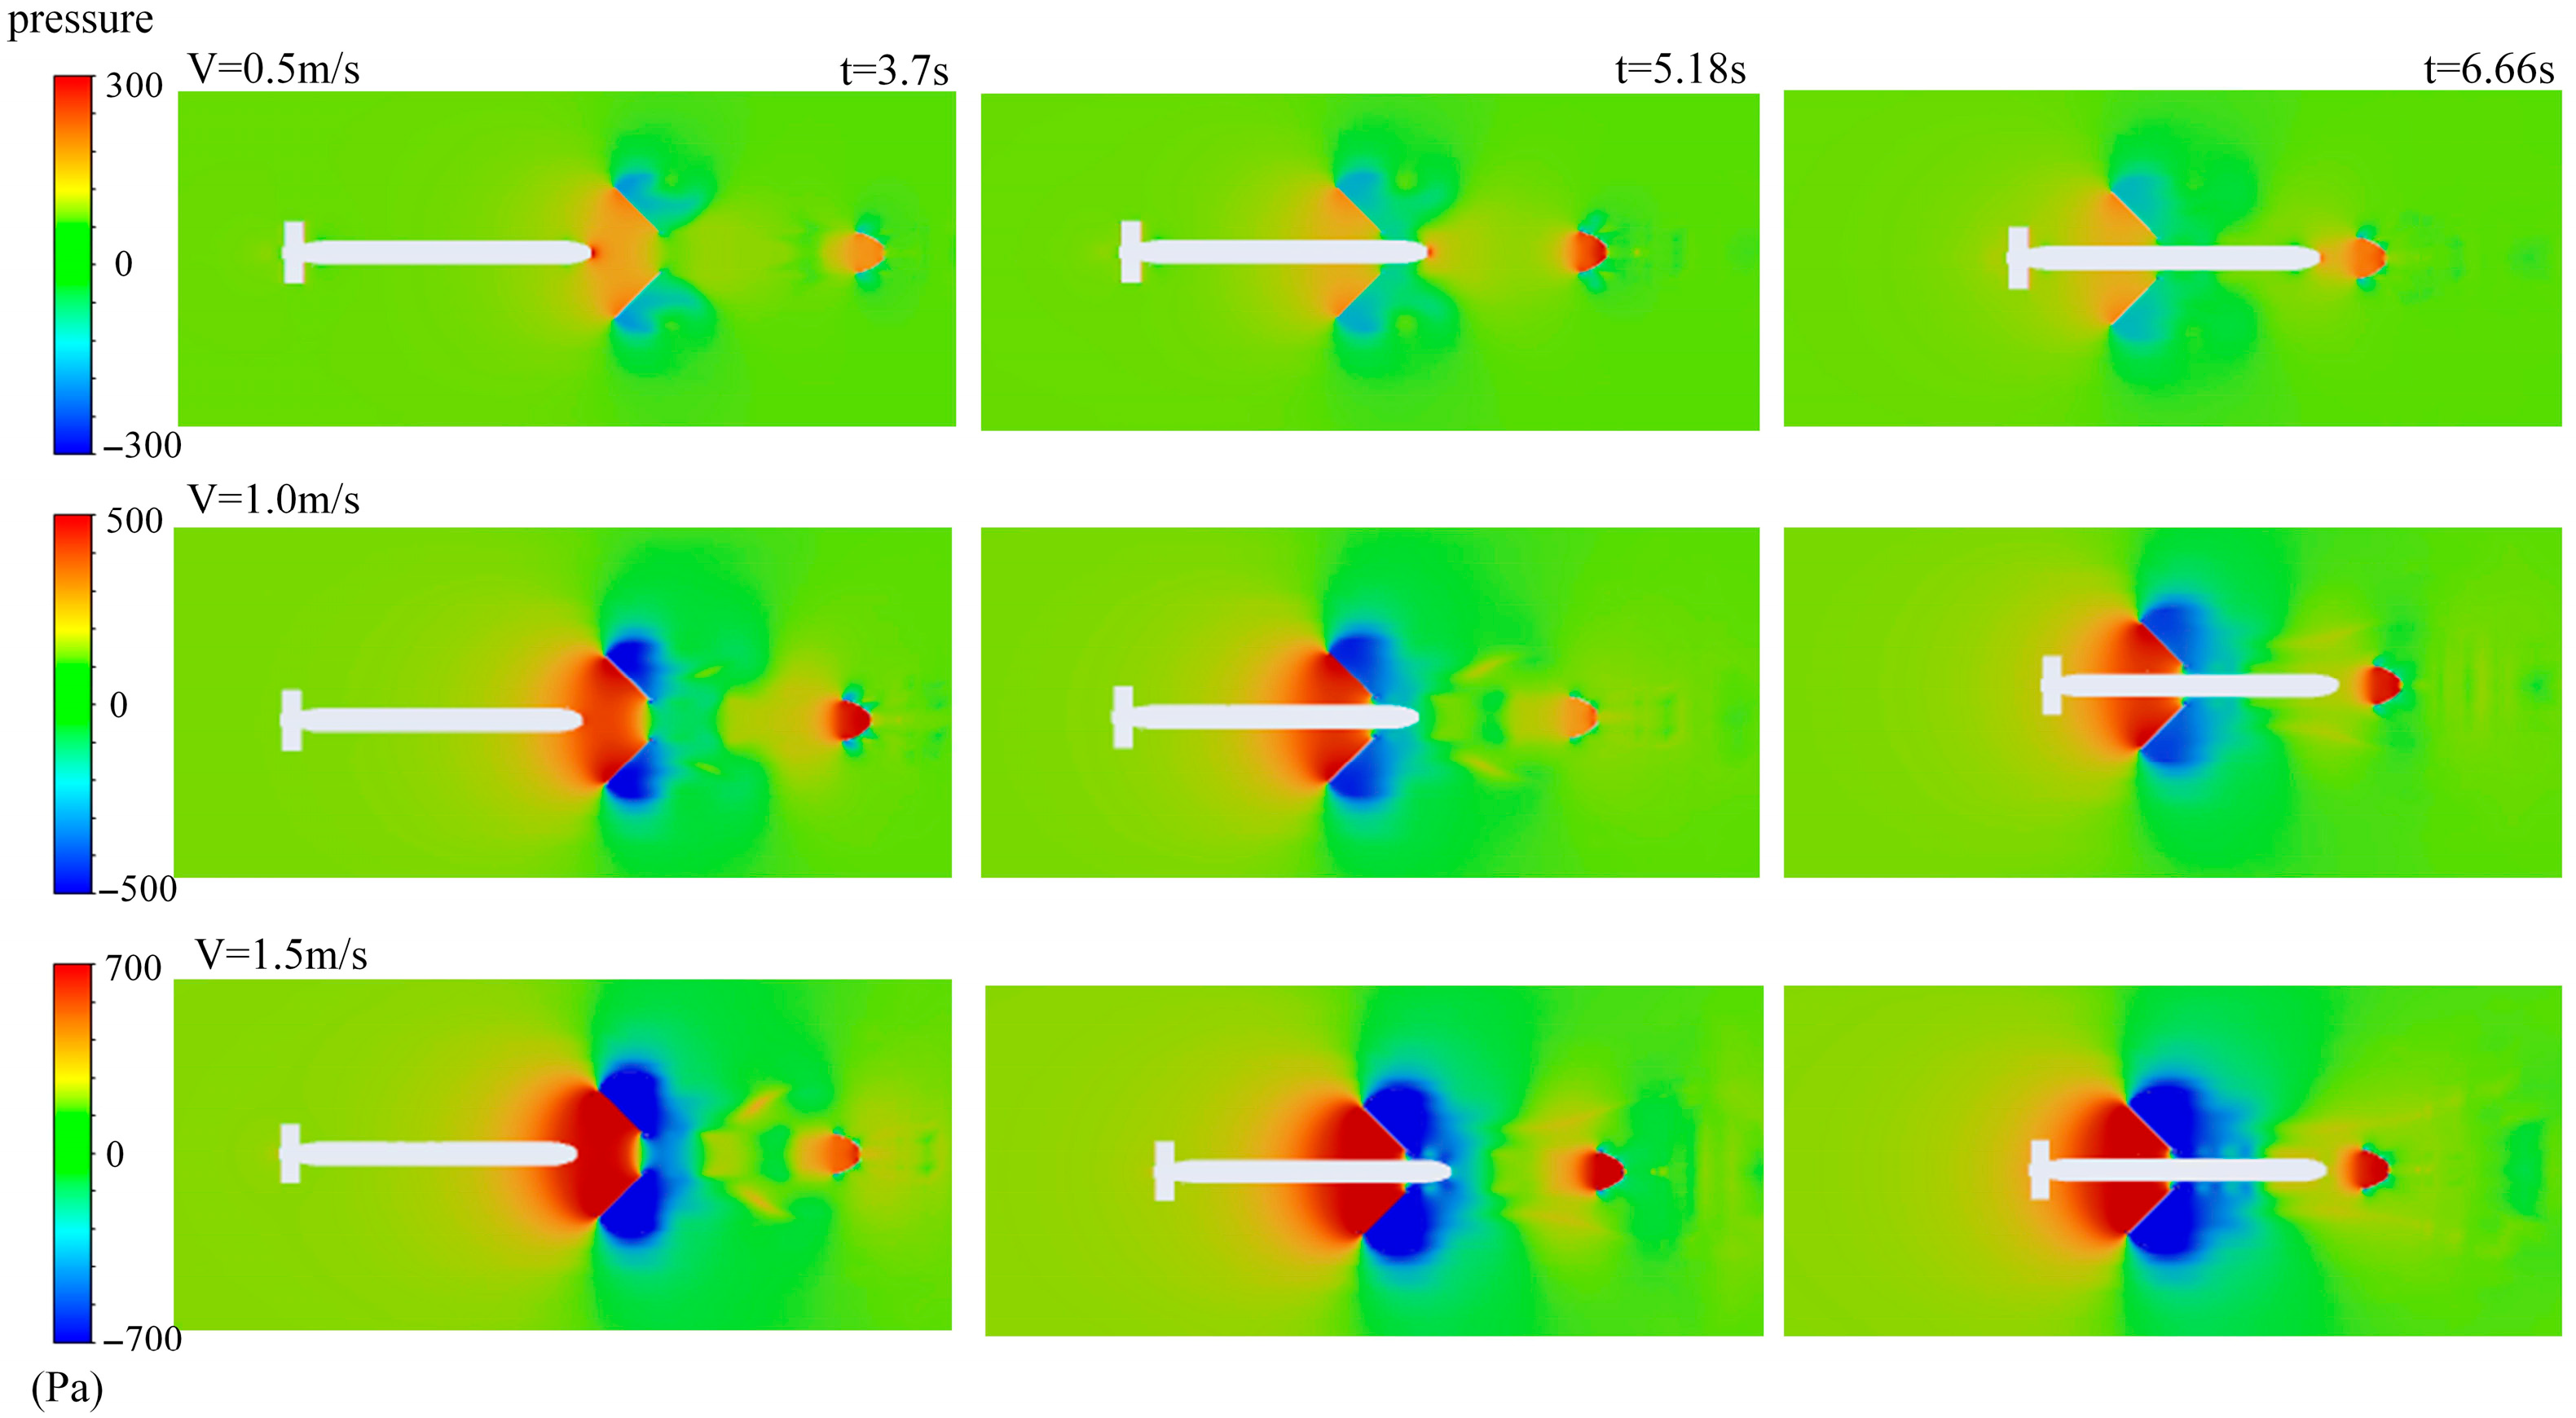
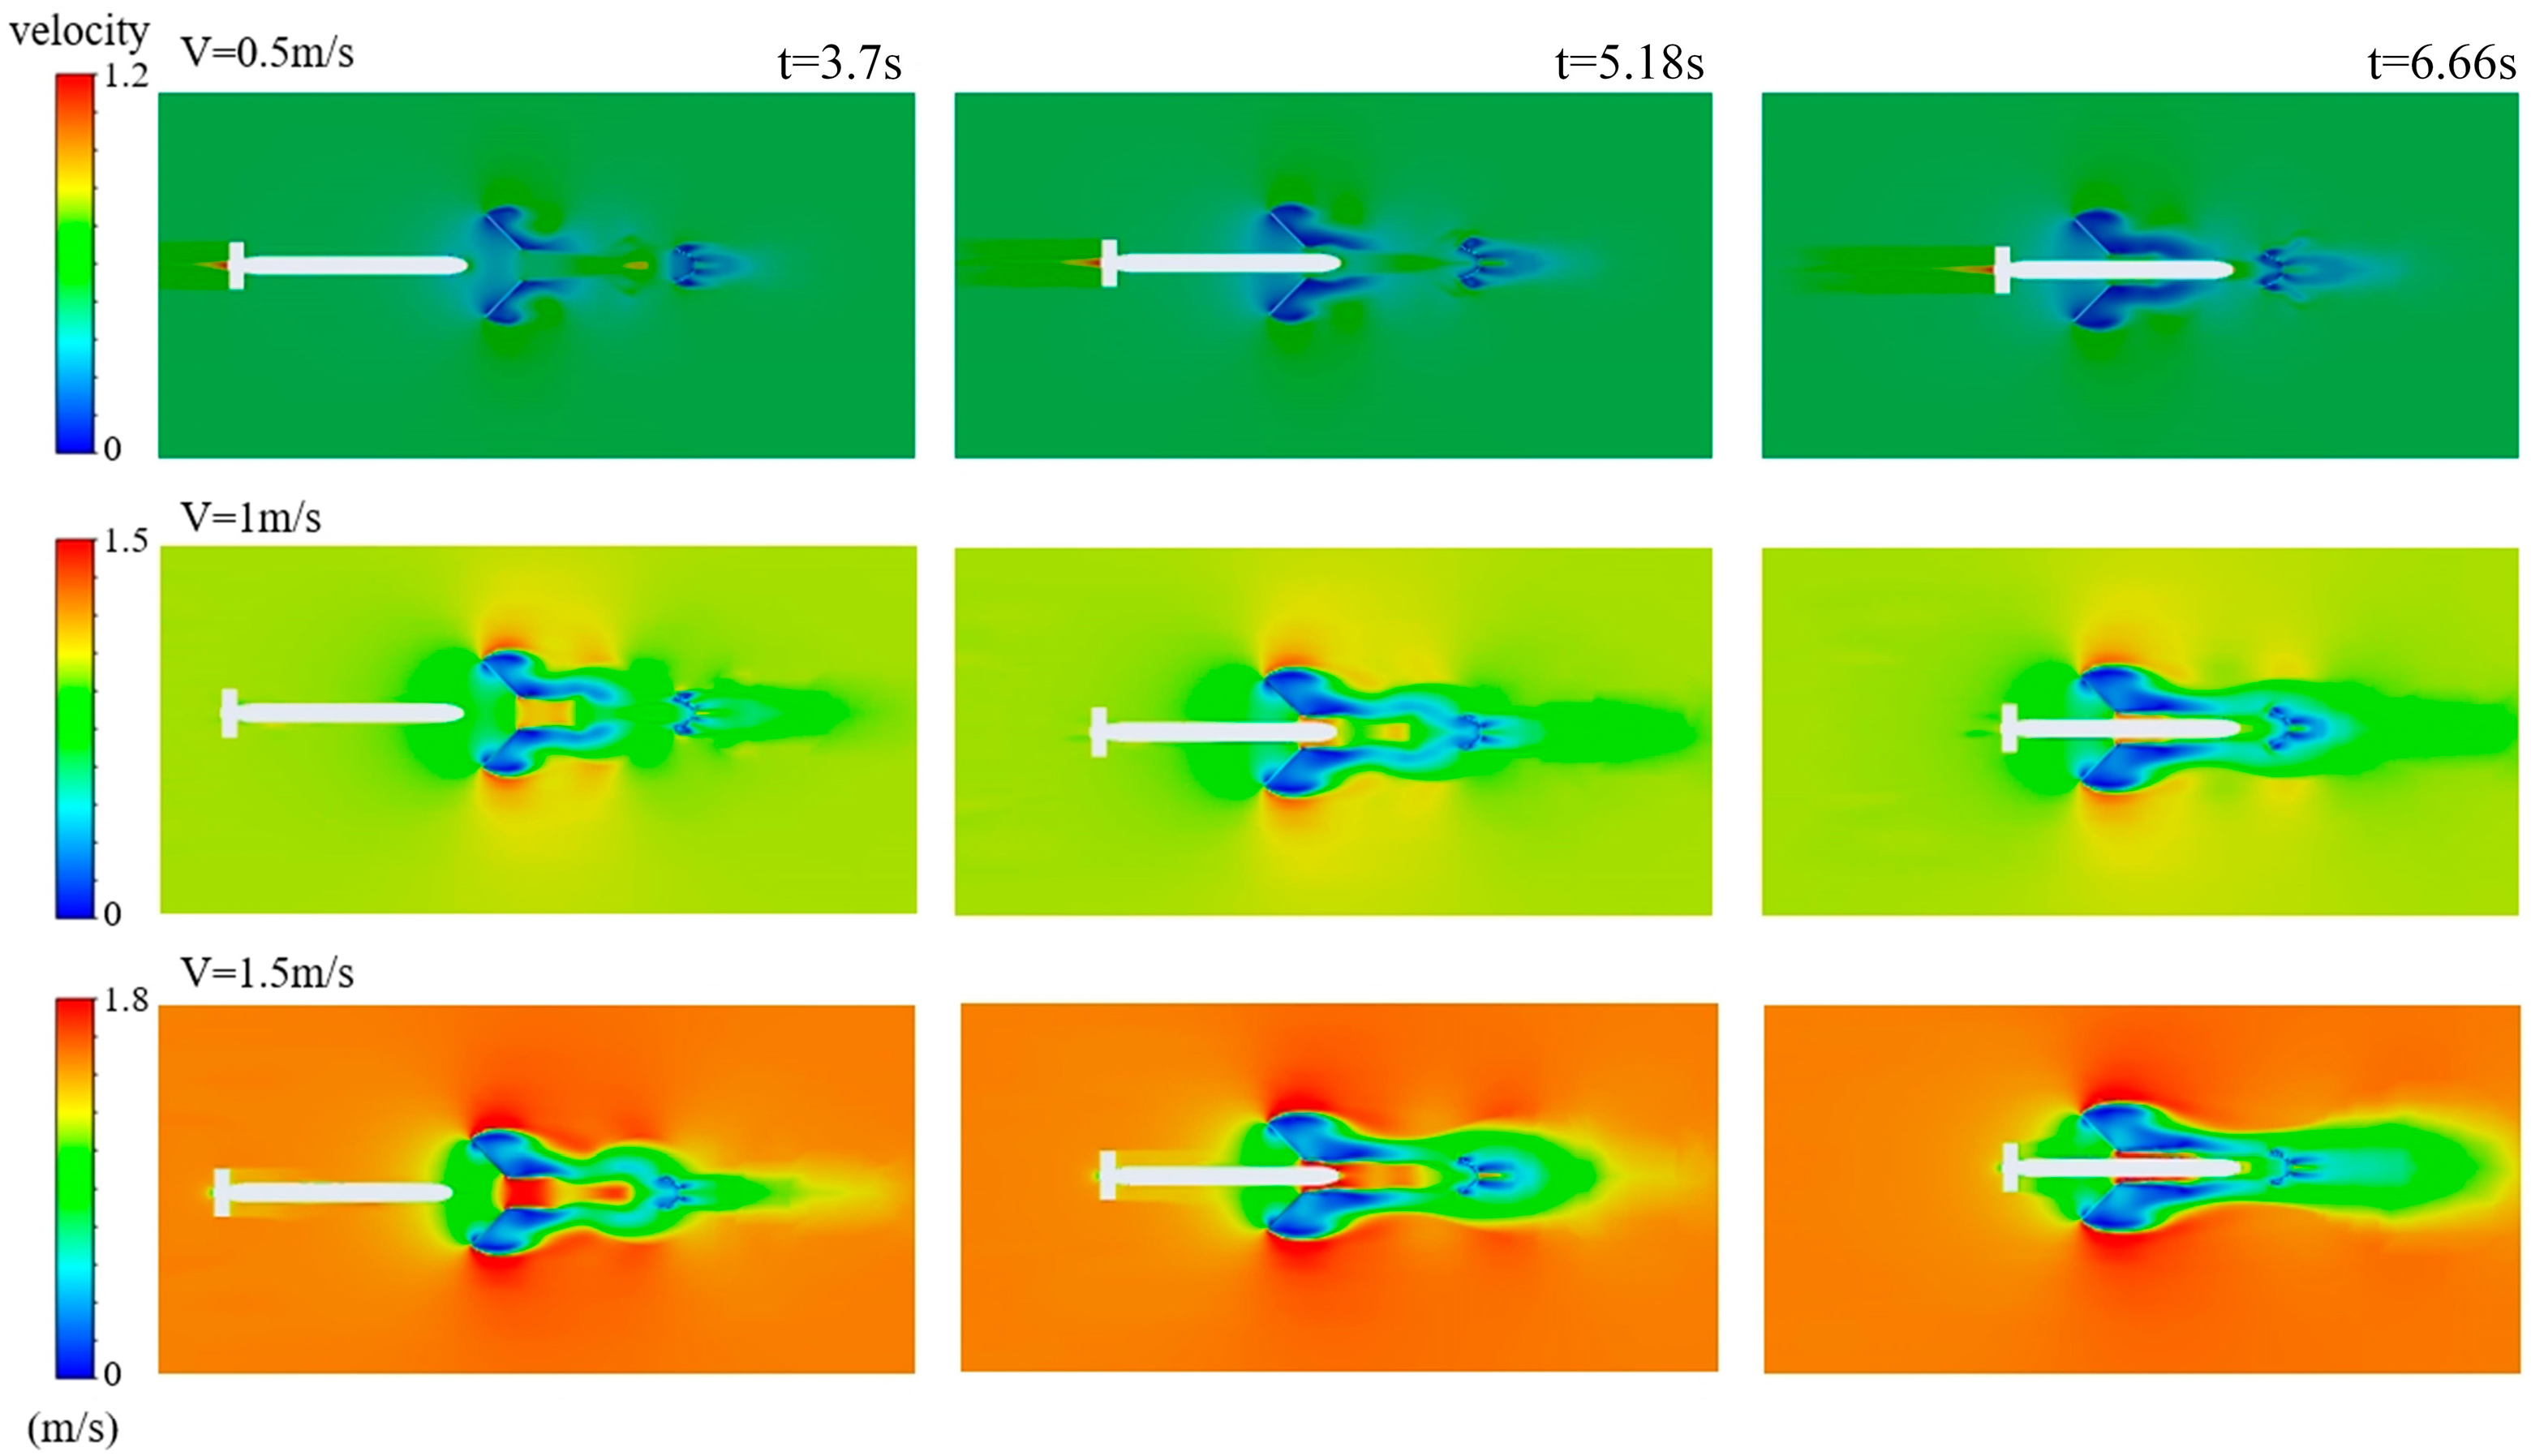
On the basis of clarifying the influence of geometric configuration, including inlet taper and diameter, on the hydrodynamic characteristics, this study further reveals the key flow field evolution mechanism under the coupling of the dynamic current environment and AUV speed, which fills in the gap of the study of isotropic variable flow current conditions. For this mechanism, Figure 14 and Figure 15 show the pressure and velocity distributions of the flow field around the AUV and the docking device when the AUV encounters the isotropic currents with flow velocities of 0.5 m/s, 1.0 m/s, 1.5 m/s, and 1.5 m/s under the conditions of speed V = 1 m/s and angle of attack α = 0°, respectively. In order to emphasize the comparison effect, the left, middle, and right panels within each group correspond to the pressure and velocity distributions when the AUV is at the same position (running time t = 3.7, 5.18, and 6.66 s, respectively).
Figure 14 shows the pressure cloud map of the AUV under different ocean current speeds, revealing that the pressure distribution around the AUV changes significantly as the flow velocity increases. At 0.5 m/s, the pressure distribution is relatively uniform, with small positive pressure at the front and negative pressure at the rear, indicating stable flow and suitability for precise docking. As the current speed increases to 1.0 m/s, the positive pressure zone at the front expands, and the negative pressure at the rear intensifies, indicating an increase in the inertial effects of the fluid and a rise in flow instability. At 1.5 m/s, both the positive- and negative-pressure regions significantly expand, with pronounced tail vortices, increased flow separation, and heightened pressure fluctuations, which may impact the AUV’s attitude control and docking accuracy.
From the velocity cloud diagram in Figure 15, it can be observed that when the ocean current velocity is 0.5 m/s, the flow field distribution is relatively symmetrical, and the deflector structure and the rear region of the AUV form a distinct low-velocity zone. The wake zone flows smoothly, and the wake vortex is weak, which is conducive to attitude stability control during the docking process. As the ocean current velocity increases to 1.0 m/s, the overall fluid velocity increases, and a noticeable velocity gradient appears on both sides of the flow-guiding structure. The wake vortex at the AUV’s tail expands and exhibits an asymmetric distribution, which may cause attitude disturbances and docking errors; the hydrodynamic load on the flow-guiding structure also increases accordingly. When the ocean current velocity reaches 1.5 m/s, high flow velocities appear in local areas, the wake zone significantly widens, vortex intensity increases, flow separation intensifies, and turbulent kinetic energy rises, causing the flow field behind the flow guide structure to become more turbulent, posing a threat to docking accuracy. Low-speed conditions result in stable flow with minimal interference, making them more suitable for AUVs to achieve high-precision docking. However, high-speed conditions require structural optimization and control strategies to mitigate the adverse effects of flow instability.
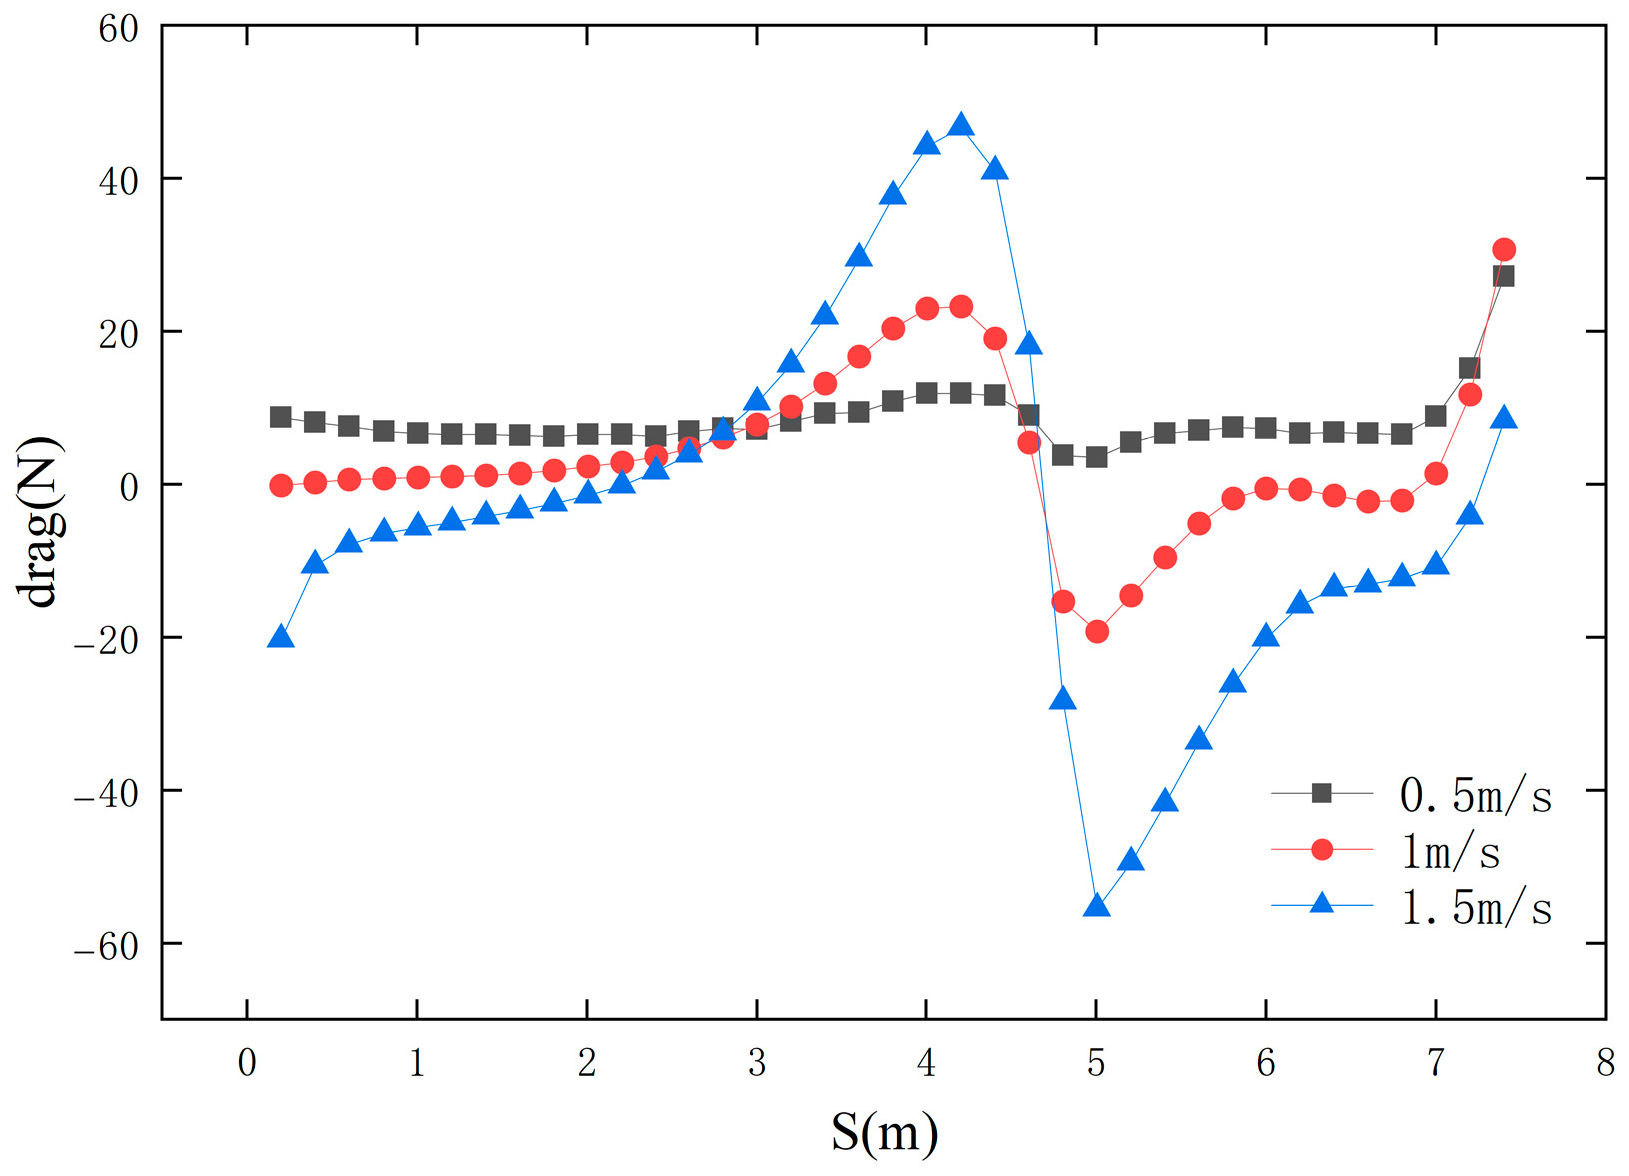
Figure 16 shows the change in drag force of the AUV under different ocean current speeds at the same propulsion speed (1 m/s). The results indicate that when the ocean current velocity is less than or equal to the AUV velocity, the overall resistance experienced by the AUV is positive, with a direction opposite to the direction of travel, acting as an obstacle; when the ocean current velocity exceeds the AUV velocity (1.5 m/s), the resistance is negative, with a direction consistent with the AUV’s heading, acting as a propulsive force. Especially at point A, the resistance at a current speed of 1.5 m/s is 2.94 times that at 0.5 m/s, and at 1.0 m/s, it is 2.32 times that at 0.5 m/s. As the docking process progresses, the resistance remains negative under high-current conditions after point B, and the thrust increases, which can accelerate the docking speed but may also pose a significant collision risk. As shown by the curve changes, under a current of 0.5 m/s, the resistance changes are relatively stable, with minimal flow disturbance; at 1.0 m/s, the resistance fluctuates slightly; at 1.5 m/s, the fluctuations are severe, with the maximum positive resistance exceeding 40 N, followed by a sudden drop to approximately −60 N, indicating severe flow separation and enhanced disturbance under high ocean currents. Therefore, The stronger the ocean current, the more dramatic the changes in resistance, and the higher the difficulty of docking control. A low-speed ocean current environment is more conducive to stable and reliable underwater docking.
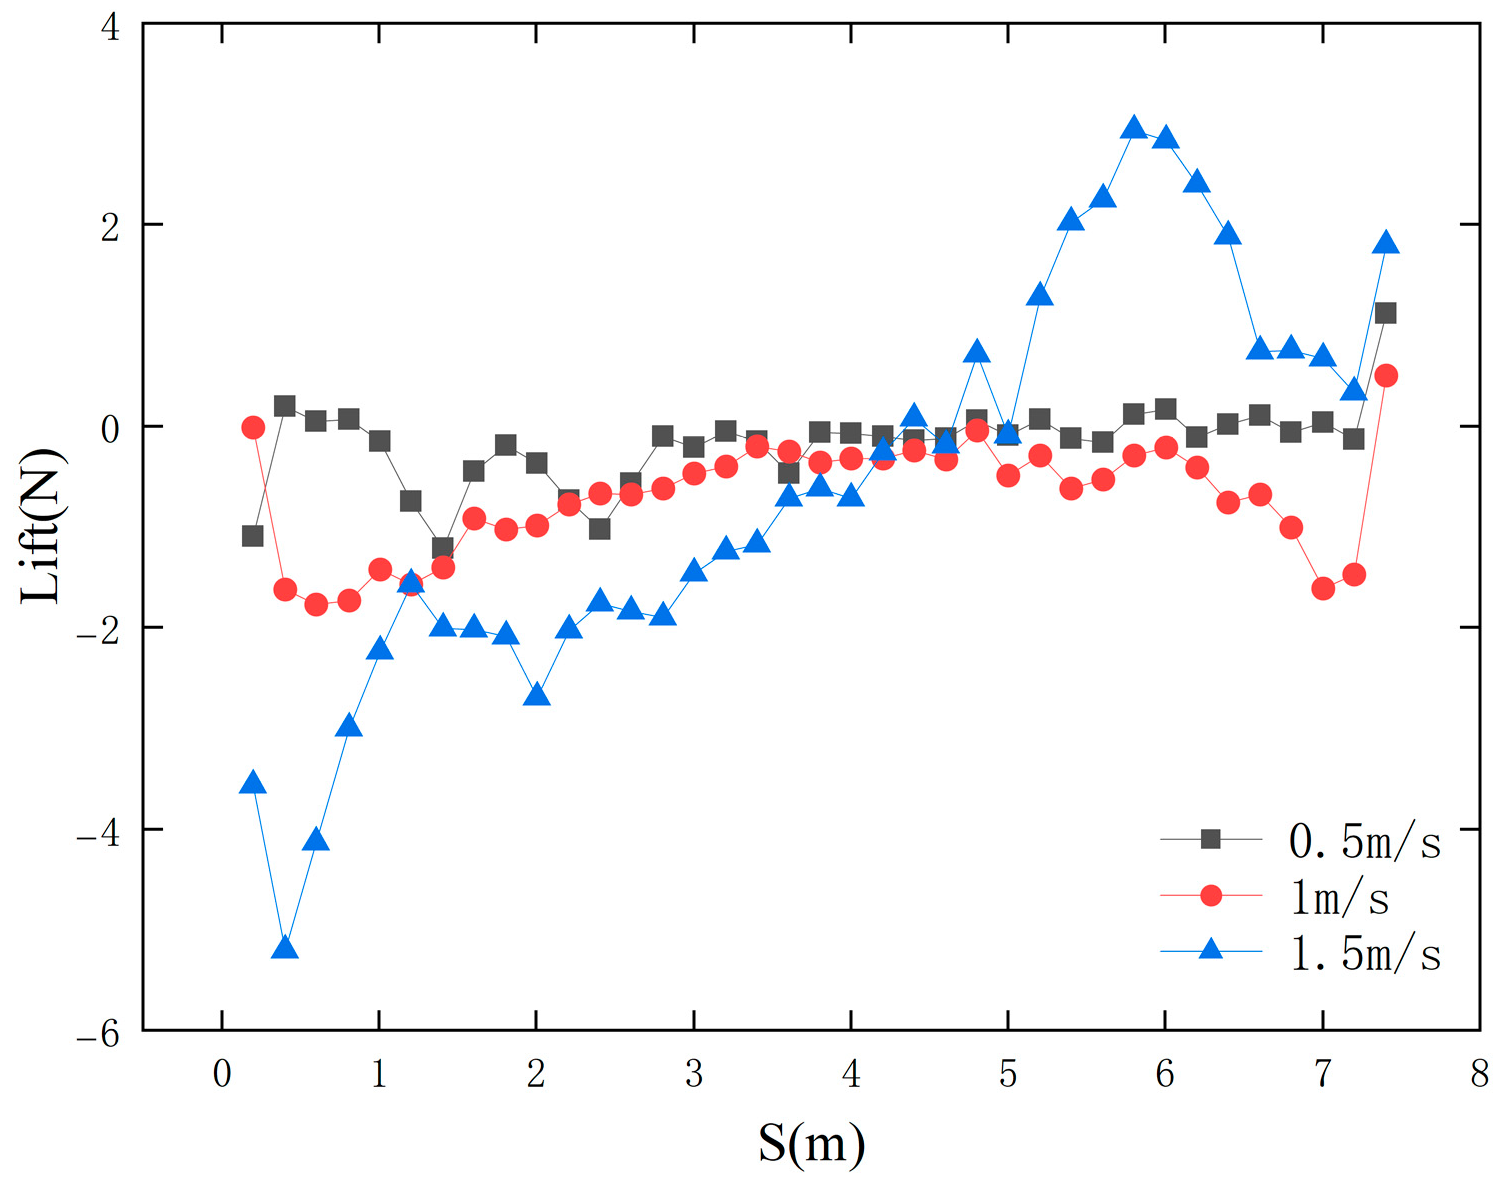
Figure 17 shows the lift changes experienced by the AUV along the docking path under different ocean current velocity conditions. The results indicate that under 0.5 m/s ocean current conditions, lift fluctuations are relatively small, with the curve remaining generally stable and values maintained within ±5 N, indicating a stable flow field with minimal impact on the AUV’s vertical attitude; under 1.0 m/s conditions, lift fluctuations increase, with local lift values approaching 10 N, indicating increased interference from the flow field; under a current speed of 1.5 m/s, lift variations become severe—particularly in the S = 4–6 m range, where significant lift peaks occur, with the maximum exceeding 20 N—followed by a rapid decline to negative values, reflecting the significant enhancement of local flow separation and asymmetric flow field effects, posing challenges to the vertical control of the AUV. Overall, as the ocean current velocity increases, the lift significantly increases, increasing instability This may cause AUV attitude deviation, affecting docking accuracy.

4.2. Docking Under Multi-Directional Constant-Velocity Currents

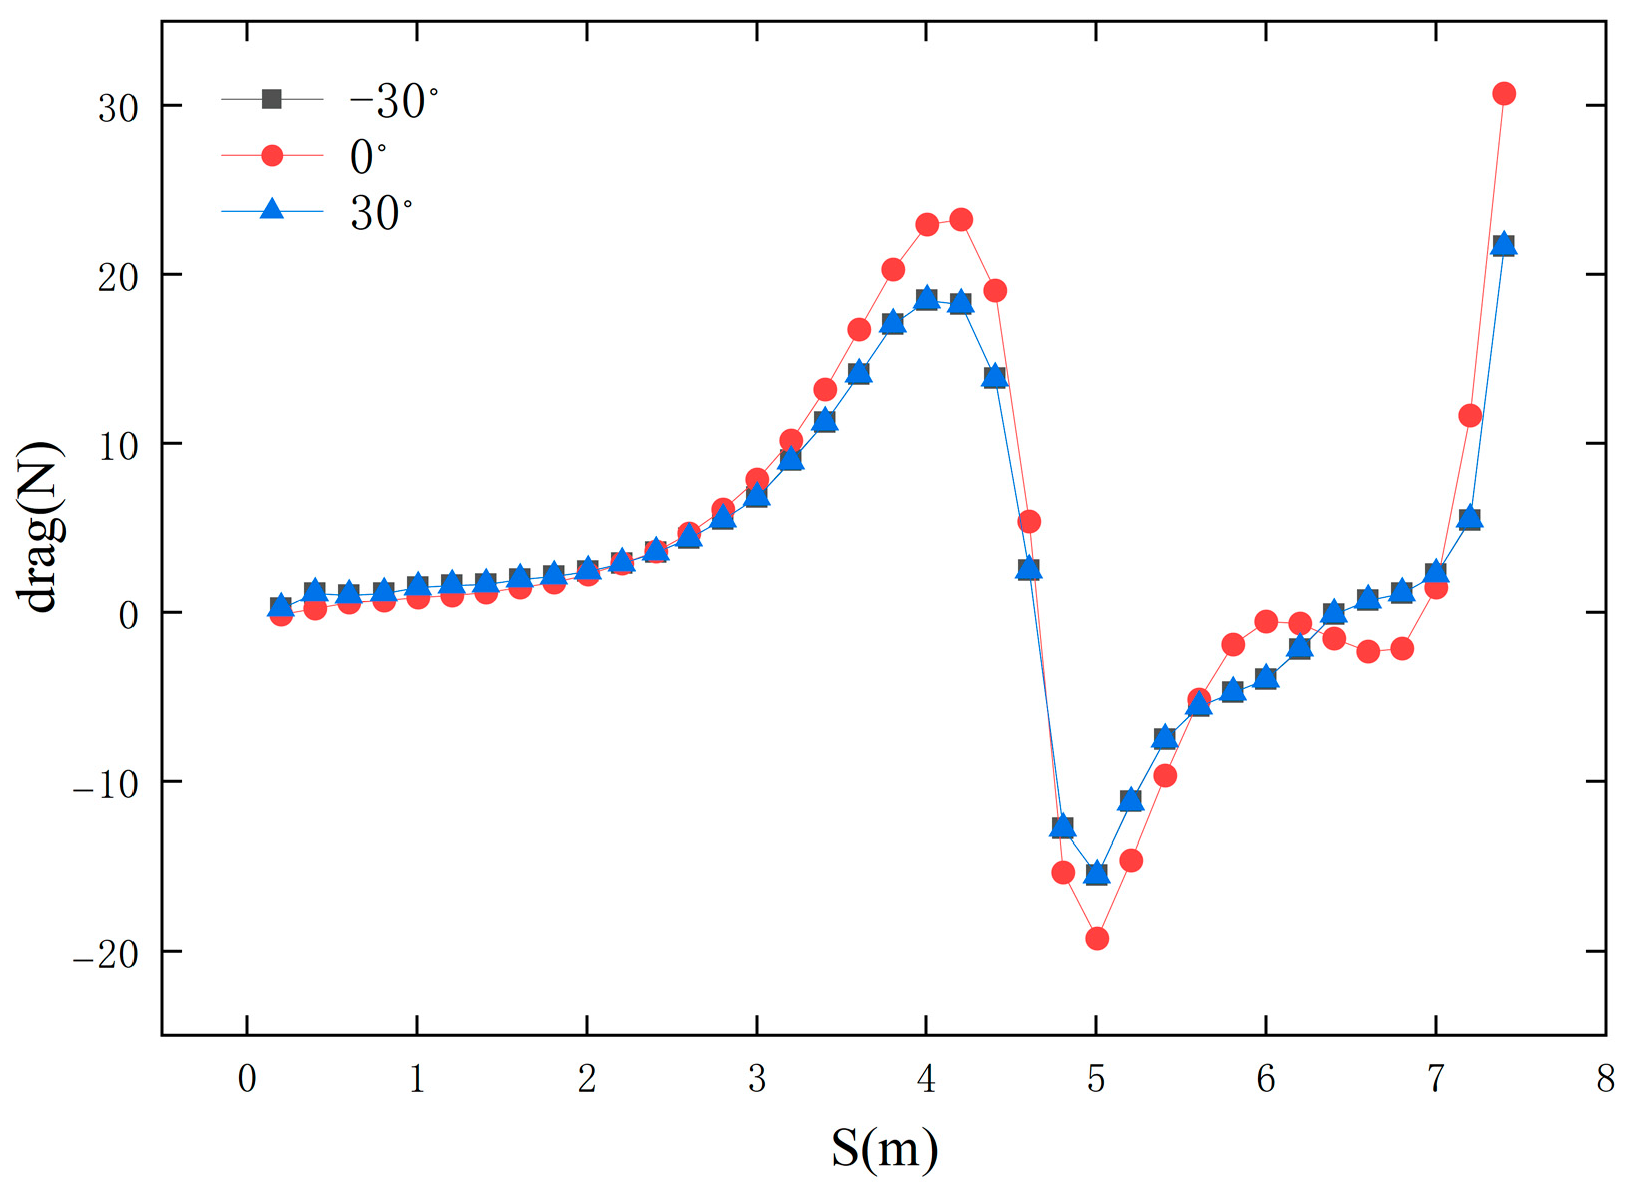
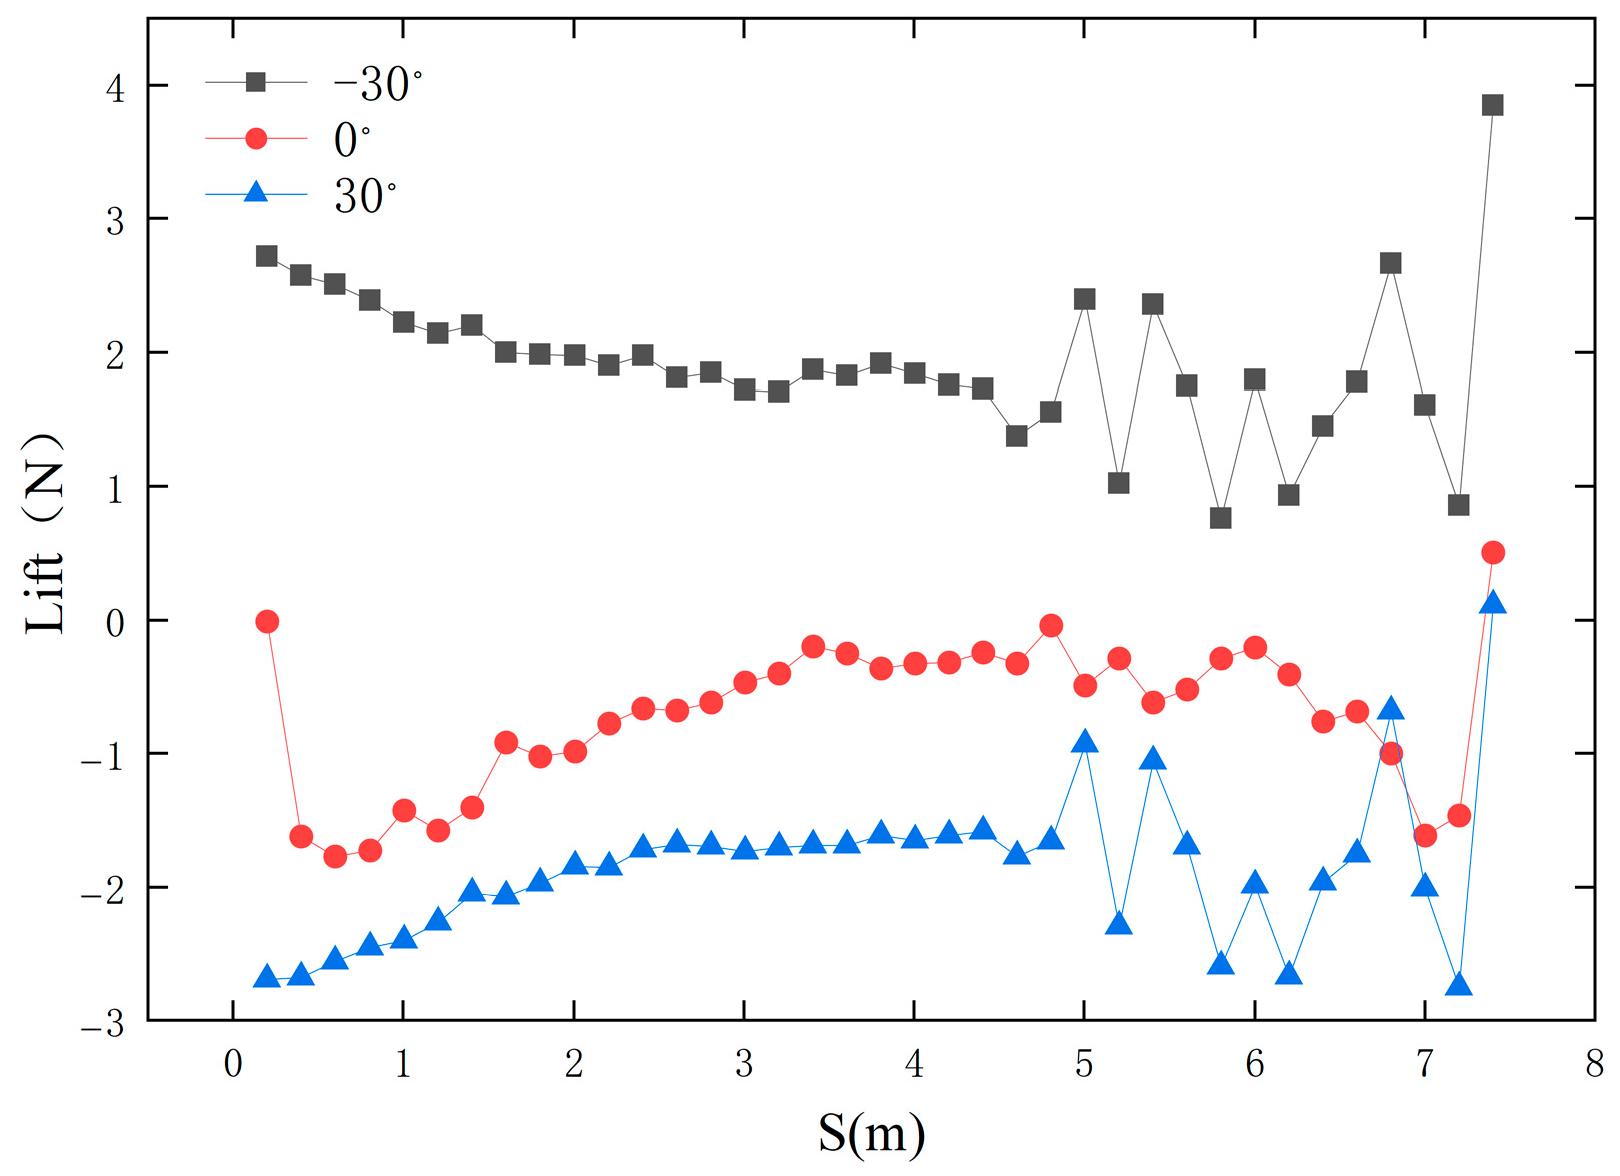
As described in Section 4.1, ocean current velocity significantly affects the docking process of AUVs. Furthermore, ocean currents with different flow directions, even at the same velocity, also have a critical impact on the hydrodynamic characteristics of the docking process. Therefore, this section focuses on investigating the effects of three different flow direction angles (30°, 0°, and −30°) on the hydrodynamics of the AUV recovery process. The experiment was set with an AUV speed of V = 1 m/s and an angle of attack of α = 0°, aiming to compare it with ocean current conditions where the flow velocity is also 1 m/s but the flow direction is different.
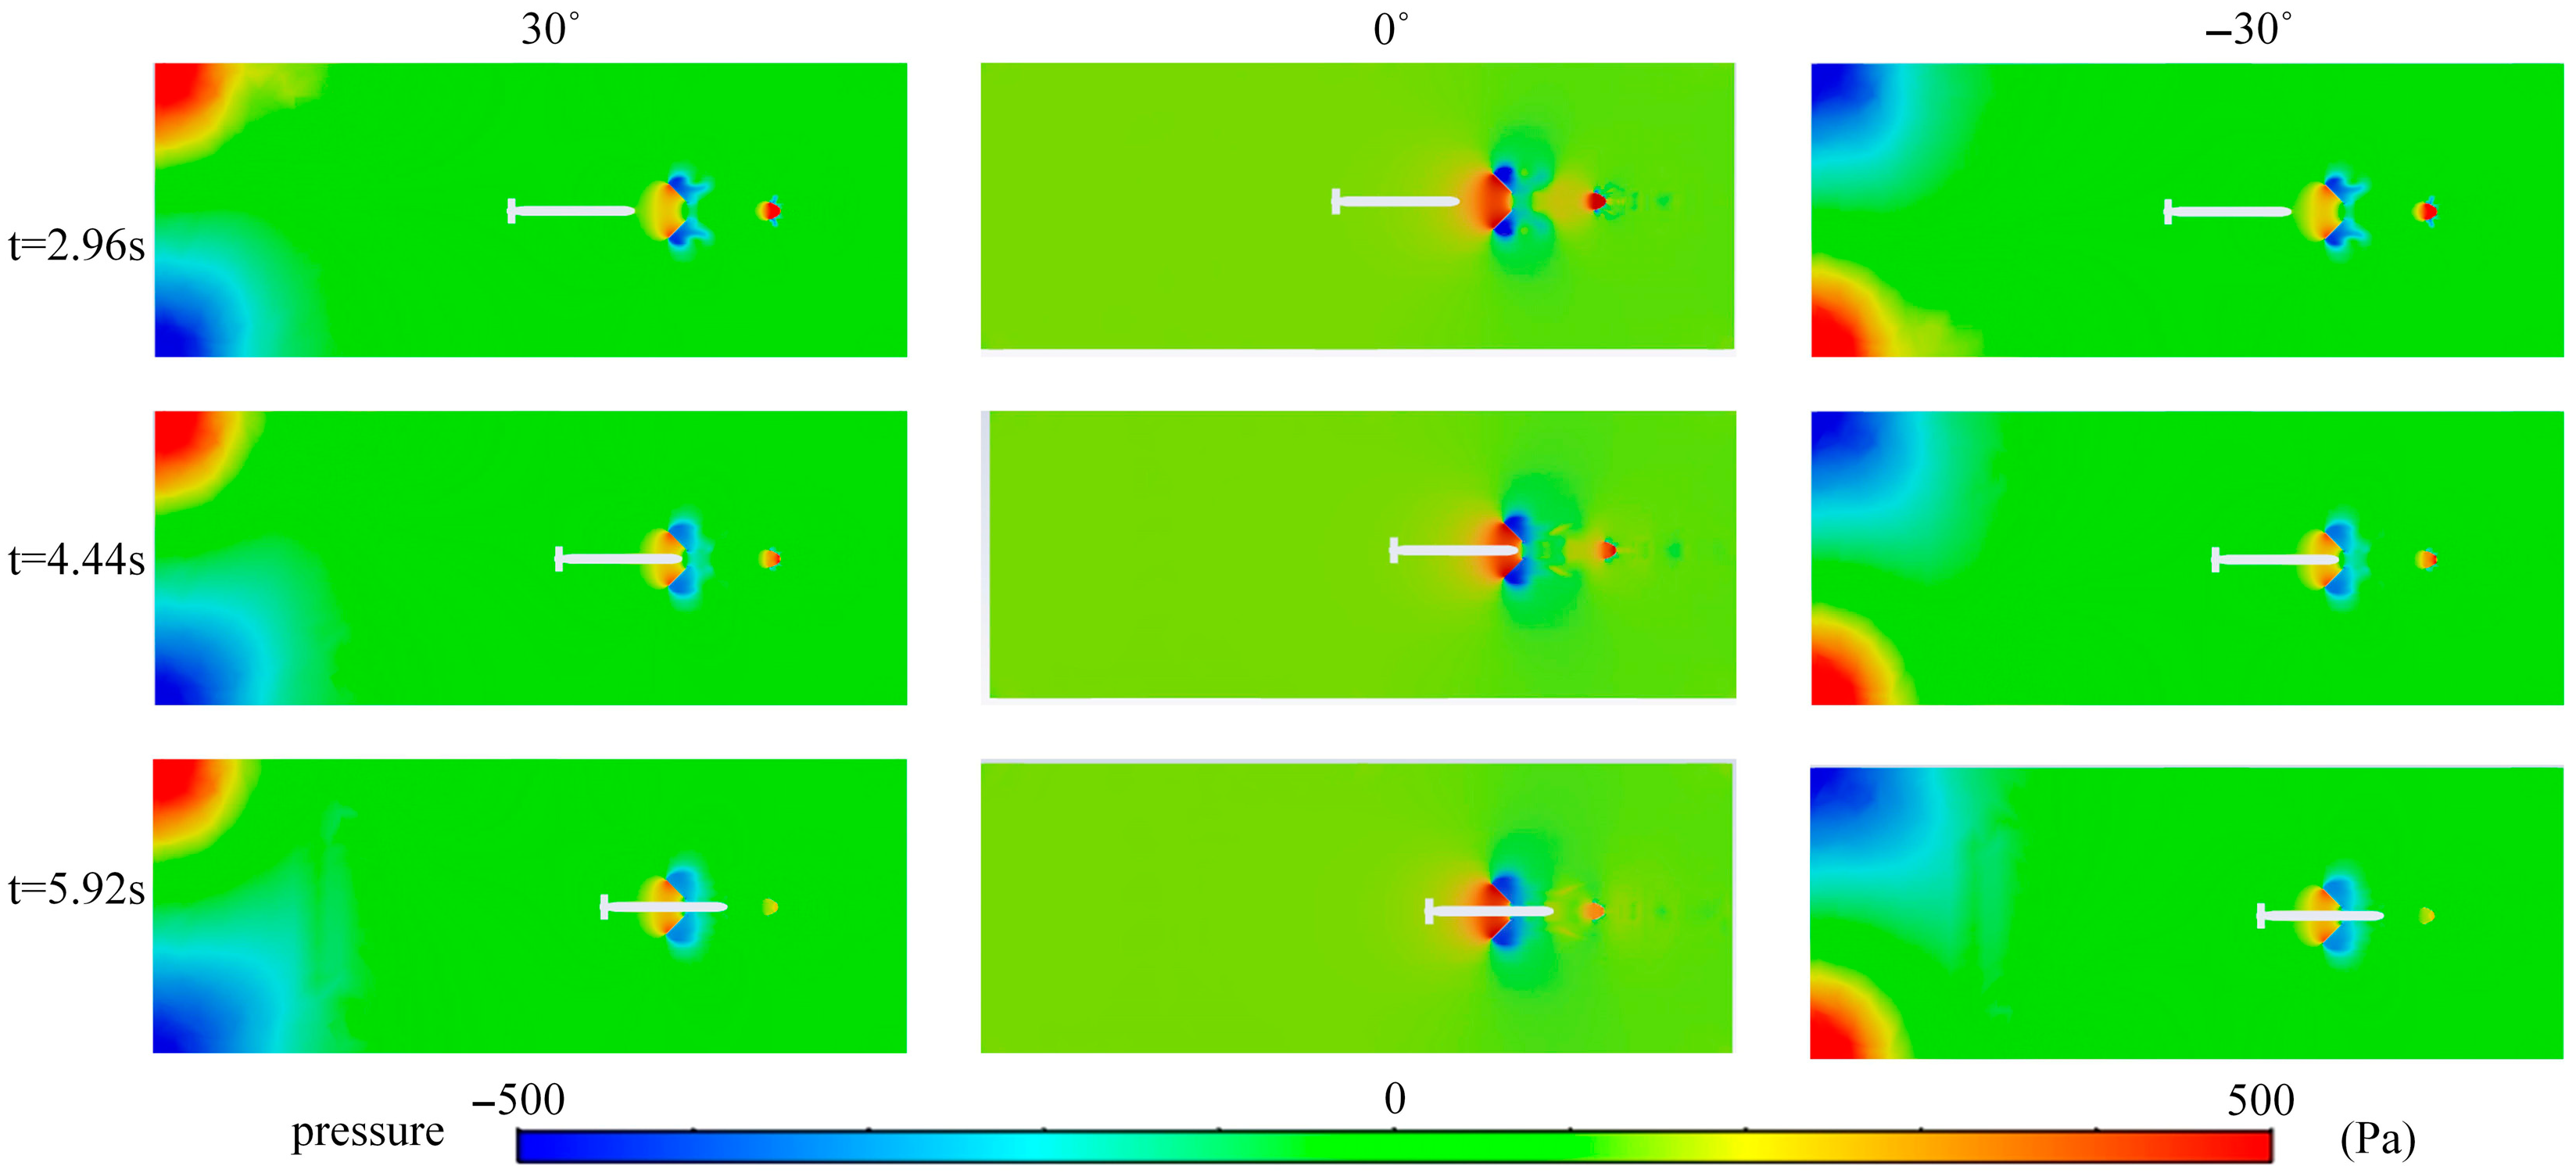
Figure 18 shows the pressure distribution map during the underwater docking process between the AUV and the docking chamber. At t = 4.44 s, the AUV’s bow enters the hollow guide hood area, causing positive pressure to form on the inner side of the guide hood and negative pressure on the outer side. This is because the fluid between the AUV and the guide hood is compressed and flows through the openings in the hood wall to the outside, creating a negative-pressure zone. By comparing pressure distribution maps under different current directions, it is found that the smaller the flow angle, the greater the positive surface pressure on the front end of the tubular structure. Additionally, under 0° flow conditions, the pressure distribution is relatively uniform, and the water flow is smooth. However, under ±30° flow conditions, the pressure distribution is uneven, with low-pressure zones and high-pressure zones appearing at the rear and sides, indicating fluid separation and the formation of vortices. This instability may increase the AUV’s resistance and drag force, affecting docking accuracy.
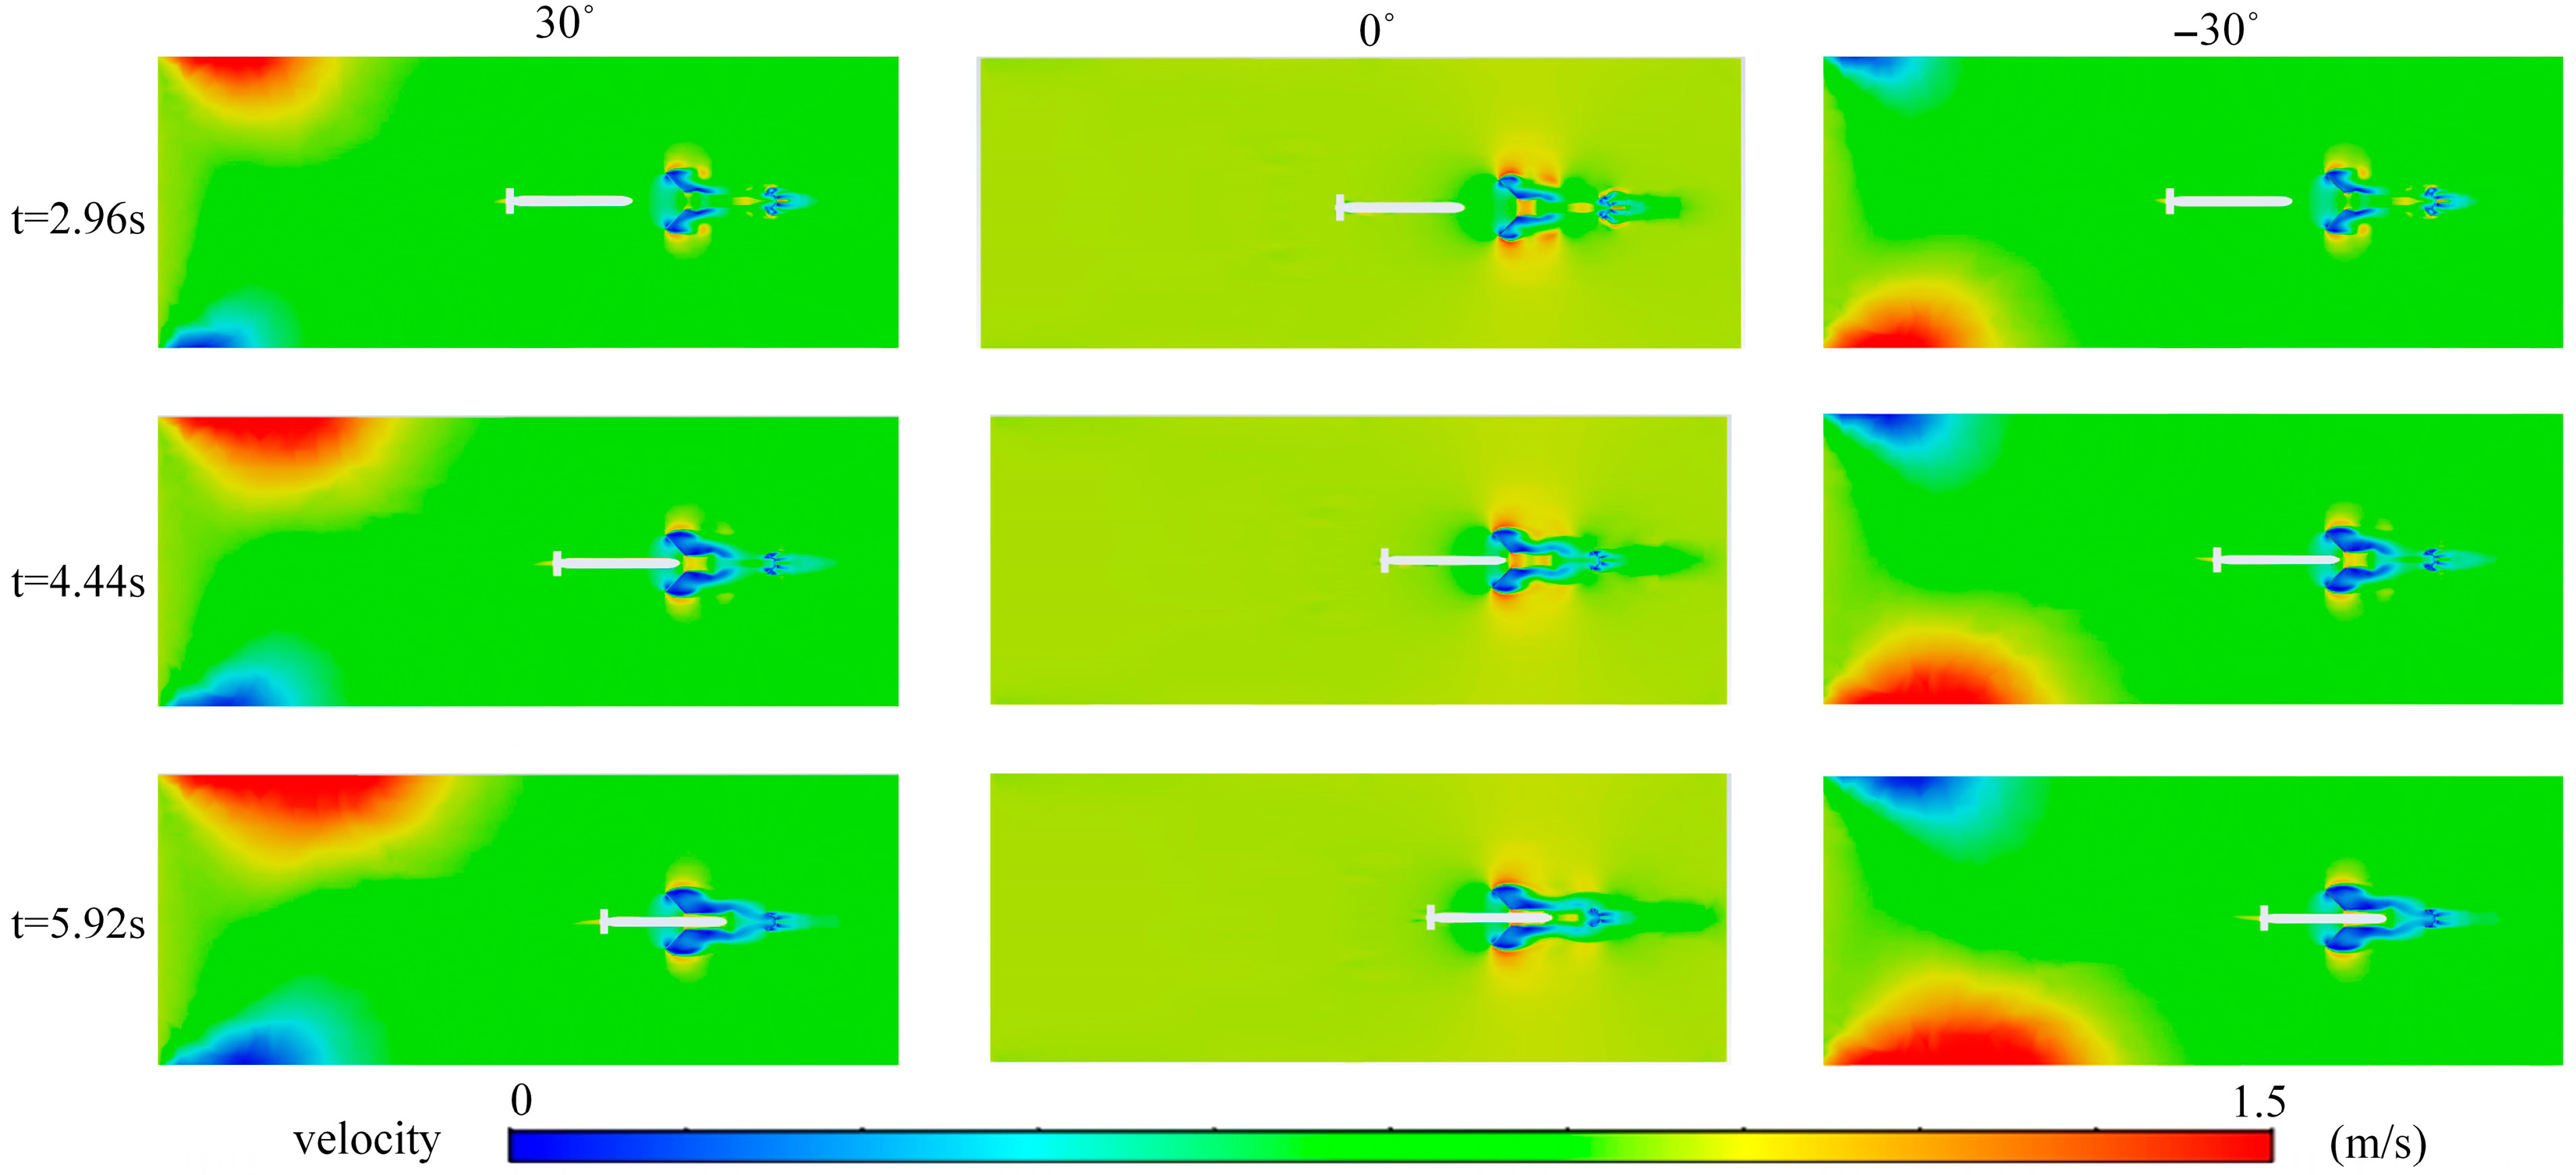
Figure 19 shows the velocity contour map during the underwater docking process between the AUV and the docking chamber. It can be observed that when the direction of the ocean current aligns with the AUV’s operational direction, the overall flow velocity is relatively high. As the angle between the ocean current direction and the AUV’s operational direction increases, the flow velocity gradually decreases. This is because when the ocean current strikes the AUV and the dock at a large angle, the fluid must flow around the object’s surface, resulting in the conversion of kinetic energy into turbulent kinetic energy or potential energy. During the docking process, when the ocean current direction angle is 30°, the velocity in the upper flow field is greater than that in the lower flow field, creating a vertical velocity difference that generates upward lift. This may cause the AUV to drift upward, deviating from the docking trajectory and increasing docking difficulty and collision risks. Conversely, when the current direction angle is −30°, the velocity of the lower flow field is greater than that of the upper flow field, generating downward lift force, causing the AUV to drift downward, requiring additional upward control force to maintain stability. Additionally, at a 0° current direction, the fluid velocity is relatively uniform, indicating smooth water flow; however, at ±30° current directions, the fluid velocity at the front of the AUV increases, while the rear and sides form low-velocity zones, exhibiting fluid acceleration and separation phenomena, which increase the AUV’s drag, particularly in the vortex region at the rear, potentially affecting docking accuracy.
Through computational analysis, the relationship between the resistance experienced by the AUV and the distance from the underwater recovery device was determined under conditions where the AUV moves at a constant speed of 1 m/s in ocean currents with directions of 30°, 0°, and −30°, as shown in Figure 20. Before the AUV reaches point A, as the distance between the AUV and the docking device decreases, the resistance experienced by the AUV increases. This is because the docking device creates a significant diversion effect on the incoming flow, forming a high-pressure zone at its rear, placing the AUV’s bow in the high-pressure zone. The overall direction of resistance points in the opposite direction of the AUV’s navigation, thereby obstructing the AUV’s entry into the dock. As the ocean current direction angle increases, the resistance experienced by the AUV decreases. This is because an increased direction angle reduces the velocity of the ocean current along the AUV’s forward direction. In the recovery device, when the ocean current’s velocity along the positive X-axis decreases, the resistance decreases until it reaches zero at point B. After point B, the resistance changes from positive to negative, and the ocean current transitions from obstructing docking to facilitating docking. Throughout the docking process, the resistance at ocean current direction angles of −30° and 30° is nearly identical. As the AUV approaches the rear of the docking device, the resistance changes from negative to positive and increases as the distance decreases. The conclusions drawn from the above simulation are that an increase in the ocean current direction angle results in reduced resistance and suction, which is advantageous for AUV docking.
Figure 21 shows the changes in lift under the same conditions. The lift curve indicates that as the AUV approaches the docking chamber, the lift first exhibits slight fluctuations and then rapidly increases as it nears the docking position, particularly under ±30° current direction conditions, where the amplitude of lift changes is significant. When the current direction angle is positive, the AUV experiences downward lift; when the current direction angle is negative, the AUV experiences upward lift. An increase in the current direction angle means the AUV experiences greater forces in the vertical direction, and these fluctuations in lift may cause the AUV to exhibit upward or downward drift tendencies, thereby affecting its docking accuracy and stability. Figure 20 and Figure 21 indicate that the current direction angle significantly influences the changes in drag and lift during the AUV’s docking process, especially under larger angle conditions (e.g., ±30°), where the hydrodynamic characteristics of the AUV change more drastically, potentially increasing the difficulty of docking.

5. Conclusions

This study employed a hybrid dynamic overlapping grid method to conduct numerical simulations of the AUV docking process with a conical dry dock. To accurately predict the motion of the AUV as it enters the narrow dry dock from a long distance and improve prediction accuracy, the numerical method was improved, a corresponding mathematical model was established, a turbulence model was selected, and grid sizes suitable for the docking system were set. Through numerical simulation, the hydrodynamic characteristics of the underwater docking process between the AUV and the conical dock were systematically analyzed, with a focus on the influence of dock geometric parameters (entry cone angle, diameter) and ocean current conditions (velocity, direction) on fluid dynamic behavior. The main conclusions are as follows:
(1)
Increasing the cone angle of the docking bay entrance (55°) significantly reduces the docking resistance of the AUV, as a larger cone angle minimizes turbulence in the flow field at the front of the docking bay and prevents the accumulation of high-pressure zones. A smaller cone angle (35°) tends to create a low-pressure zone on the rear side of the docking bay entrance, increasing the risk of fluid separation and thereby hindering the stable entry of the AUV.
(2)
Increasing the diameter of the docking chamber inlet (e.g., from 1500 mm to 1900 mm) will result in increased flow field resistance. A larger diameter increases the cross-sectional area of the fluid, reducing flow velocity. According to Bernoulli’s principle, this results in an increase in static pressure, thereby creating greater resistance. Conversely, a docking chamber with a smaller diameter has the lowest resistance, but an excessively small diameter may exacerbate fluid separation, thereby affecting the stability of the docking process.
(3)
When the ocean current velocity is consistent with the AUV’s direction of travel, resistance is minimal when the ocean current velocity is close to the AUV’s speed (1 m/s). However, when the ocean current velocity (0.5 m/s) is less than the AUV’s speed, resistance is positive during the docking process, hindering the AUV’s smooth docking. On the other hand, when the ocean current speed (1.5 m/s) exceeds the AUV’s speed, an adhesive force (thrust) appears after point B, accelerating the AUV’s docking process but also increasing the risk of collision.
(4)
(An increase in the direction angle of the ocean current (±30°) reduces drag during the AUV docking process, but also causes a speed difference between the upstream and downstream fields of the AUV, generating lift (upward drift) or downward pressure (downward drift). To maintain stability, the AUV must apply additional control forces to avoid significant lateral drift.
The results of this study contribute to a deeper understanding of the dynamic behavior of AUV underwater docking and conical docks. Future research may further consider the coupled effects of multi-AUV cooperative docking and complex sea conditions (such as waves and eddies). By combining machine learning algorithms to develop adaptive control models and perform intelligent trajectory corrections under ocean current interference, the robustness of the docking system can be enhanced, which will become a future research direction.

Author Contributions

Conceptualization, Y.G. and X.L.; methodology, Y.G. and X.L.; software, Y.G.; validation, Y.G., X.L. and J.M.; formal analysis, Y.G.; investigation, Y.G.; resources, Y.G.; data curation, Y.G.; writing—original draft preparation, Y.G.; writing—review and editing, Y.G.; visualization, Y.G. and J.M.; supervision, X.L. and D.L.; project administration, D.L.; funding acquisition, Y.T. and D.L. All authors have read and agreed to the published version of the manuscript.

Funding

This research was funded by the Jiangsu Provincial Key Research and Development Program, China (Grant No.BE2022062-1), and the Young Scientists Fund of the National Natural Science Foundation of China (Grant No. 51805512).

Data Availability Statement

The data that support the findings of this study are available within the article.

Conflicts of Interest

The authors declare no conflicts of interest.

References

  1. Walsh, D. Exploration and technology—Key building blocks for the new blue economy. In Preparing a Workforce for the New Blue Economy; Elsevier: Amsterdam, The Netherlands, 2021; pp. 3–16. [Google Scholar]
  2. Zhang, H.; Hao, L.; Wang, Y.; Liu, Y.; Wu, Z.; Wang, S.; Shao, S.; Wei, D.; Hou, W. The general design of a seafloor surveying AUV system. In Proceedings of the 2013 OCEANS-San Diego, San Diego, CA, USA, 23–27 September 2013; IEEE: Piscataway, NJ, USA, 2014; pp. 1–5. [Google Scholar]
  3. Liu, G.; Chen, L.; Liu, K.; Luo, Y. A swarm of unmanned vehicles in the shallow ocean: A survey. Neurocomputing 2023, 531, 74–86. [Google Scholar] [CrossRef]
  4. He, J.; Wen, J.; Xiao, S.; Yang, J. Multi-AUV inspection for process monitoring of underwater oil transportation. IEEE/CAA J. Autom. Sin. 2023, 10, 828–830. [Google Scholar] [CrossRef]
  5. Bovio, E.; Cecchi, D.; Baralli, F. Autonomous underwater vehicles for scientific and naval operations. Annu. Rev. Control 2006, 30, 117–130. [Google Scholar] [CrossRef]
  6. Nicholson, J.; Healey, A. The present state of autonomous underwater vehicle (AUV) applications and technologies. Mar. Technol. Soc. J. 2008, 42, 44–51. [Google Scholar] [CrossRef]
  7. Wang, H.; Xi, L.; Li, J.; Zhou, H. Design, construction of a small unmanned underwater vehicle. In Proceedings of the 2013 MTS/IEEE OCEANS-Bergen, Bergen, Norway, 10–14 June 2013; IEEE: Piscataway, NJ, USA, 2013; pp. 1–6. [Google Scholar]
  8. Nouri, N.; Zeinali, M.; Jahangardy, Y. AUV hull shape design based on desired pressure distribution. J. Mar. Sci. Technol. 2016, 21, 203–215. [Google Scholar] [CrossRef]
  9. Yan, K.; Wu, L. A survey on the key technologies for underwater AUV docking. Robot 2007, 29, 267–273. [Google Scholar]
  10. Zhang, W.; Wu, W.; Teng, Y.; Li, Z.; Yan, Z. An underwater docking system based on UUV and recovery mother ship: Design and experiment. Ocean Eng. 2023, 281, 114767. [Google Scholar] [CrossRef]
  11. Szczotka, M. AUV launch & recovery handling simulation on a rough sea. Ocean Eng. 2022, 246, 110509. [Google Scholar] [CrossRef]
  12. Fan, S.; Liu, C.; Li, B.; Xu, Y.; Xu, W. AUV docking based on USBL navigation and vision guidance. J. Mar. Sci. Technol. 2019, 24, 673–685. [Google Scholar] [CrossRef]
  13. Page, B.R.; Mahmoudian, N. Simulation-driven optimization of underwater docking station design. IEEE J. Ocean. Eng. 2019, 45, 404–413. [Google Scholar] [CrossRef]
  14. Zhang, W.; Jia, G.; Wu, P.; Yang, S.; Huang, B.; Wu, D. Study on hydrodynamic characteristics of AUV launch process from a launch tube. Ocean Eng. 2021, 232, 109171. [Google Scholar] [CrossRef]
  15. Brizzolara, S.; Chryssostomidis, C. Design of an Unconventional ASV for Underwater Vehicles Recovery: Simulation of the motions for operations in rough seas. In Proceedings of the ASNE International Conference on Launch & Recovery, Linthicum, MD, USA, 14–15 November 2012. [Google Scholar]
  16. Sarda, E.I. Automated Launch and Recovery of an Autonomous Underwater Vehicle from an Unmanned Surface Vessel. Ph.D. Thesis, Florida Atlantic University, Boca Raton, FL, USA, 2016. [Google Scholar]
  17. Bai, G.; Gu, H.; Zhang, H.; Meng, L.; Tang, D. V-shaped wing design and hydrodynamic analysis based on moving base for recovery AUV. In Proceedings of the 2018 WRC Symposium on Advanced Robotics and Automation (WRC SARA), Beijing, China, 16 August 2018; IEEE: Piscataway, NJ, USA, 2018; pp. 320–325. [Google Scholar]
  18. Palomeras, N.; Vallicrosa, G.; Mallios, A.; Bosch, J.; Vidal, E.; Hurtos, N.; Carreras, M.; Ridao, P. AUV homing and docking for remote operations. Ocean Eng. 2018, 154, 106–120. [Google Scholar] [CrossRef]
  19. Meng, L.; Lin, Y.; Gu, H.; Bai, G.; Su, T.-C. Study on dynamic characteristics analysis of underwater dynamic docking device. Ocean Eng. 2019, 180, 1–9. [Google Scholar] [CrossRef]
  20. Li, Y.; Jiang, Y.; Cao, J.; Wang, B.; Li, Y. AUV docking experiments based on vision positioning using two cameras. Ocean Eng. 2015, 110, 163–173. [Google Scholar] [CrossRef]
  21. Lin, M.; Yang, C. Auv docking method in a confined reservoir with good visibility. J. Intell. Robot. Syst. 2020, 100, 349–361. [Google Scholar] [CrossRef]
  22. Vu, M.T.; Choi, H.-S.; Nhat, T.Q.M.; Nguyen, N.D.; Lee, S.-D.; Le, T.-H.; Sur, J. Docking assessment algorithm for autonomous underwater vehicles. Appl. Ocean Res. 2020, 100, 102180. [Google Scholar] [CrossRef]
  23. Zhang, T.; Li, D.; Yang, C. Study on impact process of AUV underwater docking with a cone-shaped dock. Ocean Eng. 2017, 130, 176–187. [Google Scholar] [CrossRef]
  24. Diao, J.; Li, W.; Yuan, X.; Jiang, K.; Zhao, Y. Study on influencing factors of hydrodynamics based on AUV docking with conical dock. Proc. Inst. Mech. Eng. Part M J. Eng. Marit. Environ. 2023, 237, 929–939. [Google Scholar] [CrossRef]
  25. Diao, J.; Gao, Z.; Yuan, X. Collision dynamics in AUV docking with conical hood type dock: Influencing factors and performance analysis. Ships Offshore Struct. 2024, 19, 2130–2136. [Google Scholar] [CrossRef]
  26. Stokey, R.; Purcell, M.; Forrester, N.; Austin, T.; Goldsborough, R.; Allen, B.; von Alt, C. A docking system for REMUS, an autonomous underwater vehicle. In Proceedings of the Oceans’ 97. MTS/IEEE Conference Proceedings, Halifax, NS, Canada, 6–9 October 1997; IEEE: Piscataway, NJ, USA, 2002; Volume 2, pp. 1132–1136. [Google Scholar]
  27. Stokey, R.; Allen, B.; Austin, T.; Goldsborough, R.; Forrester, N.; Purcell, M.; Von Alt, C. Enabling technologies for REMUS docking: An integral component of an autonomous ocean-sampling network. IEEE J. Ocean. Eng. 2002, 26, 487–497. [Google Scholar] [CrossRef]
  28. Allen, B.; Austin, T.; Forrester, N.; Goldsborough, R.; Kukulya, A.; Packard, G.; Purcell, M.; Stokey, R. Autonomous docking demonstrations with enhanced REMUS technology. In Proceedings of the OCEANS 2006, Boston, MA, USA, 18–21 September 2006; IEEE: Piscataway, NJ, USA, 2007; pp. 1–6. [Google Scholar]
  29. McEwen, R.S.; Hobson, B.W.; McBride, L.; Bellingham, J.G. Docking control system for a 54-cm-diameter (21-in) AUV. IEEE J. Ocean. Eng. 2008, 33, 550–562. [Google Scholar] [CrossRef]
  30. Palomeras, N.; Ridao, P.; Ribas, D.; Vallicrosa, G. Autonomous I-AUV docking for fixed-base manipulation. IFAC Proc. Vol. 2014, 47, 12160–12165. [Google Scholar] [CrossRef]
  31. Zhang, T.; Li, D.; Lin, M.; Wang, T.; Yang, C. AUV terminal docking experiments based on vision guidance. In Proceedings of the OCEANS 2016 MTS/IEEE Monterey, Monterey, CA, USA, 19–23 September 2016; IEEE: Piscataway, NJ, USA, 2016; pp. 1–5. [Google Scholar]
  32. Meng, L.; Lin, Y.; Gu, H.; Su, T.-C. Study on dynamic docking process and collision problems of captured-rod docking method. Ocean Eng. 2019, 193, 106624. [Google Scholar] [CrossRef]
  33. Yang, Q.; Liu, H.; Yu, X.; Zhang, W.; Chen, J. Attitude constraint-based recovery for under-actuated AUVs under vertical plane control during the capture stage. Ocean Eng. 2023, 281, 115012. [Google Scholar] [CrossRef]
  34. Mitra, A.; Panda, J.P.; Warrior, H.V. Experimental and numerical investigation of the hydrodynamic characteristics of autonomous underwater vehicles over sea-beds with complex topography. Ocean Eng. 2020, 198, 106978. [Google Scholar] [CrossRef]
  35. Zhang, W.; Zeng, J.; Yan, Z.; Wei, S.; Tian, W. Leader-following consensus of discrete-time multi-AUV recovery system with time-varying delay. Ocean Eng. 2021, 219, 108258. [Google Scholar] [CrossRef]
  36. Wu, L.; Li, Y.; Su, S.; Yan, P.; Qin, Y. Hydrodynamic analysis of AUV underwater docking with a cone-shaped dock under ocean currents. Ocean Eng. 2014, 85, 110–126. [Google Scholar] [CrossRef]
  37. Meng, L.; Lin, Y.; Gu, H.; Su, T.-C. Study on the mechanics characteristics of an underwater towing system for recycling an Autonomous Underwater Vehicle (AUV). Appl. Ocean Res. 2018, 79, 123–133. [Google Scholar] [CrossRef]
  38. Meng, L.; Lin, Y.; Gu, H.; Su, T.-C. Study of the dynamic characteristics of a cone-shaped recovery system on submarines for recovering autonomous underwater vehicle. China Ocean Eng. 2020, 34, 387–399. [Google Scholar] [CrossRef]
  39. Luo, W.; Ma, C.; Jiang, D.; Zhang, T.; Wu, T. The hydrodynamic interaction between an AUV and submarine during the recovery process. J. Mar. Sci. Eng. 2023, 11, 1789. [Google Scholar] [CrossRef]
  40. Xu, Y.; Shi, W.; Song, Y.; Hou, H. Hydrodynamics of a Remora-inspired autonomous underwater vehicle approaching and docking to a benchmark submarine. Ocean Eng. 2024, 291, 116447. [Google Scholar] [CrossRef]
  41. Liu, J.; Yu, F.; He, B.; Soares, C.G. A review of underwater docking and charging technology for autonomous vehicles. Ocean Eng. 2024, 297, 117154. [Google Scholar] [CrossRef]
  42. Hong, L.; Fang, R.; Cai, X.; Wang, X. Numerical investigation on hydrodynamic performance of a portable AUV. J. Mar. Sci. Eng. 2021, 9, 812. [Google Scholar] [CrossRef]
  43. Wu, L.; Feng, X.; Hu, Z. Application of 3-D hybrid dynamic grids to simulate the flow in AUV swim-out. J. Ship Mech. 2010, 14, 717–722. [Google Scholar]
  44. Wu, L. Numerical Simulation on AUV Underwater Launch and Docking Based on Dynamic Hybrid Grids. Ph.D. Thesis, Graduate School of the Chinese Academy of Sciences, Beijing, China, 2009. [Google Scholar]
Figure 1. AUV underwater docking numerical model.
Jmse 13 01645 g001
Figure 2. Boundaries of the flow field computational domain.
Jmse 13 01645 g002
Figure 3. Grids for docking AUVs to docking pods: (a) cylindrical computational domain mesh; (b) cutting internal grids in the plane. The blue line on the left is the speed inlet, and the red line on the right is the pressure outlet.
Jmse 13 01645 g003
Figure 4. Comparison between a hybrid mesh with a hexahedral mesh (a) and a mesh with only a tetrahedral mesh (b).
Jmse 13 01645 g004
Figure 5. Grid-independent verification.
Jmse 13 01645 g005
Figure 6. Verification of time-step irrelevance.
Jmse 13 01645 g006
Figure 7. Pressure contours for three inlet taper docking chambers.
Jmse 13 01645 g007
Figure 8. Three-dimensional pressure cloud of AUV homogeneous docking.
Jmse 13 01645 g008
Figure 9. Velocity contours for three entrance taper docking bays.
Jmse 13 01645 g009
Figure 10. Drag variation for docking in three entrance taper docking bays.
Jmse 13 01645 g010
Figure 11. Three inlet diameter docking chambers’ docking pressure contours.
Jmse 13 01645 g011
Figure 12. Velocity contours for docking in three entrance diameter docking bays.
Jmse 13 01645 g012
Figure 13. Variation in drag for docking of three inlet diameter docking chambers.
Jmse 13 01645 g013
Figure 14. Pressure clouds of AUV docking under different velocity currents.
Jmse 13 01645 g014
Figure 15. Velocity clouds of AUV docking in different velocity currents.
Jmse 13 01645 g015
Figure 16. Changes in drag force under different ocean current speeds.
Jmse 13 01645 g016
Figure 17. Changes in lift force under different ocean current speeds.
Jmse 13 01645 g017
Figure 18. Pressure cloud map of AUV docking under different ocean current conditions.
Jmse 13 01645 g018
Figure 19. Speed cloud map of AUV docking under different ocean current conditions.
Jmse 13 01645 g019
Figure 20. Changes in drag force under different ocean currents.
Jmse 13 01645 g020
Figure 21. Changes in lift under different directional ocean currents.
Jmse 13 01645 g021
Disclaimer/Publisher’s Note: The statements, opinions and data contained in all publications are solely those of the individual author(s) and contributor(s) and not of MDPI and/or the editor(s). MDPI and/or the editor(s) disclaim responsibility for any injury to people or property resulting from any ideas, methods, instructions or products referred to in the content.