1. Introduction
Low-permeability sandstone reservoirs have emerged as critical global oil and gas exploration targets [
1]. These unconventional resources, characterized by micro-to-nanoscale pore-throat structures, represent a substantial portion of the remaining hydrocarbon reserves worldwide [
2]. In North America, technological innovations have facilitated remarkable advancements in developing these challenging reservoirs [
3]. While China’s exploration of low-permeability sandstone reservoirs began relatively later, it has achieved significant progress in recent years, with the Changqing Oilfield in the Ordos Basin serving as an exemplary case of both technological innovation and practical application [
4].
The fundamental distinction between low-permeability sandstone reservoirs and conventional reservoirs lies in their pore-throat structures, which directly influence fluid storage capacity, flow behavior, and hydrocarbon accumulation and distribution patterns [
5]. Consequently, comprehensive characterization of pore structures and connectivity in low-permeability reservoirs is essential for understanding the mechanisms governing hydrocarbon migration, accumulation, and production potential.
Low-permeability sandstone reservoirs are distinguished by their complex pore-throat systems, typically ranging from nanometers to micrometers in size [
6]. These reservoirs exhibit several distinctive characteristics: (1) intricate, tortuous pore-throat networks with complex geometries; (2) restricted pore radii, often below 1 μm; (3) limited pore-throat connectivity; (4) pronounced heterogeneity in spatial distribution; and (5) complex relationships between porosity and permeability [
7].
The microstructural properties of these reservoirs significantly impact fluid storage capacity and transmissibility [
8]. Unlike conventional reservoirs, where the relationship between porosity and permeability follows relatively predictable patterns, low-permeability sandstones often exhibit complex, non-linear relationships between these parameters [
9]. This complexity necessitates detailed analysis of pore morphology, size distribution, and connectivity to accurately predict reservoir performance and optimize development strategies [
10].
Researchers have employed diverse methodologies to characterize the pore size distribution (PSD) and geometry of sandstone reservoirs, which can be categorized into three principal approaches: imaging methods, ray scanning methods, and fluid injection methods [
11]. Techniques such as casting thin sections and scanning electron microscopy (SEM) provide valuable insights into pore morphology, size, and genetic origin [
12]. These methods offer high-resolution visualization of pore spaces. Still, they are inherently limited by their two-dimensional nature and the specific area being imaged, potentially leading to sampling bias and incomplete characterization of the entire pore network [
13]. Computed tomography (CT) scanning enables three-dimensional visualization of pore distributions within core samples. This technique quantifies parameters such as pore size, pore number, and pore-throat ratios. However, resolution limitations may prevent the accurate characterization of nanoscale features critical to low-permeability reservoirs [
14]. The fluid injection techniques represent the most widely applied and effective approaches for analyzing low-permeability sandstone reservoirs, such as gas adsorption (utilizing N
2 and CO
2), mercury intrusion capillary pressure (MICP), and constant-velocity mercury injection (CMI) [
15].
Despite these advances, no analytical method can comprehensively characterize the complex pore structures of low-permeability sandstone reservoirs. A multi-technique integrated approach is necessary to overcome the limitations of individual methods and provide a holistic understanding of reservoir characteristics.
Despite considerable research on low-permeability sandstone reservoirs globally, several knowledge gaps persist: (1) limited studies have focused on the Wenchang Formation within the Huizhou Depression of the Pearl River Mouth Basin, despite its significant hydrocarbon potential; (2) the relationship between pore structure characteristics and reservoir quality in this specific geological context remains inadequately understood; (3) previous investigations have often employed single analytical techniques, potentially overlooking the complex interplay of factors affecting pore structure and connectivity; and (4) the application of fractal theory to classify pore-throat types in this region has not been thoroughly explored.
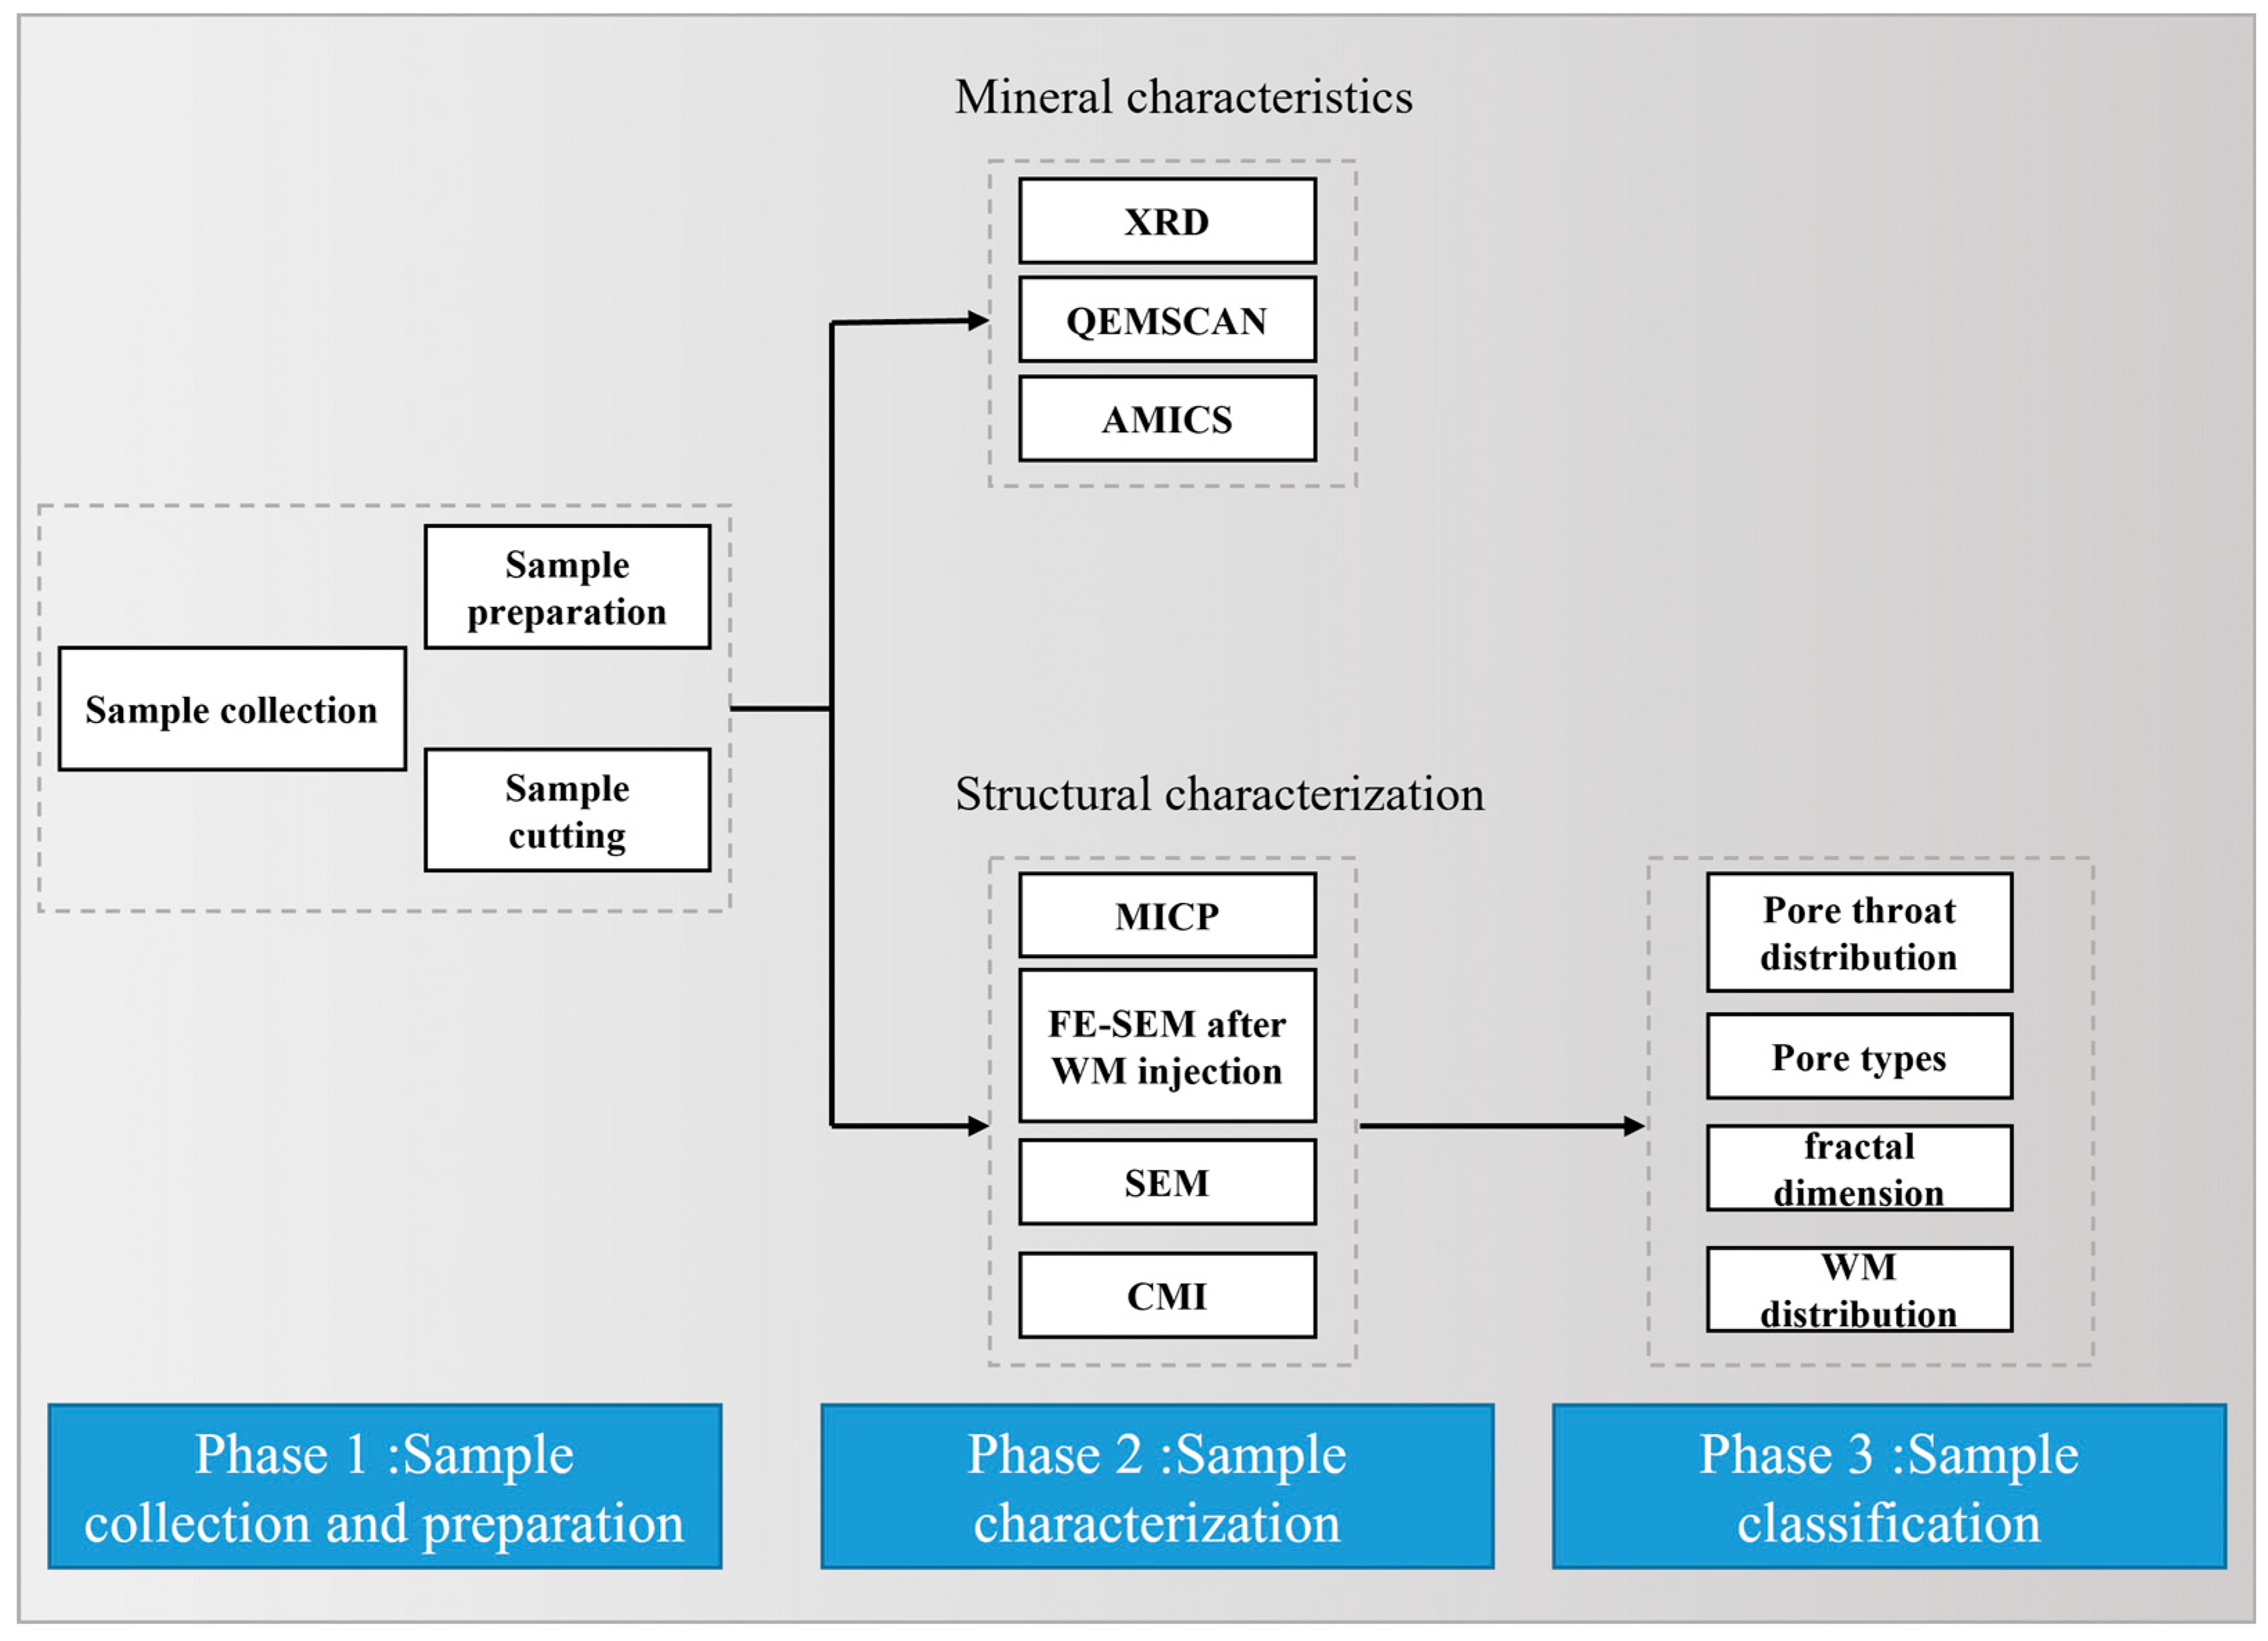
These knowledge gaps highlight the need for a comprehensive, multi-method investigation of the pore systems in low-permeability sandstone reservoirs of the Wenchang Formation. The primary objective of this study is to characterize the pore structure and genesis of low-permeability sandstone reservoirs in the Wenchang Formation within the Huizhou Depression of the Pearl River Mouth Basin in the Northern South China Sea. Specific aims include the classification of pore-throat types using fractal theory, detailed analysis of the physical and structural characteristics of interconnected pore-throat reservoir systems, assessment of the influence of each pore type on reservoir physical properties, and development of recommendations for future exploration and development strategies. This study employs an integrated analytical approach combining (
Figure 1) mercury intrusion capillary pressure (MICP), constant-velocity mercury injection (CMI), Wood’s metal impregnation (WM), scanning electron microscopy (SEM), X-ray diffraction (XRD), and Quantitative Evaluation of Minerals by Scanning Electron Microscopy (QEMSCAN) to achieve these objectives [
16]. This multi-method approach enables the comprehensive characterization of pore systems across multiple scales, from nanometers to micrometers, providing insights that would be unattainable through any single analytical technique. This study presents a comprehensive investigation of pore structure characteristics in low-permeability sandstone reservoirs of the Wenchang Formation, employing an integrated analytical approach. Our findings will enhance the understanding of the fundamental controls governing reservoir quality within the study area, facilitate the development of more accurate predictive models for reservoir performance, and optimize exploration and development strategies for analogous low-permeability sandstone reservoirs. This study also presents advanced methodological approaches for characterizing complex pore systems in unconventional reservoirs. By presenting a detailed classification and description of pore structure characteristics, this research will provide invaluable insights and practical recommendations for the prospective development of hydrocarbon resources in the Huizhou Depression of the Pearl River Mouth Basin.
2. Geological Background of the Pearl River Mouth Basin
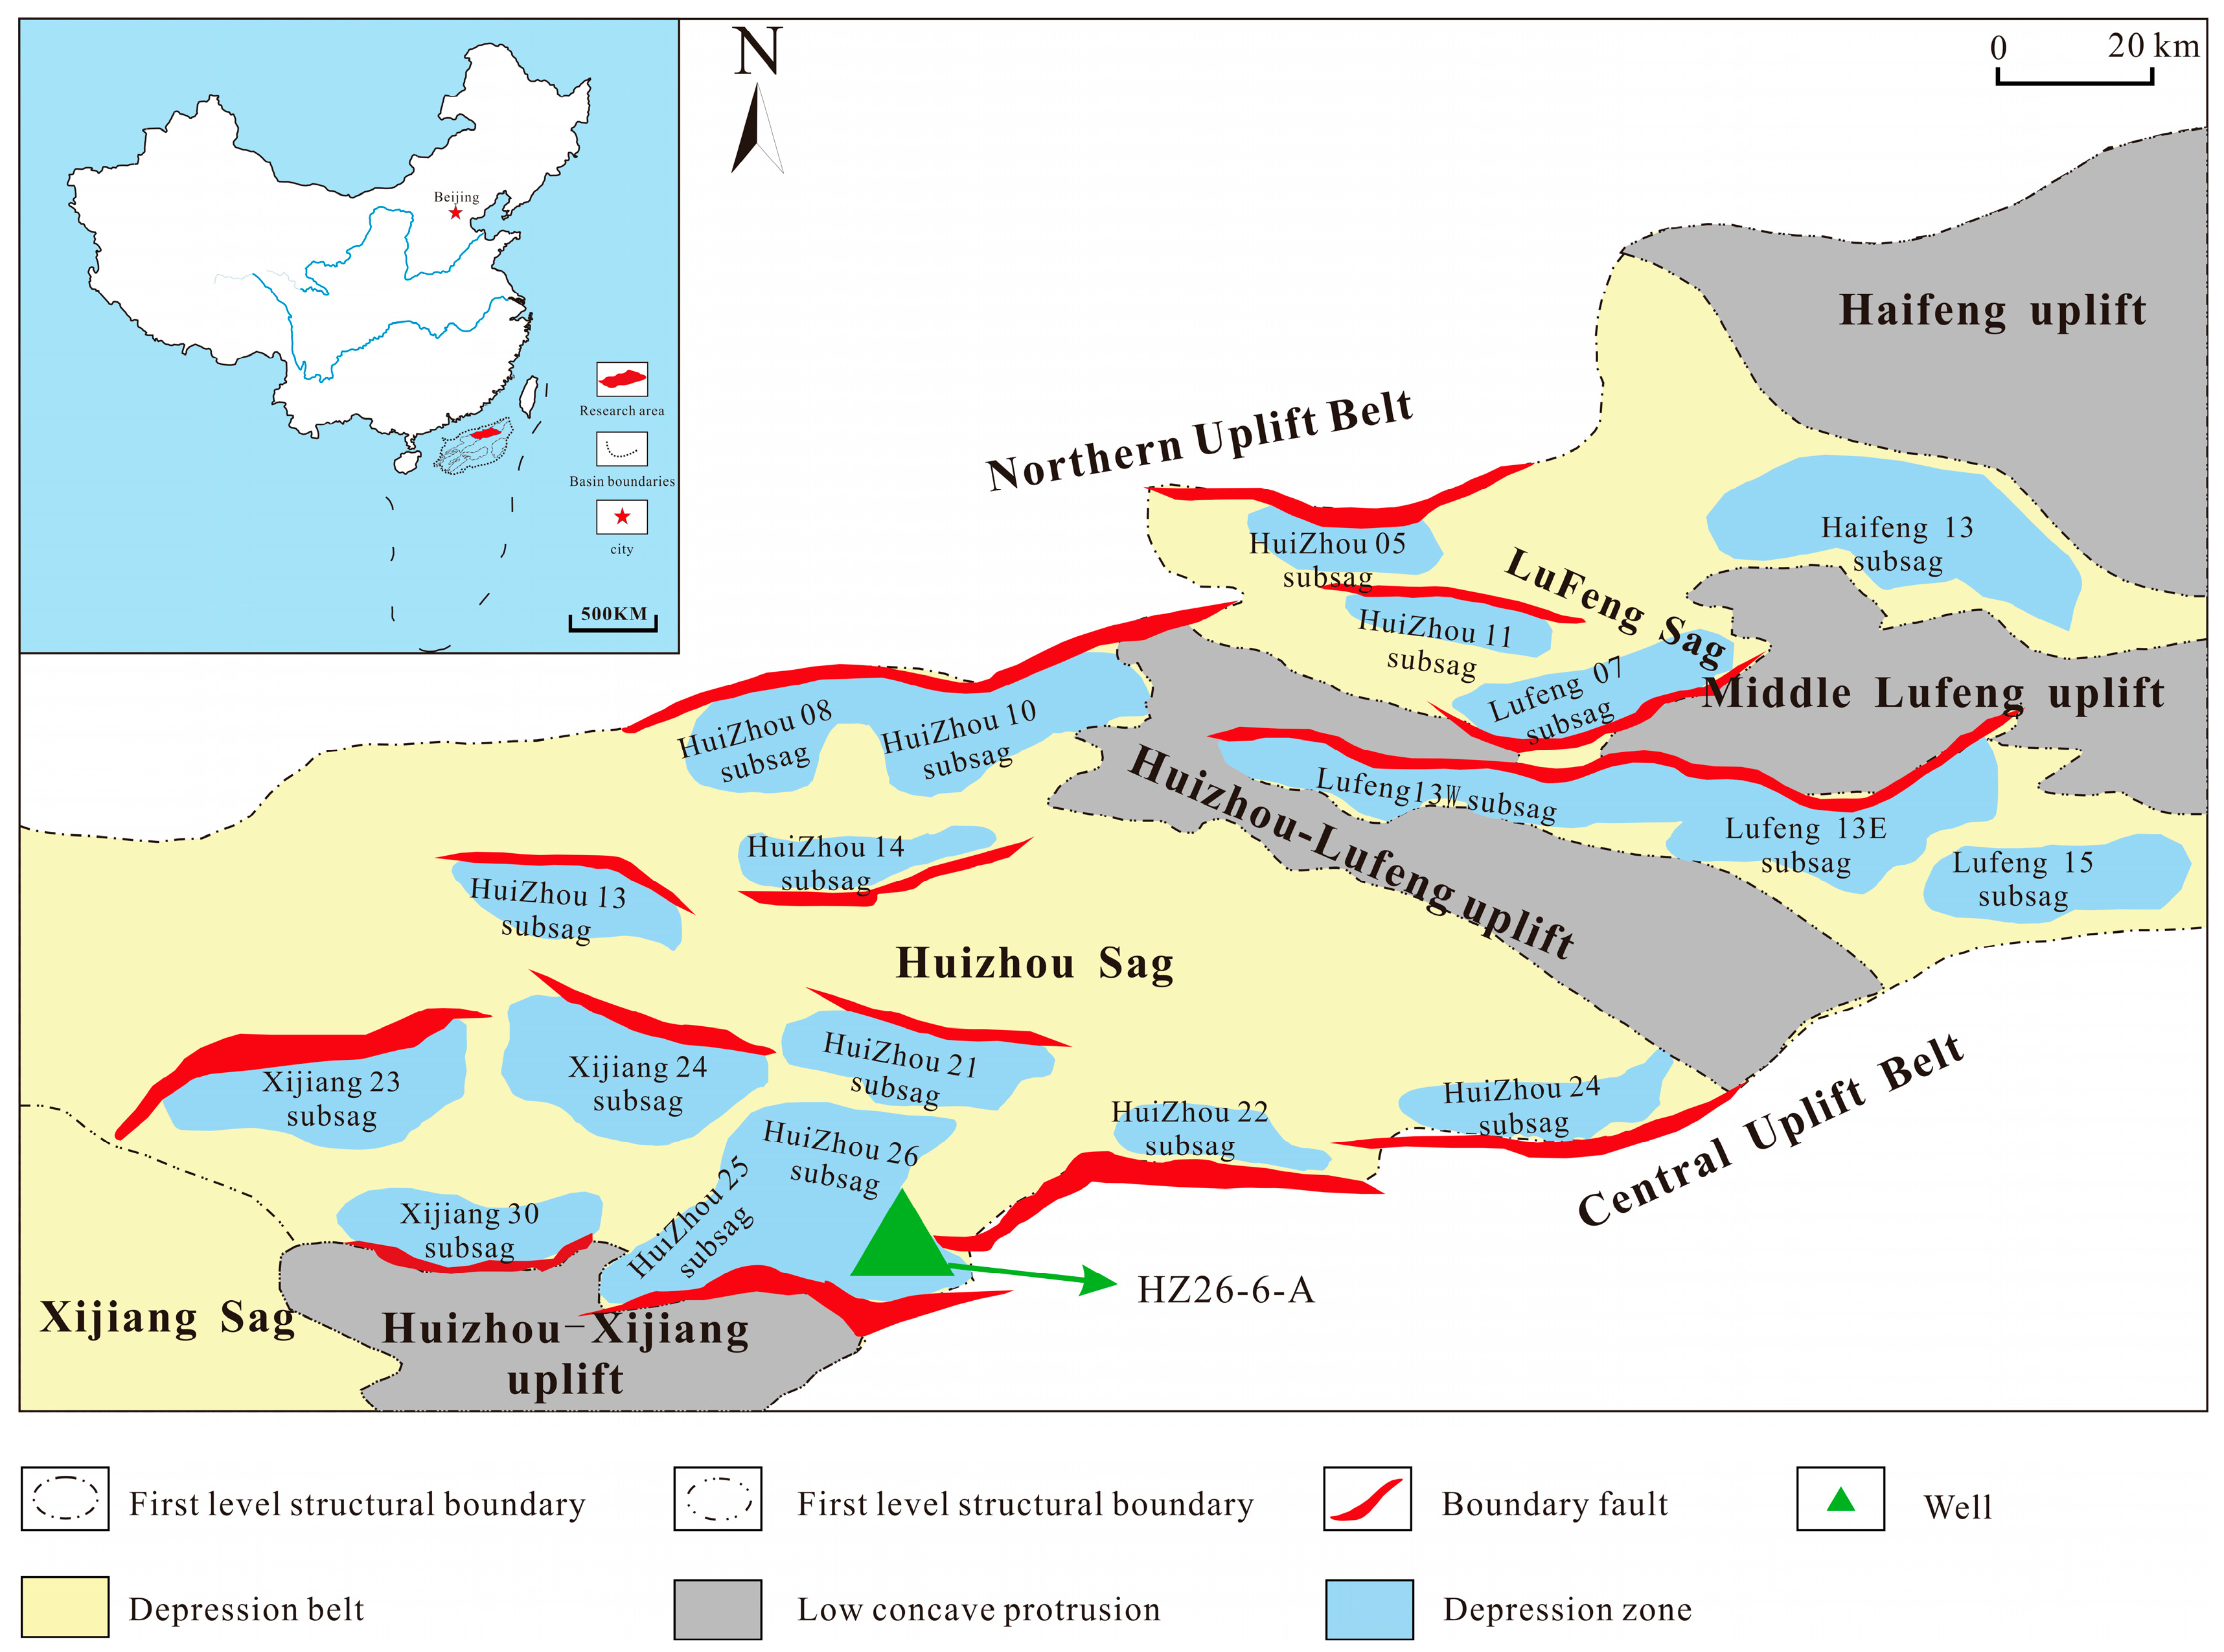
The Huizhou sag of the Pearl River Mouth Basin is located in the eastern region of the South China Sea (
Figure 2), encompassing an area of approximately 1.75 × 10⁵ km
2. This significant Mesozoic–Cenozoic sedimentary basin was developed on Yanshanian granite and a pre-Cenozoic folded basement [
17]. The basin possesses rich oil and gas resources, rendering it one of the most productive petroliferous basins in the South China Sea. It is categorized from north to south into the Northern Uplift Belt, Northern Depression Belt, Central Uplift Belt, Central Depression Belt, Southern Uplift Belt, and Southern Depression Belt [
18]. The Huizhou Sag is geographically positioned in the central area of the Northern Depression Belt within the Pearl River Mouth Basin. The Paleogene strata within this region, arranged from top to bottom, include the Wenchang Formation, Enping Formation, and Zhuhai Formation. With burial depths exceeding 3000 m, the Paleogene sequences in the Huizhou Sag have experienced extended sedimentation and intricate diagenetic alteration processes. These phenomena have resulted in complex reservoir property evolution, as well as diverse mechanisms and factors influencing the development of effective reservoirs, ultimately leading to significant heterogeneity in reservoir distribution [
19].
The Cenozoic of the Huizhou Sag is based on pre-Paleogene metamorphic rocks and volcanic rocks, and the thickness of sedimentary strata is generally about 5000 m. The sedimentary environment of the Huizhou Sag has undergone an evolution process from continental lakes to deltas to sea transgressions [
20]. During the Paleogene period, the area was mainly lacustrine sedimentary environment, and the sediments were mainly mudstone and siltstone. In the Neogene period, with the intensification of transgression, the sedimentary environment became delta sedimentary, and the sediment types included sandstone, mudstone, coal seam, etc. [
21]. During the Quaternary period, the transgression was further expanded, forming a sedimentary environment dominated by sand and gravel.
3. Materials and Methods
3.1. Sample Characterization and Preparation
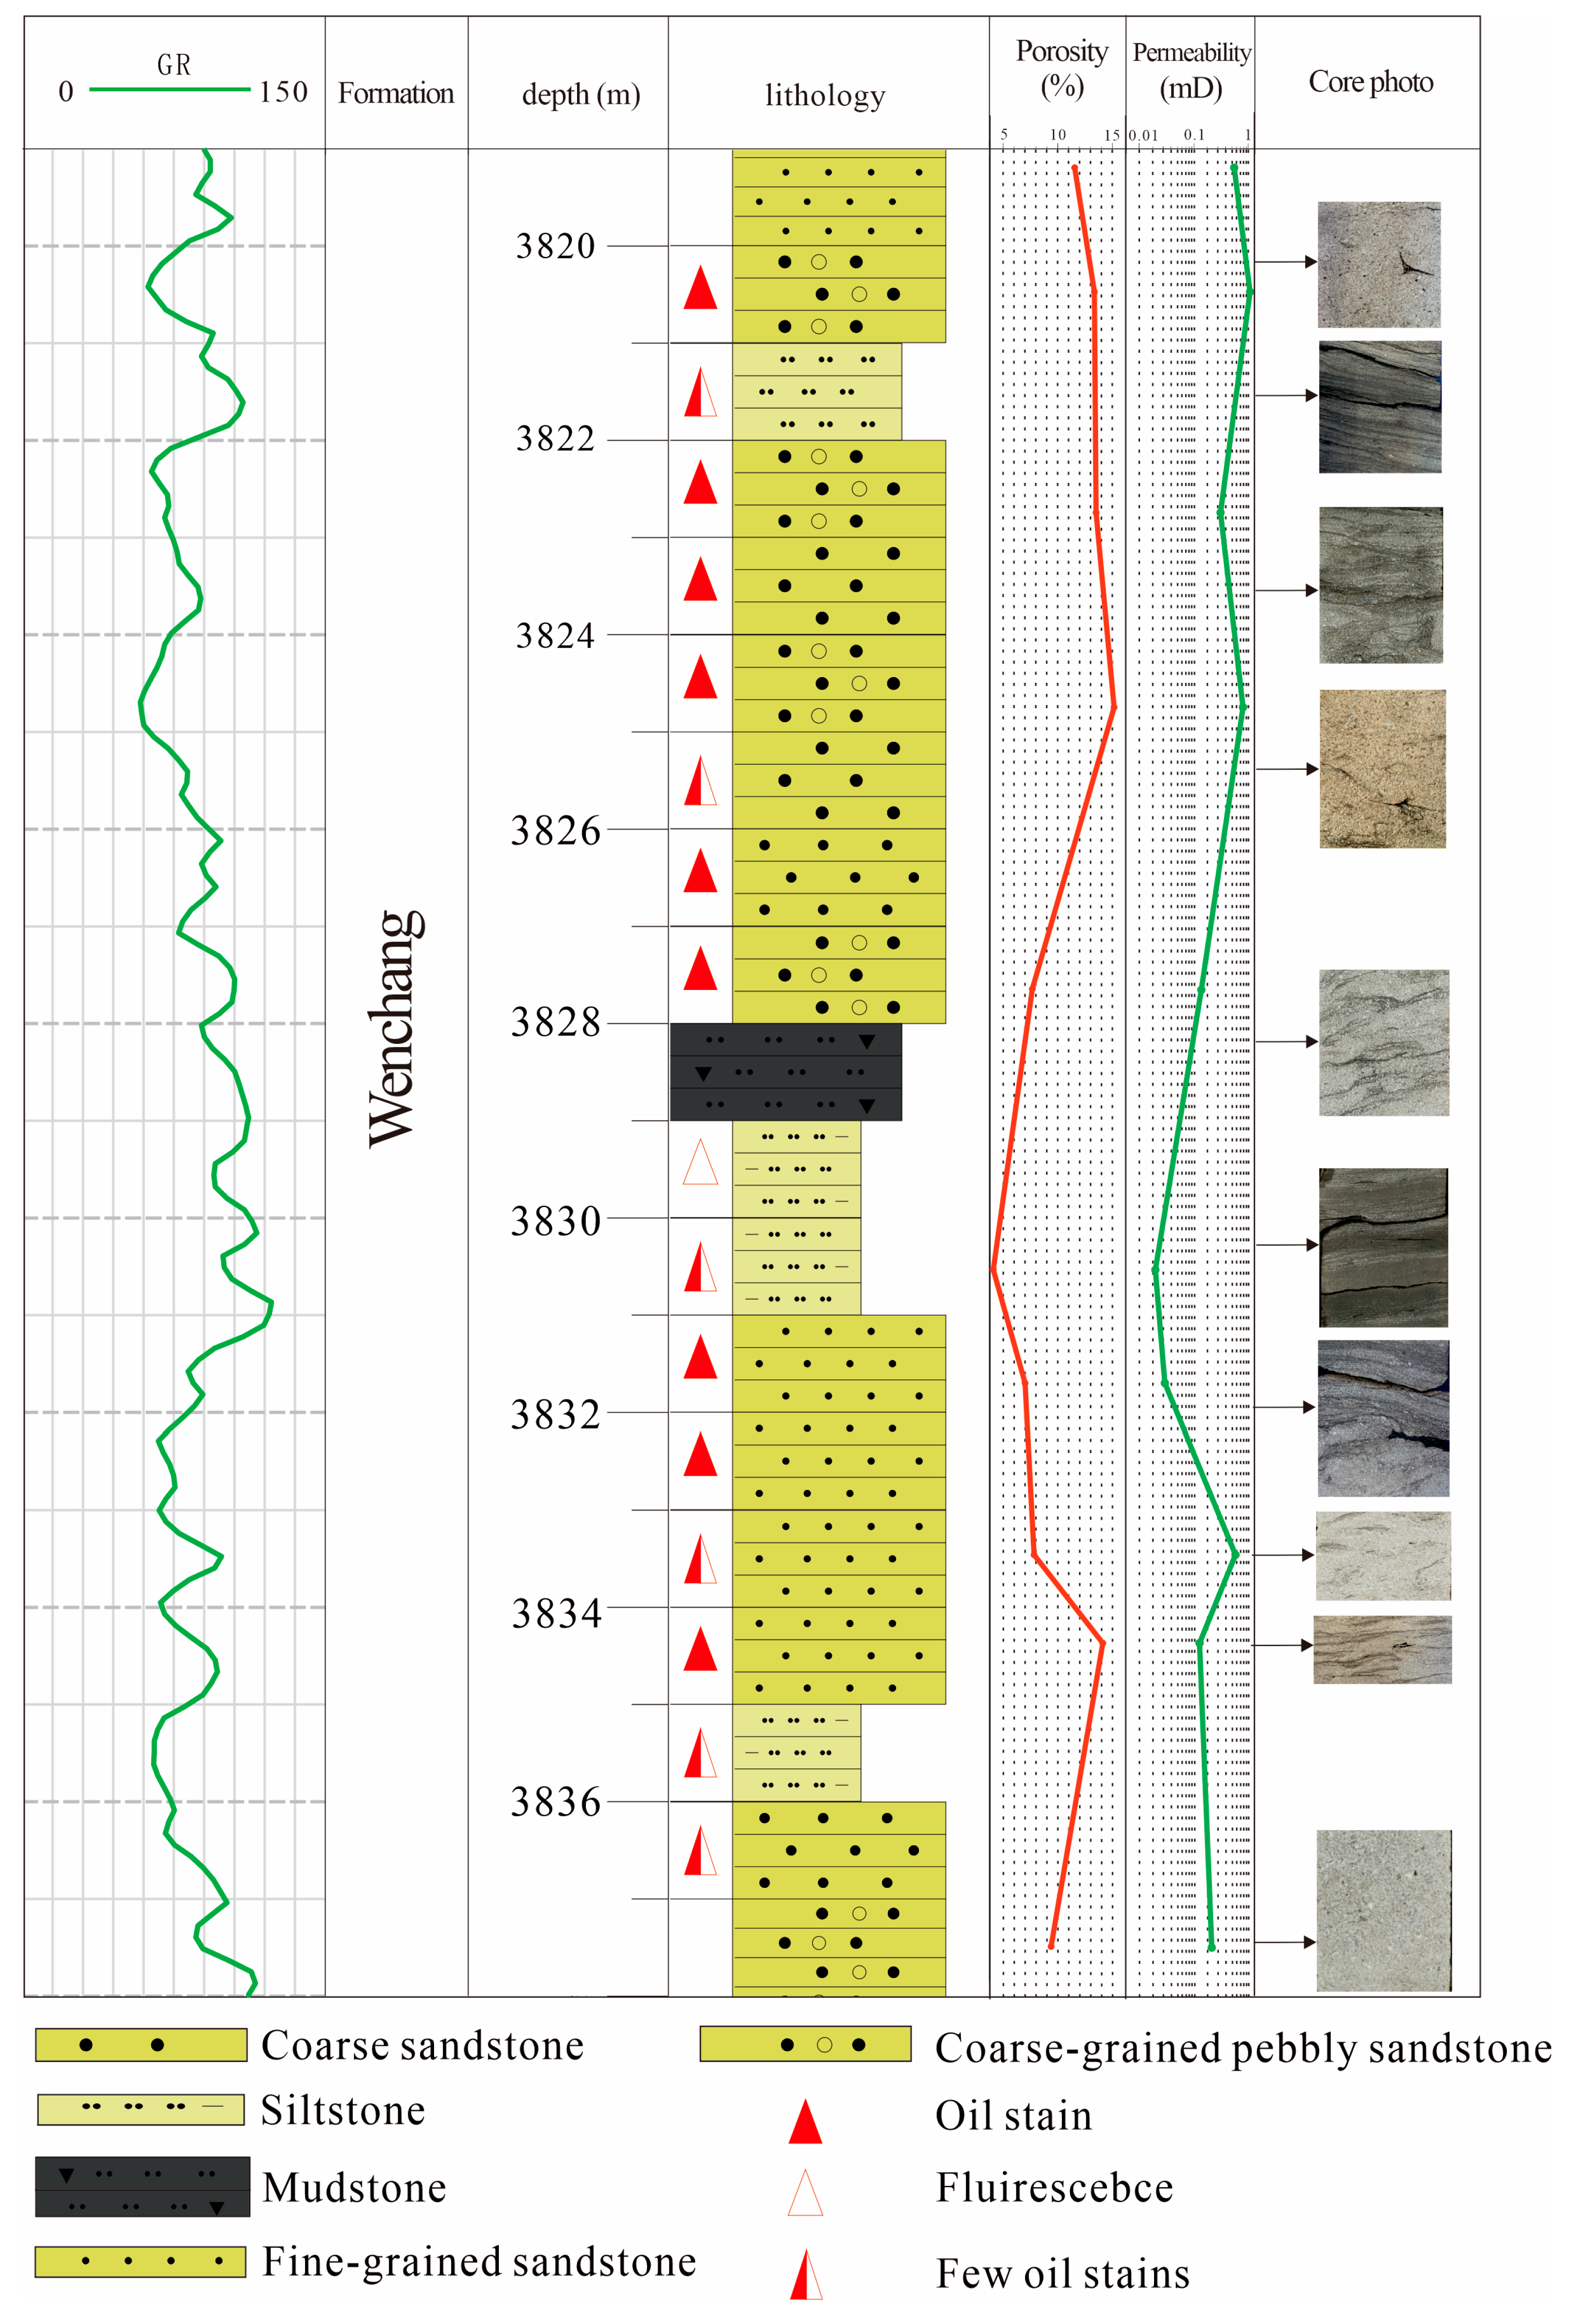
To investigate the characteristics and genesis of the pore structure of low-permeability sandstone from the Wenchang Formation, we collected the sandstone samples from key well (A) in the Huizhou sag of the Pearl River Mouth Basin. Through core observation, as illustrated in
Figure 3, ten plug samples, each 2.5 cm in diameter and 5 cm in length, were extracted from core samples at varying depths for a series of experimental analyses. The PDP-200 overburden porosimeter–permeameter (CoreLab, Amsterdam, The Netherlands), utilizing helium, was employed to ascertain the porosity and permeability of each plug sample under a confining pressure of 800 psi at room temperature (
Table 1). All plug samples were subsequently reduced to cubic shapes (approximately 1 cm
3) for MICP, CMI, and high-pressure Wood’s metal impregnation experiments. Each cubic sample underwent oven drying at 60 °C for a duration exceeding 48 h to remove moisture and volatiles before the commencement of the experiments. The granularity, petrography, and mineralogy of the samples were analyzed through the observation of thin sections and X-ray diffraction (XRD). Crushed samples, with a particle size of less than 200 mesh, along with clay minerals extracted via the gravity method, were examined using an X-ray diffraction instrument to determine the mineral composition. The granularity. The content of quartz, feldspar, and rock fragments within the sandstone was assessed by preparing thin sections to classify the sandstone petrography.
3.2. MICP Measurement
MICP tests were performed using a Micromeritics AutoPore IV 9620 Porosimeter (Micromeritics® Instruments, Norcross, GA, USA), with an initial injection pressure of 0.5 psi (0.0034 MPa), to determine the bulk density of the samples. The maximum intrusion pressure of 60,000 psi (413.7 MPa) was used to obtain the cumulative intrusion pore volume, which was then used to calculate the skeletal density and porosity of the samples. According to the Washburn equation (p = 2σ cos θ/r, where r is the pore-throat radius, p is the intrusion pressure, θ is the contact angle set at 130°, and σ is the surface tension set at 485 mN/m), the pore throat detected in the experimental pressure ranges from 340 μm to 3 nm. Before the MICP tests, six surfaces of each cubic sample were polished to reduce the pockmark effects during the test. A penetrometer with a capillary volume of 0.412 mL (measuring samples with porosity between 2% and 30%) was selected for the low-permeability sandstone sample.
3.3. CMI Test
CMI tests were performed on an ASPE-730 instrument (Micromeritics® Instruments, Norcross, GA, USA), using a constant rate of 5 × 10
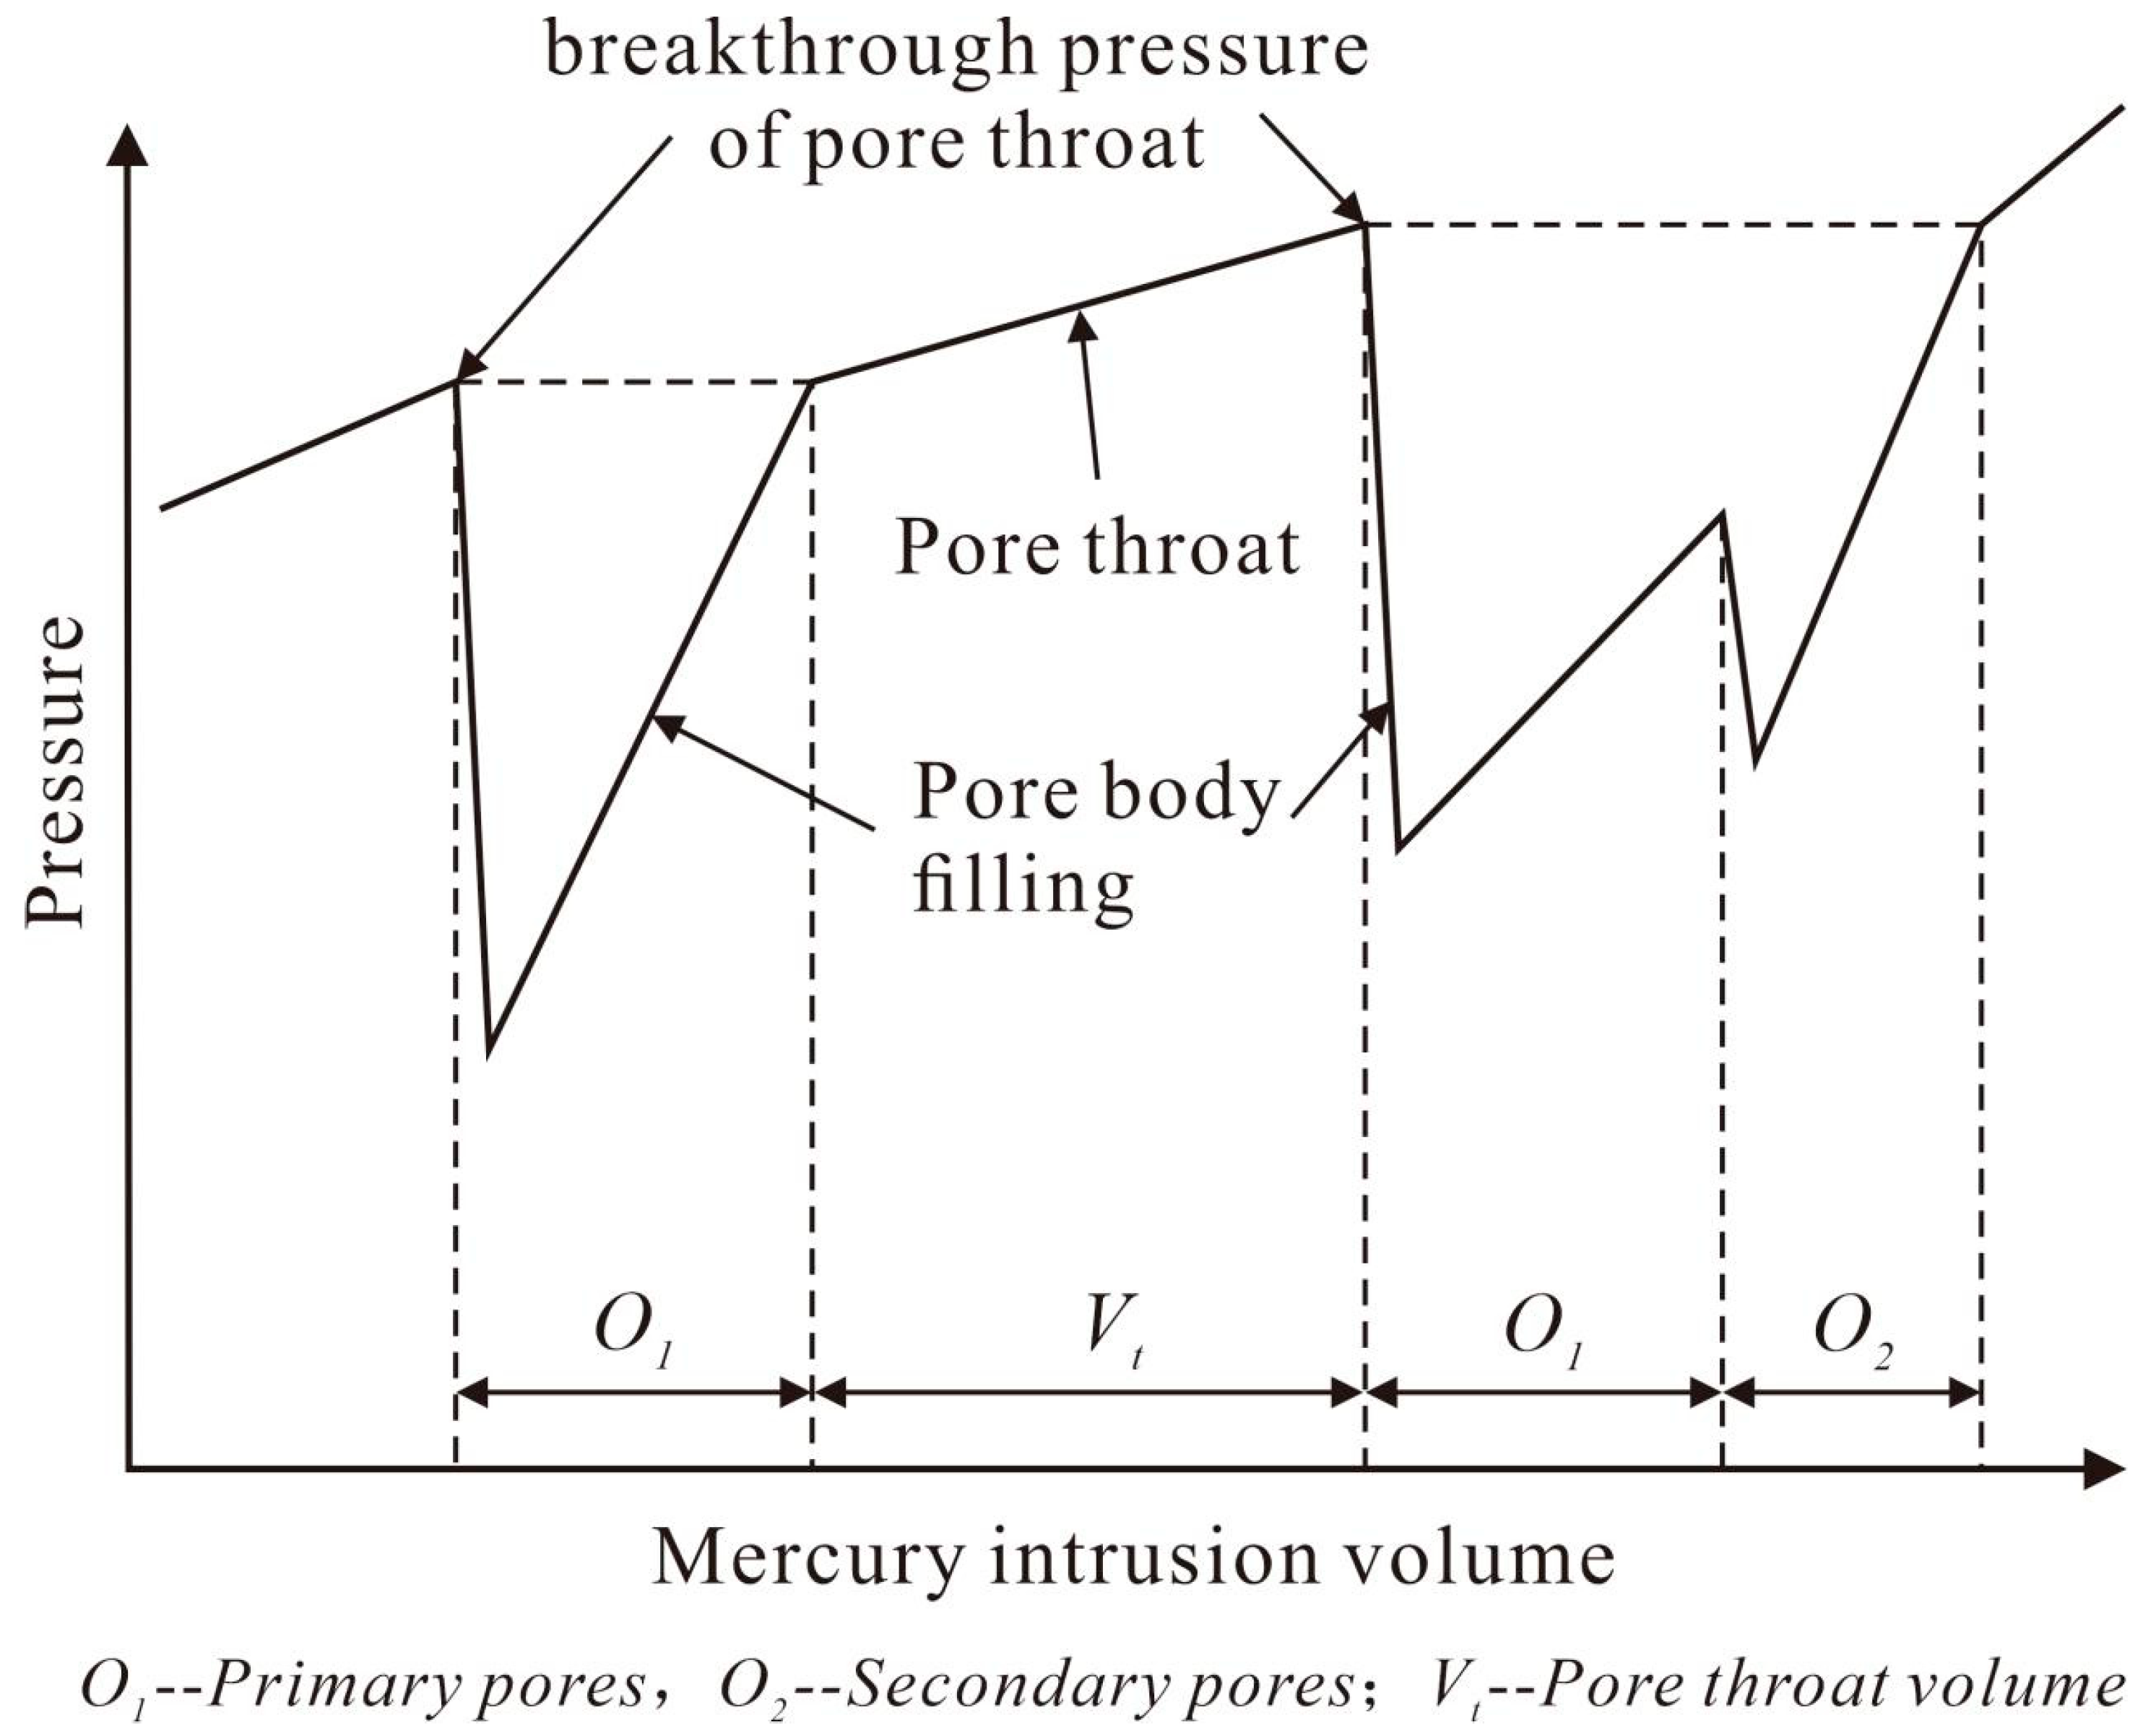
−5 mL/min to drive mercury into the sandstone sample in a quasi-static process, increasing the pressure from 0.7 psi to 900 psi, corresponding to a pore/throat range of 280 μm to 200 nm. The difference between CMI and MICP is that CMI can distinguish the distribution of pore size and throat size in sandstone samples through the change in pressure. When mercury fills the pore space through the throat, the pressure will decrease and fluctuate, and the increase in mercury intrusion resulting from the pressure jump corresponds to the pore volume (
Figure 4). Assuming that the pore is spherical in shape, the pore radius can be calculated, and the size distribution of tubular throat and spherical pore can be obtained.
Figure 3.
Core columnar diagram of the study area in Huizhou.
Figure 3.
Core columnar diagram of the study area in Huizhou.
Table 1.
Granularity, physical properties, and mineral components of low-permeability sandstone samples from the Eocene Wenchang Formation.
Table 1.
Granularity, physical properties, and mineral components of low-permeability sandstone samples from the Eocene Wenchang Formation.
| Sample | Depth
(m) | Granularity | Porosity
(%) | Permeability
(mD) | Whole-Rock X-Ray Diffraction (XRD)
(wt.%) | Clay Minerals in X-Ray Diffraction (XRD) (wt.%) |
|---|
| Quaztz | Feldspar | Calcite | Barite | Clays | I/S | I | K | C | %S |
|---|
| A-1 | 3820.15 | Pebbly, coarse-grained | 11.5 | 0.580 | 66 | 25 | 4 | 0 | 5 | 19 | 6 | 10 | 65 | 10 |
| A-2 | 3821.40 | Pebbly, coarse-grained | 13.4 | 1.060 | 62 | 23 | 7 | 0 | 8 | 18 | 5 | 7 | 70 | 10 |
| A-3 | 3823.50 | Inequigranular | 13.5 | 0.358 | 75 | 18 | 3 | 0 | 4 | 12 | 8 | 8 | 72 | 10 |
| A-4 | 3825.41 | Medium–coarse-grained | 15.1 | 0.723 | 71 | 19 | 3 | 0 | 7 | 25 | 27 | 8 | 40 | 10 |
| A-5 | 3828.12 | Coarse-grained | 7.8 | 0.144 | 48 | 30 | 14 | 2 | 6 | 7 | 8 | 12 | 73 | 10 |
| A-6 | 3830.86 | Inequigranular | 3.2 | 0.026 | 32 | 40 | 24 | 2 | 2 | 30 | 17 | 37 | 16 | 10 |
| A-7 | 3831.96 | Inequigranular | 7.2 | 0.039 | 50 | 39 | 4 | 2 | 5 | 15 | 8 | 12 | 65 | 10 |
| A-8 | 3833.68 | Inequigranular | 7.8 | 0.433 | 58 | 27 | 5 | 2 | 8 | 22 | 17 | 6 | 55 | 10 |
| A-9 | 3834.49 | Inequigranular | 14.1 | 0.113 | 62 | 27 | 7 | 0 | 4 | 11 | 16 | 14 | 59 | 10 |
| A-10 | 3837.43 | Coarse-grained | 11.4 | 0.230 | 70 | 24 | 2 | 0 | 4 | 17 | 13 | 10 | 60 | 10 |
Figure 4.
Schematic diagram of the constant-rate mercury injection (CRMI) principle.
Figure 4.
Schematic diagram of the constant-rate mercury injection (CRMI) principle.
3.4. FE-SEM Observation After WM Impregnation
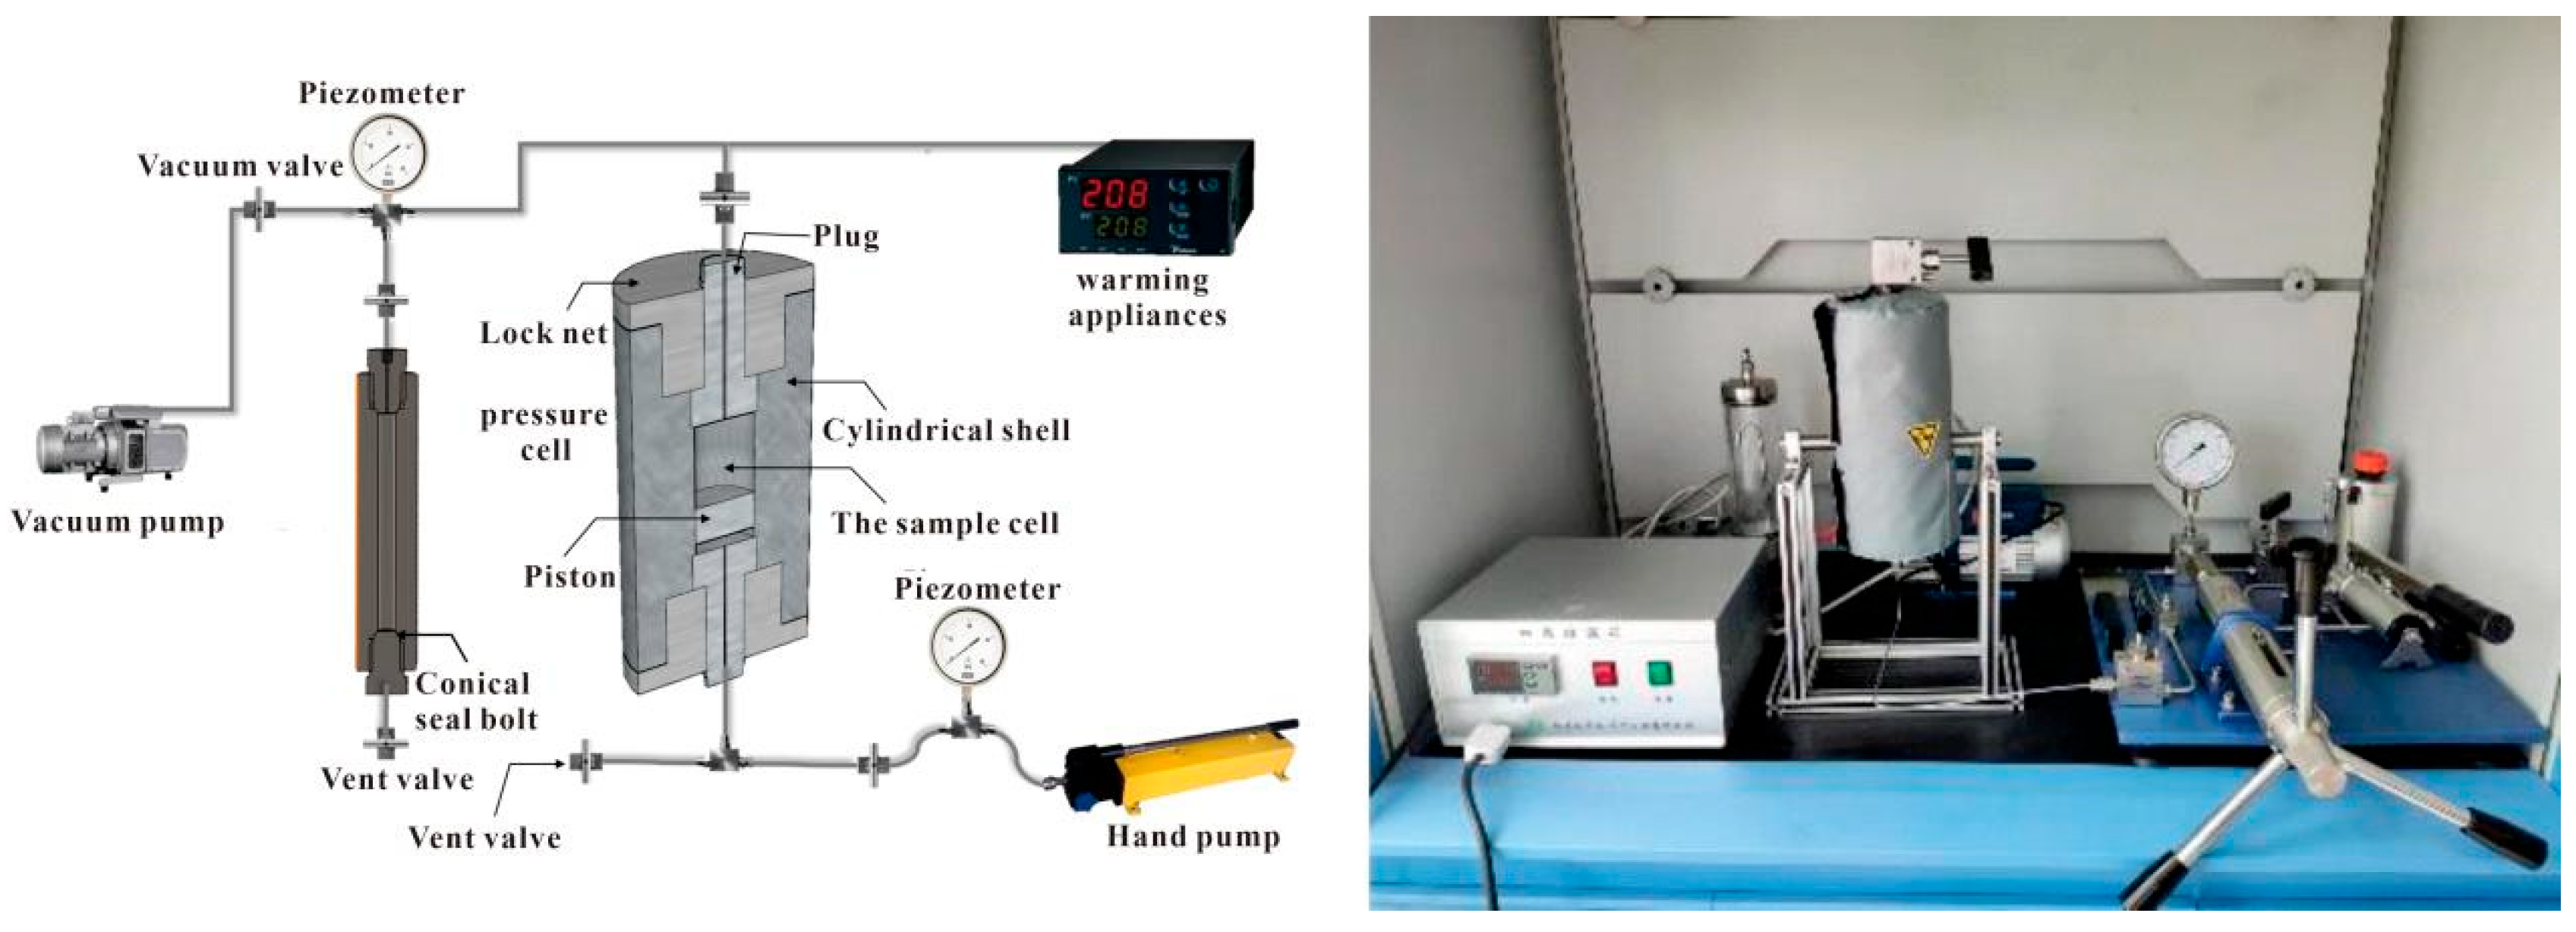
The WM impregnation experiments were performed using a self-developed WM injection apparatus (
Figure 5) at the State Key Laboratory of Continental Shale Oil, affiliated with Northeast Petroleum University. The oven-dried cubic sample and WM were placed in the high-pressure sample cell of the WM injection apparatus, which was heated to 110 °C under vacuum conditions to melt the WM (melting point: 80 °C) and wrap the sample. Then, the pressure in the high-pressure sample cell was increased by a hand pump at a rate of 3 MPa/min to 200 MPa and maintained at maximum pressure for one hour to fill the pore space of the sample with the liquid WM. After that, the sample cell was cooled to room temperature while maintaining a pressure of 200 MPa, allowing WM to solidify in the pore space of the sample. Finally, removed from the high-pressure cell after depressurization to ambient conditions and cut in half from the middle to obtain the internal surface of the sample (1 cm
2), the WM (40% Bi; 30% Sn; 20% Pb; 10% Cd) used in this study had a surface tension of 420 mN/m in the molten state and a contact angle of 110° on the sample surface. Therefore, according to the Washburn equation, the lower limit of pore throat that can be injected into WM at 200 MPa is approximately 3 nm.
To obtain a smooth surface for FE-SEM observation and AMICS analysis, the observation surface was polished using an argon-ion polisher (Ilion+ II, Model 697, GATAN) at 50 °C, with liquid nitrogen used to prevent the WM from melting. The smooth surfaces were imaged and analyzed for minerals using a field-emission FEI Quanta 650 scanning electron microscope (SEM) equipped with energy-dispersive X-ray spectroscopy (EDS). The FE-SEM images were quantitatively analyzed using ImageJ (V1.8.0.112) software to obtain pore structure information of the sandstone.
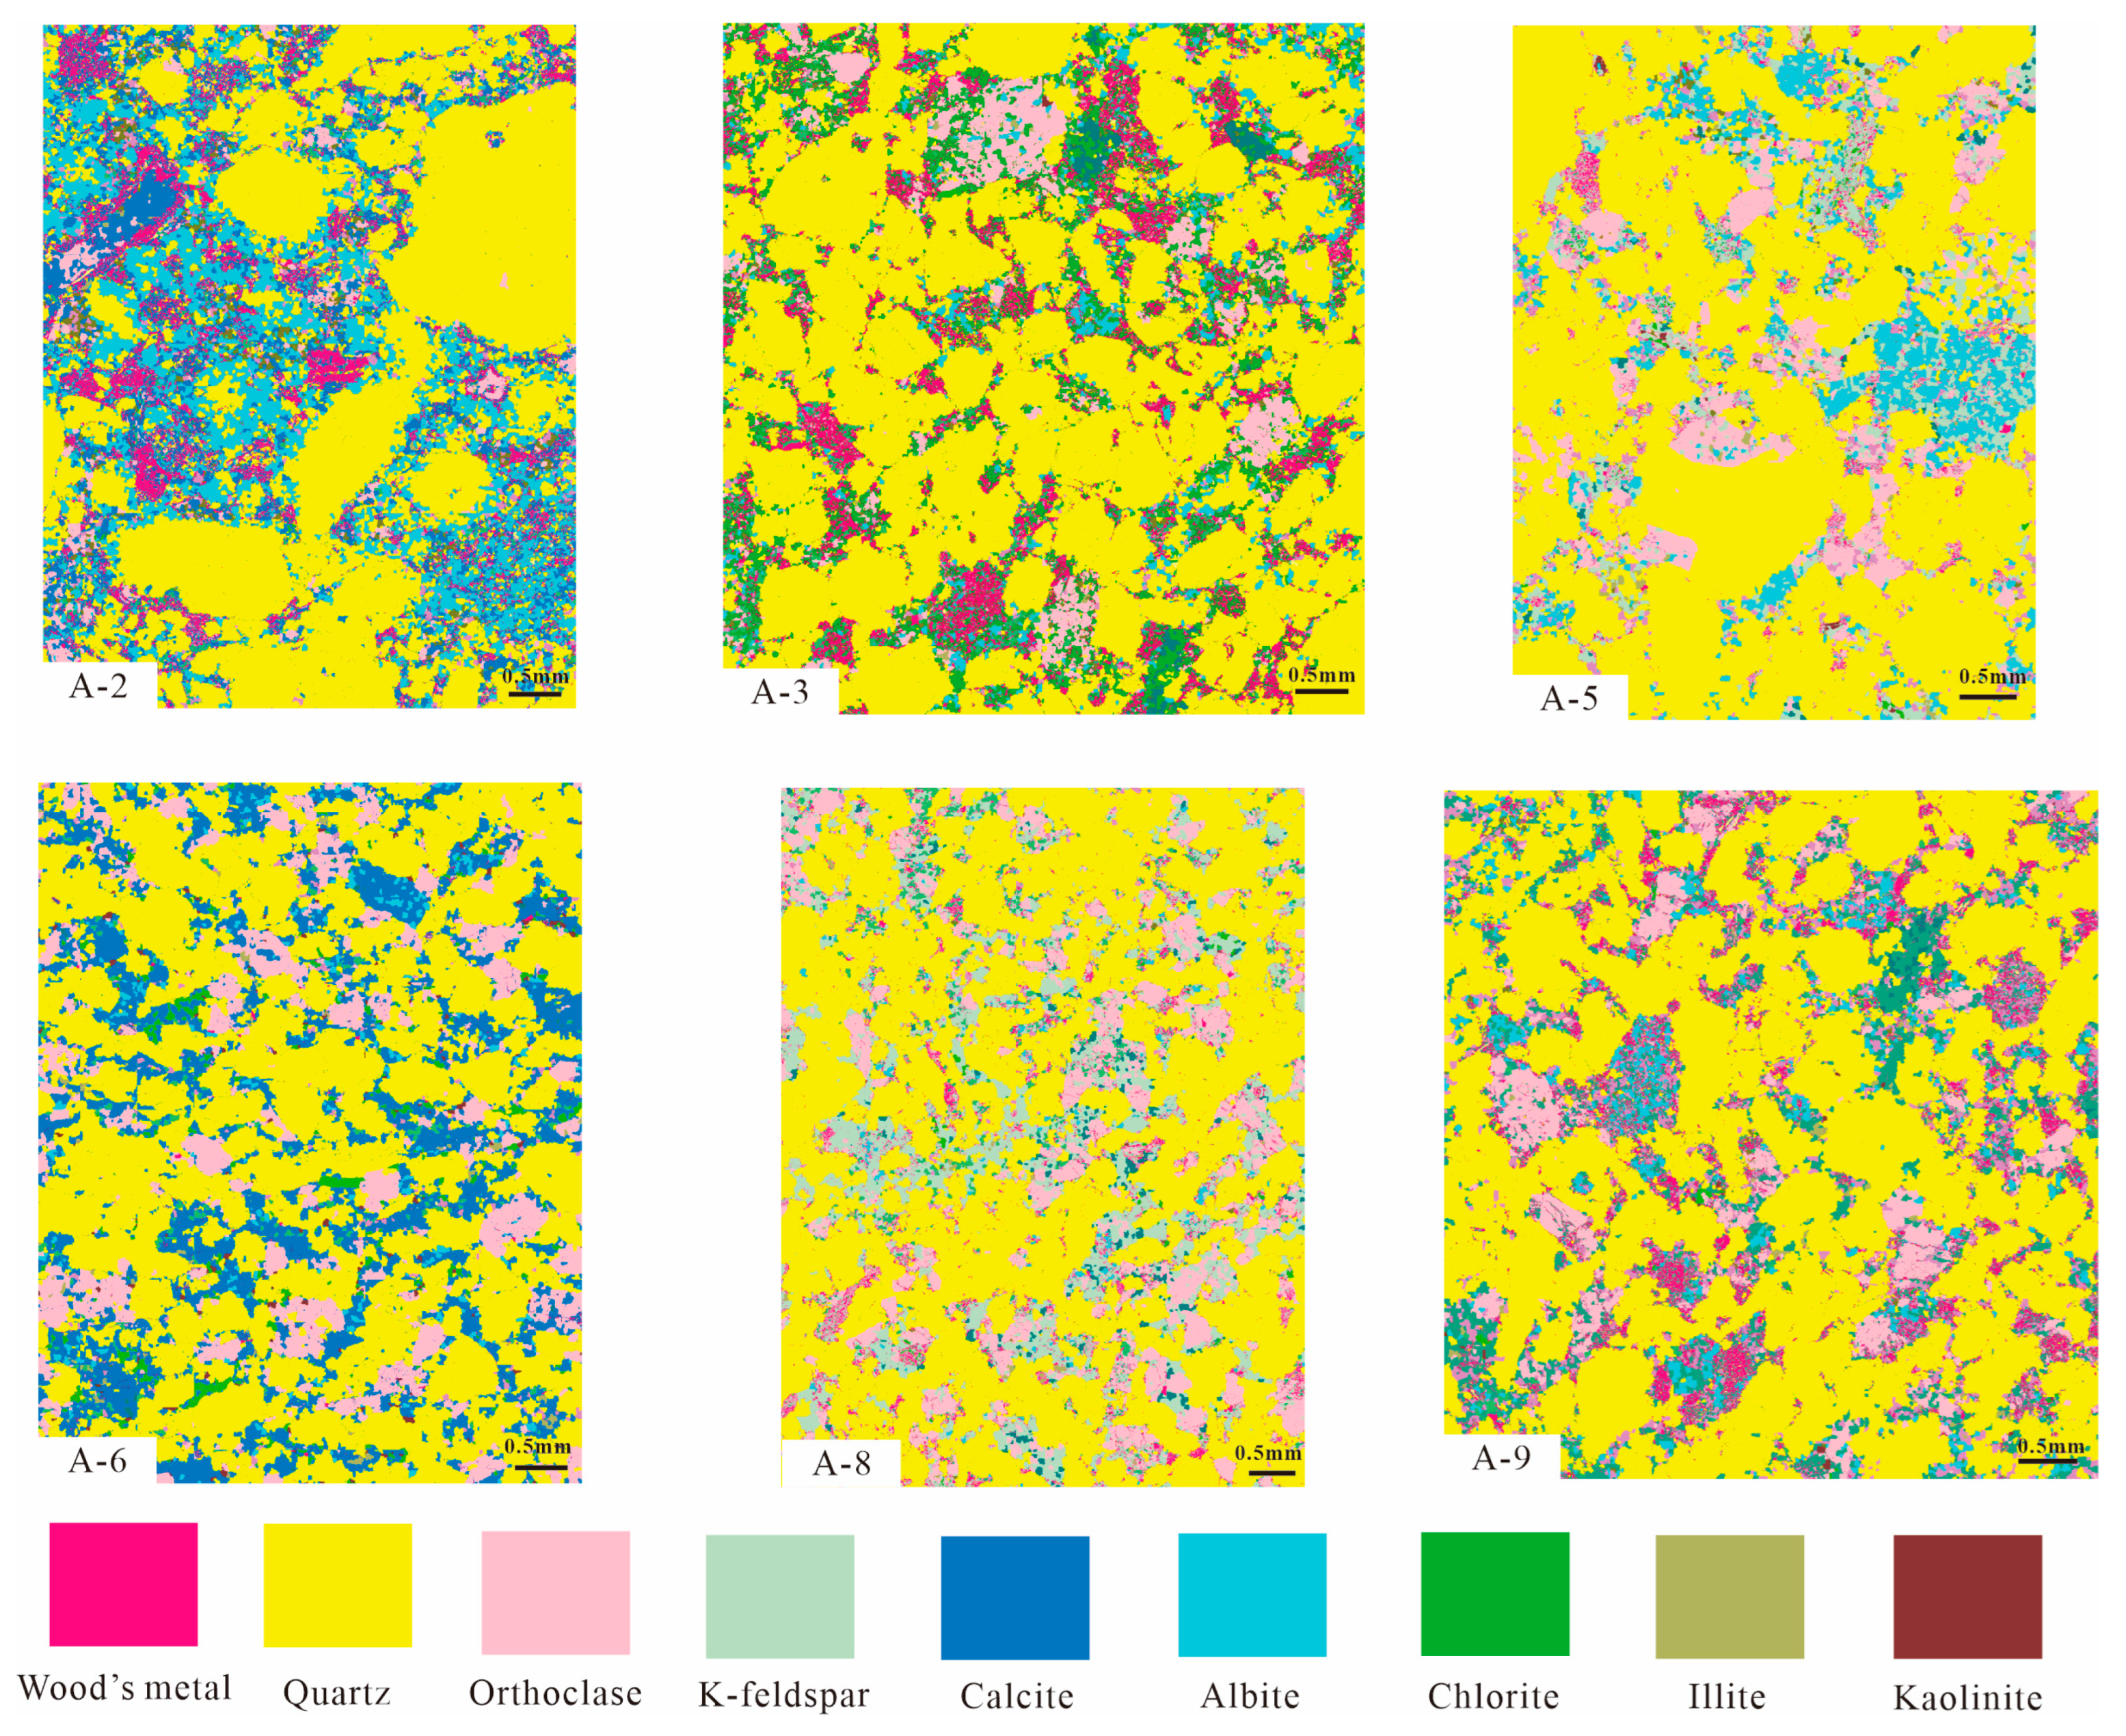
AMICS analysis can identify mineral components and fill WM by scanning the smooth surface of the sample. AMICS analysis was performed using a Zeiss Sigma 300 FE-SEM (Carl Zeiss AG, Oberkochen, Germany), combined with a Bruker Xflash 6/60 energy-dispersive X-ray spectroscopy (Bruker, Berlin, Germany), to quantitatively characterize the components of the sample surface with a resolution of 1 μm. Because the pebbly, coarse-grained sandstone contains grains larger than 2 mm in size, the field-of-view area scanned by the sample is greater than 25 mm2 to represent the overall characteristics of the sample. The associative relationship between the WM filling pores and minerals, as well as the contact relationship between different minerals, can be visualized and quantified using AMICS analysis.
4. Results
4.1. Petrological and Mineralogical Characteristics
The grain size, physical properties, and mineral composition of 10 samples from well A are detailed in
Table 1. Although the samples are from a narrow range of depths, there is considerable variation in porosity and permeability, ranging from 3.2% to 14.1% and from 0.026 mD to 1.060 mD, respectively. The average porosity is 10.5%, with an average permeability of 0.3706 mD. These results indicate that the interval in well A exhibits significant heterogeneity and is characteristic of a typical low-porosity, low-permeability reservoir.
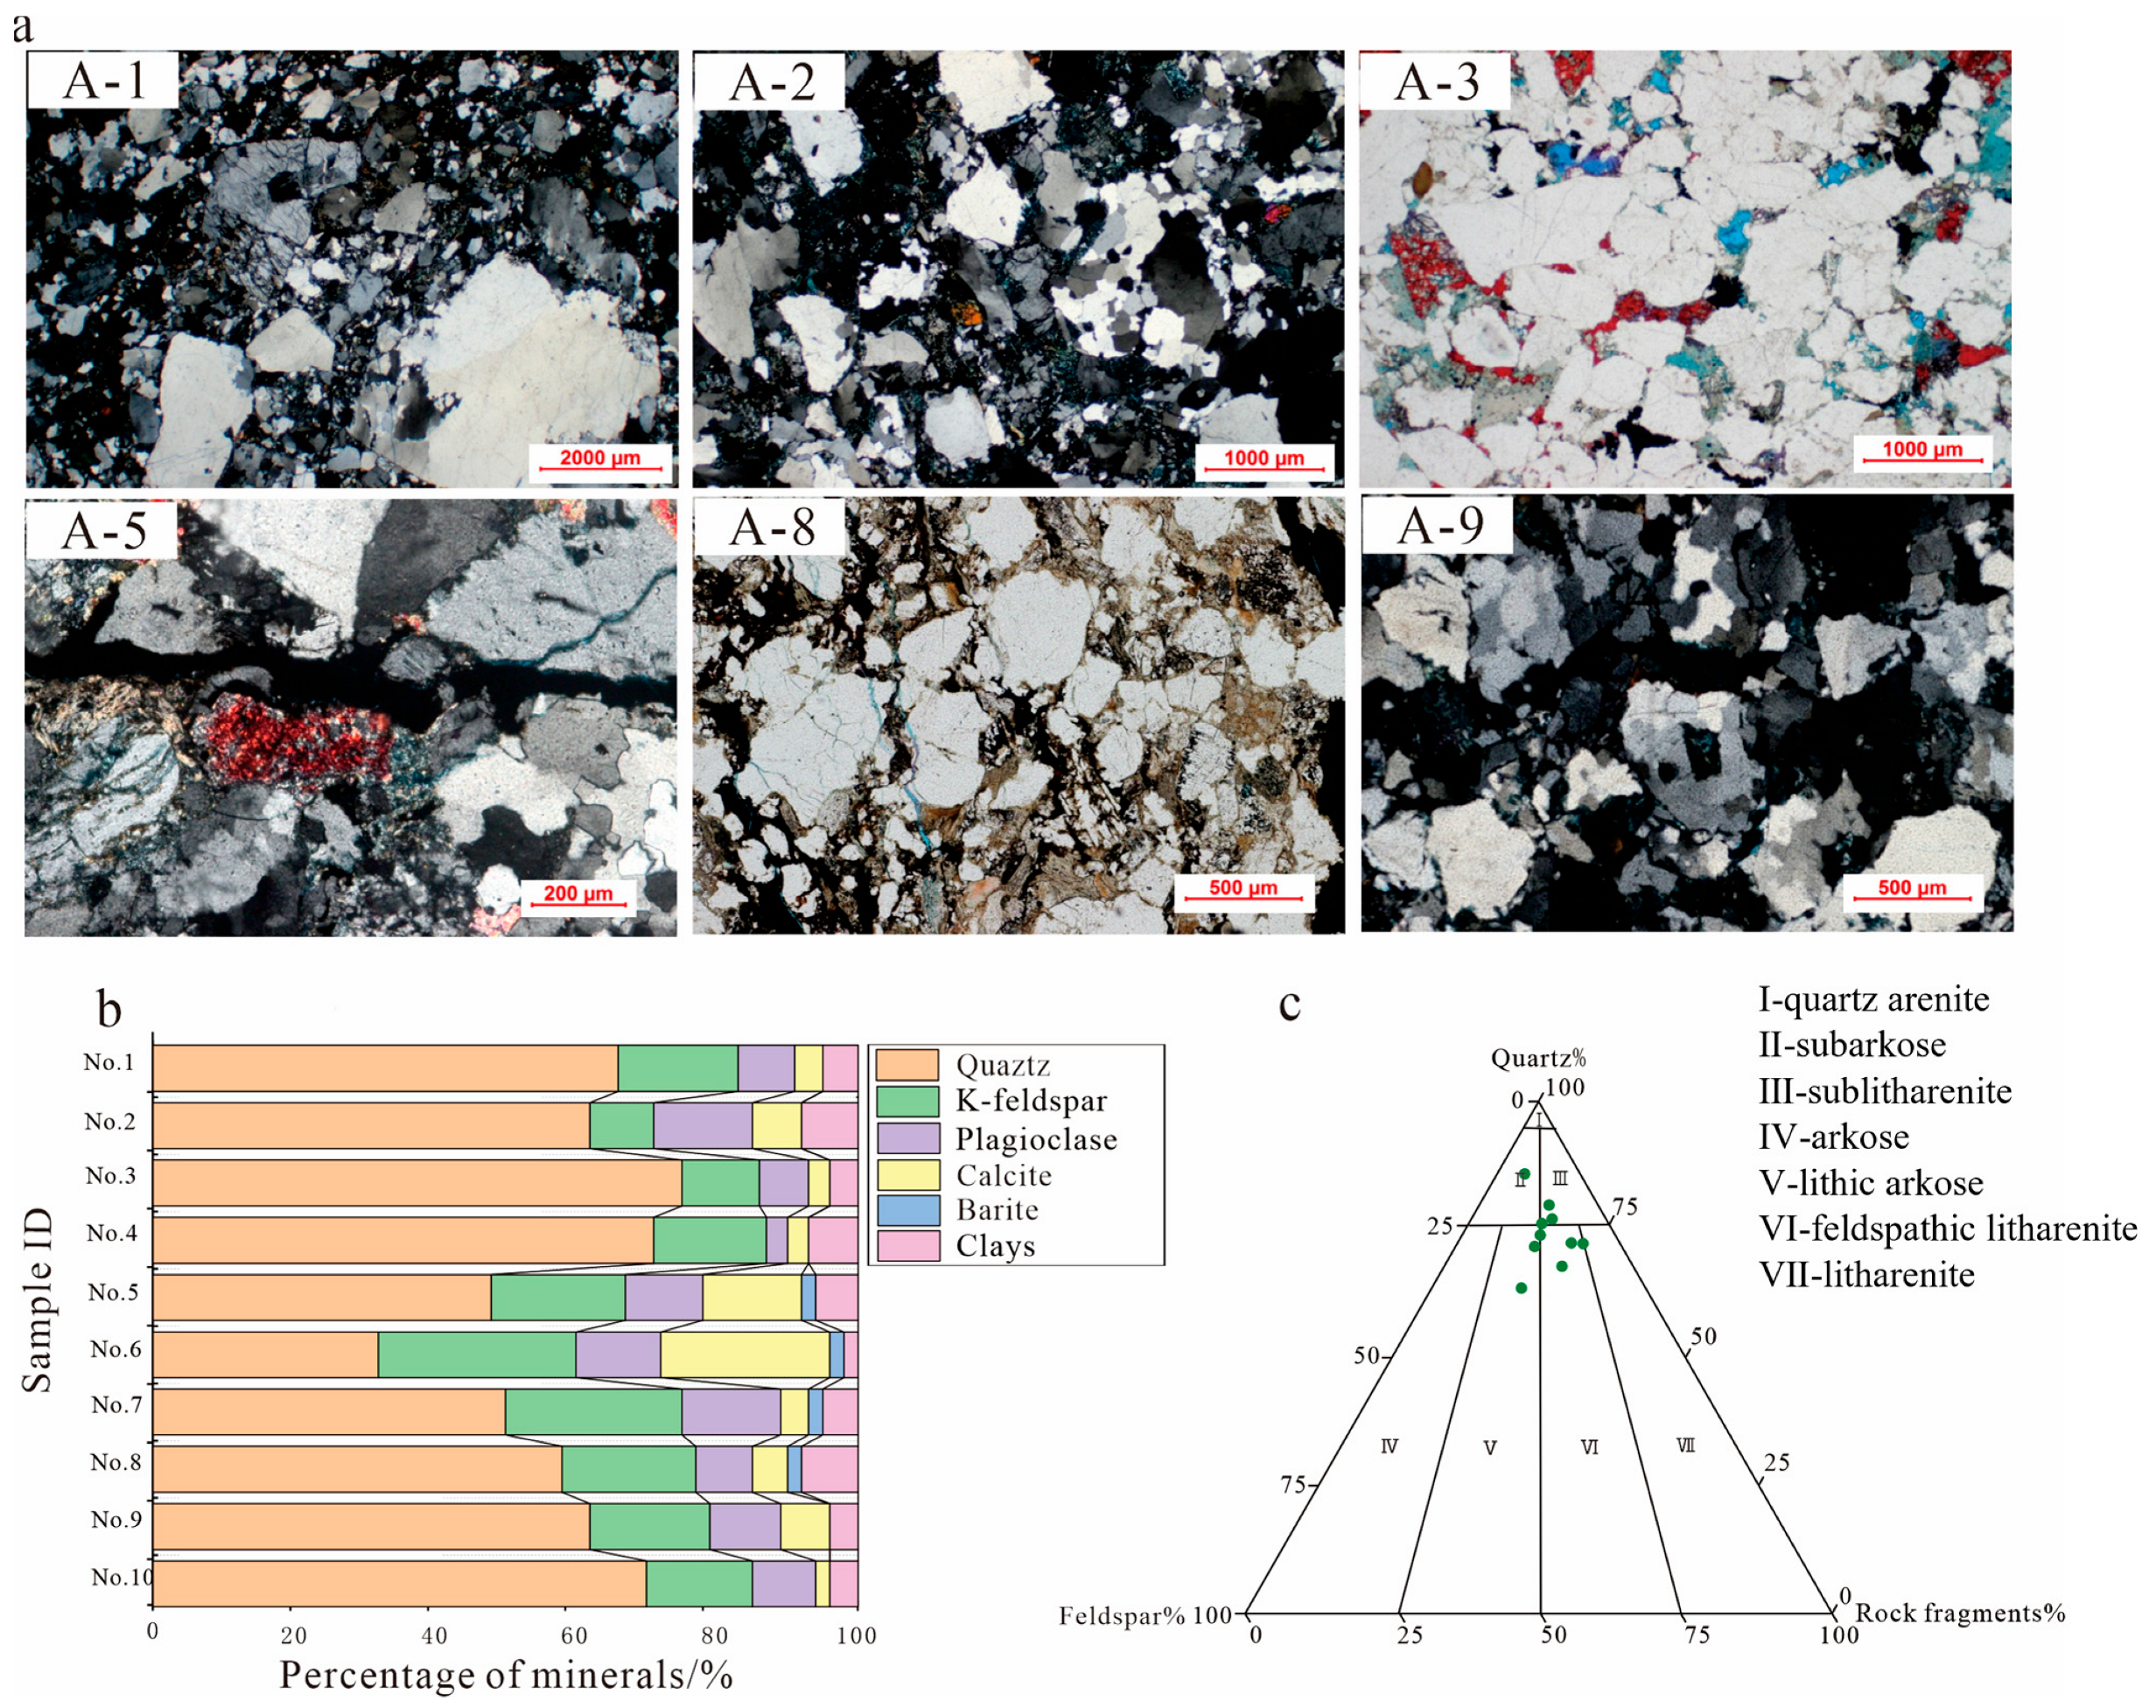
Figure 6 presents the results of whole-rock mineral analysis. The data indicate that quartz is the predominant mineral component, with its content ranging from 32 wt.% to 75 wt.% and an average content of 59.4 wt.%. Additionally, the feldspar content varies from 13 wt.% to 40 wt.%, with most samples containing a higher proportion of K-feldspar than plagioclase. Samples exhibited calcite contents ranging from 2 wt.% to 24 wt.%, with those having higher calcite contents typically exhibiting lower quartz levels. Barite was present only in the four samples with the lowest quartz content, at 2 wt.%; it was absent from all other samples.
The clay mineral content is relatively low, ranging from 2% to 8%, with an average content of 5.3%. Through thin-section observation and statistical analysis of rock composition (
Figure 6a), combined with Folk’s classification scheme [
22], the lithologies of Wenchang low-permeability sandstone reservoirs mainly consist of lithic arkose and feldspathic litharenite, with a small amount of sublitharenite (
Figure 6c).
4.2. MICP
The structural parameters of the pore throats of the 10 sandstone samples in the study area for the MICP experiment are shown in
Table 2. The porosity ranges from 3.19% to 14.09%, with an average of 9.285%, which is generally lower than that of helium porosity (
Table 1) because the pore throats of MICP tests range from 7.25 nm to 105.00 μm. The range of the pores of from the helium porosity tests is much larger than the pore-throat interval of the MICP tests. The displacement pressures of the 10 samples were significantly different, with discharge pressures ranging from 0.16 MPa to 0.67 MPa. The maximum mercury saturation and mercury withdrawal efficiency reflect the reservoir’s collectability and connectivity. The average maximum mercury saturation in the study area is 89.9%, which is higher than that of conventional low-permeability reservoirs, indicating that the study area has better hydrocarbon storage capacity. The average mercury withdrawal efficiency is 22.6%, reflecting the relatively poor pore connectivity of the reservoir in the study area.
In this study, the pore-throat structures of ten sandstone samples from the study area were quantitatively analyzed using high-pressure mercury intrusion porosimetry (MICP), and fractal theory was employed to calculate the fractal dimension (D) to distinguish between different types of pore structures.
4.2.1. Determination of Total Pore Volume
The total pore volume () of the samples was determined using helium porosity. Due to its small atomic radius, helium can effectively penetrate even the finest pores within the sample, precisely measuring the total pore volume. This method ensures that the volume of all connected pores is accurately determined, providing a reliable basis for subsequent mercury saturation calculations.
4.2.2. Calculation of Mercury Saturation
During the MICP experiment, mercury is incrementally intruded into the pore system of the samples by applying increasing pressure, and the corresponding mercury intrusion volume (
) is recorded at each pressure point. The mercury saturation (
) at a given pressure
is defined as the ratio of the mercury-occupied pore volume to the total pore volume, and it is calculated using the following equation:
where
is the cumulative mercury intrusion volume at pressure,
; and
is the total pore volume measured by helium porosity.
4.2.3. Calculation of Fractal Dimension
The relationship between mercury saturation () and pressure was transformed into a linear relationship in a logarithmic coordinate system, expressed as versus .
The slope of the linear fit obtained through this transformation is the negative of the fractal dimension,
:
where
C is a constant; and the magnitude of the fractal dimension,
, reflects the self-similarity and complexity of the pore-throat structure.
4.2.4. Segmented Linear Fitting
In the MICP experiments, the mercury saturation curves typically exhibit multiple linear segments across different pressure ranges. To accurately describe the fractal characteristics of pore throats at different scales, the curves were subjected to segmented linear fitting, and the fractal dimension, D, was calculated for each segment. This segmented approach allows for the differentiation of pore-throat structural features under varying pressure conditions, providing a more detailed quantification of reservoir heterogeneity.
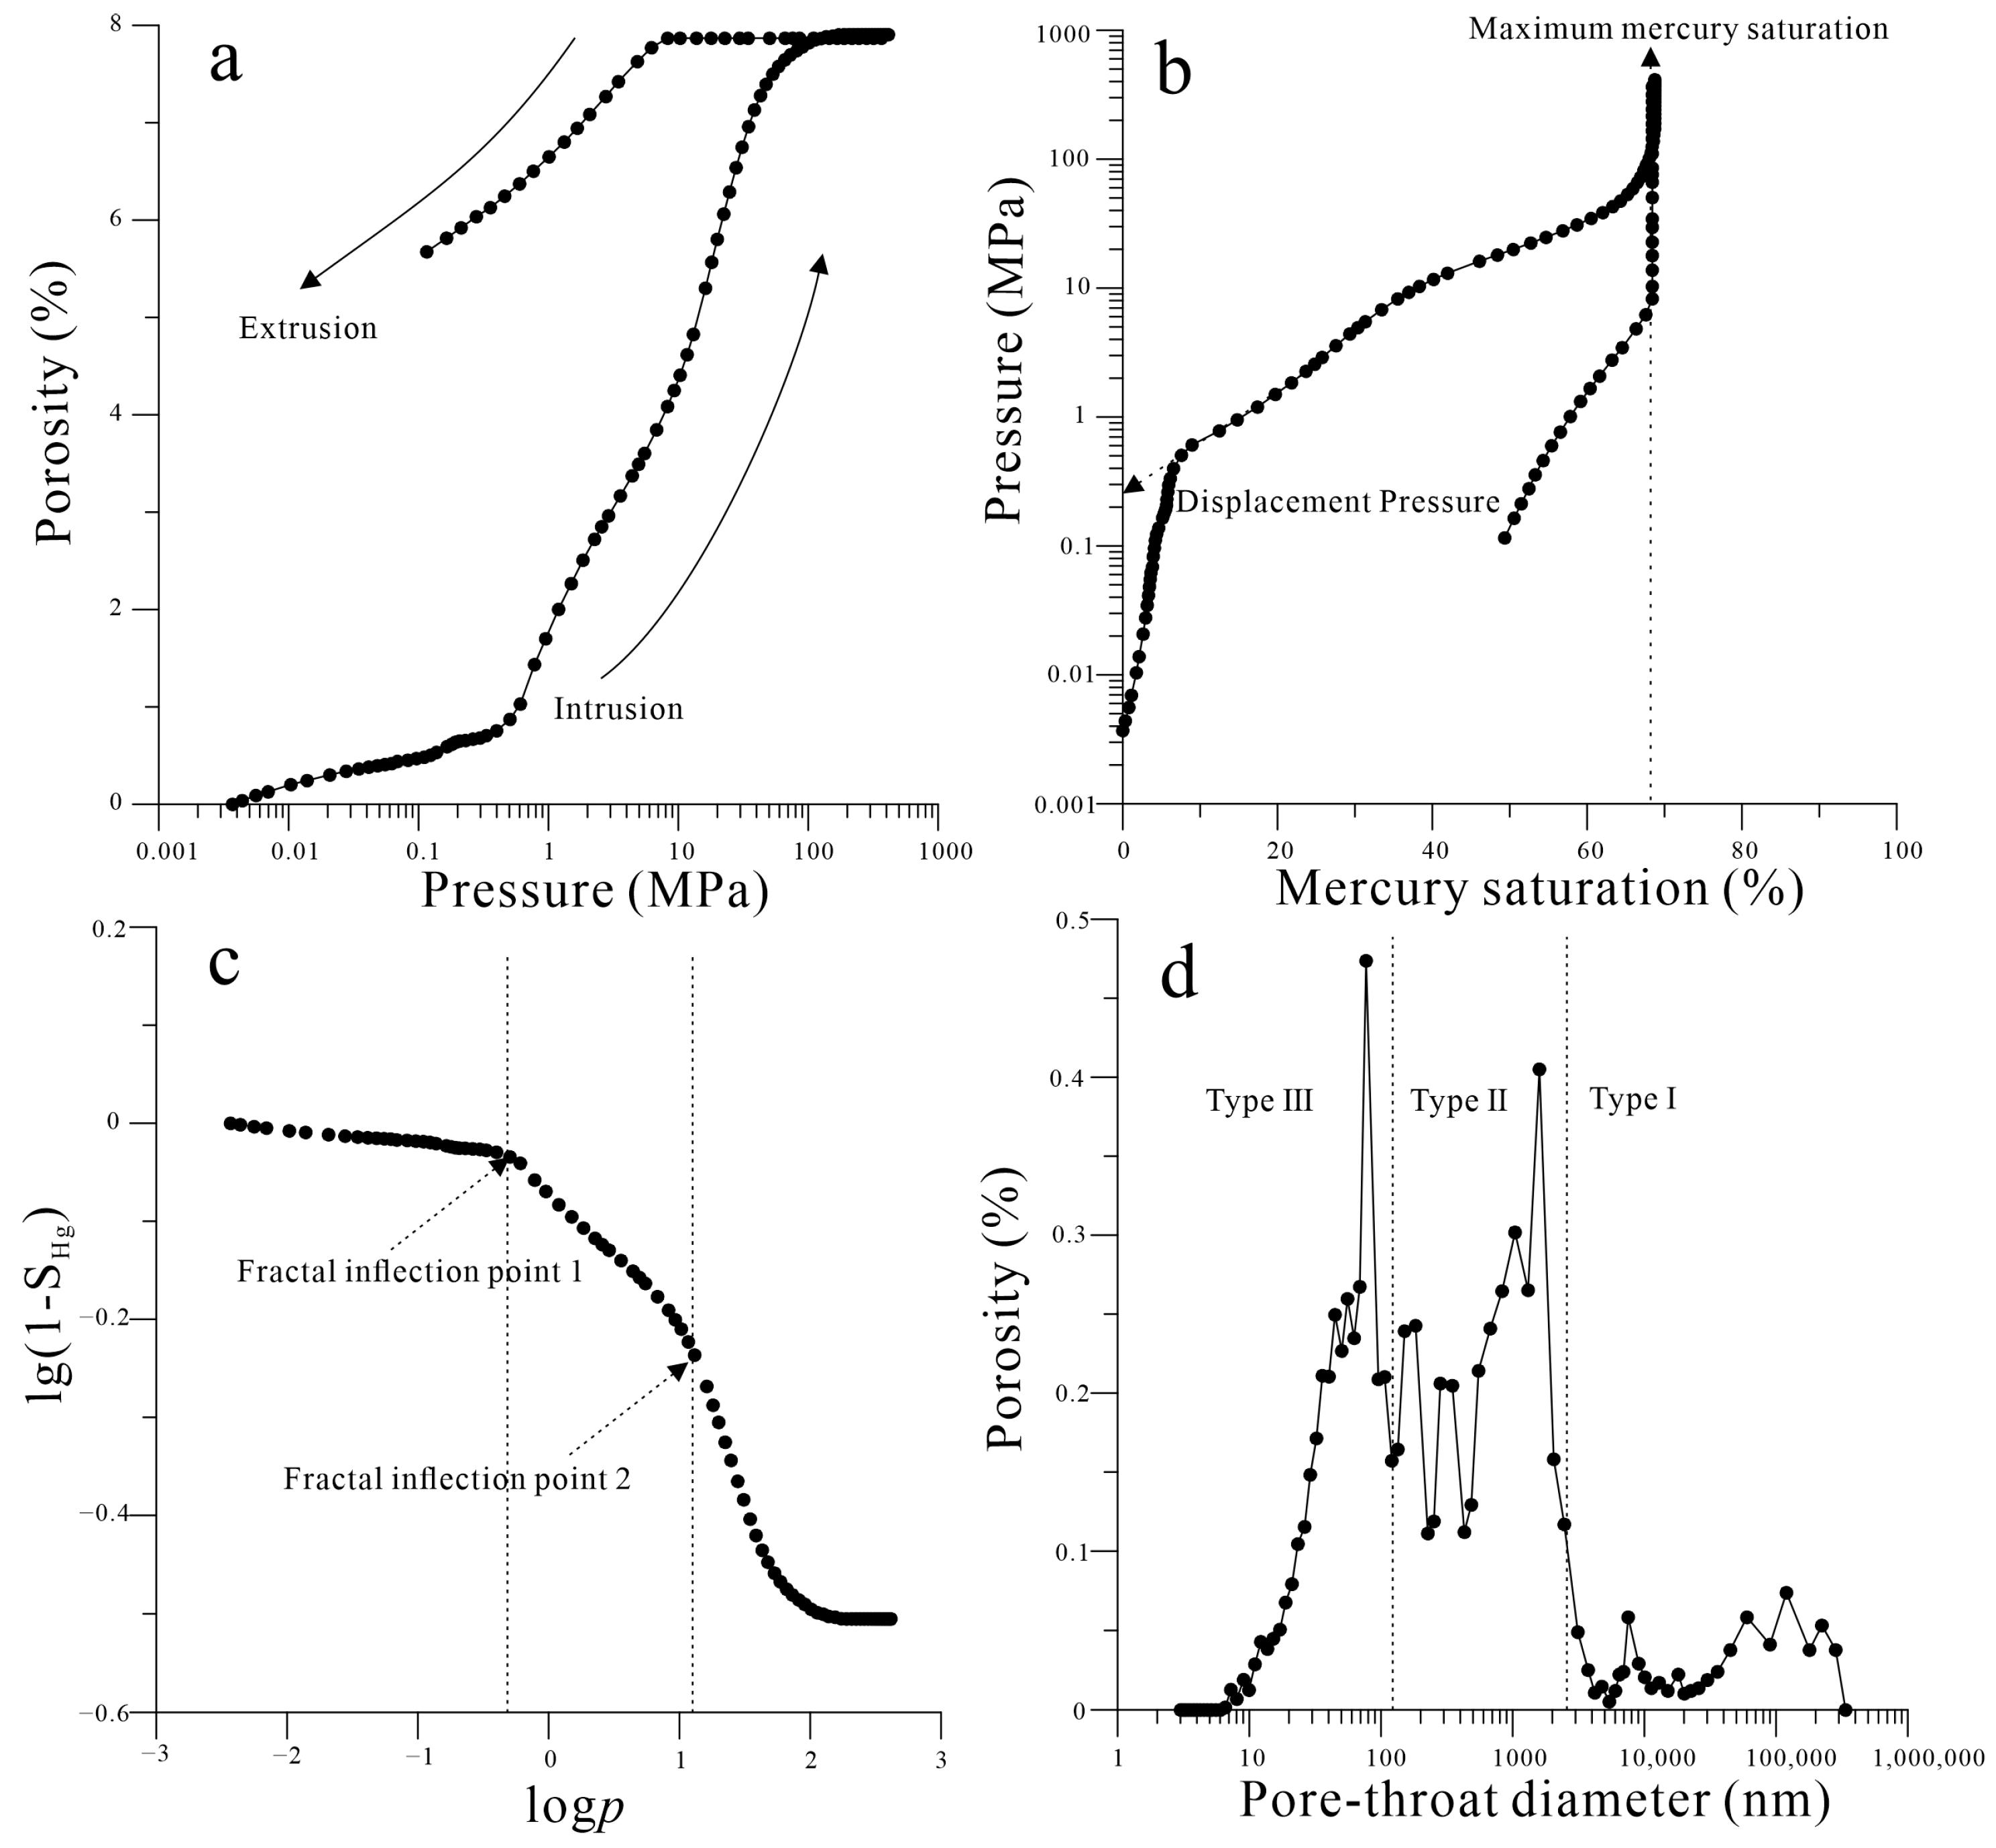
Figure 7a presents the mercury intrusion and extrusion curves for a representative sandstone sample from the ten samples collected from the Huizhou area. The high-pressure mercury intrusion experiment was conducted within a pressure range of 0.0069 MPa to 101 MPa, and the sample exhibited a porosity of 7.91%. The figure also reveals a mercury withdrawal efficiency of 28.22% for this sample.
Based on the porosity measurements obtained from mercury intrusion porosimetry and helium porosimetry, the capillary pressure curve of the sample was generated, as illustrated in
Figure 7b. The analysis indicates that the sample’s maximum mercury saturation reached 67.78%, with a displacement pressure of 0.25 MPa.
Analysis of the fractal characteristic curve in
Figure 7c reveals that the sample exhibits a distinct tri-segmental distribution pattern, with each segment corresponding to a distinct fractal dimension value. This tripartite structure demonstrates that the pore space can be divided into three distinct systems. The application of the Washburn equation enables the quantitative determination of throat diameters corresponding to each pressure stage, with the ranges of the three throat types illustrated in
Figure 7d.
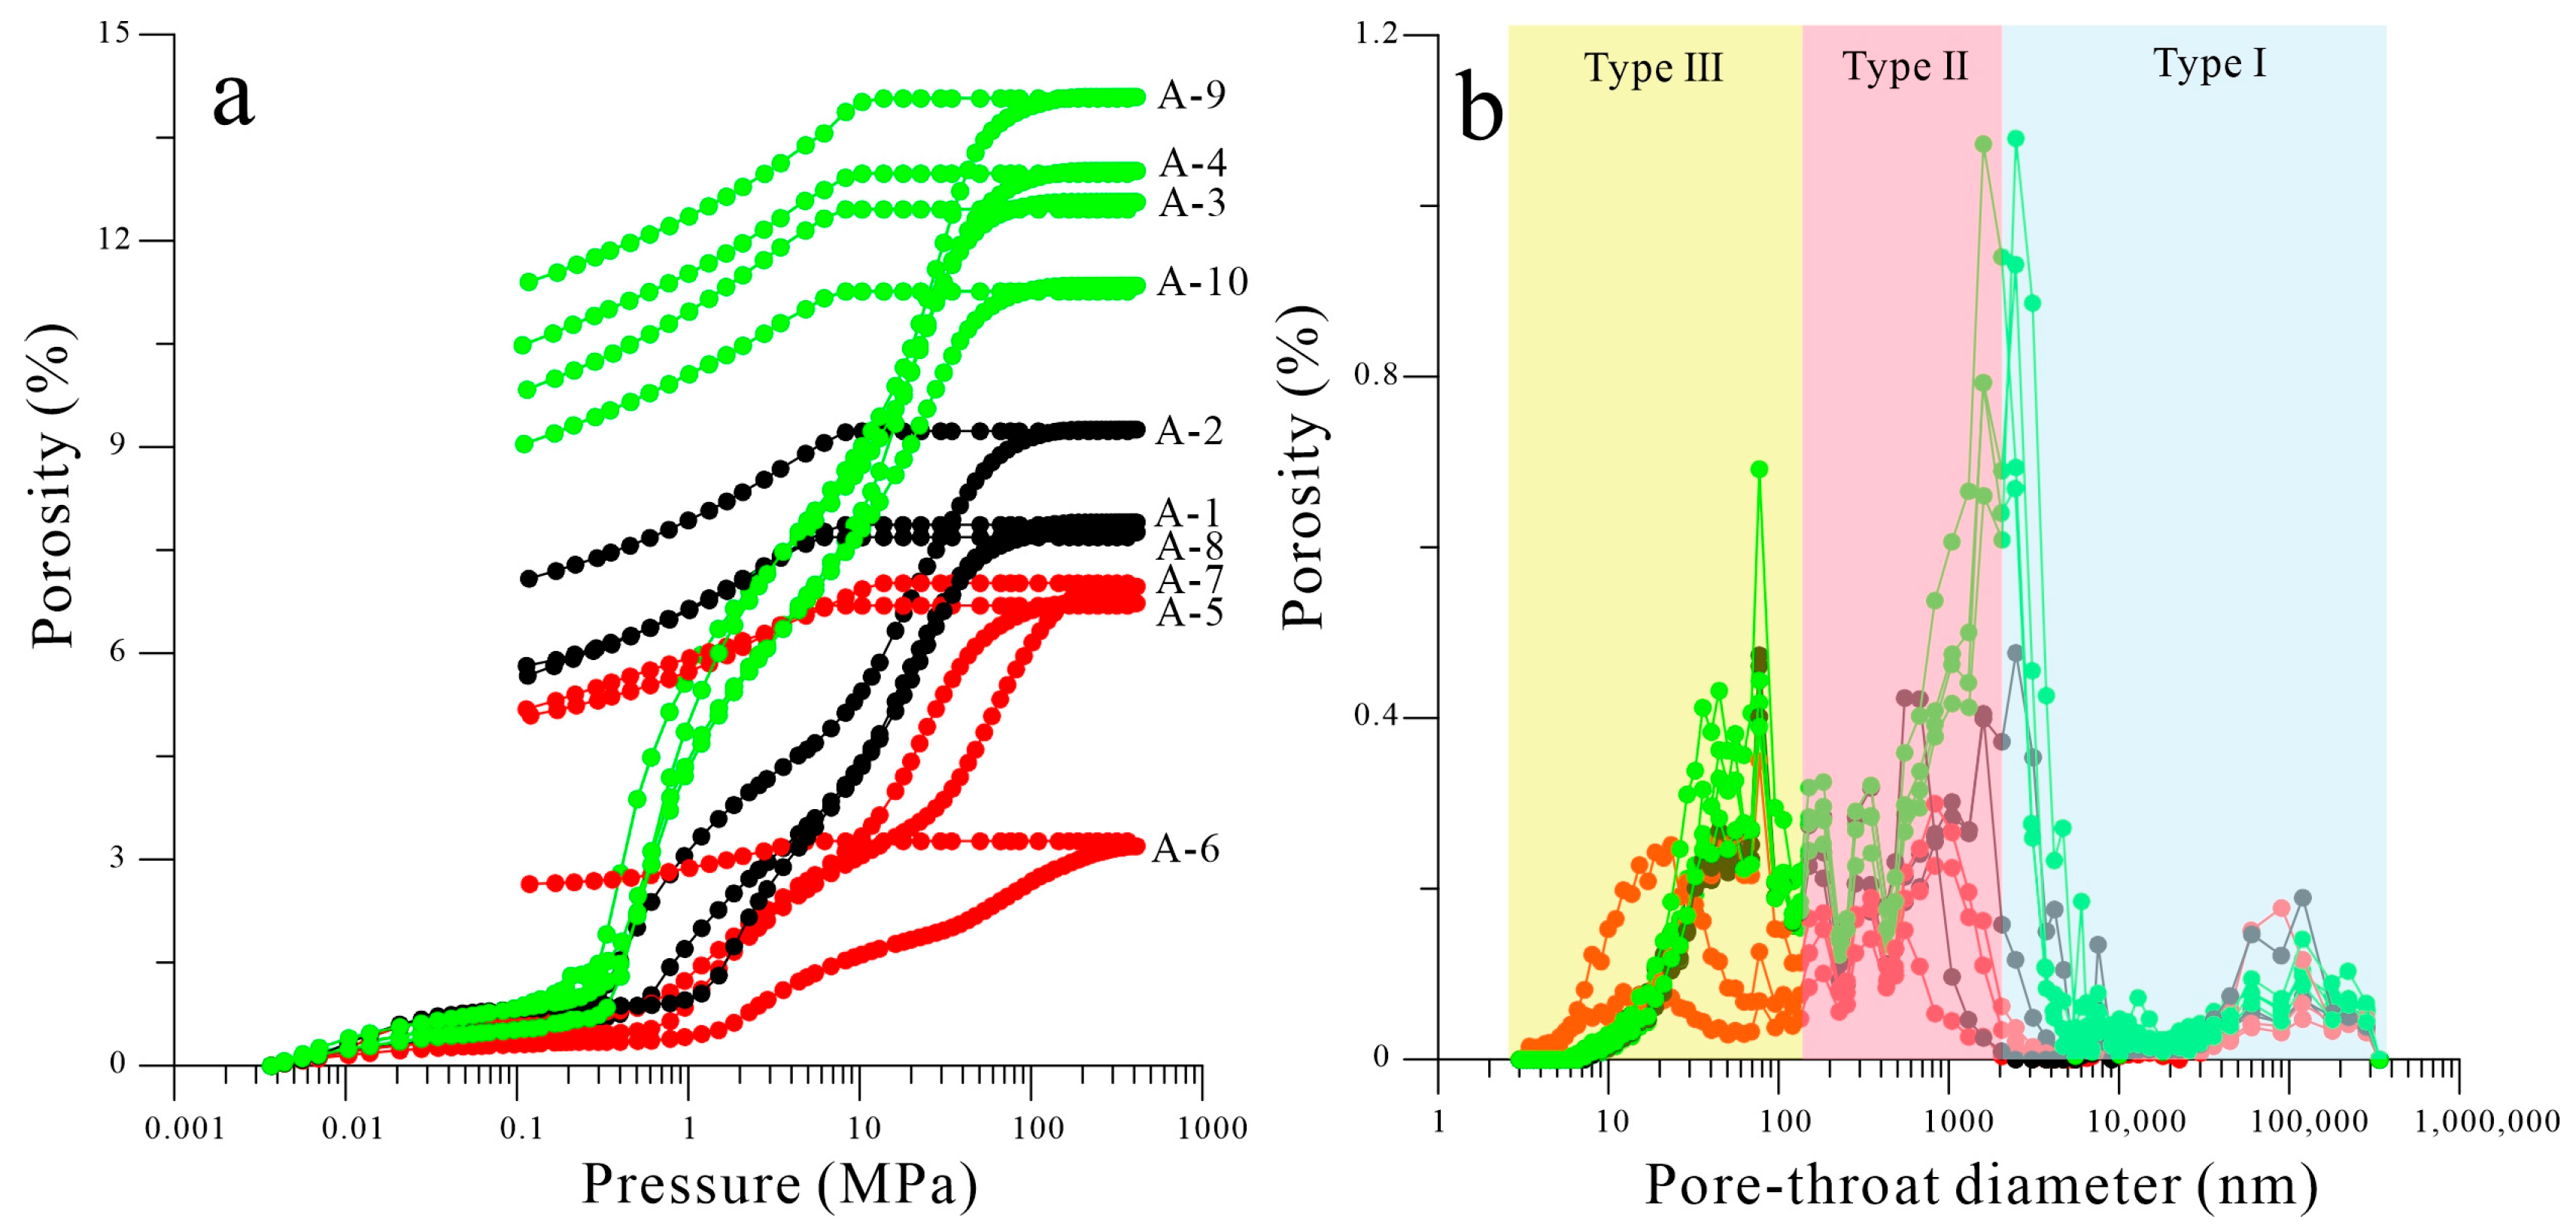
The pore structures in the study area can be classified into three main types based on the proportional distribution of different pore types. The first type (type I) is characterized by intergranular pores (Samples 3, 4, 9, and 10), which exhibit significantly higher porosity, greater cumulative mercury intrusion, and lower displacement pressure, indicating better connectivity and, consequently, higher permeability. The second type (type II) exhibits a dual-porosity system with both intergranular and intragranular pores (Samples 1, 2, and 8), showing moderately lower porosity and cumulative mercury intrusion than the first type, along with a relatively uniform pore size distribution that reflects a balanced bifractal structure. The third type (type III) is primarily controlled by intragranular pores (Samples 5, 6, and 7), demonstrating the lowest cumulative mercury intrusion and porosity (
Figure 8). Due to the small and irregularly distributed pore-throat diameters, this type exhibits the poorest connectivity, resulting in the lowest permeability.
4.3. CMI
The figure illustrates the Hg intrusion curves from CMI tests of six sandstone samples (including pores, throats, and total pores). The pressure profiles can be categorized into three types based on the intrusion characteristics of Hg in the pores. In the first type of samples, the total intrusion curves show a short “plateau trend” in the low-pressure stage, during which most of the Hg enters into the pores, and only a small portion of the Hg enters into the throats (
Figure 9a,b), suggesting that the pore types of this type of sample belong to the category of “large pores and narrow throats”, and the pores are mainly composed of large pores with narrow throats. This indicates that the pore type of these samples belongs to “large pores and narrow throats”, and the pores are mainly dominated by intergranular pores, and in the stage of pressure rise, the mercury only enters into the smaller pores and throats. The second type of samples and the first type of samples have a similar plateau area, but the second type of samples has less pore space, and the mercury mainly enters into the throat during the pressure-rise stage, indicating that the pore type belongs to the “medium pore space and narrow throat”, and the pore space consists of a small portion of intergranular pores and a portion of intragranular pores (
Figure 9c,d). In the third type of samples, there is no plateau period, and Hg enters the throat only when the pressure reaches a certain level. The pore type of the third type of samples belongs to the “narrow throat with small pores”, and there is no obvious difference between the pore body and the throat, indicating that the pore related to the intragranular pores is dominant (
Figure 9e,f).
4.4. FE-SEM Observation and AMICS Analysis After WM Impregnation
The Wenchang Formation sandstone samples are predominantly composed of quartz (32–75%), feldspar (18–40%), and calcite (3–24%), which together account for over 90% of the mineral content. In addition, the clay minerals are primarily smectite mixed-layer (I/S), kaolinite, and chlorite, with chlorite being the most abundant (except for sample A-6, with an average proportion of approximately 66%). A high proportion of chlorite is a typical characteristic of low-permeability sandstone. According to the scanning electron microscopy (SEM) analysis results (
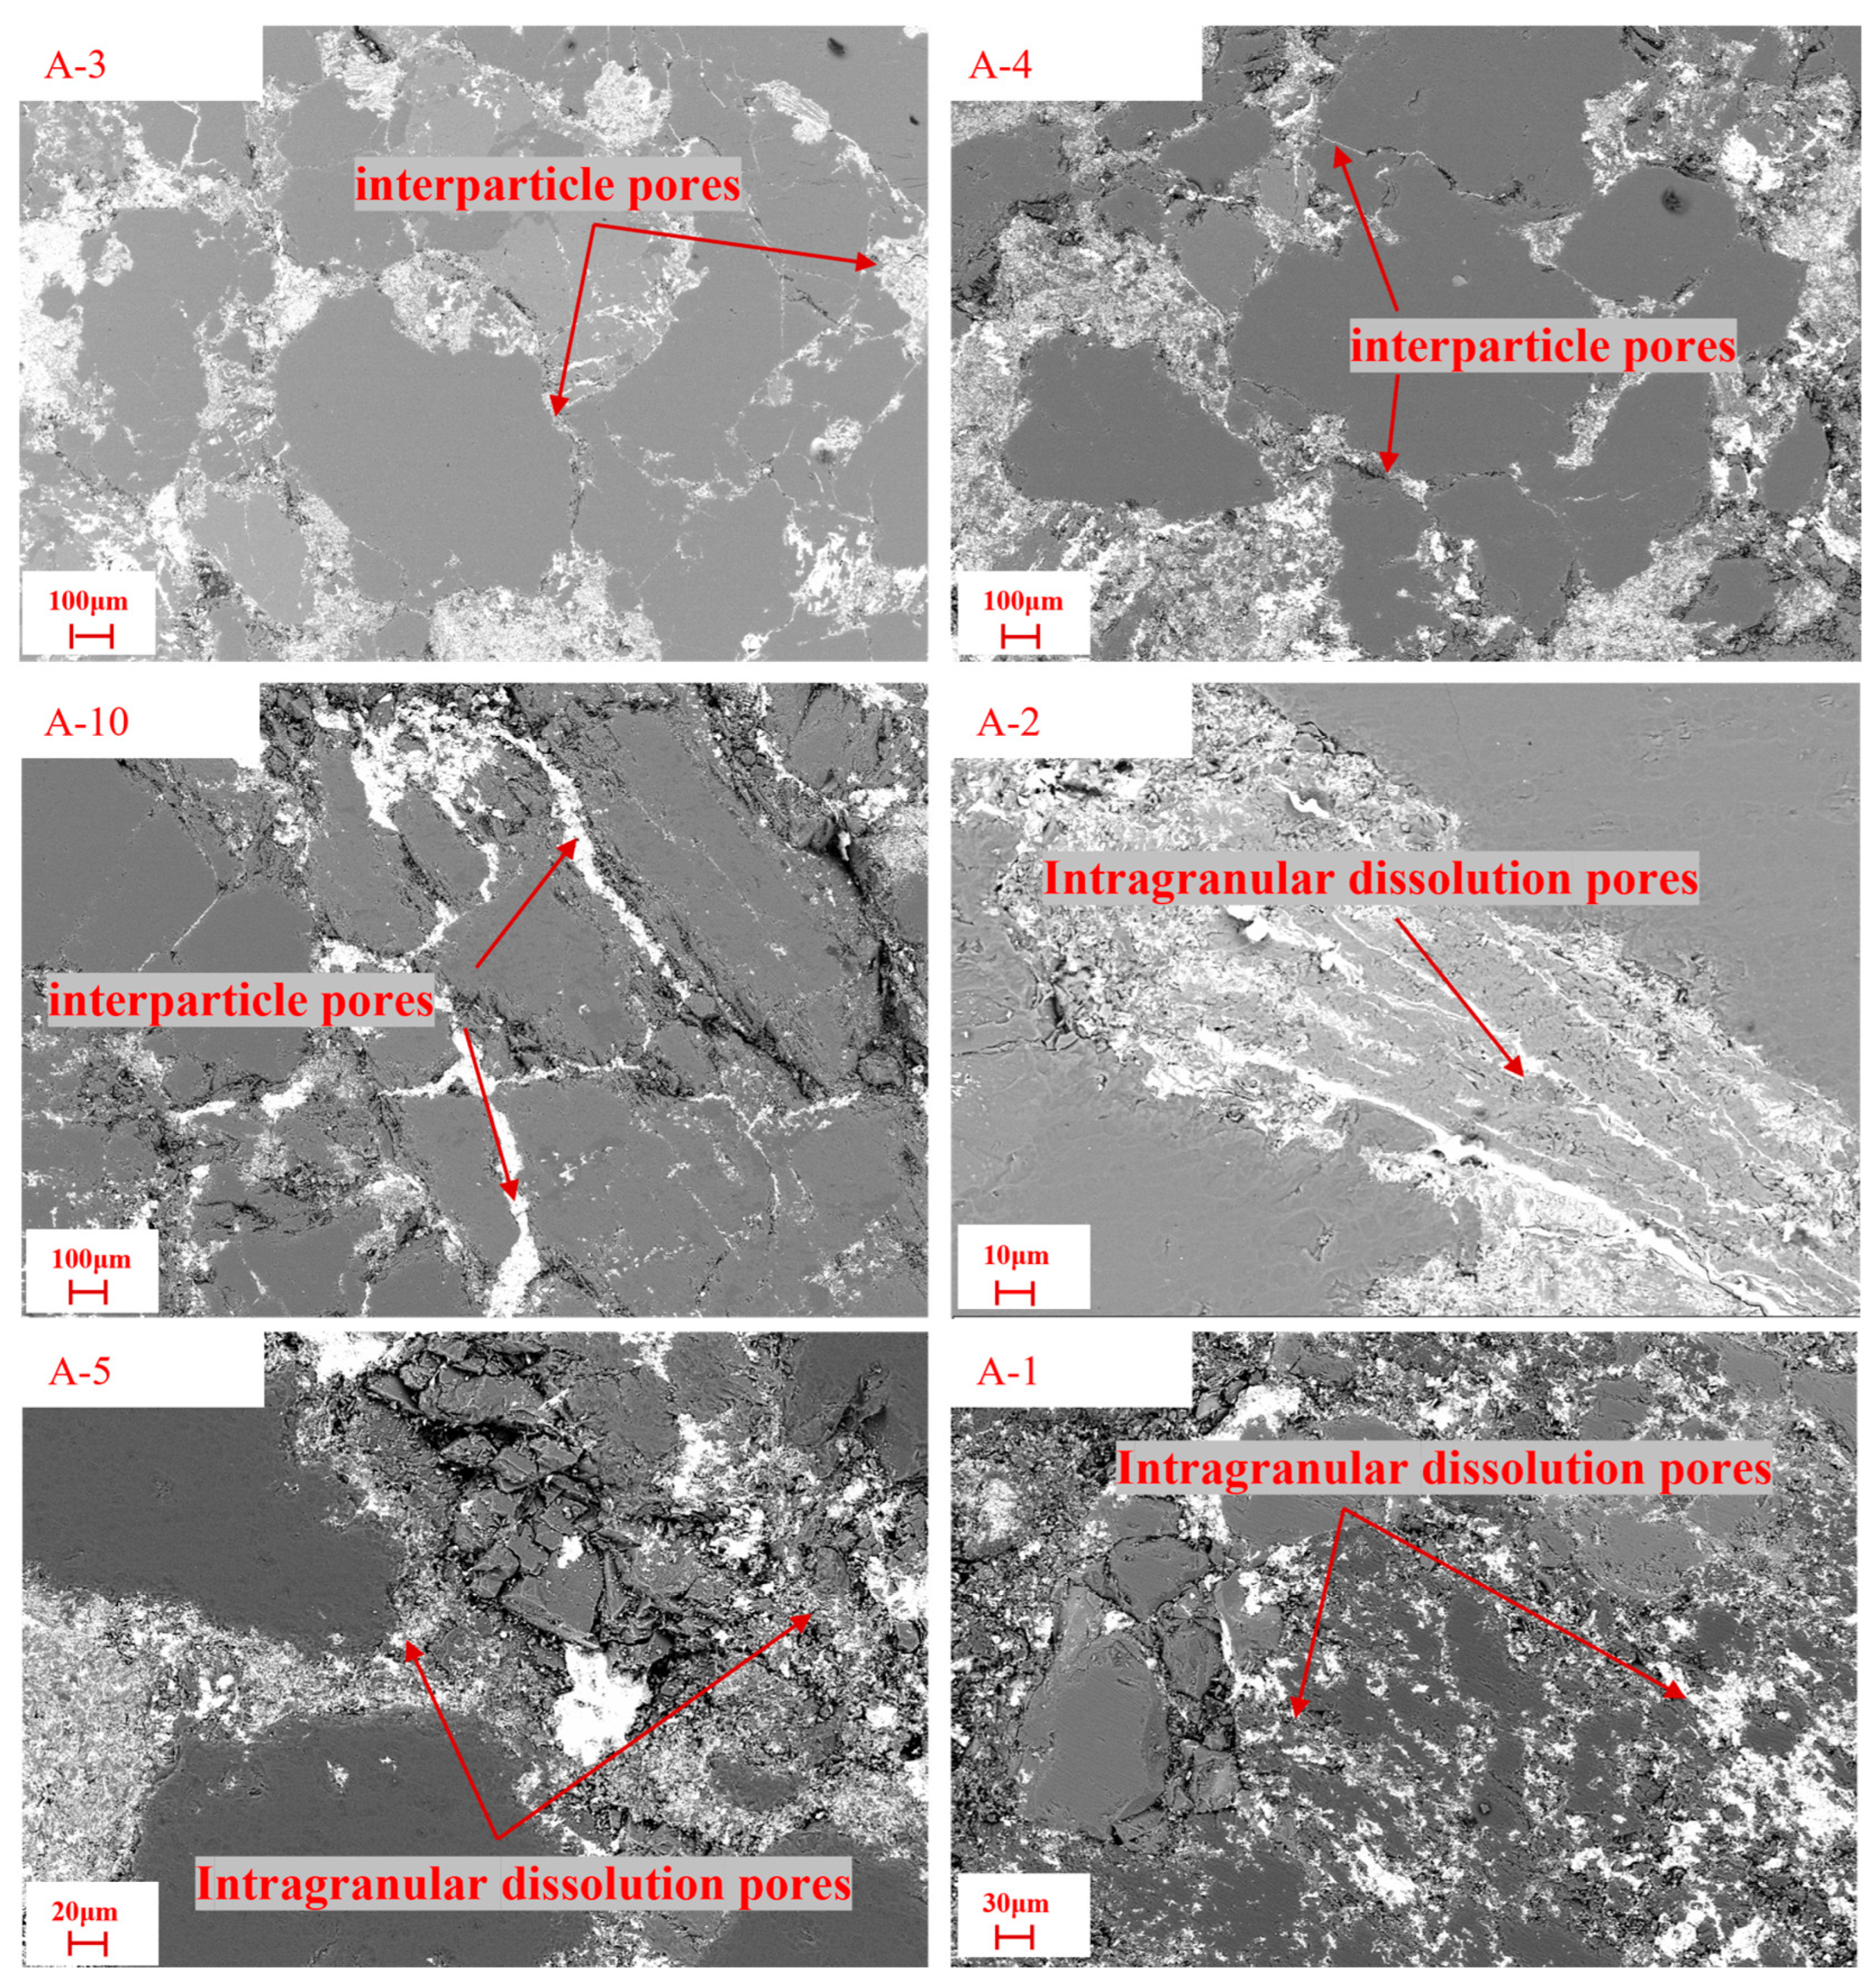
Figure 10 and
Figure 11), the pore types developed in the reservoir of the study area can be classified into three categories: intergranular pores, intragranular pores, and intergranular–intragranular pores [
23]. Among these, intergranular pores exhibit the highest permeability, followed by intergranular–intragranular pores, while intragranular pores have the lowest permeability.
In samples A-5 and A-6, Wood’s metal primarily contacts minerals such as quartz, potassium feldspar, chlorite, and calcite, with permeabilities of 0.144 mD and 0.026 mD, respectively. The proportions of metal are 2.27% and 0.61%, respectively. The low permeability results in poor injectability of the metal, leading to limited accessibility and poor connectivity. Specifically, the A-5 sample mainly develops intragranular pores in illite, albite, and chlorite, while the A-6 sample primarily develops intragranular pores in calcite, albite, and chlorite.
The pore system in low-permeability sandstone samples consists of intergranular pores, intragranular pores, and dissolution pores, with occasional microfractures. While intergranular pores exhibit the largest dimensions, they are relatively sparse and discontinuously distributed.
Ten SEM images of six samples following Wood’s alloy injection experiments are presented, clearly demonstrating the metal infiltration patterns within the pore networks. In samples A-3, A-4, and A-10, extensive penetration of Wood’s metal into intergranular pores was observed, confirming well-developed intergranular porosity. These interconnected pore networks serve as both primary hydrocarbon storage spaces and efficient migration pathways. In samples A-2, A-5, and A-1, the pore systems are predominantly composed of intragranular pores. Although these pores account for a substantial proportion of the total porosity, they contribute negligibly to the overall permeability of the samples [
24].
5. Discussion
5.1. Petrological Characteristics and Reservoir Quality
The low-permeability sandstone reservoir in the Wenchang Formation of the Huizhou area exhibits significant heterogeneity in terms of porosity and permeability [
25]. The wide range in porosity (3.19% to 14.09%) and permeability (0.026 mD to 1.060 mD) values, despite the similar depths of the samples, indicates complex pore structure development influenced by mineralogical composition [
26]. This heterogeneity is typical of low-permeability sandstone reservoirs globally and presents challenges for effective hydrocarbon exploration and production.
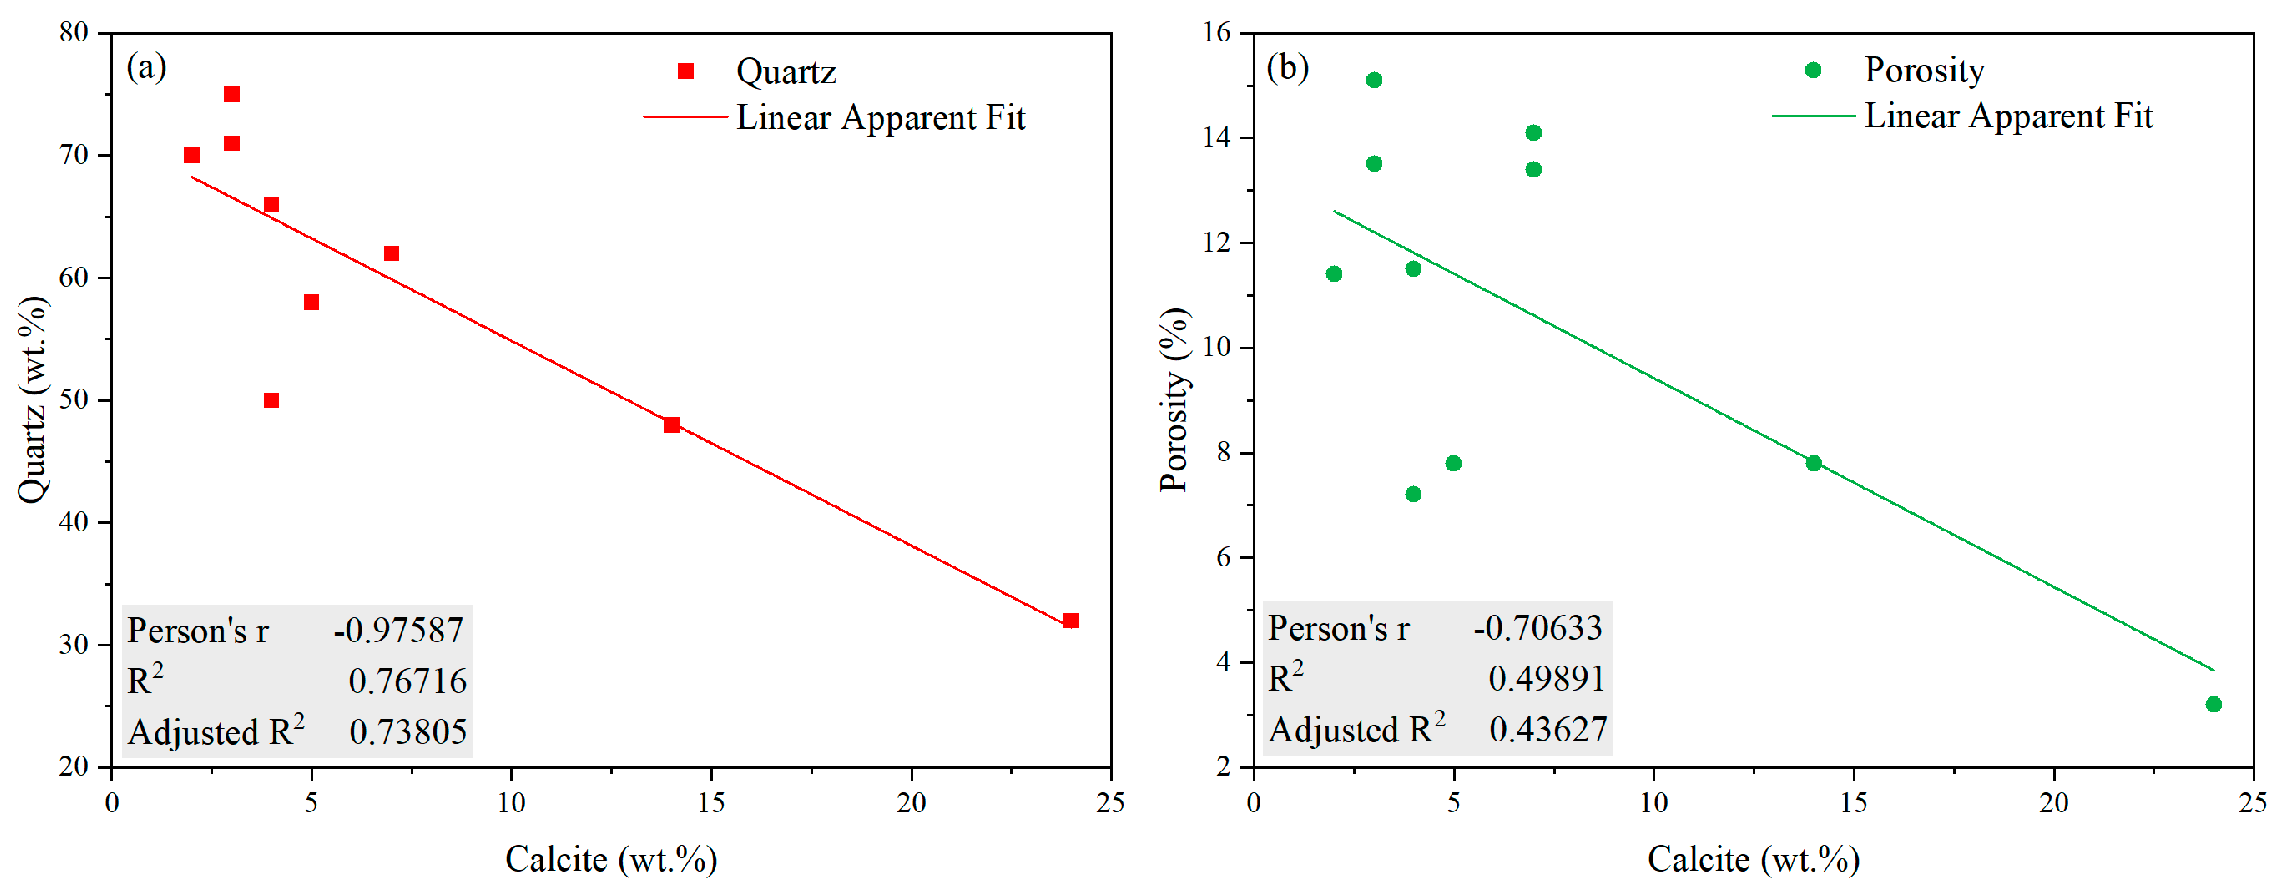
The predominance of quartz (average 59.4 wt.%) establishes a relatively stable framework for the reservoir, while variable feldspar content (13–40 wt.%) suggests different degrees of diagenetic alteration. The inverse relationship between calcite and quartz content indicates that carbonate cementation significantly affects reservoir quality (
Figure 12a), likely reducing primary porosity through pore-filling precipitation. The presence of barite exclusively in samples with lower quartz content suggests that mineral precipitation may be a porosity-reduction mechanism in specific intervals.
The relatively low clay mineral content (average 5.3%) is somewhat unusual for low-permeability sandstone reservoirs (
Figure 12b), which typically exhibit higher clay percentages. This suggests that pore-throat reduction in this reservoir may be more controlled by compaction and cementation rather than clay infiltration [
27]. In addition, abundant calcite tends to occlude pores, exerting negative impacts on both the porosity and permeability of the reservoir. The lithological classification of primarily lithic arkose and feldspathic litharenite reflects the moderately mature nature of these sandstones, consistent with their tight-reservoir characteristics [
28].
5.2. Pore Structure Characteristics
The MICP results provide critical insights into the pore-throat architecture of these sandstones. The systematically lower porosity values from MICP compared to helium porosity measurements confirm the presence of micropores below the detection limit of mercury intrusion, which can only access pore throats larger than 7.25 nm. This difference highlights the significance of micropores in contributing to the total storage capacity but not to the flow capacity [
29].
The high maximum mercury saturation (average 89.9%) compared to conventional low-permeability reservoirs indicates better hydrocarbon storage capacity. However, the low mercury withdrawal efficiency (average 22.6%) reveals poor pore connectivity, which explains the low permeability values despite moderate porosity in some samples. This characteristic “storage-without-flow” phenomenon is typical of tight reservoirs and represents a significant challenge for production [
30].
The variable displacement pressures (0.16 to 0.67 MPa) further demonstrate the heterogeneity of the pore network, with higher displacement pressures indicating smaller pore-throat diameters that require greater capillary pressure to overcome. The application of fractal dimension analysis provides a quantitative measure of pore complexity, with the identification of two inflection points in the fractal dimension curves suggesting distinct pore populations at different scales.
5.3. Pore Types and Their Contribution to Reservoir Quality
After we performed Wood’s metal impregnation, the FE-SEM observations and AMICS analysis revealed three primary pore types: intergranular, intragranular, and combined intergranular–intragranular pores. The relative contribution of each pore type to overall permeability follows a clear hierarchy, with intergranular pores providing the highest permeability, followed by combined pores, and then intragranular pores showing the lowest permeability.
The samples with higher permeability (A-2 and A-8) demonstrate greater Wood’s metal infiltration (8.77% and 3.92%, respectively), primarily filling intergranular spaces and dissolution pores. This confirms that connected intergranular porosity is the dominant contributor to flow capacity in these low-permeability sandstone. In contrast, samples dominated by intragranular porosity within minerals such as illite, albite, and chlorite (A-5 and A-6) show significantly lower permeability (0.144 mD and 0.026 mD) and limited metal infiltration (2.27% and 0.61%).
The mineral associations with different pore types provide additional insights into diagenetic controls on reservoir quality. The dissolution pores associated with calcite in sample A-2, which exhibits the highest permeability (1.06 mD), suggests that secondary dissolution of carbonate cement may enhance reservoir quality in certain intervals. Meanwhile, the dominant association of intragranular pores with clay minerals and feldspars in low-permeability samples points to the detrimental effects of mineral alteration on flow capacity.
6. Conclusions
This study presents a comprehensive investigation of pore structure characteristics in low-permeability sandstone reservoirs of the Eocene Wenchang Formation, Huizhou Sag, Pearl River Mouth Basin, Northern South China Sea, employing an integrated analytical approach by combining MICP, CMI, WM, SEM, XRD, and QEMSCAN.
The following conclusions were drawn from this study:
- (1)
The Wenchang Formation exhibits a “storage-but-not-flow” profile characterized by moderate porosity (average 10.5%) and very low permeability (average 0.3706 mD). The high quartz content (average 59.4%) provides a stable framework, but variable diagenesis (feldspar dissolution with calcite cementation) has an important negative impact on reservoir quality.
- (2)
Micropores (<7.25 nm) contribute significantly to storage capacity, with high MICP saturation (average 89.9%), but exhibit poor flow performance. Effective permeability depends primarily on connected intergranular pores and dissolution features, not isolated intragranular pores.
- (3)
Understanding the link between pore-throat architecture (connectivity and size) and mineralogical composition (especially diagenetic minerals like calcite and feldspar) is crucial for predicting reservoir quality and planning production in this heterogeneous system.
- (4)
Future exploration should prioritize intervals with enhanced intergranular porosity and dissolution features for optimal hydrocarbon recovery. Initial regression results, while suggestive, require cautious interpretation and larger datasets for robust statistical power.
