Abstract
The moving particle semi-implicit (MPS) method is employed to investigate the dynamic response of a wave energy converter (WEC) buoy subjected to dam-break flows. The buoy is connected to a hydraulic power take-off (PTO) system equipped with an accumulator, enabling it to capture wave energy. First, the MPS method is validated by comparison with experimental results, demonstrating its accuracy in simulating violent interactions between dam-break flows and the buoy. Subsequently, numerical simulations are conducted to analyze the influence of different PTO forces and buoy positions on the heave motion, fluid forces and captured power of the buoy. The results indicate that PTO force exerts a significant influence on heave motion, captured power and vertical fluid force while having a relatively minor effect on the horizontal fluid force. In addition, the maximum power that the buoy can capture increases as its distance from the wall decreases. Notably, the maximum average captured power of the buoy located near a wall can be five times higher than that of a buoy far away from the wall, indicating that a vertical wall can significantly increase the efficiency of nearshore WEC devices. These findings could provide valuable insights for the design, optimization and operation of nearshore WEC devices.
1. Introduction
The random and unstable nature of waves causes unstable energy output from wave energy converters (WECs). To address this issue, accumulator-integrated hydraulic power take-off (PTO) systems have been developed and applied in many floating buoy WECs, such as Haiyuan 1 and Wavestar [1,2]. This kind of system can effectively stabilize output power and enhance energy conversion efficiency. By storing and releasing energy, they strengthen systematic adaptability to wave randomness and instability, significantly improving the general performance of WECs.
Dam-break flows, which resemble solitary waves and tsunamis, are frequently utilized in studies of tsunamis and shallow-water waves, as well as their interactions with structures [3,4,5,6]. Additionally, the process of a dam break impacting a horizontal deck is often used as a cost-effective surrogate for the wave-on-deck process, as it reduces costs compared to conventional wave generation methods [7,8]. Many WECs are deployed in nearshore shallow waters due to construction and maintenance costs, as well as the need for breakwater protection. Therefore, studying the impact of shallow-water waves on these devices is essential for the research of WEC behavior. Furthermore, WECs located in tsunami-prone areas must consider the potential for tsunami damage. Unlike free-floating bodies, WEC buoys experience motion damping due to PTO forces, making them prone to wave slamming and deck flooding. Consequently, investigating the motion response and mechanical characteristics of WEC buoys under dam-break flow impact holds practical importance.
Many studies have been carried out on the dynamic response of WEC buoys with PTO systems in waves. Li et al. [1] analyzed the buoy motion and energy captured efficiency of HaiYuan 1 using a potential flow method. Kim et al. [9] evaluated the hydrodynamic performance of a Multi-Buoy-Type WEC with a hydraulic PTO system in irregular waves. Shi et al. [10] derived a heave motion equation for a WEC buoy under nonlinear hydraulic resistance, studying its effects on WEC system efficiency via theory, experiments and numerical simulations. Xu et al. [11] designed a buoy-type WEC with hydraulic PTO, analyzing its motion and power efficiency using potential flow theory and Maximum Power Point Tracking (MPPT) algorithms. Windt et al. [2] employed a CFD-based numerical wave tank model to investigate the hydrodynamic and energy conversion performance of a 1:5 scale point-absorber device (Wavestar) equipped with a linear spring-damper system. Li et al. [12] studied the hydrodynamic parameters of a WEC floater with an integrated hydraulic transformer and multi-chamber cylinder in the PTO system under various control strategies. Roh [13] developed a maximum power control algorithm for hydraulic PTO systems in floating WECs by analyzing the characteristics and power generation performance of the system according to the control variables of each algorithm. Liu et al. [14] proposed an improved hydraulic energy storage wave power generation system with a two-branch topology on artificial breakwaters, demonstrating that the quasi-proportional resonance control strategy improves wave energy efficiency and reduces power intermittency, via simulations and experiments. Li et al. [15] investigated the optimal energy capture of a floating two-buoy WEC excited by regular and irregular waves, incorporating a hydraulic PTO and a linear permanent magnet generator. Jia et al. [16] established a mathematical model for the energy conversion and transmission process in a WEC system with a hydraulic PTO unit and proposed an Adaptive Hierarchical Model Predictive Control (AHMPC) method to enhance its performance. Lai et al. [17] established a corresponding mathematical model of the hydraulic PTO system and studied the optimal performance of “Dolphin 1” with a hydraulic PTO system containing PID control under different wave conditions. The above studies have contributed to our understanding of the motion response and energy conversion characteristics of WEC buoys with PTO systems in regular and irregular random waves. Some research has also focused on the dynamic response under dam-break flow impacts. For instance, Sjökvist and Göteman [18] analyzed the motion and force characteristics of a wave energy device equipped with a linear PTO system under dam-break flow conditions, exploring its survivability against tsunami impacts. However, research on the dynamic response of WEC buoys with accumulator-integrated hydraulic PTO systems under dam-break flows is still limited.
The Moving Particle Semi-implicit (MPS) and Smoothed Particle Hydrodynamics (SPH) methods are prominent mesh-free Lagrangian particle techniques in computational fluid dynamics, excelling in simulating violent fluid impacts and free-surface flows by tracking fluid particles without a fixed grid. These methods are especially valued for modeling extreme fluid–structure interactions, such as dam-break flows. Brito et al. [19] investigated power absorption in a constrained wave energy hyperbaric converter, highlighting the influence of PTO damping and breakwater geometry on the capture width ratio. Tang et al. [20] demonstrated the accuracy of the overlapping MPS method in simulating interactions between 3D dam-break flows with fixed obstacles. Amaro et al. [21] validated that both MPS and SPH methods can accurately simulate violent dam-break flow impacts on obstacles, showing high consistency with experimental results. Zhang et al. [22] accurately reproduced the interaction between dam-break flow and an elastic sluice gate using an MPS–FEM coupled method. Quartier et al. [23] coupled DualSPHysics with Project Chrono to compute the water surface elevation at the centre of the chamber and the airflow speed through the orifice in an OWC (Oscillating Water Column) WEC, achieving good agreement with experimental measurements. Quartier et al. [24] and Yun et al. [25] validated the high fidelity of an SPH method by simulating the motion of WECs under regular waves and comparing the results with experimental data. Capasso et al. [26] designed a high-fidelity numerical tank based on the SPH method, validated its exceptional accuracy in reproducing wave transformation and velocity fields, and subsequently investigated the dynamic response of the moored Uppsala University WEC (UUWEC) under taut-mooring conditions. Li et al. [27] employed a modified MPS method to accurately simulate the motion of a rectangular box under dam-break flows, demonstrating high consistency with experimental data and confirming the method’s effectiveness in capturing violent wave impact mechanics and related phenomena. These studies collectively highlight the robustness and accuracy of MPS and SPH in complex fluid–structure interactions, especially in highly nonlinear scenarios involving wave breaking and deck flooding.
In this paper, an accurate fluid–structure coupling numerical model is established based on a modified MPS method to investigate the dynamic response of a heaving buoy with a hydraulic PTO system under dam-break flow impacts. The hydraulic PTO system acting on the buoy is equipped with an accumulator to maintain stable hydraulic pressure. This study focuses on analyzing how wall effects and varying PTO forces influence the heave motion, captured power and fluid loads of the buoy, aiming to provide a reference for the optimization and design of nearshore point-absorber wave energy devices.
2. Accumulator-Integrated Hydraulic PTO System and Motion Equation
The system of a heaving buoy WEC with an accumulator (illustrated generically in Figure 1) typically encompasses a heaving buoy, a hydraulic cylinder, check and globe valves, an accumulator, a hydraulic motor, an electric generator and an oil tank [1,12,17]. Incident waves drive the buoy oscillation in heave, thereby activating the coupled hydraulic PTO system. And the hydraulic cylinder transports hydraulic oil to the hydraulic motor to drive its operation, which ultimately drives the generator to produce electricity. In this system, the oscillating buoy harnesses wave energy by performing work against the PTO force, and the accumulator plays a role in stabilizing the hydraulic system pressure and ensuring the stable output of electrical power.
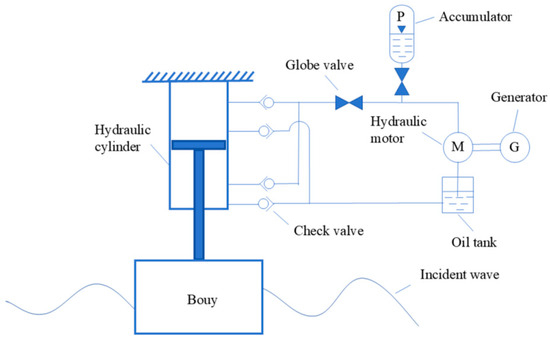
Figure 1.
Schematic diagram of the heaving buoy WEC with the accumulator.
In such a system, the buoy is subjected to hydrodynamic forces, gravity and the reaction force from the hydraulic PTO system. Thus, the heaving motion equation of the buoy is as follows:
where is the mass of the buoy; refers to the velocity component of the buoy in vertical direction; represents the gravity acceleration, usually (upward direction is positive). is the vertical fluid force acting on the buoy. denotes the force exerted by the accumulator-integrated hydraulic PTO system on the buoy.
The fluid force follows the below equation:
where is the pressure on the wall of the buoy; is the surface area of the wall of the buoy; is the unit outward normal vector; is the unit vector in the vertical direction.
As shown in Figure 1, due to the check valves, the buoy experiences a PTO force opposite to its motion direction, regardless of upward or downward movement. Consequently, whenever the velocity of the buoy is non-zero, the PTO force acting on it takes the form of Coulomb damping [1,9]:
where is defined as the product of the hydraulic system pressure difference (the difference between the accumulator pressure and the tank pressure) and the hydraulic cylinder piston area :
When equals to zero, the PTO force should be determined by considering the following three possible scenarios:
- When , the buoy is activated and will move upward in the next moment. Hence,
- When , the buoy is activated and will move downward in the next moment. Hence,
- When , the buoy cannot be activated by the incident wave in the next moment, as the forces , gravity and are in equilibrium. Obviously,
From Equations (3)–(7), the following combined expression for can be obtained:
3. Modified MPS Method
The modified MPS method proposed by Li et al. [27] is adopted. In this section, several key components of the modified MPS method are introduced briefly, including a pressure-splitting scheme, a mixed gradient operator, a threshold particle-shifting technique and a modified SPP scheme. For a more detailed description of the method, the reader is referred to reference [27].
3.1. Governing Equations
The governing equations for incompressible fluid flow include the momentum equation (Equation (9)) and the mass conservation equation (Equation (10)).
where , , , , , and denote velocity vector, time, density, pressure, viscous coefficient of fluid and gravitational acceleration vector, respectively.
and
3.2. Pressure Split Scheme
In the modified MPS method, Li et al. [27] split total pressure into hydrostatic pressure and dynamic pressure :
where follows the below equation:
and satisfied Equation (13):
In Equation (12) and Equation (13), and denote the wall boundary and Dirichlet boundary, respectively; an inner fluid particle refers to a fluid particle that is not identified as a free surface particle; a wall pressure particle is a wall particle involving in the pressure calculation; an inner particle is a wall pressure particle or a fluid particle that is not identified as a free surface particle; refers to the time interval.
3.3. Differential Operators and Particle-Shifting Technique
3.3.1. Laplacian Operator
The modified MPS method employs the Laplacian operator of Zhang et al. [28]:
where refers to the physical quantity (such as pressure and velocity) of the particle; is the dimension of the calculation; is the distance between particle and ; represents the kernel function; refers to the initial particle number density.
3.3.2. Mixed Pressure Gradient and Particle-Shifting Technique
Li et al. [27] proposed the following mixed pressure gradient, in which the repulsive pressure gradient is applied to FA-type particles and the original pressure gradient to FB-type particles:
As shown in Figure 2, an FA-type particle is defined as any fluid particle whose search radius (generally equals to , where denotes the initial particle distance) contains at least one free surface particle; by contrast, an FB-type particle has no free surface particles within this radius.

Figure 2.
Schematic illustration of FA- and FB-type particles.
The original pressure gradient is unable to ensure regular particle distribution and may trigger computational collapse [29]. Consequently, a particle-shifting technique is required for FB-type particles to regularize the particle distribution. To this end, Li et al. [27] developed a threshold particle-shifting
technique, in which the particle-shifting amount is determined using the following equation:
where is a constant number, with recommended. follows the below equation:
In Equation (17), denotes the minimum distance between particle and its neighbors, and is the particle-shifting threshold. To suppress particle aggregation and maintain a regular distribution, should be slightly less than 1. Here, is recommended.
3.4. Modified spp. Scheme
In traditional MPS methods, all free-surface particles are assigned zero pressure, which can lead to the issue of particle thrusting. To address this issue, space potential particle (SPP) concept was developed [30]. Here, a modified SPP scheme developed by Li et al. [27] is applied to prevent particle thrusting. In this scheme, free-surface particles are classified as either ordinary or splash particles (Figure 3). Splash particles are defined as free surface particles that possess no neighbors, whereas ordinary free-surface particles retain at least one neighboring particle.
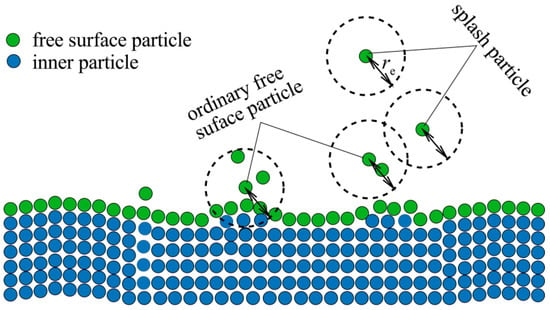
Figure 3.
Schematic classification of free surface particles.
In the modified SPP scheme of Li et al. [27], splash particles are still assigned zero pressure, whereas the hydrodynamic pressure of ordinary free-surface particles is governed by the following pressure Poisson equation:
where is an ordinary free-surface particle; is a neighboring particle of ; represents the particle number density of ; refers to the intermediate velocity of .
3.5. Twice-Judge Method for Detecting Free Surface
A twice-judge method proposed by Pan et al. [31] is introduced to detect free surface particle. The first judgment is according to the following equation:
where and are experimental parameters, with and recommended. If a particle requires a second judgment, the search region between and is divided into eight sectors, as shown in Figure 4. When no neighboring particles are found within any two adjacent sectors, the particle is classified as a free-surface particle.

Figure 4.
Schematic diagram of the second judgment for detecting free surface particle.
4. Validation
In order to verify the feasibility of the modified MPS method, the interactions between a dam-break flow and a floating heave box is simulated. And then, the numerical results are compared with experiment results from Wang and Dong [32].
The experiment by Wang and Dong [32] was carried out in a rectangular water tank, the configuration of which is illustrated in Figure 5. The rectangular tank is open at the top and has principal dimensions of 2.00 m × 0.60 m × 0.80 m. A sluice gate is located 0.5 m from the right end of the tank, which separates the right side into the reservoir section and the left side into the downstream section. For verification in this section, the initial water levels of the reservoir and the downstream are 0.35 m and 0.15 m, respectively. At the initial moment, a rectangular buoy with a mass of 5.35 kg and a draft of 0.03 m is placed downstream. It is restricted to heave motion only, with its center of buoyancy located 0.75 m from the right wall, exactly at the midpoint of the downstream section. In order to capture surface elevation, a wave gauge (WG) is located 1.30 m away from the left wall of the tank. In addition, two pressure probes, M1 and M2, are placed on the right side of the buoy to capture pressure fluctuations: M1 is 30 mm above the bottom of the buoy, and M2 is 30 mm beneath the top of the buoy.
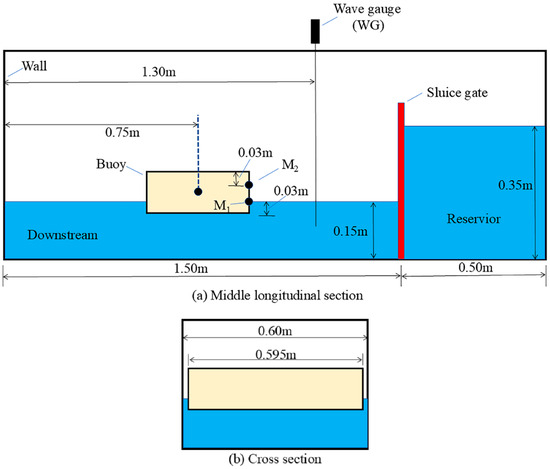
Figure 5.
Schematic diagram of dimensions of the experiment tank.
Numerical simulations in this study are performed via a code developed by the authors. In the present numerical calculations of the section, particles are arranged uniformly, and two distinct initial particle distances, and , are adopted to assess the convergence characteristics of the modified MPS method. In addition, the time interval satisfies the following CLF condition:
where is an empirical constant (typically 0.1~0.2), and is the maximum velocity of fluid particles.
Figure 6 contrasts numerical snapshots at , , , and , with the corresponding experimental images reported by Wang and Dong [32]. The left column presents the experimental results (Figure 6a), while the middle and right columns present the corresponding numerical results calculated using the modified MPS method with initial particle distances of 0.01 m and 0.0075 m (Figure 6b,c), respectively. Though many wires connected to the buoy can be found in Figure 6a, their influence on the flow can be neglected because their diameters are orders of magnitude smaller than the 0.60 m tank width. It is clear that there is close alignment between the simulated free-surface profiles and the experimental results at these moments. Notably, the wave-on-deck phenomenon of the buoy at and , as well as the wave climbing and breaking on the left-side wall of the tank at , are accurately replicated in the simulations. In addition, Figure 6b,c are visually almost identical; the reduced particle distance in Figure 6c merely refines the free-surface resolution and produces splash patterns in closer agreement with the experimental observations.
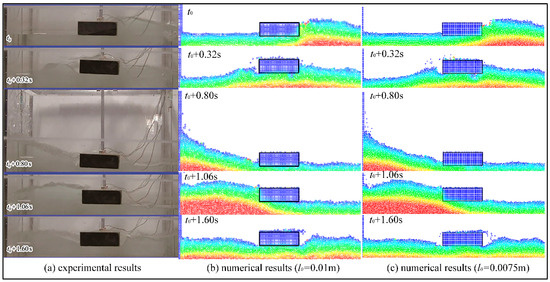
Figure 6.
Visual comparison between experimental and numerical results.
A comparison of several characteristic curves from the experiment and numerical simulations, including free-surface elevation, slamming pressure, and the heave motion of the buoy, are shown in Figure 7. It can be found in the figure that the numerical results obtained with initial particle distances of 0.01 m and 0.0075 m are virtually identical, and both agree well with the experimental results overall. The simulated free-surface elevation curves at the WG agrees well with the experimental results both in wave pattern and peak value. Additionally, the simulated pressure at M1 and M2 align well with the experimental results, despite minor pressure oscillations appearing in the simulated curves. Additionally, the simulated heave motion curves of the buoy show good consistency with the experimental results. It should be noted that minor deviations are observed between the numerical and experimental time series. For instance, the simulations lag by approximately 0.1 s, and certain peak values differ marginally from the measurements. These deviations stem from several sources, including inevitable human error (such as imperfect synchronization between gate release and data acquisition) and neglected experimental details (such as the thin wires attached to the buoy in Figure 6a). In addition, the inherent randomness in the timing and peak values of dam-break flow experiments (Lobovský et al. [33]) is also a significant contributing factor. Nevertheless, it is evident from Figure 7 that these deviations are generally small and acceptable.
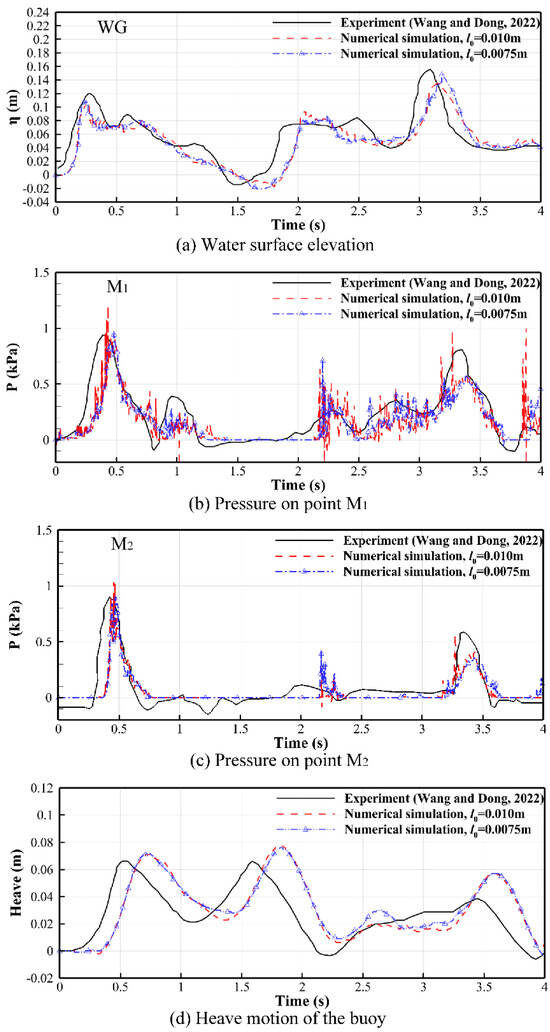
Figure 7.
Characteristic curves obtained from the experiment [32] and numerical simulations.
From Figure 6 and Figure 7, it is clear that when the buoy is placed in the middle of the downstream area, the modified MPS method effectively reproduces the experimental results in fluid contours, free-surface elevation, slamming pressure and heave motion. A previous study has also confirmed that the modified MPS method can accurately simulate cases where the buoy is located near the left wall of the tank [27]. Therefore, the modified MPS method is proven to be reliable and effective for simulating interactions between dam-break flow and floating buoys involving intense fluid impact and wave breaking.
5. Results and Discussion
The interactions between a dam-break flow and a buoy with a PTO system are simulated using the modified MPS method, with consideration given to varying PTO forces and distinct buoy positions. Subsequently, the relationships among PTO force, buoy position, heave motion of the buoy, fluid force and captured power are analyzed.
5.1. Analysis Cases
As shown in Figure 8, the numerical tank, the shape and draft of the buoy, and the reservoir section and downstream section employed in this section are identical to those in the validation case in Section 4. However, one difference is that an additional PTO force from the hydraulic system acts on the buoy in this section, whereas none is applied in Section 4. In the figure, denotes the horizontal distance between the left wall and the centroid of the buoy. Evidently, a smaller signifies a closer proximity of the buoy to the left wall. As listed in Table 1, four case groups are involved, each corresponding to a distinct buoy position, to systematically quantify the wall boundary effects. The buoy positions (represented by ) for groups 1 to 4 are 0.75 m, 0.45 m, 0.30 m and 0.20 m, respectively. For each case group, the parameter varies from 0.25 to 1.25 ( denotes the gravitational force acting on the buoy, ).
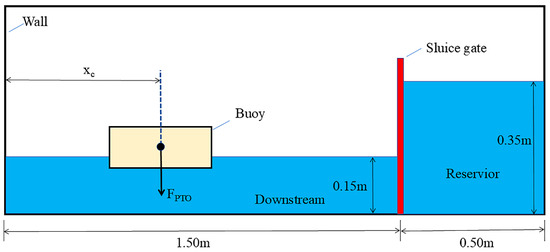
Figure 8.
Schematic of the numerical experiment showing the interactions between a dam-break flow and a buoy subjected to PTO forces.

Table 1.
Details of the analysis case groups.
The convergence study in Section 4 demonstrates that an initial particle distance of 0.01 m is sufficient to accurately reproduce the dam-break flow and its violent interaction with the floating buoy. Consequently, this value is adopted for all simulations in the present section, while the time step is still governed by the CFL condition given in Equation (20).
5.2. Relationship Between PTO Force, Heave Motion and Captured Power
The heave motion curves of the buoy positioned at = 0.75 m under different values are presented in Figure 9. At this position, the buoy is located in the middle of the downstream area, far from the left wall. When is 0.25, the buoy exhibits pronounced heave motion with a distinct double-peak pattern within the first 3 s. The second peak arises from the dam break flow reflecting off the left wall and then re-impacting the buoy. As increases, the motion amplitude decreases, and the double-peak pattern gradually disappears. When = 1.00, the buoy primarily moves upward with almost no downward motion.
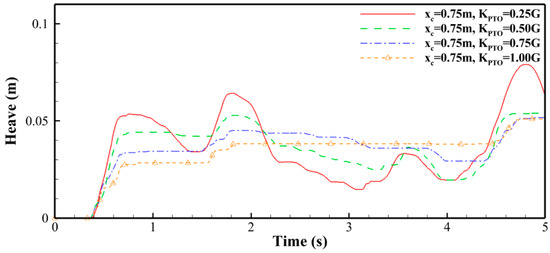
Figure 9.
Heave motion curves of the buoy under different (middle position, = 0.75 m).
Figure 10 presents the heave motion curves of the buoy positioned at = 0.30 m for different values. At this position, the buoy is located quite near the left wall and is therefore subject to pronounced wall boundary effects. Similar to Figure 9, as the PTO force increases, the motion amplitude of the buoy decreases, and its motion lag intensifies correspondingly. It can also be found that the residence time of the buoy at the place of maximum or minimum vertical displacement increases with the rising . Notably, under the condition of = 1.00, the buoy continues to move downward between 1.95 s and 2.7 s. This downward motion is attributed to the negative vertical fluid force acting on the buoy, as illustrated in Figure 10. In addition, compared with Figure 9, it is evident that, for the same , the buoy positioned on the left exhibits markedly larger motion amplitudes.
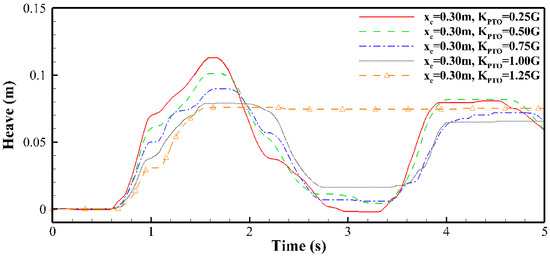
Figure 10.
Heave motion curves of the buoy under different (left position, = 0.30 m).
Captured power is a key performance indicator for a WEC. According to [12], the average captured power over the interval can be computed as
In Figure 11, the relationships between and the average captured power of the buoy before 3.2 s under different buoy positions are calculated according to the numerical results of the four case groups. First, focusing on the variation of the dashed curve, which corresponds to the scenario where the buoy is positioned at = 0.75 m. As increases, the captured power initially rises, peaks at approximately 0.6 W when , and then gradually decreases as continues to increase. Next, examining the other three curves corresponding to = 0.45 m, 0.30 m and 0.20 m, respectively. Generally speaking, as increases, the capture power of the three curves first increases continuously as well, reaching their peak values at , and then gradually decreases (except for the curve of = 0.30 m, which has another peak of 2.3 W at ), with maximum average captured power of 1.8 W, 2.4 W and 3.3 W, respectively. Although the maximum average captured power occurs at a of 1.0, it is recommended to select a slightly lower value. Taking the curve of = 0.30 m as an example, 0.8 could be a more suitable optimal value compared to 1.0 G for the following two key reasons: first, the difference in captured power between and is comparatively small, and a lower value reduces hydraulic force and thus safety risks to the hydraulic system; second, excessive hydraulic forces (e.g., ≥1.0) may cause the buoy to be suspended, preventing it from moving downward to its initial position. By comparing the four curves, one can observe that under the same incident wave conditions, the closer the buoy is to the left wall, the greater the maximum average captured power. When the buoy is near the left wall (e.g., = 0.20 m), the maximum average captured power can be at least five times higher than that obtained when the buoy is in the middle position ( = 0.75 m), which indicates that the vertical wall can significantly increase the efficiency of nearshore buoy-type WEC devices. This is attributed to the wall-blocking effect, which causes the horizontal flow near the wall to convert into vertical flow, inducing wave climbing phenomena. This increases wave height and concentrates wave energy. As a result, the left-located buoy can be pushed to a higher position under greater PTO force and capture more energy than the middle-located one.

Figure 11.
Relationships between and average captured power before 3.2 s.
5.3. Fluid Force on the Buoy
The variations in vertical fluid force on the buoy under different PTO forces when the buoy is in the middle position ( = 0.75 m) and left position ( = 0.30 m) are calculated and shown in Figure 12 and Figure 13, respectively. Both figures show that, as the PTO force increases, the maximum vertical fluid force on the buoy before 3.2 s exhibits an increasing trend, while the minimum vertical fluid force before 3.2 s demonstrates a decreasing trend. In Figure 12, when = 1.0 (the orange dashed curve with triangular symbols), the vertical fluid force maintains a consistently positive value, preventing the buoy from commencing downward motion. This explains why the buoy cannot move downward in the corresponding curve in Figure 9. In Figure 13, when = 1.0 (the gray dashed curve), a negative vertical fluid force emerges between approximately 1.95 s and 2.35 s. This explains why the buoy can move downward in the corresponding curve in Figure 10.

Figure 12.
Time histories of the vertical fluid force on the buoy (middle position, = 0.75 m).
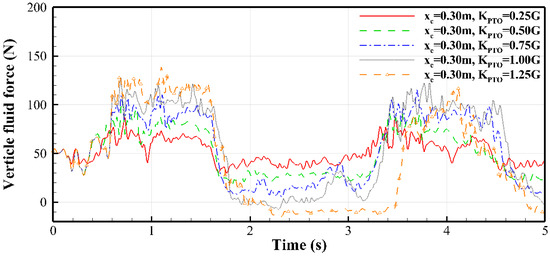
Figure 13.
Time histories of the vertical fluid force on the buoy (left position, = 0.30 m).
The variations in horizontal fluid force on the buoy under different PTO forces when the buoy is in the middle position ( = 0.75 m) and left position ( = 0.30 m) are shown in Figure 14 and Figure 15, respectively. It can be found that, whether the buoy is at the middle or left position, the value of has little effect on the horizontal force. The curves in Figure 14 are almost identical, with the first trough of approximately −40 N (indicating a leftward drag force on the buoy) occurring near 0.45 s and the first peak of around 35 N appearing near 1.5 s. Similarly, the curves in Figure 15 are also very close to each other, with the first trough of approximately −50 N near 0.80 s and the first peak of around 40 N occurring near 1.4 s.
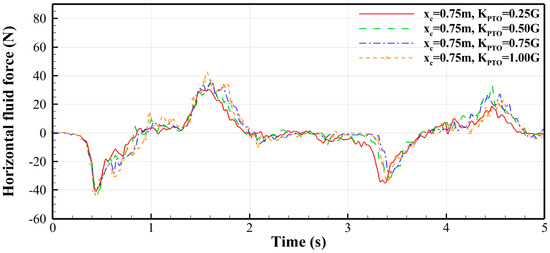
Figure 14.
Time histories of the horizontal fluid force on the buoy (middle position, = 0.75 m).
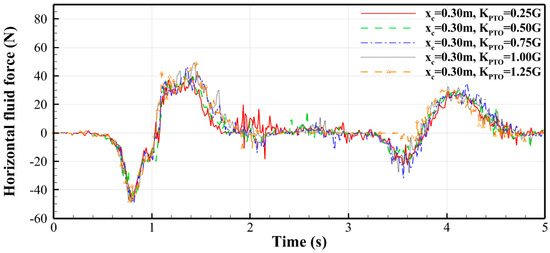
Figure 15.
Time histories of the horizontal fluid force on the buoy (left position, = 0.30 m).
6. Conclusions
This study focuses on the numerical investigation of the motion, captured power and fluid forces of a buoy connected to an accumulator-integrated hydraulic PTO system under dam-break flow. A modified MPS method proposed by Li et al. [27] is adopted to construct fluid–structure numerical models for the study. Subsequently, violent interactions between dam-break flow and a rectangular floating box are simulated and compared with experimental results, demonstrating the accuracy of the modified MPS method in reproducing the motion and fluid forces of the floating box, as well as fluid-induced slamming and overtopping phenomena. After validation, various case groups are simulated for the buoy in four different positions under varying PTO forces. Based on the analysis and discussion of the numerical results of these cases, the following conclusions are drawn:
- PTO force significantly affects the heave motion of the buoy. As the value of increases, the amplitude of the heave motion decreases. When the value of exceeds a certain threshold (equal to or slightly above the gravity of the buoy), the buoy ceases to move downward.
- PTO force significantly affects the captured power of the buoy. Generally, the captured power initially increases and then decreases with increasing . If the value of corresponding to the maximum captured power exceeds the gravity of the buoy, a value slightly smaller than the gravity of the buoy is recommended as optimal to prevent the buoy from being suspended and failing to fall down.
- PTO force significantly affects the vertical fluid force on the buoy. The vertical fluid force on the buoy increases with higher forces, while the minimum vertical fluid force decreases.
- PTO force has little effect on the horizontal fluid force on the buoy. Irrespective of whether it is positioned in the middle or near the left wall, the horizontal fluid force curves of the buoy are highly similar across different values of .
- The position of the buoy has a marked impact on its maximum captured power. When the buoy is positioned near the left wall, the maximum average captured power can be five times higher than that of the buoy far away from the left wall. This is attributed to the wall-blocking effect, which enhances wave climbing and energy concentration.
Author Contributions
Conceptualization, Z.Z. and D.L.; Methodology, D.L.; Software, J.W.; Validation, Z.Z.; Formal analysis, J.W. and D.L.; Investigation, J.W.; Resources, D.L.; Data curation, J.W.; Writing—original draft, J.W.; Writing—review & editing, J.W., Z.Z. and D.L.; Supervision, Z.Z. All authors have read and agreed to the published version of the manuscript.
Funding
This research is funded by the National Natural Science Foundation of China, grant numbers 52471302 and 52171316.
Data Availability Statement
The original contributions presented in this study are included in the article. Further inquiries can be directed to the corresponding author(s).
Conflicts of Interest
The authors declare no conflict of interest.
References
- Li, D.; Li, D.; Li, F.; Shi, J.; Zhang, W. Analysis of Floating Buoy of a Wave Power Generating Jack-Up Platform Haiyuan 1. Adv. Mech. Eng. 2013, 5, 105072. [Google Scholar] [CrossRef]
- Windt, C.; Davidson, J.; Ransley, E.J.; Greaves, D.; Jakobsen, M.; Kramer, M.; Ringwood, J.V. Validation of a CFD-Based Numerical Wave Tank Model for the Power Production Assessment of the Wavestar Ocean Wave Energy Converter. Renew. Energy 2020, 146, 2499–2516. [Google Scholar] [CrossRef]
- Seiffert, B.; Ertekin, R.C. Numerical Modeling of Solitary and Cnoidal Waves Propagating over a Submerged Bridge Deck. In Proceedings of the 2012 Oceans—Yeosu, Yeosu, Republic of Korea, 21–24 May 2012; pp. 1–4. [Google Scholar]
- Douglas, S.; Nistor, I. On the Effect of Bed Condition on the Development of Tsunami-Induced Loading on Structures Using OpenFOAM. Nat. Hazards 2015, 76, 1335–1356. [Google Scholar] [CrossRef]
- Farvizi, F.; Melville, B.W.; Shamseldin, A.Y.; Shafiei, S.; Hendi, E. Experimental Investigation of Tsunami Bore-Induced Forces and Pressures on Skewed Box Section Bridges. Ocean Eng. 2021, 224, 108730. [Google Scholar] [CrossRef]
- Mokhtar, Z.A.; Mohammed, T.A.; Yusuf, B.; Lau, T.L. Experimental Investigation of Tsunami Bore Impact Pressure on a Perforated Seawall. Appl. Ocean Res. 2019, 84, 291–301. [Google Scholar] [CrossRef]
- Hu, Z.; Xue, H.; Tang, W.; Zhang, X. A Combined Wave-Dam-Breaking Model for Rogue Wave Overtopping. Ocean Eng. 2015, 104, 77–88. [Google Scholar] [CrossRef]
- Sun, S.; Du, W.; Li, H. Study on Green Water of Tumblehome Hull Using Dam-Break Flow and Ranse Models. Pol. Marit. Res. 2017, 24, 172–180. [Google Scholar] [CrossRef]
- Kim, S.-J.; Koo, W.; Shin, M.-J. Numerical Study on Multi-Buoy-Type Wave Energy Converter Platform with Hydraulic PTO System. In Proceedings of the OCEANS 2017—Aberdeen, Aberdeen, UK, 19–22 June 2017; pp. 1–8. [Google Scholar]
- Shi, H.; Zhao, C.; Liu, Z.; Cao, F. Study on Hydraulic System Efficiency of Heaving-Buoy Wave Energy Converter. J. Ocean Univ. China 2018, 17, 1044–1052. [Google Scholar] [CrossRef]
- Xu, J.; Yang, Y.; Hu, Y.; Xu, T.; Zhan, Y. MPPT Control of Hydraulic Power Take-Off for Wave Energy Converter on Artificial Breakwater. J. Mar. Sci. Eng. 2020, 8, 304. [Google Scholar] [CrossRef]
- Li, C.; Zhang, D.; Zhang, W.; Liu, X.; Tan, M.; Si, Y.; Qian, P. A Constant-Pressure Hydraulic PTO System for a Wave Energy Converter Based on a Hydraulic Transformer and Multi-Chamber Cylinder. Energies 2021, 15, 241. [Google Scholar] [CrossRef]
- Roh, C. Maximum Power Control Algorithm for Power Take-Off System Based on Hydraulic System for Floating Wave Energy Converters. J. Mar. Sci. Eng. 2022, 10, 603. [Google Scholar] [CrossRef]
- Liu, Z.; Huang, W.; Liu, S.; Wu, X.; Lai, C.S.; Yang, Y. An Improved Hydraulic Energy Storage Wave Power-Generation System Based on QPR Control. Energies 2023, 16, 647. [Google Scholar] [CrossRef]
- Li, D.; Sharma, S.; Wang, T.; Borthwick, A.G.L.; Dong, X.; Shi, H. Optimal Hydraulic PTO and Linear Permanent Magnet Generator for a Floating Two-Buoy Wave Energy Converter. Renew. Energy 2024, 234, 121231. [Google Scholar] [CrossRef]
- Jia, H.; Pei, Z.; Tang, Z.; Li, M. Modeling, Analysis and Control of an Inertial Wave Energy Converter and Hydraulic Power Take-off Unit. Sci. Rep. 2025, 15, 7650. [Google Scholar] [CrossRef] [PubMed]
- Lai, W.; Li, J.; Rong, S.; Yang, H.; Zheng, X. Research on the Performance Optimization of a Hydraulic PTO System for a “Dolphin 1” Oscillating-Body Wave Energy Converter. China Ocean Eng. 2025, 39, 166–178. [Google Scholar] [CrossRef]
- Sjökvist, L.; Göteman, M. Peak Forces on a Point Absorbing Wave Energy Converter Impacted by Tsunami Waves. Renew. Energy 2019, 133, 1024–1033. [Google Scholar] [CrossRef]
- Brito, M.; Bernardo, F.; Neves, M.G.; Neves, D.R.C.B.; Crespo, A.J.C.; Domínguez, J.M. Numerical Model of Constrained Wave Energy Hyperbaric Converter under Full-Scale Sea Wave Conditions. J. Mar. Sci. Eng. 2022, 10, 1489. [Google Scholar] [CrossRef]
- Tang, Z.; Zhang, Y.; Wan, D. Numerical Simulation of 3-D Free Surface Flows by Overlapping MPS. J. Hydrodyn. 2016, 28, 306–312. [Google Scholar] [CrossRef]
- Amaro, R.A.; Cheng, L.-Y.; Buruchenko, S.K. A Comparison Between Weakly-Compressible Smoothed Particle Hydrodynamics (WCSPH) and Moving Particle Semi-Implicit (MPS) Methods for 3D Dam-Break Flows. Int. J. Comput. Methods 2021, 18, 2050036. [Google Scholar] [CrossRef]
- Zhang, G.; Zha, R.; Wan, D. MPS–FEM Coupled Method for 3D Dam-Break Flows with Elastic Gate Structures. Eur. J. Mech.–B/Fluids 2022, 94, 171–189. [Google Scholar] [CrossRef]
- Quartier, N.; Crespo, A.J.C.; Domínguez, J.M.; Stratigaki, V.; Troch, P. Efficient Response of an Onshore Oscillating Water Column Wave Energy Converter Using a One-Phase SPH Model Coupled with a Multiphysics Library. Appl. Ocean Res. 2021, 115, 102856. [Google Scholar] [CrossRef]
- Quartier, N.; Vervaet, T.; Fernandez, G.V.; Domínguez, J.M.; Crespo, A.J.C.; Stratigaki, V.; Troch, P. High-Fidelity Numerical Modelling of a Two-WEC Array with Accurate Implementation of the PTO System and Control Strategy Using DualSPHysics. Energy 2024, 296, 130888. [Google Scholar] [CrossRef]
- Yun, S.-M.; Shin, H.-S.; Park, J.-C. Two-Way Coupling Simulation of Fluid-Multibody Dynamics for Estimating Power Generation Performance of Point Absorber Wave Energy Converters. Energies 2024, 17, 930. [Google Scholar] [CrossRef]
- Capasso, S.; Tagliafierro, B.; Martínez-Estévez, I.; Altomare, C.; Gómez-Gesteira, M.; Göteman, M.; Viccione, G. Development of an SPH-Based Numerical Wave–Current Tank and Application to Wave Energy Converters. Appl. Energy 2025, 377, 124508. [Google Scholar] [CrossRef]
- Li, D.; Zhang, H.; Qin, G. Numerical Simulation of Violent Interactions between Dam Break Flow and a Floating Box Using a Modified MPS Method. J. Ocean Eng. Sci. 2025, 10, 535–548. [Google Scholar] [CrossRef]
- Zhang, S.; Morita, K.; Fukuda, K.; Shirakawa, N. An Improved MPS Method for Numerical Simulations of Convective Heat Transfer Problems. Int. J. Numer. Methods Fluids 2006, 51, 31–47. [Google Scholar] [CrossRef]
- Tsuruta, N.; Khayyer, A.; Gotoh, H. A Short Note on Dynamic Stabilization of Moving Particle Semi-Implicit Method. Comput. Fluids 2013, 82, 158–164. [Google Scholar] [CrossRef]
- Tsuruta, N.; Khayyer, A.; Gotoh, H. Space Potential Particles to Enhance the Stability of Projection-Based Particle Methods. Int. J. Comput. Fluid Dyn. 2015, 29, 100–119. [Google Scholar] [CrossRef]
- Xujie, P.; Huaixin, Z.; Xueyao, S. A Free Surfacetraced Method for Moving Particle Semi-Implicit Method. Shanghai Jiaotong Daxue Xuebao/J. Shanghai Jiaotong Univ. 2010, 44, 134–138. [Google Scholar]
- Wang, D.; Dong, S. Experimental Investigation on the Interactions Between Dam-Break Flow and a Floating Box. J. Ocean Univ. China 2022, 21, 633–646. [Google Scholar] [CrossRef]
- Lobovský, L.; Botia-Vera, E.; Castellana, F.; Mas-Soler, J.; Souto-Iglesias, A. Experimental Investigation of Dynamic Pressure Loads during Dam Break. J. Fluids Struct. 2014, 48, 407–434. [Google Scholar] [CrossRef]


Disclaimer/Publisher’s Note: The statements, opinions and data contained in all publications are solely those of the individual author(s) and contributor(s) and not of MDPI and/or the editor(s). MDPI and/or the editor(s) disclaim responsibility for any injury to people or property resulting from any ideas, methods, instructions or products referred to in the content. |
© 2025 by the authors. Licensee MDPI, Basel, Switzerland. This article is an open access article distributed under the terms and conditions of the Creative Commons Attribution (CC BY) license (https://creativecommons.org/licenses/by/4.0/).