Article

Assessing the Effectiveness of 3D-Printed Ceramic Structures for Coral Restoration: Growth, Survivorship, and Biodiversity Using Visual Surveys and eDNA

1
School of Biological Sciences, The Swire Institute of Marine Science, The University of Hong Kong, Hong Kong, China
2
Agriculture, Fisheries and Conservation Department, The Government of the Hong Kong Special Administrative Region (HKSAR), Hong Kong, China
3
Simon F.S. Li Marine Science Laboratory, School of Life Sciences, The Chinese University of Hong Kong, Hong Kong, China
*
Author to whom correspondence should be addressed.
These authors contributed equally to the work and should be considered as joint first author.
J. Mar. Sci. Eng. 2025, 13(9), 1605; https://doi.org/10.3390/jmse13091605
Submission received: 22 July 2025 / Revised: 18 August 2025 / Accepted: 20 August 2025 / Published: 22 August 2025
(This article belongs to the Section Marine Ecology)

Abstract

Coral reef degradation has spurred the development of artificial structures to mitigate losses in coral cover. These structures serve as substrates for coral transplantation, with the expectation that growing corals will attract reef-associated taxa—while the substrate’s ability to directly support biodiversity is often neglected. We evaluated a novel 3D-printed modular tile made of porous terra cotta, designed with complex surface structures to enhance micro- and cryptic biodiversity, through a restoration project in Hong Kong. Over four years, we monitored 378 outplanted coral fragments using diver assessments and photography, while biodiversity changes were assessed through visual surveys and eDNA metabarcoding. Coral survivorship was high, with 88% survival after four years. Visual surveys recorded seven times more fish and almost 60% more invertebrates at the restoration site compared to a nearby unrestored area. eDNA analyses revealed a 23.5% higher eukaryote ASV richness at the restoration site than the unrestored site and 13.3% greater richness relative to a natural reference coral community. This study highlights the tiles’ dual functionality: (1) supporting coral growth and (2) enhancing cryptic biodiversity, an aspect often neglected in traditional reef restoration efforts. Our findings underscore the potential of 3D-printed ceramic structures to improve both coral restoration outcomes and broader reef ecosystem recovery.

1. Introduction

Coral reefs are declining at an alarming rate. Driven by the combined impacts of climate change, overfishing, eutrophication, and coastal development, coral cover worldwide has already declined by over 50% since the late 20th century, with some regions—such as the Caribbean—experiencing losses of more than 80% [1,2,3,4]. As mass bleaching events and coral mortality become more frequent and intense, over 90% of the world’s reefs are projected to face severe degradation by the middle of the century [5,6]. This collapse threatens not only marine biodiversity—with up to a quarter of all marine species depending on coral reefs [7,8]—but also the livelihoods of roughly 500 million people and ecosystem services valued at up to USD 350,000 per hectare annually [9,10].
In response, Artificial Reefs (ARs) have emerged as widely adopted interventions to stabilize degraded reef structures, promote coral settlement, and support broader ecological recovery [11,12]. ARs range from simple rubble piles and concrete blocks to complex, biomimetic structures designed to increase surface area, reduce hydrodynamic stress, and provide microhabitats for diverse marine organisms [13]. When combined with coral outplanting, ARs can enhance survivorship and potentially accelerate the recovery of benthic communities. However, many ARs remain reliant on non-biocompatible materials, provide minimal fine-scale habitat complexity, and are unsuited for sediment-laden or high-energy environments. In addition, few artificial structures produced for coral reef restoration explicitly consider cryptic biodiversity or long-term ecological function in their design, with most focusing solely on mitigating losses in coral cover [12].
To address these limitations, we developed a ceramic 3D-printed reef tile, engineered from terracotta clay and designed to integrate both coral restoration and biodiversity enhancement through a scalable, modular design. The tiles feature a hexagonal configuration and fine-scale topography intended to promote coral attachment, reduce sediment smothering, and replicate natural reef crevices, thus facilitating larval recruitment and benthic colonization [14,15]. Unlike conventional concrete ARs, the reef tiles are deployable directly onto soft benthic substrates without complex substrate engineering, offering a low-impact solution for challenging or urbanized environments. The material properties of terracotta—being porous, erosion-resistant, and biocompatible—further support microbial colonization and ecological succession, enhancing both coral health and overall habitat function [16,17]. However, the effectiveness of these design choices requires empirical validation. Beyond coral fragment survivorship, the potential of the artificial structures and the outplanted coral community to facilitate the reassembly of reef-associated taxa—which are critical for restoring ecological function—must also be assessed under dynamic, real-world conditions.
While coral survivorship remains a central restoration target, ecosystem resilience depends equally on the reassembly of diverse coral-associated communities that sustain trophic interactions and contribute to reef function [11,18,19,20]. Owing to their relative ease of identification, sensitivity to environmental disturbance, and role in mitigating macroalgal overgrowth, macroinvertebrates and fish are often the only targets for biodiversity monitoring in coral restoration projects [21]. Beyond these two taxonomic groups, however, are a range of organisms that provide equally critical functions on coral reefs. Crustose coralline algae provide larval settlement cues, sponges consolidate loose sediments and rubble, and smaller cryptic invertebrates feed on algae and serve as a food source for reef fish; collectively, these organisms, along with microbial communities of bacteria, algae, and fungi, facilitate nutrient cycling [22].
To capture a fuller picture of the effect of the artificial reef tiles on community diversity, we combined standard SCUBA-based visual surveys of fish and macroinvertebrates with environmental DNA (eDNA) metabarcoding, a non-invasive tool that enables detection of both conspicuous and cryptic taxa from environmental samples [23,24]. eDNA is a particularly useful tool for monitoring structurally complex systems like coral reefs, where its ability to detect a wide range of organisms complements traditional visual surveys and bridges critical gaps in current restoration monitoring frameworks [25]. In this study, we tested the ecological performance of ceramic 3D-printed reef tiles deployed in a subtropical, urbanized marine environment. We assessed coral survivorship, community reassembly, and biodiversity enhancement using a combination of visual surveys and eDNA metabarcoding. This approach aims to provide a replicable model for ecosystem-based reef rehabilitation while evaluating the performance of the tiles according to the following research question: Can this engineered substrate support coral restoration and simultaneously enhance overall biodiversity? We hypothesized that deployment of the ceramic tiles would produce (1) greater fish and macroinvertebrate abundances and (2) eukaryotic eDNA communities that were richer and distinct from those detected at an unrestored seabed. In addressing this question, our broader goal is to establish a framework for effective reef rehabilitation that not only restores coral cover but also measures and promotes the recovery of diverse reef-associated communities.

2. Materials and Methods

2.1. Study Sites

Lying just south of the Tropic of Cancer, Hong Kong supports unexpectedly high coral diversity, with more than 80 species of reef-building corals recorded across its semi-enclosed, estuarine-influenced waters [26,27,28]. This diversity is particularly noteworthy, given the region’s marked seasonal variability and persistent anthropogenic stressors, such as coastal development, salinity fluctuations, and sediment-laden runoff [29]. Coral cover in Hong Kong declined substantially over the past century, driven by acute stressors such as thermal anomalies and extreme weather events, alongside chronic local pressures like nutrient enrichment and elevated suspended solids [30,31]. Since the 1990s, however, water quality in Hong Kong has improved due to stricter controls on wastewater treatment [32]. Hong Kong thus presents a suitable environment to explore the viability of re-introducing extirpated corals following a reduction in the extent of local environmental stressors [26].
This study was conducted within Hoi Ha Wan Marine Park (HHWMP; 22°28′13.68″ N, 114°20′08.25″ E), located in the northeastern waters of the Sai Kung Peninsula, Hong Kong SAR (Figure 1). Established in 1996, HHWMP spans approximately 260 hectares and is known for its diverse subtropical coral communities, supporting more than 60 species of hard corals [33] (AFCD Report, 2004). Here, we describe environmental conditions within HHWMP over the duration of the study (1 July 2020, to 31 July 2024) using monthly surface water measurements reported by Hong Kong SAR Environmental Protection Department (EPD) for the three nearest monitoring stations (MM6, MM17, TM6; Respectively ~2 km W, NE, and SE from the study sites; https://cd.epic.epd.gov.hk/ accessed on 11 August 2025). Data from June, July, and August were used to represent summer conditions while winter averages were calculated from December, January, and February (n = 30 samples per season).
Given the monsoonal climate of Hong Kong, the park experiences pronounced seasonal variation, with average summer and winter temperatures of 29.2 °C (SD = 1.2 °C) and 19.6 °C (SD = 1.7 °C), respectively. Salinity is modulated by monsoonal rainfall and freshwater inflow, being lower in the summer (30.2 PSU, SD = 2.6) than in the winter (32.9 PSU, SD = 0.7). Within the park, nitrogen concentrations (Summer: 0.3 mg/L total nitrogen, SD = 0.2; Winter: 0.5 mg/L total nitrogen, SD = 0.2) are less seasonally variable; While not directly measured by the EPD, previous work has demonstrated that nitrogen regimes in eastern Hong Kong are dominated by dissolved organic nitrogen [34]. Turbidity is less seasonally variable within the park (Summer: 3.6 NTU, SD = 3.2; Winter: 3.7 NTU, SD = 4.4) and is generally lower than in the western waters of Hong Kong. These conditions, combined with proximity to urbanized coastal zones, position HHWMP as a representative site for testing coral restoration strategies in marginal, subtropical reef environments.
Three ecologically distinct sites within HHWMP were selected for comparative analysis (Figure 1). The restored site, off Coral Beach, served as the primary deployment area for the reef tiles. Prior to the installation of the artificial structures, this site was a sandy seabed with no coral cover or hard substrate. Approximately 50 m north of the restored area, parallel to the shoreline, the unrestored site comprised a section of sandy seabed with no artificial substrate, representing a degraded benthic baseline with no intervention. The reference site, situated at Gruff Head approximately 500 m west of the restored site, featured a natural coral assemblage and minimal anthropogenic disturbance. This site was selected to represent a realistic restoration target for community diversity and function. All three sites were located at comparable depths (6–8 m) and experienced similar hydrodynamic and environmental conditions.

2.2. Reef Tile Design

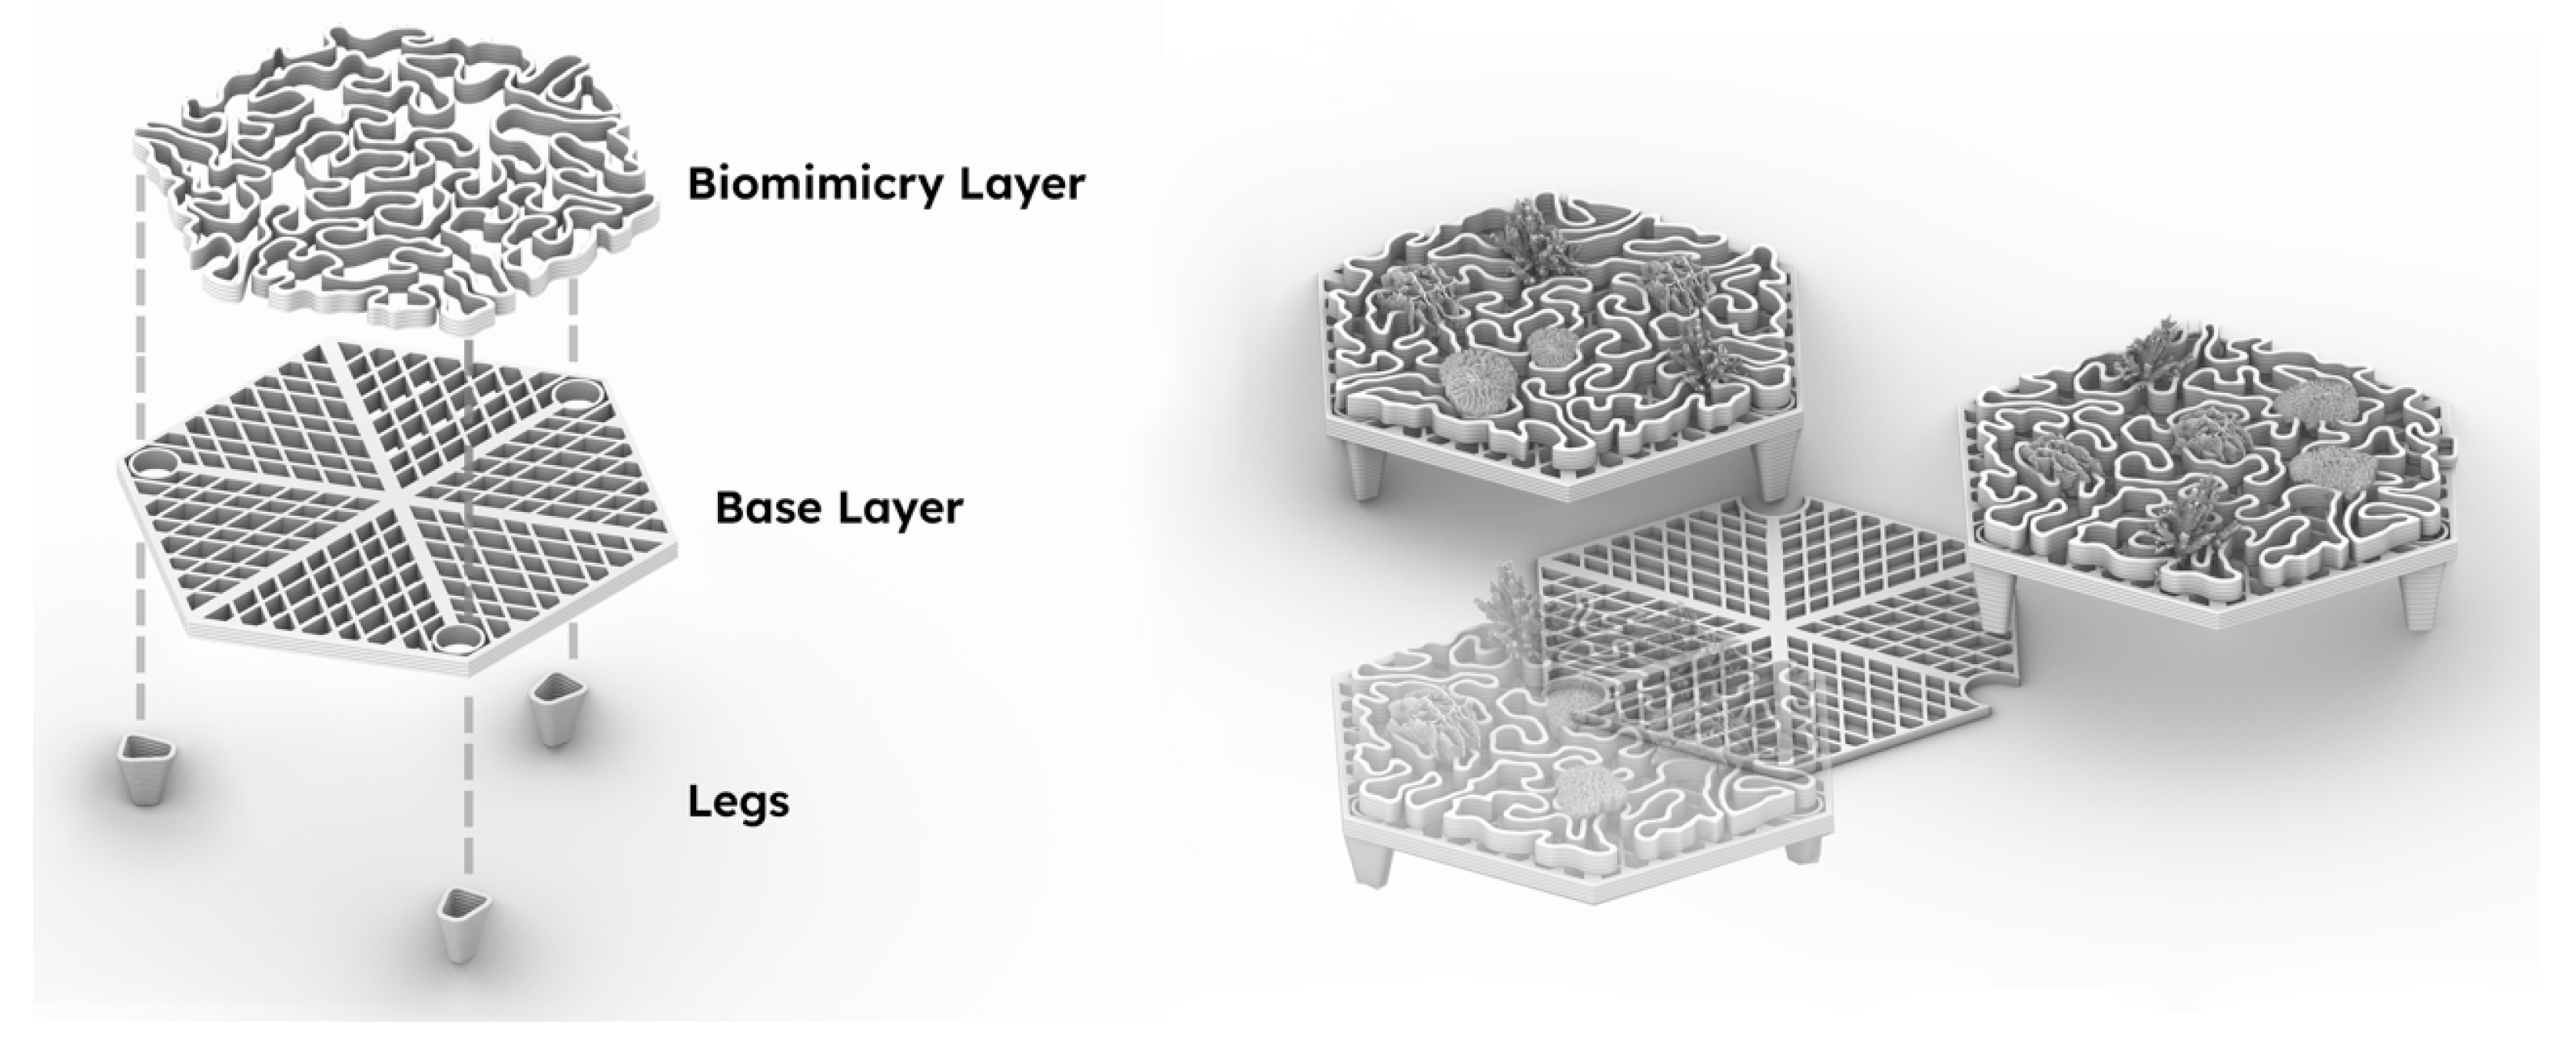
The 3D-printed ceramic reef tiles used in this study were custom-engineered ceramic substrates designed to promote coral recruitment, enhance structural complexity, and mitigate sediment accumulation in a subtropical marine environment. Each tile was hexagonal in shape, with a maximum width of 650 mm, and comprised two integrated functional layers: a structural base layer (“grid layer”) and a biomimetic surface layer (“coral layer”) (Figure 2). The grid layer featured a diagrid framework with integrated lateral bracing to maximize mechanical stability while minimizing material usage and fabrication defects. The geometry was optimized to reduce cracking during drying and thermal stress during firing, with a print path totaling approximately 170 m in length. This design facilitated uniform moisture evaporation and enhanced compressive strength under load. To improve hydrodynamic performance and minimize sediment deposition, a three-legged footing system was printed on the underside of each tile after drying (Figure 2). These legs elevated the tile slightly above the seabed to promote water flow and create a sheltered interface for benthic recruitment.
Fabrication of the 3D-printed reef tiles was performed using a Direct Ink Writing (DIW) method with an ABB 6700 robotic arm (Tennessee Industrial Electronics, La Vergne, TN, USA) and a linear ram extruder (with a 6 mm nozzle diameter, Deltabots, Port St. Lucie, FL, USA). The paste material consisted of red terracotta clay (P1331, Potterycrafts Ltd., Stoke-on-Trent, UK) amended with <1% fine crystalline silica. Tiles were printed with a layer height of 2.7 mm at extrusion speeds ranging from 10.5 to 17 mm/s depending on local path geometry. After air-drying and structural inspection, the tiles were fired in a gas kiln at 1125 °C, yielding a mean shrinkage of approximately 11%.

2.3. Restoration Site Design

The coral restoration experiment was conducted within a 10 m × 35 m plot at the restored site (Coral Beach) in Hoi Ha Wan Marine Park (Figure 3). Within this plot, a total of 24 modular reef units—comprising 72 reef tiles—were deployed in a grid layout with 5 m spacing between units. Each unit consisted of three interlocked tiles arranged in a triangular configuration (Figure 2). This modular design enhanced structural heterogeneity while facilitating standardized monitoring across units.
Each reef tile was seeded with six coral fragments, evenly spaced to ensure uniform coverage, representing three distinct morpho-functional groups: Acropora (branching), Pavona (plating), and Platygyra (massive). Pavona and Platygyra fragments were collected as Corals of Opportunity within HHWMP, while Acropora fragments were sourced from healthy donor colonies at Bluff Island (~8 km distance from the restoration site), because they are locally extirpated within the marine park. A total of 378 fragments were transplanted to the restoration site, with 126 fragments per genus. Coral fragments were secured using marine-grade epoxy (Z-Spar A-788, Pettit, Greensboro, NC, USA).

2.4. Monitoring Coral Survivorship and Growth

Coral performance was assessed quarterly for four years following transplantation, beginning three months after outplanting. SCUBA divers visually examined each coral fragment for signs of bleaching or discoloration at each survey interval. Four conditions were assigned to the coral fragments: healthy, partial mortality, detached, and dead. Corals were considered alive if they were healthy or showed signs of partial mortality; those classified as dead or detached were not counted as having survived. Instances of breakage were also recorded as they occurred. During each monitoring event, high-resolution photographs of each tile and its attached coral fragments were captured using an underwater digital camera (Olympus TG5, Olympus Corp., Tokyo, Japan). Each image included a scale bar placed on the tile, which served as a calibration reference for accurate spatial measurements. Growth measurements were extracted from these photographs using ImageJ software (v1.52n), recording the maximum linear extension of each coral fragment at each survey date.
Extension rates (cm month−1 linear growth) for each coral individual were calculated based on the change in size from the initial measurement to the monitoring survey:
E x t e n s i o n   r a t e i = S i z e i S i z e i n i t i a l T i m e i
where Sizei represents the size at the monitoring survey (cm), Sizeinitial is the initial size measurement (cm), and Timei is the time interval (in months) since the initial measurement. Broken fragments were excluded from growth rate calculations (for all survey dates following the first notice of breakage).
Differences in extension rates and breakage between genera were analyzed using generalized linear mixed models (GLMMs). For extension rates, the model was fitted with the glmmTMB package (v1.1.12) [36], which included fixed effects for genus, with a random factor specified for the position of coral fragments nested within transplantation tiles, which were themselves nested within units to capture variability at multiple hierarchical levels. To address temporal autocorrelation among repeated measures on the same coral fragment, a first-order autoregressive (AR1) variance structure was incorporated. Model selection was performed using Akaike’s Information Criterion (AIC) to identify the best-fitting GLMMs (Table A1). Due to the binomial nature of the breakage data, models were fitted using the lme4 package (v1.1-37) [37]. When significant differences between genera were detected, pairwise comparisons of estimated marginal means were performed using the emmeans package (v1.11.2) [38], applying the Kenward-Roger degrees of freedom method and Tukey-adjusted p-values.

2.5. Visual Fish and Invertebrate Surveys

To assess the reef community’s response to restoration, visual belt transect surveys were conducted concurrently with coral monitoring at all three study sites. At each site, three 35 m transects were laid out parallel to the shoreline, spaced 5 m apart. Two divers surveyed each transect simultaneously (one on each side), covering a total area of 70 m2 per transect (2 × 35 m2 transects). Target species (Table 1) were selected from the list of Reef Check species for Hong Kong, which identifies common fish and invertebrate that are used to represent key functional groups and responses to anthropogenic stressors acting on subtropical reef ecosystems [39]. For this study, taxa were selected to represent a range of trophic strategies–with groupers as apex predators, wrasse and sweetlips feeding on smaller fish and macroinvertebrates, urchins as herbivorous grazers, and sea cucumbers as detritivores. All of the target fish taxa, as well as the black sea cucumber, are also of commercial interest [40].
Observations from all three transects were pooled by survey date (n = 14 surveys) for summary statistics, which were also used to generate boxplots. Observations were further aggregated for all fish and all macroinvertebrate taxa to test for significant differences in their abundances between sites. As both the fish and macroinvertebrate count data exhibited non-normal distribution (Shapiro-Wilk test p < 0.001) and non-homogenous variance (Levene test p < 0.001), a non-parametric Kruskal-Wallis rank sum test was performed using the kruskal.test() function of the stats package. Significant results were then followed by pairwise Wilcox tests (using the pairwise.wilcox.test() function), with a Holm-Bonferroni correction applied to account for multiple comparisons.

2.6. Environmental DNA Metabarcoding

2.6.1. DNA Sampling, Extraction, Amplification, and Sequencing

Two years after the artificial tile deployment, sedimentary environmental DNA (eDNA) was sampled from all three study sites. Five replicates were collected at 5–6 m depth from each site, with 10 m distance between each replicate. Each replicate was collected in a sterile 50 mL falcon tube, collecting sediment from only the top 1 cm of the seafloor. Samples were transported back to the laboratory on ice and stored at −20 °C within three hours of collection. Each sample was homogenized using a sterile spatula and plastic tray, and a 500 mg aliquot of bulk sediment weighed for extraction. DNA was extracted using the DNeasy PowerMax Soil Kit following the manufacturer’s protocol and subsequently purified using the DNeasy PowerClean Cleanup Kit (Qiagen, Hilden, Germany). The concentration of the resulting DNA extracts was quantified using the Qubit dsDNA High Sensitivity Assay (Thermo Fisher Scientific, Waltham, MA, USA).
Extracted DNA was amplified using the mlCOIintF and jgHCO2198 primer set, which amplifies a ~313 bp fragment of the cytochrome c oxidase subunit I (COI) gene to target metazoan diversity. Polymerase chain reactions (PCR) were prepared to a 20 µL total reaction volume. The reaction mixture included 2 µL of 10× Advantage 2 PCR Buffer (Takara Bio, Kusatsu, Japan), 0.4 µL of 50× Advantage 2 Polymerase Mix, 1.4 µL of a 50× dNTP Mix (10 mM of each dNTP), 1 µL of each primer (10 pmol/µL), 0.5 μL Bovine Serum Albumin (BSA, 20 mg/mL; Thermo Fisher Scientific, Waltham, MA, USA), and 10 to 30 ng of template DNA. The following thermocycling parameters were used: an initial 1 min at 95 °C, followed by 16 cycles of denaturing at 95 °C for 10 s, annealing at 62 °C for 30 s, and extension at 72 °C for 1 min, ending with 10 min of final extension at 72 °C. To increase the probability of amplification for low-copy DNA sequences, DNA extracted from each sample was amplified in triplicate. At a minimum, one PCR control was performed per seven sample reactions using autoclaved MQ as the template. PCR products were visualized via electrophoresis in a 2% agarose gel. Triplicate amplification products for each sample were then pooled and subsequently purified using the QIAquick Gel Extraction Kit (Qiagen, Hilden, Germany). A unique 6 bp index was attached to each pooled sample using an indexing primer.
Library preparation and sequencing was completed by Genewhiz (Suzhou, China). All 15 samples submitted for sequencing passed initial quality control, with DNA concentrations ranging between 0.2 and 23.4 ng/μL. Sequencing was performed on an Illumina MiSeq system. A total of 24.6 million 251 bp paired-end reads were generated, with 1.4 to 1.8 million reads per sample. A binned quality score of Q30 (indicating base-call accuracy of 99.9%) was given to 90% of base calls.

2.6.2. Bioinformatics

Sequence Analysis and Quality Control
Raw sequencing reads were processed in QIIME2 (v2022.2) [47] using the DADA2 plugin (v1.22) [48]. Reads were demultiplexed to separate individual samples in QIIME2. The denoise-paired function of DADA2 was then used to trim primers, remove low-quality sequence regions, denoise and join paired reads, dereplicate duplicate sequences, and remove chimeric sequences. No modifications were made to the default parameters of this function. Forward and reverse reads were both trimmed by 26 bp at the 5′ end and truncated at the 3′ end at 250 bp. A total of 117,673 amplicon sequence variants (ASVs), comprising 18,704,812 reads, were inferred. Taxonomy was then assigned using the Ribosomal Database Program (RDP) [49], with a pre-trained database of COI sequences [50]. Taxonomic nomenclature was manually edited as needed to adhere to the terminology established by the World Register of Marine Species (WoRMS; www.marinespecies.org, accessed on 19 August 2025).
Following taxonomic assignment, data were imported into R (v4.2.1) [51] for further filtering and analysis using the phyloseq package (v1.38) [52]. Alpha rarefaction curves were plotted using the ggrare() function of the ranacapa package (v0.1) [53]. One sample from the unrestored site had anomalously low ASV richness (974 ASVs) relative to other samples from the same site (4813 to 16,559 ASVs per sample; Figure 2). The overwhelming majority of reads from this sample (>95.6%) were assigned to only two species. This sample did not meet quality standards and was removed from the dataset. Singletons (1050 ASVs) were then removed, and sequences assigned to Bacteria (23,568 ASVs), Archaea (3 ASVs), or terrestrial taxa (6431 ASVs) were discarded.
Stringent prevalence and abundance filters were applied to eliminate spurious ASVs produced by background sequencing errors during apparent over-sequencing (i.e., number of unique sequences exceeded realistic biological diversity in samples [54]; Figure A1). Only ASVs that appeared in at least three samples from each site were retained: samples were grouped by site using the subset_samples function, the phyloseq_filter_prevalence function (prevalence threshold = 0.6) was then applied to each of the site subsets, and the subsets subsequently combined into one phyloseq object. To mitigate bias in prevalence filtering introduced by unequal replication between sites, a mock sample was generated by randomly sampling from a combined pool of ASVs from all other unrestored site samples (seed value = 852). The prevalence filter removed 94.8% of the remaining ASVs (81,583 ASVs), which accounted for 41.8% of the remaining sequencing reads. The mock sample was then removed from the dataset: Five sample replicates for the Restoration and Reference sites and four replicates for the Unrestored sites thus remained for all downstream filtering and analysis. ASVs were then filtered based on abundance. Those with a cumulative read abundance of fewer than 50 total counts across all samples (493 ASVs) were removed. Samples were then rarefied to an even sequencing depth (96,443 reads per sample, 90% of the depth of the sample with the lowest number of reads; Figure A1). No ASVs were removed through rarefaction.
Community Diversity Analysis
All analyses were performed in R using phyloseq (v1.38) [44]. Figures were created using ggplot2 (v3.5) [55]. A tandem approach was adopted to examine taxonomic composition and differences in community structure between sites, using both occurrence and relative read abundance data. Two transformed ASV tables were utilized: one in which read counts were converted to a binary presence-absence matrix, and another in which read counts were retained and normalized through Hellinger transformation. For metrics and visualizations based on the site-level eDNA community, ASV counts for each replicate were merged by site prior to transformation.
Observed ASV richness was used to measure alpha diversity, comparing both the number of unique ASVs detected across all samples for each site and the ASV richness of each replicate by site. To test whether there was a significant difference in sample ASV richness between sites, a one-way analysis of variance (ANOVA) was conducted with the vegan package (v2.5) [56]. Homogeneity of variance and normality were verified by Levene’s and Shapiro’s tests using the rstatix package (v0.7.2) [57]. The ASV richness of the 10 most diverse phyla by site was visualized as a stacked bar plot, with the number of ASVs among the remaining, less-represented phyla pooled into one group. A chi-squared contingency table test was used to determine whether ASV richness for individual phyla varied significantly by site, using the chisq.test() function of the stats package. Following the detection of significant differences in phylum richness between sites, a post-hoc multiple comparisons test was performed with Holm-Bonferroni adjusted p-values, using the chisq.posthoc.test package [58,59]. Amplicon sequence variant (ASV) richness for Bacillariophyta was markedly higher across all samples (1612 ASVs) compared to the other 34 phyla, which were represented by 1 to 389 ASVs (median = 17, mean = 111 ASVs; Figure A2). Bacillariophyta are comprised primarily of diatoms, a particularly diverse group of organisms that exhibit high levels of both speciation and intraspecific variation [60,61]. Although this high diversity is not unexpected biologically, it presents a potential source of statistical bias, potentially masking significant differences among less diverse phyla and increasing the likelihood of false negatives. To mitigate the bias resulting from uneven ASV richness, only phyla represented by at least 10 ASVs were included in the chi-squared analysis. Two versions of the test were performed: one including Bacillariophyta, and one excluding Bacillariophyta. For both tests, phylum richness for each site was normalized to the total ASV richness of that site (excluding Bacillariophyta from the total site richness for the latter test).
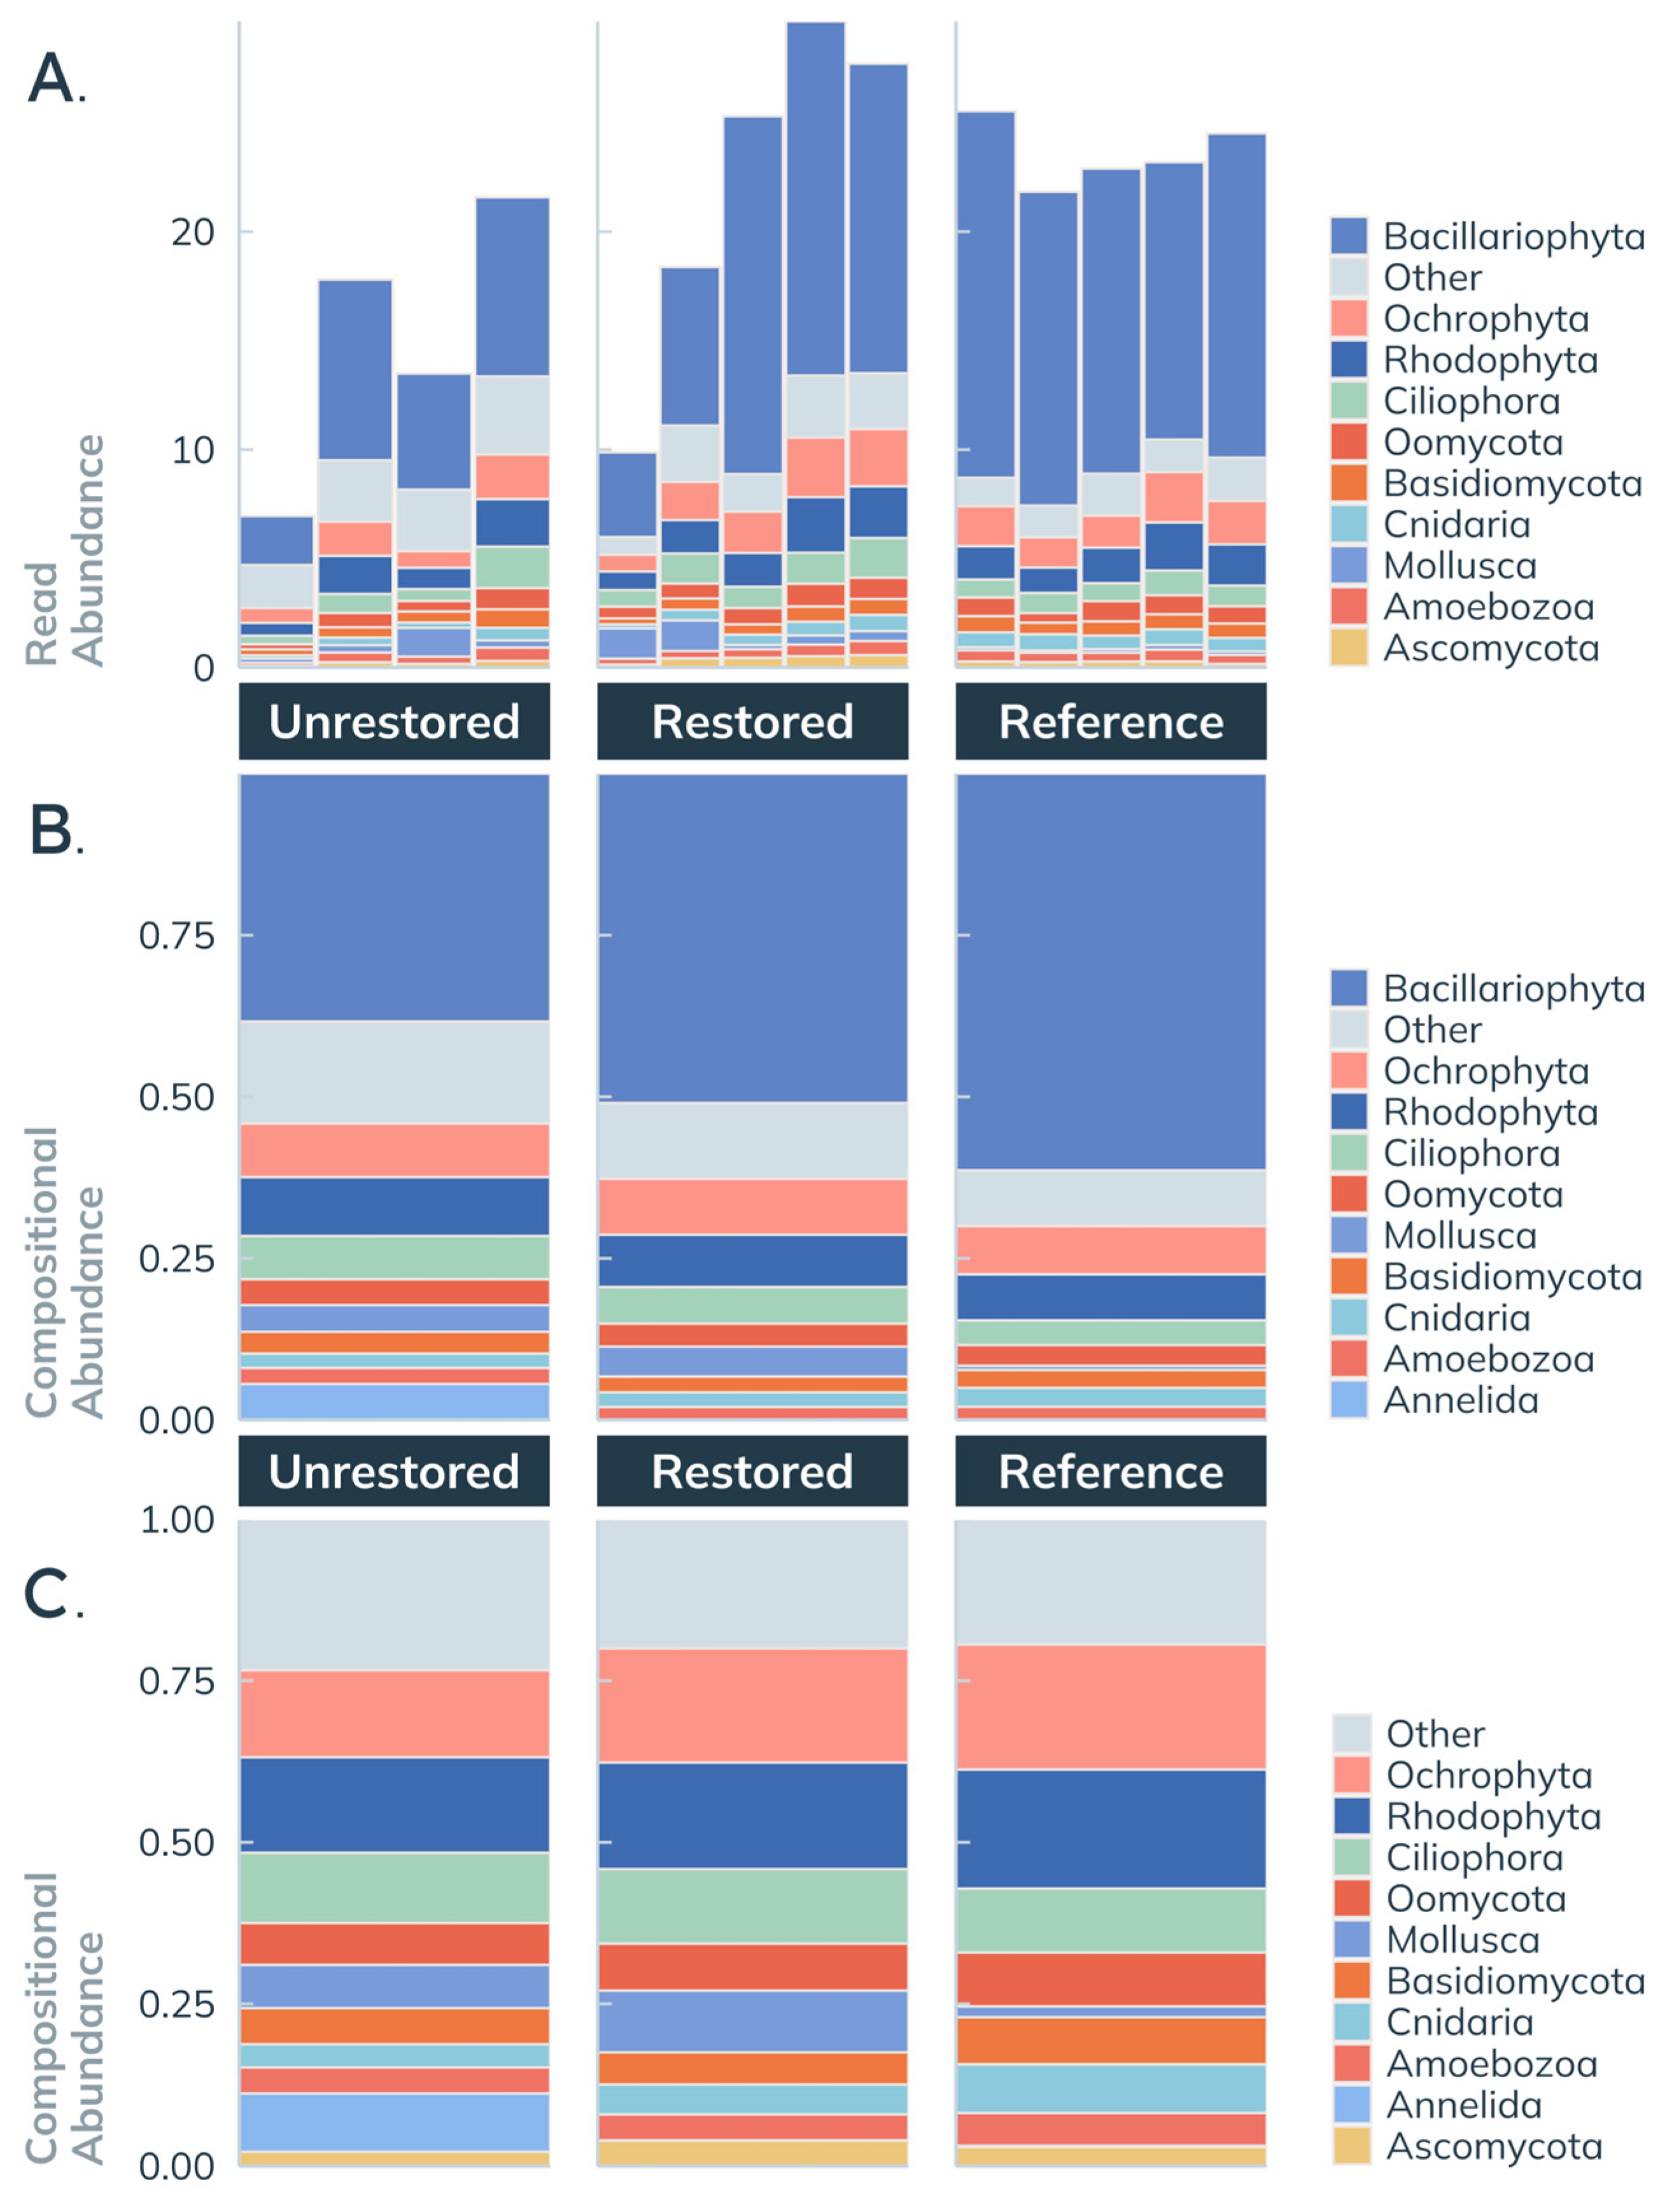
Beta diversity was assessed using two dissimilarity matrices: one based on the Jaccard index, calculated from occurrence data only, and another based on Bray-Curtis dissimilarity, calculated from Hellinger-transformed read abundances. Principal coordinate ordinations (PCoA) based on each of these matrices were produced to visualize differences in community composition between samples. Differences between sites were then tested using permutational analyses of variance (PERMANOVA) on both matrices with the adonis2 function of vegan. This was followed by post-hoc pairwise comparisons using the pairwiseAdonis wrapper for vegan [62]. To assess whether the observed differences in community composition among sites were influenced by variations in group dispersion (heterogeneity of variances), a permutational analysis of multivariate dispersions (PERMDISP) was conducted using the permutest function of vegan [56]. Taxonomic composition plots were created from the Hellinger-transformed read count matrix. Three plots were generated: (1) total Hellinger-transformed read abundance by sample, to better understand variation in sample composition among replicates from the same site; (2) compositional abundance by site, where sample data were merged, Hellinger-transformed, and then converted to relative abundance data to approximate a consensus composition for each site; and (3) another version of the same site-level compositional abundance, with Bacillariophyta sequences removed prior to transformation, to better examine differences in the relative abundance of less-abundant phyla.

3. Results

3.1. Coral Performance

3.1.1. Coral Transplant Survival

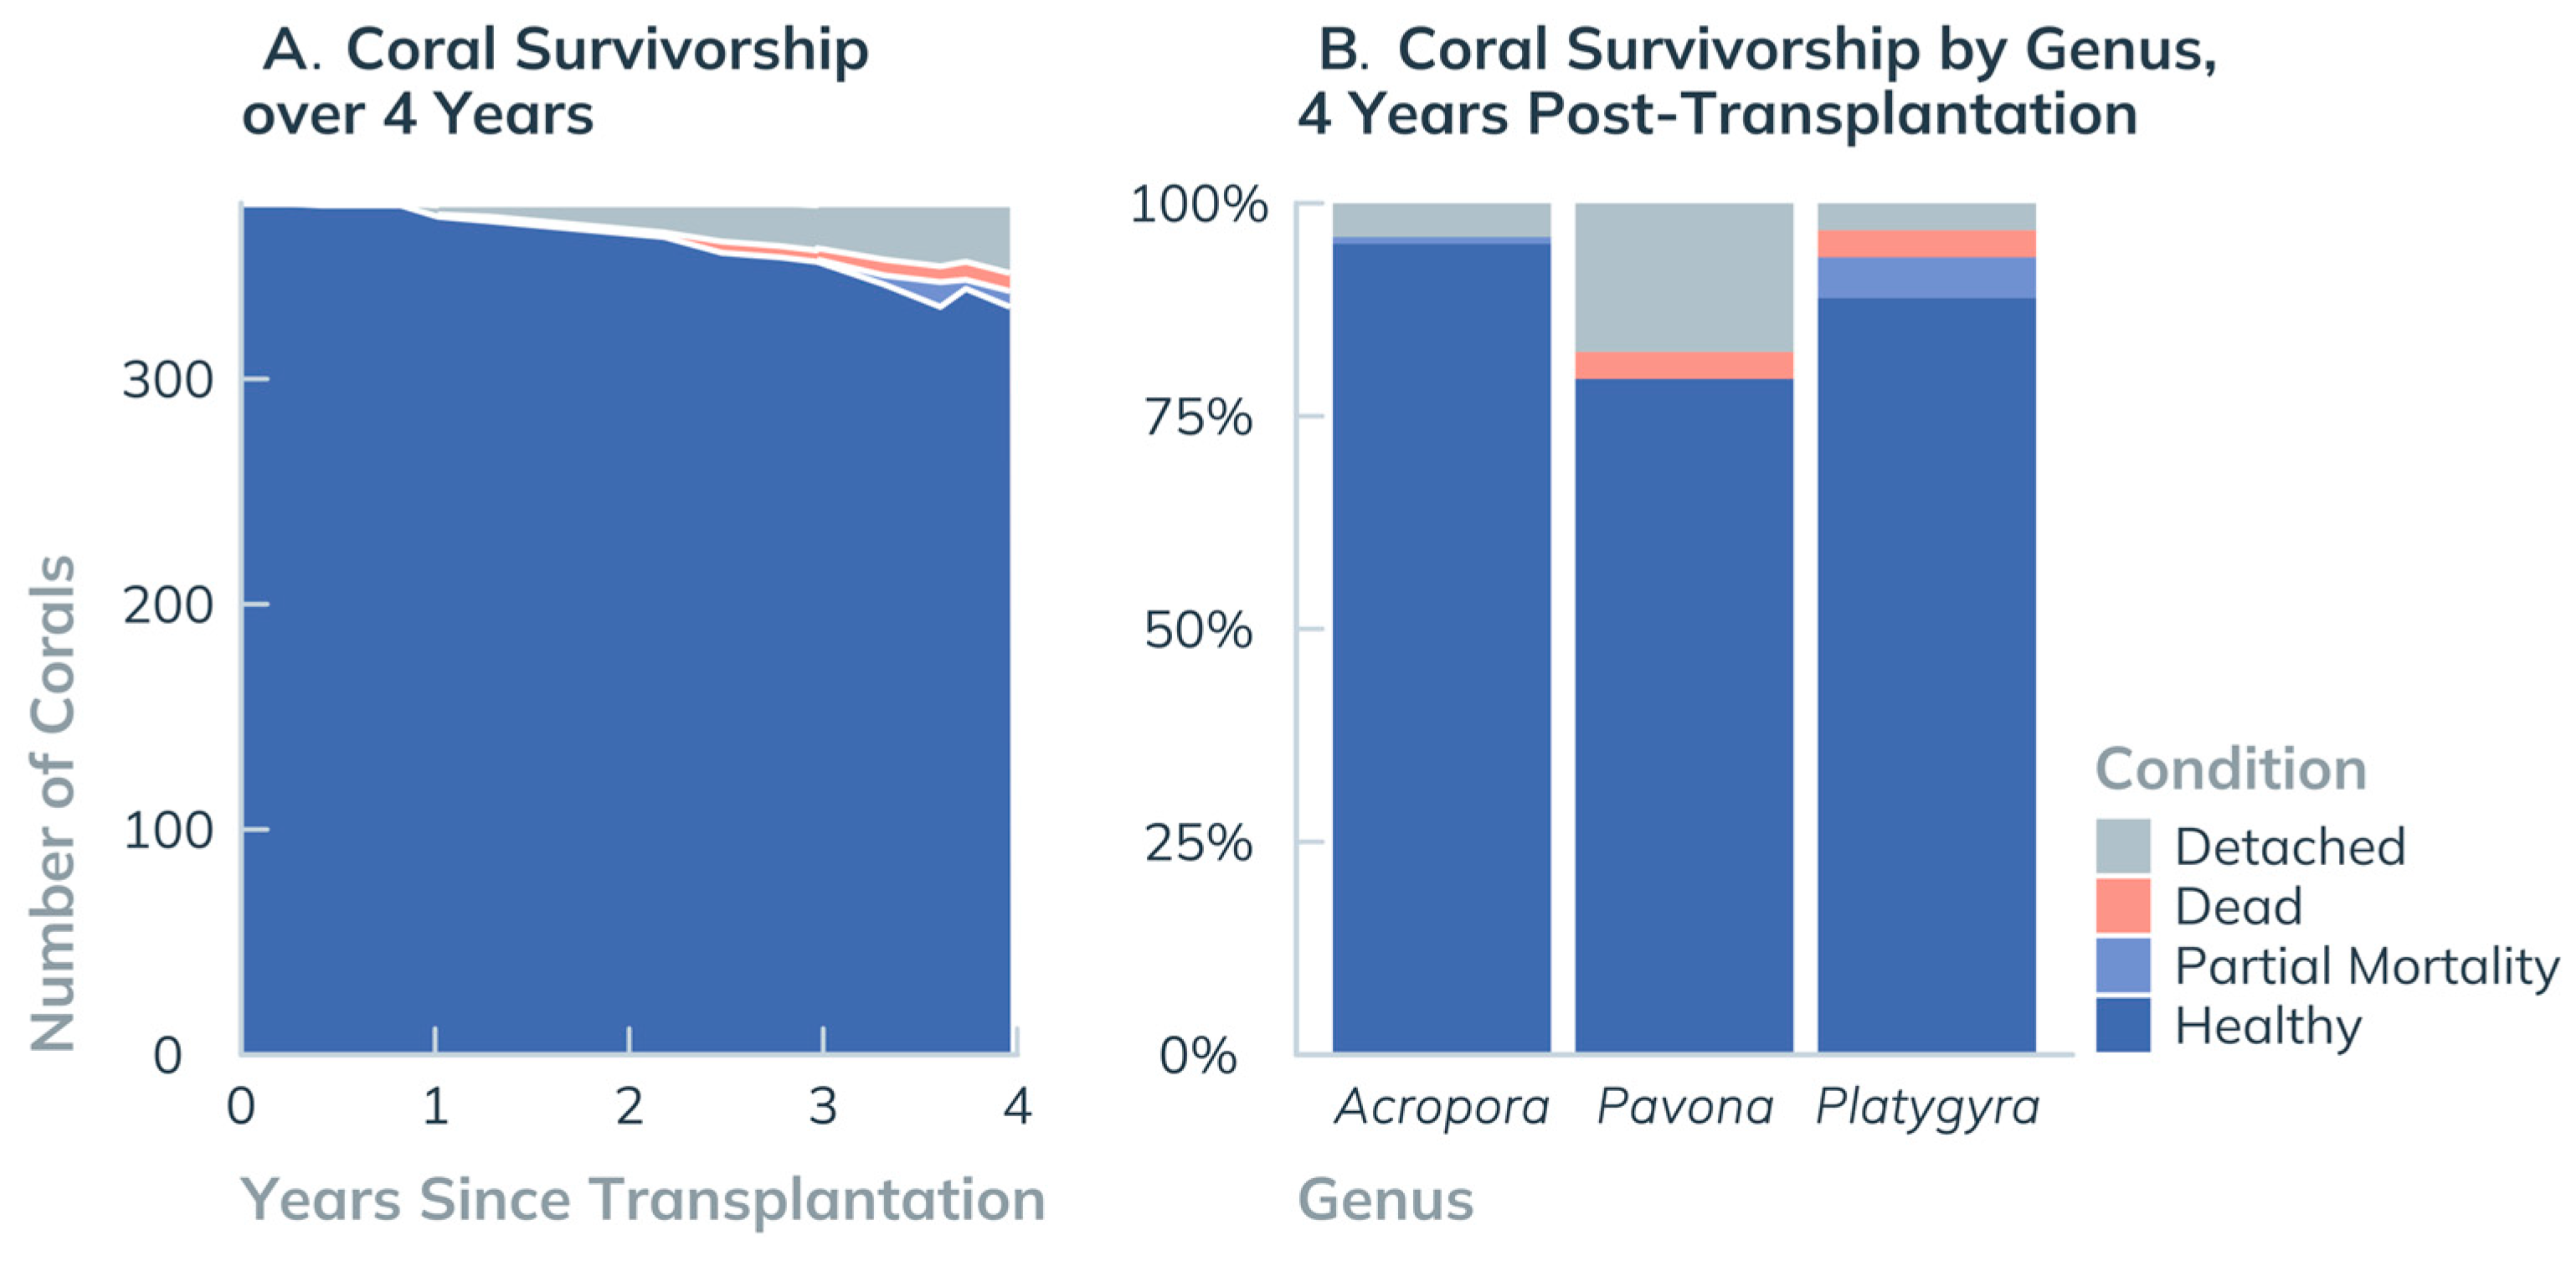
Transplanted coral fragments exhibited high survivorship throughout the four-year monitoring period, with 88% of individuals (n = 378) classified as alive (86% healthy, 2% partial mortality) and securely attached at the study’s conclusion (Figure 4 and Table A2). Only 2% of fragments experienced full mortality, while 10% were lost due to detachment from the reef tile (Table A2). The low and stable mortality and detachment rates suggest sustained substrate stability and long-term fragment viability at the restoration site. No bleaching events were recorded during the monitoring surveys.
Genus-level analysis revealed variation in survivorship and condition among the three coral growth morphologies (Figure 4). Acropora exhibited the highest survivorship, with 94% of fragments remaining healthy and only 1% exhibiting partial mortality. Of the 6% of Acropora fragments that were lost, all were due to detachment—with no full or partial mortality observed. Platygyra fragments had lower survivorship, with 89% classified as healthy, 5% exhibiting partial mortality, 3% dead, and 3% detached after four years. Pavona exhibited the lowest survivorship, with only 76% classified as healthy, 3% dead, and 21% detached by the end of the monitoring period.

3.1.2. Extension Rates and Breakage

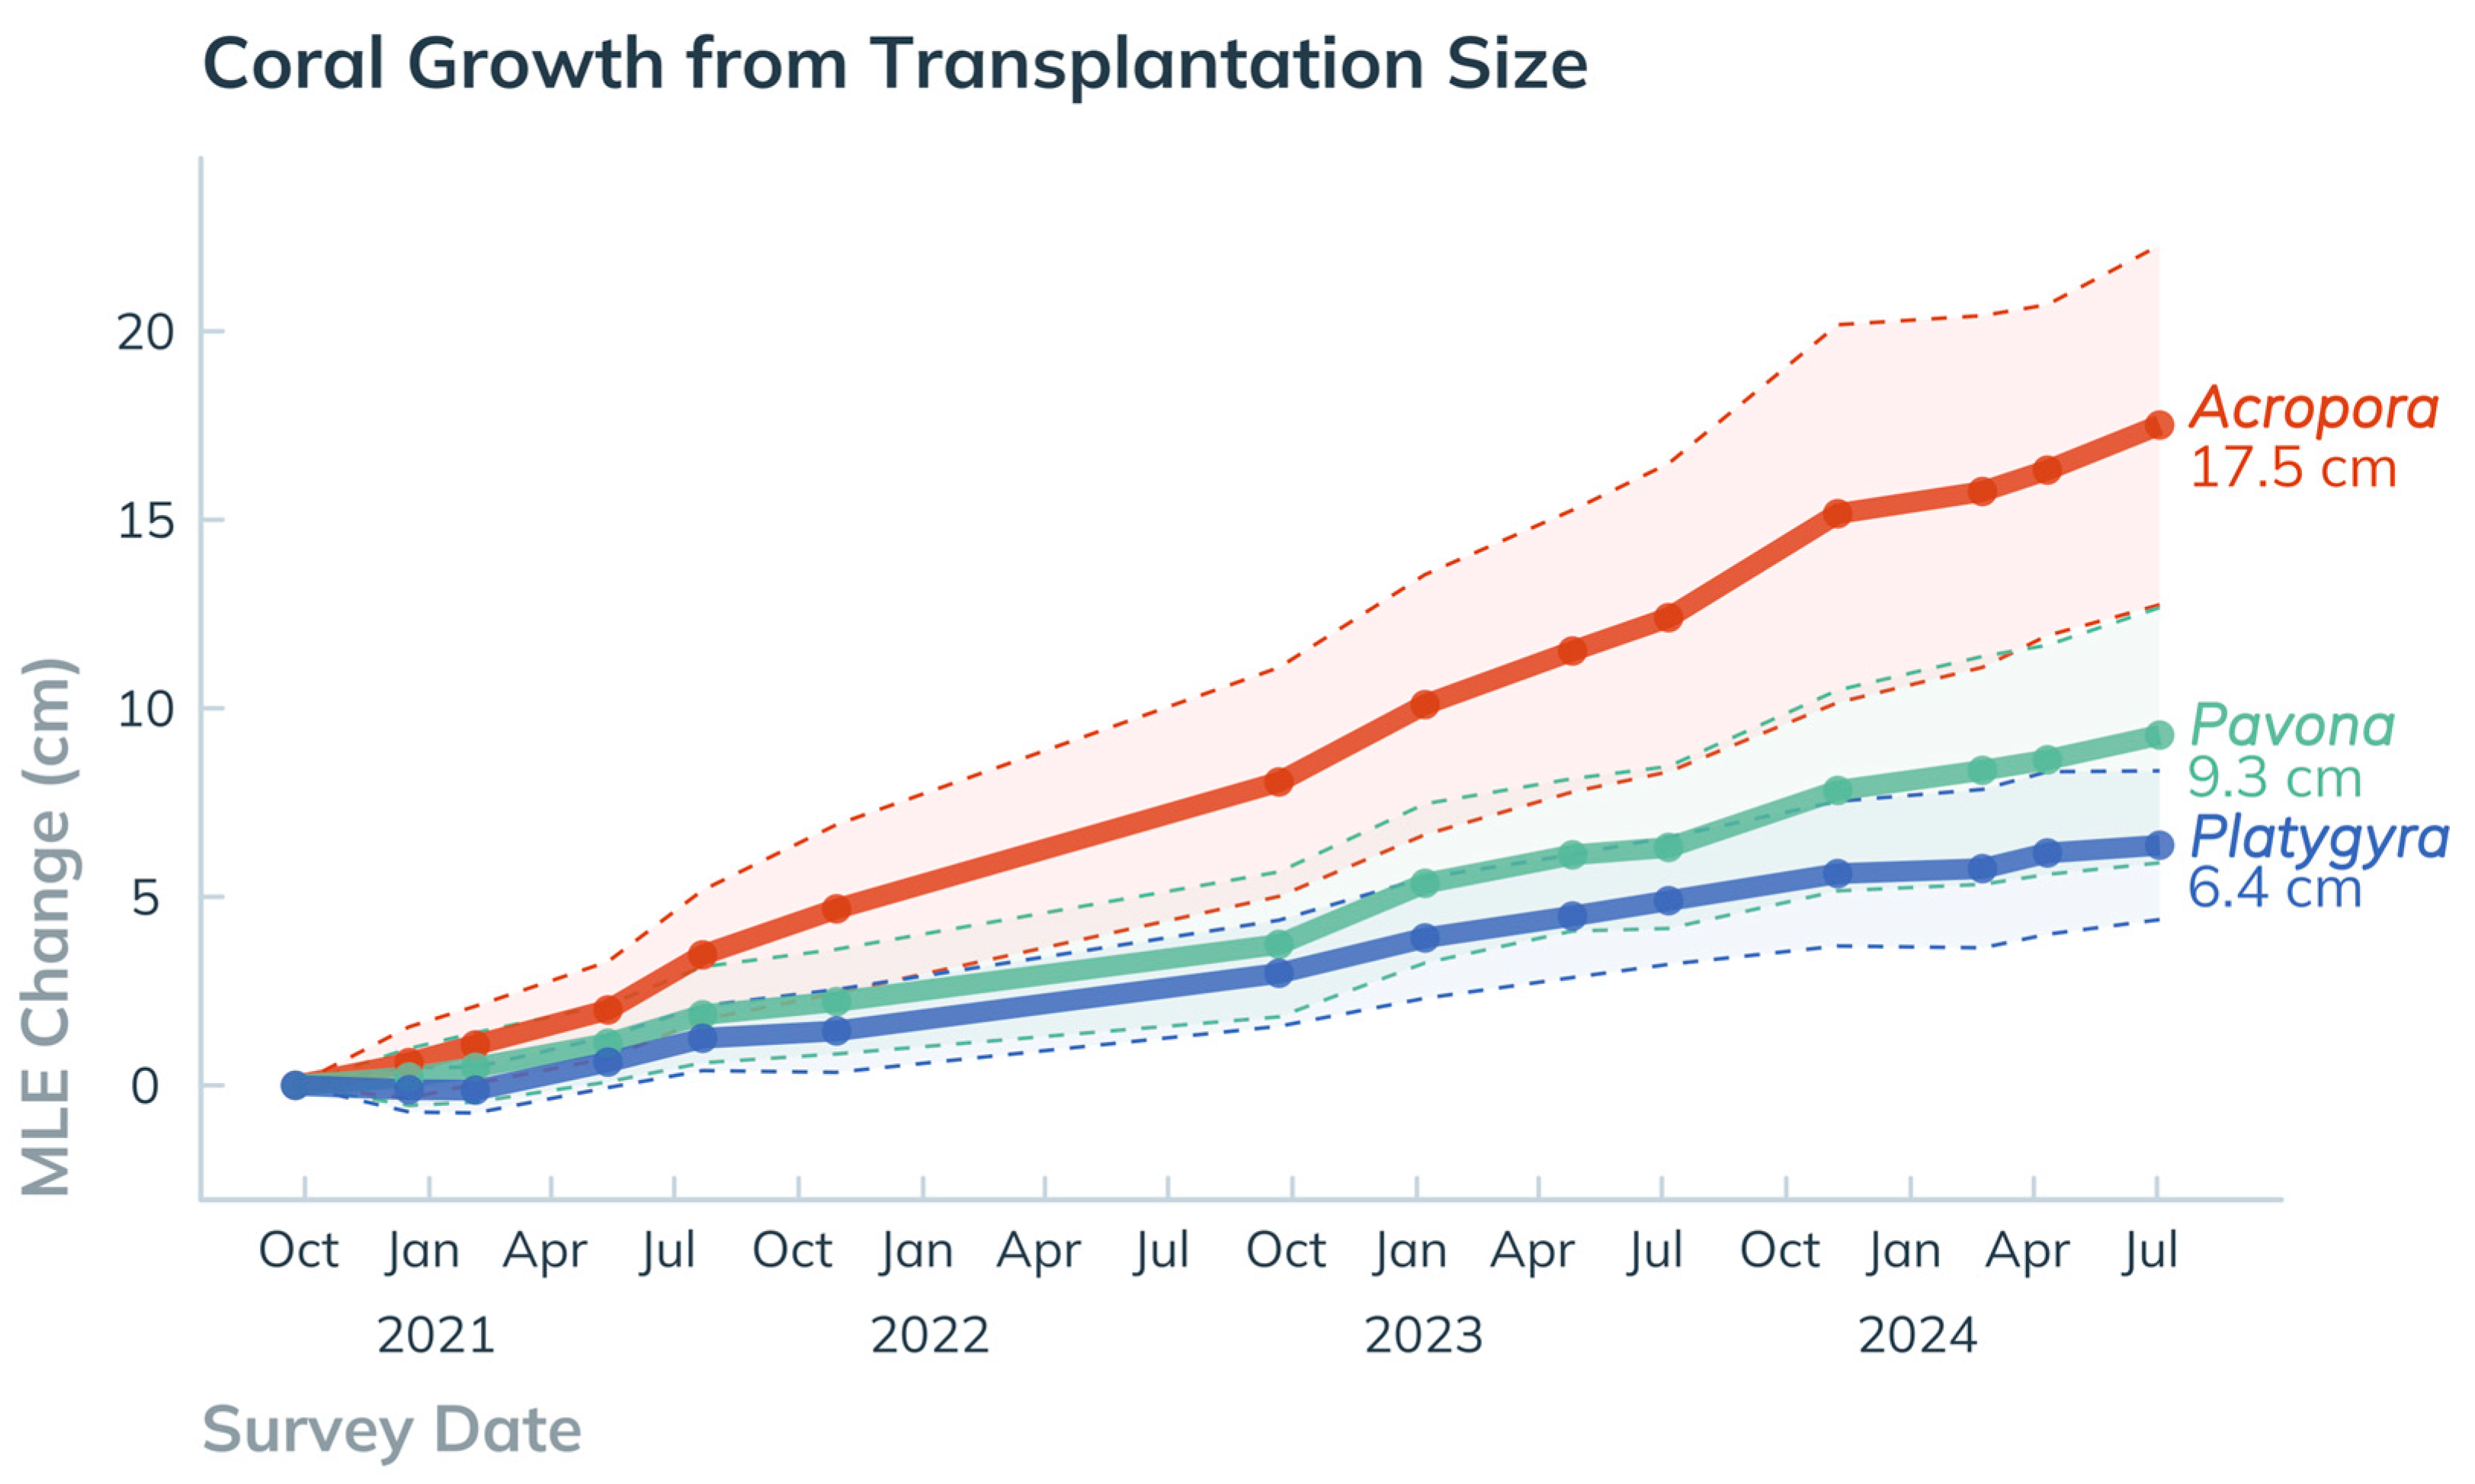
Over the four-year monitoring period, all three coral genera exhibited positive linear extension relative to their initial transplantation size, but significant differences in growth trajectories were observed among genera representing distinct growth forms (Figure 5). Acropora fragments showed the most pronounced increase in linear extension, with a mean growth of 254% relative to baseline measurements, corresponding to an extension rate of 0.35 ± 0.16 cm month−1 (n = 1495). Pavona displayed intermediate growth, achieving a mean increase of 179%, with an extension rate of 0.20 ± 0.11 cm month−1 (n = 1295). In contrast, Platygyra, characterized by its massive growth form and inherently slower growth dynamics, with a mean increase of 118% and an extension rate of 0.14 ± 0.06 cm month−1 (n = 1335). Tukey-adjusted contrasts of growth rates (Table 2) showed that Acropora grew significantly faster than Pavona (z = 10.482, p < 0.001) and Platygyra (z = 19.071, p < 0.001). Pavona also grew faster than Platygyra (z = 8.030, p < 0.001). The incidence of broken fragments was also examined (Table 2), with breakage rates highest in Acropora, which was significantly greater than in Platygyra (z = 7.0899, p < 0.001) and Pavona (z = 7.472, p < 0.001).

3.2. Fish and Invertebrate Surveys

The total number of fish (Figure 6 and Table 3) observed per survey (n = 14 surveys) differed significantly among the three sites (Table 4; Kruskal-Wallis H(2) = 13.6, p = 0.001, η2 = 0.29). The average number of fish observed per survey was significantly lower for the unrestored site (2.4 ± 2.1 SD observations) than at both the reference (14.9 ± 13.1 SD) and the restored (17.6 ± 17.8 SD) sites (Wilcoxon signed rank p < 0.01 for both comparisons, with Holm-Bonferroni correction; Table 4). No significant difference was found between the average number of fish observed at the restored and reference sites (p > 0.5; Table 4). The total abundance of invertebrates (Figure 6 and Table 3) also differed significantly between sites (Kruskal-Wallis H(2) = 5.3, p = 0.072, η2 = 0.08). Post-hoc pairwise comparisons showed that the average number of invertebrates observed per survey was only significantly different between the restored (232.3 ± 115.2 SD observations) and the unrestored sites (138.4 ± 80.2 SD; Wilcoxon pairwise p = 0.077 in a comparison between the restored and unrestored sites).

3.3. Environmental DNA

3.3.1. DNA Sequencing Output by Phyla

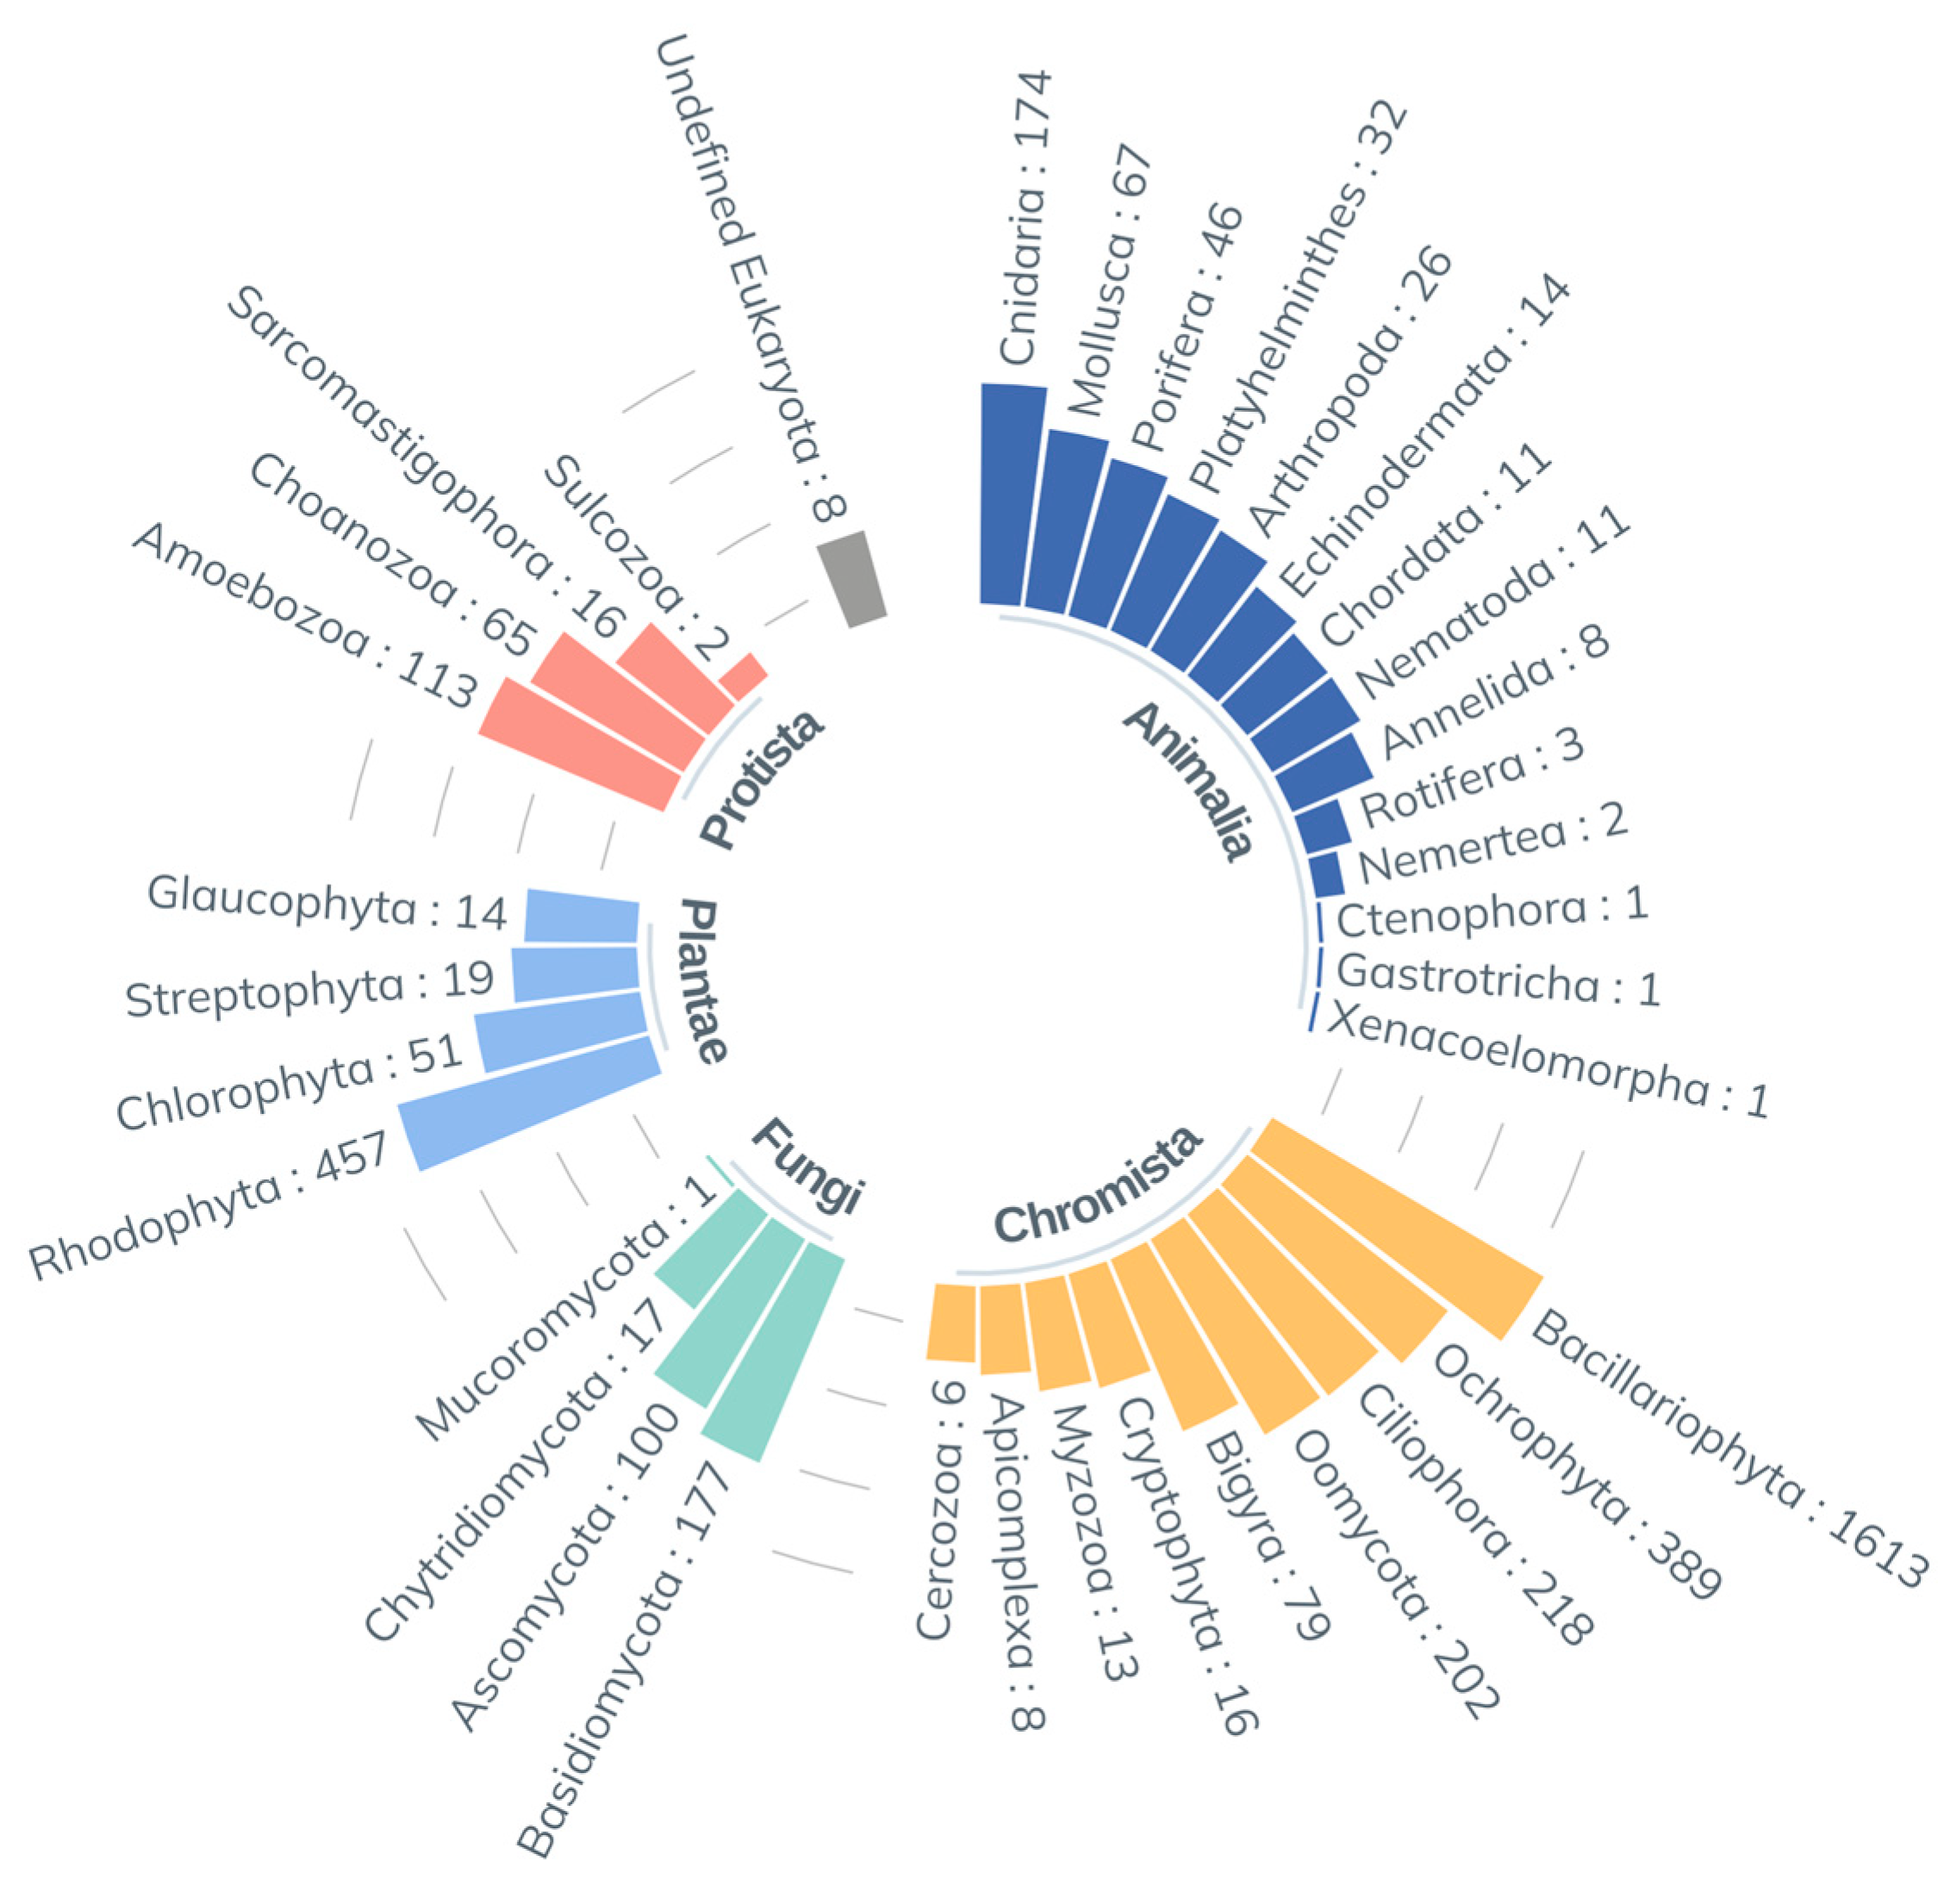
The dataset consisted of 3981 ASVs and 1,350,202 total reads across all samples following sequence analyses and quality control filtering. A total of 35 eukaryotic phyla were detected and assigned across Chromista (9 phyla), Plantae (4 phyla), Animalia (14 phyla), Fungi (4 phyla), and Protista (4 phyla; Figure A2). Of these kingdoms, Chromista was represented by the greatest number of both ASVs and untransformed sequencing reads (2544 ASVs; 812,859 reads)—followed by Plantae (541 ASVs; 98,190 reads), Animalia (397 ASVs; 393,712 reads), and Fungi (295 ASVs; 23,698 reads). There were 8 ASVs (381 reads) that could not be assigned to the kingdom level.
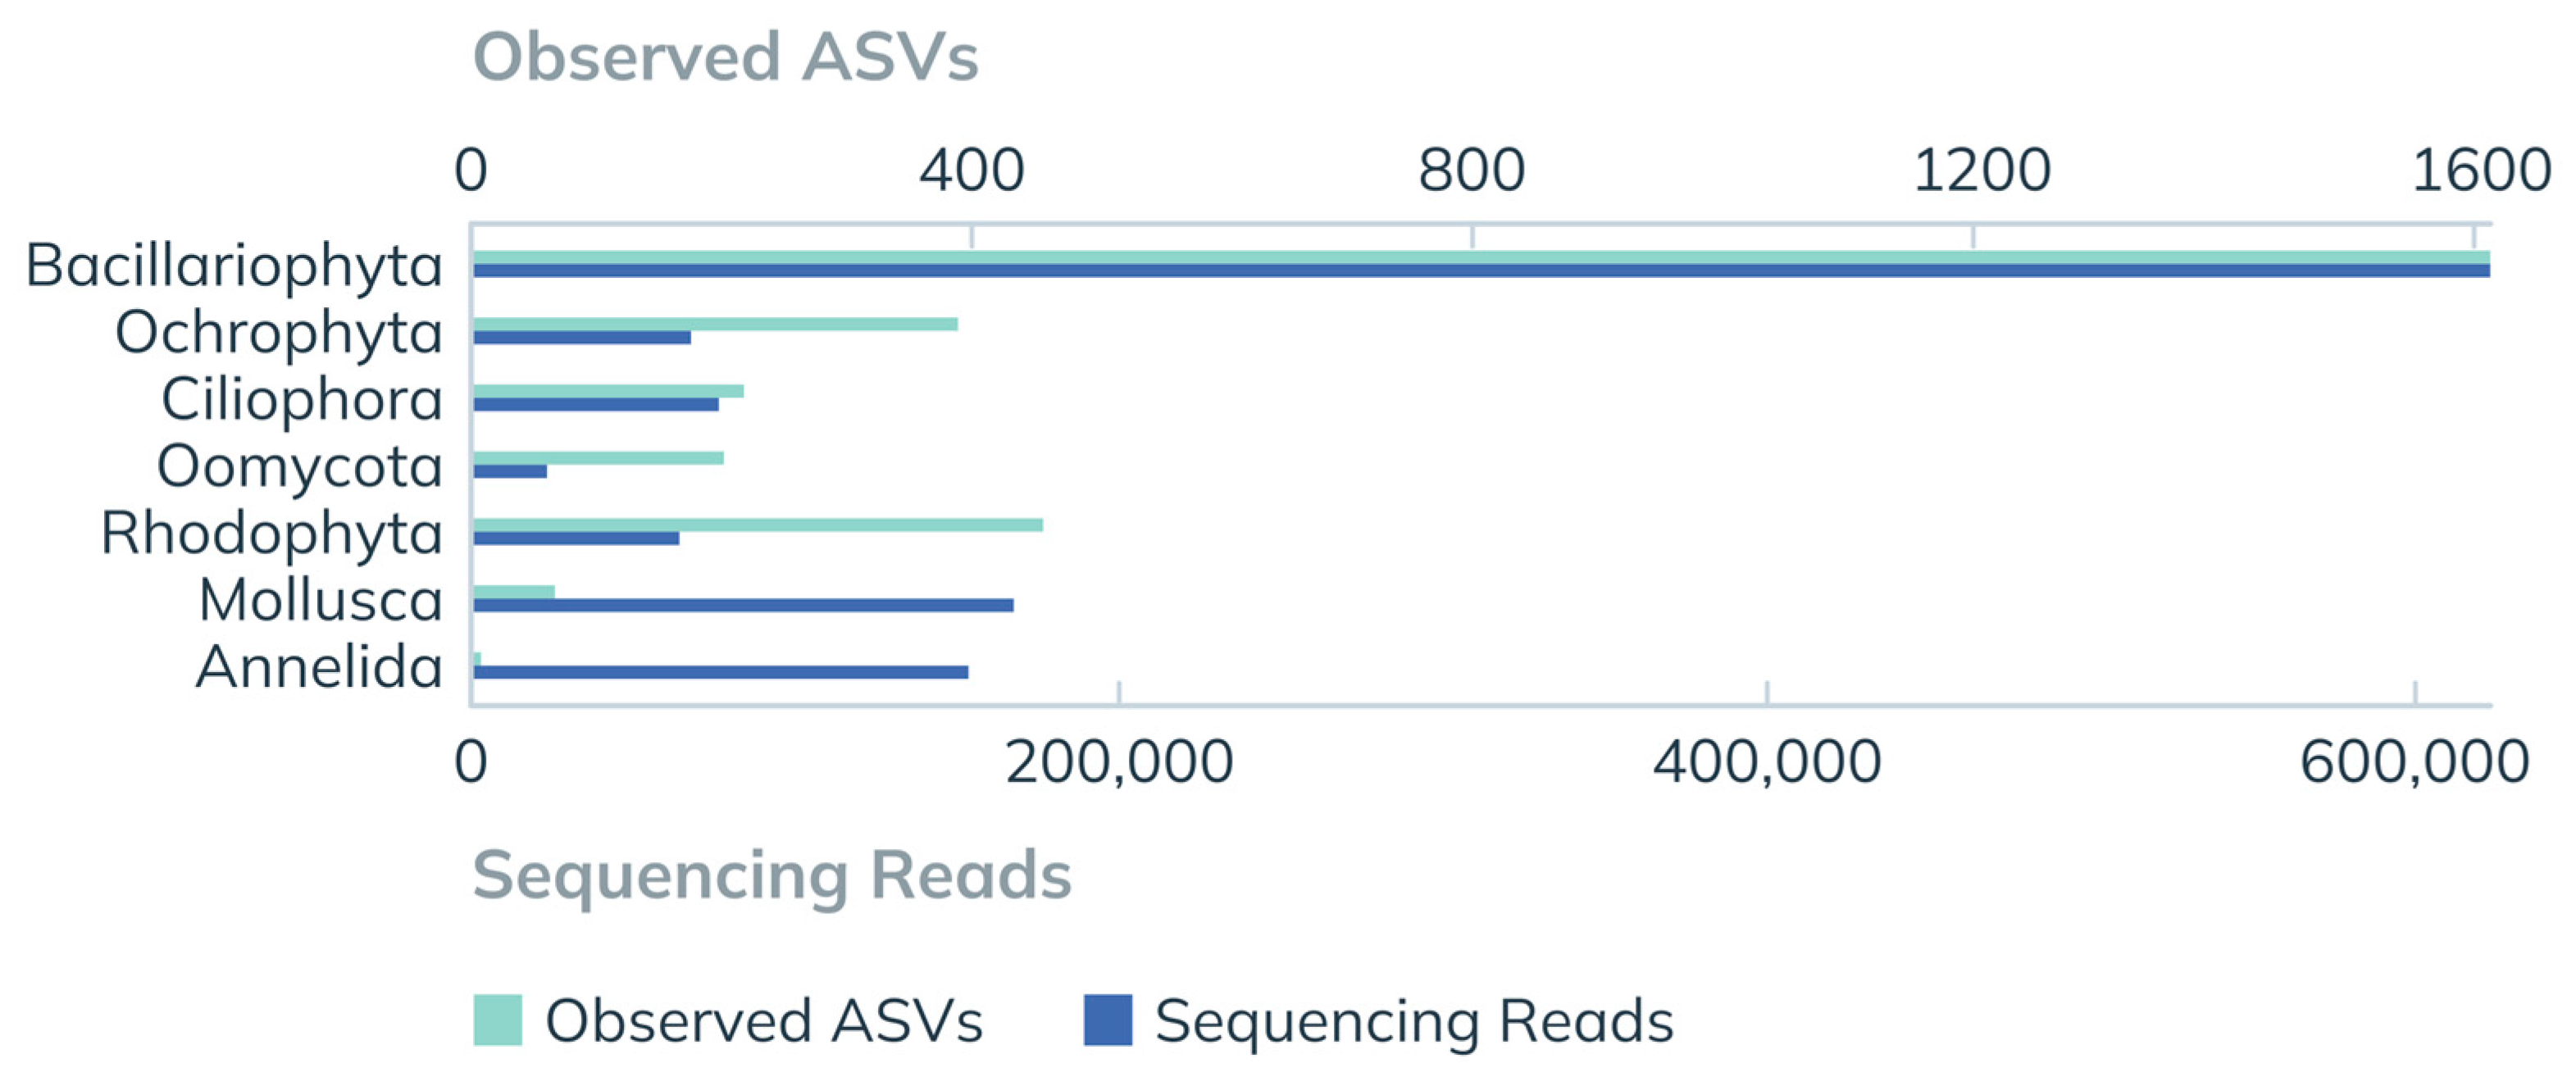
Of the five phyla with the highest sampled ASV richness, four were Chromista: Bacillariophyta (1613 ASVs; 623,144 reads), Ochrophyta (389 ASVs; 67,893 reads), Ciliophora (218 ASVs; 76,469 reads), and Oomycota (202 ASVs; 23,437 reads; Figure 7). Rhodophyta, however, had the second-greatest assigned ASV richness of any phyla (457 ASVs; 64,298 reads), accounting for the majority (84%) of ASVs assigned to the kingdom Plantae (Figure 7). Among metazoans, Cnidaria had the greatest ASV richness (174 ASVs; 10,920 reads), followed by Mollusca (67 ASVs; 167,474 reads), Porifera (46 ASVs; 3016 reads), Platyhelminthes (32 ASVs; 7184 reads), and Arthropoda (26 ASVs; 35,279 reads; Figure A2). In terms of raw sequencing reads, Annelida was the third most abundant phylum among all kingdoms while being represented by low ASV diversity (8 ASVs; 153,520 reads; Figure 7).

3.3.2. ASV Richness by Site

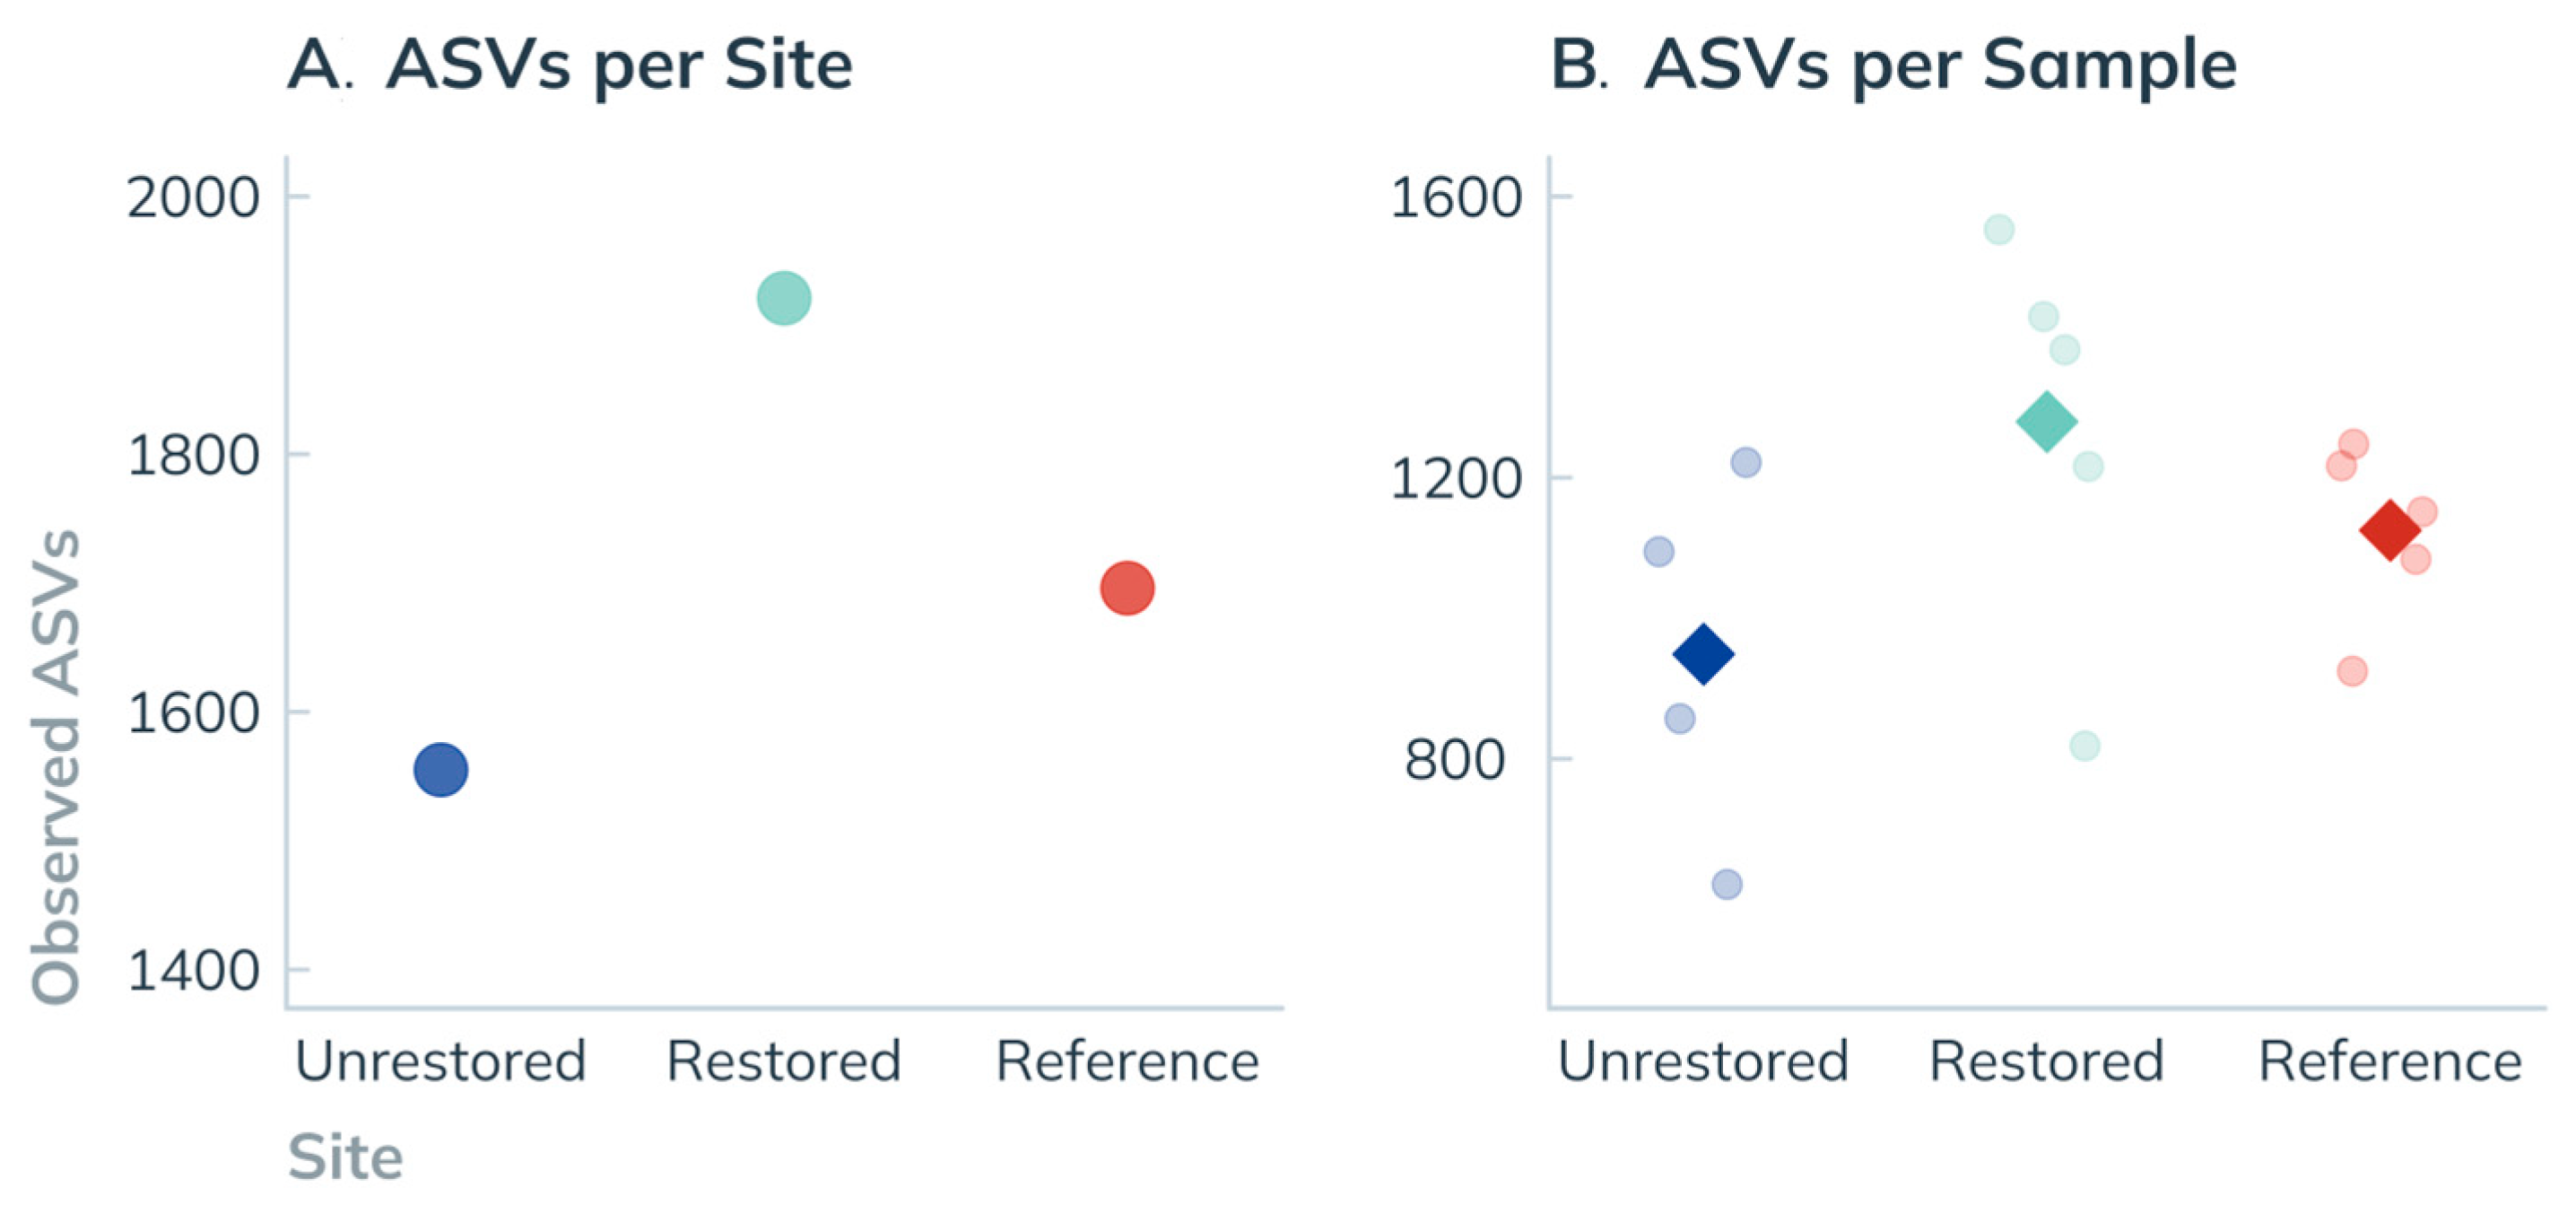
ASV richness was evaluated in terms of both the overall site richness and the average number of ASVs observed per sample (Figure 8). The restored site exhibited the highest overall richness, with 1921 observed ASVs—13.3% more ASVs than the number detected at the reference coral community (1696 ASVs) and 23.5% more than the sampled richness of the unrestored seabed (1555 ASVs). When Bacillariophyta ASVs were excluded—given the impact the disproportionately high diversity of this phylum may have on observed patterns of overall site richness—the restored site still displayed the highest number of observed ASVs (1129). In contrast, a greater number of non-Bacillariophyta ASVs were observed at the unrestored site (1003) than at the reference site (833). Non-Bacillariophyta richness at the restored site was therefore 12.5% higher than that of the unrestored site and about 35.6% higher than that of the reference site.
Across all three sites, an average richness of 1130 ± 255 ASVs per sample was observed (n = 14). The restored site showed the highest average sample richness at 1280 ± 284 ASVs (n = 5), followed by the reference site at 1125 ± 129 ASVs (n = 5), and the unrestored site, which had the lowest average sample richness of 948 ± 266 ASVs (n = 4). Greater variation in ASV richness was observed among samples collected from the unrestored and restored sites than among those from the reference coral community (Figure 8B). Considering the relative differences in mean sample richness between sites, ASV richness from the restored site was 13.7% greater than that of the reference community, and 35% higher than that of the unrestored site. Although the restored site exhibited higher mean ASV richness, these differences were not statistically significant (ANOVA, F(2,11) = 2.225, p > 0.1; Table 5).

3.3.3. Community Similarity

Most ASVs were unique to an individual site, as 76% of all ASVs were exclusively found among samples from one of the three locations (Table 6). A similar number of site-specific ASVs were found at the restored site (1059; 27% of all ASVs) and the reference site (1064; 27%). In contrast, the unrestored site had fewer site-specific ASVs than the other two sites, with only 880 site-specific ASVs (22% of all ASVs). Among ASVs that were shared between only two sites, the restored site shared a slightly higher number of ASVs with the nearby unrestored seabed (341 ASVs; 9% of all ASVs) than with the reference coral community (303 ASVs; 8% of all ASVs). However, the unrestored site had far fewer ASVs in common with the reference site (121 ASVs; 3% of all ASVs).
Only 213 ASVs were identified across all three sites (Table 6). While these ubiquitous ASVs accounted for a small share (5%) of all observed ASVs, they were represented by a relatively large number of reads, accounting for 23% of Hellinger-transformed read counts across all samples. The majority of these ubiquitous ASVs were Bacillariophyta (123 ASVs; 57% of all ubiquitous ASVs), followed by Ochrophyta (21 ASVs; 10%), Ciliophora (12 ASVs; 6%), and Rhodophyta (11 ASVs; 5%). All other phyla were represented by fewer than 10 ubiquitous ASVs.
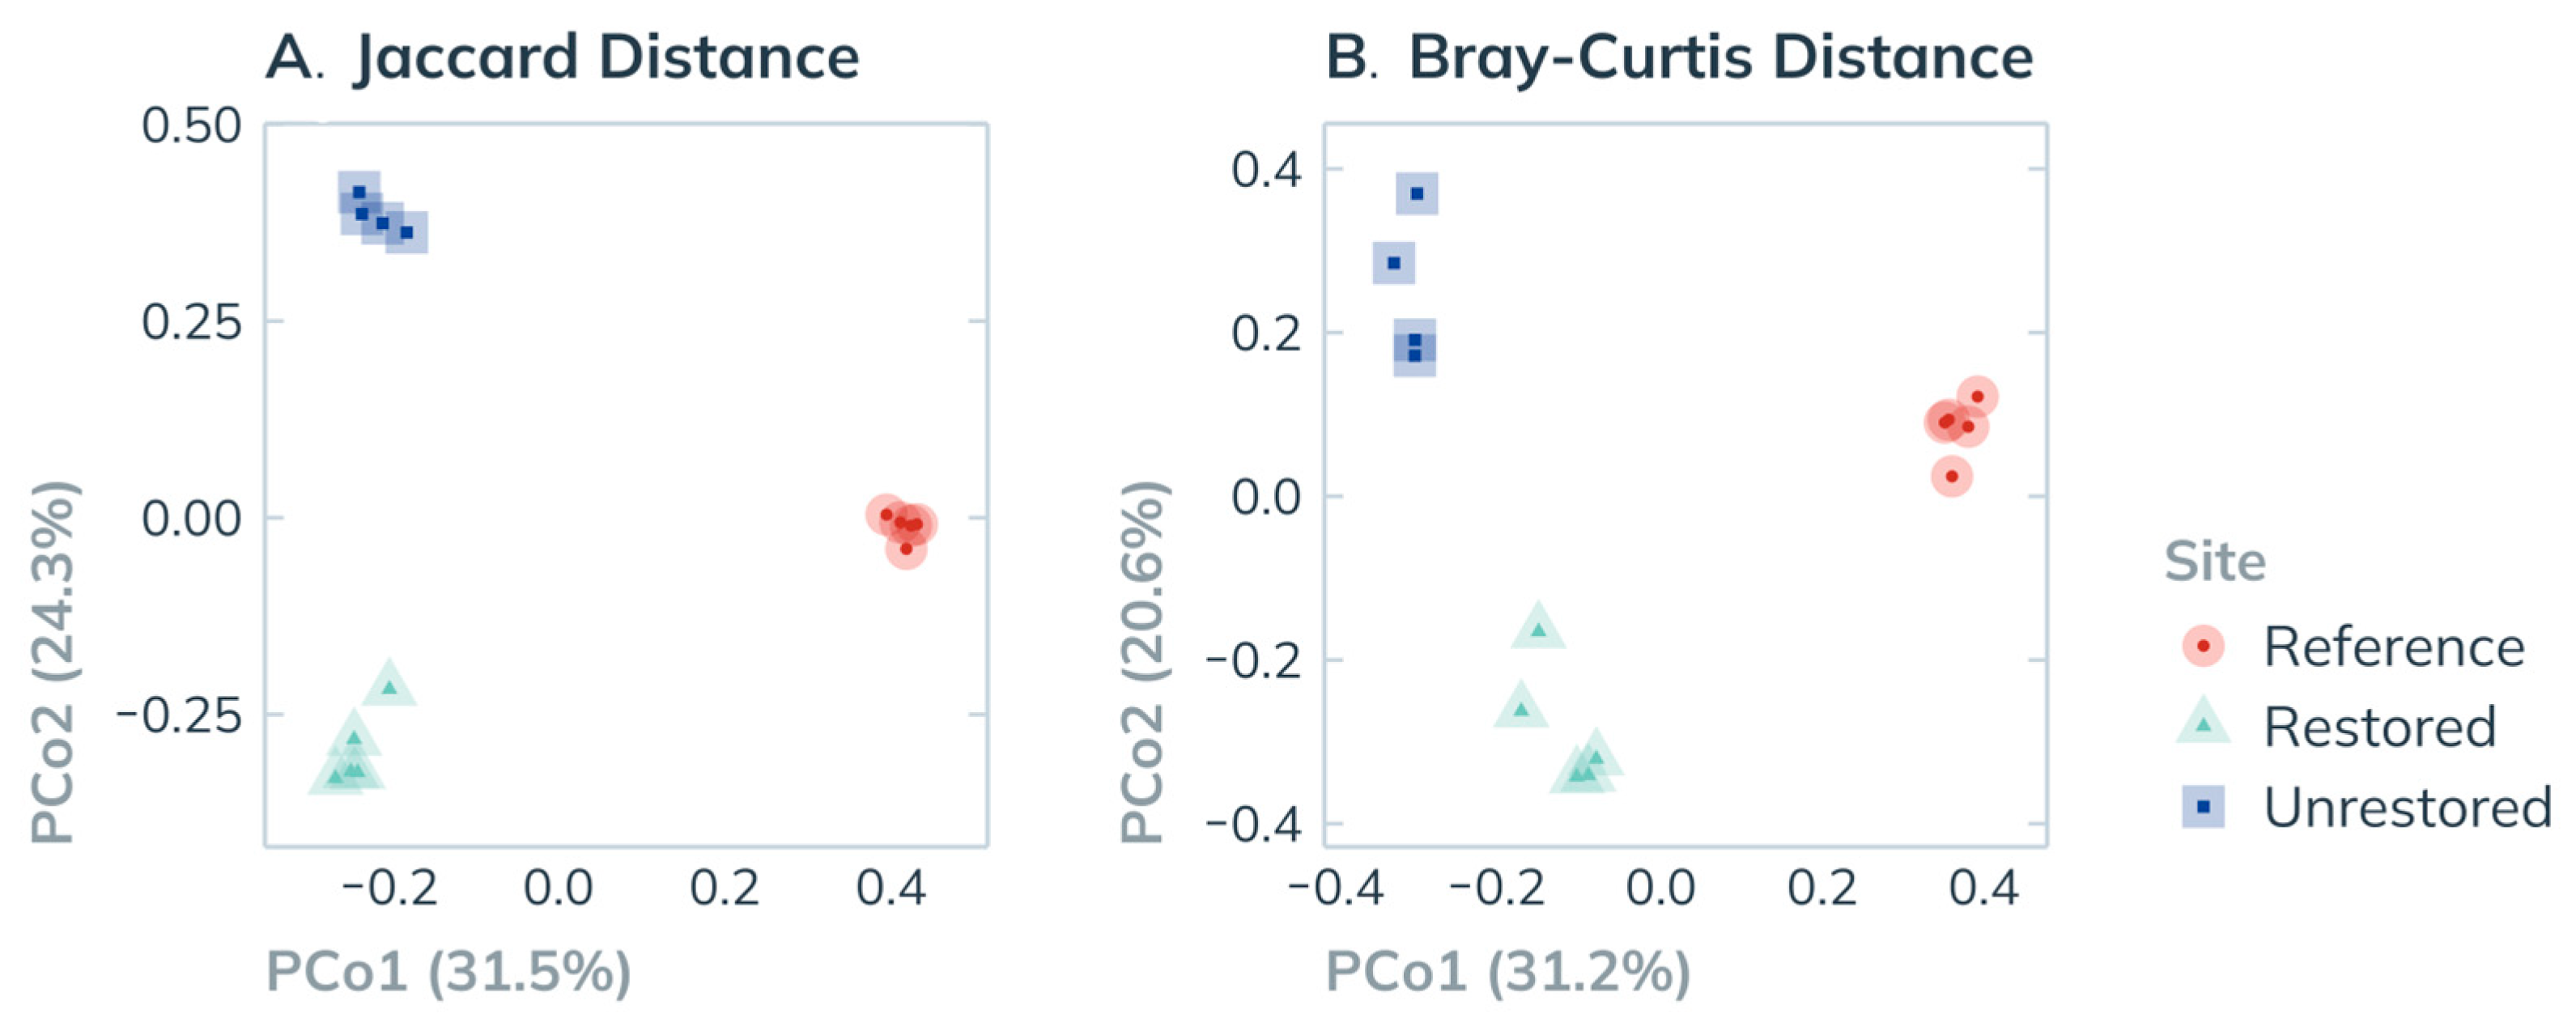
Two sets of Principal Coordinate Analyses (PCoA) were conducted to assess differences in community composition between sites. Each site was shown to have a distinct community structure, with both ordinations producing tight, largely non-overlapping clusters (Figure 9). The Jaccard distance ordination (presence/absence) showed some overlap between the unrestored and restored sites along the first principal coordinate (PCo1, 31.5%). However, all three sites occupied distinct positions along the second principal coordinate (PCo2, 24.3%; Figure 9A). PERMANOVA analysis of the Jaccard dissimilarity matrix confirmed significant differences in assemblages between the sites (F(2,11) = 6.9, p < 0.001, permutations = 999; Table 7). Post-hoc pairwise testing indicated significant differences between all site pairs (Restored vs. Reference: F(1,8) = 7.91, p = 0.01; Restored vs. Unrestored: F(1,7) = 5.73, p < 0.01; Reference vs. Unrestored: F(1,7) = 6.92, p < 0.01; Table 8).
Bray–Curtis dissimilarity, which incorporates both occurrence and abundance data, revealed distinct site clusters with minimal overlap. The restored site plotted between the unrestored and reference sites on the first principal coordinate (PCo1, 31.2%), while the reference site again appeared centrally positioned between the other two on the second component (PCo2, 20.6%; Figure 9B). The PERMANOVA based on the Bray–Curtis dissimilarity matrix indicated statistically significant differences in community composition by site (F(2,11) = 5.7, p < 0.001, permutations = 999; Table 7), with post hoc tests confirming significant differences between all site pairs (Restored vs. Reference: F(1,8) = 6.42, p = 0.01; Restored vs. Unrestored: F(1,7) = 4.23, p < 0.01; Reference vs. Unrestored: F(1,7) = 6.60, p < 0.01; Table 8). No significant differences in dispersion among sites were found for either ordination (PERMDISP: Jaccard distance, F(2,11) = 0.29, p = 0.75; Bray–Curtis distance, F(2,11) = 0.86, p = 0.472). This suggests that the assumption of homogeneity of variances was met, and the observed differences in community composition, as detected by PERMANOVA, are likely due to differences in group centroids rather than dispersion.

3.3.4. Taxonomic Composition by Site: Diversity and Abundance

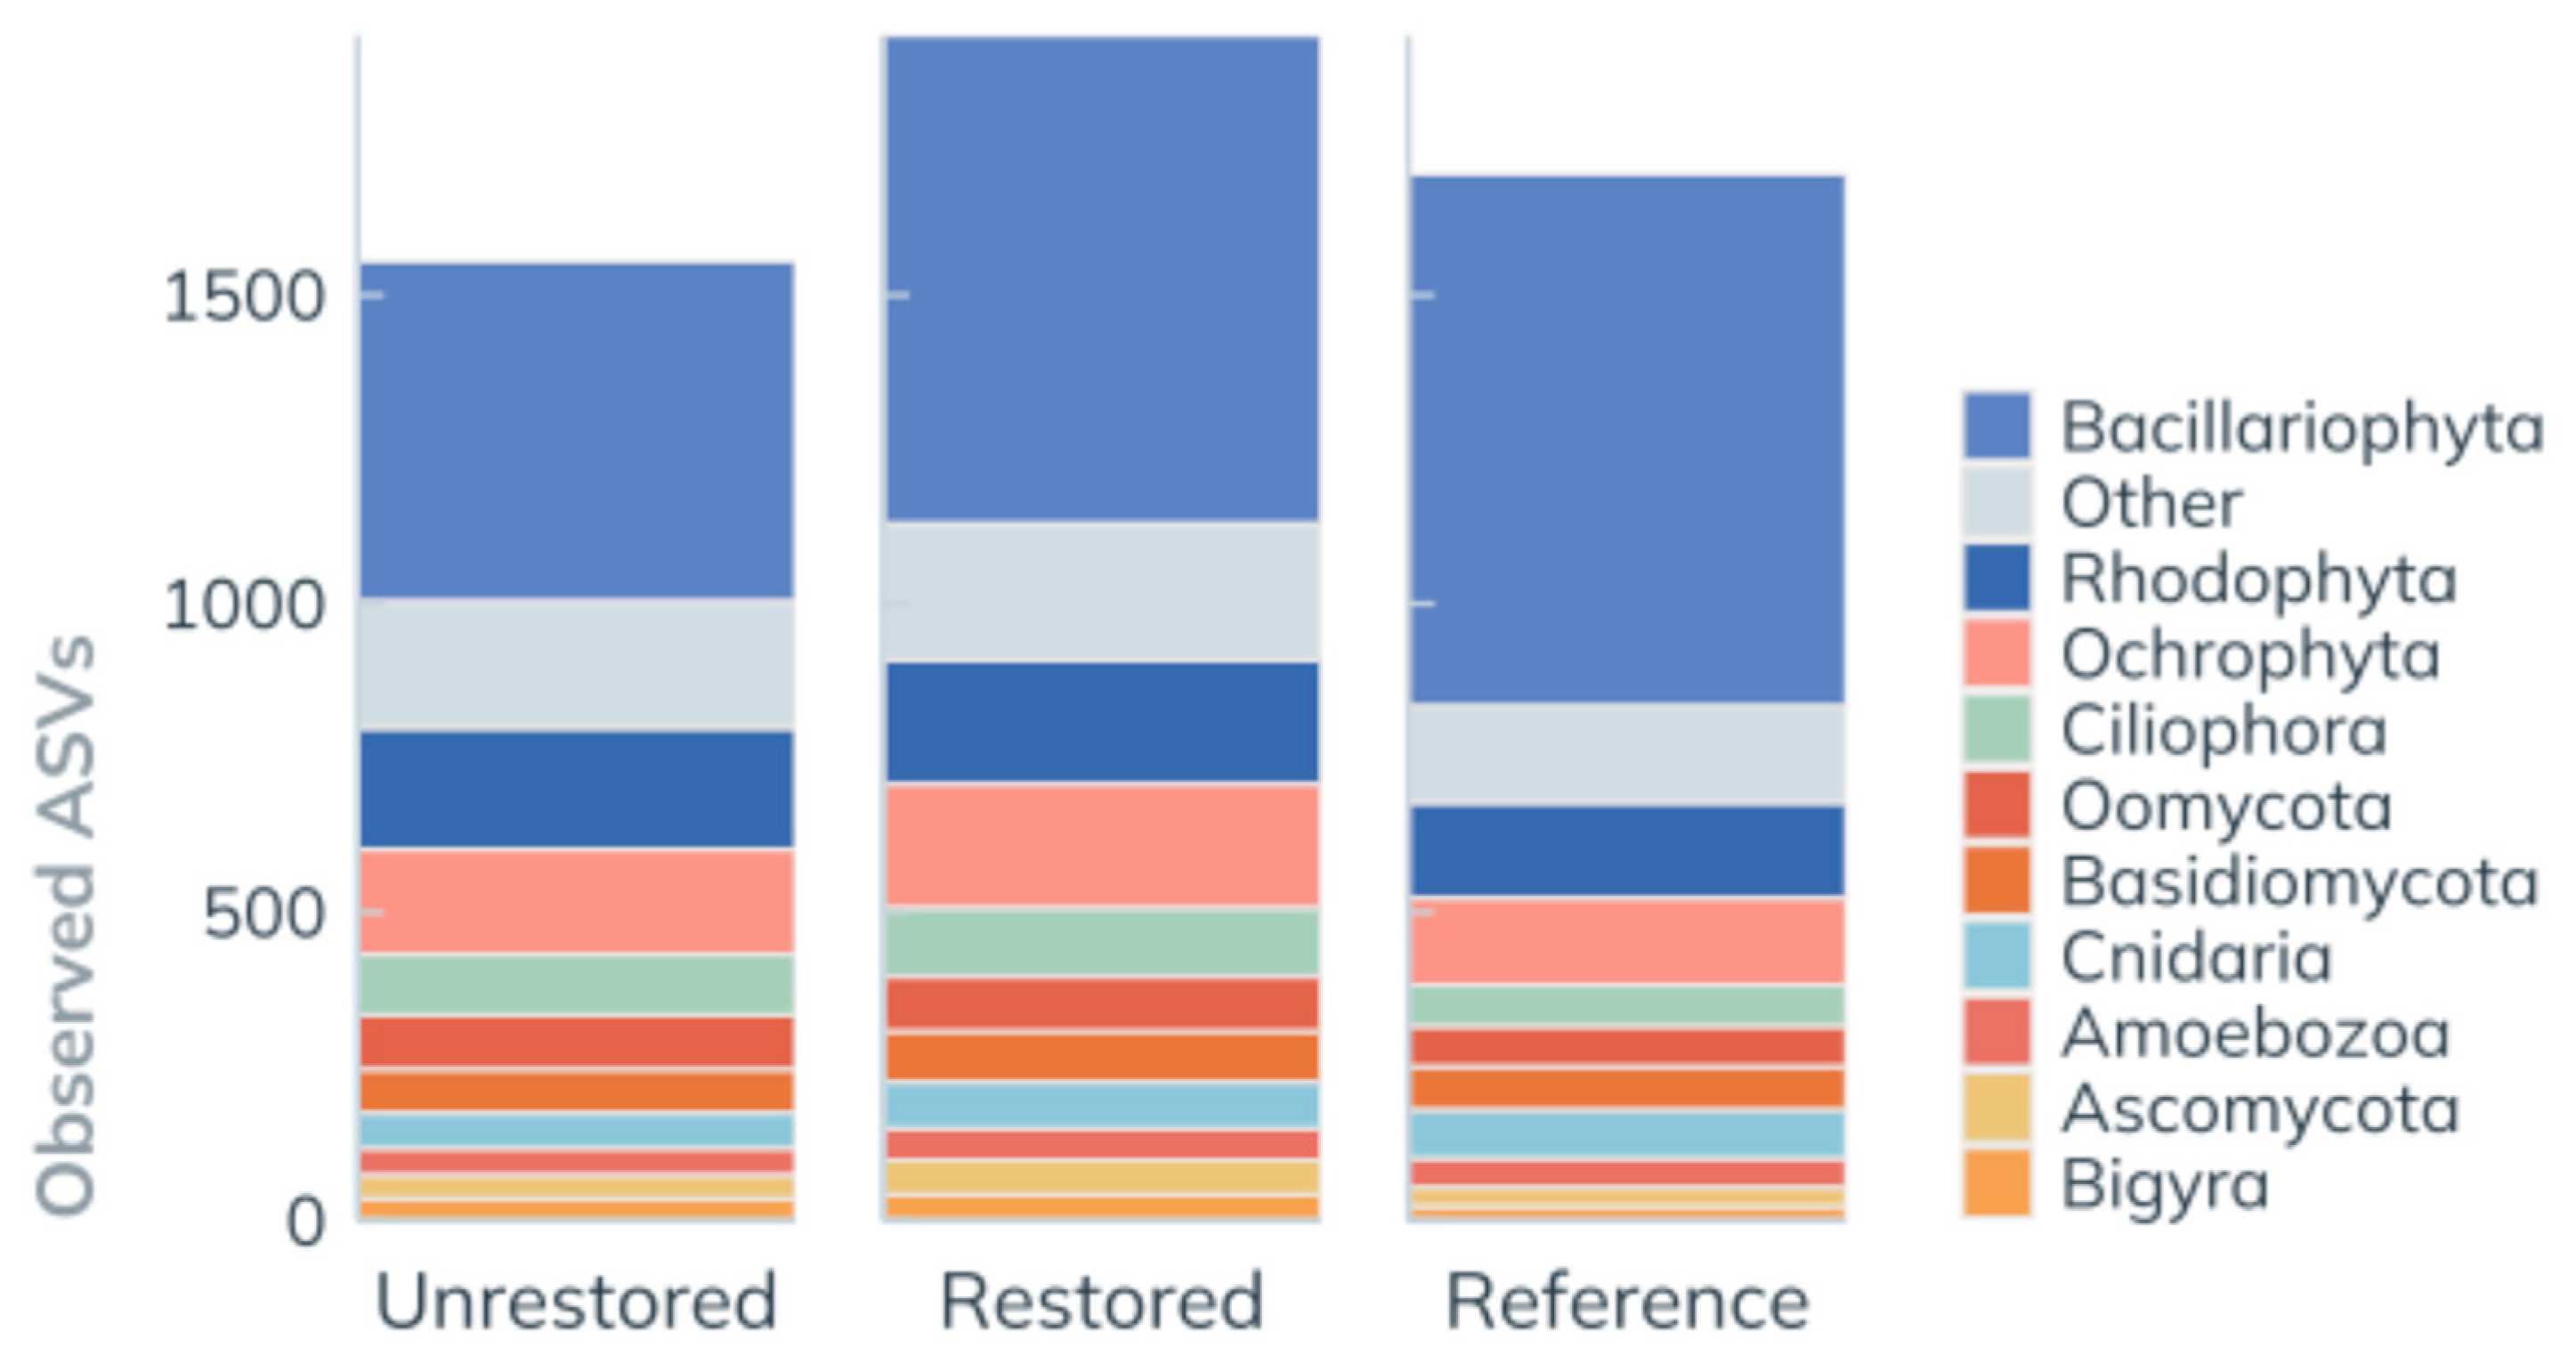
Given the wide taxonomic breadth of the sequencing data, community composition was compared at the phylum level. Taxonomic composition was first assessed using presence–absence transformed data, illustrating the number of ASVs observed within each phylum at each site. ASV richness for each phylum was relatively consistent across the three sites, except for Bacillariophyta, which was represented by more ASVs and contributed a greater share of site richness at the reference site (Figure 10).
Of the 36 phyla identified, 25 were represented by at least 10 ASVs and retained for testing variation in phylum-level ASV richness among sites (Figure A2). This test confirmed a significant difference in phylum richness by site (χ2(48) = 138.1, p < 0.001), primarily driven by differences in Bacillariophyta ASV counts. Post hoc comparisons of the residuals from the chi-square test indicated that Bacillariophyta was the only phylum with a significant difference in ASV richness between sites (Holm–Bonferroni adjusted p < 0.001). Bacillariophyta ASV richness peaked at the reference site (863 ASVs, 50.9% of site ASVs), was lowest at the unrestored site (552 ASVs, 35.5%), and intermediate at the restored site (792 ASVs, 41.2%). Across all sites, Bacillariophyta contributed 34.6% to the calculated χ2 value, while no other phylum contributed more than 6%. Overall, Bacillariophyta accounted for 40.5% of all detected ASVs.
Recognizing that the high diversity of Bacillariophyta could obscure richness patterns among other phyla, a second chi-square test was performed excluding Bacillariophyta ASVs. This analysis also detected a significant difference in ASV richness among sites (χ2(46) = 102.2, p < 0.001). Cnidaria was the only phylum to exhibit a significant difference in richness between sites (Holm–Bonferroni adjusted p = 0.002; post hoc comparison based on χ2 residuals), contributing 17.0% to the calculated χ2 value. Cnidaria were slightly more diverse at the reference (79 ASVs, 9.5% of all non-Bacillariophyta ASVs) and restored (75 ASVs, 6.6%) sites than at the unrestored site (58 ASVs, 5.8%).
To complement richness-based assessments, relative read abundance was analyzed using Hellinger transformation to capture compositional differences across sample replicates and sites. Across all samples, Bacillariophyta was the most abundant phylum, accounting for an average of 51.1% (±11.8% SD) of all transformed read counts per sample (Figure 11A). The next two most abundant phyla, Ochrophyta and Rhodophyta, were generally present in similar proportions, each representing approximately 8% of total transformed read counts per sample (8.3 ± 1.4% SD and 8.0 ± 1.5% SD, respectively; Figure 11A). Phylum-level read abundance was more consistent among replicates from the reference community, mirroring the tighter clustering observed among reference site samples in the Bray-Curtis ordination (Figure 9B). In contrast, there was substantial variation in phylum representation across samples from the unrestored site. For the restored site, variation in phylum-level abundance was intermediate, with relative read abundance profiles for the seven most abundant phyla closely matching those of the reference site. However, two samples from the restored site exhibited unusually high Mollusca read abundances (14.0% and 7.6% of total transformed reads).
Compositional abundance—presented as relative Hellinger-transformed abundance by site—was used as a proxy for site-level community composition. The abundance of Bacillariophyta differed markedly among sites, being highest at the reference site (61.4%), intermediate at the restored site (50.9%), and lowest at the unrestored site (38.4%; Figure 11B), mirroring the gradient in Bacillariophyta richness observed across sites (Figure 10). As Bacillariophyta accounted for 53.7% of all transformed read counts across samples, patterns in compositional abundance for other phyla were largely masked; therefore, Bacillariophyta was removed from the dataset to better resolve patterns among the remaining phyla.
After excluding Bacillariophyta, Ochrophyta and Rhodophyta were the most abundant phyla across all sites. For both algal phyla, compositional abundance was lowest at the unrestored site, intermediate at the restored site, and highest at the reference site. Specifically, in samples from the unrestored, restored, and reference sites, Ochrophyta accounted for 13.5%, 17.7%, and 19.3%, respectively, and Rhodophyta for 14.8%, 16.5%, and 18.4% of non-Bacillariophyta transformed reads (Figure 11C). A similar gradient was observed for Cnidaria, which was lowest at the unrestored site (3.6%), higher at the restored site (4.6%), and highest at the reference site (7.5%; Figure 11C).
Other phyla displayed different patterns of compositional abundance between sites. Ciliophora abundance was relatively consistent across samples, being slightly higher at the unrestored (10.8%) and restored (11.5%) sites than at the reference site (9.9%; Figure 11C). In contrast, Basidiomycota was more abundant at the reference site (7.1%) compared to the unrestored (5.5%) and restored (5.0%) sites. Pronounced differences in relative Mollusca sequence abundance were observed, with high values at the unrestored (6.7%) and restored (9.5%) sites, but negligible abundance at the reference site (1.7%). Notably, Annelida accounted for a large share of transformed reads at the unrestored site (9.0%) but contributed minimally to the read counts at the other two sites (<1.0%). Elevated Mollusca and Annelida abundances at the unrestored site may indicate opportunistic colonization in less structurally complex habitats. Ascomycota sequences accounted for a greater share of reads from the restored site (3.9%) than from the reference (2.9%) or unrestored (2.2%) sites.

4. Discussion

Coral restoration aims to achieve two primary ecological goals: enhancing coral populations and preserving community biodiversity and ecosystem function. In this study, we deployed a novel 3D-printed ceramic tile design to establish a coral community in a marine park in Hong Kong. Evaluation of the tiles’ efficacy for coral reef restoration showed that the artificial structures provided a suitable substrate, supporting sustained coral growth and high survivorship of transplanted fragments. This, in turn, resulted in a measurable enhancement of site biodiversity.

4.1. Ecological Outcomes

4.1.1. Coral Performance

Our results demonstrate that the 3D-printed ceramic tiles served as an effective substrate for coral attachment and growth. After four years, 88% of the 378 coral fragments outplanted to the restoration site remained alive, with only 2% showing signs of tissue loss. This survivorship rate substantially exceeds the reported average of 66% for coral transplantation projects, an average which may be inflated due to the short monitoring durations of many studies [11,12]. Our project met the suggested targets of the Coral Restoration Consortium (CRC) of the National Oceanic and Atmospheric Administration (NOAA), whose Restoration Evaluation Tool provides the only comprehensive suite of quantitative targets for evaluating coral reef restoration performance [63].
The CRC recommends the following criteria for coral health and survivorship, measured one year after transplantation: (1) high coral survivorship (>80% of outplanted fragments alive), (2) high mean live tissue coverage (>80% per colony), (3) limited coral bleaching (<5% of fragments with tissue loss due to bleaching), and (4) low disease prevalence (<10% of fragments showing disease) [63]. At the one-year mark, all criteria were met: only one fragment died, and five detached, resulting in an overall survivorship of 98%. While the exact percentage of tissue loss per fragment was not quantified, 98% of fragments exhibited full tissue cover, indicating that mean live tissue coverage likely exceeded 80%. Diver-based assessments using standardized color indices detected no signs of bleaching or disease. The CRC’s longer-term targets for survivorship are >65% cover at 2 to 5 years post-transplantation and >50% thereafter. Although our monitoring covers only the first four years, the high final survivorship and minimal losses over time suggest the project will continue to meet these criteria, barring unforeseen acute stress events.
Coral growth rates vary widely across species and morphologies (Figure 5), with branching corals generally growing faster than massive and plating forms [64,65]. In our study, Acropora demonstrated the fastest growth (0.35 cm month−1), followed by Pavona (0.21 cm month−1) and Platygyra (0.15 cm month−1) over the four-year period. These growth rates were consistent with our expectations, given the morphology of each genus; Branching forms typically have higher growth rates, given their structural adaptations to optimize light capture and nutrient acquisition [66]. However, it is challenging to directly contextualize these growth rates relative to other studies, as environmental conditions, such as temperature, light, water quality, nutrient availability, salinity, and aragonite saturation all affect coral growth [67,68]. Because “successful” growth rates are highly context-dependent, the Coral Restoration Consortium (CRC) does not define specific quantitative targets for coral growth [63]. Rather, outplanting is considered successful if it enhances coral reef structure and complexity, producing a measurable increase in mean coral height or linear extension [63]. Our project satisfied this criterion, with the mean maximum linear extension of all three genera, at minimum, doubling.
Acropora are often favored for restoration projects, as their relatively high growth rates support rapid establishment, while their branching morphology enhances structural complexity [69,70]. In this study, Acropora achieved the highest survivorship, although breakage rates were higher among Acropora than Pavona and Platygyra. The higher incidence of breakage among transplanted Acropora fragments is consistent with the ecological characteristics of corals with branching morphologies, which reproduce via fragmentation and employ rapid growth to overcome the high-disturbance environments of coral reefs [71,72]. However, the high survivorship of Acropora observed here is somewhat atypical; Within coral restoration literature, it is often acknowledged that there is a tradeoff between growth and survivorship rates in transplanted Acropora fragments, which often exhibit much higher mortality rates than other slower-growing morphospecies [63,73,74,75]. The high survivorship observed here, despite Acropora’s susceptibility to breakage, suggests that structural fragility may not compromise long-term viability when substrate stability is maintained.
Transplanting diverse coral assemblages offers ecological advantages, as fast-growing branching species like Acropora can offset predation and disturbance pressures on slower-growing taxa, facilitating their establishment [76]. In contrast, massive and foliose corals tend to be more resistant to environmental stressors, contributing to the long-term stability of restored communities [76]. Functional diversity also enhances community-level resilience, with mixed assemblages of autotrophic and heterotrophic species conferring increased resistance to thermal bleaching [77]. By incorporating a variety of morpho-functional groups, restoration efforts not only increase structural complexity but also strengthen the ability of restored communities to withstand environmental fluctuations—an especially important consideration in eutrophic urban reef settings [28,78].
Despite these benefits, implementing species-diverse outplanting strategies presents challenges, particularly in optimizing attachment techniques for different morphologies. In our study, most fragment losses resulted from detachment, with Pavona (a plate coral) being disproportionately affected. This outcome highlights the need to further develop attachment methods tailored to specific growth forms to maximize survivorship and overall restoration efficacy, such as incorporating bioadhesives or modular plug systems to improve substrate adherence during the initial phase [79]. Addressing these technical considerations will enhance the ecological benefits of species and functional diversity, thereby increasing the resilience and sustainability of restored communities. In summary, our monitoring demonstrates that 3D-printed ceramic tiles provide a suitable substrate for coral attachment and growth. However, it is crucial to recognize that while the substrate plays a significant role in this success, appropriate site selection ultimately determines coral survivorship outcomes.

4.1.2. Biodiversity

Fish and Macroinvertebrate Abundance
A principal design goal of the reef tiles was to attract and support a diverse assemblage of marine taxa. Given the high economic and nutritional value of fish to coastal communities, fish have long been the central—and often sole—focus of studies investigating the impacts of artificial reef construction on coral-associated organisms [12,80]. Several studies have demonstrated that artificial structures attract fish and are commonly associated with increased abundance and diversity of fish assemblages [81,82,83,84]. In this study, visual surveys recorded an average of seven times more fish at the restoration site than at the nearby unrestored seabed, with fish abundances similar to those observed at the natural reference coral community. Macroinvertebrate abundance similarly differed between sites, with 45% greater abundance of sea urchins and sea cucumbers at the restored site than at the unrestored area.
The presence of moderate densities of sea urchins and small herbivorous fishes suggests early functional establishment of the restored reef. Herbivory plays an essential role in maintaining coral cover and diverse benthic assemblages—particularly in eutrophic environments like Hong Kong, where high nutrient levels favor the proliferation of fast-growing algae that can outcompete corals for benthic cover and reduce biodiversity [85,86,87]. While moderate sea urchin densities help control macroalgae, excessive urchin densities can harm corals [88,89]. Our surveys found comparable urchin densities at the restoration and reference sites, which suggests the urchin abundance noted at the restoration site is compatible with coral growth. Looking beyond herbivory, the surveyed fish taxa included representatives of different trophic levels—sweetlips (Plectorhinchus spp.) that feed on shrimp and small crabs, wrasse (Labridae) which prey on larger invertebrates such as sea urchins and mollusks, and groupers (Epinephelinae) known to feed on other reef fish, octopuses, and larger crustaceans. The presence of fish reliant on a diversity of feeding strategies suggests that the restored habitat is supporting a functioning trophic network. From a socioeconomic perspective, the capacity for restoration projects to attract commercially valuable species, such as groupers, enhances the potential for local community engagement and economic viability of restoration efforts. Our results meet the CRC’s criterion for non-coral community biodiversity enhancement, which requires greater abundances of fish and coral grazers at the restoration site relative to a control or pre-restoration baseline.
Elevated fish and macroinvertebrate abundances at the restoration site may reflect either genuine increases in local carrying capacity or aggregation effects, a distinction particularly relevant for highly mobile species like fish [11,67]. While aggregation may initially drive increased fish abundance, long-term monitoring is needed to determine whether restored habitats support sustained recruitment and population growth. Without pre-restoration biodiversity data, it is unclear whether elevated abundances noted at the restoration site result from local recruitment and population growth, or simply redistribution from adjacent areas. However, the aggregation of multiple species, even if they belong to similar functional groups, provides functional redundancy. Functional redundancy ensures that key ecosystem processes persist even if specific taxa decline, thereby enhancing resilience to environmental disturbances [75]. While visual surveys are effective for monitoring large, mobile taxa, they often underrepresent cryptic or small-bodied species [76]. Future assessments should incorporate pre-installation baselines and complementary methods, such as environmental DNA, to better evaluate biodiversity and carrying capacity impacts.
eDNA Cryptobiome
Rugose tile surfaces, together with coral growth, enhanced structural complexity and resource availability of a previously uniform sandy seabed. Such complexity is widely recognized as a key driver of both macro- and microfaunal diversity in reef systems [82,84]. Indeed, the restored site exhibited 23.5% greater eukaryotic richness (1921 ASVs) compared to that of the unrestored seabed (1555 ASVs). Additionally, more unique ASVs were found at the restoration site than at the unrestored seabed (1059 and 880 ASVs, respectively). The high proportion of site-specific ASVs detected suggests localized community differentiation, potentially driven by substrate type and habitat complexity. Beta diversity analyses revealed distinct, non-overlapping clusters for each site, with PERMANOVA confirming significant differences in community composition between sites. Our findings indicate that, despite the proximity of the two sites (50 m), the restoration project produced a more diverse, distinct community assemblage than that of the unrestored seabed. Ecological theory generally posits that elevated taxonomic richness enhances ecosystem resilience and functional stability—even if much of the diversity is functionally redundant [90,91,92]. Under this theory, the increased richness associated with the restoration project would serve to enhance the ecosystem resilience of the marine park.
Frameworks for ecosystem restoration are commonly framed around the goal of returning the community structure of a degraded ecosystem to that of an undisturbed baseline [93,94]. It is recommended that such objectives be evaluated through comparison to a reference site [94]. In our study, evidence for convergence between the eDNA communities sampled at the restoration and reference sites—such as comparable richness and increased read abundances of key taxa—was tempered by findings that the restored and unrestored sites continued to share certain community characteristics distinct from the natural reference coral community. Richness at the restored site (1921 ASVs) exceeded that of the reference reef (1696 ASVs). In terms of taxonomic composition: Both presence-absence and abundance data revealed gradients in the read abundance and ASV diversity of foundational groups such as Bacillariophyta, Rhodophyta, Ochrophyta, and Cnidaria between sites, which were greatest at the reference site, intermediate at the restored site, and least prevalent at the unrestored site. The dominance of Bacillariophyta, a diatom-rich phylum, particularly among samples from the restoration and reference sites, likely reflects the role of these organisms as primary colonizers and contributors to benthic productivity in stable reef environments [95,96]. Artificial reef communities are known to undergo dynamic changes over years [97], with ecological succession continuing for years following deployment [98]. The observed communities—particularly those sampled from the restoration site—likely reflect early successional stages, with ongoing recruitment and turnover expected to shape long-term assemblage trajectories. The differences in phylum-level community structure between the restoration and reference sites could also be partially attributed to having only sampled one point in time, two years after deployment, which captured only a snapshot of ongoing transition at the restoration site.
While richness was higher at the restoration site, compositional differences suggest that the restored community is functionally distinct, rather than converging toward the reference assemblage. Given the highly heterogeneous nature of urbanized marine ecosystems, variations in environmental conditions between the two sites will continue to shape each community in different ways [99,100]. Differences in substrate will also continue to influence the ongoing recruitment of benthic organisms to the site, as settlement preferences for different taxa vary based on substrate material and structure [101]. Rather than representing an incomplete transition to the reference community, the restoration site is likely developing into a distinct assemblage, which confers its own benefits to local biodiversity. Increased heterogeneity in both habitat and community structure between sites may enhance ecosystem resilience by supporting a broader range of species and functional roles; improving the system’s capacity to respond to disturbances [102,103].
The addition of novel surfaces and substrates, combined with coral outplanting, can augment the seascape by introducing new ecological niches, facilitating coral community assemblages that are distinct from those found on natural reef ecosystems [104,105]. Coral restoration projects are typically implemented to enhance existing, though often degraded, coral communities—leveraging the knowledge that environmental conditions at the chosen restoration site are already generally suitable for coral growth. However, the results of this study highlight the potential benefits of installing artificial reefs in areas where all necessary conditions for coral growth are met, aside from suitable substrate. In these cases, our eDNA results demonstrate that artificial reefs may foster communities even richer than those observed in neighboring natural reefs.
To our knowledge, this study represents the first application of eDNA to assess the outcomes of a coral reef restoration project. With no prior studies using sedimentary eDNA to compare marine communities following ecosystem restoration—or even across anthropogenic impact gradients—the ecological significance of the observed differences in richness and composition remains challenging to contextualize. While differences in richness between sites were not statistically significant, the effect size may still be ecologically relevant, particularly given the low replication in this study. While there are no relevant points of comparison in marine restoration ecology, a comprehensive meta-analysis of over 400 papers found that terrestrial restoration sites were found to exhibit, on average, 20% higher biodiversity than unrestored sites (across a range of indices, not eDNA specific) [106]. The 23.5% difference in richness we observed between the unrestored and restored sites is consistent with the effect of restoration in terrestrial environments. Although these findings cannot be directly equated due to differences in methodological approaches and ecosystem contexts, the parallel observed here is noteworthy and may indicate a broader pattern across restoration efforts.
It is, however, important to interpret these findings within several specific contexts and limitations. First, our reference coral community is located in a region that has experienced considerable degradation; thus, the richness observed at the restoration site was interpreted relative to a reasonable target for biodiversity given the highly urbanized environment. A similar pattern may not hold for restoration work conducted among less impacted reefs. Alternatively, the high richness sampled from the restoration site may have been facilitated by the relatively high regional biodiversity of Hong Kong [54]. Artificial reefs outplanted in areas with less regional biodiversity to recruit from may be less successful at developing diverse communities. Second, unavoidable biases are introduced at every stage of eDNA-based monitoring—from differential preservation of DNA in the environment between taxa, to sampling design, laboratory procedures, and the parameters selected for bioinformatics. These biases can favor the detection of certain groups. While we observed increased overall richness, this measure, as with all survey methods, serves as a proxy for true site diversity. It is possible that richness gains reflect increases in specific taxa, while other groups may continue to be better represented at the reference site. Similarly, it is important to recognize that DNA surveys do not provide direct measurements of absolute organismal abundance. Read counts are affected by variability in DNA shedding rates among taxa, PCR amplification bias, and sequencing depth [107,108,109]. The compositional abundance data from our study does not directly reflect the absolute abundance of different phyla at the sites. However, given broadly similar sample composition and consistent processing methods, differences in the relative read abundance of the same phylum between sites may credibly reflect relative differences in their abundance between sites. Such correlations, however, are likely limited to more dominant taxa [110,111].
As the temporal and spatial variability of eDNA in marine sediments remains poorly characterized [24], our findings are further constrained by having only sampled a single time point. Crucially, without a pre-restoration baseline for our study sites, it is difficult to determine how much of the measured differences in richness and community composition between the restoration and control site can be directly attributed to the restoration project. Aggregation of taxa that were already present in the area, but attracted to a novel structure, likely contributes to the higher richness and distinct community detected at the restoration site. Such an effect does not necessarily indicate restoration success. Moreover, we have assumed that these two sites are comparable due to their proximity (50 m) and similar substrate. However, even subtle differences in environmental conditions—such as hydrodynamics, water quality, and patterns of human activity—may drive variations in eDNA community structure that predate our deployment [112,113]. This concern is particularly relevant given the high heterogeneity of urbanized marine ecosystems [100]. Ultimately, the differences between the eDNA communities detected at the restoration site and the unrestored seabed likely reflect the impact of the artificial reef deployment in combination with aggregation effects, and extrinsic biotic and abiotic variation. Lacking the measurements needed to disentangle the relative influence of these factors, we caution against over-attributing differences in the eDNA communities of these two sites to the restoration project alone.
The interpretation of our eDNA results is further complicated by the physical transport of DNA within the marine environment. Water movement can introduce exogenous DNA from adjacent or even distant habitats, resulting in the detection of taxa that are not present at the actual sampling location. Recognizing the proximity between the restored and unrestored sites, we sampled sediments—which generally exhibit lower DNA mobility compared to water samples—to minimize the influence of DNA transport [114,115]. However, even using sediment samples, some level of DNA movement through the water column prior to and following deposition cannot be fully excluded. Bioturbation also likely affected our results: Our visual surveys documented the presence of black sea cucumbers and sweetlips fish at the study sites, both of which are known to disturb sediments, potentially resuspending and moving eDNA [116]. Such transport dynamics would promote the homogenization of eDNA community profiles between nearby sites, potentially leading to an underestimation of true ecological differentiation between the restored and unrestored sites. Ideally, future studies in systems where control and restoration sites are connected should employ sampling designs that facilitate spatial analyses of eDNA community composition and consider using an eDNA tracer [117,118]. While both approaches are currently novel in marine settings, implementing these methods would improve the ability to characterize transport dynamics within the system.

4.2. Measuring Coral Restoration Outcomes

The most stated objective among peer-reviewed studies of coral reef restoration, whether conducted on existing reefs or in areas augmented with artificial structures, is the establishment of a self-sustaining, functioning coral reef ecosystem [21]. While many coral restoration studies state objectives with a broad ecological scope—to preserve critical ecosystem functions, enhance biodiversity, and foster resilience—a review by Boström-Einarsson et al. found that 45% of restoration projects that noted ecological objectives failed to collect relevant measurements to evaluate them [11]. Across the published literature, there is an apparent misalignment between the ecological aspirations of restoration work and the indicators generally chosen to measure success, with fragment-scale measurements of coral growth and survivorship being reported more than twice as often as community-level species composition metrics [21,119]. Among reef restoration studies that include surveys of coral-associated communities, fish are often the sole taxa reported (~60%) [12]. Despite eDNA having the potential to sample biodiversity across the tree of life, recent work employing eDNA analyses as a tool for monitoring reef restoration outcomes also suffers this bias: With one exception, all previous work using eDNA to characterize communities associated with artificial reefs and coral restoration has focused on fish populations [120,121,122,123,124].
Levy et al. published the first example of eDNA being used to detect a broad range of metazoan taxa settling on or near artificial structures in a marine environment, demonstrating the promise of eDNA for capturing the often-overlooked diversity of reef-associated organisms [125]. Building on this work, our study is the first to use eDNA metabarcoding to assess how coral reef restoration influences eukaryote diversity. By including both restored and control sites, our approach enables a direct comparison of biodiversity outcomes attributable to restoration interventions—an advancement over previous studies, which typically report the community that has settled on new structures without baseline or control site assemblages for comparison. To our knowledge, the work of Knoester et al. is the only benthic biodiversity survey to compare communities associated with artificial reefs to those of a control site; their visual surveys of several macroinvertebrate groups revealed different effects on abundance but could not resolve an overarching effect on site-wide biodiversity [126]. Our survey therefore represents the first evidence of a community-wide enhancement of site richness associated with a coral restoration project.
A major strength of using eDNA for coral ecosystem monitoring is its ability to detect a broad suite of taxa, including cryptic and sessile organisms such as crustose coralline algae (CCA) and sponges [125]. These groups are increasingly recognized for their beneficial roles in coral recruitment, ecosystem engineering, and overall reef resilience [127,128]. By capturing this wider spectrum of biodiversity, eDNA offers a more holistic perspective on the ecological outcomes of restoration interventions. However, several limitations must be acknowledged. The replication and temporal resolution of our eDNA sampling were constrained, limiting our ability to assess temporal trends or establish causality. More broadly, the novelty of eDNA applications in reef restoration means that there are few comparable datasets, complicating interpretation and benchmarking of restoration success. Additionally, questions remain about the ecological significance of eDNA detections, as the method can recover signals from transient or low-abundance taxa whose functional roles within the ecosystem are unclear [129].
Despite these challenges, eDNA provides a valuable foundation for developing more nuanced functional indices. While our study focused on biodiversity as an endpoint, eDNA data could also be leveraged to infer aspects of trophic complexity—an attribute increasingly recognized as central to ecosystem functioning and resilience [93]. Moreover, eDNA can inform on the presence and relative abundance of foundational versus non-native species, provide early detection of outbreaks of harmful taxa, track reproductive outputs, and characterize changes in functional groups relevant to nutrient cycling [130,131,132,133,134,135]. Realizing the full potential of these molecular tools will require further experimental validation and integration with other monitoring approaches, but our findings demonstrate the capacity of eDNA to advance the field toward more comprehensive and ecologically relevant assessments of coral reef restoration outcomes.
Although processing eDNA samples can be costly, sample collection itself is straightforward and inexpensive; therefore, we recommend that those considering using eDNA to monitor restoration work collect baseline samples prior to any intervention, even if resources to support their processing are not available at the start of the project. Ideally, this baseline sampling should be combined with annual monitoring to better capture the trajectory of succession and the persistence of these patterns in the sampled eDNA communities. Collecting and archiving baseline samples provides the opportunity to conduct retrospective analyses as funding or new methods become available, which is especially important for distinguishing restoration effects from natural or pre-existing variability.
Our monitoring efforts demonstrate that the restoration project satisfied, and indeed exceeded, all relevant CRC evaluation criteria and restoration objectives. The 3D-printed ceramic tiles provided a stable substrate for coral survivorship and growth and supported higher abundances of key fish and macroinvertebrates. Furthermore, we demonstrate that sedimentary eDNA analyses can be used to effectively detect previously unmeasured changes in sitewide biodiversity, finding evidence that the tile deployment and coral transplantation supported increased eukaryote biodiversity at the restoration site. These results suggest that the restoration project was successful and support the potential for future use of these tiles as artificial substrates for coral restoration.

Author Contributions

V.Y. and D.M.B. conceived the project and secured research funding. Monitoring surveys were organized and led by H.L., Z.W.W., P.D.T. and V.Y., with survey data processed by H.L. and Z.W.W. Z.K.T.W. and L.W.H.L. contributed to the conceptualization, funding acquisition and supervision of the project. Coral growth and survivorship data analyses were conducted by J.C.Y.W., supported by A.D.C., V.Y., S.E.M. and D.M.B. Supervision of eDNA sampling and laboratory work was provided by V.Y., with advice from S.E.M. and A.D.C. eDNA data analyses were performed by A.D.C., supported by S.E.M. and D.M.B. All data figures were created by A.D.C. Manuscript writing was led by A.D.C., with contributions from J.C.Y.W. and V.Y. The manuscript was edited by all authors. All authors have read and agreed to the published version of the manuscript.

Funding

This research was funded by the Hong Kong Research Grants Council Collaborative Research Fund C7013-19G and by the Hong Kong Agriculture, Fisheries and Conservation Department (AFCD; “AFCD/SQ/256/18/C Provision of Service to Design and Deploy 3D-printed Artificial Reefs for Coral Transplantation in Hoi Ha Wan Marine Park” and “AFCD/SQ/17/22/C Provision of Service on Further Monitoring for Restored Corals on 3D-printed Reef Tiles in Hoi Ha Wan Marine Park”).

Institutional Review Board Statement

Not applicable.

Informed Consent Statement

Not applicable.

Data Availability Statement

The data presented in this study are available on request from the corresponding author to comply with government contract terms.

Acknowledgments

The authors gratefully acknowledge the Agriculture, Fisheries and Conservation Department (AFCD) for funding the project and providing permitting support and professional views essential to the implementation of this study. The authors also wish to thank the World Wide Fund for Nature, Hong Kong (WWF-HK) for their valuable logistical assistance. Jordan Pierce is acknowledged for his contributions to the early-stage design development of the 3D printed ceramic structure. Appreciation is extended to Chris Webster, Christian Lange, Lidia Ratoi, and Dominic Co from the School of Architecture at the University of Hong Kong for their assistance in the fabrication of the prototypes. We also thank Haze Chung for her assistance processing the eDNA samples, Rainbow Tsang for her contribution to the eDNA bioinformatics, as well as all volunteers who helped with the deployment of the ceramic reef tiles in Hoi Ha Wan and subsequent surveys.

Conflicts of Interest

The authors declare no conflicts of interest.

Abbreviations

The following abbreviations are used in this manuscript:
HHWMPHoi Ha Wan Marine Park
eDNAEnvironmental DNA

Appendix A

Table A1. Comparison of generalized linear mixed models (GLMMs) for coral extension rates across genera, evaluated using AIC. K denotes the number of model parameters, logLik is the log-likelihood of the model, ΔAIC represents the difference in AIC relative to the best-fitting model, and AIC Weight indicates the relative likelihood of each model given the data. The best-fitting model is highlighted in bold.
ModelKlogLikAICΔAICAIC Weight
Random: unit_no
AR1: survey_no
718,080.95−36,147.91168.75<0.001
Random: unit_no/tile_no
AR1: survey_no
818,102.02−36,188.05128.610.003
Random: unit_no/tile_no/coral_no
AR1: survey_no
918,167.33−36,316.660.000.997
Table A2. Cumulative number of the coral condition by genus (Acropora, Pavona, and Platygyra) during each monitoring survey. Status indicators include: H (healthy), PM (partial mortality), D (dead), and DTCH (detached).
AcroporaPavonaPlatygyra
SurveyHPMDDTCHHPMDDTCHHPMDDTCH
1126000126000126000
2126000125001126000
3126000125001126000
4126000125001126000
5125001121014125001
6125001120024124002
71250011130211124002
81250011070415123012
91250011050417123012
101240021050417122112
111220041010421116433
121200069904231091133
13119106990423116343
14118107960426112644

Appendix B

Additional figures pertaining to the results of eDNA analyses.
Figure A1. Rarefaction curves for ASV detection. Each line represents a sample, colored by site. (A) Rarefaction curves for ASVs inferred from the DADA2 denoise-paired function, before any subsequent cleanup steps. These curves indicate that the sequencing effort provided sufficient coverage for the taxa represented in the samples. The sample from the unrestored site that was subsequently excluded from analyses based on abnormally low richness (974 ASVs) and biased taxonomic composition is shown. (B) Rarefaction curves plotted from the phyloseq object that resulted following prevalence and abundance filtering, which retained only those ASVs that appeared in at least three samples from the same site and were represented by a minimum of 50 reads. The dotted grey line indicates the sampling depth used for rarefaction (96,443 reads), which was set to 90% of the depth of the sample with the fewest reads.
Jmse 13 01605 g0a1
Figure A2. ASVs observed per phyla. Bar size and the number associated with each phylum name indicate the number of unique ASVs assigned to that phylum across all fourteen samples from all three sites. Phyla are grouped by kingdom, following the taxonomic used by the World Register of Marine Species (WoRMS) database. Logarithmic transformation was applied to the scale to enhance visibility.
Jmse 13 01605 g0a2

References

  1. Gardner, T.A.; Côté, I.M.; Gill, J.A.; Grant, A.; Watkinson, A.R. Long-Term Region-Wide Declines in Caribbean Corals. Science 2003, 301, 958–960. [Google Scholar] [CrossRef]
  2. Bruno, J.F.; Valdivia, A. Coral Reef Degradation Is Not Correlated with Local Human Population Density. Sci. Rep. 2016, 6, 29778. [Google Scholar] [CrossRef]
  3. Hochberg, E.J.; Gierach, M.M. Missing the Reef for the Corals: Unexpected Trends Between Coral Reef Condition and the Environment at the Ecosystem Scale. Front. Mar. Sci. 2021, 8, 727038. [Google Scholar] [CrossRef]
  4. Whaley, Z.; Cramer, K.; McClenachan, L.; Tewfik, A.; Alvarez-Filip, L.; McField, M.; Carilli, J.; Vardi, T. Long-Term Change in Caribbean Reef Water Quality and Ecosystem Health. Bull. Fla. Mus. Nat. Hist. 2023, 60, 126. [Google Scholar] [CrossRef]
  5. Grottoli, A.G.; Warner, M.E.; Levas, S.J.; Aschaffenburg, M.D.; Schoepf, V.; McGinley, M.; Baumann, J.; Matsui, Y. The Cumulative Impact of Annual Coral Bleaching Can Turn Some Coral Species Winners into Losers. Glob. Change Biol. 2014, 20, 3823–3833. [Google Scholar] [CrossRef]
  6. Kalmus, P.; Ekanayaka, A.; Kang, E.; Baird, M.; Gierach, M. Past the Precipice? Projected Coral Habitability Under Global Heating. Earths Future 2022, 10, e2021EF002608. [Google Scholar] [CrossRef] [PubMed]
  7. Reaka-Kudla, M.L. The Global Biodiversity of Coral Reefs: A Comparison with Rainforests. Biodivers. II Underst. Prot. Our Biol. Resour. 1997, 2, 551. [Google Scholar]
  8. Knowlton, N.; Brainard, R.E.; Fisher, R.; Moews, M.; Plaisance, L.; Caley, M.J. Coral Reef Biodiversity. In Life in the World’s Oceans; Wiley-Blackwell: Hoboken, NJ, USA, 2010; pp. 65–78. ISBN 978-1-4443-2550-8. [Google Scholar]
  9. Battaglia, F.M. Climate Change and the Ocean: The Disruption of the Coral Reef. In Blue Planet Law; Springer: Cham, Switzerland, 2023; pp. 121–130. ISBN 978-3-031-24887-0. [Google Scholar]
  10. Edwards, A.; Guest, J.; Humanes, A. Rehabilitating Coral Reefs in the Anthropocene. Curr. Biol. 2024, 34, R399–R406. [Google Scholar] [CrossRef] [PubMed]
  11. Boström-Einarsson, L.; Babcock, R.C.; Bayraktarov, E.; Ceccarelli, D.; Cook, N.; Ferse, S.C.A.; Hancock, B.; Harrison, P.; Hein, M.; Shaver, E.; et al. Coral Restoration—A Systematic Review of Current Methods, Successes, Failures and Future Directions. PLoS ONE 2020, 15, e0226631. [Google Scholar] [CrossRef] [PubMed]
  12. Higgins, E.; Metaxas, A.; Scheibling, R.E. A Systematic Review of Artificial Reefs as Platforms for Coral Reef Research and Conservation. PLoS ONE 2022, 17, e0261964. [Google Scholar] [CrossRef] [PubMed]
  13. Sedano, F.; Navarro-Barranco, C.; Guerra-García, J.M.; Espinosa, F. Understanding the Effects of Coastal Defence Structures on Marine Biota: The Role of Substrate Composition and Roughness in Structuring Sessile, Macro- and Meiofaunal Communities. Mar. Pollut. Bull. 2020, 157, 111334. [Google Scholar] [CrossRef] [PubMed]
  14. Hata, T.; Madin, J.S.; Cumbo, V.R.; Denny, M.; Figueiredo, J.; Harii, S.; Thomas, C.J.; Baird, A.H. Coral Larvae Are Poor Swimmers and Require Fine-Scale Reef Structure to Settle. Sci. Rep. 2017, 7, 2249. [Google Scholar] [CrossRef] [PubMed]
  15. Levy, N.; Berman, O.; Yuval, M.; Loya, Y.; Treibitz, T.; Tarazi, E.; Levy, O. Emerging 3D Technologies for Future Reformation of Coral Reefs: Enhancing Biodiversity Using Biomimetic Structures Based on Designs by Nature. Sci. Total Environ. 2022, 830, 154749. [Google Scholar] [CrossRef]
  16. Spieler, R.E.; Gilliam, D.S.; Sherman, R.L. Artificial Substrate and Coral Reef Restoration: What Do We Need to Know to Know What We Need? Bull. Mar. Sci. 2001, 69, 1013–1030. [Google Scholar]
  17. Vivier, B.; Dauvin, J.-C.; Navon, M.; Rusig, A.-M.; Mussio, I.; Orvain, F.; Boutouil, M.; Claquin, P. Marine Artificial Reefs, a Meta-Analysis of Their Design, Objectives and Effectiveness. Glob. Ecol. Conserv. 2021, 27, e01538. [Google Scholar] [CrossRef]
  18. Done, T.J. Phase Shifts in Coral Reef Communities and Their Ecological Significance. Hydrobiologia 1992, 247, 121–132. [Google Scholar] [CrossRef]
  19. Wismer, S.; Hoey, A.; Bellwood, D. Cross-Shelf Benthic Community Structure on the Great Barrier Reef: Relationships between Macroalgal Cover and Herbivore Biomass. Mar. Ecol. Prog. Ser. 2009, 376, 45–54. [Google Scholar] [CrossRef]
  20. Edwards, A.; Job, S.; Wells, S. Learning Lessons from Past Reef-Rehabilitation Projects. In Reef Rehabilitation Manual; Coral Reef Targeted Research & Capacity Building for Management Program: St. Lucia, QLD, Australia, 2010; pp. 129–166. ISBN 978-1-921317-05-7. [Google Scholar]
  21. Hein, M.Y.; Willis, B.L.; Beeden, R.; Birtles, A. The Need for Broader Ecological and Socioeconomic Tools to Evaluate the Effectiveness of Coral Restoration Programs. Restor. Ecol. 2017, 25, 873–883. [Google Scholar] [CrossRef]
  22. Bourne, D.G.; Morrow, K.M.; Webster, N.S. Insights into the Coral Microbiome: Underpinning the Health and Resilience of Reef Ecosystems. Annu. Rev. Microbiol. 2016, 70, 317–340. [Google Scholar] [CrossRef]
  23. Leray, M.; Knowlton, N. DNA Barcoding and Metabarcoding of Standardized Samples Reveal Patterns of Marine Benthic Diversity. Proc. Natl. Acad. Sci. USA 2015, 112, 2076–2081. [Google Scholar] [CrossRef]
  24. Beng, K.C.; Corlett, R.T. Applications of Environmental DNA (eDNA) in Ecology and Conservation: Opportunities, Challenges and Prospects. Biodivers. Conserv. 2020, 29, 2089–2121. [Google Scholar] [CrossRef]
  25. Thompson, S.; Jarman, S.; Griffin, K.; Spencer, C.; Cummins, G.; Partridge, J.; Langlois, T. Novel Drop-Sampler for Simultaneous Collection of Stereo-Video, Environmental DNA and Oceanographic Data. Ecol. Evol. 2024, 14, e70705. [Google Scholar] [CrossRef] [PubMed]
  26. Duprey, N.N.; McIlroy, S.E.; Ng, T.P.T.; Thompson, P.D.; Kim, T.; Wong, J.C.Y.; Wong, C.W.M.; Husa, S.M.; Li, S.M.H.; Williams, G.A.; et al. Facing a Wicked Problem with Optimism: Issues and Priorities for Coral Conservation in Hong Kong. Biodivers. Conserv. 2017, 26, 2521–2545. [Google Scholar] [CrossRef]
  27. Xie, J.Y.; Yeung, Y.H.; Kwok, C.K.; Kei, K.; Ang, P.; Chan, L.L.; Cheang, C.C.; Chow, W.; Qiu, J.-W. Localized Bleaching and Quick Recovery in Hong Kong’s Coral Communities. Mar. Pollut. Bull. 2020, 153, 110950. [Google Scholar] [CrossRef] [PubMed]
  28. Duprey, N.N.; Yasuhara, M.; Baker, D.M. Reefs of Tomorrow: Eutrophication Reduces Coral Biodiversity in an Urbanized Seascape. Glob. Change Biol. 2016, 22, 3550–3565. [Google Scholar] [CrossRef]
  29. Fabricius, K.E. Effects of Terrestrial Runoff on the Ecology of Corals and Coral Reefs: Review and Synthesis. Mar. Pollut. Bull. 2005, 50, 125–146. [Google Scholar] [CrossRef]
  30. Cybulski, J.D.; Husa, S.M.; Duprey, N.N.; Mamo, B.L.; Tsang, T.P.N.; Yasuhara, M.; Xie, J.Y.; Qiu, J.-W.; Yokoyama, Y.; Baker, D.M. Coral Reef Diversity Losses in China’s Greater Bay Area Were Driven by Regional Stressors. Sci. Adv. 2020, 6, eabb1046. [Google Scholar] [CrossRef] [PubMed]
  31. Yeung, Y.H.; Xie, J.Y.; Kwok, C.K.; Kei, K.; Ang, P.; Chan, L.L.; Dellisanti, W.; Cheang, C.C.; Chow, W.K.; Qiu, J.-W. Hong Kong’s Subtropical Scleractinian Coral Communities: Baseline, Environmental Drivers and Management Implications. Mar. Pollut. Bull. 2021, 167, 112289. [Google Scholar] [CrossRef] [PubMed]
  32. Hua, F.L.; Tsang, Y.F.; Chua, H. Progress of Water Pollution Control in Hong Kong. Aquat. Ecosyst. Health Manag. 2008, 11, 225–229. [Google Scholar] [CrossRef]
  33. Chan, A.; Chan, K.; Choi, C.; McCorry, D.; Lee, M.; Ang, P. Field Guide to Hard Corals of Hong Kong; Agriculture, Fisheries and Conservation Department, The Hong Kong SAR Government: Hong Kong, China, 2005.
  34. Geeraert, N.; Archana, A.; Xu, M.N.; Kao, S.-J.; Baker, D.M.; Thibodeau, B. Investigating the Link between Pearl River-Induced Eutrophication and Hypoxia in Hong Kong Shallow Coastal Waters. Sci. Total Environ. 2021, 772, 145007. [Google Scholar] [CrossRef]
  35. Lange, C. Rethinking Artificial Reef Structures through a Robotic 3D Clay Printing Method. In Proceedings of the 25th International Conference of the Association for Computer-Aided Architectural Design Research in Asia (CAADRIA), Bangkok, Thailand, 5–6 August 2020; Association for Computer-Aided Architectural Design Research in Asia (CAADRIA): Hong Kong, 2020; Volume 2, pp. 463–472. [Google Scholar]
  36. Brooks, M.E.; Kristensen, K.; van Benthem, K.J.; Magnusson, A.; Berg, C.W.; Nielsen, A.; Skaug, H.J.; Mächler, M.; Bolker, B.M. glmmTMB Balances Speed and Flexibility Among Packages for Zero-Inflated Generalized Linear Mixed Modeling. R J. 2017, 9, 378–400. [Google Scholar] [CrossRef]
  37. Bates, D.; Mächler, M.; Bolker, B.; Walker, S. Fitting Linear Mixed-Effects Models Using Lme4. J. Stat. Softw. 2015, 67, 1–48. [Google Scholar] [CrossRef]
  38. Lenth, R. emmeans: Estimated Marginal Means, Aka Least-Squares Means, version 1.11.2-8; R package. 2025. Available online: https://rvlenth.github.io/emmeans/ (accessed on 19 August 2025).
  39. Hodgson, G. Reef Check California Instruction Manual: A Guide to Monitoring California’s Rocky Reefs, 1st ed.; Reef Check Foundation: Pacific Palisades, CA, USA, 2006; ISBN 978-0-9723051-9-8. [Google Scholar]
  40. Sadovy, Y.; Cornish, A.S. Reef Fishes of Hong Kong; Hong Kong University Press: Hong Kong, China, 2000; ISBN 962-209-480-5. [Google Scholar]
  41. Azevedo, J.M.N.; Rodrigues, J.B.; Mendizabal, M.; Arruda, L.M. Study of a Sample of Dusky Groupers, Epinephelus Marginatus (Lowe, 1834), Caught in a Tide Pool at Lajes Do Pico, Azores. Bol. Mus. Munic. Funchal. 1995, 4, 55–64. [Google Scholar]
  42. Moore, A.; Ndobe, S.; Ambo-Rappe, R.; Jompa, J.; Yasir, I. Dietary Preference of Key Microhabitat Diadema Setosum: A Step towards Holistic Banggai Cardinalfish Conservation. IOP Conf. Ser. Earth Environ. Sci. 2019, 235, 012054. [Google Scholar] [CrossRef]
  43. Vadas, R.L. Preferential Feeding: An Optimization Strategy in Sea Urchins. Ecol. Monogr. 1977, 47, 337–371. [Google Scholar] [CrossRef]
  44. Tsuchiya, M.; Nishihira, M.; Poung-in, S.; Choohabandit, S. Feeding Behavior of the Urchin-Eating Urchin Salmacis Sphaeroides. Galaxea J. Coral Reef Stud. 2009, 11, 149–153. [Google Scholar] [CrossRef]
  45. Ahmed, Q.; Ali, Q.; Bat, L.; Öztekin, A.; Ghory, F.; Shaikh, I.; Qazi, H.; Baloch, A. Gut Content Analysis in Holothuria Leucospilota and Holothuria Cinerascens(Echinodermata: Holothuroidea: Holothuriidae) From Karachi Coast. J. Mater. Env. Sci. 2023, 14, 31–40. [Google Scholar]
  46. Woods, C.M.C. Natural Diet of the Seahorse Hippocampus Abdominalis. N. Z. J. Mar. Freshw. Res. 2002, 36, 655–660. [Google Scholar] [CrossRef]
  47. Bolyen, E.; Rideout, J.R.; Dillon, M.R.; Bokulich, N.A.; Abnet, C.C.; Al-Ghalith, G.A.; Alexander, H.; Alm, E.J.; Arumugam, M.; Asnicar, F.; et al. Reproducible, Interactive, Scalable and Extensible Microbiome Data Science Using QIIME 2. Nat. Biotechnol. 2019, 37, 852–857. [Google Scholar] [CrossRef] [PubMed]
  48. Callahan, B.J.; McMurdie, P.J.; Rosen, M.J.; Han, A.W.; Johnson, A.J.A.; Holmes, S.P. DADA2: High-Resolution Sample Inference from Illumina Amplicon Data. Nat. Methods 2016, 13, 581–583. [Google Scholar] [CrossRef]
  49. Wang, S.; Meyer, E.; McKay, J.K.; Matz, M.V. 2b-RAD: A Simple and Flexible Method for Genome-Wide Genotyping. Nat. Methods 2012, 9, 808–810. [Google Scholar] [CrossRef]
  50. Porter, T.M.; Hajibabaei, M. Over 2.5 Million COI Sequences in GenBank and Growing. PLoS ONE 2018, 13, e0200177. [Google Scholar] [CrossRef] [PubMed]
  51. R Core Team. R: A Language and Environment for Statistical Computing, version 4.5.0; R Foundation for Statistical Computing: Vienna, Austria, 2021.
  52. McMurdie, P.J.; Holmes, S. Phyloseq: An R Package for Reproducible Interactive Analysis and Graphics of Microbiome Census Data. PLoS ONE 2013, 8, e61217. [Google Scholar] [CrossRef] [PubMed]
  53. Kandlikar, G.S.; Gold, Z.J.; Cowen, M.C.; Meyer, R.S.; Freise, A.C.; Kraft, N.J.; Moberg-Parker, J.; Sprague, J.; Kushner, D.J.; Curd, E.E. Ranacapa: An R Package and Shiny Web App to Explore Environmental DNA Data with Exploratory Statistics and Interactive Visualizations. F1000Research 2018, 7, 1734. [Google Scholar] [CrossRef] [PubMed]
  54. McIlroy, S.E.; Guibert, I.; Archana, A.; Chung, W.Y.H.; Duffy, J.E.; Gotama, R.; Hui, J.; Knowlton, N.; Leray, M.; Meyer, C.; et al. Life Goes on: Spatial Heterogeneity Promotes Biodiversity in an Urbanized Coastal Marine Ecosystem. Glob. Change Biol. 2023, 30, e17248. [Google Scholar] [CrossRef]
  55. Wickham, H. Getting Started with Ggplot2. In ggplot2: Elegant Graphics for Data Analysis; Springer: Berlin/Heidelberg, Germany, 2016; pp. 11–31. [Google Scholar]
  56. Oksanen, J.; Blanchet, F.G.; Kindt, R.; Legendre, P.; Minchin, P.R.; O’hara, R.; Simpson, G.L.; Solymos, P.; Stevens, M.H.H.; Wagner, H. Package ‘Vegan’. Community Ecology Package, version 2.6-6.1. Available online: http://CRAN.R-project.org/package=vegan (accessed on 19 August 2025).
  57. Kassambara, A. Rstatix: Pipe-Friendly Framework for Basic Statistical Tests, version 0.7.2; CRAN Contrib. Packages, 2023. Available online: https://rpkgs.datanovia.com/rstatix/ (accessed on 19 August 2025). [CrossRef]
  58. Ebbert, D. Chisq.Posthoc.Test: A Post Hoc Analysis for Pearson’s Chi-Squared Test for Count Data, version 0.1.2; 2019. Available online: https://cran.r-project.org/web/packages/chisq.posthoc.test/chisq.posthoc.test.pdf (accessed on 19 August 2025).
  59. Beasley, T.M.; Schumacker, R.E. Multiple Regression Approach to Analyzing Contingency Tables: Post Hoc and Planned Comparison Procedures. J. Exp. Educ. 1995, 64, 79–93. [Google Scholar] [CrossRef]
  60. Godhe, A.; Rynearson, T. The Role of Intraspecific Variation in the Ecological and Evolutionary Success of Diatoms in Changing Environments. Philos. Trans. R. Soc. B 2017, 372, 20160399. [Google Scholar] [CrossRef]
  61. Julius, M.L.; Theriot, E.C. Theriot, E.C. The Diatoms: A Primer. In The Diatoms: Applications for the Environmental and Earth Sciences; Smol, J.P., Stoermer, E.F., Eds.; Cambridge University Press: Cambridge, UK, 2010; pp. 8–22. ISBN 978-0-521-50996-1. [Google Scholar]
  62. Martinez Arbizu, P. pairwiseAdonis: Pairwise Multilevel Comparison Using Adonis, version 0.4; 2020. Available online: https://github.com/pmartinezarbizu/pairwiseAdonis (accessed on 19 August 2025).
  63. Goergen, E.A.; Schopmeyer, S.; Moulding, A.L.; Moura, A.; Kramer, P.; Viehman, T.S. Coral Reef Restoration Monitoring Guide: Methods to Evaluate Restoration Success from Local to Ecosystem Scales; NOS and NCCOS: Silver Spring, MD, USA, 2020. [CrossRef]
  64. Gladfelter, E.H.; Monahan, R.K.; Gladfelter, W.B. Growth Rates of Five Reef-Building Corals in the Northeastern Caribbean. Bull. Mar. Sci. 1978, 28, 728–734. [Google Scholar]
  65. Zawada, K.J.; Dornelas, M.; Madin, J.S. Quantifying Coral Morphology. Coral Reefs 2019, 38, 1281–1292. [Google Scholar] [CrossRef]
  66. Rossi, S.; Schubert, N.; Brown, D.; Soares, M.d.O.; Grosso, V.; Rangel-Huerta, E.; Maldonado, E. Linking Host Morphology and Symbiont Performance in Octocorals. Sci. Rep. 2018, 8, 12823. [Google Scholar] [CrossRef]
  67. Lough, J.; Barnes, D. Environmental Controls on Growth of the Massive Coral Porites. J. Exp. Mar. Biol. Ecol. 2000, 245, 225–243. [Google Scholar] [CrossRef]
  68. Browne, N. Spatial and Temporal Variations in Coral Growth on an Inshore Turbid Reef Subjected to Multiple Disturbances. Mar. Environ. Res. 2012, 77, 71–83. [Google Scholar] [CrossRef] [PubMed]
  69. Calle-Triviño, J.; Muñiz-Castillo, A.I.; Cortés-Useche, C.; Morikawa, M.; Sellares-Blasco, R.; Arias-González, J.E. Approach to the Functional Importance of Acropora cervicornis in Outplanting Sites in the Dominican Republic. Front. Mar. Sci. 2021, 8, 668325. [Google Scholar] [CrossRef]
  70. Young, C.N.; Schopmeyer, S.; Lirman, D. A Review of Reef Restoration and Coral Propagation Using the Threatened Genus Acropora in the Caribbean and Western Atlantic. Bull. Mar. Sci. 2012, 88, 1075–1098. [Google Scholar] [CrossRef]
  71. Highsmith, R.C. Reproduction by Fragmentation in Corals. Mar. Ecol. Prog. Ser. Oldendorf 1982, 7, 207–226. [Google Scholar] [CrossRef]
  72. Lirman, D. Fragmentation in the Branching Coral Acropora palmata (Lamarck): Growth, Survivorship, and Reproduction of Colonies and Fragments. J. Exp. Mar. Biol. Ecol. 2000, 251, 41–57. [Google Scholar] [CrossRef] [PubMed]
  73. Clark, S.; Edwards, A. Coral Transplantation as an Aid to Reef Rehabilitation: Evaluation of a Case Study in the Maldive Islands. Coral Reefs 1995, 14, 201–213. [Google Scholar] [CrossRef]
  74. Yap, H.T.; Alino, P.M.; Gomez, E.D. Trends in Growth and Mortality of Three Coral Species(Anthozoa: Scleractinia), Including Effects of Transplantation. Mar. Ecol. Prog. Ser. Oldendorf 1992, 83, 91–101. [Google Scholar] [CrossRef]
  75. Ware, M.; Garfield, E.N.; Nedimyer, K.; Levy, J.; Kaufman, L.; Precht, W.; Winters, R.S.; Miller, S.L. Survivorship and Growth in Staghorn Coral (Acropora cervicornis) Outplanting Projects in the Florida Keys National Marine Sanctuary. PLoS ONE 2020, 15, e0231817. [Google Scholar] [CrossRef]
  76. Cabaitan, P.C.; Yap, H.T.; Gomez, E.D. Performance of Single versus Mixed Coral Species for Transplantation to Restore Degraded Reefs. Restor. Ecol. 2015, 23, 349–356. [Google Scholar] [CrossRef]
  77. Conti-Jerpe, I.E.; Thompson, P.D.; Wong, C.W.M.; Oliveira, N.L.; Duprey, N.N.; Moynihan, M.A.; Baker, D.M. Trophic Strategy and Bleaching Resistance in Reef-Building Corals. Sci. Adv. 2020, 6, eaaz5443. [Google Scholar] [CrossRef]
  78. Cybulski, J.D. Hong Kong’s Coral Assemblages through Time: A Paleoecological and Geochemical Look at Human-Driven Change. Ph.D. Thesis, The University of Hong Kong, Hong Kong SAR, China, 2021. [Google Scholar]
  79. Liao, H.; Hu, S.; Yang, H.; Wang, L.; Tanaka, S.; Takigawa, I.; Li, W.; Fan, H.; Gong, J.P. Data-Driven de Novo Design of Super-Adhesive Hydrogels. Nature 2025, 644, 89–95. [Google Scholar] [CrossRef] [PubMed]
  80. Bohnsack, J.A.; Sutherland, D.L. Artificial Reef Research: A Review with Recommendations for Future Priorities. Bull. Mar. Sci. 1985, 37, 11–39. [Google Scholar]
  81. Arena, P.T.; Jordan, L.K.B.; Spieler, R.E. Fish Assemblages on Sunken Vessels and Natural Reefs in Southeast Florida, USA. Hydrobiologia 2007, 580, 157–171. [Google Scholar] [CrossRef]
  82. Gratwicke, B.; Speight, M.R. The Relationship between Fish Species Richness, Abundance and Habitat Complexity in a Range of Shallow Tropical Marine Habitats. J. Fish Biol. 2005, 66, 650–667. [Google Scholar] [CrossRef]
  83. Santos, L.N.; Araujo, F.G.; Brotto, D.S. Artificial Structures as Tools for Fish Habitat Rehabilitation in a Neotropical Reservoir. Aquat. Conserv. Mar. Freshw. Ecosyst. 2008, 18, 896. [Google Scholar] [CrossRef]
  84. Sherman, R.L.; Gilliam, D.S.; Spieler, R.E. Artificial Reef Design: Void Space, Complexity, and Attractants. ICES J. Mar. Sci. 2002, 59, S196–S200. [Google Scholar] [CrossRef]
  85. Burkepile, D.E.; Hay, M.E. Herbivore Species Richness and Feeding Complementarity Affect Community Structure and Function on a Coral Reef. Proc. Natl. Acad. Sci. USA 2008, 105, 16201–16206. [Google Scholar] [CrossRef] [PubMed]
  86. Hughes, T.P.; Rodrigues, M.J.; Bellwood, D.R.; Ceccarelli, D.; Hoegh-Guldberg, O.; McCook, L.; Moltschaniwskyj, N.; Pratchett, M.S.; Steneck, R.S.; Willis, B. Phase Shifts, Herbivory, and the Resilience of Coral Reefs to Climate Change. Curr. Biol. 2007, 17, 360–365. [Google Scholar] [CrossRef]
  87. Mumby, P.; Steneck, R. Coral Reef Management and Conservation in Light of Rapidly Evolving Ecological Paradigms. Trends Ecol. Evol. 2008, 23, 555–563. [Google Scholar] [CrossRef] [PubMed]
  88. Glynn, P.W.; D’Croz, L. Experimental Evidence for High Temperature Stress as the Cause of El Niño-Coincident Coral Mortality. Coral Reefs 1990, 8, 181–191. [Google Scholar] [CrossRef]
  89. Carreiro-Silva, M.; McClanahan, T.R. Macrobioerosion of Dead Branching Porites, 4 and 6 Years after Coral Mass Mortality. Mar. Ecol. Prog. Ser. 2012, 458, 103–122. [Google Scholar] [CrossRef]
  90. Yachi, S.; Loreau, M. Biodiversity and Ecosystem Productivity in a Fluctuating Environment: The Insurance Hypothesis. Proc. Natl. Acad. Sci. USA 1999, 96, 1463–1468. [Google Scholar] [CrossRef] [PubMed]
  91. McGrady-Steed, J.; Harris, P.M.; Morin, P.J. Biodiversity Regulates Ecosystem Predictability. Nature 1997, 390, 162–165. [Google Scholar] [CrossRef]
  92. Naeem, S.; Li, S. Biodiversity Enhances Ecosystem Reliability. Nature 1997, 390, 507–509. [Google Scholar] [CrossRef]
  93. Gann, G.D.; McDonald, T.; Walder, B.; Aronson, J.; Nelson, C.R.; Jonson, J.; Hallett, J.G.; Eisenberg, C.; Guariguata, M.R.; Liu, J. International Principles and Standards for the Practice of Ecological Restoration. Restor. Ecol. 2019, 27, S1–S46. [Google Scholar] [CrossRef]
  94. McDonald, T.; Gann, G.; Jonson, J.; Dixon, K. International Standards for the Practice of Ecological Restoration–Including Principles and Key Concepts; Society for Ecological Restoration: Washington, DC, USA, 2016. [Google Scholar]
  95. Dang, H.; Lovell, C.R. Microbial Surface Colonization and Biofilm Development in Marine Environments. Microbiol. Mol. Biol. Rev. 2015, 80, 91–138. [Google Scholar] [CrossRef] [PubMed]
  96. Virta, L.; Gammal, J.; Järnström, M.; Bernard, G.; Soininen, J.; Norkko, J.; Norkko, A. The Diversity of Benthic Diatoms Affects Ecosystem Productivity in Heterogeneous Coastal Environments. Ecology 2019, 100, e02765. [Google Scholar] [CrossRef]
  97. Perkol-Finkel, S.; Benayahu, Y. Recruitment of Benthic Organisms onto a Planned Artificial Reef: Shifts in Community Structure One Decade Post-Deployment. Mar. Environ. Res. 2005, 59, 79–99. [Google Scholar] [CrossRef]
  98. Spagnolo, A.; Cuicchi, C.; Punzo, E.; Santelli, A.; Scarcella, G.; Fabi, G. Patterns of Colonization and Succession of Benthic Assemblages in Two Artificial Substrates. J. Sea Res. 2014, 88, 78–86. [Google Scholar] [CrossRef]
  99. Pickett, S.T.A.; Cadenasso, M.L.; Rosi-Marshall, E.J.; Belt, K.T.; Groffman, P.M.; Grove, J.M.; Irwin, E.G.; Kaushal, S.S.; LaDeau, S.L.; Nilon, C.H.; et al. Dynamic Heterogeneity: A Framework to Promote Ecological Integration and Hypothesis Generation in Urban Systems. Urban Ecosyst. 2017, 20, 1–14. [Google Scholar] [CrossRef]
  100. Todd, P.A.; Heery, E.C.; Loke, L.H.L.; Thurstan, R.H.; Kotze, D.J.; Swan, C. Towards an Urban Marine Ecology: Characterizing the Drivers, Patterns and Processes of Marine Ecosystems in Coastal Cities. Oikos 2019, 128, 1215–1242. [Google Scholar] [CrossRef]
  101. Bae, S.; Ubagan, M.D.; Shin, S.; Kim, D.G. Comparison of Recruitment Patterns of Sessile Marine Invertebrates According to Substrate Characteristics. Int. J. Environ. Res. Public Health 2022, 19, 1083. [Google Scholar] [CrossRef]
  102. Juan, S.d.; Thrush, S.F.; Hewitt, J.E. Counting on β-Diversity to Safeguard the Resilience of Estuaries. PLoS ONE 2013, 8, e65575. [Google Scholar] [CrossRef]
  103. Oliver, T.H.; Heard, M.S.; Isaac, N.J.B.; Roy, D.B.; Procter, D.; Eigenbrod, F.; Freckleton, R.; Hector, A.; Orme, C.D.L.; Petchey, O.L.; et al. Biodiversity and Resilience of Ecosystem Functions. Trends Ecol. Evol. 2015, 30, 673–684. [Google Scholar] [CrossRef] [PubMed]
  104. Connell, S.D. Floating Pontoons Create Novel Habitats for Subtidal Epibiota. J. Exp. Mar. Biol. Ecol. 2000, 247, 183–194. [Google Scholar] [CrossRef] [PubMed]
  105. Perkol-Finkel, S.; Benayahu, Y. Differential Recruitment of Benthic Communities on Neighboring Artificial and Natural Reefs. J. Exp. Mar. Biol. Ecol. 2007, 340, 25–39. [Google Scholar] [CrossRef]
  106. Atkinson, J.; Brudvig, L.A.; Mallen-Cooper, M.; Nakagawa, S.; Moles, A.T.; Bonser, S.P. Terrestrial Ecosystem Restoration Increases Biodiversity and Reduces Its Variability, but Not to Reference Levels: A Global Meta-analysis. Ecol. Lett. 2022, 25, 1725–1737. [Google Scholar] [CrossRef]
  107. Deiner, K.; Walser, J.-C.; Mächler, E.; Altermatt, F. Choice of Capture and Extraction Methods Affect Detection of Freshwater Biodiversity from Environmental DNA. Biol. Conserv. 2015, 183, 53–63. [Google Scholar] [CrossRef]
  108. Nichols, R.V.; Vollmers, C.; Newsom, L.A.; Wang, Y.; Heintzman, P.D.; Leighton, M.; Green, R.E.; Shapiro, B. Minimizing Polymerase Biases in Metabarcoding. Mol. Ecol. Resour. 2018, 18, 927–939. [Google Scholar] [CrossRef]
  109. Zinger, L.; Bonin, A.; Alsos, I.G.; Bálint, M.; Bik, H.; Boyer, F.; Chariton, A.A.; Creer, S.; Coissac, E.; Deagle, B.E.; et al. DNA Metabarcoding—Need for Robust Experimental Designs to Draw Sound Ecological Conclusions. Mol. Ecol. 2019, 28, 1857–1862. [Google Scholar] [CrossRef]
  110. Shelton, A.O.; Gold, Z.J.; Jensen, A.J.; D′Agnese, E.; Andruszkiewicz Allan, E.; Van Cise, A.; Gallego, R.; Ramón-Laca, A.; Garber-Yonts, M.; Parsons, K.; et al. Toward Quantitative Metabarcoding. Ecology 2023, 104, e3906. [Google Scholar] [CrossRef]
  111. Skelton, J.; Cauvin, A.; Hunter, M.E. Environmental DNA Metabarcoding Read Numbers and Their Variability Predict Species Abundance, but Weakly in Non-Dominant Species. Environ. DNA 2023, 5, 1092–1104. [Google Scholar] [CrossRef]
  112. Joseph, C.; Faiq, M.E.; Li, Z.; Chen, G. Persistence and Degradation Dynamics of eDNA Affected by Environmental Factors in Aquatic Ecosystems. Hydrobiologia 2022, 849, 4119–4133. [Google Scholar] [CrossRef]
  113. Xie, R.; Zhao, G.; Yang, J.; Wang, Z.; Xu, Y.; Zhang, X.; Wang, Z. eDNA Metabarcoding Revealed Differential Structures of Aquatic Communities in a Dynamic Freshwater Ecosystem Shaped by Habitat Heterogeneity. Environ. Res. 2021, 201, 111602. [Google Scholar] [CrossRef] [PubMed]
  114. Shogren, A.J.; Tank, J.L.; Andruszkiewicz, E.; Olds, B.; Mahon, A.R.; Jerde, C.L.; Bolster, D. Controls on eDNA Movement in Streams: Transport, Retention, and Resuspension. Sci. Rep. 2017, 7, 5065. [Google Scholar] [CrossRef] [PubMed]
  115. Turner, C.R.; Uy, K.L.; Everhart, R.C. Fish Environmental DNA Is More Concentrated in Aquatic Sediments than Surface Water. Biol. Conserv. 2015, 183, 93–102. [Google Scholar] [CrossRef]
  116. Prosser, C.M.; Hedgpeth, B.M. Effects of Bioturbation on Environmental DNA Migration through Soil Media. PLoS ONE 2018, 13, e0196430. [Google Scholar] [CrossRef]
  117. Jeunen, G.-J.; Knapp, M.; Spencer, H.G.; Lamare, M.D.; Taylor, H.R.; Stat, M.; Bunce, M.; Gemmell, N.J. Environmental DNA (eDNA) Metabarcoding Reveals Strong Discrimination among Diverse Marine Habitats Connected by Water Movement. Mol. Ecol. Resour. 2019, 19, 426–438. [Google Scholar] [CrossRef] [PubMed]
  118. URycki, D.R.; Kirtane, A.A.; Aronoff, R.; Avila, C.C.; Blackman, R.C.; Carraro, L.; Evrard, O.; Good, S.P.; Hoyos, J.D.C.; López-Rodríguez, N.; et al. A New Flow Path: eDNA Connecting Hydrology and Biology. WIREs Water 2024, 11, e1749. [Google Scholar] [CrossRef]
  119. Bayraktarov, E.; Stewart-Sinclair, P.J.; Brisbane, S.; Boström-Einarsson, L.; Saunders, M.I.; Lovelock, C.E.; Possingham, H.P.; Mumby, P.J.; Wilson, K.A. Motivations, Success, and Cost of Coral Reef Restoration. Restor. Ecol. 2019, 27, 981–991. [Google Scholar] [CrossRef]
  120. Sato, M.; Inoue, N.; Nambu, R.; Furuichi, N.; Imaizumi, T.; Ushio, M. Quantitative Assessment of Multiple Fish Species around Artificial Reefs Combining Environmental DNA Metabarcoding and Acoustic Survey. Sci. Rep. 2021, 11, 19477. [Google Scholar] [CrossRef] [PubMed]
  121. Inoue, N.; Sato, M.; Furuichi, N.; Imaizumi, T.; Ushio, M. The Relationship between eDNA Density Distribution and Current Fields around an Artificial Reef in the Waters of Tateyama Bay, Japan. Metabarcoding Metagenomics 2022, 6, e87415. [Google Scholar] [CrossRef]
  122. Krolow, A.P. Assessing the Diversity of Fish Communities at or Around Artificial Reefs Along the Louisiana Coast Through the Use of Environmental DNA (eDNA). Master’s Thesis, Southeastern Louisiana University, Hammond, LA, USA, 2019. [Google Scholar]
  123. Krolow, A.D.; Geheber, A.D.; Piller, K.R. If You Build It, Will They Come? An Environmental DNA Assessment of Fish Assemblages on Artificial Reefs in the Northern Gulf of Mexico. Trans. Am. Fish. Soc. 2022, 151, 297–321. [Google Scholar] [CrossRef]
  124. Miyajima-Taga, Y.; Sato, M.; Oi, K.; Furuichi, N.; Inoue, N. Fine-Scale Spatial Distribution of a Fish Community in Artificial Reefs Investigated Using an Underwater Drone and Environmental DNA Analysis. Mar. Ecol. Prog. Ser. 2024, 740, 123–144. [Google Scholar] [CrossRef]
  125. Levy, N.; Simon-Blecher, N.; Ben-Ezra, S.; Yuval, M.; Doniger, T.; Leray, M.; Karako-Lampert, S.; Tarazi, E.; Levy, O. Evaluating Biodiversity for Coral Reef Reformation and Monitoring on Complex 3D Structures Using Environmental DNA (eDNA) Metabarcoding. Sci. Total Environ. 2023, 856, 159051. [Google Scholar] [CrossRef] [PubMed]
  126. Knoester, E.; Rienstra, J.; Schürmann, Q.; Wolma, A.; Murk, A.; Osinga, R. Community-Managed Coral Reef Restoration in Southern Kenya Initiates Reef Recovery Using Various Artificial Reef Designs. Front. Mar. Sci. 2023, 10, 1152106. [Google Scholar] [CrossRef]
  127. Harrington, L.; Fabricius, K.; De’ath, G.; Negri, A. Recognition and Selection of Settlement Substrata Determine Post-Settlement Survival in Corals. Ecology 2004, 85, 3428–3437. [Google Scholar] [CrossRef]
  128. Webster, N.S.; Soo, R.; Cobb, R.; Negri, A.P. Elevated Seawater Temperature Causes a Microbial Shift on Crustose Coralline Algae with Implications for the Recruitment of Coral Larvae. ISME J. 2011, 5, 759–770. [Google Scholar] [CrossRef]
  129. Bessey, C.; Jarman, S.N.; Berry, O.; Olsen, Y.S.; Bunce, M.; Simpson, T.; Power, M.; McLaughlin, J.; Edgar, G.J.; Keesing, J. Maximizing Fish Detection with eDNA Metabarcoding. Environ. DNA 2020, 2, 493–504. [Google Scholar] [CrossRef]
  130. Clark, D.E.; Pilditch, C.A.; Pearman, J.K.; Ellis, J.I.; Zaiko, A. Environmental DNA Metabarcoding Reveals Estuarine Benthic Community Response to Nutrient Enrichment—Evidence from an in-Situ Experiment. Environ. Pollut. 2020, 267, 115472. [Google Scholar] [CrossRef]
  131. Couton, M.; Lévêque, L.; Daguin-Thiébaut, C.; Comtet, T.; Viard, F. Water eDNA Metabarcoding Is Effective in Detecting Non-Native Species in Marinas, but Detection Errors Still Hinder Its Use for Passive Monitoring. Biofouling 2022, 38, 367–383. [Google Scholar] [CrossRef] [PubMed]
  132. Liang, D.; Xia, J.; Song, J.; Sun, H.; Xu, W. Using eDNA to Identify the Dynamic Evolution of Multi-Trophic Communities under the Eco-Hydrological Changes in River. Front. Environ. Sci. 2022, 10, 929541. [Google Scholar] [CrossRef]
  133. Larson, E.R.; Graham, B.M.; Achury, R.; Coon, J.J.; Daniels, M.K.; Gambrell, D.K.; Jonasen, K.L.; King, G.D.; LaRacuente, N.; Perrin-Stowe, T.I.; et al. From eDNA to Citizen Science: Emerging Tools for the Early Detection of Invasive Species. Front. Ecol. Environ. 2020, 18, 194–202. [Google Scholar] [CrossRef]
  134. Uthicke, S.; Robson, B.; Doyle, J.R.; Logan, M.; Pratchett, M.S.; Lamare, M. Developing an Effective Marine eDNA Monitoring: eDNA Detection at Pre-Outbreak Densities of Corallivorous Seastar (Acanthaster Cf. Solaris). Sci. Total Environ. 2022, 851, 158143. [Google Scholar] [CrossRef] [PubMed]
  135. Ip, Y.C.A.; Chang, J.J.M.; Tun, K.P.P.; Meier, R.; Huang, D. Multispecies Environmental DNA Metabarcoding Sheds Light on Annual Coral Spawning Events. Mol. Ecol. 2023, 32, 6474–6488. [Google Scholar] [CrossRef] [PubMed]
Figure 1. Locations of study sites in Hoi Ha Wan Marine Park, Hong Kong. Map showing the positions of the reference (Gruff Head), restored (Coral Beach), and unrestored (Coral Beach) sites surveyed in this study. Greyscale shading delineates the land boundary of Hong Kong. Basemap data were obtained from the Lands Department (Digital Topographic Map iB5000) and the DIVA-GIS database.
Jmse 13 01605 g001
Figure 2. Design and structural components of the custom-engineered 3D-printed reef tiles used for coral recruitment and restoration. (Left) The upper “biomimicry layer” of the tiles features a biomimetic surface designed to mimic reef complexity, providing habitat for cryptic invertebrates. The grid layer has a diagrid framework and lateral bracing to enhance mechanical strength, reduce fabrication defects, and support uniform drying and firing. The integrated three-legged footing system is printed and attached during post-processing. This footing system elevates the tile above the seabed, improving hydrodynamic flow and minimizing sediment accumulation. (Right) One assembled unit showing three tiles, onto which coral fragments were transplanted, anchored on one Base Layer plate. In this study, 24 of these assembled units were deployed at 5 m intervals along a 3 × 8 unit grid at the restoration site [35].
Jmse 13 01605 g002
Figure 3. Composite image of the restoration project, four years after deployment. (A) A subset of the ceramic reef tiles deployed at the restoration site in Hoi Ha Wan Marine Park, outplanted with multiple coral species representing branching, plating, and massive colony morphologies. (B) Self-attachment of a transplanted fragment via new growth onto the biomimicry layer. (C) A tile seeded with Acropora fragments, which have grown to obscure the existence of the reef tile below. (D) Encrusting taxa that have grown onto the terracotta surface of the reef tile, including marine sponges and coralline algae.
Jmse 13 01605 g003
Figure 4. Summary of coral survivorship and condition. (A) Overall survivorship of corals, and (B) genus-specific survivorship of Acropora, Pavona, and Platygyra over a four-year period following transplantation. Coral conditions were categorized as Healthy (blue), Partial Mortality (light blue), Dead (red), and Detached (grey).
Jmse 13 01605 g004
Figure 5. Coral Growth from transplantation size. Change in maximum linear extension (MLE, cm) of the three genera of corals, Acropora (red), Pavona (green), and Platygyra (blue) over a 4-year period following transplantation. The solid line represents the mean values; the dotted lines indicate standard deviation.
Jmse 13 01605 g005
Figure 6. Visual survey counts. Each point represents the total number of observations of each taxon recorded during a single monitoring event for: (A) Invertebrates and (B) Fish.
Jmse 13 01605 g006
Figure 7. The number of observed ASVs and sequencing reads by phylum across all samples. Data shown reflects only those ASVs and reads that passed the prevalence and abundance filters prior to Hellinger transformation. For enhanced visibility, only the five phyla with the greatest ASV diversity (Bacillariophyta, Ochrophyta, Ciliophora, Oomycota, Rhodophyta) and/or the five phyla with the highest raw sequencing read counts (Bacillariophyta, Mollusca, Annelida, Ciliophora, Ochrophyta) were plotted.
Jmse 13 01605 g007
Figure 8. Point plots of observed ASV richness by site and per sample. Based on the parameters of the prevalence filter applied to the community metabarcoding dataset, all ASVs represented in this plot appeared in a minimum of three samples per site. (A) The number of unique ASVs observed across all samples from the unrestored (1555 ASVs, n = 4), restored (1921 ASVs, n = 5), and reference (1696 ASVs, n = 5) sites. Each ASV was counted once per site, regardless of how many replicates it was detected in. (B) The number of ASVs detected per sample is indicated by the circular points. Diamonds indicate mean ASV richness (±SD) across all replicates for each site: unrestored (946 ± 266 ASVs per sample, n = 4), restored (1280 ± 284, n = 5), and reference (1125 ± 129, n = 5).
Jmse 13 01605 g008
Figure 9. Beta diversity of eukaryotic ASVs. Dissimilarity in community composition was assessed using community dissimilarity matrices. Each point represents a single sample; sites are distinguished by color and shape. (A) PCoA ordination based on Jaccard distance, a presence-absence-based metric. (B) PCoA based on Bray-Curtis distance, which incorporates abundance data (Hellinger-transformed).
Jmse 13 01605 g009
Figure 10. Eukaryotic phylum richness, by site. Each bar represents the total number of ASVs observed across samples from each site. Bars are colored to distinguish the ASV richness of the 10 most diverse phyla in the eDNA COI metabarcoding dataset; “Other” denotes the combined ASV counts for the remaining 15 phyla.
Jmse 13 01605 g010
Figure 11. Taxonomic Composition by Phyla, based on Hellinger-Transformed Read Abundance. For each panel, the ten most abundant phyla are given distinct colors, while less abundant phyla have been merged as “Other”. Each phylum is depicted with the same color across all panels, but the ten most abundant phyla vary by panel due to differences in how data for each was processed: (A) Stacked bar plot showing Hellinger-transformed read abundance for each sample. (B) Read abundances were aggregated by site prior to Hellinger transformation, and then converted to compositional abundance to illustrate the relative contribution of each phylum to the combined sequenced community at each site. (C) Bacillariophyta ASVs were excluded prior to aggregating by site and performing the Hellinger transformation, allowing for clearer visualization of differences in the proportions of non-Bacillariophyta reads assigned to other phyla among sites.
Jmse 13 01605 g011
Table 1. Fish and invertebrate taxa monitored during diver surveys. Diet can vary widely by species (i.e., different species within the Labridae family have different preferences) and opportunity (particularly for opportunistic feeders like urchins). Diets are provided here to give a general idea of the trophic ecology of these taxa.
Fish Invertebrate
Common NameScientific NameDietCommon NameScientific NameDiet
GrouperEpinephelinaeCrustaceans, fish, molluscs [41] Long-spined sea urchinDiadema setosumMacroalgae, seagrasses, diatoms [42]
WrasseLabridaeBenthic invertebrates, small fish, and (in cleaner wrasse) ectoparasites [40]Decorator urchinSalmacis sphaeroidesMacroalgae, seagrasses, detritus, jellyfish, conspecifics [43,44]
SweetlipsPlectorhinchinaeSmall fish, benthic invertebrates [40]Black sea
cucumber
Holothuria leucospilotaDetritus (scavenged organics in sediment) [45]
SeahorseHippocampusAmphipods, copepods, shrimp, plankton [40,46]
Table 2. Results of the GLMM model and pairwise comparisons of estimated marginal means (EMMs) examining the effect of coral genera on extension rate and breakage. p-values have been adjusted using the Tukey method for multiple comparisons; values ≤ 0.05 are highlighted in bold. Table Key: est. = estimate; SE = standard error; df = degree of freedom; A = Acropora, Pv = Pavona, Pt = Platygyra..
Breakageest.SEdfZ-Score
(Glmer)
p-Value
A-Pv
A-Pt
Pv-Pt
2.435
3.209
0.775
0.308
0.429
0.504
Inf
Inf
Inf
7.0899
7.472
1.527
<0.0001
<0.0001
0.2734
Extension Rate Z-Score
(glmmTMB)
A-Pv
A-Pt
Pv-Pt
0.517
0.913
0.396
0.0493
0.0479
0.0493
Inf
Inf
Inf
10.482
19.071
8.030
<0.0001
<0.0001
<0.0001
Table 3. Total abundance of fish and invertebrate sightings across 14 surveys, and the mean count and standard deviation (SD) of observations per survey (three transects per survey) at the reference, restored, and unrestored sites. Seahorses were not observed during any monitoring visits and thus have been omitted from the table.
Site ReferenceRestoredUnrestored
TaxaTypeTotal CountMean CountSDTotal CountMean CountSDTotal CountMean CountSD
GrouperFish654.62.6866.14.0100.71.1
Other FishFish8714.52.410317.27.3122.00.9
SweetlipsFish100.71.2201.42.540.30.6
WrasseFish473.43.9372.63.270.50.9
Black sea
cucumber
Invert99270.932.61937138.452.5126390.243.3
Decorator
urchin
Invert133695.492.897469.682.244731.939.8
Long-spined
urchin
Invert26919.244.834124.431.622716.219.9
Table 4. Results of the Kruskal-Wallis test comparing abundances of fish and invertebrates observed per survey between sites. Table Key: H = H statistic (Kruskal-Wallis non-parametric χ2); df = degrees of freedom; W = Wilcoxon’s signed rank test statistic.; Ref = reference site, Res = restored site, Un = unrestored site. Significant p-values (≤0.05) are highlighted in bold. Holm-Bonferroni corrections have been applied to the pairwise test to account for multiple comparisons.
Hdfp-ValueW
(Pairwise)
p-Value
(Pairwise)
Fish13.620.001Ref-Res: 94
Ref-Un: 166
Res-Un: 168
Ref-Res: 0.872
Ref-Un: 0.003
Res-Un: 0.003
Invertebrate3.120.071Ref-Res: 73
Ref-Un: 124
Res-Un: 147
Ref-Res: 0.260
Ref-Un: 0.260
Res-Un: 0.077
Table 5. The results of a one-way ANOVA testing for differences in ASV richness by site. Table Key: df = degrees of freedom; SS = sum of squares; MS = mean squares; F = F-statistic, p-value = probability of observing a value as extreme as F under the null hypothesis.
dfSSMSFp-Value
Site 2243,432121,7162.2250.154
Residuals11601,74454,704
Table 6. Unique, ubiquitous, and shared ASVs by site.
Observed ASVs% of All ASVs% of Reads% of Reads
Hellinger TransformedNo
Transformation
UniqueUnrestored88022%11%18%
Restored105927%14%7%
Reference106427%19%13%
SharedUnrestored—Restored—Reference2135%23%27%
Unrestored—Restored3419%14%19%
Unrestored—Reference1213%5%6%
Restored—Reference3038%15%11%
Total 398176%
Table 7. PERMANOVA results, testing for differences in eDNA community composition by site. Table key: df = degrees of freedom; SS = sum of squares; F = F statistic; p = probability of observing a value as extreme as F under the null hypothesis. Significant p-values (≤0.05) are highlighted in bold. Results were calculated separately from both a Jaccard Distance matrix and a Bray-Curtis Dissimilarity matrix using the adonis2 function of vegan (999 permutations).
dfSSR2Fp
JaccardSite22.3770.5556.8590.001
Residual111.9060.445
Total134.2841.000
Bray-Curtis Site21.8670.5105.7140.001
Residual111.7970.490
Total133.6641.000
Table 8. Pairwise comparisons of beta diversity by site. Table key: df = degrees of freedom; SS = sum of squares; R2 = proportion of variance explained by the model, F = F statistic; p = probability of observing a value as extreme as F under the null hypothesis. Significant p-values (≤0.05) are highlighted in bold. Produced using the ‘pairwiseAdonis’ wrapper for ‘vegan’ (999 permutations) based on both Jaccard Distance and Bray-Curtis dissimilarity matrices.
Restored–ReferenceRestored–UnrestoredReference–Unrestored
dfSSR2FpdfSSR2FpdfSSR2Fp
JaccardSite11.280.507.910.0111.030.455.73<0.0111.240.506.92<0.01
Residual81.300.50 71.260.55 71.260.50
Total92.581.00 82.291.00 82.501.00
Bray-CurtisSite10.950.456.420.0110.760.384.23<0.0111.100.496.60<0.01
Residual81.180.55 71.250.62 71.160.51
Total92.121.00 82.011.00 82.261.00
Disclaimer/Publisher’s Note: The statements, opinions and data contained in all publications are solely those of the individual author(s) and contributor(s) and not of MDPI and/or the editor(s). MDPI and/or the editor(s) disclaim responsibility for any injury to people or property resulting from any ideas, methods, instructions or products referred to in the content.