Article

Hydrochemistry of Blackwaters in a Shoreline Zone of São Paulo State, Brazil

by
Daniel M. Bonotto
1,*,
Marina Lunardi
1 and
Ashantha Goonetilleke
2
1
Department of Geology, UNESP-São Paulo State University, Rio Claro 13506-900, Brazil
2
Faculty of Engineering, QUT-Queensland University of Technology, Brisbane, QLD 4000, Australia
*
Author to whom correspondence should be addressed.
J. Mar. Sci. Eng. 2025, 13(8), 1575; https://doi.org/10.3390/jmse13081575 (registering DOI)
Submission received: 20 July 2025 / Revised: 13 August 2025 / Accepted: 14 August 2025 / Published: 16 August 2025
(This article belongs to the Section Chemical Oceanography)

Abstract

Blackwater rivers are enriched in humic acids and impoverished in nutrients, sometimes discharging into oceans. Brazil has a coastal zone of about 8700 km, with several blackwater rivers discharging into the Atlantic Ocean, in addition to the Rio Negro of the northern Amazon basin, which is the largest (about 1700 km long) and best-known tropical backwater river. On the other hand, only a few attempts have been made to deal with their hydrochemical composition and how it is related to the hydrochemistry of different water bodies nearby. This paper focuses on a sector of the Atlantic Ocean shore occurring in São Paulo State, enclosing two important Ecological Reserves, i.e., the Restinga State Park of Bertioga and the State Park of Serra do Mar–São Sebastião Nucleus, located at Bertioga and São Sebastião cities, respectively. Physicochemical parameters such as pH and electrical conductivity, as well as the composition of major constituents like sodium, potassium, calcium, magnesium, bicarbonate, chloride, sulfate, nitrate, etc., have been evaluated in two blackwater rivers and one blackwater stream to compare their relative inputs into the Atlantic Ocean. Traditional hydrogeochemical diagrams such as the Piper, Schoeller, Gibbs, van Wirdum, and Wilcox graphs were utilized for investigating the major features of the blackwater’s composition, revealing in some cases that they suffer an accentuated influence of the constituents occurring in the Atlantic Ocean waters, due to backward currents (coastal upwelling or tidal currents). Another highlight of this paper is the measurement of an enhanced concentration of dissolved iron in one blackwater sample analyzed, reaching a value of 1.9 mg/L. Such a finding has also been often reported in the literature for blackwater rivers and streams, as humic and fulvic acids are used to bind Fe3+, keeping it in solution. Nowadays, iron in solution has been considered a very important element acting as a natural fertilizer of the coastal ocean because it is an essential nutrient to marine phytoplankton.

1. Introduction

The English naturalist, explorer, geographer, anthropologist, biologist, and illustrator Alfred Russel Wallace (1823–1913) is considered the 19th century’s leading expert on the geographical distribution of animal species, being sometimes called the “father of biogeography”, or more specifically of zoogeography [1]. Wallace conducted extensive fieldwork, starting in the Amazon River basin, where he spent four years charting the Rio Negro, collecting specimens, and making notes on the peoples and languages he encountered as well as the geography, flora, and fauna [2]. Based on such fieldwork, in 1853, Wallace classified the Amazon River and its tributaries into white, black, and clear water river types, being the first scientist to adopt the color classification based on the waters of the Amazon River basin [3].
In 1890, Forel [4] suggested standards for the classification of the water color, aiming to evaluate the Lake Geneva coloring. This author divided the water colors into 11 levels, varying between blue and green, which were supplemented in 1892 by Ule [5], who added another 10 levels, ranging from blue-green to brown. Thus, the 21 water color classes, ranging from indigo blue to cola brown, comprise the Forel-Ule (FU) scale (Figure 1), with the FU scale records representing the oldest dataset of optical water types [6].
Nowadays, water color has been recognized by the Global Climate Observing System as a key essential climate variable for lakes, as it is directly related to variations in water constituents [8]. The FU scale is considered a very useful color standard for determining actual water color, as it is a parameter that has been recorded for global water bodies for over a century [9]; more than 280,000 observations in global ocean areas have been recorded over the past 130 years, based on the FU scale [10].
Multispectral information acquired from satellite sensors allowed defining another water color index, named Forel-Ule Index (FUI) [11], which coupled the FU scale observations in oceanography and the chromaticity diagram of the International Commission on Illumination [6].
Thus, the use of remote sensing monitoring methods of water color since the age of the Landsat Multispectral Scanner Sensor has dramatically increased over the last years. For instance, Nichol [12] demonstrated the application of remote sensing techniques to the collection of data on water quality in tropical regions characterized by peat swamp hydrology. Lehmann et al. [13] implemented an algorithm for the retrieval of color parameters (hue angle, dominant wavelength) and derived a new correction for color purity to account for the spectral bandpass of the Landsat 8 Operational Land Imager. Gardner et al. [14] examined patterns in river color between 1984 and 2018 by building a remote sensing database of surface reflectance extracted from 234,727 Landsat images covering 108,000 km of rivers wider than 60 m in the U.S.A. Using Landsat series images, the Dynamic Surface Water Extent algorithm, and the FUI, the water surface of 746 large reservoirs in China was sampled by Lai et al. [15], and the water color was inverted using the Google Earth Engine platform.
Beyond such approaches, several other aspects involving the water color have also been reported in the literature. For example, Wozniak and Meler [7] reported the modelling results of selected characteristics of water-leaving light in an optically complex nearshore marine environment, taking into account the spectra of the remote-sensing reflectance and the hue angle, which quantitatively describes the color of water visible to the unaided human eye. Jerome et al. [16] evaluated the color variability in terms of the specific absorption and scattering encountered in a variety of inland waters, presenting a technique for using the chromaticity coordinates to determine the dominant wavelength and spectral purity of an upwelling irradiance spectrum observed over a natural water body. Marinho et al. [17] presented empirical bio-optical models for estimating the absorption of colored dissolved organic matter in the Negro River, Amazon basin, using in situ remote sensing reflectance data. Wang et al. [18] reported a method for the identification of water quality based on machine learning (support vector machine model), which involved sampling, water image acquisition by photographing, and the use of the moment method to obtain nine-dimensional digital information features of the color information.
The term “blackwater river” is generally used in Geography, Ecology, Biology, Geology, and fluvial studies to represent a type of river with a slow-moving channel flowing through forested swamps or wetlands. The “black tea” color occurs when tannins are leached into the water during the vegetation decay, producing a transparent, darkly stained, and acidic water [19]. Therefore, blackwater rivers and streams have stained or tea-colored waters due to the tannic acid leached from fallen leaves of trees that inhabit the wide floodplains along the river’s edge. As the water rises and falls, it draws nutrients (detritus) from decaying plant and animal matter [20]. Natural conditions in these waters often differ from non-blackwater systems, as the pH and oxygen levels can be very low, despite being completely natural [21].
The FU scale shown in Figure 1 focuses on the visible spectrum of colors, chiefly the blues and greens, which are most affected by the light interaction with water. Thus, it does not include black because it represents the absence of light rather than a specific color. The non-transmission of light and the black color can be due to the presence of numerous suspended particles in the water of organic and inorganic origin. When Wallace classified the Amazon River waters and its tributaries into white, black, and clear ones, the black class was due to his great involvement with the Rio Negro waters, which typically exhibit the “black tea” color [22].
A great number of blackwater rivers and streams have been recognized in Africa [23,24], Asia [25,26], Europe [27,28], North America [29,30,31,32], and South America [3,33,34,35,36,37,38]. In several studies, other terms have been used to describe these systems, such as “tannic” [39,40], “brownwater” [41,42,43], “humic” [28], and “stained” [44,45]. Under this scenario, colors represented by the Forel-Ule scale classes between FU = 17 and FU = 21 (Figure 1) are very common in rivers and streams worldwide.
Similar to other hydrological resources, in several situations, blackwater rivers are suffering the effects of pollution, harmful development, road construction, highway development, mining, excessive water use, and a lack of effective actions for their protection [46], which contribute to the reduction in their quality. Among the several reasons for establishing initiatives requiring their appropriate management, it can also be highlighted that the blackwater rivers and streams play a major role in performing the natural iron fertilization of the coastal ocean, as reported by [47].
The Brazilian coastal zone is long (~8700 km), with several blackwater rivers discharging into the Atlantic Ocean. However, the knowledge of their hydrochemical composition is incipient, despite the available published dataset for blackwaters of the Rio Negro in the northern Amazon basin, which is the largest (1700 km) tropical backwater river [3,17,33,35,36,37]. This paper investigates blackwater rivers and streams occurring on a sector of the Atlantic Ocean shore at São Paulo State, Brazil, reporting a novel hydrochemical dataset that improves the understanding associated with the interactions between surface waters and ocean waters taking place in the study area.

2. Study Area

The study area is located at Bertioga and São Sebastião cities, São Paulo State, inserted in the North Coast Circuit of the state and 97 km distant (Figure 2), which comprises several beaches suitable for swimming and sports. Bertioga and São Sebastião municipalities originated from Portugal’s colonization in the middle of the 16th and 17th centuries, respectively. It was from Bertioga that, in 1565, Estácio de Sá and other followers from Santos, São Vicente, and São Paulo cities left to found the city of Rio de Janeiro [48]. Bertioga city was a district of Santos city until 1991, when it became an independent municipality; its surface area corresponds to 491.2 km2, while the population was 64,188 inhabitants in 2022 [48].
São Sebastião city became an independent municipality from Santos city in 1636, exhibiting a surface area of 402.4 km2, and a population of 81,595 inhabitants in 2022 [49]. One important highlight of São Sebastião city is the State Park of Serra do Mar–São Sebastião Nucleus, which was created in 1998, comprising a surface area of 26,268 ha to protect several ecosystems and important environments for feeding and sheltering marine species, and which is responsible for part of the connection between marine and terrestrial ecosystems [50].
Also relevant in the study area is the State Park Restinga of Bertioga, created in 2010 by the legislation of São Paulo State [51]. Studies carried out by WWF-Brazil and the Serra do Mar State Park Management Plan indicated that this area constitutes an important biological corridor between marine-coastal environments, the restinga vegetation, and the Serra do Mar mountains, forming a continuum whose protection is essential to guarantee the perpetuity of its ecological processes and gene flows [51]. The area possesses a high biodiversity, housing all the phytophysiognomies of the São Paulo coastal zone (mangrove, restinga, and dense ombrophilous lowland forest), 44 endangered species, and 53 species of bromeliads (1/3 of the species in the entire state) [51]. Regarding fauna, the area houses: 117 bird species, 37 of which are endemic, and 9 are threatened with extinction; 93 species of reptiles and amphibians, with 14 threatened, and 14 rare species; 117 species of mammals, 25 of which are medium and large (such as the puma, deer, tapir, ocelot, and black monkey, all threatened), and 69 bats, with 6 species threatened with extinction [51]. Also, the area is relevant to protecting the sub-basins of the Itaguaré and Guaratuba rivers, which have good water availability and water quality [51].
The stretch of coastline between Bertioga and São Sebastião cities lies within the central portion of the Mantiqueira Province, more specifically within the Ribeira Belt, an extensive Neoproterozoic orogenic system over 1400 km long along Brazil’s southeastern margin [52,53].
The Ribeira Belt itself is characterized by a general NE-SW structural trend. It is interpreted as the product of convergent tectonic interactions between microplates and the eastern margin of the São Francisco Craton and the southwestern margin of the Congo Craton. These convergences resulted in crustal shortening, thrust imbrications, and strike-slip (dextral) transpressional shear zones, dividing the belt into tectono-stratigraphic terranes [54]. One of these terrains, the Oriental Terrain, also known as the Serra do Mar Microplate [55], is composed primarily of migmatitic complexes and elongated (garnet)-biotite granitic bodies, showing nebulitic and schlieren textures, variably deformed [56]. Heilbron et al. [54] subdivided this terrain into three domains: Cambuci, Costeiro, and Italva. The study area falls within the Costeiro Domain, commonly addressed as the Costeiro Complex.
The Costeiro Complex is lithologically heterogeneous and dominated by rocks metamorphosed under granulite and amphibolite facies conditions, often migmatized [57]. The protolith ages can be from Archean to middle/upper Proterozoic, or undefined Precambrian [57,58]. The dominant lithologies include migmatites (metatexites and diatexites), pyroxene-bearing granulites, quartz-feldspar granulites, kinzigitic and charnockitic rocks, hypersthene granite-gneisses, amphibolites, and associated serpentinites, as well as a few mafic intrusive bodies, such as metadiorites, quartz diorites/gabbros, and orthoamphibolites [57].
São Sebastião’s geology is rooted in the Costeiro Complex, where eight Precambrian basement units have been identified: coarse-grained granitic gneiss, foliated porphyritic granite, mesocratic biotite gneiss, fine-grained mylonitic biotite gneiss, leucocratic mylonitic granite, banded gneisses, calc-silicate rocks, and migmatitic mylonitized gneisses (only on the mainland portion). In addition, important Mesozoic intrusive events are as follows: tholeiitic and alkaline dykes, stratiform gabbroic stocks, alkali syenitic plutons, and lamprophyres [59].
The coastal plain at the Bertioga zone is predominantly composed of unconsolidated Quaternary sediments that overlie the crystalline basement. These include alluvial and colluvial deposits associated with rivers, as well as lagoonal and marine–coastal deposits, composed primarily of sands and clays with peat layers occurring in swampy areas. The geomorphological features of the region include marine terraces, coastal ridges, paleochannels, and fluviomarine plains [60]. This sedimentary cover results from sea-level oscillations during the Quaternary, particularly in the Holocene, under strong influence from both marine and fluvial dynamics.
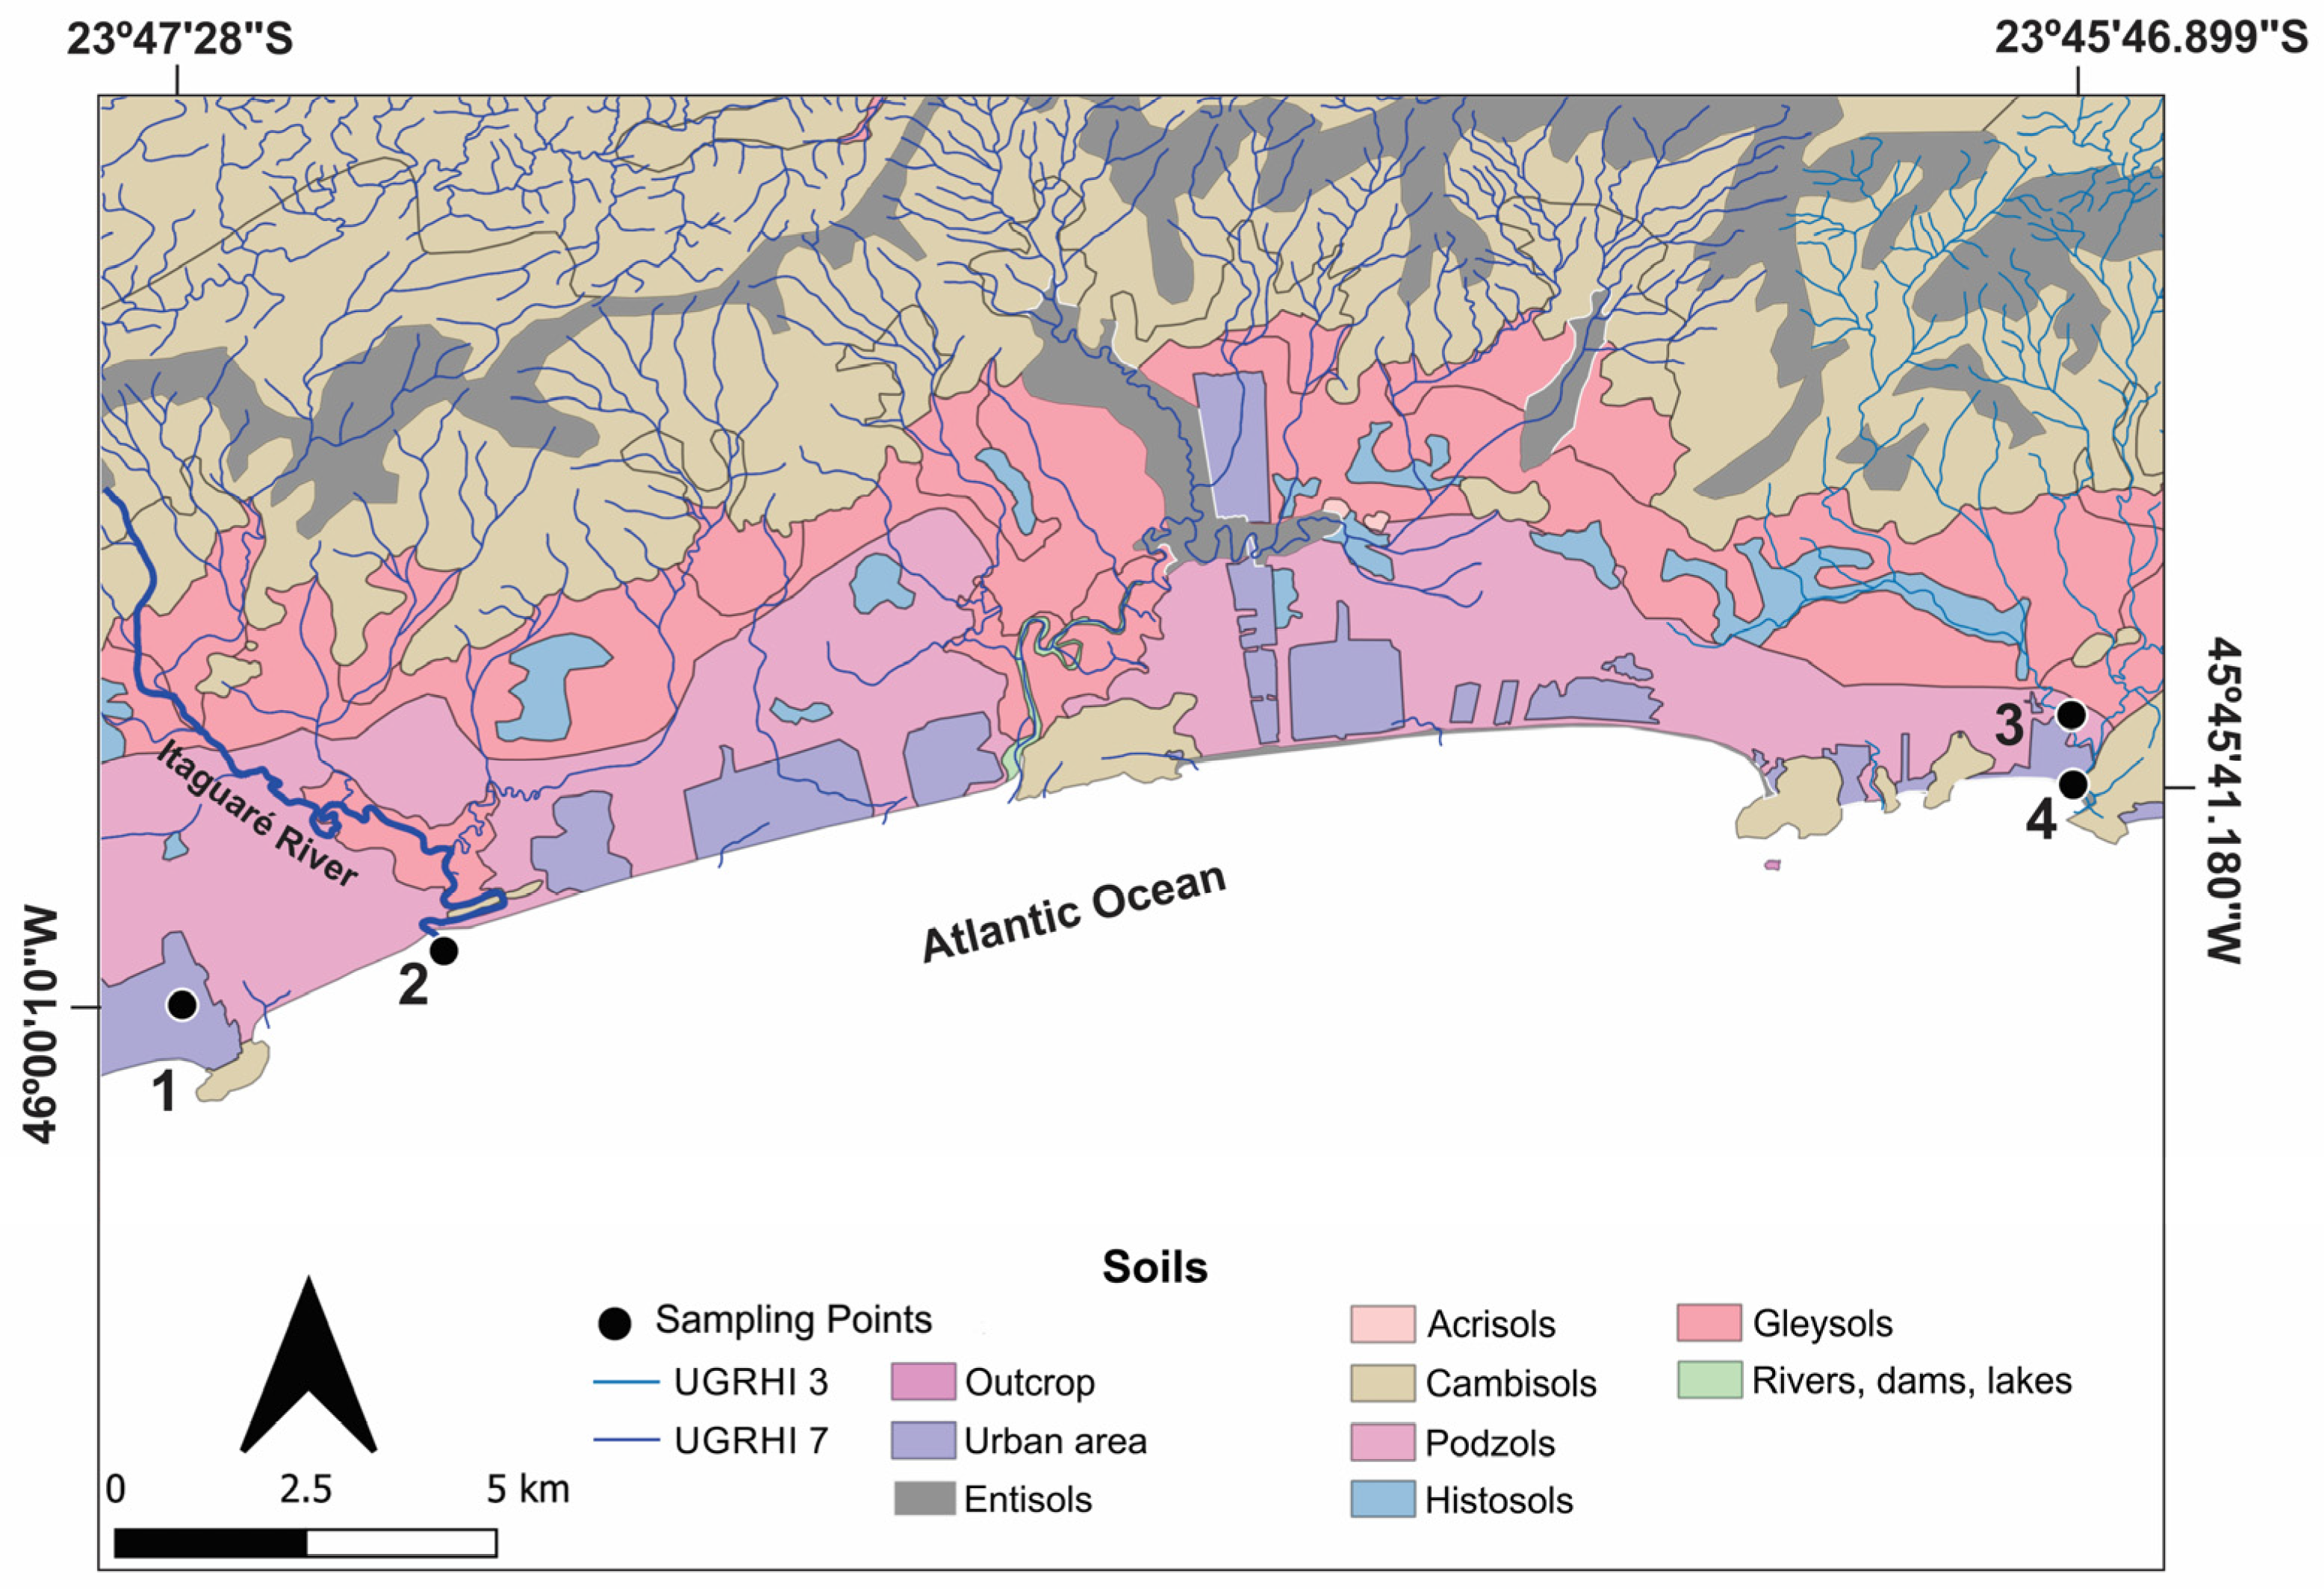
Poorly drained soils and palustrine environments are common in this region, especially in mangrove systems and restinga areas. Dark organic-rich horizons (spodosols and gleysols), associated with high organic matter accumulation and poor drainage, are frequently observed (Figure 3). Notably, the region exhibits high soil acidity, low oxygenation, and the occurrence of dark-colored waters in rivers such as the Itaguaré, Guaratuba, and Una, a consequence of the decomposition of Atlantic Forest vegetation and the release of humic substances [61].

3. Sampling Points

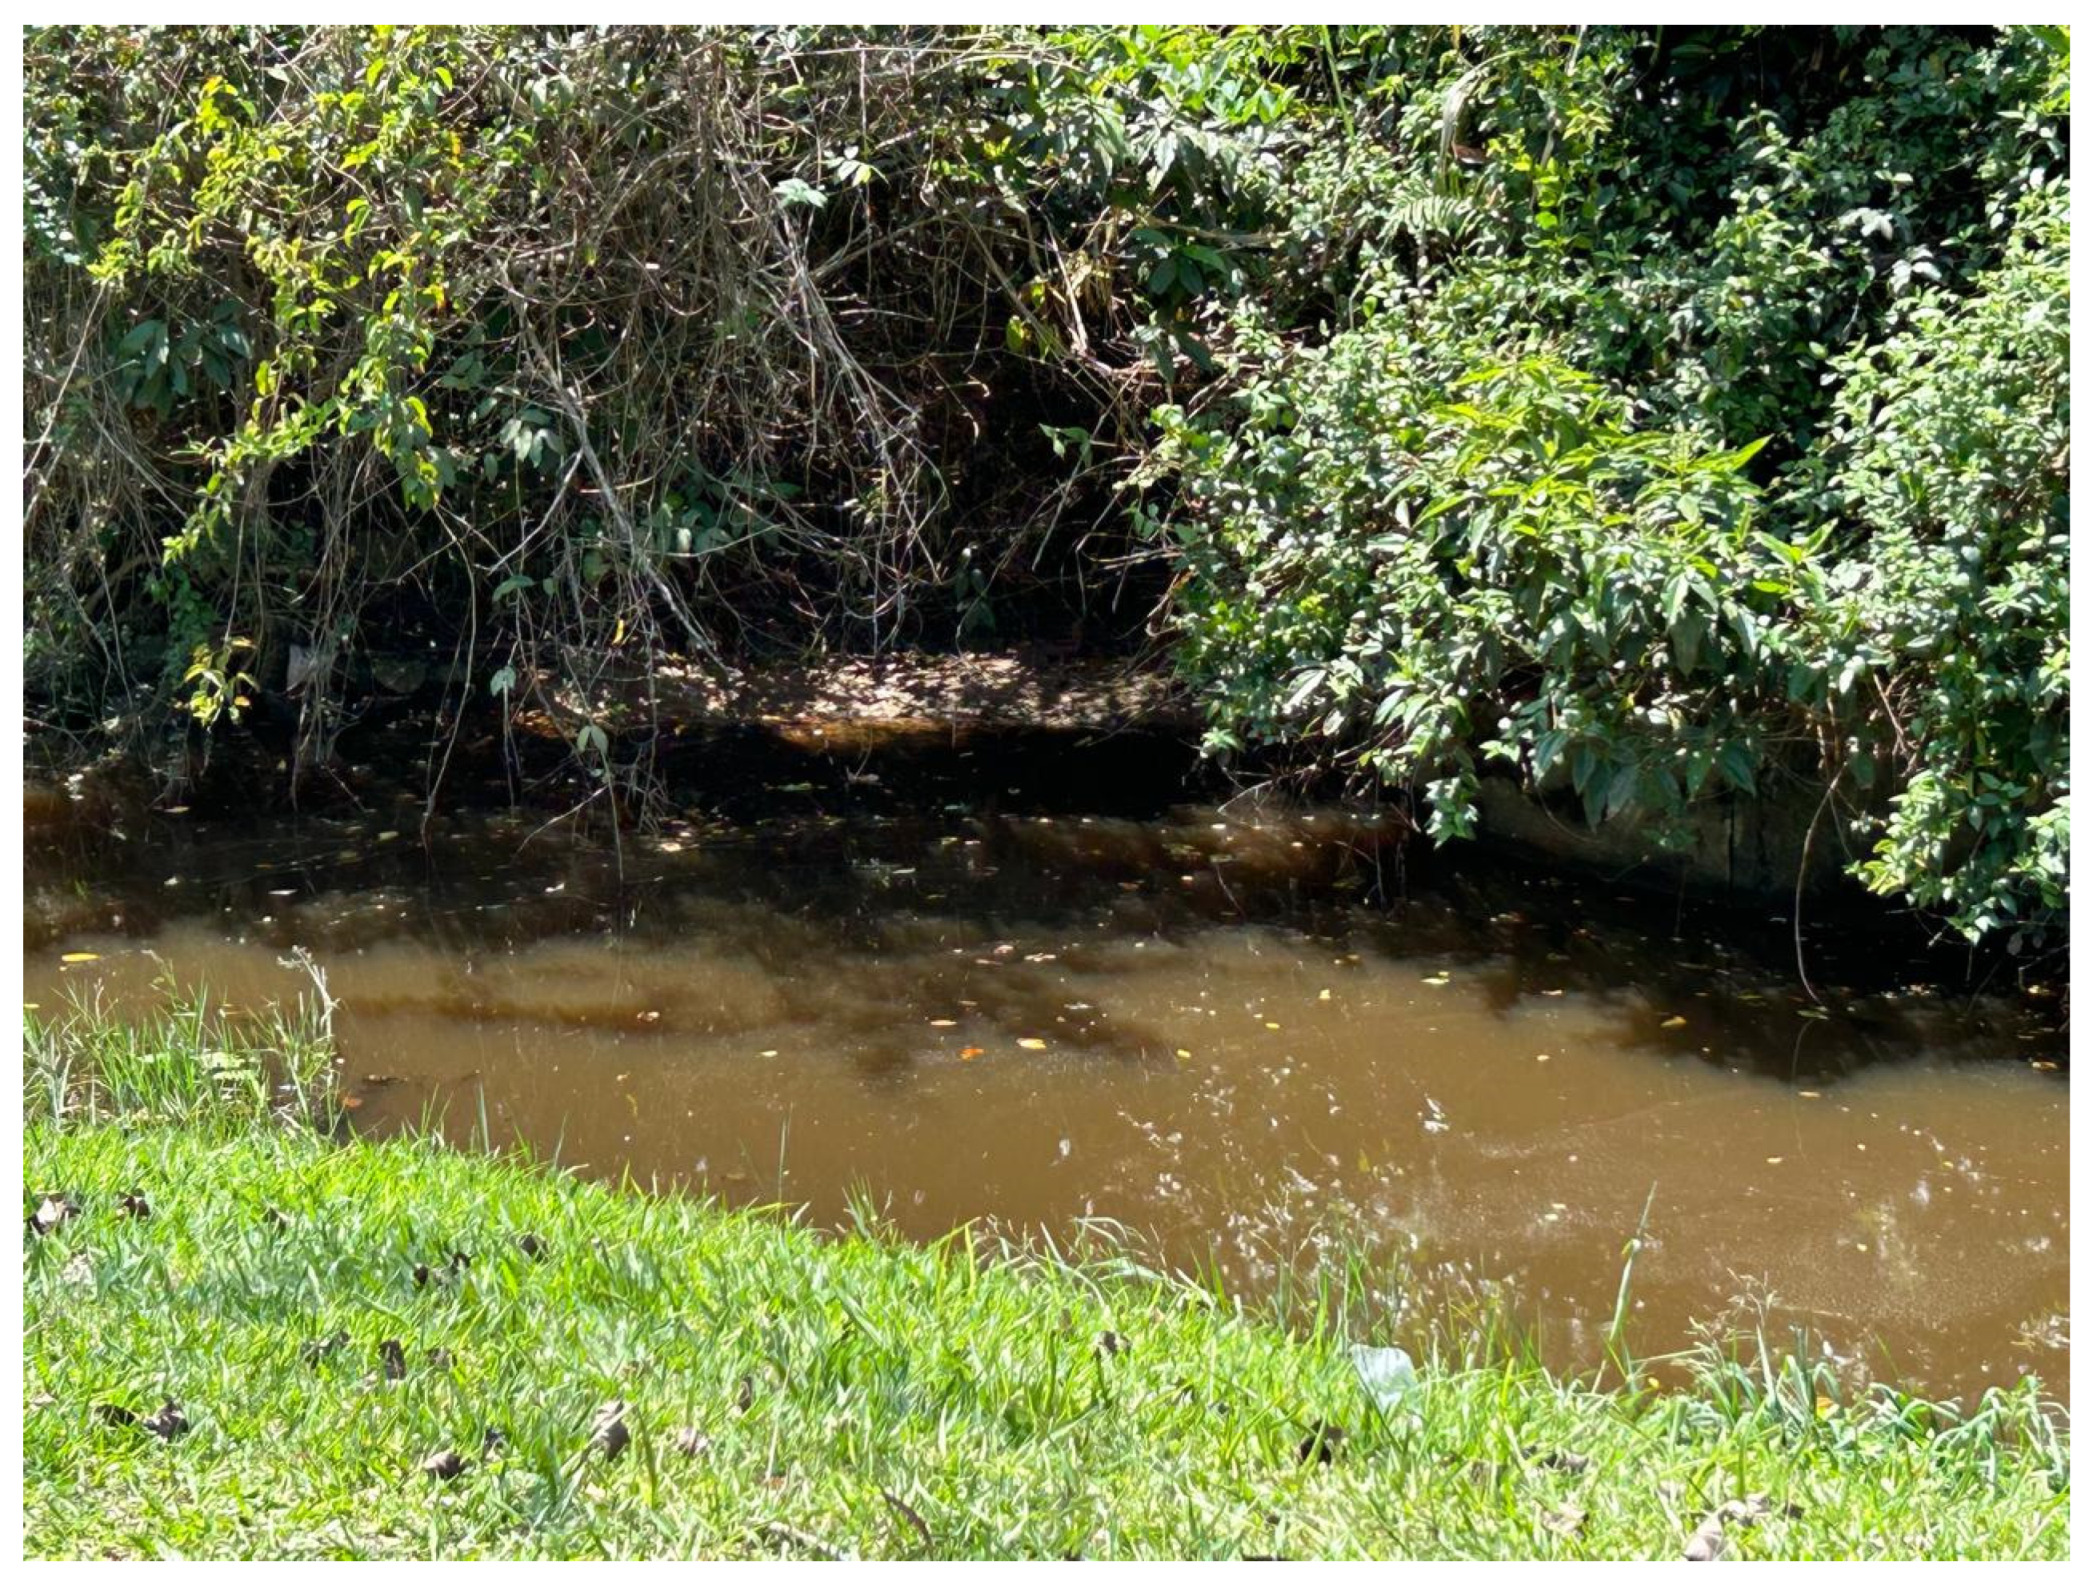
Blackwater samples were collected at four points in the study area, as shown in Figure 3. The sample 1 (Scheme 1) (Latitude = 23°47′06.8″ S; Longitude = 46°00′17.9″ W) was collected in a channeled stream within the Condominium São Lourenço’s Riviera, which is 18 km distant from Bertioga city. Such blackwater has been named “Riviera stream” in this study, discharging into the ocean, and possessing a source on the slopes and hills within the State Park Restinga of Bertioga.
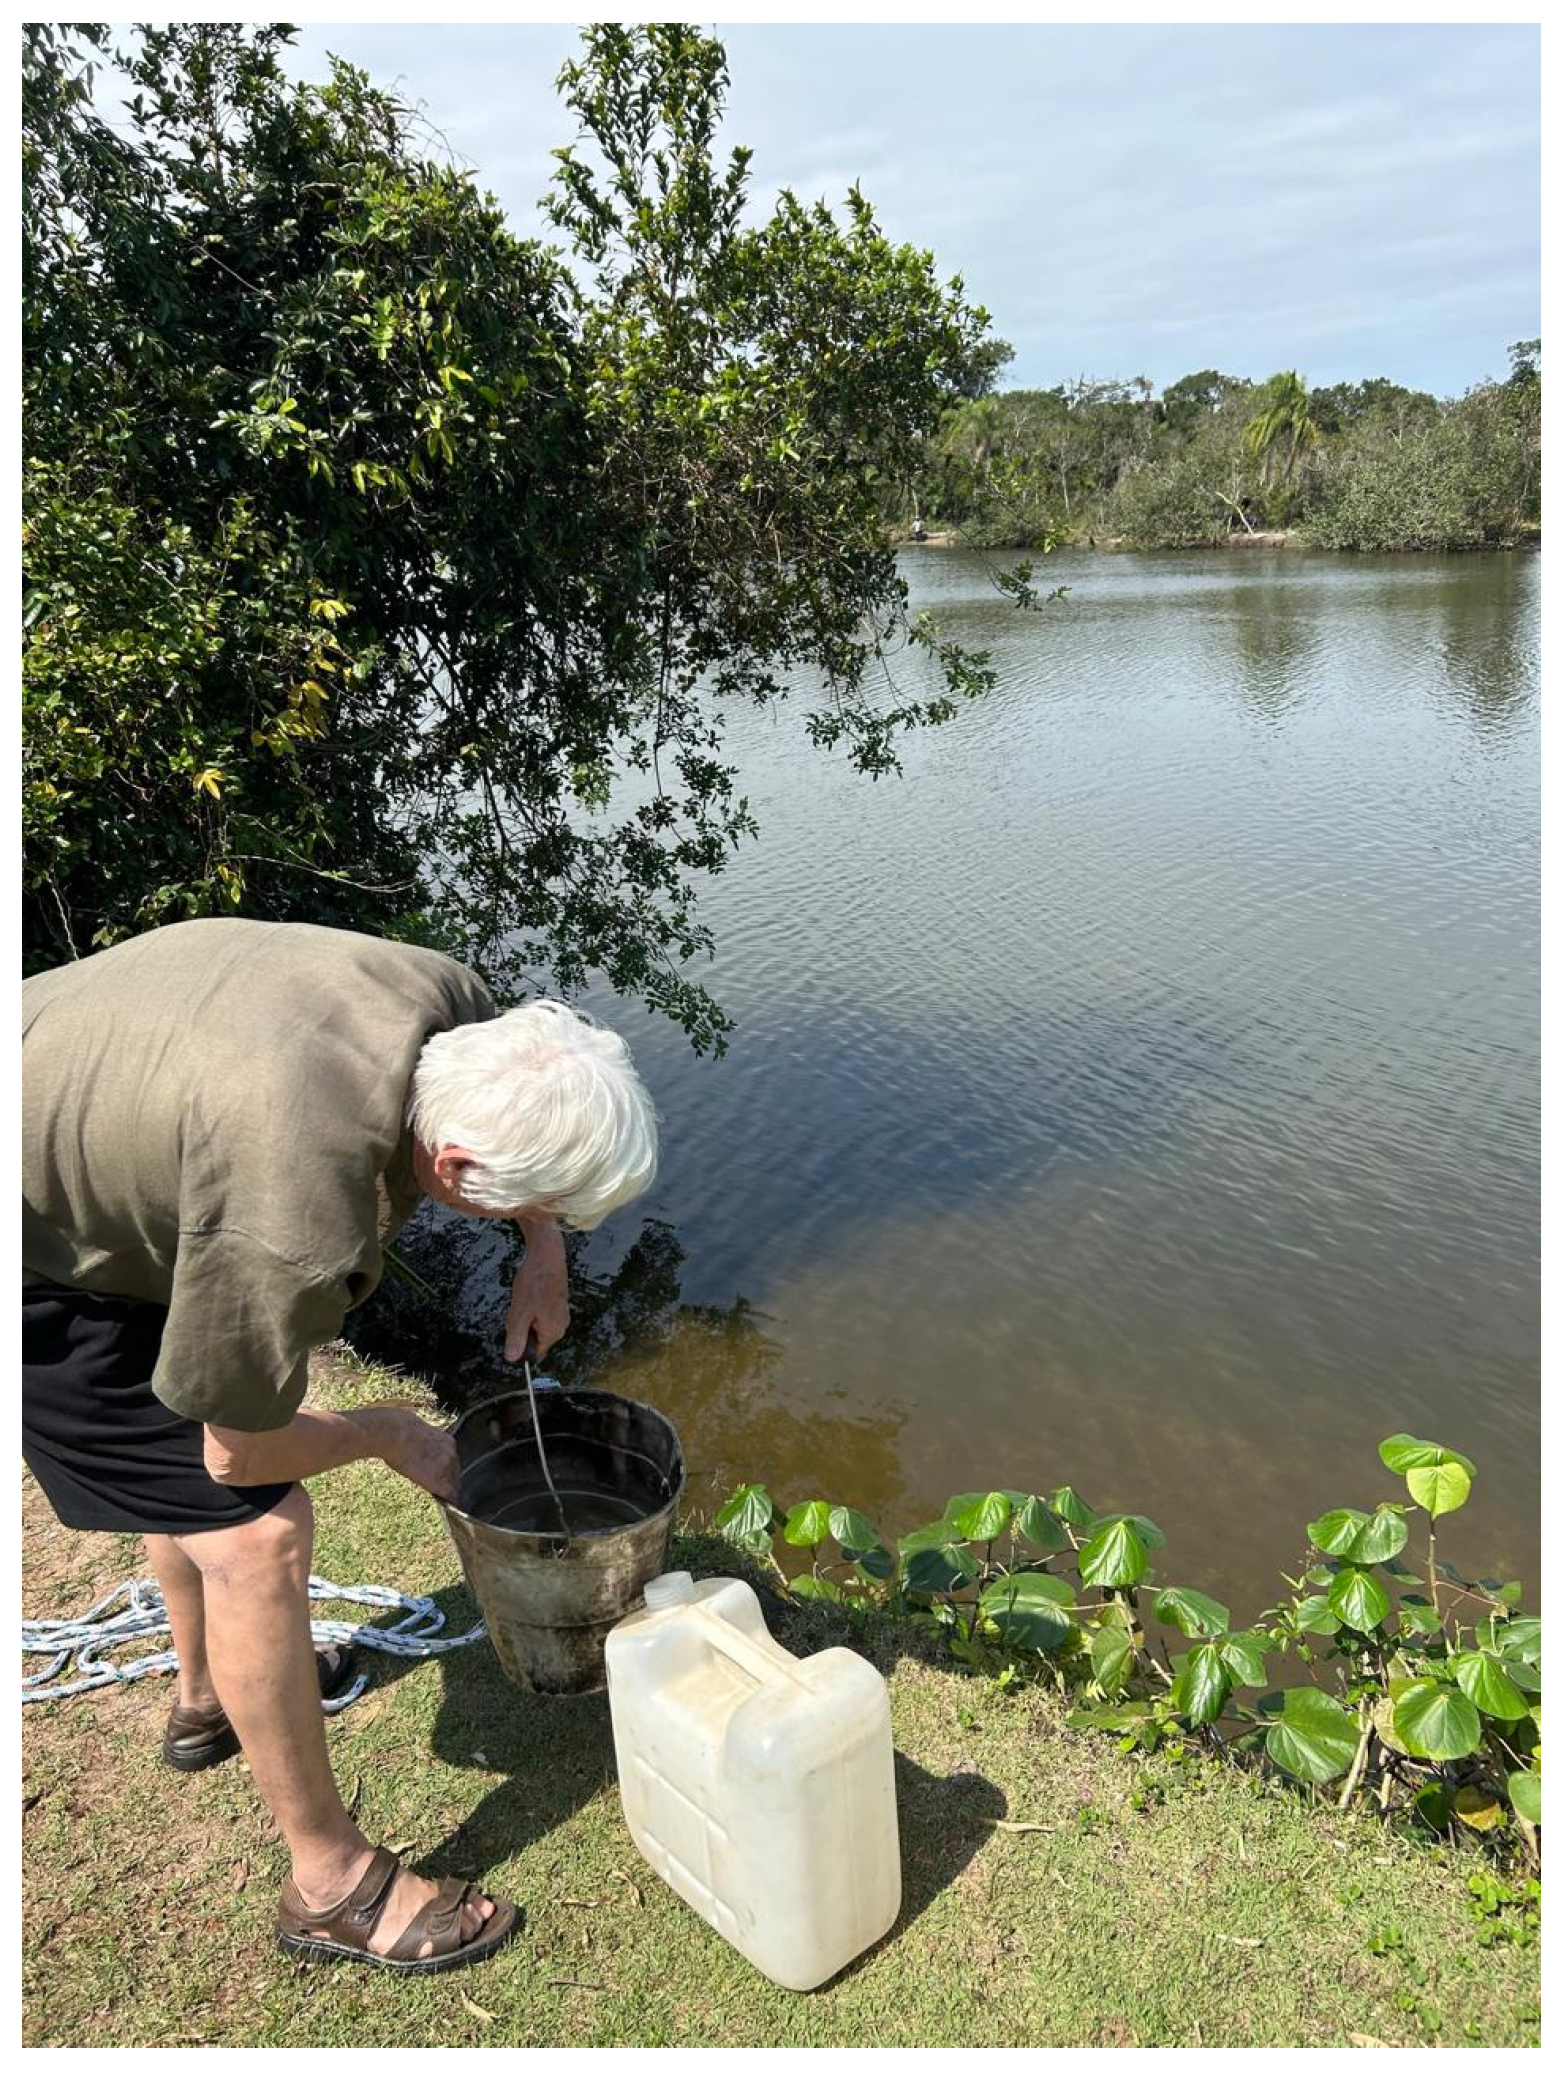
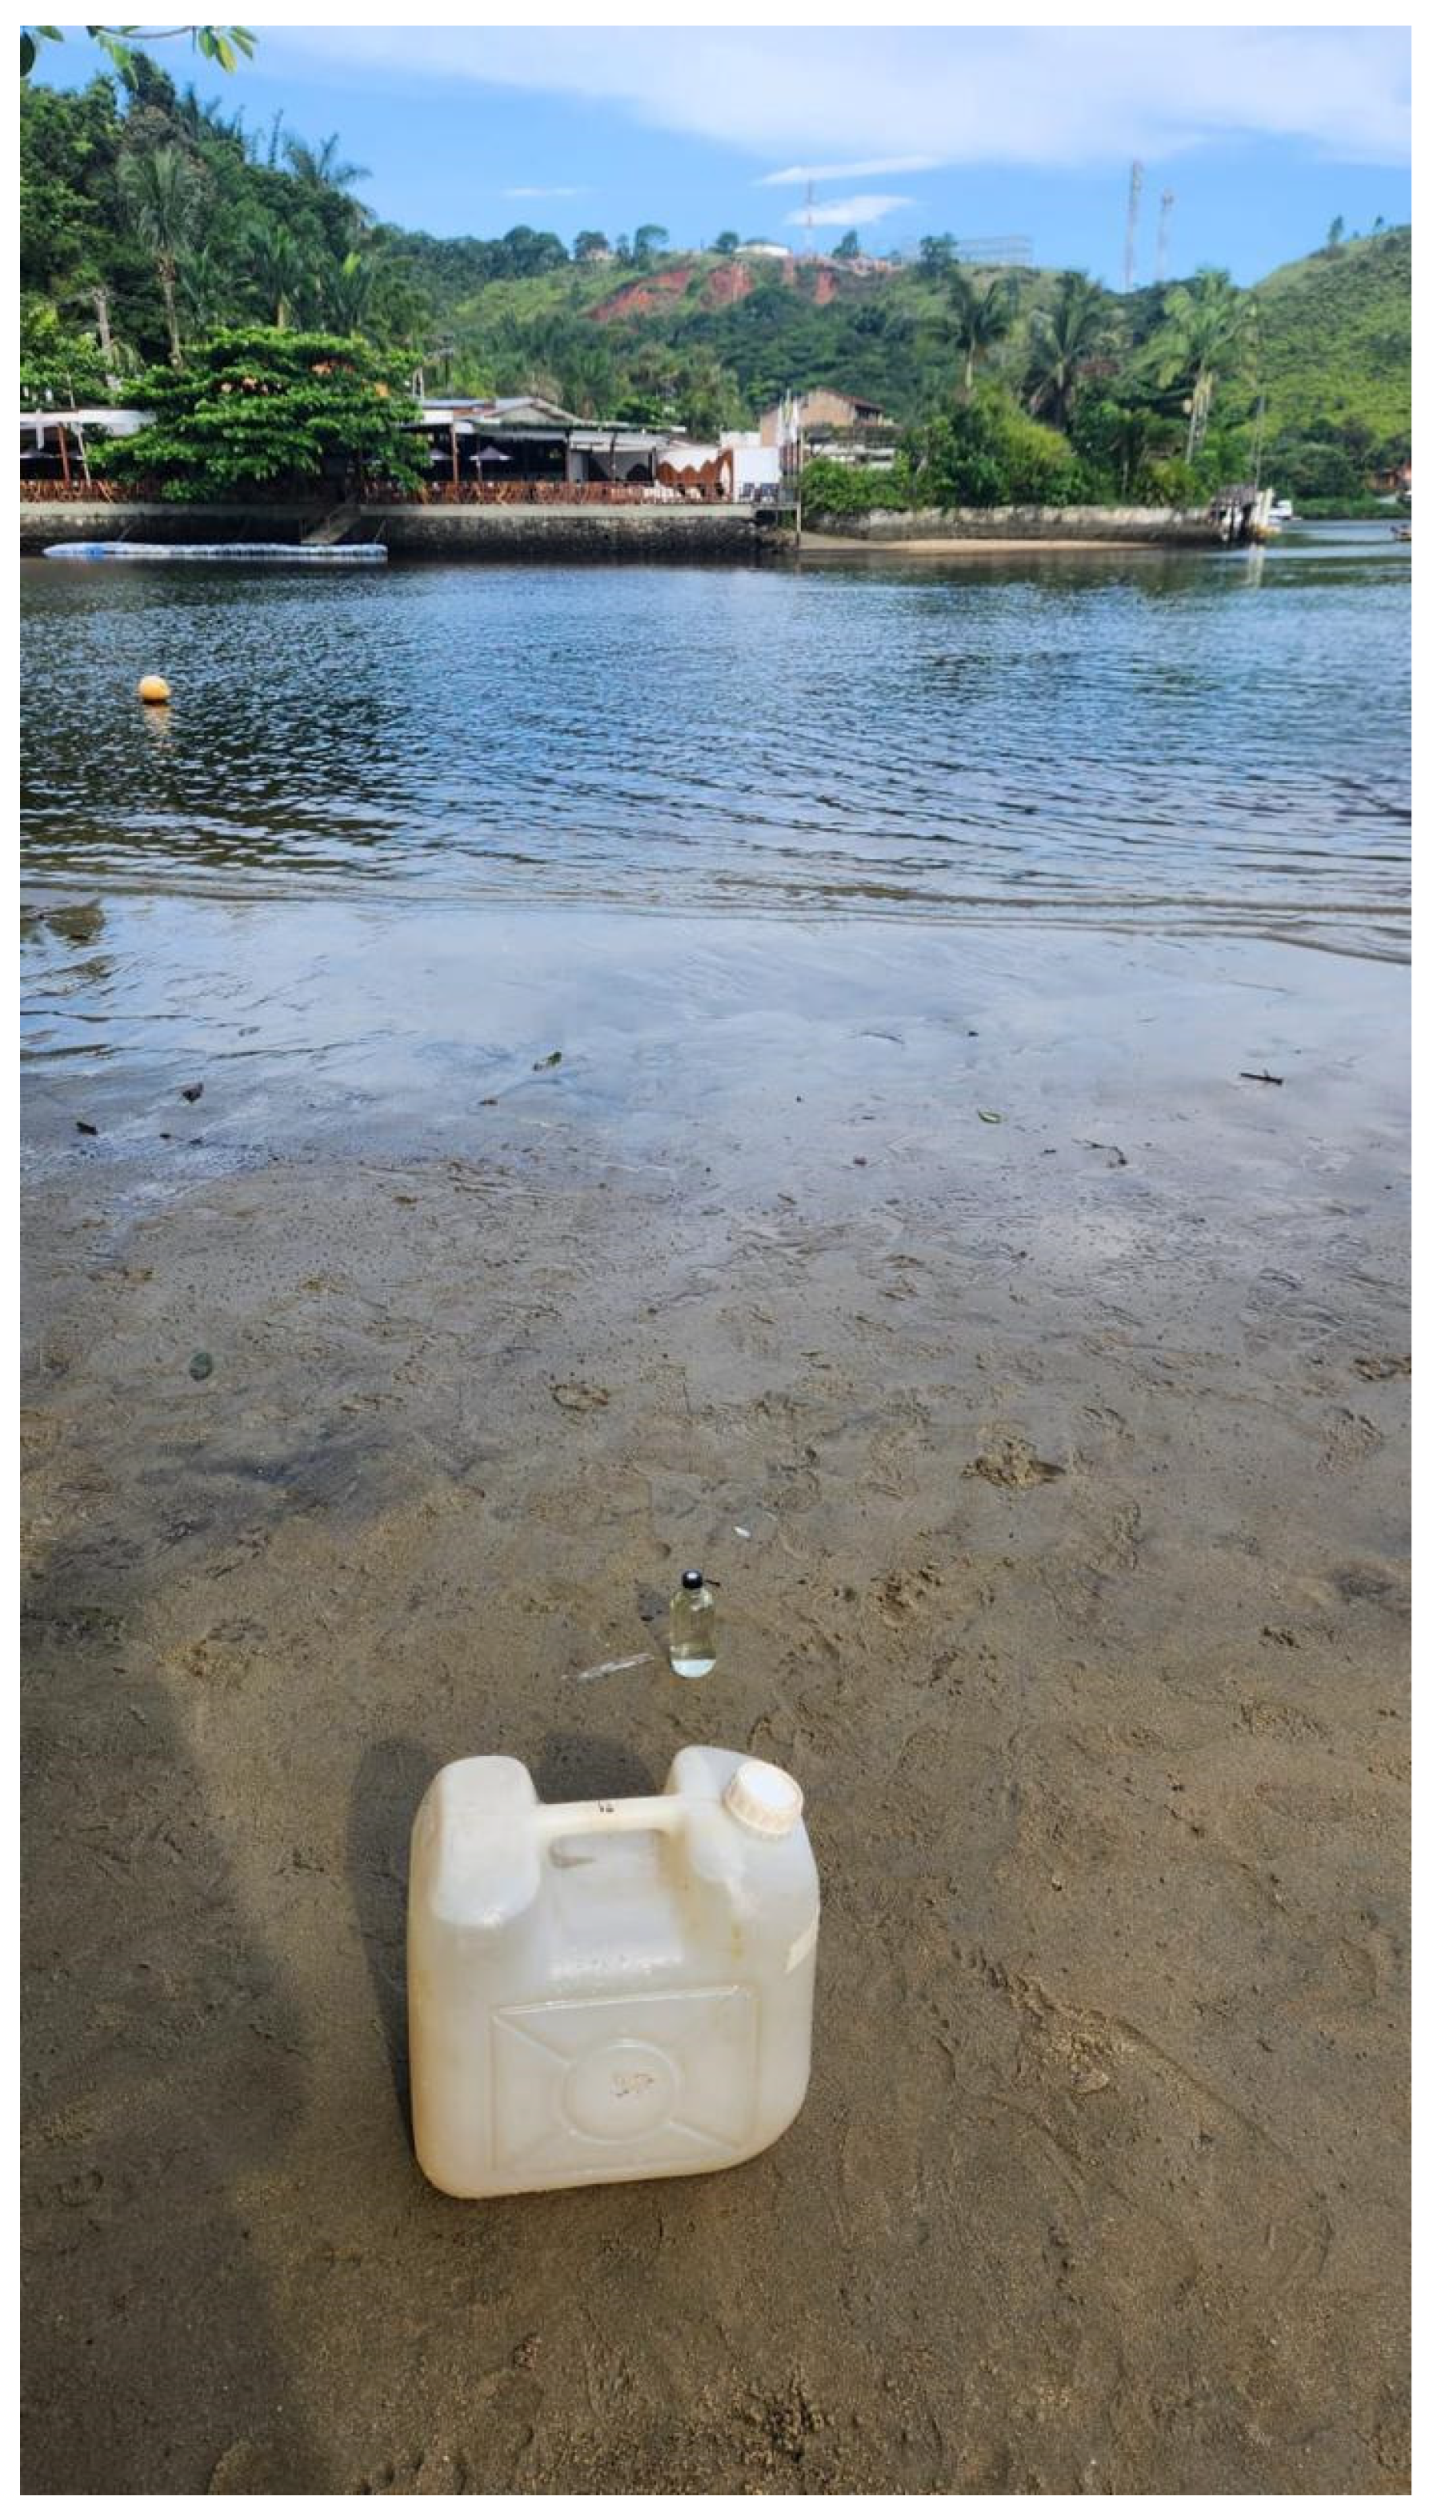
The blackwater sample 2 (Scheme 2) (Latitude = 23°46′38.4″ S; Longitude = 45°58′11.2″ W) was collected at the Itaguaré River close to a bridge on the BR-101 highway. It is formed by the confluence of several first- and second-order streams that originate in the Serra do Mar, possessing a drainage area of 95.09 km2, with approximately half of its basin located in steep sections of the mountains. The main channel of the river’s plain stretch extends for approximately 7.5 km, from the formation point to its mouth at sea [62].
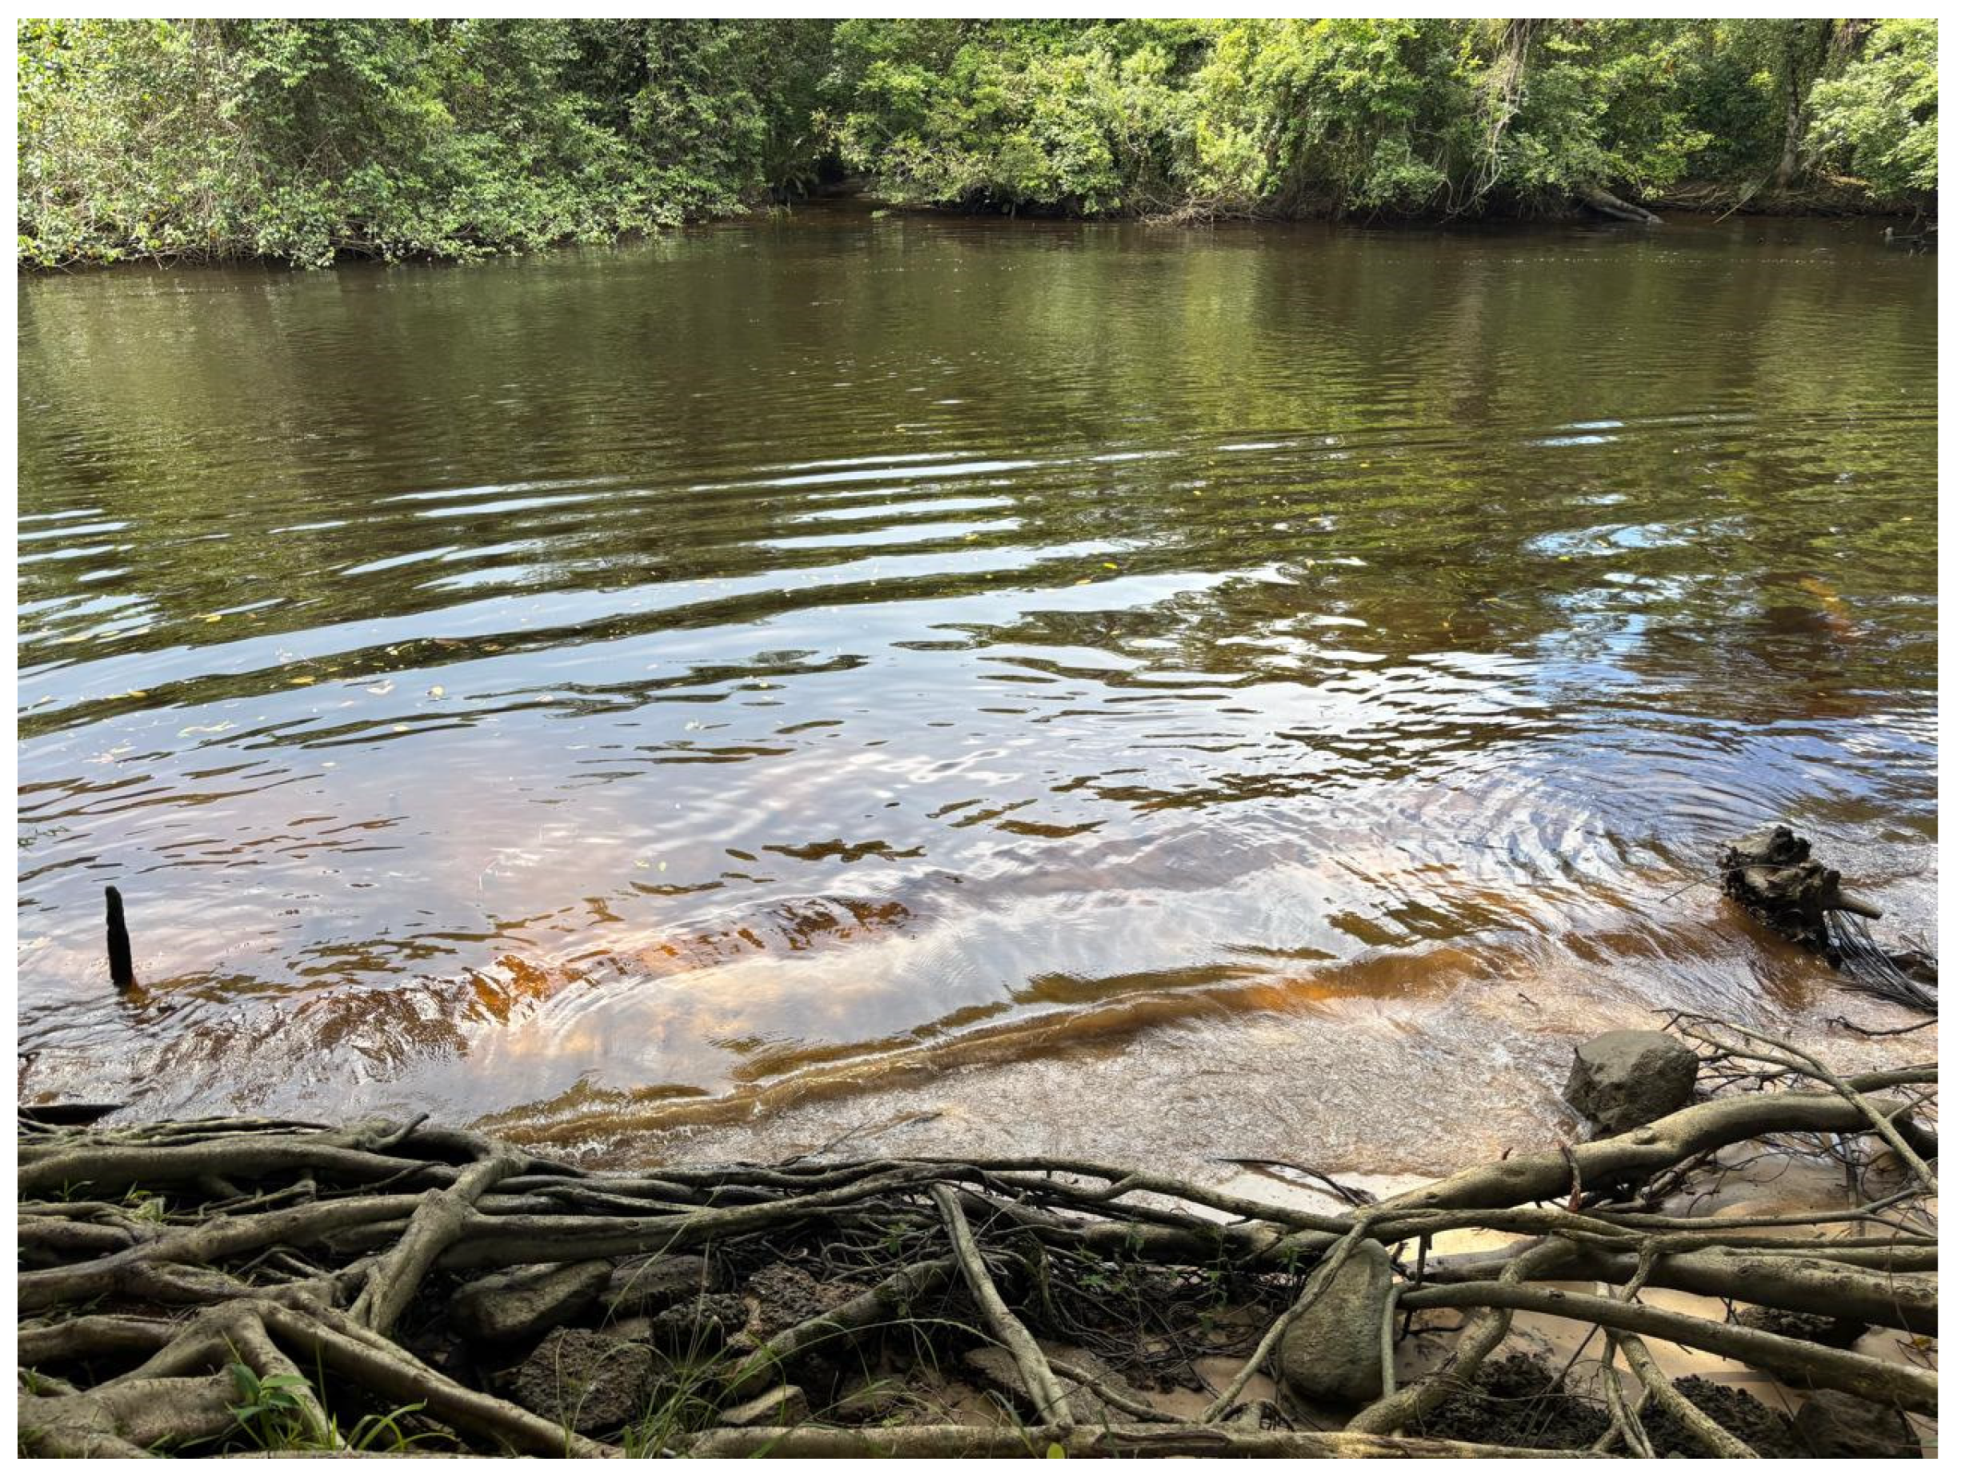
Blackwater samples 3 and 4 (Scheme 3 and Scheme 4) were collected at the Una River, in the well-known tourist area Barra do Una of São Sebastião municipality. The word “Una” means black in the local Tupi-Guarani language. The Una River mouth is located on the left side of Barra do Una beach and is formed by a group of rivers that originate on the slopes of the Serra do Mar mountain range in the Sertão do Una region. The sample 4 (Latitude = 23°45′45.0″ S; Longitude = 45°45′41.0″ W) was collected close to the Una River mouth, whilst the sample 3 (Latitude = 23°45′17.0″ S; Longitude = 45°45′43.0″ W) was collected about 900 m upstream of this monitoring point.
The sampling campaigns were conducted at the end of September 2024 (spring, Bertioga city) and the middle of January 2025 (summer, São Sebastião city). The blackwater samples were stored in polyethylene flasks (25 L), previously washed with ultrapure Milli-Q water and rinsed in situ with the collected water for the hydrochemical analyses. Physicochemical parameters were measured in situ, while the remaining analyses were conducted immediately after the samples arrived at LABIDRO-Isotopes and Hydrochemistry Laboratory located at IGCE-UNESP-Rio Claro Campus. Special glass bottles, manufactured by Durridge Co. (Billerica, MA, USA) and equipped with a suitable cap to prevent radon loss during transportation and measurement, were used to recover the samples for such readings. Details of the analytical protocols are given in the next section.

4. Analytical Methods

Standard analytical techniques, such as dilution and incubation procedures, evaporation, methyl orange end-point titration, potentiometry, spectrophotometry, and alpha spectrometry, were used to obtain the parameters analyzed in the water samples. Table 1 is a summary of the analytical methods adopted for data acquisition, with corresponding detection limits and analytical uncertainties. A description of the protocol involving the major experimental steps is now provided.
The pH measurement was performed by a digital portable meter (Digimed) coupled to a combination glass electrode (model KASVI); buffer solutions equilibrated with the sample temperature were utilized to calibrate the equipment before the analyses. The electrical conductivity (EC) was measured using a digital device (Analion, model C-702) coupled to a 1 cm2 area Pt electrode calibrated with a KCl standard.
The true color was determined by colorimetry (wavelength 455 nm), using a program stored in the Hach DR/2000 spectrophotometer that was calibrated in color units based on the APHA-recommended standard of 1 color unit being equal to 1 mg/L platinum as chloroplatinate ion [63].
The turbidity was evaluated by the absorptometric method (wavelength 450 nm) that measures the scattering and absorption of light by the particulate matter present, whose readings in the Hach DR/2000 spectrophotometer are based on formazin turbidity standards, thus given in formazin turbidity units (FTU) [63].
The suspended solids (SS) were measured by the photometric method (also called nonfilterable residue), using the Method 8006 of the Hach DR/2000 spectrophotometer (wavelength 810 nm). The total dissolved solids (TDS) were calculated by the sum of the concentration of the dissolved constituents as determined in aliquots of the samples filtered through a 0.45 µm Millipore membrane filter.
Alkalinity was measured by titration with 0.02 N sulfuric acid using the Hach 8221–Buret Titration method, whose readings are in the concentration range between 0.1 and 500 mg/L [64]. The obtained values corresponded to the bicarbonate concentrations since neither carbonate nor hydroxide was characterized.
The determination of sodium and potassium was performed by the flame atomic emission spectrometry method, using a Benfer flame photometer (model BFC-300). Calcium hardness (as CaCO3) and magnesium hardness (as MgCO3) of the water samples were determined by the colorimetric method (wavelength 522 nm) after chelating calcium with EGTA and calcium and magnesium with EDTA [64], parameters that allowed the evaluation of Ca and Mg contents as read in the Hach DR/2700 spectrophotometer (Hach method 8030–Calmagite Colorimetric).
Silica, chloride, nitrate, nitrite, sulfate, phosphate, and iron were characterized by colorimetry utilizing the Hach DR/2700 spectrophotometer for every standardized Hach Method [64]. For silica, the Hach method 8185 (Silicomolybdate) was adopted, in which silica in the sample reacts with molybdate ion under acidic conditions to form yellow silicomolybdic acid complexes read at wavelength 450 nm. The Hach method 8113 (Mercuric Thiocyanate) was utilized for measurements of chloride in the samples, which reacts with mercuric thiocyanate to form mercuric chloride and liberate thiocyanate ion that reacts with the ferric ions to form an orange ferric thiocyanate complex, read at wavelength 455 nm. For nitrate, the Hach method 8039 (Cadmium reduction) was used, in which cadmium metal reduces nitrates present in the sample to nitrite, which reacts in an acidic medium with sulfanilic acid to form an intermediate diazonium salt that couples to gentisic acid, forming an amber-colored product read at wavelength 500 nm. The Hach method 8507 (Diazotization) was adopted for nitrite readings, which reacts with sulfanilic acid to form the same intermediate diazonium salt that now couples with chromotrophic acid to produce a pink colored complex read at wavelength 507 nm, which is directly proportional to the amount of nitrite present. Sulfate readings were conducted by the Hach method 8051 (SulfaVer 4), in which sulfate ions in the sample react with barium in SulfaVer 4 sulfate reagent and form insoluble barium sulfate turbidity read at wavelength 450 nm. Phosphorus reactive (orthophosphate) was determined by the Hach method 8048 (PhosVer 3, ascorbic acid), in which orthophosphate reacts with molybdate in an acid medium to produce a phosphomolybdate complex; then, ascorbic acid reduces the complex, giving an intense molybdenum blue color read at wavelength 890 nm. Total Fe was measured by the Hach method 8008 (FerroVer), utilizing the 1,10-phenanthroline indicator, which yields an orange color proportional to the iron concentration and read at wavelength 510 nm.
Tannin and lignin were characterized by the tyrosine method that registers all hydroxylated aromatic compounds, including tannin, lignin, phenol, and cresol, which produces a blue color proportional to the amount of these compounds and is read at wavelength 700 nm in the Hach DR/2000 spectrophotometer [63].
The organic matter (OM) was determined by the dichromate method, which is based on organic carbon oxidation to CO2 with a parallel reduction of Cr6+ to Cr3+ and an accompanying color change from orange to green, whose intensity is measured at 610 nm [63]. The test was realized utilizing 100 mL of sample to which 10 mL of 1 N potassium dichromate solution and 20 mL of concentrated sulfuric acid were added. The organic carbon was estimated from those readings by the Walkley–Black method [65,66].
The BOD (Biochemical Oxygen Demand) was measured by the dilution method, employing Milli-Q ultrapure water (resistivity of 18.2 MΩ.cm at 25 °C). For this purpose, the dissolved oxygen (DO) content remaining in six portions of each well-mixed sample transferred to separate 300 mL glass-stoppered bottles was evaluated after a five-day incubation period at a temperature of 20 °C; the DO values measured potentiometrically were plotted against the mL of sample taken, yielding a straight line that allowed obtain the BOD data [63].
The radon (222Rn) dissolved in the water samples was analyzed using a RAD7 alpha particle detector coupled to an accessory (RADH2O), both manufactured by Durridge Co. The RAD7 utilizes a solid-state Si semiconductor detector that converts the alpha particles’ energy into an electrical signal, resulting in an alpha spectrum in the energy range of 0–10 MeV [67]. The spectrum is displayed in a set of channels (200) divided into eight windows of variable energy ranges, with windows A and C providing the 222Rn activity concentration data from 218Po (“new” 222Rn) and 214Po (“old” 222Rn) decays [67].
The RADH2O unit comprised a closed-circuit aeration system, coupling the sample, RAD7, and a tube with Drierite (desiccant) for moisture absorption [68]. Air circulation for ~10 min was conducted through the sample to perform the radon extraction, which was pumped into the RAD7, where its progeny was detected, yielding the dissolved 222Rn activity concentration data (in Bq/m3 and afterwards converted to the SI unit, Bq/L, if necessary).
The aliquots (15–20 L) for analysis of uranium were acidified to pH < 2 using HCl. Then, approximately 500 mg of iron chloride and 4.4 dpm of 232U spike were added. Afterwards, the pH was raised to about 7–8 using a concentrated solution of ammonium hydroxide, which caused the uranium co-precipitation with iron hydroxide. In the next step, the precipitate recovery and its dissolution in 8M HCl, with Fe3+ extraction into an equal volume of isopropyl ether, occurred. Purification of the acid U-bearing solution was conducted in a column of 100–200 mesh Dowex 1-X8 resin, which is a strong chloride anion exchanger. 9M HCl and 7M HNO3 circulated through the resin bed, with uranium being finally eluted from the NO3-column with 0.1 M HCl. Then, 10 mL of 2M (NH4)2SO4 electrolyte was added to the dry residue of the eluted solution, which was transferred to a Teflon electrodeposition cell. After adjusting the pH of the solution to 2.4 with sulfuric acid, the uranium electrodeposition was realized on a stainless-steel circular disk (diameter = 2.54 cm) after 3 h at a current density of 1 Acm−2.
The alpha spectrometry was the technique adopted for measuring the dissolved U concentration and 234U/238U activity ratio (AR). Four ULTRA-AS Ion-Implanted Detectors from EG&G ORTEC (Model BU-020-450-AS) were utilized for the alpha readings. They possessed 450 mm2 of active area, 0.1 mm of depletion depth, and a FWHM resolution of 20 keV at an alpha energy of 5.486 MeV. The EG&G ORTEC 919 Spectrum Master Multichannel Buffer allowed for recording the alpha spectrum containing the natural uranium isotopes 238U and 234U, as well as the 232U spike added to the samples. The 238U and 232U peaks in the alpha spectrum permitted obtaining the 238U activity concentration by isotope dilution, while the 238U and 234U peaks allowed calculation of the AR’s data. Analytical uncertainties for these measurements are 10–15% within 1σ standard deviation and 95% confidence level. Additional details for such an experimental protocol are given by [69,70,71].

5. Results and Discussion

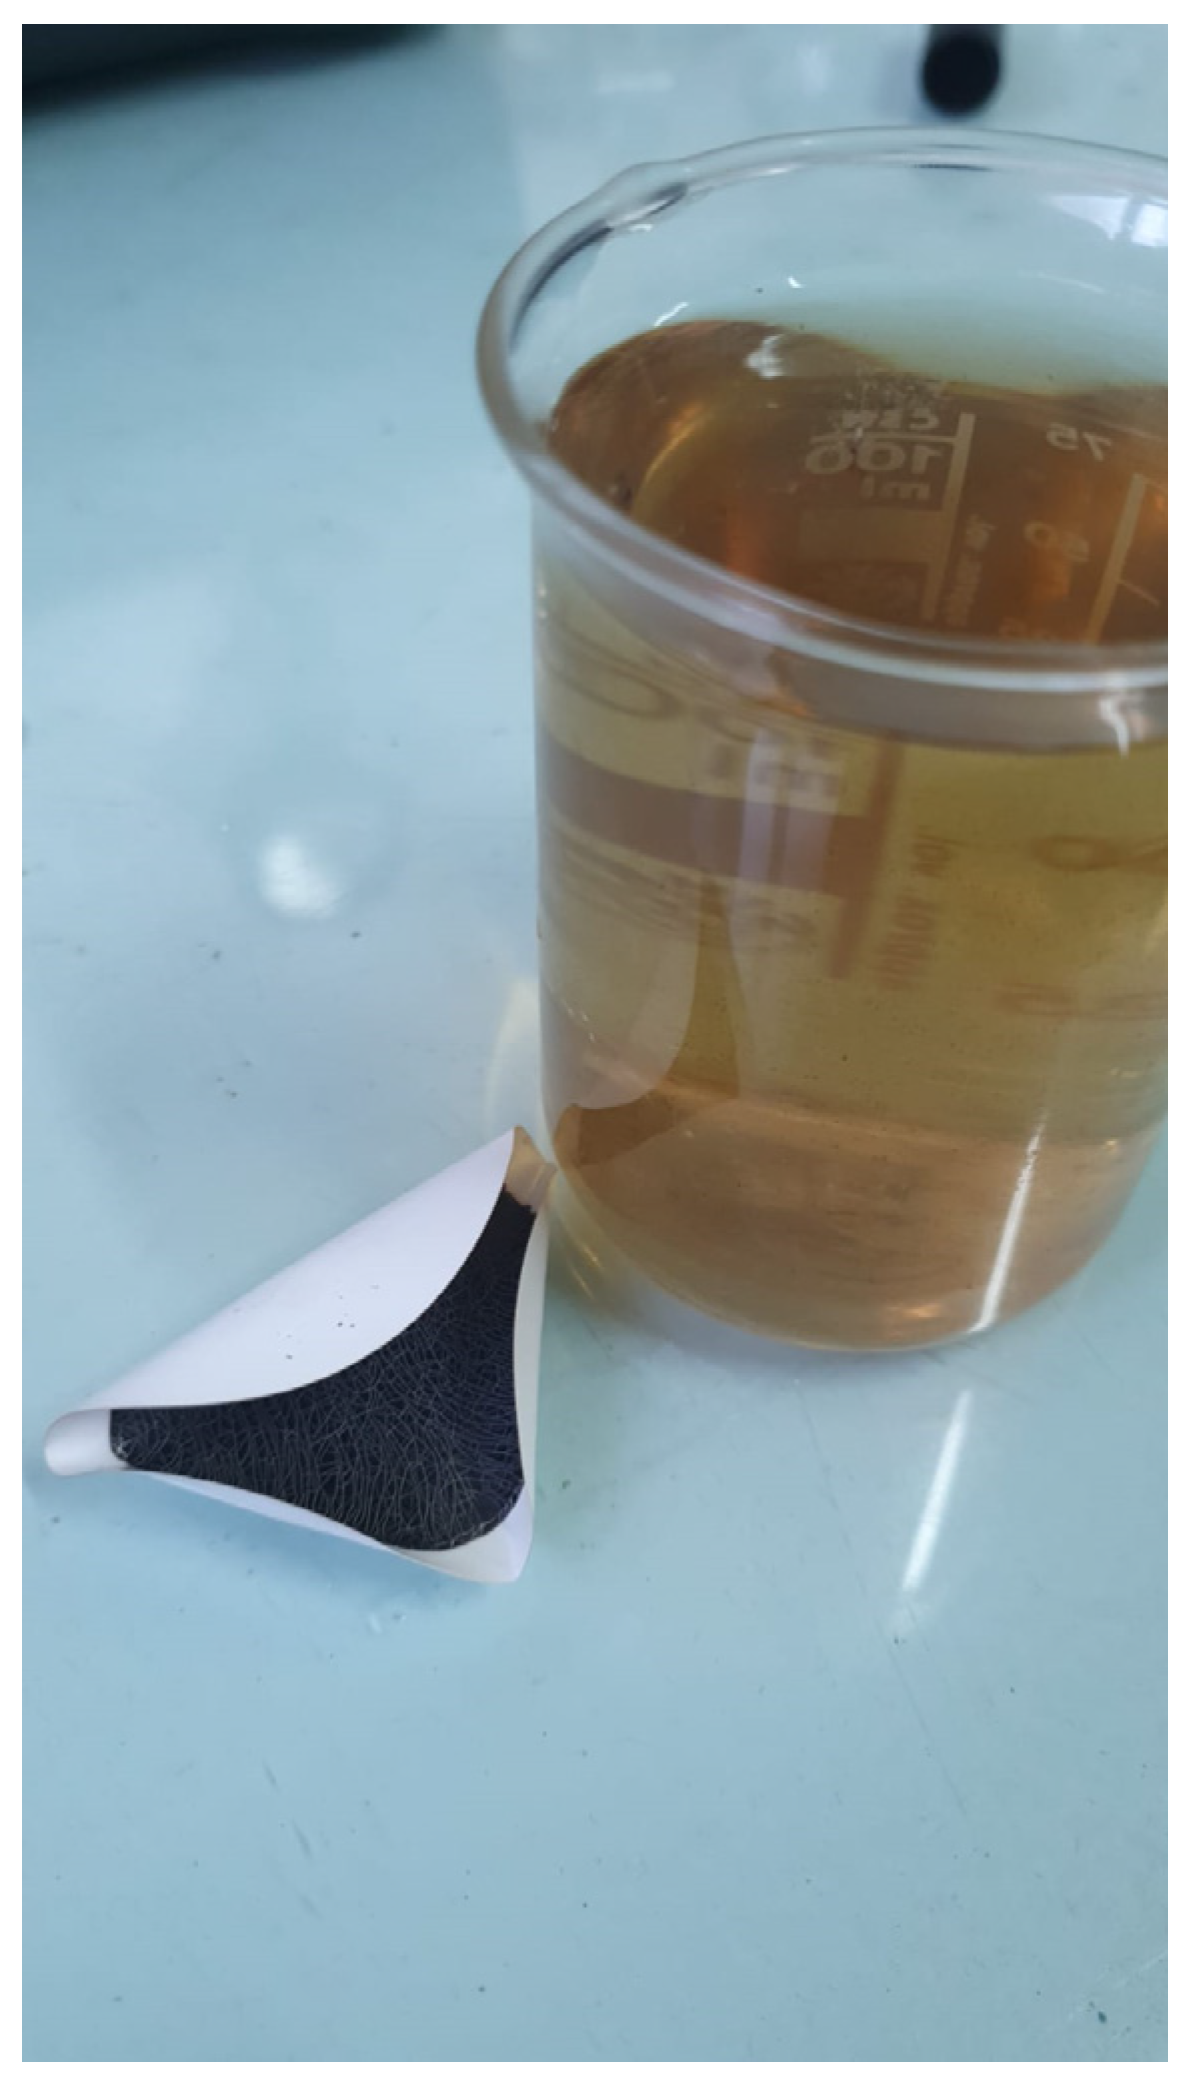
Table 2 reports the results of the parameters analyzed. The color and turbidity of blackwater sample 1 differ greatly from those of other waters, reaching values of 778 Pt-Co units and 118 FTU, respectively. These parameters imply higher values of organic matter, organic carbon, BOD, phosphate, and total iron for water sample 1 compared to the remaining blackwaters. Scheme 5 shows the black color of the suspended solids (22 mg/L, Table 2) recovered after filtering it, which is a typical situation that occurs during the vegetation decay (detritus) and leaching into the water [20]. The brownish color of the filtered aliquot (Scheme 5) points out the presence of dissolved iron that is high in blackwater sample 1 (1.90 mg/L, Table 2). The pH values indicate that sample 2 is close to neutrality, while the remaining waters are acidic (pHs between 5.4 and 6.4), as often verified for blackwater rivers and streams [19].
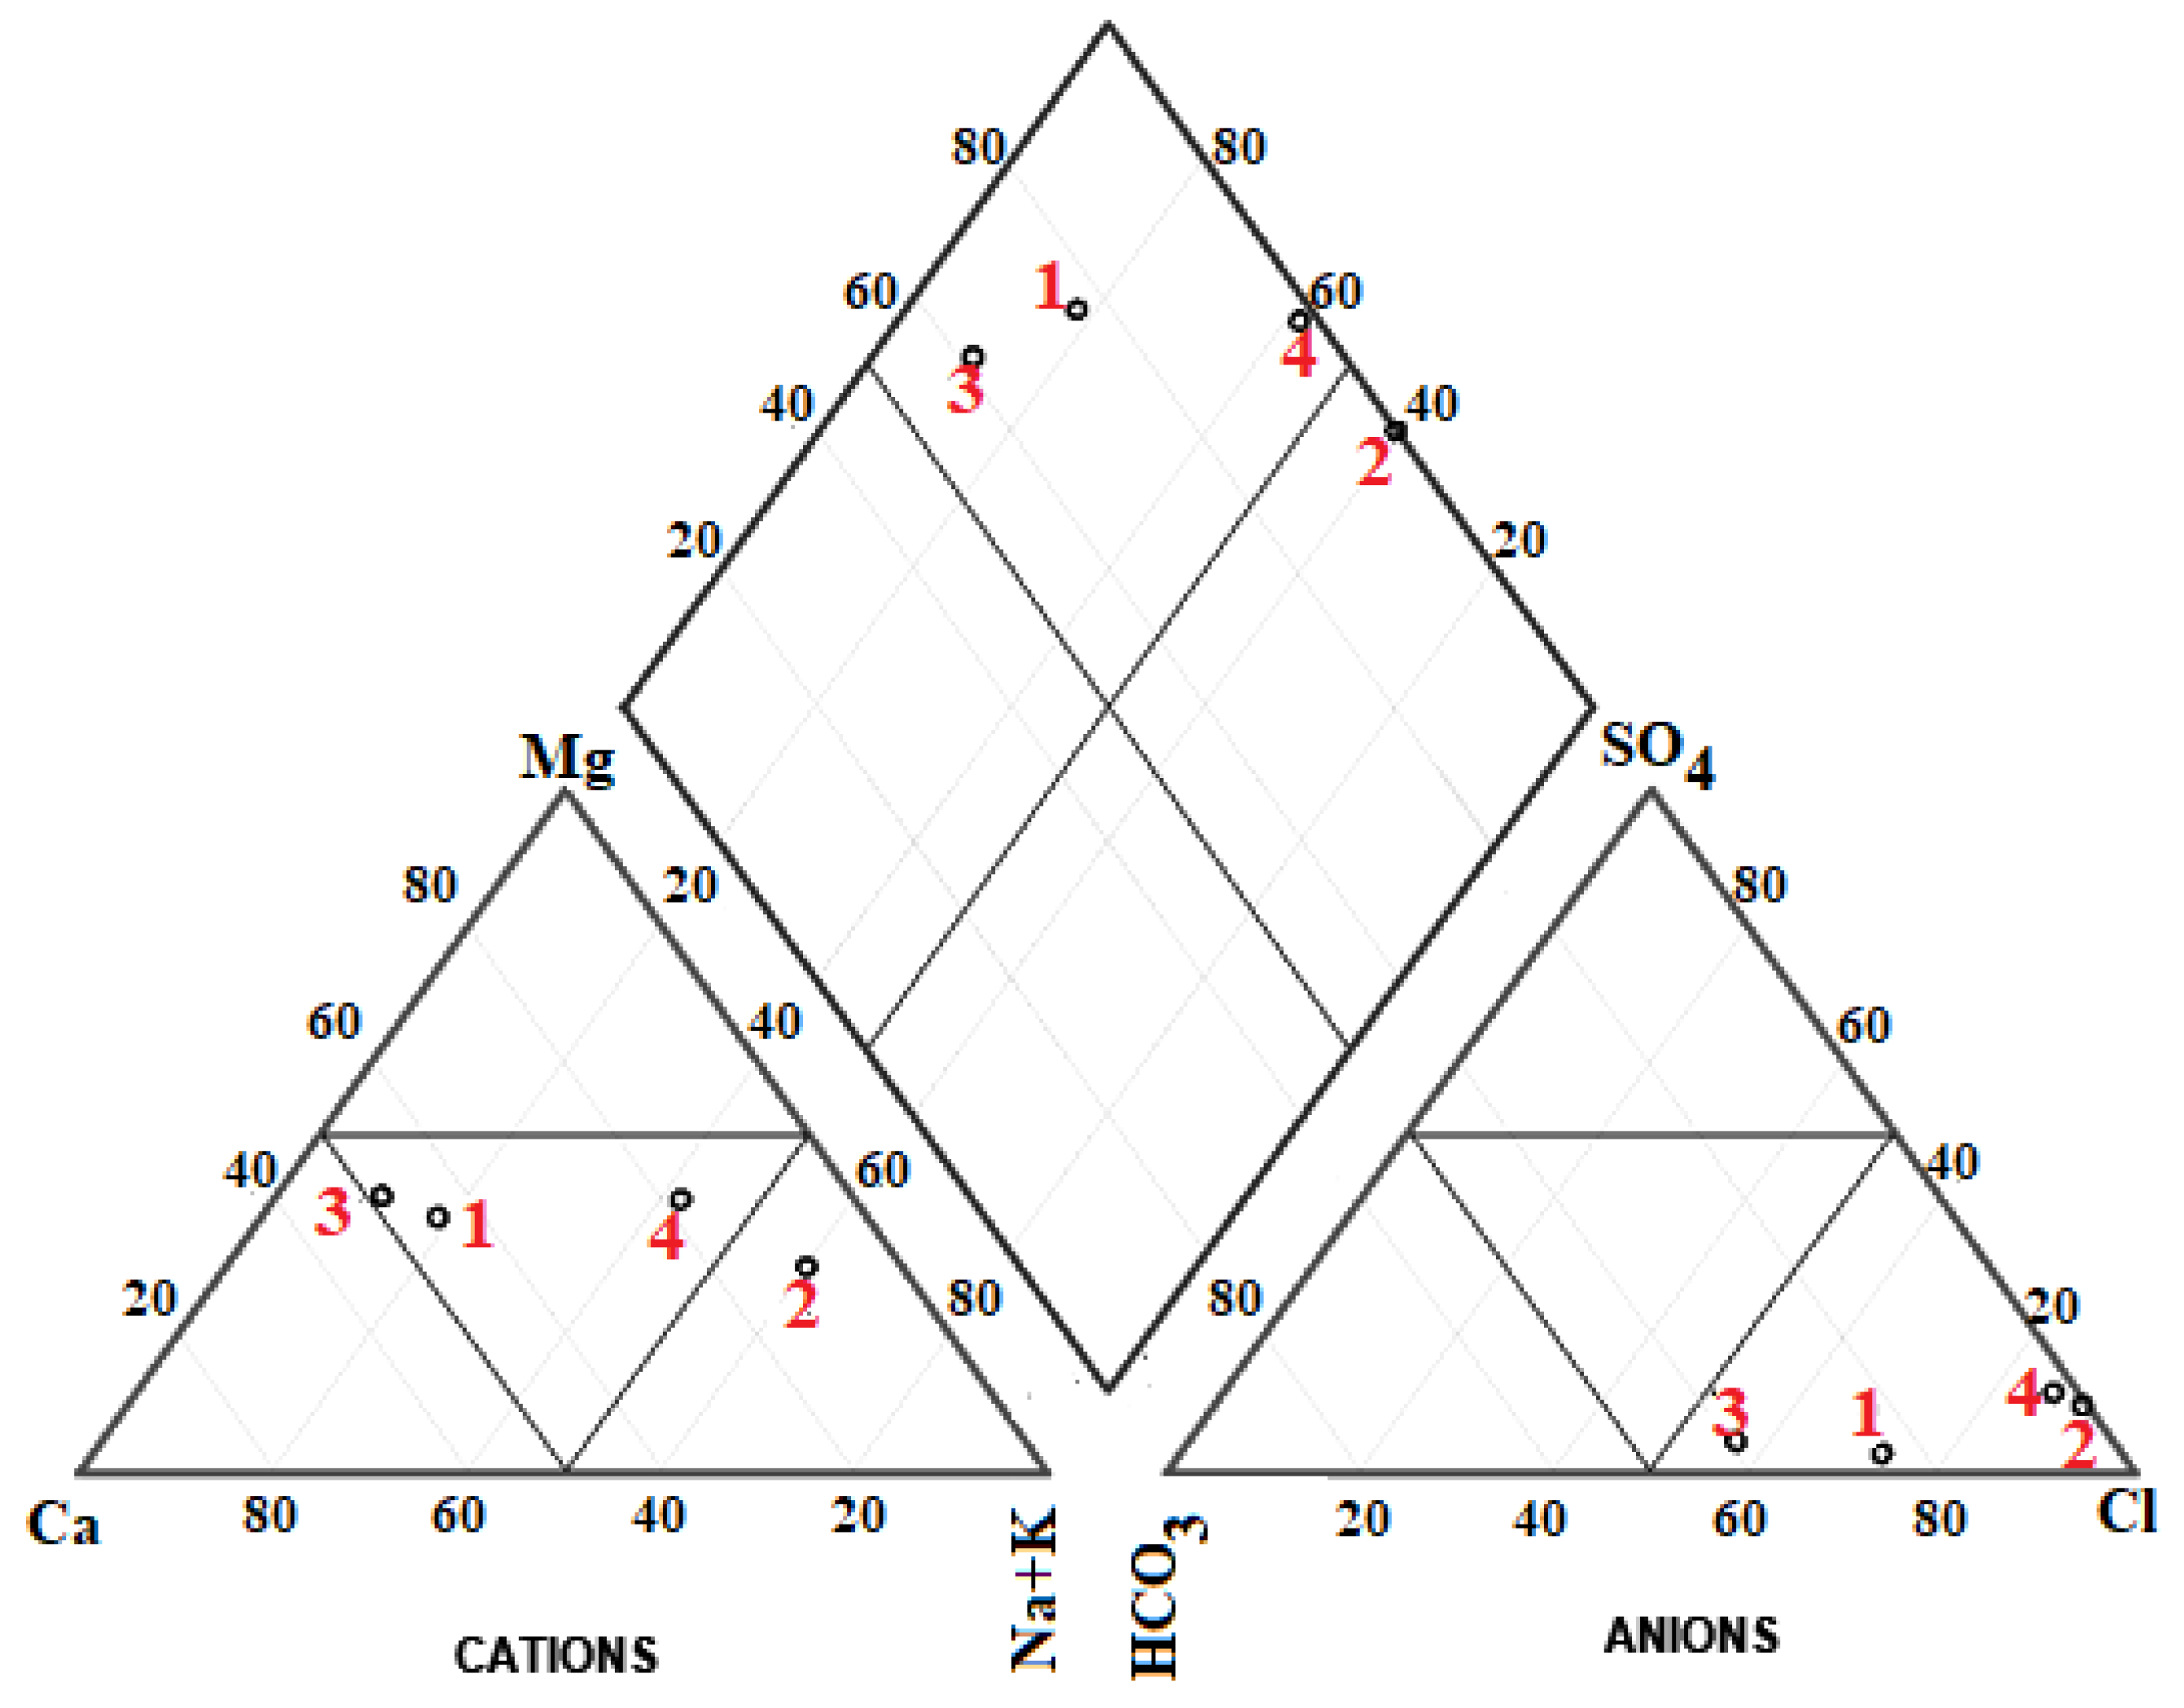
Aquachem version 4.0 software [72] allowed plotting the hydrochemical data of Table 2 in the Piper [73] and Schoeller [74] diagrams as shown in Figure 4 and Figure 5. In terms of dissolved cations, blackwater sample 2 is Na-dominated, while the remaining blackwaters are mixed. Additionally, both hydrogeochemical diagrams highlight the dominance of chloride in all blackwaters.
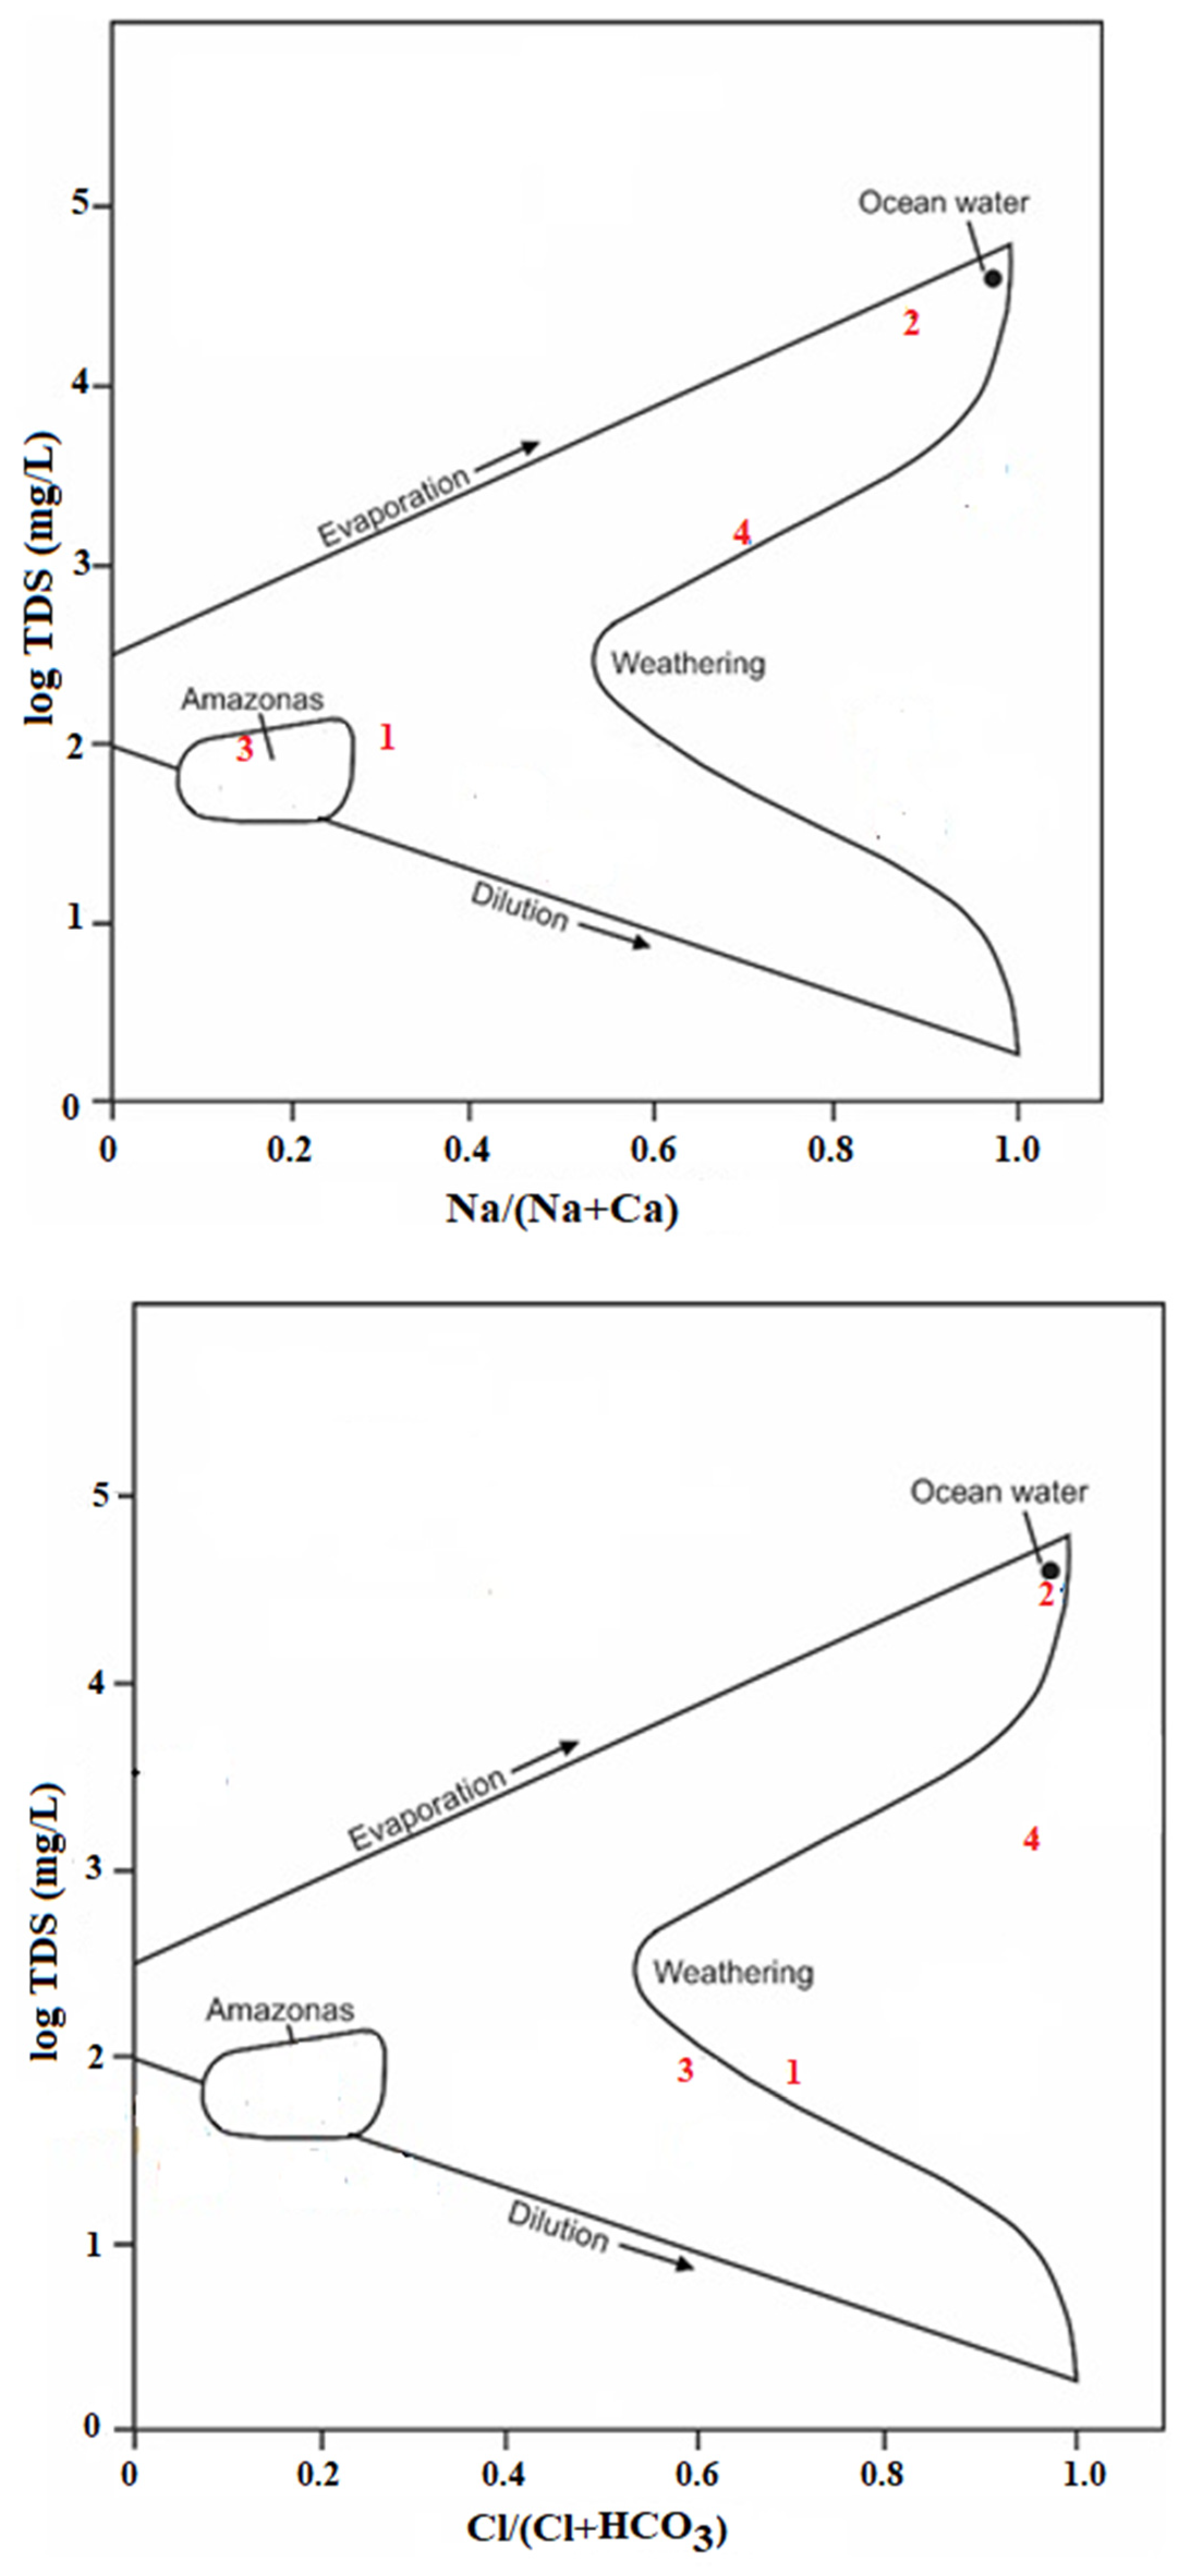
The Gibbs boomerang diagrams [75] plot hydrogeochemical data for discussion of dominant mechanisms that control the world surface water chemistry, suggesting influences among different components of the hydrological cycle (seawater, rainwater, surface waters, and groundwater). Figure 6 highlights the accentuated dominance of sodium and chloride in the blackwaters 2, suggesting a strong marine influence in the hydrochemical composition.
Another useful hydrogeochemical mixing diagram was proposed by van Wirdum [76] for ecological purposes, which is ternary and takes into account the following water types (Figure 7): lithotrophic (LI = calcium-bicarbonate water, usually owing its characteristic composition to a contact with soil); atmotrophic (AT = water with low concentrations of most constituents, usually owing its characteristic composition to atmospheric precipitation); and thalassotrophic (TH = a saline sodium-chloride water as found in the oceans). Figure 7 shows that the blackwater sample 2’s composition is almost equivalent to that found in the oceans (thalassotrophic), as indicated by the Gibbs diagrams in Figure 6.
Therefore, blackwater sample 2 collected at Itaguaré River is certainly affected by the hydrochemical composition of the Atlantic Ocean waters, which is a common process occurring in coastal zones, as ocean backward currents (also known as coastal upwelling or tidal currents) can significantly alter the water chemistry of a river, particularly near the river mouth and in the estuary [77]. This is due to the mixing of saltwater from the ocean with the freshwater from the river, as well as the transport of dissolved substances and sediment by the currents [77].
The interaction between the oceanic waters and rivers’ blackwaters in the study area is also revealed by the hydrochemical composition of samples 3 and 4 collected at the Una River, Barra do Una, São Sebastião municipality. Table 2 shows that EC, sodium, potassium, calcium, magnesium, chloride, sulfate, and, consequently, TDS, are much higher close to the Una River mouth, as indicated by analytical data of blackwater sample 4 compared to blackwater sample 3.
Sodium and chloride are two relevant ions in the chemical composition of ocean waters, also highlighting the influence of the tidal currents in the hydrochemistry of the Itaguaré and Una rivers. The sodium and chloride concentrations were 9430 mg/L and 9100 mg/L, respectively, at Itaguaré River (sample 2), while they were 257 mg/L and 330 mg/L, respectively, at Una River (sample 4) as reported in Table 2. Thus, sodium and chloride concentrations are, respectively, about 37 and 28 times higher in the Itaguaré River than in the Una River, indicating a stronger influence of the tidal currents in the Itaguaré River mouth. This is supported by the tidal coefficient (TC), which ranges between 20 and 120 and reflects the difference in water height between high and low tide, i.e., a higher TC value means a larger tidal range and stronger tides, whereas a lower TC value suggests a smaller range and weaker tides. The TC value was 70 (classified as high) at Bertioga city on 29th September 2024 when sample 2 was collected, whilst it was 36 (classified as low) at São Sebastião city on 22 January 2025 during the collection of sample 4 [78,79].
One important social and economic consequence of this ocean–river interaction is related to the water use for agricultural purposes, as several crops can be affected by the salinity increase in the rivers’ blackwaters. Since Wilcox [80], the B, Na, and EC levels in water samples have been used for valuating waters aiming at irrigating several crops.
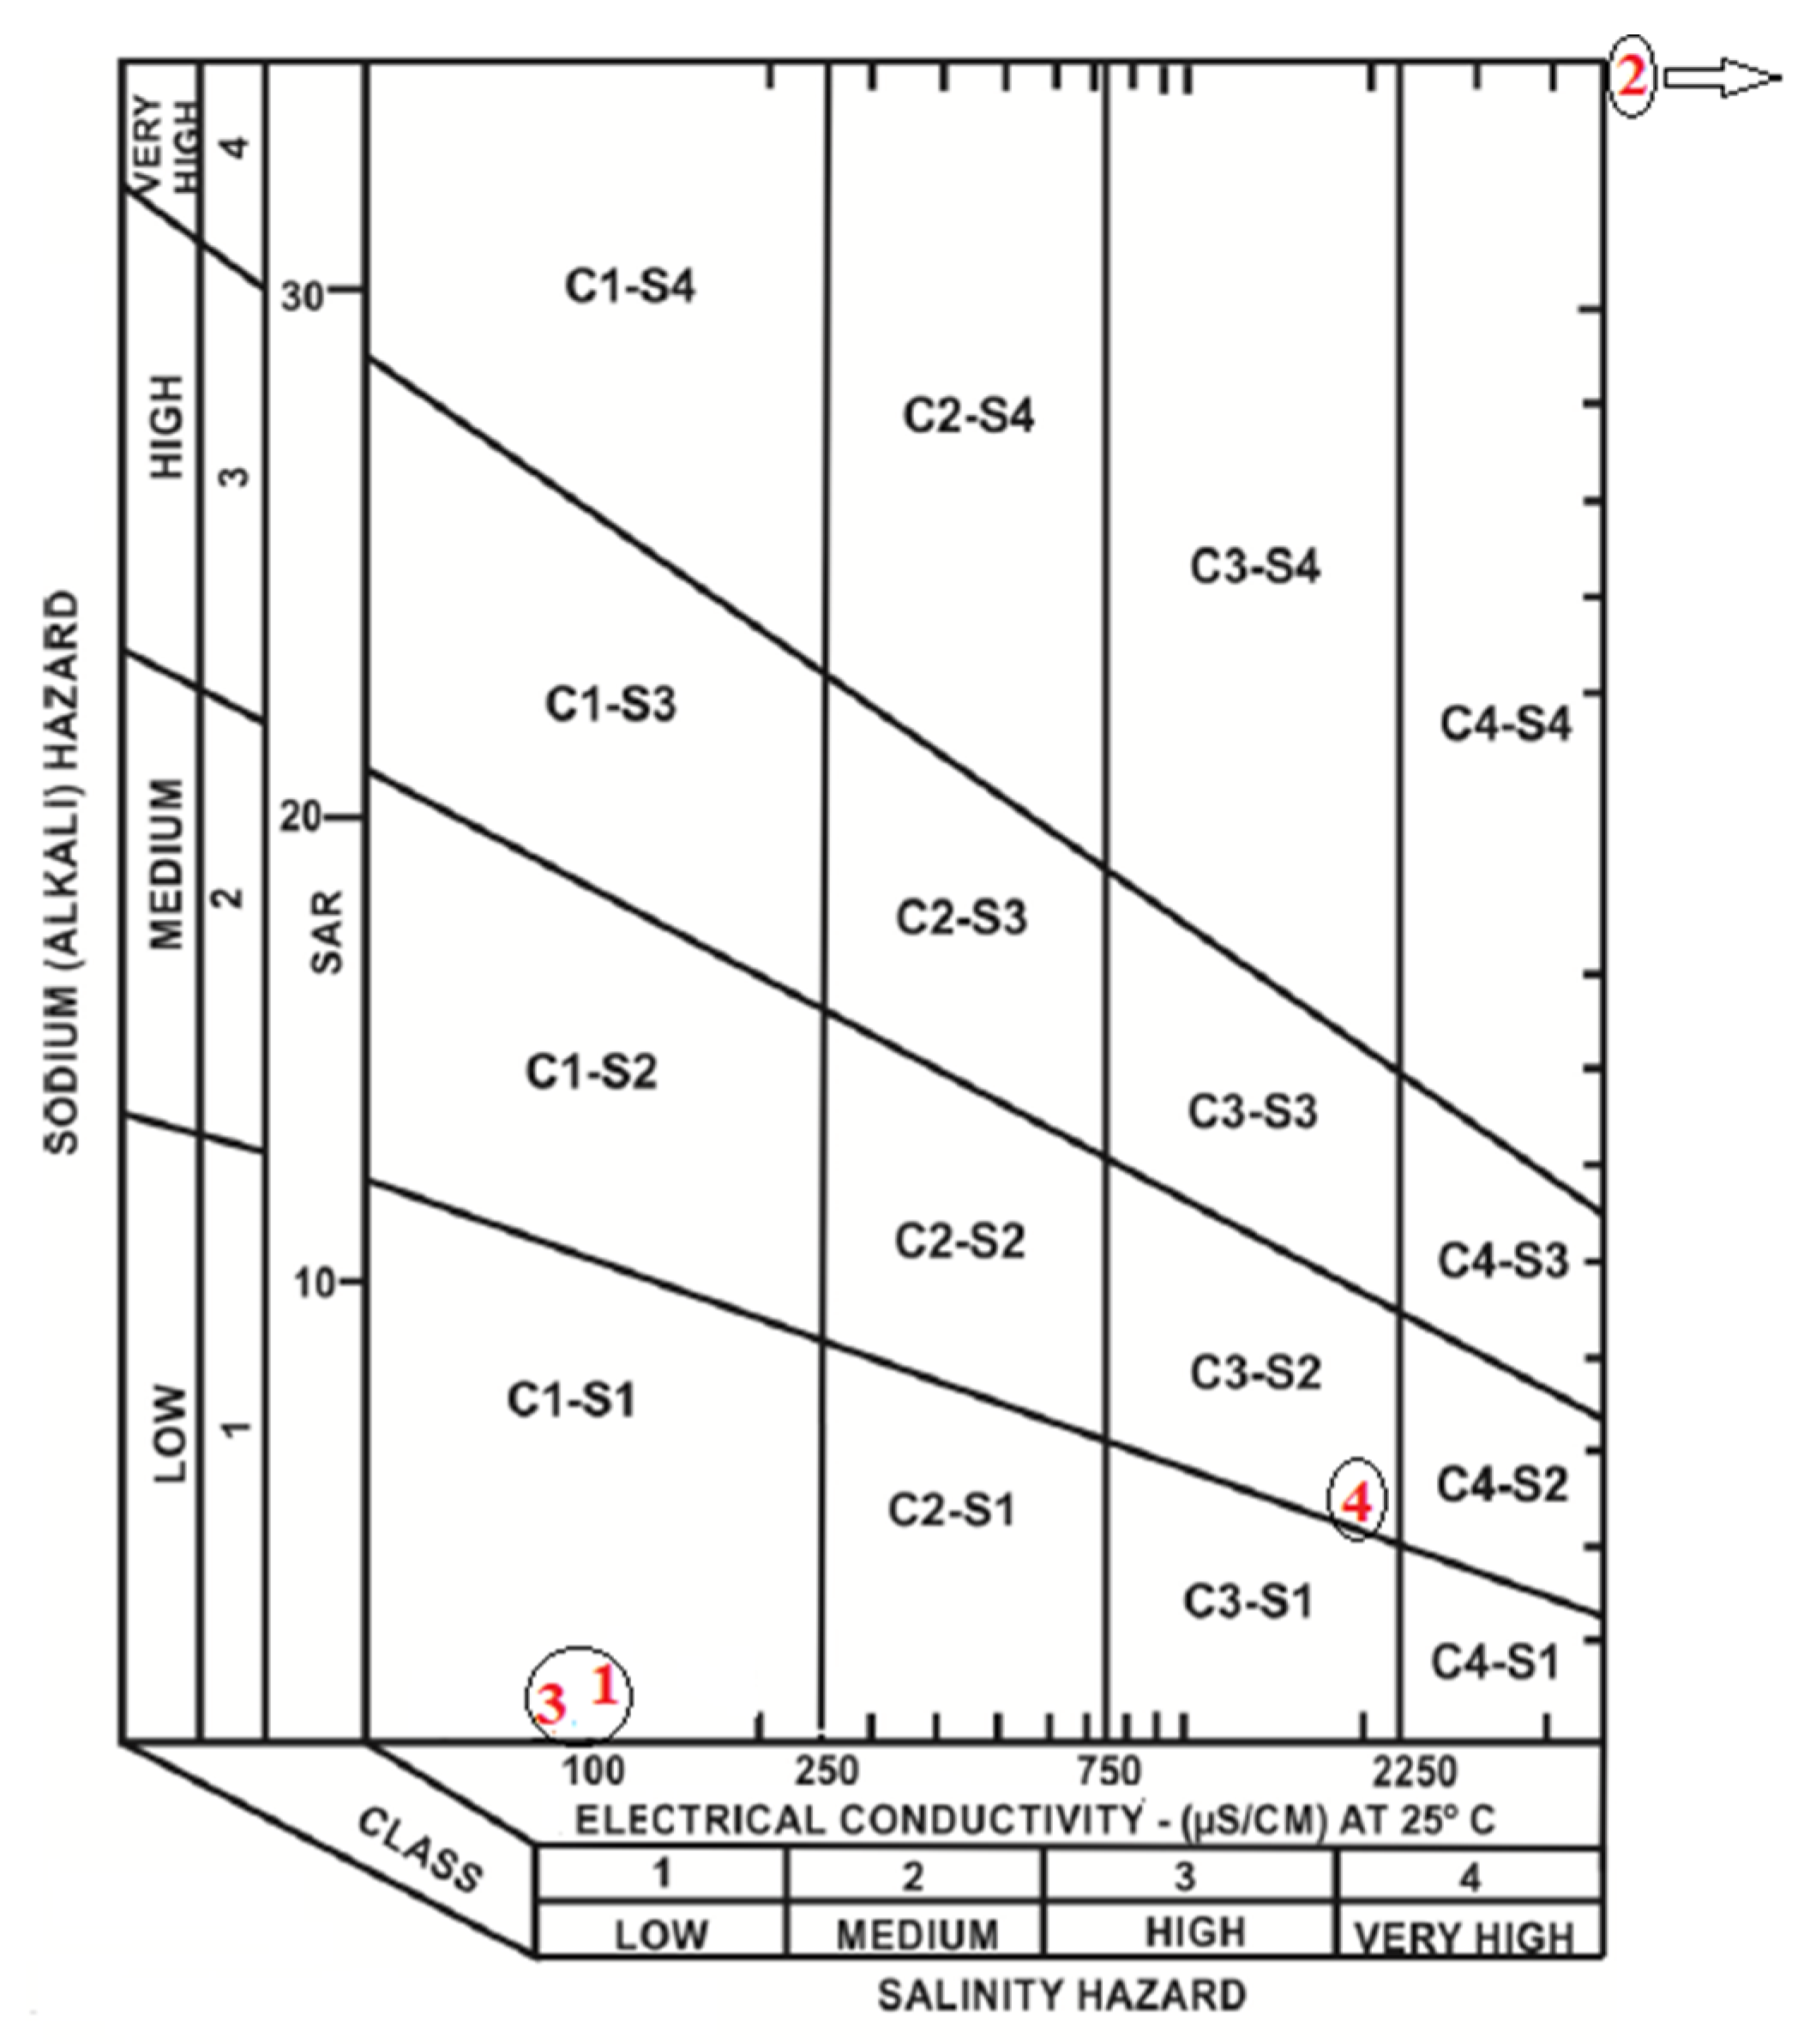
The parameters EC and sodium adsorption ratio (SAR) provided the idealization of the “USSL diagram” by the laboratory staff for evaluating salinity in the U.S.A. [81]. Such a chart combines the sodium and salinity hazards by plotting SAR in the vertical axis and EC in the horizontal axis, allowing the waters to be grouped into 16 types (Figure 8). Based on the EC values, there are four types of waters, exhibiting low (C1), medium (C2), high (C3), and very high (C4) salinity levels [82]. The kind of class will define the water suitability for the different crops and soils.
Considering the sodium, calcium, and magnesium concentration (in mEq/L), USSL [81] defined this equation for calculating SAR:
SAR = Na+/[½ (Ca2+ + Mg2+)]1/2
The four SAR types are of waters possessing low (S1), medium (S2), high (S3), and very high (S4) sodium levels [82]. The water’s usefulness for irrigation is based on such classes.
Figure 8 shows that the Riviera stream blackwater (sample 1) and the Una River blackwater at monitoring point 3 are inserted in the C1-S1 group, indicating they are low saline and sodic, thus suitable for irrigating most of the soil types. In the Una River blackwater’s mouth (monitoring point 4), the data are inserted in the transition of C3-S1 and C3-S2 classes (high-salinity and low/medium-sodium water), suggesting possible use for cultivating some species of plants. In the monitoring point close to the mouth of the Itaguaré River (sample 2), the blackwater exhibits a notorious different classification that is beyond the category C4-S4 of the waters possessing very high salinity and very high sodium concentration. Its use for irrigation only can be sporadic, but accompanied by some specific actions like applying additional products as soil amendments, for instance, calcium sulfate [83].
Chloride is an anion of high solubility that exhibits a conservative behavior in the different compartments of the hydrological cycle (atmosphere, surface waters, and groundwater) [84]. The monitoring points at Una River are almost 1 km distant, exhibiting chloride concentrations of 8.4 mg/L (sample 3) and 330 mg/L (sample 4). Therefore, the chloride level is about 40 times higher in the Una River mouth compared to the value obtained in the upstream collection point, suggesting a chloride reduction rate of 40 times per km, under a TC of 36.
In the monitoring point 3, the Una River blackwater is low saline and sodic, being suitable for irrigating most of the soil types. The chloride concentration at the Itaguaré River mouth is 9100 mg/L (sample 2), which is approximately 1080 times higher than the value of 8.4 mg/L found for sample 3 of the Una River. The TC of 70 for the Itaguaré River and the chloride reduction rate of 40 times per km as estimated for the Una River would imply a distance of circa 27 km for the Itaguaré River to reach the chloride concentration of 8.4 mg/L. This simple calculation illustrates the relevance of the TC parameter for evaluating the hydrochemical quality of waters discharging into coastal areas, allowing tracking of possible scenarios related to the influence of the ocean backward currents.
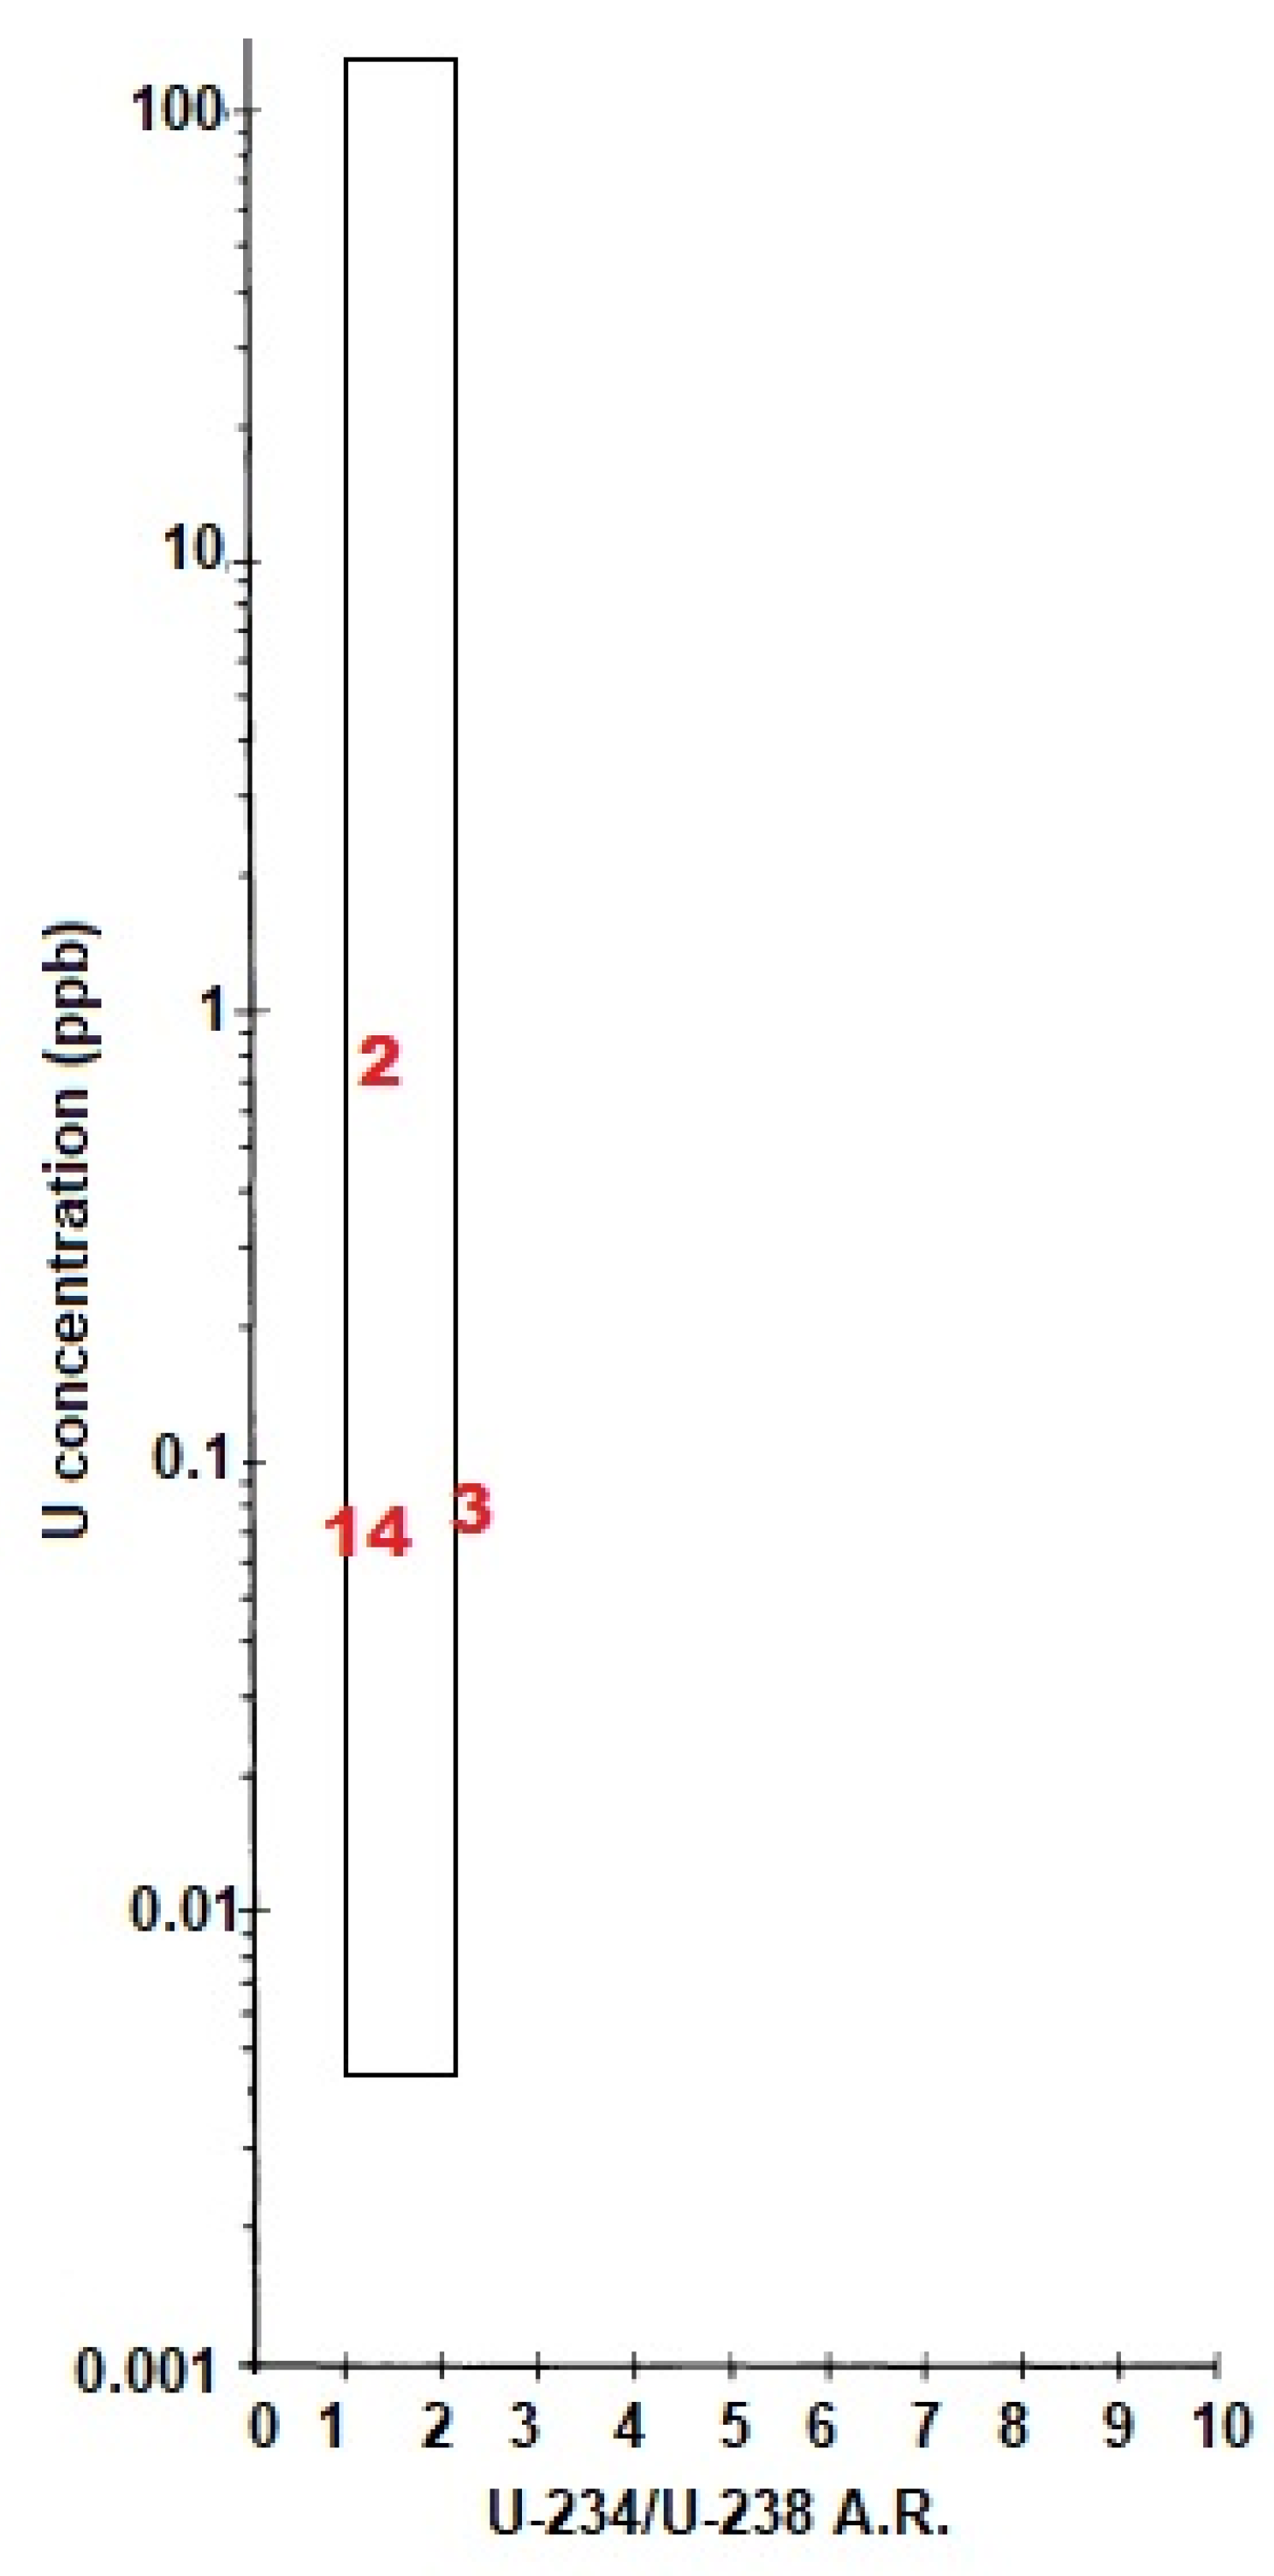
Uranium is an element very sensitive to changes in redox potentials (Eh) and pH. In general terms, if oxidizing conditions prevail, then U leaching tends to occur, but if reducing conditions become dominant after redox fronts, the U precipitation is favored [85]. Worldwide soluble U content generally ranges from 0.1 to 10 µg/L in rivers, lakes, and groundwater [69], within which concentration interval are inserted the results obtained for the blackwaters analyzed in this study (Figure 9). The highest dissolved U concentration corresponding to 0.66 µg/L (or 0.66 ppb) was found for the Itaguaré River blackwater (sample 2), which also exhibits the highest alkalinity value of 64 mg/L. The pH of the blackwaters analyzed indicates that the measured alkalinity is due to the bicarbonate (HCO3), which is a significant anion for transporting uranium into waters in the valence state 6+ (uranyl ion, UO22+) [82].
In terms of 234U/238U activity ratio (AR) data, except for the Una River blackwater at monitoring point 3, the obtained values are between 1 and 2, within experimental errors, which defines a “normal” worldwide situation, as shown in Figure 9. Such ratios greater than unity in the liquid phase are typical during water–soil/rock interactions as a consequence of the preferential chemical dissolution of 234U [86] and alpha-recoil release of 234Th at the rock–water interface [87]. The climate, lithology, stratigraphy, hydrogeological, geochemical conditions, and extent of water–soil/rock interactions are among the factors responsible for the AR value higher than 2 (2.79, Table 2) for the Una River blackwater at monitoring point 3. For instance, some of its tributaries (Cristina River, Pouso Alto River, Água Branca River, Mariano stream, or Silveiras stream) could be contributing to this enhanced AR value. Also, because AR’s values above 2 are very common in groundwater, perhaps some groundwater flow into the Una River would be able to yield such a more elevated ratio.
The radon levels at Una River blackwaters are higher than the value obtained for the Itaguaré River blackwater (Table 2). The mechanisms of radon and uranium transfer to the blackwaters are different, as they are greatly dependent, respectively, on the surface area and depth of etch during the water–rock/soil interactions [71]. The radon release is affected by microscopic properties, such as the network of nanopores, inhomogeneous 226Ra distribution in the solid, or surface roughness in natural systems, which, in general, are difficult/impossible to properly evaluate for the great diversity of rocks and minerals occurring in the study area.
Anyway, the radiometric data reported in this study are a relevant database for further investigations focusing on mixing studies of freshwater with ocean waters and submarine groundwater discharge (SGD), which are research topics beyond the scope of this paper.
Additionally, given the important influence of the ocean backward currents on the hydrochemical composition of the blackwater rivers in the shoreline zone, it must be highlighted that a need for future research focusing on this topic, utilizing all available tools, for instance, the use of machine learning (ML) applications for such a purpose. For instance, Lou et al. [88] reported on the State-of-the-Art and specific practices of ML in ocean data, reviewing the application examples of ML learning in various fields, such as sea waves, by using the neural network approach to estimate wave parameters from the wind field generated by cyclones. Also, Guillou and Chapalain [89] investigated sea level variations in the upper part of the estuary utilizing two types of ML algorithms: (1) the multiple regression methods based on linear and polynomial regression functions, and (2) an artificial neural network, the multilayer perceptron. Therefore, these and other ML approaches may add helpful insights to studies focusing on the interaction of blackwater rivers with ocean waters.

6. Conclusions

Nowadays, blackwater rivers and streams have been recognized as important sources of natural iron fertilization of the coastal ocean, as they tend to be rich in this element in solution due to the chelating properties of humic and fulvic acids, which bind Fe3+ and keep it in solution. This has been supported by experiments indicating that the iron naturally present in blackwater rivers and streams is readily bioavailable to marine algal species, thus constituting a relevant nutrient to marine phytoplankton. The results reported in this paper pointed out:
-
a high level of dissolved iron corresponding to 1.9 mg/L in one blackwater stream monitored at Bertioga municipality, São Paulo State, Brazil, thus contributing to the natural fertilization of the studied shoreline zone;
-
coherent results for such a blackwater stream in terms of color, turbidity, organic matter, organic carbon, biochemical oxygen demand, and phosphate, beyond the iron concentration;
-
strong influence of ocean backward currents on the hydrochemical composition of the Itaguaré River and Una River blackwaters, especially in the lower reaches of the rivers closer to the mouth;
-
accentuated increase in electrical conductivity (EC) and dissolved concentration of sodium, potassium, calcium, magnesium, chloride, sulfate, and, consequently, total dissolved solids in the lower reaches of Itaguaré and Una rivers;
-
possible implications for the blackwater’s use in the cultivation of some crops, as demonstrated by the EC vs. SAR (sodium adorption ratio) diagram for salinity hazard classification.
Therefore, the hydrochemical dataset reported in this paper increases the knowledge related to blackwater rivers and streams in Brazilian coastal zones, which is presently incipient in the country. This is because most of the published data about blackwaters in Brazil has chiefly focused on the Rio Negro in the northern Amazon basin, which is the largest tropical backwater river in the world. Very accentuated tourist activities have been developed at both sites investigated in this paper, the reason for which several conservationists’ efforts in São Paulo State have been made, including the knowledge and integration of a wide range of themes, including the hydrochemical approach reported here.

Author Contributions

Conceptualization, project administration, supervision, funding acquisition, writing, D.M.B.; methodology, formal analysis, writing, M.L.; manuscript revision, A.G. All authors have read and agreed to the published version of the manuscript.

Funding

This research was funded by CNPQ- Conselho Nacional de Desenvolvimento Científico e Tecnológico, grants 304010/2021-9 and 401723/2023-2.

Data Availability Statement

The original contributions presented in the study are included in the article; further inquiries can be directed to the corresponding author.

Acknowledgments

Fábio O. Thomazini, Geology Department, IGCE-UNESP-Campus de Rio Claro, is thanked for technical support during the experiments. Three anonymous reviewers are greatly thanked for their helpful comments that improved the readability of the manuscript.

Conflicts of Interest

The authors declare no conflicts of interest.

References

  1. Smith, C.H. The Alfred Russel Wallace Page. Available online: https://people.wku.edu/charles.smith/wallace/chsarwin.htm (accessed on 10 July 2025).
  2. Raby, P. Alfred Russel Wallace: A Life; Princeton University Press: Princeton, NJ, USA, 2002. [Google Scholar]
  3. Duncan, W.P.; Fernandes, M.N. Physicochemical characterization of the white, black, and clearwater rivers of the Amazon Basin and its implications on the distribution of freshwater stingrays (Chondrichthyes, Potamotrygonidae). Pan-Am. J. Aquat. Sci. 2010, 5, 454–464. [Google Scholar]
  4. Forel, F.A. A new classification of the color types to study the lake waters. Arch. Phys. Nat. Sci./Phys. Nat. Hist. Soc. Geneva 1890, 6, 25. (In French) [Google Scholar]
  5. Ule, W. Determining the water color in lakes: Minor announcements. Justus Perthe’s Geogr. Rep. 1892, 38, 70–71. (In German) [Google Scholar]
  6. Ye, M.; Sun, Y. Review of the Forel-Ule Index based on in situ and remote sensing methods and application in water quality assessment. Environ. Sci. Pollut. Res. 2022, 29, 13024–13041. [Google Scholar] [CrossRef]
  7. Wozniak, S.B.; Meler, J. Modelling water colour characteristics in an optically complex nearshore environment in the Baltic Sea; Quantitative interpretation of the Forel-Ule scale and algorithms for the remote estimation of seawater composition. Remote Sens. 2020, 12, 2852. [Google Scholar] [CrossRef]
  8. Wang, S.; Li, J.; Zhang, W.; Cao, C.; Zhang, F.; Shen, Q.; Zhang, X.; Zhang, B. A dataset of remote-sensed Forel-Ule Index for global inland waters during 2000–2018. Sci. Data 2021, 8, e26. [Google Scholar] [CrossRef]
  9. Hutchinson, G.E. A Treatise on Limnology; Chapman and Hall: London, UK, 1957; Volume 1. [Google Scholar]
  10. Pitarch, J.; Van der Woerd, H.J.; Brewin, R.J.W.; Zielinski, O. Optical properties of Forel-Ule water types deduced from 15 years of global satellite ocean color observations. Remote Sen. Environ. 2019, 231, e111249. [Google Scholar] [CrossRef]
  11. Van der Woerd, H.J.; Wernand, M.R. True colour classification of natural waters with medium-spectral resolution satellites: SeaWiFS, MODIS, MERIS and OLCI. Sensors 2015, 15, 25663–25680. [Google Scholar] [CrossRef] [PubMed]
  12. Nichol, J.E. Remote sensing of tropical blackwater rivers: A method for environmental water quality analysis. Appl. Geogr. 1993, 13, 153–168. [Google Scholar] [CrossRef]
  13. Lehmann, M.K.; Nguyen, U.; Allan, M.; Van der Woerd, H.J. Colour classification of 1486 lakes across a wide range of optical water types. Remote Sens. 2018, 10, 1273. [Google Scholar] [CrossRef]
  14. Gardner, J.R.; Yang, X.; Topp, S.N.; Ross, M.R.V.; Altenau, E.H.; Pavelsky, T.M. The color of rivers. Geophys. Res. Lett. 2021, 48, e2020GL088946. [Google Scholar] [CrossRef]
  15. Lai, Y.; Zhanf, J.; Li, W.; Song, Y. Water quality monitoring of large reservoirs in China based on water color change from 1999 to 2021. J. Hydrol. 2024, 633, e130988. [Google Scholar] [CrossRef]
  16. Jerome, J.H.; Bukata, R.P.; Whitfield, P.H.; Rousseau, N. Colours of natural waters: 1. Factors controlling the dominant wavelength. Northwest Sci. 1994, 68, 43–52. [Google Scholar]
  17. Marinho, R.R.; Martinez, J.-M.; Oliveira, T.C.S.; Moreira, W.P.; Carvalho, L.A.S.; Moreira-Turcq, P.; Harmel, T. Estimating the colored dissolved organic matter in the Negro River, Amazon Basin, with in situ remote sensing data. Remote Sens. 2024, 16, 613. [Google Scholar] [CrossRef]
  18. Wang, J.; Zhai, Z.; Zhu, Y.; Zhang, L.; Fang, X. Identification for water quality based on color characteristics. IOP Conf. Ser. Earth Environ. Sci. 2022, 983, e012075. [Google Scholar] [CrossRef]
  19. FAO (Food and Agriculture Organization of the United Nations). Blackwater Rivers. Available online: https://agrovoc.fao.org/browse/agrovoc/ar/page/?clang=vi&uri=c_4f5b9967 (accessed on 10 July 2025).
  20. Weatherstem Scholar. Blackwater Rivers. Available online: https://learn.weatherstem.com/modules/learn/lessons/178/20.html (accessed on 10 July 2025).
  21. Flotemersch, J.E.; Blocksom, K.A.; Herlihy, A.T.; Kaufmann, P.R.; Mitchell, R.M.; Peck, D.V. Distribution and characteristics of blackwater rivers and streams of the contiguous United States. Water Resour. Res. 2024, 60, e2023WR035529. [Google Scholar] [CrossRef]
  22. Amazon Waters Alliance. Blackwater Rivers. Available online: https://en.aguasamazonicas.org/waters/river-types/blackwater-rivers (accessed on 10 July 2025).
  23. Anwana, E.D.; Ogbemudia, F.O.; Ita, R.E.; Sunday, P.E. Influence of hydrological variables on macrophytes in a black water river ecosystem. J. Appl. Sci. Envir. Manag. 2021, 25, 151–158. [Google Scholar] [CrossRef]
  24. Thieme, M.L.; Abell, R.; Stiassny, M.L.; Skelton, P.; Lehner, B.; Teugels, G.G. Freshwater Ecoregions of Africa and Madagascar: A Conservation Assessment; Island Press: Washington, DC, USA, 2005. [Google Scholar]
  25. Alkhatib, M.; Jennerjahn, T.C.; Samiaji, J. Biogeochemistry of the Dumai River estuary, Sumatra, Indonesia, a tropical black-water river. Limno. Oceanogr. 2007, 52, 2410–2417. [Google Scholar] [CrossRef]
  26. Britannica. Black River. Available online: https://www.britannica.com/place/Vietnam (accessed on 10 July 2025).
  27. Grzybkowska, M.; Temech, A.; Dukowska, M. Impact of long-term alternations of discharge and spate on the chironomid community in the lowland Widawka River (Central Poland). Hydrobiologia 1996, 324, 107–115. [Google Scholar] [CrossRef]
  28. Heikkinen, K. Organic matter, iron and nutrient transport and nature of dissolved organic matter in the drainage basin of a boreal humic river in northern Finland. Sci. Total Environ. 1994, 152, 81–89. [Google Scholar] [CrossRef]
  29. Benke, A.C.; Wallace, J.B. High secondary production in a Coastal Plain river is dominated by snag invertebrates and fueled mainly by amorphous detritus. Freshw. Biol. 2015, 60, 236–255. [Google Scholar] [CrossRef]
  30. Meyer, J.L. A blackwater perspective on riverine ecosystems. BioScience 1990, 40, 643–651. [Google Scholar] [CrossRef]
  31. Zampella, R.A.; Laidig, K.J.; Lowe, R.L. Distribution of diatoms in relation to land use and pH in blackwater Coastal Plain streams. Env. Mgmt. 2007, 39, 369–384. [Google Scholar] [CrossRef]
  32. Zampella, R.A.; Bunnell, J.F.; Procopio, N.A.; Bryson, D.E. Macroinvertebrate assemblages in blackwater streams draining forest land and active and abandoned cranberry bogs. Wetlands 2008, 28, 390–400. [Google Scholar] [CrossRef]
  33. Ríos-Villamizar, E.A.; Piedade, M.T.F.; da Costa, J.G.; Adeney, J.M.; Junk, W.J. Chemistry of different Amazonian water types for river classification: A preliminary review. WIT Trans. Ecol. Environ. 2014, 178, 17–28. [Google Scholar]
  34. Vegas-Vilarrúbia, T.; Paolini, J.; Herrera, R. A physico-chemical survey of blackwater rivers from the Orinoco and the Amazon basins in Venezuela. Arch. Hydrobiol. 1988, 111, 491–506. [Google Scholar] [CrossRef]
  35. Horbe, A.M.C.; Santos, A.G.S. Chemical composition of black-watered rivers in the western Amazon region (Brazil). J. Braz. Chem. Soc. 2009, 20, 119–1126. [Google Scholar] [CrossRef]
  36. Küchler, I.L.; Miekeley, N.; Forsberg, B.R. A contribution to the chemical characterization of rivers in the Rio Negro basin, Bazil. J. Braz. Chem. Soc. 2000, 11, 286–292. [Google Scholar] [CrossRef]
  37. Oliveira, L.C.; Botero, W.G.; Santos, F.A.; Sargentini, E., Jr.; Rocha, J.C.; Santos, A. Influence of seasonality on the interaction of mercury with aquatic humic substances extracted from the middle Negro River basin (Amazon). J. Braz. Chem. Soc. 2012, 23, 1711–1718. [Google Scholar] [CrossRef]
  38. Por, F.D.; Shimizu, G.Y.; Prado-Por, M.S.A.; Tòha, F.A.L.; Oliveira, I.R. The blackwater river estuary of Rio Una do Prelado (São Paulo, Brazil): Preliminary hydrobiological data. Rev. Hydrobiol. Trop. 1984, 17, 215–258. [Google Scholar]
  39. Fraley, K.M.; Haynes, T.B.; López, J.A. Under-ice population density estimation of Alaska Blackfish. N. Am. J. Fish. Manag. 2018, 38, 454–461. [Google Scholar] [CrossRef]
  40. Largier, J.L. Structure and mixing in the Palmiet estuary, South Africa. Afr. J. Mar. Sci. 1986, 4, 139–152. [Google Scholar] [CrossRef]
  41. Benedetti, M.M.; Raber, M.J.; Smith, M.S.; Leonard, L.A. Mineralogical indicators of alluvial sediment sources in the Cape Fear River Basin, North Carolina. Phys. Geogr. 2006, 27, 258–281. [Google Scholar] [CrossRef]
  42. Clair, T.A.; Freedman, B. Patterns and importance of dissolved organic carbon in four acidic brownwater streams in Nova Scotia, Canada. Water Air Soil Pollut. 1986, 31, 139–147. [Google Scholar] [CrossRef]
  43. Stahle, D.W.; Cleaveland, M.K.; Hehr, J.G. A 450-year drought reconstruction for Arkansas, United States. Nature 1985, 316, 530–532. [Google Scholar] [CrossRef]
  44. McKinley, T.R. Survey of Northern Pike in Lakes of Soldotna Creek Drainage, 2002; Alaska Department of Fish and Game, Division of Sport Fish, Research and Technical Services: Juneau, AK, USA, 2013. [Google Scholar]
  45. Waldo, A.J. Operational Plan: Crooked Creek Chinook Salmon Enhancement Project, 2019–2021; Alaska Department of Fish and Game, Regional Operational Plan ROP: Soldotna, AK, USA, 2019; Volume 2. [Google Scholar]
  46. American Rivers. Blackwater River Named Among America’s most Endangered Rivers of 2024. Available online: https://www.americanrivers.org/media-item/blackwater-river-named-among-americas-most-endangered-rivers-of-2024/ (accessed on 10 July 2025).
  47. Krachler, R.; Krachler, R.; Valda, A.; Keppler, B.K. Natural iron fertilization of the coastal ocean by “blackwater rivers”. Sci. Total Environ. 2019, 656, 952–958. [Google Scholar] [CrossRef]
  48. Bertioga City Hall. Facts of Bertioga. Available online: https://conhecabertioga.webnode.page/ (accessed on 10 July 2025). (In Portuguese).
  49. IBGE (Brazilian Geographical and Statistical Institute). São Sebastião Data. Available online: https://cidades.ibge.gov.br/brasil/sp/sao-sebastiao/panorama (accessed on 10 July 2025). (In Portuguese)
  50. SMA (Secretary of Environment, Infrastructure, and Logistics of São Paulo State). State Park Serra do Mar—São Sebastião Nucleus. Available online: https://guiadeareasprotegidas.sp.gov.br/ap/parque-estadual-serra-do-mar-nucleo-sao-sebastiao/ (accessed on 10 July 2025). (In Portuguese)
  51. Forestry Foundation. State Park Restinga of Bertioga. Available online: https://fflorestal.sp.gov.br/parque-estadual-restinga-de-bertioga/ (accessed on 10 July 2025). (In Portuguese)
  52. Ebert, H. Geology of Southern Brazil do Brasil. Meridional; UFRGS (Federal University of Rio Grande do Sul): Porto Alegre, RS, Brazil, 1971. (In Portuguese) [Google Scholar]
  53. Almeida, F.F.M.; Hasui, Y.; Brito Neves, B.B.; Fuck, R.A. Brazilian structural provinces. In Proc. VIII Geology Symposium of Northeast Brazil; SBG (Brazilian Geological Society), Ed.; SBG (Brazilian Geological Society): Campina Grande, Brazil, 1977; pp. 363–391. (In Portuguese) [Google Scholar]
  54. Heilbron, M.; Ribeiro, A.; Valeriano, C.M.; Paciullo, F.; Almeida, J.C.H.; Trow, R.; Tupinambá, M.; Silva, L.G.E. The Ribeira belt. In São Francisco Craton, Eastern Brazil Tectonic Genealogy of a Miniature Continent; Heilbron, M., Cordani, U.G., Alkmin, F., Eds.; Springer: Berlin, Germany, 2017; Volume 1, pp. 277–304. [Google Scholar]
  55. Campos Neto, M.C.; Figueiredo, M.C.H. The Serra do Mar tectonic domain: Pattern of deformation and tectonic evolution of a segment of the Neoproterozoic Ribeira belt, SE Brazil. J. S. Am. Earth Sci. 1995, 8, 235–258. [Google Scholar]
  56. Campos Neto, M.C. Orogenic systems from southwestern Brazil: An approach based on tectonic setting of superposed orogenies. Precambrian Res. 2000, 97, 25–60. [Google Scholar]
  57. IPT(Technological Researches Institute of São Paulo State). Geological Map of São Paulo State; IPT: São Paulo, Brazil, 1981. [Google Scholar]
  58. Almeida, F.F.M.; Hasui, Y. The Precambrian in Brazil; Edgard Blücher: São Paulo, Brazil, 1984. [Google Scholar]
  59. Barreto, G.S. Geology and Tectonics of the Western Portion of São Sebastião Island (SP) and Comparison with Surrounding Continental Areas. Ph.D. Thesis, USP-São Paulo University, São Paulo, Brazil, 2012. (In Portuguese). [Google Scholar]
  60. Ross, J.L.S.; Moroz, I.C. Geomorphological mapping of the coastal plain between Bertioga and São Sebastião channel (SP). Geogr. Dep. Mag. (USP) 1997, 11, 51–66. (In Portuguese) [Google Scholar]
  61. Rossi, M. Factors Shaping the Coastal Landscape: The Guaratuba Basin, São Paulo, Brazil. Ph.D. Thesis, USP-São Paulo University, São Paulo, Brazil, 1999. (In Portuguese). [Google Scholar]
  62. Baraldo, K.B. Characterization and Comparison of Estuaries from Itaguaré and Guaratuba Rivers (Bertioga, SP) Based on Geo-physico-Chemical Parameters, Bathymetry, and Bottom Imaging. Master’s Dissertation, UNESP-São Paulo State University, São Vicente, Brazil, 2018. (In Portuguese). [Google Scholar]
  63. Hina, S.; Zahid, M.; Baloch, I.H.; Pasha, T.S. Water Analysis Handbook, 2nd ed.; Hach Company: Loveland, CO, USA, 1992. [Google Scholar]
  64. Hina, S.; Zahid, M.; Baloch, I.H.; Pasha, T.S. Water Analysis Handbook, 4th ed.; Hach Company: Loveland, CO, USA, 2000. [Google Scholar]
  65. Allison, L.E. Organic carbon. In Methods of Soil Analysis, Part 2; Black, C.A., Ed.; American Society of Agronomy, Inc.: Madison, WI, USA, 1965; pp. 1367–1378. [Google Scholar]
  66. Boyd, C.E. Influence of organic matter on some characteristics of aquatic soils. Hydrobiologia 1970, 36, 17–21. [Google Scholar] [CrossRef]
  67. Durridge. RAD7 Radon Detector-User Manual; Durridge Co., Inc.: Bedford, MA, USA, 2009. [Google Scholar]
  68. Durridge. RAD7—RAD H2O Radon in Water Accessory-Owner’s Manual; Durridge Co., Inc.: Bedford, MA, USA, 2009. [Google Scholar]
  69. Osmond, J.K.; Cowart, J.B. The theory and uses of natural uranium isotopic variations in hydrology. At. Energy Rev. 1976, 14, 621–679. [Google Scholar]
  70. Ivanovich, M.; Harmon, R.S. Uranium Series Disequilibrium: Applications to Environmental Problems, 2nd ed.; Clarendon Press: Oxford, UK, 1992. [Google Scholar]
  71. Bonotto, D.M. Radioactivity in Waters: From England to Guarani; Ed. UNESP: São Paulo, Brazil, 2004. (In Portuguese) [Google Scholar]
  72. Waterloo Hydrogeologic. AquaChem User’s Manual: Water Quality Data Analysis, Plotting & Modeling; Waterloo Hydrogeologic: Waterloo, ON, Canada, 2003. [Google Scholar]
  73. Piper, A.M.A. A graphic procedure in the geochemical interpretation of water-analyses. Trans. Am. Geophys. Union 1944, 25, 914–928. [Google Scholar]
  74. Schoeller, H. Groundwaters; Masson & Cie: Paris, France, 1962. (In French) [Google Scholar]
  75. Gibbs, R.J. Mechanisms controlling world water chemistry. Science 1970, 170, 1088–1090. [Google Scholar] [CrossRef] [PubMed]
  76. van Wirdum, G. Vegetation and Hydrology of Floating Rich-Fens. Ph.D. Thesis, University of Amsterdam, Amsterdam, The Netherlands, 1991. [Google Scholar]
  77. Science Direct. Water Currents. Available online: https://www.sciencedirect.com/topics/agricultural-and-biological-sciences/water-currents (accessed on 10 July 2025).
  78. Bertioga. Tábua de Marés e Solunares. Available online: https://tabuademares.com/br/so-paulo/bertioga (accessed on 10 August 2025). (In Portuguese).
  79. São Sebastião. Tábua de Marés e Solunares. Available online: https://tabuademares.com/br/so-paulo/sao-sebastiao (accessed on 10 August 2025). (In Portuguese).
  80. Wilcox, L.V. Classification and use of irrigation waters. In USDA Circular No. 969; U.S. Department of Agriculture: Colorado Springs, CO, USA, 1955. [Google Scholar]
  81. USSL (U.S. Salinity Laboratory Staff). Diagnosis and improvement of saline and alkali soils. In Handbook No. 60; U.S. Department of Agriculture: Colorado Springs, CO, USA, 1954. [Google Scholar]
  82. Mirabbasi, R.; Mazloumzadeh, S.M.; Rahnama, M.B. Evaluation of irrigation water quality using Fuzzy Logic. Res. J. Environ. Sci. 2008, 2, 340–352. [Google Scholar]
  83. Lyerly, P.J.; Longenecker, D.E. Salinity control in irrigation and agriculture. Tex. Agric. Ext. Serv. Bull. 1957, 876, 1–20. [Google Scholar]
  84. Berner, E.K.; Berner, R.A. The Global Water Cycle; Prentice-Hall: Upper Saddle River, NJ, USA, 1987. [Google Scholar]
  85. Langmuir, D. Uranium solution-mineral equilibria at low temperatures with applications to sedimentary ore deposits. Geochim. Cosmochim. Acta 1978, 42, 547–569. [Google Scholar] [CrossRef]
  86. Rosholt, J.N.; Shields, W.R.; Garner, E.L. Isotope fractionation of uranium in sandstone. Science 1963, 139, 224–226. [Google Scholar] [CrossRef]
  87. Kigoshi, K. Alpha-recoil 234Th: Dissolution into water and the 234U/238U disequilibrium in nature. Science 1971, 173, 47–48. [Google Scholar] [CrossRef]
  88. Lou, R.; Lv, Z.; Dang, S.; Su, T.; Li, X. Application of machine learning in ocean data. Multimed. Syst. 2023, 29, 1815–1824. [Google Scholar] [CrossRef]
  89. Guillou, N.; Chapalain, G. Machine learning methods applied to sea level predictions in the upper part of a tidal estuary. Oceanologia 2021, 63, 531–544. [Google Scholar] [CrossRef]
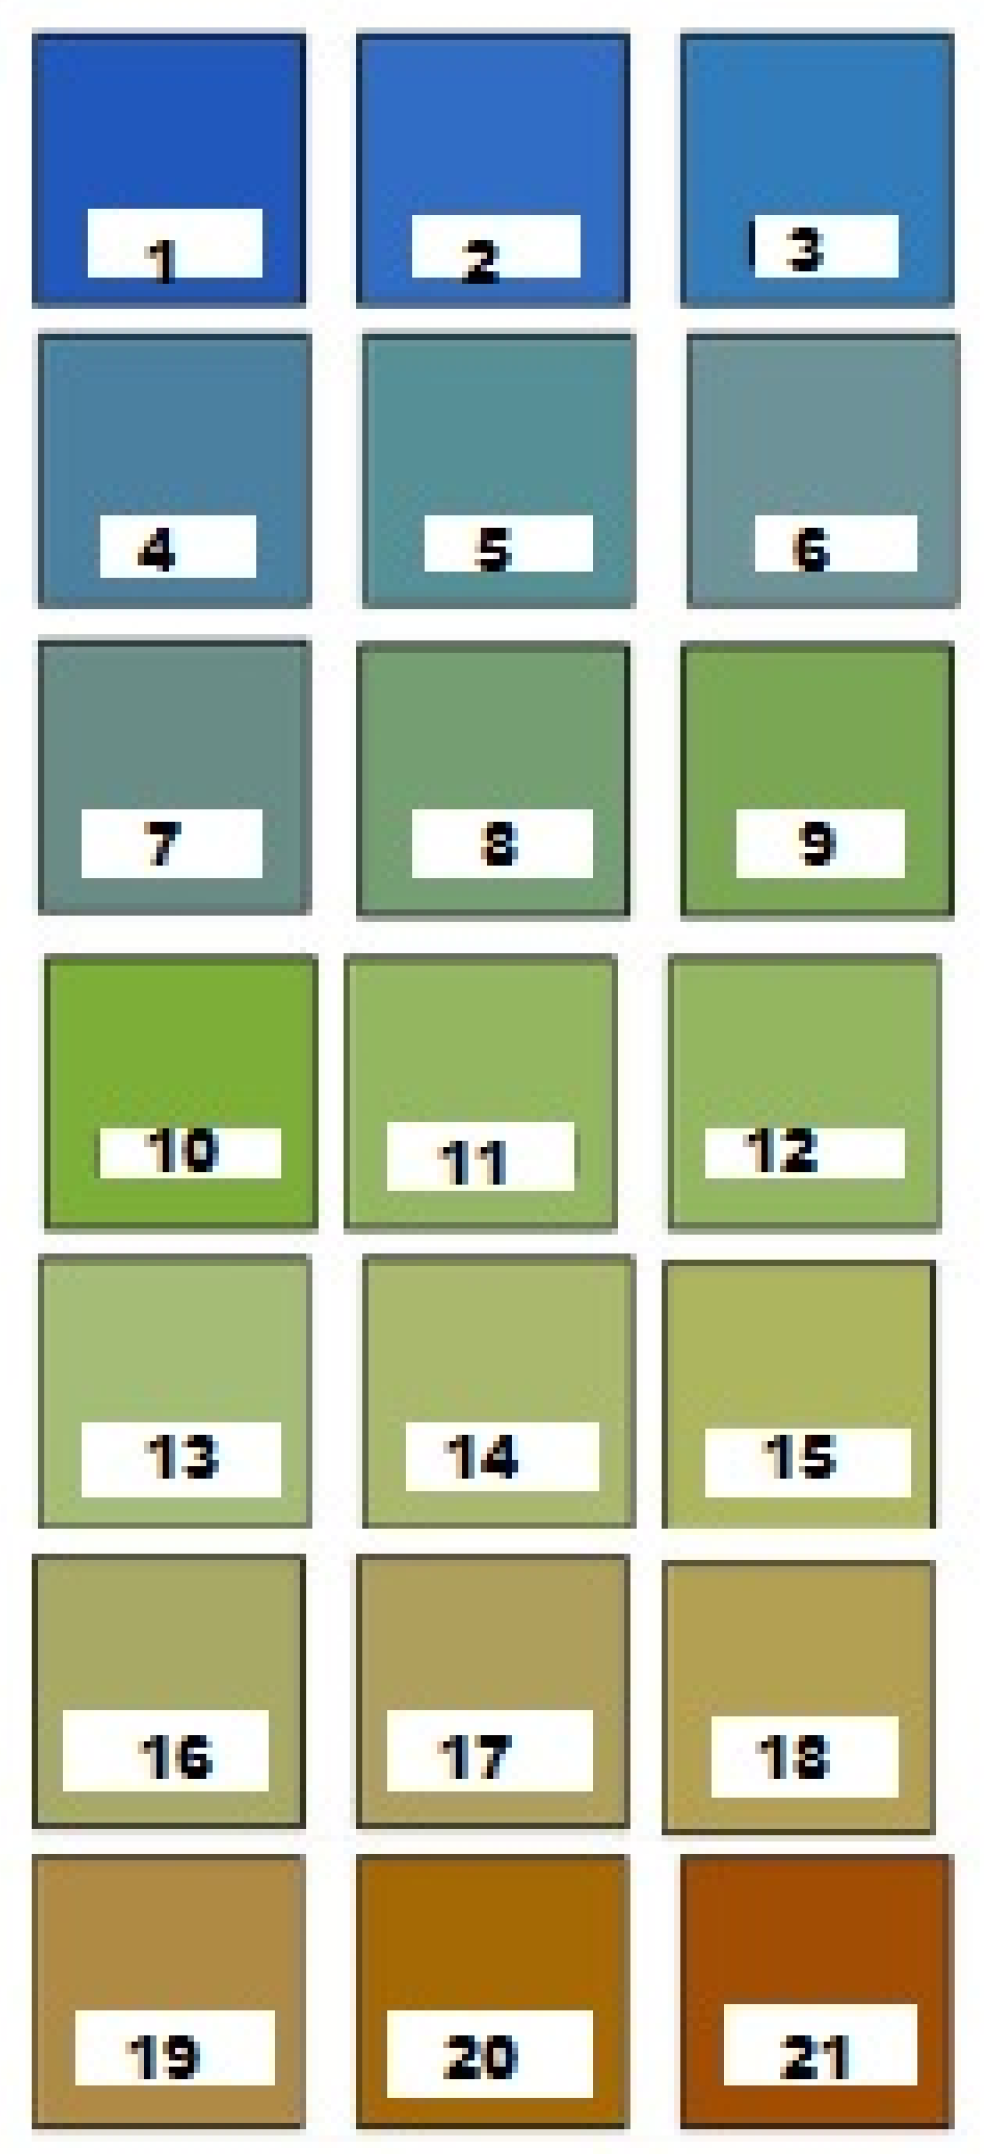
Figure 1. Typical colors representing the Forel-Ule (FU) scale classes. Modified from [7].
Jmse 13 01575 g001
Figure 2. Location of Bertioga and São Sebastião cities, São Paulo State, Brazil. Modified from [48].
Jmse 13 01575 g002
Figure 3. Soil types from the study area and location of the blackwater sampling points. Modified from [57,60,61]. Sample 1 = Riviera stream, Bertioga city; Sample 2 = Itaguaré River, Bertioga city; Sample 3 = Una River, São Sebastião city; Sample 4 = Una River mouth, São Sebastião city.
Jmse 13 01575 g003
Scheme 1. General view of the monitoring point 1 (Riviera stream).
Jmse 13 01575 sch001
Scheme 2. General view of the monitoring point 2 (Itaguaré River).
Jmse 13 01575 sch002
Scheme 3. General view of the monitoring point 3 (Una River).
Jmse 13 01575 sch003
Scheme 4. General view of the monitoring point 4 (Una River).
Jmse 13 01575 sch004
Scheme 5. Filter paper and filtered aliquot of blackwater sample 1 (Riviera stream).
Jmse 13 01575 sch005
Figure 4. Data for major cations and anions of the waters analyzed in this study are plotted in a Piper [73] diagram.
Jmse 13 01575 g004
Figure 5. Data for major cations and anions of the waters analyzed in this study are plotted in a Schoeller [74] diagram.
Jmse 13 01575 g005
Figure 6. Chemical data of the blackwaters analyzed in this study plotted in Gibbs boomerang diagrams [75].
Jmse 13 01575 g006
Figure 7. Chemical data of the blackwaters analyzed in this study are plotted in the ternary van Wirdum diagram [76]. DBS and AJS represent groundwater samples of the Barreiro area, Araxá city, Minas Gerais State, Brazil.
Jmse 13 01575 g007
Figure 8. Data from the waters analyzed in this study are plotted on the US Salinity Laboratory’s diagram for salinity hazard classification [81].
Jmse 13 01575 g008
Figure 9. Data of the waters analyzed in this study (1–4) plotted in the dissolved U concentration vs. 234U/238U activity ratio diagram together with the typical range of results for surface waters as reported by [69].
Jmse 13 01575 g009
Table 1. Summary of the analytical methods, detection limits, and analytical uncertainties.
ParameterUnitAnalytical MethodDetection
Limit
Analytical
Uncertainty
ColorPt-CoColorimetry--
TurbidityFTUColorimetry--
pH-Potentiometry-±0.5%
Electrical conductivityµS/cmConductometry-±1–10%
Suspended solidsmg/LAbsorptometry--
Silicamg/LColorimetry0.45±0.9%
Sodiummg/LFlame photometry0.1±1%
Potassiummg/LFlame photometry0.05±1%
Calciummg/LColorimetry0.02±0.67%
Magnesiummg/LColorimetry0.006±0.4%
Alkalinitymg/LTitration1±1.5%
Chloridemg/LColorimetry0.3±3%
Nitratemg/LColorimetry0.8±4%
Nitritemg/LColorimetry0.0011±1.1%
Sulfatemg/LColorimetry1±1.8%
Phosphatemg/LColorimetry0.01±1%
Total ironmg/LColorimetry0.006±0.6%
Tannin + ligninmg/LColorimetry0.08±1.6%
Organic mattermg/LColorimetry100±0.68%
Organic carbonmg/LWalkley–Black58±0.39%
Biochemical oxygen demandmg/LPotentiometry0.2±2.8%
RadonBq/m3Alpha counting4±40–50%
Uranium (238U)µg/LAlpha spectrometry0.01±10–15%
234U/238U Activity Ratio-Alpha spectrometry-±10–15%
Table 2. Results of the blackwater samples analyzed in this study. Samples 1–4 correspond to those shown in Figure 3.
ParameterUnitSample 1Sample 2Sample 3Sample 4
ColorPt-Co778775933
TurbidityFTU1184118
pH-6.357.305.405.95
EC 1µS/cm102.416,90092.92030
SS 2mg/L221435
TDS 3mg/L10224,157117923
Silicamg/L7.96.69.211
Sodiummg/L12.4943011.5257
Potassiummg/L1.6187.70.8210.1
Calciummg/L2913804999
Magnesiummg/L15258025135
Alkalinity 4mg/L10641016
Chloridemg/L1791008.4330
Nitratemg/L0.801.400.60.6
Nitritemg/L0.820.020.0080.008
Sulfatemg/L<11400<163
Phosphatemg/L0.410.050.100.04
Total ironmg/L1.900.060.330.35
Tannin + ligninmg/L4.47.11.00.6
Organic mattermg/L1700200100<100
Organic carbonmg/L98811658<58
BOD 5mg/L0.570.370.240.39
RadonBq/m393.846.9318544
Uranium (238U)µg/L0.080.660.0750.072
234U/238U AR 6-0.921.172.791.23
1 EC = Electrical conductivity (at 25 °C); 2 SS = Suspended solids; 3 TDS = Total dissolved solids; 4 Alkalinity = Equivalent to bicarbonate due to pH; 5 BOD = Biochemical oxygen demand (5 days, 20 °C); 6 AR = Activity ratio.
Disclaimer/Publisher’s Note: The statements, opinions and data contained in all publications are solely those of the individual author(s) and contributor(s) and not of MDPI and/or the editor(s). MDPI and/or the editor(s) disclaim responsibility for any injury to people or property resulting from any ideas, methods, instructions or products referred to in the content.