Article

Forecasting Ocean Mesoscale Eddies in the Northwest Pacific in a Dynamic Ocean Forecast System

1
Institute of Atmospheric Physics, Chinese Academy of Sciences, Beijing 100029, China
2
College of Earth and Planetary Sciences, University of Chinese Academy of Sciences, Beijing 100049, China
3
Laoshan Laboratory, Qingdao 266237, China
4
School of Marine Science and Technology, Zhejiang Ocean University, Zhoushan 316022, China
5
Centre for Geography and Environmental Science, Department of Earth and Environmental Sciences, Faculty of Environment, Science and Economy, University of Exeter, Penryn TR10 9FE, UK
6
School of Ocean Sciences, China University of Geosciences, Beijing 100083, China
7
Center for Monsoon System Research (CMSR), Institute of Atmospheric Physics, Chinese Academy of Sciences, Beijing 100190, China
8
State Key Laboratory of Geo-Information Engineering, Xi’an 710054, China
*
Author to whom correspondence should be addressed.
J. Mar. Sci. Eng. 2025, 13(8), 1571; https://doi.org/10.3390/jmse13081571
Submission received: 11 July 2025 / Revised: 9 August 2025 / Accepted: 13 August 2025 / Published: 15 August 2025
(This article belongs to the Section Physical Oceanography)

Abstract

The LICOM Forecast System (LFS), a global eddy-resolving ocean forecasting system, provides 1–15-day forecasts of ocean mesoscale eddies (OMEs). This study conducts a comparative analysis of the forecast results against observational data, thereby evaluating the performance of the LFS. Results show that LFS underestimates the number of eddies by ~10% and their amplitude by ~30%, while overestimating eddy radius by ~5% and velocity by ~25%. Forecasted eddies are matched on a one-to-one basis with observed eddies based on distance, ensuring that those forecasted eddies that can locate corresponding counterparts in the observational dataset yield accurate forecasts. The outcomes reveal that the LFS successfully forecasts 63% of the eddies in the NWP. The characteristics of these accurately forecasted eddies are delineated. The findings indicate that eddies with greater amplitudes are more likely to be accurately predicted. Additionally, we further scrutinized the correlation between eddy attributes and forecast performance, revealing that with an increase in amplitude or a decrease in velocity, the LFS produces forecasts with improved locational accuracy. The mean forecast error in eddy position is 79.94 km for a 1-day lead time, which decreases to 70.97 km for eddies with amplitudes exceeding 1 cm and velocities below 1 km/day.

1. Introduction

Mesoscale eddies in the ocean are coherent, rotating water masses with characteristic spatial scales of 50–200 km and lifetimes ranging from weeks to months. These coherent eddies are key drivers of mixing in the upper ocean [1] and contribute to the redistribution of energy [2], impacting both regional [3] and global circulation patterns [4]. Influenced by the beta effect, most eddies propagate westward at a speed close to the classical non-dispersive baroclinic Rossby waves [5]. Based on their different rotational direction and temperature anomalies, OMEs can be classified into cyclonic eddies (CEs) with cold cores and anticyclonic eddies (AEs) with warm cores. The two types of eddies display distinct dynamic characteristics, but the global statistical analysis only reveals a slight preference [6]. For example, CEs tend to have larger amplitudes in the Northern Hemisphere, whereas the opposite is true in the Southern Hemisphere [5,7].
OMEs transport mass, heat, salt, and nutrients [8,9,10,11,12] at significant levels and help track pollutants [13,14]. These transports impact air–sea interactions, such as their effects on wind, clouds, and precipitation [15]. In biogeochemistry, the advection and vertical movements of OMEs influence the distribution of marine phytoplankton, which in turn serves as a basis for higher consumers to select their habitats. For instance, CEs with warm and oxygen-rich water masses are favored by top predators, as opposed to cold CEs [16,17]. The outcomes of all these processes are ultimately reflected in climate and the marine ecological system, therefore giving rise to the demand for forecasts, predictions, and even projections of OMEs’ activities.
Modern ocean forecasting systems integrate high-resolution numerical models starting from the initial state, which assimilates the real-time observational data, to predict oceanic states in the future days or weeks [18,19,20]. Forecasting mesoscale eddies is a key aspect of operational oceanographic research. Like weather forecasts [21], the nonlinear nature of eddy dynamics [5], combined with their sensitivity to initial conditions and complex interaction processes, presents significant challenges for prediction [22]. Moreover, the situation did not improve significantly in some recent predictions using artificial intelligence (AI) models (Wang et al.; Ma et al. [23,24]).
Some studies have attempted to forecast mesoscale eddies using a variety of approaches while also evaluating their predictive skill. Traditional dynamical models remain a cornerstone of ocean prediction, as they allow researchers to interpret forecast results based on model configurations and offer greater flexibility compared to other methods [25]. Xu et al. (2019) [26] successfully reproduced and predicted two AEs in the SCS using the HYCOM, providing detailed analyses of their evolution and dynamics. However, studies of long-term and large-number mesoscale eddy forecasts using dynamical models remain rare. In addition to dynamical models, statistical methods have also been employed to improve mesoscale eddy forecasts. Li et al. (2019) [27] demonstrated the forecasting capabilities of a statistical model for up to four weeks, while Chen et al. (2024) [28] introduced a physics-embedded temporal evolution model, achieving notable improvements in predictive performance.
Given the success of AI in weather and ocean forecasting, machine learning techniques have increasingly been applied to mesoscale eddy forecasts in the ocean. Recent studies have explored AI-based approaches to track and forecast OMEs. For instance, Wang et al. (2020) [23] demonstrated that Long Short-Term Memory (LSTM) networks could achieve four-week predictive abiltities, while Ma et al. (2019) [24] developed a convolutional LSTM model to forecast eddy trajectories. Despite smoother results and higher computational efficiency during products applications, AI-based predictions are typically standalone and lack the ability to provide dynamically consistent predictions of other key oceanic fields, a capability that remains a distinct advantage of traditional dynamical models [29].
Beyond the development of forecasting techniques, a fundamental challenge in forecasting OMEs is determining their theoretical predictability limit. Liu et al. (2024) [30] investigated the predictability of OMEs in the SCS using the nonlinear local Lyapunov exponent (NLLE) method [31], estimating a maximum predictability limit of 52 days for AE tracks and 53 days for CE tracks. These estimates provide valuable references for the upper bounds of mesoscale eddy predictability, yet further studies are needed to refine these estimates across different oceanic regions and seasons.
Despite these advances, a comprehensive, systematic evaluation of the performance of numerical ocean forecast systems in predicting OMEs remains largely absent in the literature. Existing studies have primarily focused on forecasting a limited number of individual eddies [23,27,28] rather than providing a comprehensive assessment of model performance over extended periods. While the statistical characteristics of OMEs simulated by numerical models have been evaluated globally [32] and regionally in the SC through eddy identification and tracking techniques, the validation of eddy forecasts is significantly more challenging. Forecasted eddies must not only be accurately captured by the model but must also match observations in both spatial and temporal dimensions. Addressing this challenge requires a robust framework for systematically assessing the predictive capabilities of numerical ocean models, which remains a gap in current research.
This study systematically evaluates the performance of a numerical ocean forecast system in predicting the OME over the SCS and Northwestern Pacific (NWP) for a global eddy-resolving ocean forecast system called the LICOM forecast system (LFS, [33,34]). We first proposed a matching method depending on the distance between the forecast and observational eddies. Then, a large number of 15-day forecasted eddies during a 1-year period in the NWP were evaluated against the observations, and some regular patterns were revealed. The rest of this paper is organized as follows. The datasets and methods are described in Section 2. The predicted eddies and their features are generally evaluated in Section 3. The evaluation of the forecast results by comparison with observations is detailed in Section 4. Finally, the conclusion and discussion are provided in Section 5.

2. Materials and Methods

2.1. The Forecast Dataset

The LICOM Forecast System (LFS, [33,34]) is a global oceanic environmental forecasting system based on the CAS-LICOM3 [35]. LFS v1.0 adopted the nudging method for data assimilation to obtain initial forecast conditions with the reanalysis data from Mercator Ocean (PSY4 [36]). Global forecast system (GFS) forecast data from the National Centers for Environmental Prediction (NCEP) were employed as atmospheric forces. The horizontal resolution of the LFS is about 0.1° (approximately 10 km) with grid points of 3600 × 2302, and the vertical resolution is 55 levels with 5 m at the uppermost degree. LFS provides forecasts for the marine environment for up to 15 days, encompassing three-dimensional ocean temperature, salinity, currents, sea surface height (SSH), mixed layer depth, etc. The specific details of the currently operational LFS can be found in [33].
In this study, the forecast absolute dynamic topography (ADT) data from LFS v1.0 were used for analysis. The SSH climatology derived from a 30-year (from 1989 to 2018) hindcast experiment was employed to calculate model sea level anomaly (SLA). The ADT output from the forecast system contains mean dynamic topography (MDT) and its variability. The former is the time average of the sea surface referenced to the earth’s geoid, which is equivalent to the SSH climatology since the geoid is a sphere for an ocean model, and the latter can be represented by SLA. This study defines SLA maps as the primary input fields for the eddy identification and tracking algorithms as the difference between ADT and SSH climatology.
S L A = A D T M D T
The study period of the forecast ADT data spanned one year, from 1 December 2021 to 30 November 2022. The output results at a 1/10° resolution were linearly interpolated to a 1/4° grid to better compare with observational data.

2.2. The Observational Dataset

An SLA product was merged daily from multi-satellite altimeters with a 1/4° horizontal resolution and employed for comparisons. This product was derived from the Archiving, Validation, and Interpolating of Satellite Oceanographic (AVISO) altimeter datasets and is distributed by the Copernicus Marine and Environment Monitoring Service (https://data.marine.copernicus.eu/product/SEALEVEL_GLO_PHY_L4_MY_008_047/description, accessed on 5 May 2024). The temporal period of the AVISO data, spanning from 1 December 2021 to 30 November 2022, was employed for reference.

2.3. Eddy Identification and Tracking Algorithms

The identification and tracking of mesoscale eddies in this study were conducted using the Genealogical Evolution Model (GEM, [37]). The basic principles of the model are analogous to the method in [5], which relies on the SLA field for the detection process. A distinction is that Chelton’s method permits multiple extremum points within an eddy, defined as a single connected region enclosed by a closed SLA contour. Still, the GEM only allows for a single extremum point within the eddy. Without altering the identification and tracking algorithms, Meng, Liu, Lin, Ding, and Dong [31] refined the program to expedite the process of eddy identification, resulting in an updated version named GEM-Modification (GEM-M).
However, some parameters or criteria of the method have been changed due to the time series limit and the systematic biases of the model. First, in previous studies, OMEs were identified and tracked over long timescales. Hence, researchers typically retain only those eddies with a lifetime exceeding 28 days to ensure the existence of the tracked eddies [38]. However, due to the limited time range of the forecast data used in this study, all identified eddies were retained to obtain more eddies. Second, unlike previous studies that used an amplitude threshold of 1 cm [32], we chose one of 0.5 cm since with a minimum of 5 consecutive pixels within a contour, a minimum geographic imprint is ensured instead [39].
In addition, the location, amplitude, and radii of the eddies are also output. Every identified OME was assigned a unique identification number to track its identity. Furthermore, we calculate the velocity (V) of eddy movement using the displacement of eddies and their lifetime. It is defined as the eddy’s displacement divided by its lifetime, as follows:
V = S e d d y t l i f e
where S e d d y represents the distance between the genesis and termination locations of the eddy, and t l i f e denotes the eddy’s lifetime. The discussion and analysis in the following sections will point out that the eddy velocity (V) is closely related to the biases in the eddy forecast. V is affected by topography [40], strong currents [10,41], eddy–eddy interaction [42,43], wind stress [44], and so on. Its distribution for both forecast results and observations is shown in Figure 1. For the observations (Figure 1a), the V of most eddies is concentrated below 5 km/day, and the distributions of CEs and AEs are nearly identical, indicating that this property is insensitive to eddy polarity. The LFS reproduces this general pattern but with a lower peak in the distribution.
Based on these, we analyze the calculated property V in a manner similar to other intrinsic eddy properties identified in this study. The spatial distribution and relative errors of V are presented in Section 3.1. To evaluate the spatial distribution of mesoscale properties, we also remap the Lagrangian metrics into 2° × 2° grids following [45].

2.4. Match Forecasts with Observations

To enable a more nuanced discussion, it is necessary to match every forecasted eddy with the observed eddy. In this study, the matching employed the distance between forecasted and observed eddies. The matching method consists of two steps: searching for the closest eddies and eliminating erroneous matches. Firstly, the closest observed eddies were searched for every forecasted eddy within 10 degrees of latitude or longitude. Figure 2a shows the result of this step. A defect arises when more than one forecasted eddy (black dots) is in the vicinity of an observed eddy (white dot). This leads to these forecasted eddies (black dots) being matched with the same observed eddy (white dot), as shown in the black box in Figure 2a. The length of the yellow line represents the distance between the two eddies. In this situation, it is logical that only the closest one meets the conditions. Therefore, the closest forecasted eddy is kept in the second step (Figure 2b). Because the distances of 99% of the matched eddies are within 300 km (Figure 2c), only eddy pairs within 300 km are retained. The two steps are executed on the first day of the eddy’s lifetime, and all the eddy twins are linked together by their identification numbers. The matching remains effective based on the identification number in the following days. For example, if the observed eddy A1 and the forecasted eddy B1 are matched on the first day, they are still considered twins on the following days, provided they appear in either the observations or forecasts. The remaining eddies, including those that failed to match on the first day and eddies that newly emerged on the following days, undergo iterative matching. For the forecast results on the second day, successfully matched eddies from the first day are excluded from the eddy dataset, and the remaining eddies are matched to identify new twin pairs. The same procedure is applied iteratively for each subsequent day.
Moreover, we practically tested that starting from the observed eddies to find the closest forecasted eddies and then eliminating erroneous matches generates the same results as starting from the forecasted eddies to find the closest observed eddies and then eliminating erroneous matches.
After matching observed eddies with forecasted eddies, all eddies can be categorized into three groups: matched eddies, unmatched eddies in the observations, and unmatched eddies in the forecast results. The location distance between matched eddies is statistically analyzed, as shown in Figure 3c, with 99% of the matched eddies being within a distance of 300 km from each other. To minimize the misrepresentation of the overall statistical results by a few samples, only eddy pairs within a distance of 300 km are retained. These matched eddies are considered to be correctly predicted by the forecast system. Here, the correct rate of the forecast can be defined as
p c o r r e c t = n m n a × 100 %
where n m represents the number of matched eddies, and n a represents the total number of eddies in the satellite observations. A “missing forecast eddy” is defined as an observed eddy that did not participate in the matching, while a “false forecast eddy” is defined as a forecast eddy that did not participate in the matching. Consequently, the missing rate and false rate are defined as
p m i s s i n g = n a n m n a × 100 %
p f a l s e = n l n m n l × 100 %
where n l denotes the total number of eddies in the forecast results.
To evaluate the spatial distribution of mesoscale properties, we remap the Lagrangian metrics into 2° × 2° grids. The distribution maps processed into 3° × 3° and 1° × 1° grids were tested in a previous study but did not influence the evaluations of spatial distributions [45]. The spatial pattern correlation coefficient (SPCC) is employed to evaluate the forecasting ability. The corresponding equation is as follows:
S P C C = i = 1 n ( O B S i O B S ¯ ) ( M O D i M O D ¯ ) i = 1 n ( O B S i O B S ¯ ) 2 i = 1 n ( M O D i M O D ¯ ) 2
where O B S and M O D represent the observations and forecast results, while O B S ¯ and M O D ¯ represent the means.

2.5. Region Selection

To more specifically assess the local characteristics of the forecast results, four typical eddy-rich regions in the NWP are given special attention: Western South China Sea (WSCS, 7°–16° N, 110°–114° E), Northeastern South China Sea (NESCS, 16°–22° N, 114°–120° E), Subtropical Countercurrent Region (STCC, 18°–24° N, 125°–150° E), and Kuroshio Extension Region (KE, 30°–42° N, 145°–160° E), denoted as regions A to D in Figure 3, respectively. These four regions exhibit relatively high standard deviation (STD) of SLA both in the AVISO and the forecasts (Figure 3), which is commonly used to measure the magnitude of mesoscale variability in the ocean [46,47]. However, the mechanisms of eddy origins and terminations differ among these four regions. The SCS, encompassing regions A and B, is a hotspot for mesoscale eddy activity, driven by the interplay of monsoons, the KE, and regional topography [48,49]. Region C, located in the STCC, stands out with elevated variability, as the necessary conditions for baroclinic instability are more readily satisfied compared to its surroundings [50]. The KE (region D) belongs to the western boundary current (WBC) extensions, a region considered to be occupied by strong and persistent ocean currents [46]. Despite differing mechanisms, all four regions exhibit active mesoscale eddies. Apart from these regions, the remaining areas of the NWP are considered eddy-poor regions. The inclusion of such diverse regions enhances the robustness and generality of the analysis, offering a more comprehensive framework for evaluating the dynamics under investigation.

3. Results

3.1. Overview of the Forecast Result

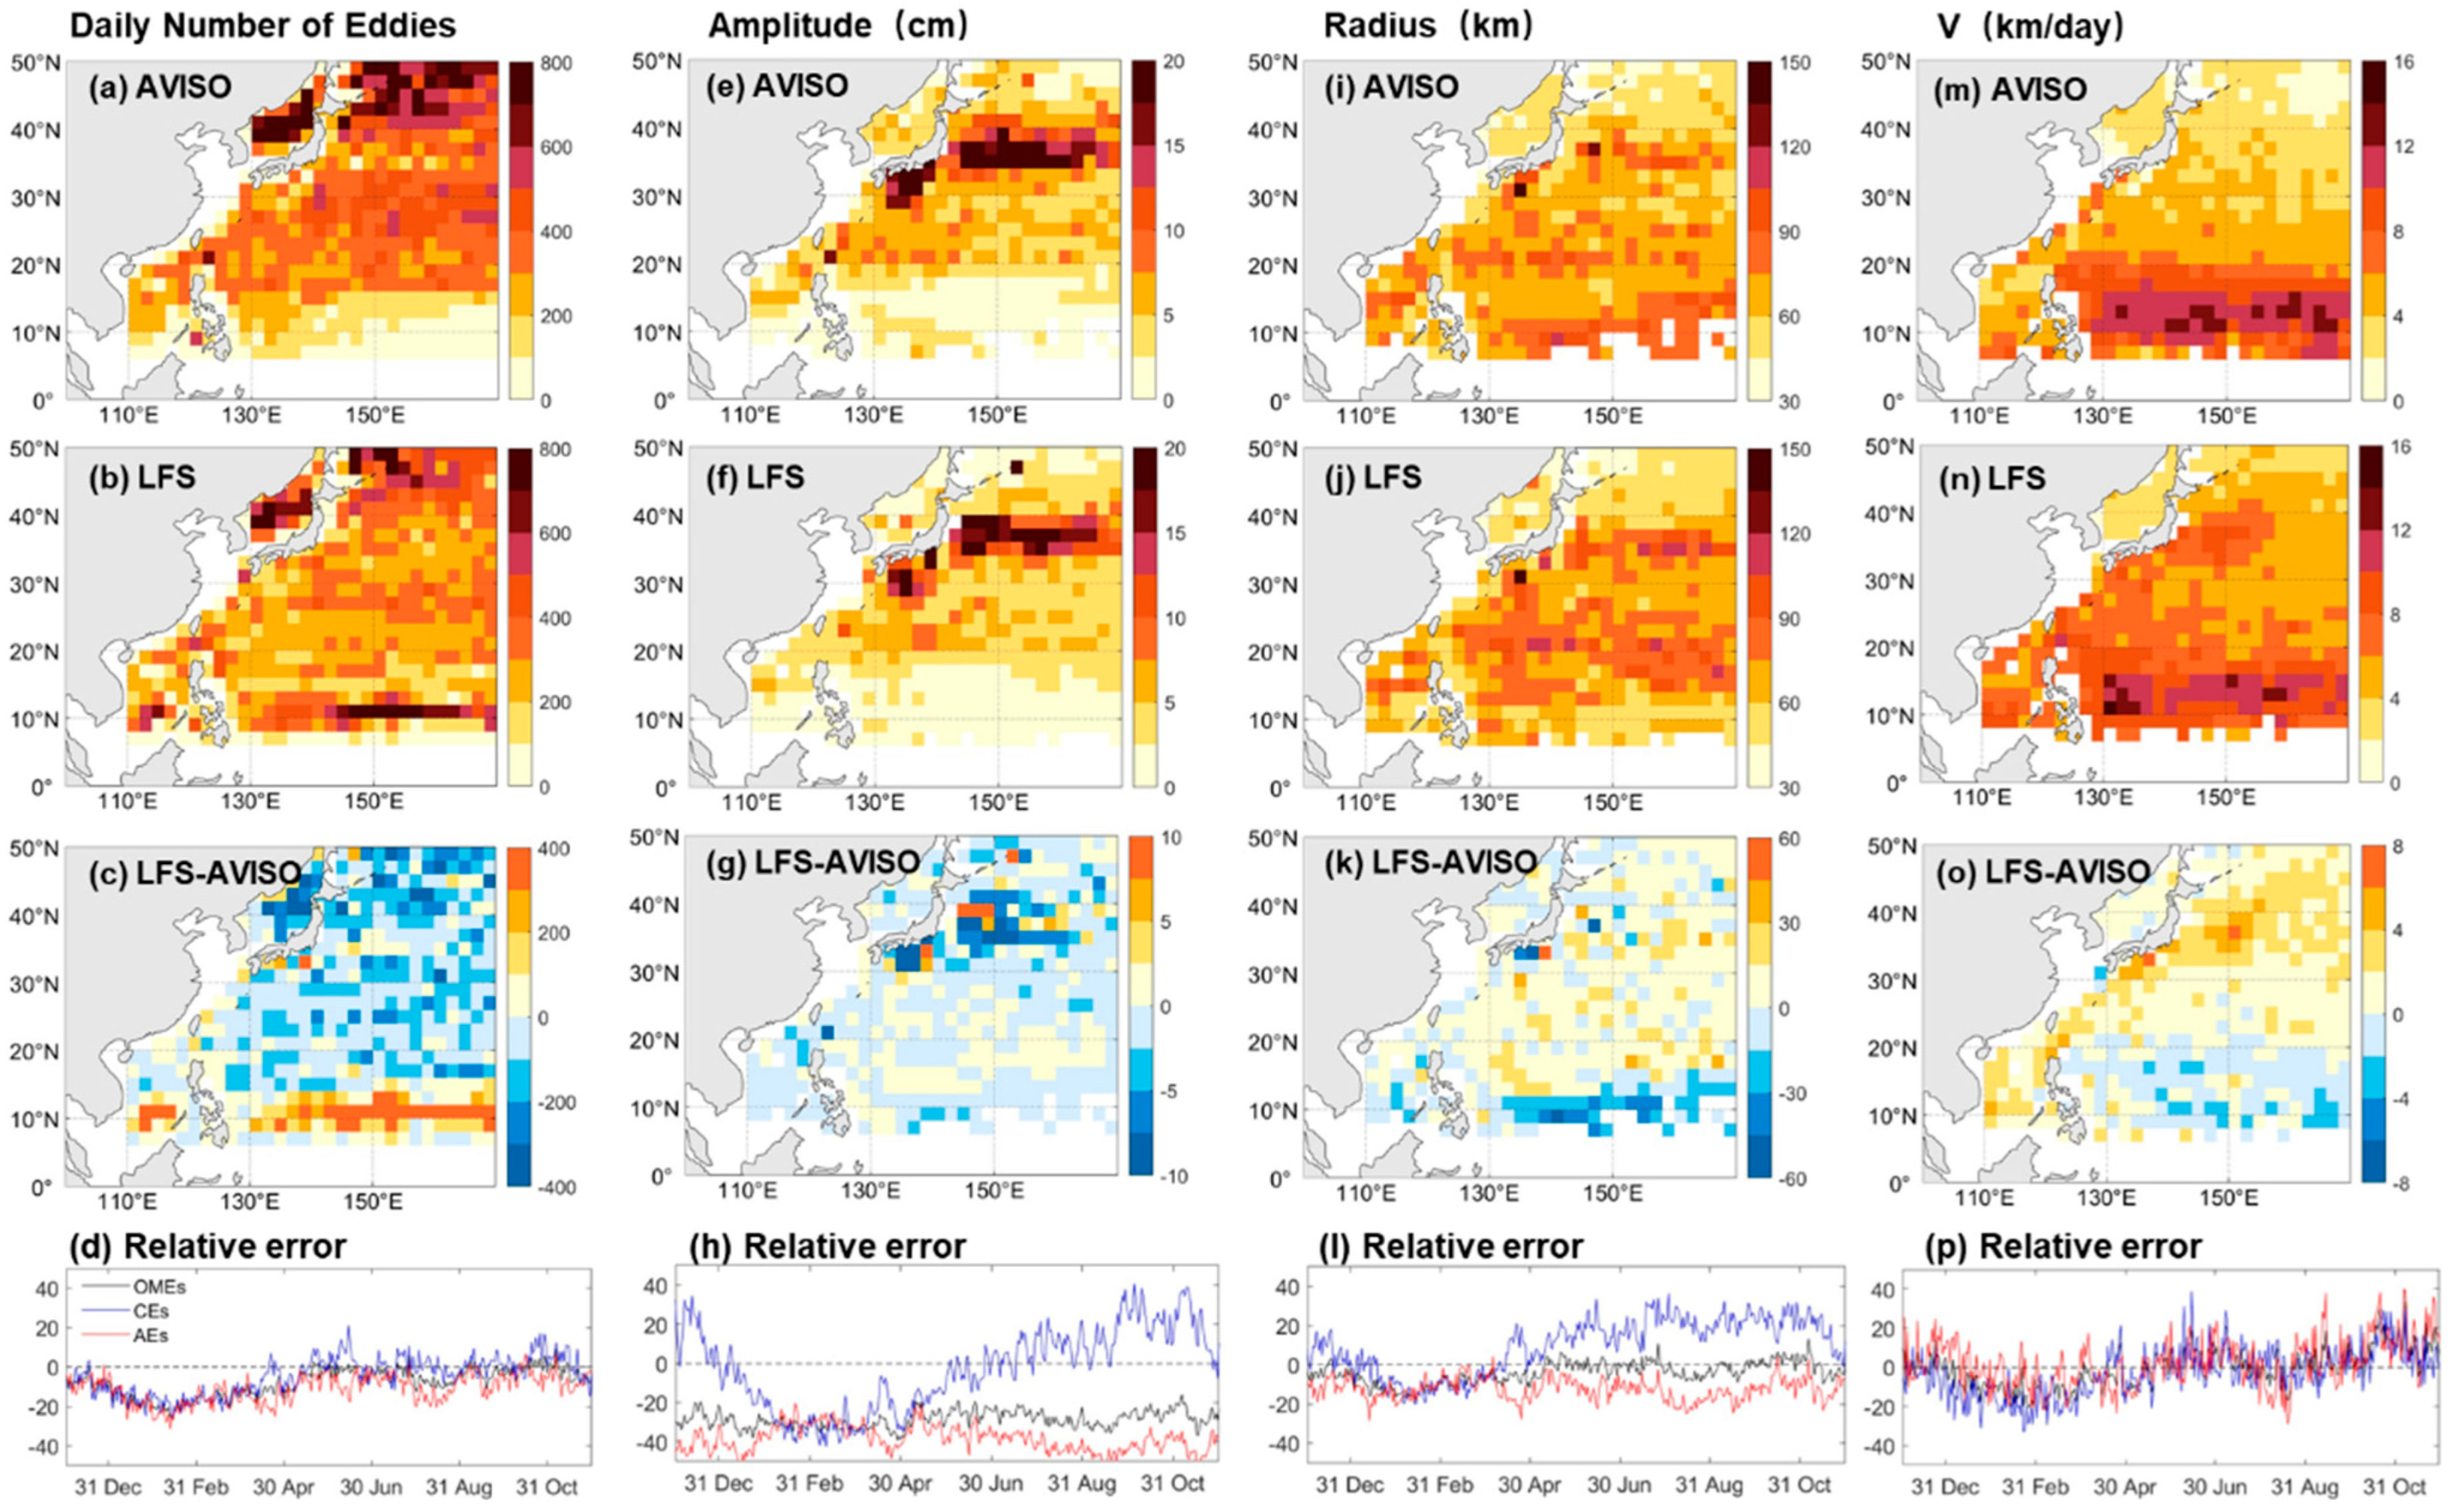
This section provides a comprehensive evaluation of forecasted eddies and their characteristics. The spatial distribution of eddy occurrence exhibits clear latitudinal dependence in both observations and forecasts (Figure 4a,b). In general, the number of detected eddies increases with latitude, a pattern that is well captured by LFS (Figure 4b). However, the model overpredicts eddy occurrence around 10° N while underestimating it at higher latitudes (Figure 4c). The difference around 10° N is likely due to the presence of more short-lived eddies in this region, which tend to evolve more slowly in the model due to sub-grid parameterizations and are thus more likely to be captured by the identification algorithm. This underestimation is concentrated from December to May, while the daily number of eddies forecasted aligns closely with observations during the rest of the year (Figure 4d). Quantitatively, the average daily number of eddies forecast at a lead time of 1 day is 8% lower than observed, calculated from 423 and 388 (Table 1).
The spatial distribution of eddy amplitude in satellite observations closely follows the pattern of SLA variability (Figure 3), with larger amplitudes observed in the KE region. The forecasted amplitude from LFS is in good spatial agreement with observations but is underestimated by approximately 22% (Figure 4e–g). This underestimation does not exhibit an expected seasonal variation (black line in Figure 4h). Instead, discrepancies arise between CEs and AEs, with relative errors differing for most of the year, except from January to April. This pattern is consistent with the time series of relative errors in eddy radius, suggesting that seasonal variability modulates the manifestation of physical processes governing mesoscale eddies in the NWP [11,51].
In contrast to eddy number and amplitude, the mean radius of forecasted eddies is slightly overestimated by approximately 4% (Figure 4i–k), indicating relatively better forecasting ability. This may be because eddy radius is largely constrained by slowly varying parameters (e.g., Coriolis parameter, mean flow, and Rossby deformation radius), which are better resolved by the model. On the other hand, amplitude is more affected by rapidly varying processes and is more susceptible to numerical damping, leading to lower forecast accuracy. The movement and size of mesoscale eddies are strongly influenced by the background circulation [10,41], particularly in the western boundary regions [5]. While the radius exhibits temporal variations similar to eddy amplitude, the difference in relative error between CEs and AEs is less pronounced (Figure 4l).
The highest velocity of eddy movement, V, is observed within 10°–15° N (Figure 4m) in observations. LFS generally captures this distribution but exhibits regional biases. Specifically, the forecasted V is overestimated in the Kuroshio and its extension regions but underestimated in the tropical western Pacific (Figure 4o). The positive bias in the Kuroshio region may primarily result from overly strong viscosity in the model, which enhances jet–eddy interactions and leads to faster eddy propagation. Other factors may also be involved, such as an overrepresentation of baroclinic instability, insufficient sub-grid turbulence parameterization, or exaggerated jet–eddy interactions, all of which can modulate mesoscale energy transfer and propagation characteristics. In observations, V does not exhibit spatial characteristics directly associated with the Kuroshio. However, in the forecast results, LFS simulates this spatial characteristic (Figure 4n), which may be related to the inherent bias in the simulation of the Kuroshio itself. Unlike eddy amplitude and radius, the difference in relative error between CEs and AEs is not apparent; the red and blue curves are hard to distinguish in Figure 4p.
The comparisons in the previous text are conducted between observations and forecasts at a lead time of 1 day. The differences between various lead days are small, and the overestimation or underestimation of eddy features by LFS remains consistent at lead times of 2 to 15 days. Table 1 presents more quantitative results, and the spatial distribution for a lead time of 5 days is displayed in Figure S2.
Overall, LFS effectively captures the mesoscale activity across most regions of the NWP, as reflected in the daily number, amplitude, radius, V (Figure 4 and Table 1), and the STD of SLA (Figure 3). However, the predicted STD of SLA is weaker than that observed, particularly in eddy-rich regions. The observed mean STD in NWP is 0.042 m, while the forecasted value is 0.032 m—indicating an underestimation of 24%. In eddy-rich regions, the underestimation is even more pronounced with observed and forecasted STDs of 0.143 m and 0.117 m, respectively. This systematic underestimation of mesoscale variability is consistent with simulations from LICOM3.0 [32], which serves as the oceanic component of LFS. This can be linked to the forecast of mesoscale eddy properties. A higher number of eddies and larger amplitudes imply greater SLA variability. In the LFS results, both the number and amplitude are underestimated, particularly the amplitude (black line in Figure 4h). Despite these discrepancies, the predictive ability of LFS in capturing oceanic mesoscale processes remains robust, as indicated by the SPCC, which is 0.67 for a lead time of 1 day and 0.65 for a lead time of 5 days.

3.2. Matched Eddies

After the overview analysis in the Euler framework, the forecasted and observed individual eddies were compared with those in the Lagrangian framework. Thus, the characteristics of correct, missing, and false eddies were collected and analyzed. Eddies from AVISO were divided into correct and missing eddies, while eddies from LFS were divided into correct and false eddies. As shown in Figure 5, the spatial distribution of the number of correct and missing forecast eddies increasing with latitude is similar to that of the total observed eddies (Figure 4), but the former has a smaller quantity. About 63% of the observed eddies (approximately 93,721 eddies for one day) were correctly forecast by LFS, while 37% (approximately 55,088 eddies) were missed. This number is close to the global climatological negative bias (~30%) in eddy number reported for CAS-LICOM3 [31], although the two metrics are based on different premises—the former reflects a global bias, while the latter refers to a regional correct rate after eddy matching. Clearly, given the smaller bias in eddy number (Table 1) and the higher foreseeable capture rate, the results in this study exhibit better performance. The spatial distribution of the number of false eddies is different, with denser eddies distributed south of 15°N latitude and a more uniform distribution of fewer eddies in the north. This phenomenon is associated with LFS forecasting a greater number of eddies in the tropics (Figure 4b,c). Generally, 31% of the forecasted eddies (about 42,612 eddies for one day) are false compared to an observed pair.
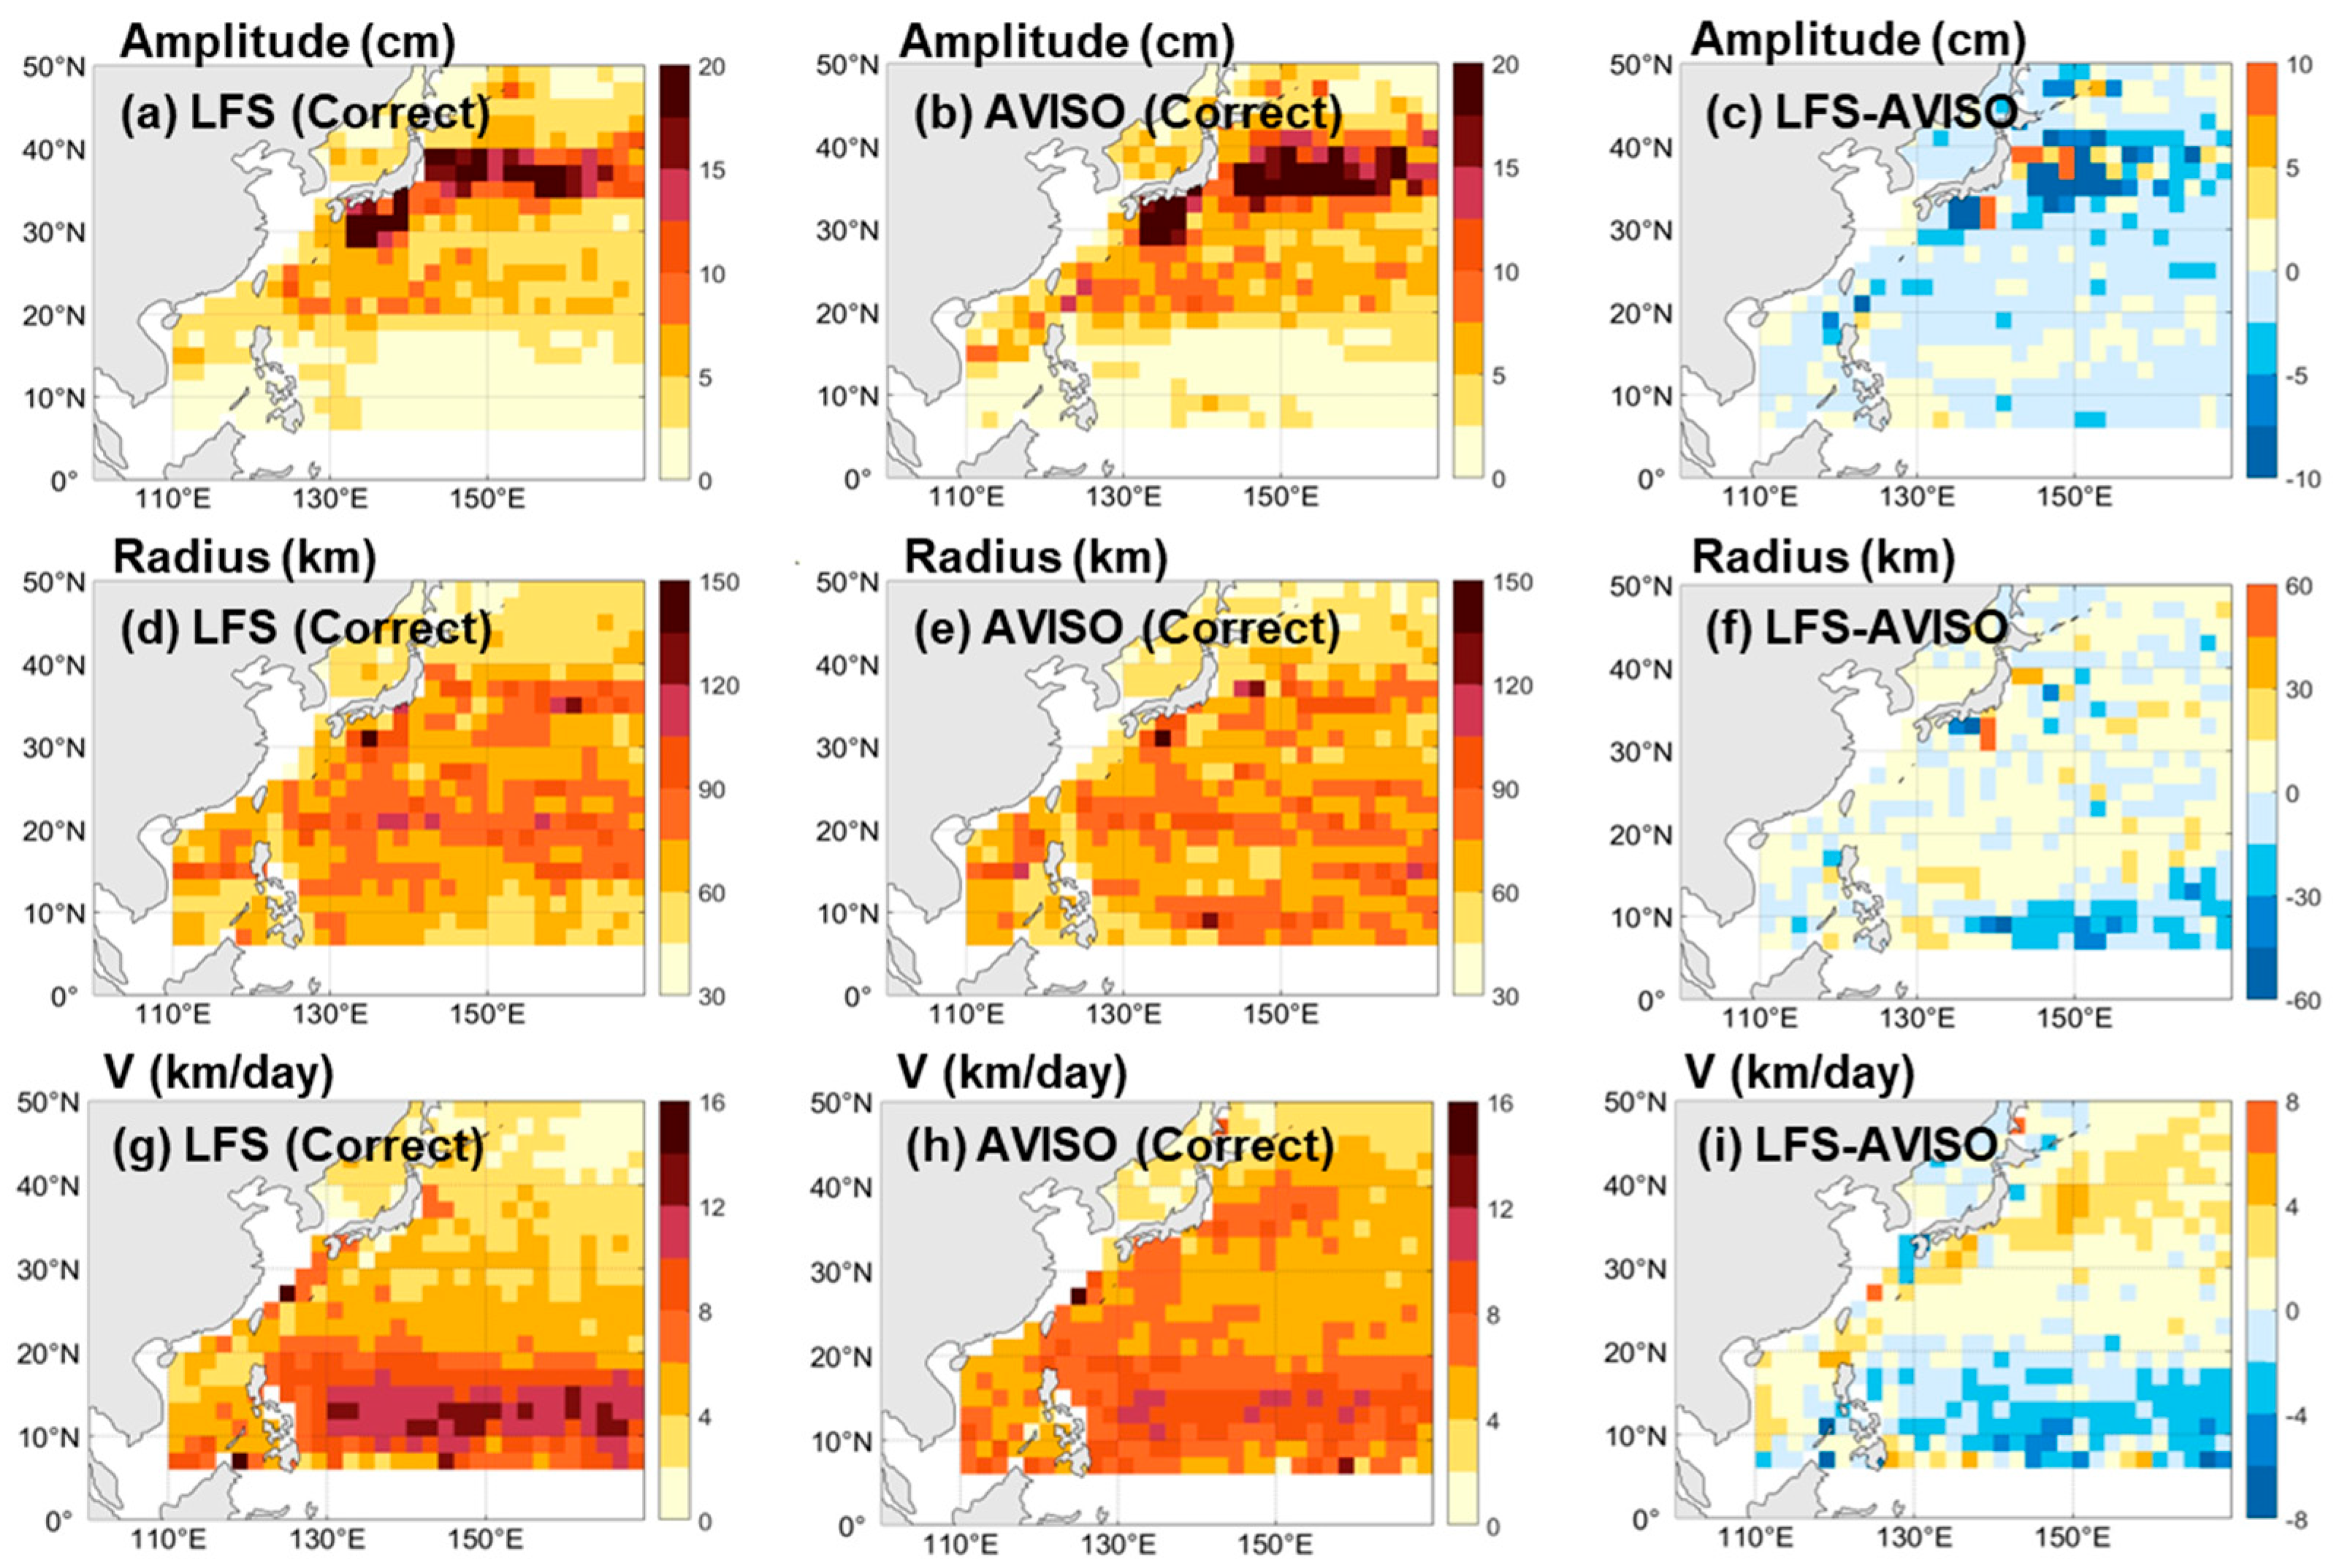
The matched eddies (or correctly forecasted eddies) at a lead time of 1 day exhibit the same number in both observations and simulations, as a one-to-one correspondence is required. However, the amplitudes, radius, and V of these matched eddies differ (Figure 6). The characteristics of the correct eddies, whether derived from LFS or AVISO, are similar to those of all eddies shown in Figure 4, indicating that the spatial distribution of the mean errors in amplitude, radius, and V remains unchanged throughout the matching process. The results for a lead time of 5 days (shown in Figure S3) are consistent with those at a 1-day lead time (Figure 6). The primary difference between the overall observed mesoscale eddies (Figure 4) and the correctly matched eddies (Figure 6) lies in the mean value of their respective features. The amplitude, radius, and V before and after matching provide insight into the relative sizes. Correctly matched eddies generally have larger amplitudes and radii in most regions, but exhibit no clear preference in terms of velocity (Figure S4).
The comparison above demonstrates that, whether for matched eddies (Figure 6) or unmatched eddies (Figure 4), the OMEs predicted by LFS generally exhibit smaller amplitudes and larger radii in most regions. This suggests a negative simulation bias in amplitude and a positive bias in radius. In addition, the comparison between matched and unmatched eddies (false/missing eddies), which is related to the preference of the LFS forecast, is also important.
The overall mean values are calculated. The mean amplitude and mean radius of correctly predicted AVISO eddies are 6.67 cm and 66.49 km, respectively—18% and 6% larger than the mean values for all AVISO eddies (Table 1). Similarly, the mean amplitude and mean radius of correctly predicted LFS eddies at a 1-day lead time are 5.26 cm and 68.39 km, which are 19% and 4% larger than those of all LFS eddies. In contrast, the mean V of the correctly matched eddies is slower than that of all eddies, with a 1% reduction for AVISO (4.31 km/day versus 5.18 km/day) and a 5% reduction for LFS (4.37 km/day versus 5.45 km/day). Therefore, stronger eddies with slightly larger sizes and slower speeds appear to be easier to forecast.
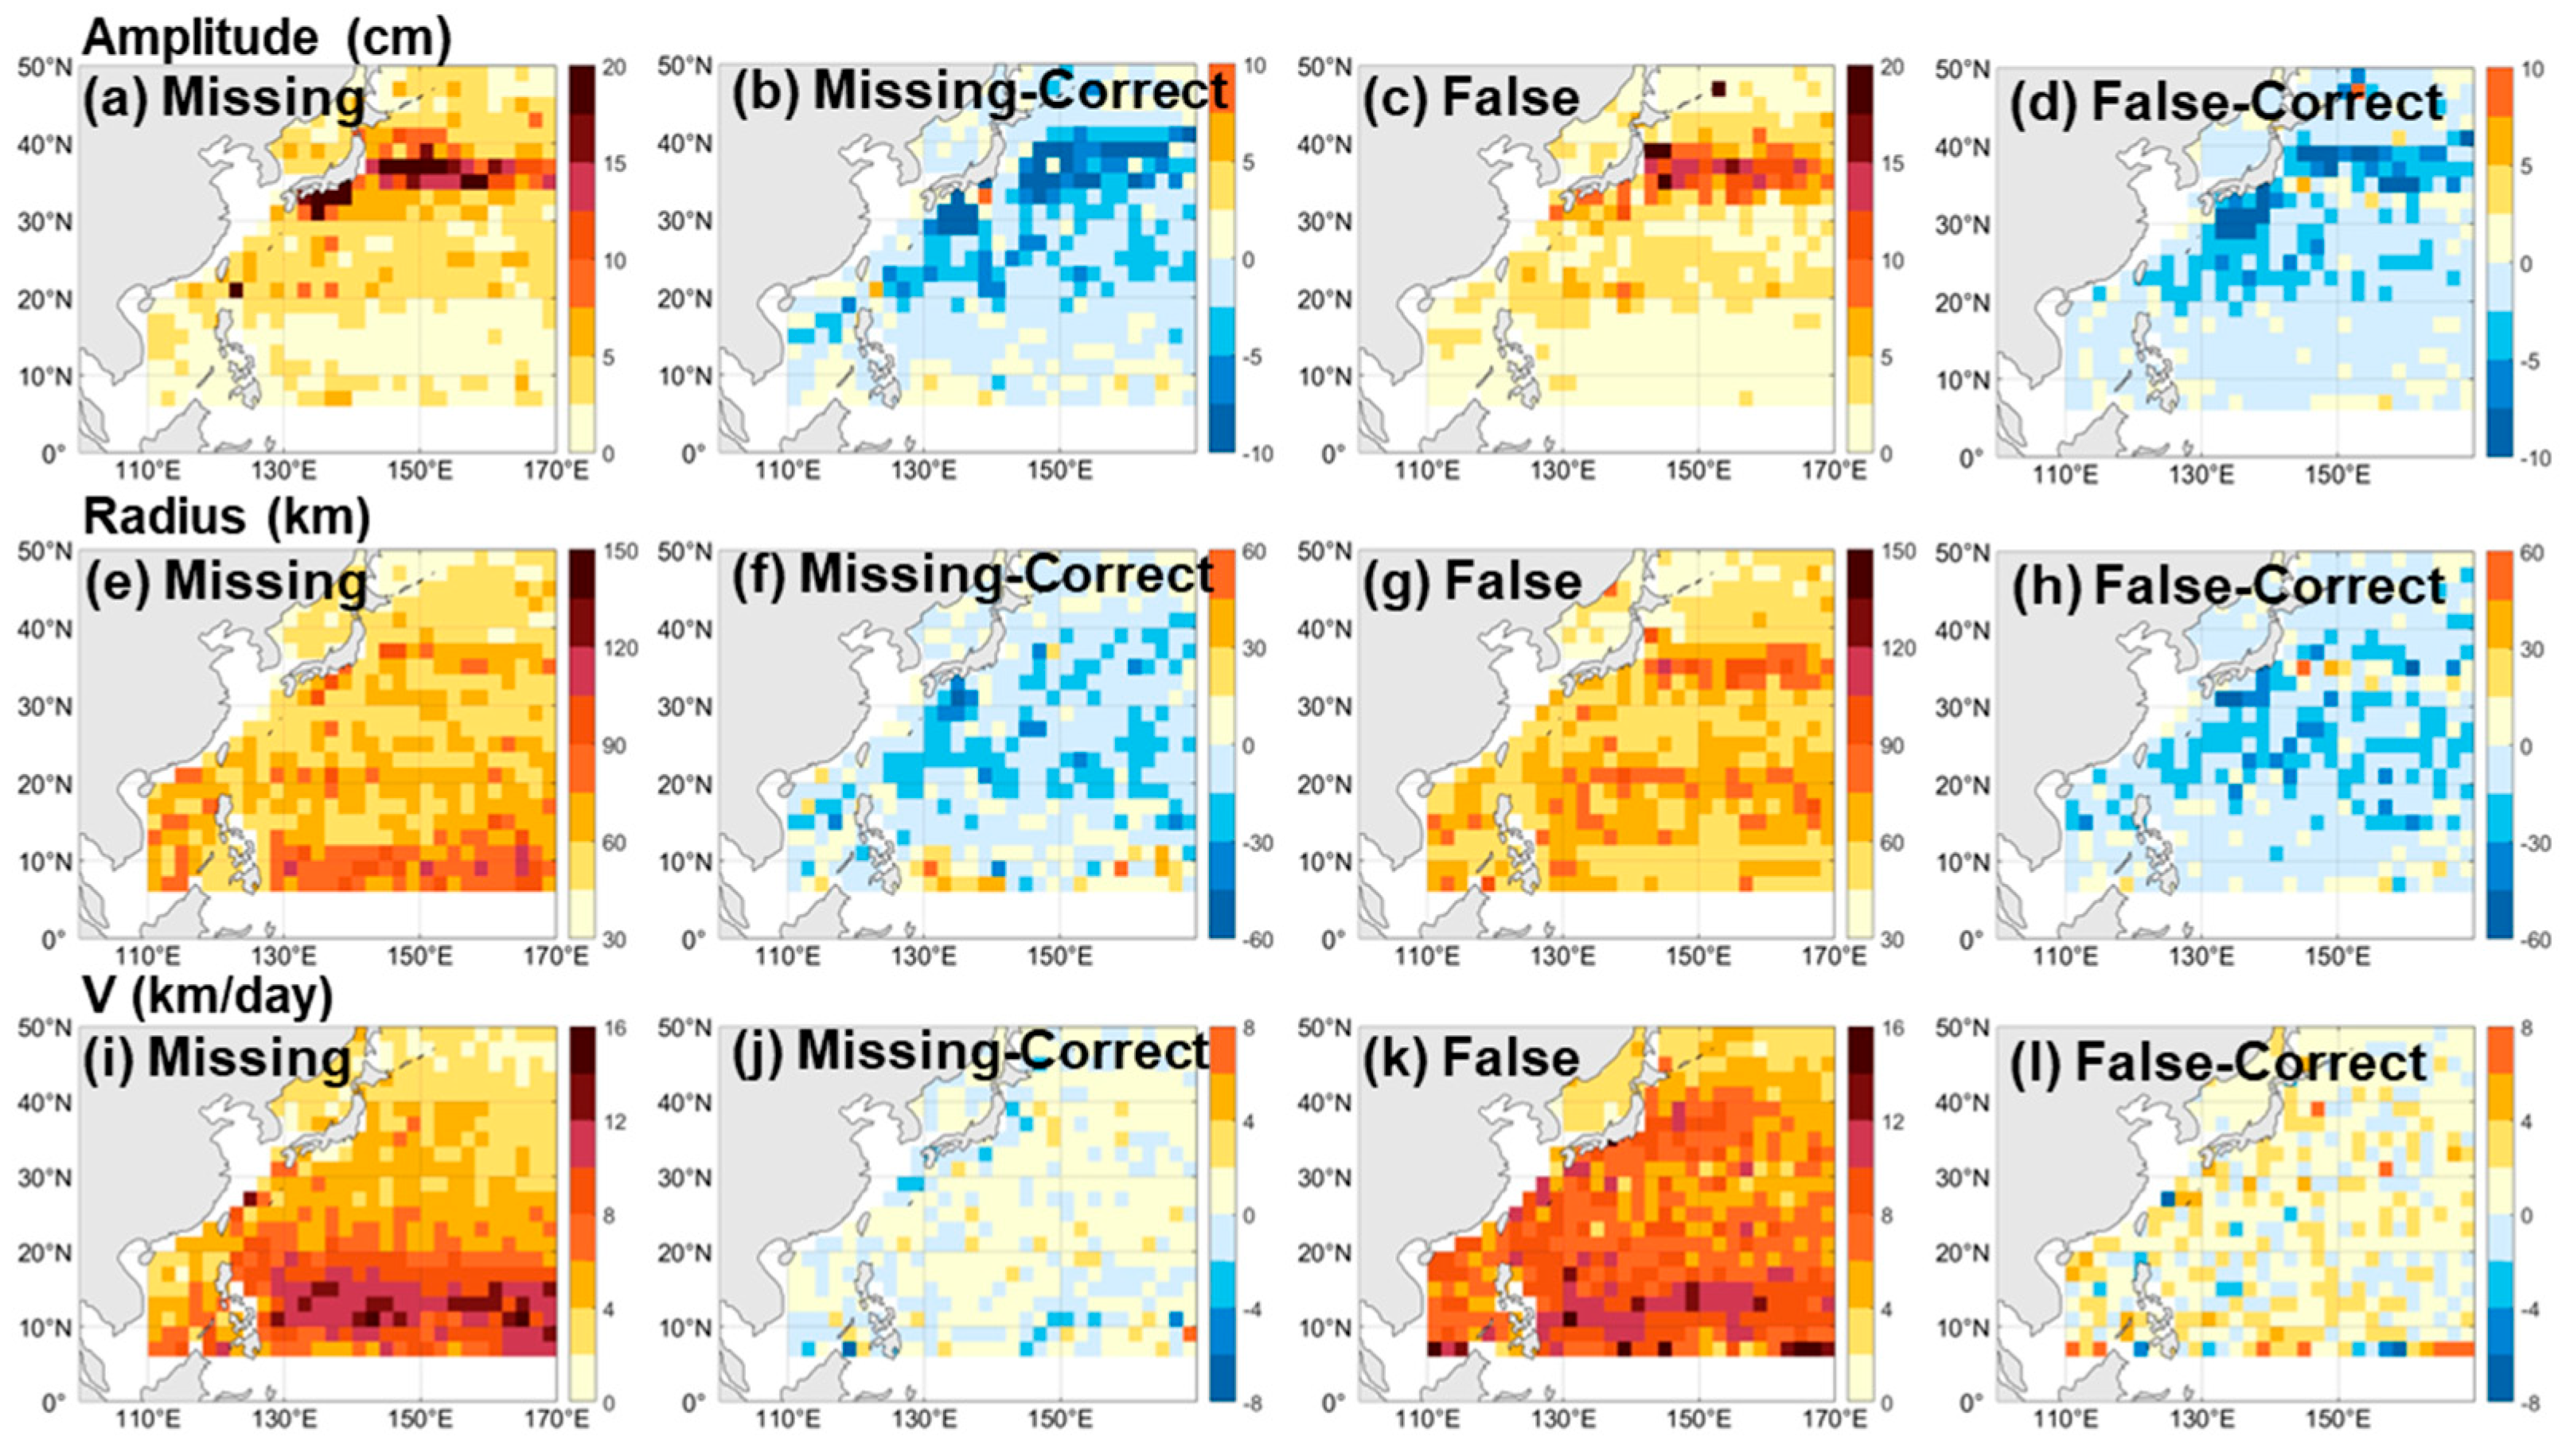
Logically, the spatial distributions of the remaining eddies in AVISO and LFS (i.e., false and missing eddies) exhibit characteristics opposite to those of the correctly matched eddies. The amplitudes and radii of missing and false eddies are smaller and weaker compared to those of the correct AVISO and LFS eddies, while their V are larger. Specifically, false eddies have smaller amplitudes and radii than the correct LFS eddies, with a higher V. Spatial distribution maps (Figure 7) show that missing eddies have smaller amplitudes and radii, as well as higher V, compared to the correctly matched AVISO and LFS eddies across most regions of the NWP. False eddies exhibit a similar pattern compared to the correctly matched LFS eddies. More specifically, the mean amplitude, radius, and V of missing eddies are 4.19 cm, 57.15 km, and 4.51 km/day, respectively, while those of false eddies are 2.76 cm, 59.43 km, and 5.97 km/day. These findings further suggest that LFS has a preference for forecasting weaker, slightly larger, and faster eddies.
The remaining parts of all eddies in AVISO and LFS are called false and missing eddies, respectively. Logically, the spatial distributions of these eddies exhibit characteristics that are opposite to those of the correct eddies. The amplitude and radius of missing/false eddies are weaker and smaller than those of correct AVISO/LFS eddies, and the V of missing/false eddies is larger. The spatial distribution in Figure 7 indicates that missing eddies have smaller amplitudes and radii, and also higher V, compared to correct AVISO/LFS eddies across most regions of the NWP, and false eddies exhibit a similar pattern to the correct LFS eddies. More specifically, the mean amplitude, radius, and V are 4.19 cm, 57.15 km, and 4.51 km/day for missing eddies, respectively, and 2.76 cm, 59.43 km, and 5.97 km/day for false eddies, respectively.

3.3. Statistics of Correct, Missing, and False Eddies

The last section mainly described the results of one day. In this section, the changes with lead days are exhibited through the statistics Pcorrect, Pmissing, and Pfalse. According to the description in Section 3, LFS forecasts only an 8% error in the daily number of eddies. Because parts of the forecast eddies are false, the error in practical application should be much larger than this number. Here, we implement one-to-one correspondence by the distance between forecasted and observed eddies, finding a twin for most observed eddies. This provides a clear answer to how many eddies in the observation can and cannot be forecasted, and how many eddies in the simulation can and cannot be utilized.
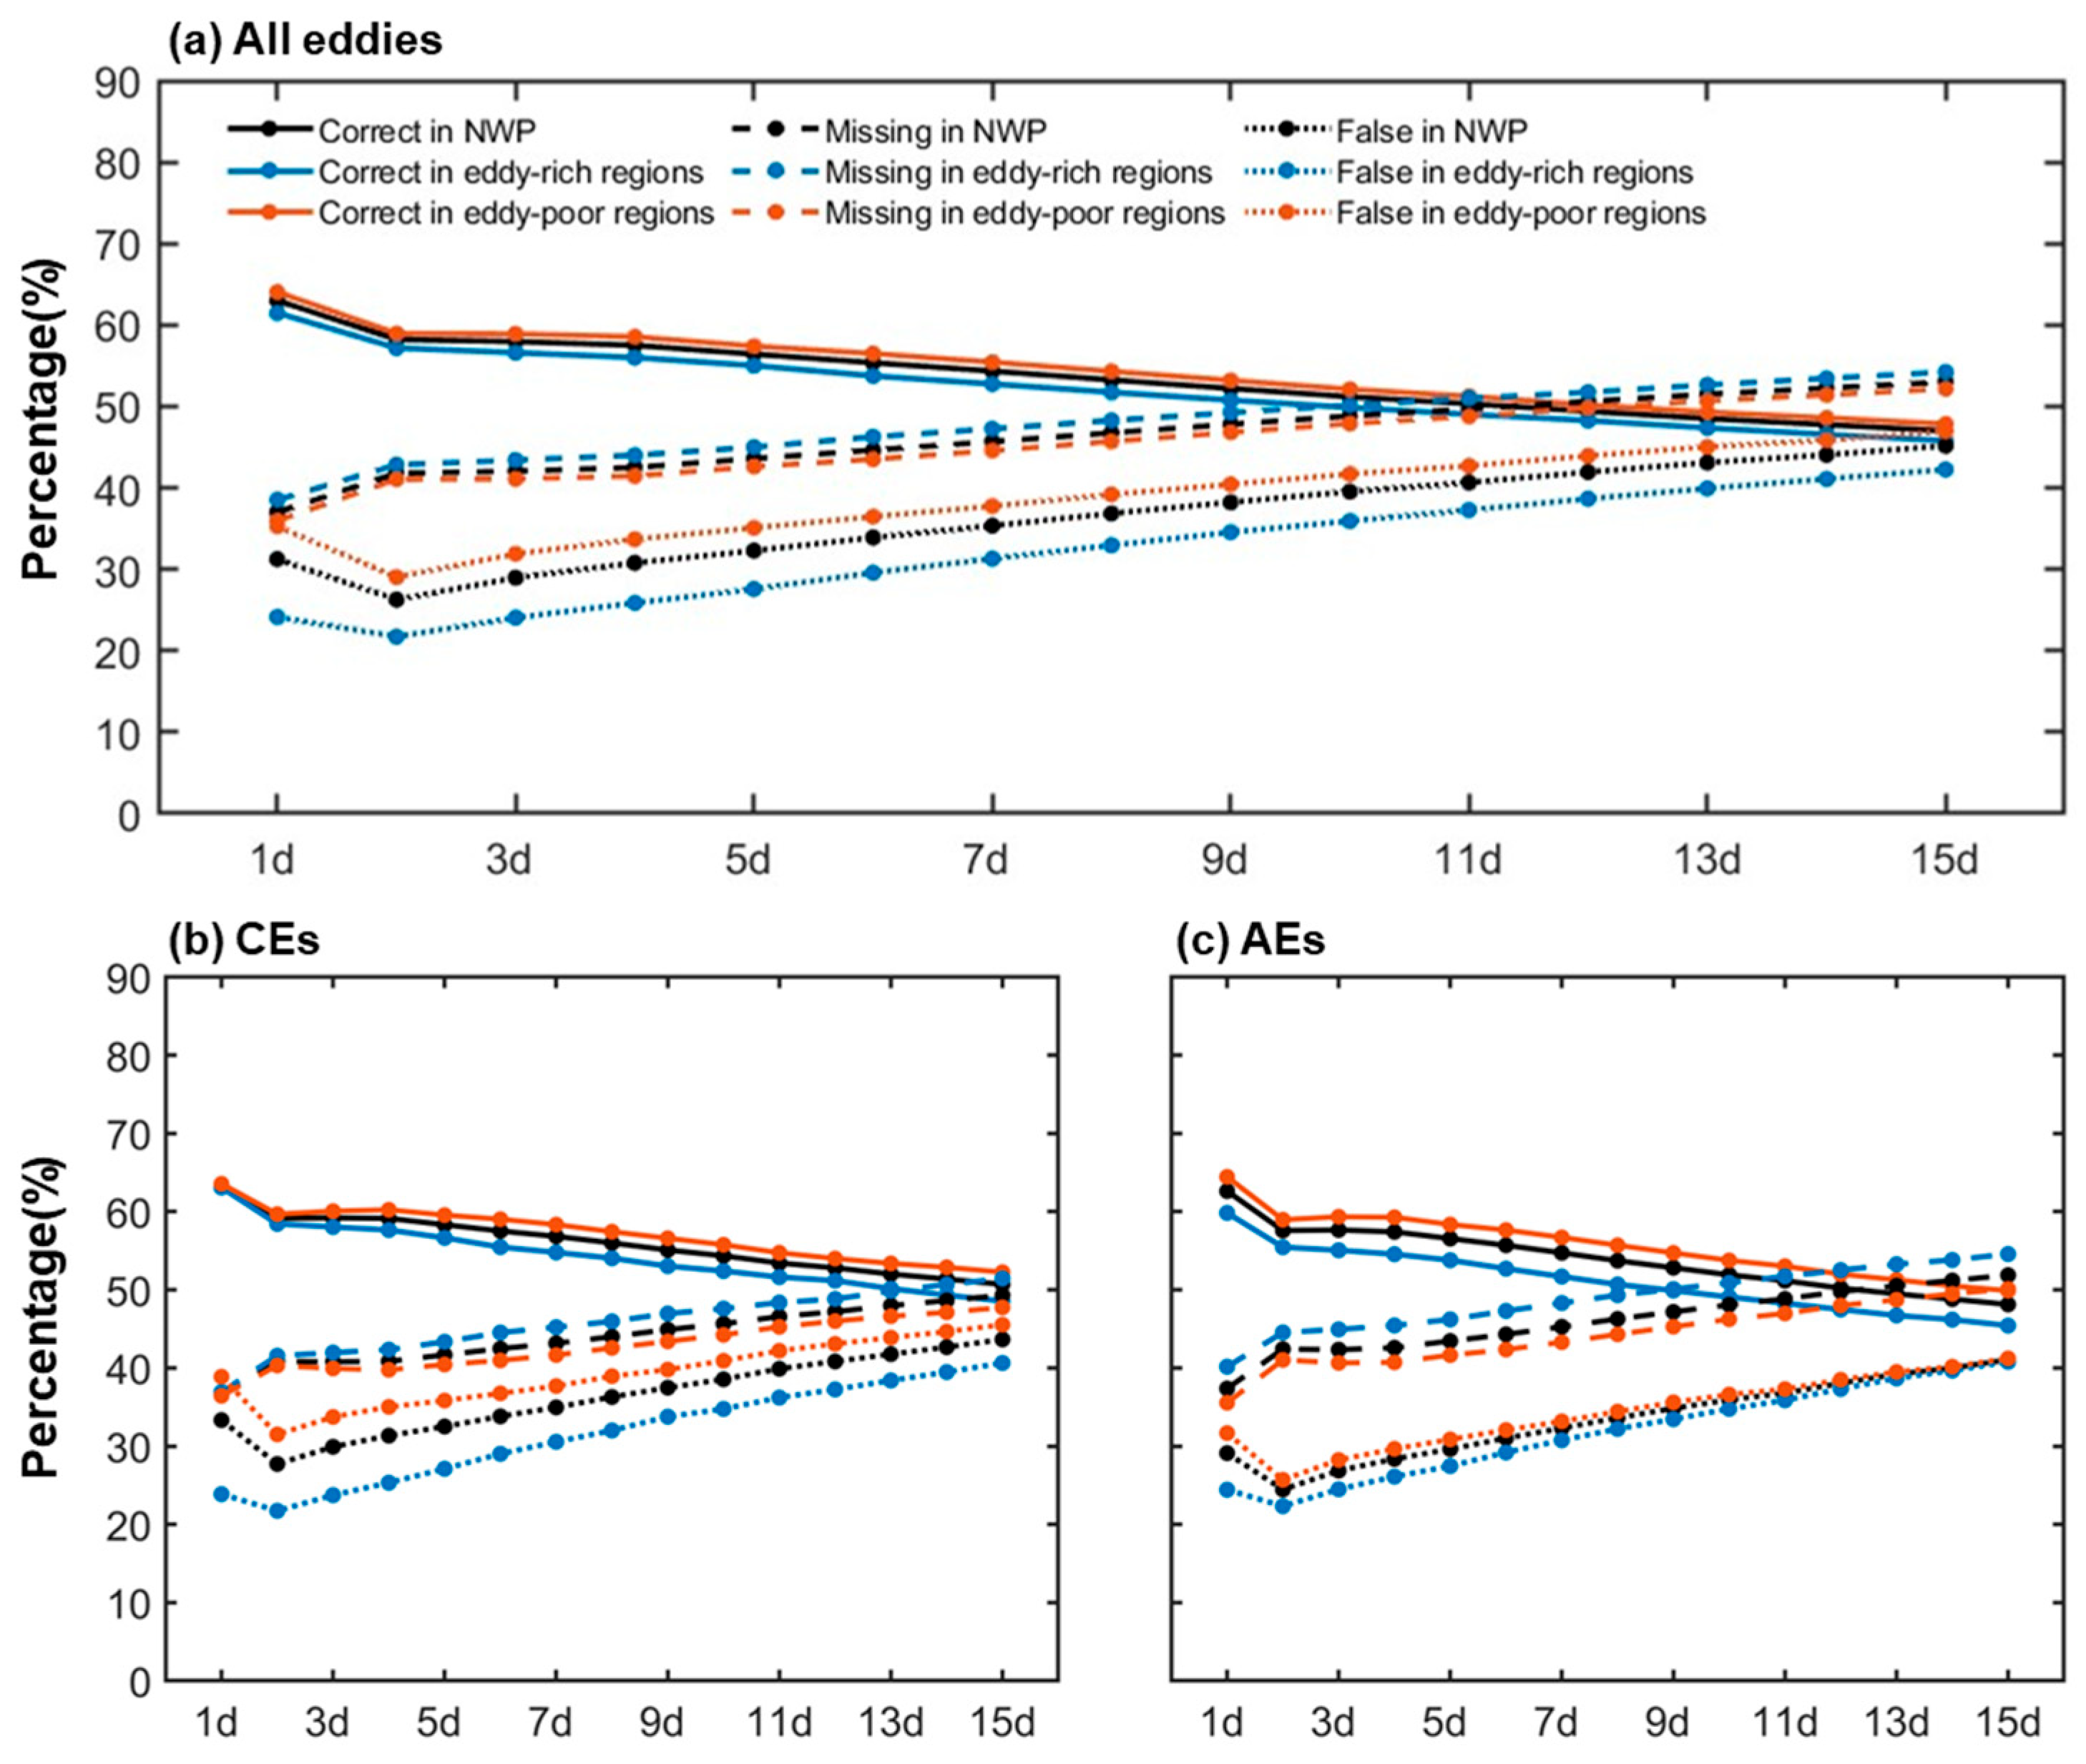
As shown in Figure 8, Pcorrect gradually decreases with increasing lead time. There are various reasons for this. When forecasted eddies are generated (or terminated) earlier or later than observed, the observed eddies lose their twins, leading to a decrease in Pcorrect. The splitting and merging of eddies can similarly help eddies avoid being identified [52]. Although the advantage of GEM-M lies in dealing with the splitting and merging of eddies [37], the effect of these two processes still cannot be ignored. LFS can predict 60% to 70% (Pcorrect, Table 2) of the observed eddies in the NWP (both the eddy-rich and eddy-poor regions), with a lead time of 1 day, while in Region D, Pcorrect is the lowest of the selected regions, below 60%. Conversely, the percentage of missing forecasts (Pmissing) and false forecasts (Pfalse) gradually increases with lead time. In fact, the sum of the missing forecasts and the correct forecasts equals 100%, and their changes are inversely consistent.
LFS forecasts more eddies in eddy-poor regions than in eddy-rich regions, although this difference may not be significant (Figure 8a). At lead times of 1 and 2 days, this is primarily driven by AEs (as shown in Figure 8b, where the solid lines overlap at the first two points, whereas they are separated in Figure 8c). In the remaining portion, differences appear in both CEs and AEs. Pmissing follows a similar trend. The performance of the forecast can be partly interpreted through the forecasted number of eddies, which is also related to Pfalse. This will be discussed further in the Discussion section.

3.4. Relationships Between Eddy Features and Distance of the Correctly Forecasted Eddies

Correctly forecasted eddies (whether from AVISO or LFS) have larger amplitudes and radii, and smaller V, indicating that stronger and much stabler eddies can be more likely forecasted in LFS. This conclusion is the same as that of the previous study, which believes that eddies with larger amplitudes can be well forecasted [27], but does not discuss the preferences of radius and moving speed. Here, we further discuss whether these characteristics can help us identify those better forecasted eddies among the correct eddies.
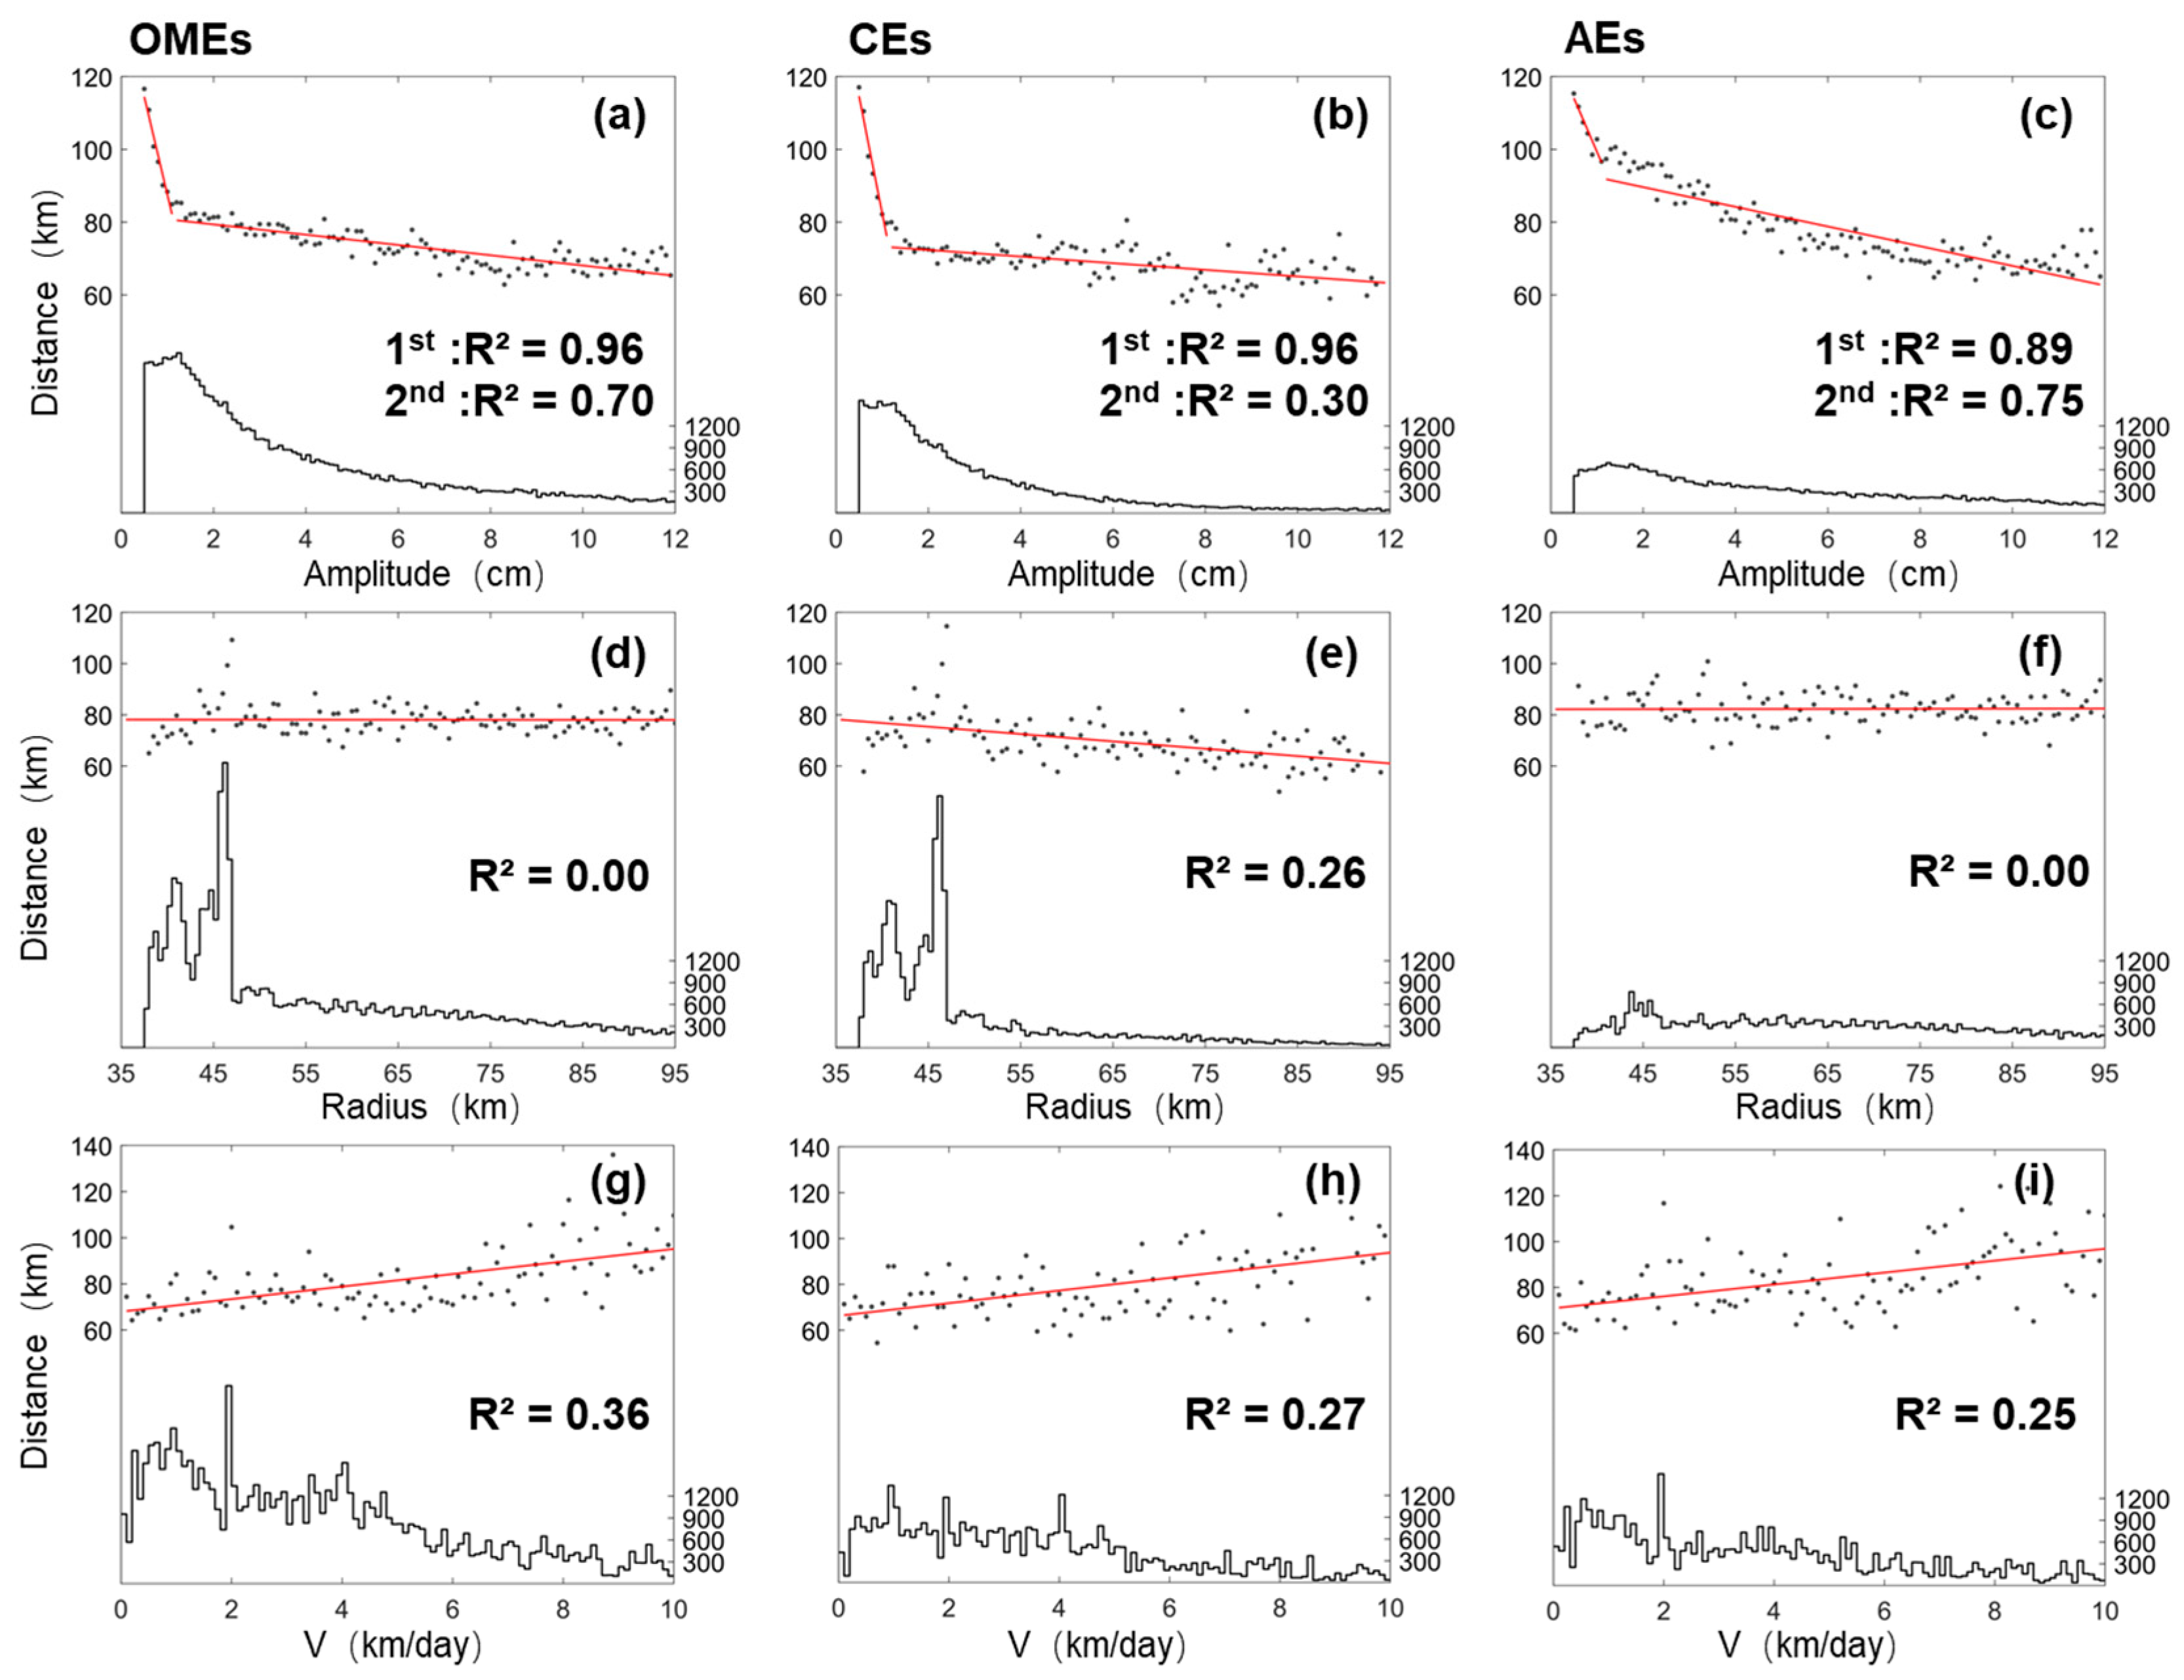
The distance between correctly forecasted AVISO and LFS eddies is considered the most critical metric, which means that the primary task of the forecast is to more accurately simulate the location of the observed eddies. The distance is statistically analyzed as it varies with amplitude, radius, and V. The observed amplitude is divided into small intervals, each containing more than 100 eddies. The intervals are 0.1 cm, 0.5 km, and 0.1 km/day for the amplitude, radius, and V, respectively. The mean values within these intervals are calculated. The result is shown in Figure 9. The observed amplitude is concentrated between 1 and 3 cm, with CEs showing a higher peak than AEs. The radii of eddies mainly lie between 40 km and 50 km, and similarly, CEs have a higher peak in radius compared to AEs. However, the distribution of V for CEs and AEs is almost identical. Although the number of eddies decreases rapidly with increasing amplitude, radius, and V, there are still sufficient eddy samples in the tail of the distribution.
The histogram in Figure 2c indicates that the distance of these matched eddies (twins) lies between 0 and 300 km, with a mean value of about 80 km on a lead time of 1 day. The amplitude variation is monotonic with a distance between 50 km and 120 km and can be divided into two linear phases (Figure 9a). The distance rapidly decreases as amplitude changes in the 0.5–1.1 cm interval. When the amplitude exceeds 1.1 cm, the rate of decrease slows down (Figure 9a). Here, we performed a piecewise linear regression with the ranges of 0.5–1.1 cm and 1.1–12 cm between the two variables. The results indicate that there is a significant linear relationship between distance and amplitude within these two ranges. In the range of 0.5–1.1 cm, for each 1 cm increase in amplitude, the mean distance between the forecasted eddies and the observed eddies decreases by about 54 km. In the range of 1.1–12 cm, for each 1 cm increase in amplitude, the mean distance decreases by 1.4 km only. When the amplitude exceeds 12 cm, the number of samples decreases, making further statistical analysis unreliable. CEs have a steeper result in the first interval (−64 km/cm) and a gentler slope in the second interval (−0.9 km/cm); in contrast, AEs have a gentler slope in the first interval (−30 km/cm) and a steeper slope in the second interval (−2.7 km/cm).
However, the results do not exhibit a remarkable trend for radius (Figure 9d–f). The distance is approximately 80 km, close to the mean of all distance samples. The slopes for OMEs, CEs, and AEs are 0.002 km/km, −0.29 km/km, and 0.005 km/km, respectively.
The distance changes more intensely with V, and a significant linear relationship exists between them (Figure 9g–i). When V is as low as 0 km/day, the mean distance of these matched eddies is about 70 km, and when V reaches 10 km/day, the distance is about 100 km. Here, the slopes for OMEs, CEs, and AEs are 2.7 km/day/km, 2.8 km/day/km, and 2.6 km/day/km, respectively.
Among these three relationships, the relationships between amplitude and distance, and V and distance are particularly noted. These characteristics imply that observed eddies with larger amplitude and slower V can be more accurately forecasted in their positions by LFS. Building on the results from Section 3.3, stronger and slower eddies, whether CEs or AEs, are very general conditions for determining whether eddies have a higher probability of being forecasted, and the attributes of OMEs are closer to the truth.
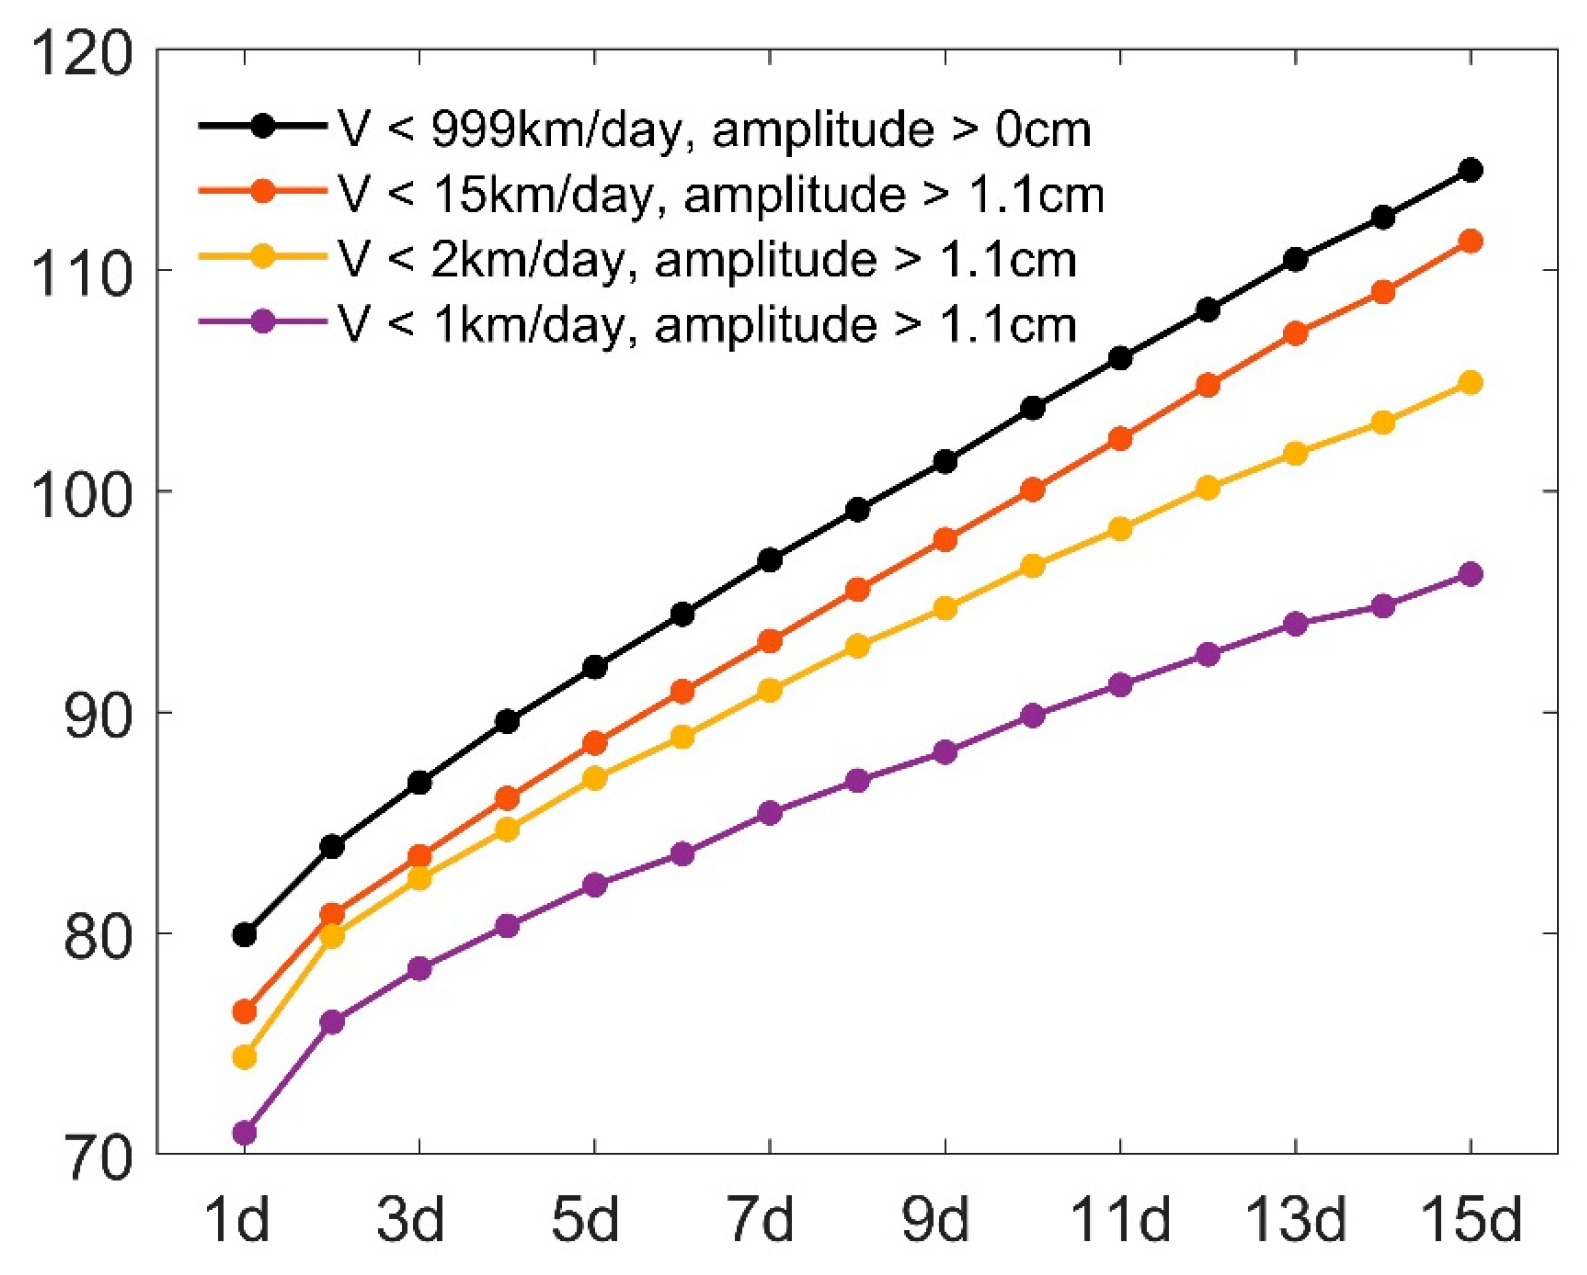
All these relationships are based on the forecast results with a lead time of 1 day. Forecast results with different lead times have similar trends. The mean distance is displayed (black line) in Figure 10. To clarify the compound impact of amplitude and V on distance, the correct eddies are divided into several groups based on amplitude and V. Since the distance only decreases rapidly with amplitude within a shorter range, only eddies with an amplitude greater than 1.1 cm were included in the statistics. Among these samples, three groups of eddies with V less than 1 km/day, 2 km/day, and 15 km/day were collected. For eddies with an amplitude greater than 1 cm and V less than 1 km/day, the distance is 71 km at a lead time of 1 day, and 82 km at a lead time of 5 days. As the maximum V grows, the distance increases. For the results without any restrictions, the mean rate of distance increase with lead time is 2.3 km/day. For the purple line in Figure 10 (amplitude > 1 cm, V < 1 km/day), the rate is 1.7 km/day.

4. Discussion

Two issues in the results require further discussion. One is why differences exist in the rate of correct, false, and missing eddies, even if those differences are not statistically significant; the other is how the matching criteria affect this study’s qualitative and quantitative conclusions.

4.1. Influence of Forecasting Density

Differences are observed not only in the rates (whether correct, false, or missing eddies) between CEs and AEs, but also between the eddy-rich and eddy-poor regions. The causes are complex and may stem from initial condition errors and biases in the simulation of physical processes. Based on the results already presented, part of the difference, especially in the rate of false eddies, can be explained by the number or density of forecasted eddies. When more eddies are forecasted, it becomes easier for observed eddies to find their twins through matching. In extreme cases, the forecast system could produce a very dense field of eddies such that there is at least one forecasted eddy within a certain range of every observed eddy. Under the matching rules applied in this study, this would yield a 100% correct forecast. However, it would also result in a large number of forecasted eddies being classified as false forecasts.
Therefore, more forecasted eddies (a higher nl/na ratio) typically correspond to more matched eddies (higher Pcorrect), more false eddies (higher Pfalse), and fewer missing eddies (lower Pmissing). The statistics in this study support this inference: the nl/na ratio is higher in eddy-poor regions than in eddy-rich regions (Figure 11), accompanied by higher Pcorrect and Pfalse and lower Pmissing in the eddy-poor regions (Table 2). This difference in the number is also consistent with findings from previous studies [45]. Similarly, CEs have a higher nl/na ratio than AEs, along with higher Pcorrect and Pfalse, and lower Pmissing. However, this relationship is empirical and has not been strictly validated.

4.2. Sensitivity of Results to Matching Criteria

Although the matching procedure yielded satisfactory results, some uncertainties remain. Inevitably, the matching step can pair two unrelated eddies, which leads to larger errors and inflates the overall mean error. Therefore, we argue that if every correct AVISO eddy could be perfectly matched with its true forecast counterpart, the location error would be smaller than the results presented in the previous text (Figure 10).
Moreover, the 300 km threshold used in matching is somewhat debatable, as this spatial scale exceeds the typical scale of mesoscale eddies. Nonetheless, in some cases, the threshold was logical, where manually identified eddy pairs had distances exceeding 200 km but under 300 km. Including more reasonable cases positively influences the analysis of error variability.
To further evaluate this, we tested a range of distance thresholds for amplitude. With thresholds of 200 km and 100 km, the qualitative conclusions of Section 3.4 remain valid, although the quantitative results vary somewhat. As the maximum allowable matching distance decreases while the minimum distance is constrained by the data resolution (25 km), the regression slopes become flatter. Specifically, when the thresholds are set to 200 km and 100 km, the corresponding R2 values are 0.76 and 0.24, respectively. The results only change when the threshold for amplitude is reduced to 50 km, which is approximately twice the grid distance. Under this threshold, the significant relationships between forecast performance and amplitude vanish—this is attributed to the resolution limitations of the dataset. Thus, increasing model resolution is regarded as a necessary step to improve the performance of the forecast system.

5. Conclusions

In this study, we systematically evaluated the performance of LFS in predicting OMEs in the NWP, yielding both qualitative and quantitative results. LFS provides marine environmental forecasts, such as SLA, with lead times ranging from 1 to 15 days. We identified OMEs from both forecasted and observed SLA fields and compared their spatial and temporal characteristics using GEM-M. Subsequently, observed eddies and forecasted eddies were matched based on the distances, and we analyzed the characteristics of eddies before and after matching, as well as whether they were successfully matched. Finally, we identified and verified significant relationships between forecast performance and eddy features.
The conclusions of this study are as follows:
(1)
In general, LFS forecasts a smaller number of eddies (8%), with lower mean amplitudes (22%), larger mean radius (4%), and faster mean V (24%).
(2)
The spatial characteristics of these correct, missing, and false eddies are similar to those of the total forecasted eddies. However, in most grids, the correct eddies exhibited larger amplitudes compared to the missing, false, and total eddies. This finding has practical implications, as eddies with larger amplitudes are more likely to be correctly forecasted in operational applications.
(3)
Similarly, we found a significant correlation between forecast location errors with the observed amplitude and V . For eddies with larger amplitudes and slower V , LFS demonstrated greater accuracy in predicting their location.
(4)
Moreover, LFS correctly predicted 63% of the OMEs in the NWP region, while 37% of the OMEs were missed, and 31% of the forecasted eddies were false at a lead time of 1 day. Differences exist in the correct, false, and missing rate, which is partly associated with the number of forecast eddies.
Our objective is to understand the forecast results and explore meaningful patterns, rather than directly improve the forecasting system for enhanced prediction outcomes. Therefore, the influence of certain parameters—both those discussed and those not explicitly addressed—is considered acceptable within the scope of this study. In addition, comparisons with other forecasting systems are necessary, and we plan to carry out such work in future studies. Overall, the findings presented here offer new insights into the current version of LFS and hold practical implications for its operational application.

Supplementary Materials

The following supporting information can be downloaded at https://www.mdpi.com/article/10.3390/jmse13081571/s1: Figure S1: The mean daily number, amplitude (cm), radius (km), and V (km/day) of CEs and AEs; Figure S2: Same as Figure 4 but at a lead time of 5 days.; Figure S3: Same as Figure 6 but at a lead time of 5 days.; Figure S4: The ratio of the mean daily number, amplitude (cm), radius (km), and V (km/day) of correct eddies to that of all OMEs;

Author Contributions

Conceptualization, J.Z. and H.L.; methodology, J.Z. and M.D.; software, M.D. and Y.M.; validation, J.Z. and W.Z.; formal analysis, J.Z. and J.C.; resources, Z.Y.; data curation, H.L., W.Z., and Z.Y.; writing—original draft, J.Z.; writing—review and editing, H.L., P.L., Y.L., and P.W.; supervision, H.L.; project administration, H.L.; funding acquisition, H.L. All authors have read and agreed to the published version of the manuscript.

Funding

This study is supported by the National Key R&D Program for Developing Basic Sciences (Grant No. 2022YFC3104802), the National Natural Science Foundation of China (Grant No. U2242214) and Huairou Science City Achievement Implementation Project (Grant No. Z231100006623004). HLL is also supported by the Tai Shan Scholar Program (Grant No. tstp20231237) and Laoshan Laboratory project (No. LSKJ202300301).

Data Availability Statement

The data presented in this study are available on request from the corresponding author because they contain preliminary or proprietary information that is not yet suitable for public release.

Conflicts of Interest

The authors declare no conflict of interest.

References

  1. Nikurashin, M.; Ferrari, R. Suppression of Eddy Diffusivity across Jets in the Southern Ocean. J. Phys. Oceanogr. 2010, 40, 1501–1519. [Google Scholar] [CrossRef]
  2. Chaigneau, A.; Le Texier, M.; Eldin, G.; Grados, C.; Pizarro, O. Vertical structure of mesoscale eddies in the eastern South Pacific Ocean: A composite analysis from altimetry and Argo profiling floats. J. Geophys. Res. Ocean. 2011, 116, C11025. [Google Scholar] [CrossRef]
  3. Ueno, H.; Bracco, A.; Barth, J.A.; Budyansky, M.V.; Hasegawa, D.; Itoh, S.; Kim, S.Y.; Ladd, C.; Lin, X.; Park, Y.-G.; et al. Review of oceanic mesoscale processes in the North Pacific: Physical and biogeochemical impacts. Prog. Oceanogr. 2023, 212, 102955. [Google Scholar] [CrossRef]
  4. Ferrari, R.; Klocker, A.; LaCasce, J.H. Estimating Suppression of Eddy Mixing by Mean Flows. J. Phys. Oceanogr. 2012, 42, 1566–1576. [Google Scholar] [CrossRef]
  5. Chelton, D.B.; Schlax, M.G.; Samelson, R.M. Global observations of nonlinear mesoscale eddies. Prog. Oceanogr. 2011, 91, 167–216. [Google Scholar] [CrossRef]
  6. Liu, Y.; Dong, C.; Guan, Y.; Chen, D.; McWilliams, J.; Nencioli, F. Eddy analysis in the subtropical zonal band of the North Pacific Ocean. Deep Sea Res. Part I Oceanogr. Res. Pap. 2012, 68, 54–67. [Google Scholar] [CrossRef]
  7. Chelton, D.B.; Schlax, M.G.; Samelson, R.M.; de Szoeke, R.A. Global observations of large oceanic eddies. Geophys. Res. Lett. 2007, 34, L15606. [Google Scholar] [CrossRef]
  8. Chelton, D.B.; Gaube, P.; Schlax, M.G.; Early, J.J.; Samelson, R.M. The Influence of Nonlinear Mesoscale Eddies on Near-Surface Oceanic Chlorophyll. Science 2011, 334, 328–332. [Google Scholar] [CrossRef]
  9. McGillicuddy, D.J. Mechanisms of Physical-Biological-Biogeochemical Interaction at the Oceanic Mesoscale. Annu. Rev. Mar. Sci. 2016, 8, 125–159. [Google Scholar] [CrossRef]
  10. Zhang, Z.; Wang, W.; Qiu, B. Oceanic mass transport by mesoscale eddies. Science 2014, 345, 322–324. [Google Scholar] [CrossRef]
  11. Qiu, B.; Chen, S. Eddy-Induced Heat Transport in the Subtropical North Pacific from Argo, TMI, and Altimetry Measurements. J. Phys. Oceanogr. 2005, 35, 458–473. [Google Scholar] [CrossRef]
  12. Dong, C.; McWilliams, J.C.; Liu, Y.; Chen, D. Global heat and salt transports by eddy movement. Nat. Commun. 2014, 5, 3294. [Google Scholar] [CrossRef]
  13. Brach, L.; Deixonne, P.; Bernard, M.-F.; Durand, E.; Desjean, M.-C.; Perez, E.; van Sebille, E.; ter Halle, A. Anticyclonic eddies increase accumulation of microplastic in the North Atlantic subtropical gyre. Mar. Pollut. Bull. 2018, 126, 191–196. [Google Scholar] [CrossRef]
  14. Gilchrist, R.M.; Hall, R.A.; Bacon, J.C.; Rees, J.M.; Graham, J.A. Increased dispersion of oil from a deep water seabed release by energetic mesoscale eddies. Mar. Pollut. Bull. 2020, 156, 111258. [Google Scholar] [CrossRef]
  15. Frenger, I.; Gruber, N.; Knutti, R.; Münnich, M. Imprint of Southern Ocean eddies on winds, clouds and rainfall. Nat. Geosci. 2013, 6, 608–612. [Google Scholar] [CrossRef]
  16. Braun, C.D.; Gaube, P.; Sinclair-Taylor, T.H.; Skomal, G.B.; Thorrold, S.R. Mesoscale eddies release pelagic sharks from thermal constraints to foraging in the ocean twilight zone. Proc. Natl. Acad. Sci. USA 2019, 116, 17187–17192. [Google Scholar] [CrossRef] [PubMed]
  17. Xing, Q.; Yu, H.; Wang, H.; Ito, S.i.; Chai, F. Mesoscale eddies modulate the dynamics of human fishing activities in the global midlatitude ocean. Fish Fish. 2023, 24, 527–543. [Google Scholar] [CrossRef]
  18. Chassignet, E.P.; Hurlburt, H.E.; Smedstad, O.M.; Halliwell, G.R.; Hogan, P.J.; Wallcraft, A.J.; Bleck, R. Ocean Prediction with the Hybrid Coordinate Ocean Model (HYCOM). In Ocean Weather Forecasting: An Integrated View of Oceanography; Chassignet, E.P., Verron, J., Eds.; Springer: Dordrecht, The Netherlands, 2006; pp. 413–426. [Google Scholar]
  19. Hurlburt, H.E.; Chassignet, E.P.; Cummings, J.A.; Kara, A.B.; Metzger, E.J.; Shriver, J.F.; Smedstad, O.M.; Wallcraft, A.J.; Barron, C.N. Eddy-Resolving Global Ocean Prediction. In Ocean Modeling in an Eddying Regime; Hecht, M.W., Hasumi, H., Eds.; American Geophysical Union: Washington, DC, USA, 2008; pp. 353–381. [Google Scholar]
  20. Thoppil, P.G.; Frolov, S.; Rowley, C.D.; Reynolds, C.A.; Jacobs, G.A.; Joseph Metzger, E.; Hogan, P.J.; Barton, N.; Wallcraft, A.J.; Smedstad, O.M.; et al. Ensemble forecasting greatly expands the prediction horizon for ocean mesoscale variability. Commun. Earth Environ. 2021, 2, 89. [Google Scholar] [CrossRef]
  21. Krishnamurthy, V. Predictability of Weather and Climate. Earth Space Sci. 2019, 6, 1043–1056. [Google Scholar] [CrossRef]
  22. Roberts, C.D.; Balmaseda, M.A.; Tietsche, S.; Vitart, F. Sensitivity of ECMWF coupled forecasts to improved initialization of the ocean mesoscale. Q. J. R. Meteorol. Soc. 2022, 148, 3694–3714. [Google Scholar] [CrossRef]
  23. Wang, X.; Wang, H.; Liu, D.; Wang, W. The Prediction of Oceanic Mesoscale Eddy Properties and Propagation Trajectories Based on Machine Learning. Water 2020, 12, 2521. [Google Scholar] [CrossRef]
  24. Ma, C.; Li, S.; Wang, A.; Yang, J.; Chen, G. Altimeter Observation-Based Eddy Nowcasting Using an Improved Conv-LSTM Network. Remote Sens. 2019, 11, 783. [Google Scholar] [CrossRef]
  25. Chen, L.; Han, B.; Wang, X.; Zhao, J.; Yang, W.; Yang, Z. Machine Learning Methods in Weather and Climate Applications: A Survey. Appl. Sci. 2023, 13, 12019. [Google Scholar] [CrossRef]
  26. Xu, D.; Zhuang, W.; Yan, Y. Could the two anticyclonic eddies during winter 2003/2004 be reproduced and predicted in the northern South China Sea? Ocean Sci. 2019, 15, 97–111. [Google Scholar] [CrossRef]
  27. Li, J.; Wang, G.; Xue, H.; Wang, H. A simple predictive model for the eddy propagation trajectory in the northern South China Sea. Ocean Sci. 2019, 15, 401–412. [Google Scholar] [CrossRef]
  28. Chen, X.; Chen, G.; Ge, L.; Cao, C.; Huang, B. Medium-range forecasting of oceanic eddy trajectory. Int. J. Digit. Earth 2024, 17, 2300325. [Google Scholar] [CrossRef]
  29. Fox-Kemper, B.; Adcroft, A.; Böning, C.W.; Chassignet, E.P.; Curchitser, E.; Danabasoglu, G.; Eden, C.; England, M.H.; Gerdes, R.; Greatbatch, R.J.; et al. Challenges and Prospects in Ocean Circulation Models. Front. Mar. Sci. 2019, 6, 65. [Google Scholar] [CrossRef]
  30. Liu, H.; Chu, P.; Meng, Y.; Ding, M.; Lin, P.; Ding, R.; Wang, P.; Zheng, W. The Predictability Limit of Oceanic Mesoscale Eddy Tracks in the South China Sea. Adv. Atmos. Sci. 2024, 41, 1661–1679. [Google Scholar] [CrossRef]
  31. Meng, Y.; Liu, H.; Lin, P.; Ding, M.; Dong, C. Oceanic mesoscale eddy in the Kuroshio extension: Comparison of four datasets. Atmos. Ocean. Sci. Lett. 2021, 14, 100011. [Google Scholar] [CrossRef]
  32. Ding, M.; Liu, H.; Lin, P.; Meng, Y.; Yu, Z. Evaluating westward and eastward propagating mesoscale eddies using a 1/10° global ocean simulation of CAS-LICOM3. Ocean Model. 2024, 189, 102373. [Google Scholar] [CrossRef]
  33. Liu, H.; Lin, P.; Zheng, W.; Luan, Y.; Ma, J.; Ding, M.; Mo, H.; Wan, L.; Ling, T. A global eddy-resolving ocean forecast system in China—LICOM Forecast System (LFS). J. Oper. Oceanogr. 2021, 16, 15–27. [Google Scholar] [CrossRef]
  34. Zheng, W.; Lin, P.; Liu, H.; Luan, Y.; Ma, J.; Mo, H.; Liu, J. An assessment of the LICOM Forecast System under the IVTT class4 framework. Front. Mar. Sci. 2023, 10, 1112025. [Google Scholar] [CrossRef]
  35. Lin, P.; Yu, Z.; Liu, H.; Yu, Y.; Li, Y.; Jiang, J.; Xue, W.; Chen, K.; Yang, Q.; Zhao, B.; et al. LICOM Model Datasets for the CMIP6 Ocean Model Intercomparison Project. Adv. Atmos. Sci. 2020, 37, 239–249. [Google Scholar] [CrossRef]
  36. Lellouche, J.-M.; Greiner, E.; Le Galloudec, O.; Garric, G.; Regnier, C.; Drevillon, M.; Benkiran, M.; Testut, C.-E.; Bourdalle-Badie, R.; Gasparin, F.; et al. Recent updates to the Copernicus Marine Service global ocean monitoring and forecasting real-time 1∕12° high-resolution system. Ocean Sci. 2018, 14, 1093–1126. [Google Scholar] [CrossRef]
  37. Li, Q.-Y.; Sun, L.; Lin, S.-F. GEM: A dynamic tracking model for mesoscale eddies in the ocean. Ocean Sci. 2016, 12, 1249–1267. [Google Scholar] [CrossRef]
  38. Faghmous, J.H.; Frenger, I.; Yao, Y.; Warmka, R.; Lindell, A.; Kumar, V. A daily global mesoscale ocean eddy dataset from satellite altimetry. Sci. Data 2015, 2, 150028. [Google Scholar] [CrossRef]
  39. Pegliasco, C.; Delepoulle, A.; Mason, E.; Morrow, R.; Faugère, Y.; Dibarboure, G. META3.1exp: A new global mesoscale eddy trajectory atlas derived from altimetry. Earth Syst. Sci. Data 2022, 14, 1087–1107. [Google Scholar] [CrossRef]
  40. Jacob, J.P.; Chassignet, E.P.; Dewar, W.K. Influence of Topography on the Propagation of Isolated Eddies. J. Phys. Oceanogr. 2002, 32, 2848–2869. [Google Scholar] [CrossRef]
  41. Zhai, X.; Johnson, H.L.; Marshall, D.P. Significant sink of ocean-eddy energy near western boundaries. Nat. Geosci. 2010, 3, 608–612. [Google Scholar] [CrossRef]
  42. Chelton, D.B.; Samelson, R.M.; Early, J.J. The Evolution and Propagation of Quasigeostrophic Ocean Eddies*. J. Phys. Oceanogr. 2011, 41, 1535–1555. [Google Scholar] [CrossRef]
  43. Ni, Q.; Zhai, X.; Wang, G.; Marshall, D.P. Random Movement of Mesoscale Eddies in the Global Ocean. J. Phys. Oceanogr. 2020, 50, 2341–2357. [Google Scholar] [CrossRef]
  44. Wilson, C. Does the wind systematically energize or damp ocean eddies? Geophys. Res. Lett. 2016, 43, 12538–12542. [Google Scholar] [CrossRef]
  45. Ding, M.; Liu, H.; Lin, P.; Hu, A.; Meng, Y.; Li, Y.; Liu, K. Overestimated Eddy Kinetic Energy in the Eddy-Rich Regions Simulated by Eddy-Resolving Global Ocean–Sea Ice Models. Geophys. Res. Lett. 2022, 49, e2022GL098370. [Google Scholar] [CrossRef]
  46. Chassignet, E.P.; Yeager, S.G.; Fox-Kemper, B.; Bozec, A.; Castruccio, F.; Danabasoglu, G.; Horvat, C.; Kim, W.M.; Koldunov, N.; Li, Y.; et al. Impact of horizontal resolution on global ocean–sea ice model simulations based on the experimental protocols of the Ocean Model Intercomparison Project phase 2 (OMIP-2). Geosci. Model Dev. 2020, 13, 4595–4637. [Google Scholar] [CrossRef]
  47. Chen, G.; Hou, Y.; Chu, X. Mesoscale eddies in the South China Sea: Mean properties, spatiotemporal variability, and impact on thermohaline structure. J. Geophys. Res. 2011, 116, C06018. [Google Scholar] [CrossRef]
  48. Qu, T. Upper-Layer Circulation in the South China Sea. J. Phys. Oceanogr. 2000, 30, 1450–1460. [Google Scholar] [CrossRef]
  49. Wang, L.; Koblinsky, C.J.; Howden, S. Mesoscale variability in the South China Sea from the TOPEX/Poseidon altimetry data. Deep Sea Res. Part I Oceanogr. Res. Pap. 2000, 47, 681–708. [Google Scholar] [CrossRef]
  50. Qiu, B. Seasonal Eddy Field Modulation of the North Pacific Subtropical Countercurrent: TOPEX/Poseidon Observations and Theory. J. Phys. Oceanogr. 1999, 29, 2471–2486. [Google Scholar] [CrossRef]
  51. Yang, C.; Yang, H.; Chen, Z.; Gan, B.; Liu, Y.; Wu, L. Seasonal variability of eddy characteristics and energetics in the Kuroshio Extension. Ocean Dyn. 2023, 73, 531–544. [Google Scholar] [CrossRef]
  52. Pilo, G.S.; Mata, M.M.; Azevedo, J.L.L. Eddy surface properties and propagation at Southern Hemisphere western boundary current systems. Ocean Sci. 2015, 11, 629–641. [Google Scholar] [CrossRef]
Figure 1. The distribution of the number of eddies against their velocities for (a) AVISO data, (b) 1-day lead forecast, and (c) 5-day lead LFS forecast (km/day). The black, blue, and red curves denote all oceanic mesoscale eddies, CEs, and AEs, respectively.
Jmse 13 01571 g001
Figure 2. An example of matching observed and forecasted eddies in Region D on 1 August 2022. (a,b) illustrate the two steps and results of matching eddies. The shaded areas and contours represent the observed and forecasted SLA (m), respectively. The white and black dots represent the locations of observed and forecasted and eddy centers. The blue and yellow lines connect matched CEs and AEs. The black box marks typical cases of erroneous matching. (c) The distance distribution of the matched eddies (bar, right y-axis) and the cumulative distribution (dashed, right y-axis).
Jmse 13 01571 g002
Figure 3. The STD of SLA (m) for (a) AVISO data, (b) 1-day lead forecast, and (c) 5-day lead LFS forecast. Daily SLA data from 1 December 2021 to 30 November 2022 was adopted for the calculation. Boxes A to D denote four study regions in this paper: Western South China Sea (WSCS, 7°–16° N, 110°–114° E), Northeastern South China Sea (NESCS, 16°–22° N, 114°–120° E), Subtropical Countercurrent Region (STCC, 18°–24° N, 125°–150° E), and Kuroshio Extension Region (KE, 30°–2° N, 145°–160° E). The spatial pattern correlation coefficients (SPCCs) between the forecast and the observation are shown in the upper right of (b,c).
Jmse 13 01571 g003
Figure 4. The mean daily number, amplitude (cm), radius (km), and V (km/day) of all eddies in NWP are shown from the first to fourth columns during the period of 1 December 2021 to 30 November 2022, respectively. The first to fourth rows represent observations, simulations, differences between simulation and observation, and average daily relative errors in NWP. All eddies, CEs, and AEs are represented in the last row as black, blue, and red curves, respectively.
Jmse 13 01571 g004
Figure 5. The numbers of correct, missing, and false eddies. The daily number of eddies within each grid cell was calculated and remapped onto 2° × 2° grids over the entire study period.
Jmse 13 01571 g005
Figure 6. The amplitude (cm) of correct eddies for (a) the 1-day lead LFS forecast and (b) AVISO, and (c) the difference between forecast and AVISO. (di) are the same as (ac), but for the radius (km) and V (km/day) of correct eddies. All values were remapped into 2° × 2° grids for the whole study period.
Jmse 13 01571 g006
Figure 7. The amplitude (cm) of (a) the missing eddies, (b) the differences between missing and corrected eddies, (c) the false eddies, (d) the differences between false and corrected eddies for the LFS 1-day lead forecast. (el) are the same as (ad), but for radius (km) and V (km/day). All values were remapped into 2° × 2° grids for the whole study period.
Jmse 13 01571 g007
Figure 8. The correct (Pcorrect), missing (Pmissing), and false (Pfalse) rates for (a) all ocean eddies, (b) CEs, and (c) AEs in the whole region (black), the eddy-rich regions (blue), and the eddy-poor regions (red) are shown for lead times of 1 to 15 days.
Jmse 13 01571 g008
Figure 9. The number of eddies against the amplitude (cm, histogram, right y-axis) and the relationship between the amplitude (cm) and distances (km, dots, left y-axis) for (a) all ocean eddies, (b) CEs, and (c) AEs. The red lines represent the regression results, exceeding the 99% confidence level except for (d,f). (di) are the same as (ac), but for the radius (km) and V (km/day) of correct eddies. The values of R2 are also shown in the figures.
Jmse 13 01571 g009
Figure 10. The distances (km) of correct eddies vary with lead time from 1 to 15 days. The black line represents the mean distance of all correct eddies. The red, yellow, and purple curves represent the eddies with amplitudes greater than 1.1 cm and velocities greater than 15 km/day, 2 km/day, and 1 km/day, respectively. All criteria were determined using the statistics of the correct AVISO eddies.
Jmse 13 01571 g010
Figure 11. The number of CEs and AEs in the NWP, eddy-rich, and eddy-poor regions. Blue bars indicate CEs; red bars indicate AEs; solid bars represent observations; and dashed bars represent forecasts.
Jmse 13 01571 g011
Table 1. The statistically averaged and standard deviations of daily number, amplitude, radius, and V of eddies in NWP during 1 December 2021–30 November 2022. Observations and forecast results in a lead time of 1, 3, 5, 7, 9, 11, 13, and 15 days are listed.
Lead TimeAVISO1 Day3 Days5 Days7 Days9 Days11 Days13 Days15 Days
Daily NumberMean422.75387.84345.44352.82355.94357.95359.33361.32363.27
STD42.2020.7919.8118.6719.8419.2619.4619.9217.66
Amplitude
(cm)
Mean5.654.424.724.674.654.674.664.674.65
STD7.936.46.66.576.526.536.546.526.48
Radius
(km)
Mean62.6465.3666.5166.1365.8665.7465.565.4665.27
STD27.6228.5629.3529.1328.9328.7728.4928.428.33
V
(km/day)
Mean4.375.455.605.645.675.745.825.945.81
STD3.885.445.114.954.925.065.245.826.25
Table 2. Number of observed (na), forecast (nl), matched eddies (nm), Pcorrect, Pmissing, and Pfalse in different regions.
NWPEddy-Rich RegionEddy-Poor Region
n a 148,80960,87287,937
n l 136,33349,33486,999
n m 93,72137,41656,305
p c o r r e c t 62.9861.4764.03
p m i s s i n g 37.0238.5335.97
p f a l s e 31.2624.1635.28
Disclaimer/Publisher’s Note: The statements, opinions and data contained in all publications are solely those of the individual author(s) and contributor(s) and not of MDPI and/or the editor(s). MDPI and/or the editor(s) disclaim responsibility for any injury to people or property resulting from any ideas, methods, instructions or products referred to in the content.