Article

Sedimentary Processes of Gas Hydrate-Bearing Layers in the Dongsha Area, South China Sea: Implications for Hydrate Accumulation

1
School of Ocean Sciences, China University of Geosciences (Beijing), Beijing 100083, China
2
Key Laboratory of Polar Geology and Marine Mineral Resources, China University of Geosciences (Beijing), Ministry of Education, Beijing 100083, China
3
Hainan Institute, China University of Geosciences (Beijing), Sanya 572025, China
4
Bureau of Geophysical Prospecting INC., CNPC, Zhuozhou 072751, China
5
Qingdao Institute of Marine Geology, China Geological Survey, Qingdao 266237, China
*
Authors to whom correspondence should be addressed.
J. Mar. Sci. Eng. 2025, 13(8), 1550; https://doi.org/10.3390/jmse13081550
Submission received: 7 July 2025 / Revised: 31 July 2025 / Accepted: 8 August 2025 / Published: 12 August 2025

Abstract

The methane flux in the Dongsha area in the northern South China Sea is relatively high. The results indicate the presence of both shallow and deep gas hydrate reservoirs at the Site DS-W08. The gas hydrate reservoir in this area is mainly composed of fine-grained sediments, and high-saturation gas hydrates are present. The shallow-GHR (8–24 mbsf) exhibits a maximum hydrate saturation of 14% (pore volume). The deep-GHR (below 65 mbsf) shows a maximum hydrate saturation of 33% The suspended sedimentation process on the banks of turbidity currents and the deep-water traction current sedimentation process play potentially important roles in the enrichment of gas hydrates. To investigate the influence of sedimentary processes on gas hydrate accumulation, this study analyzed gas hydrate saturation, sediment grain size, grain compositions, biological components, and geochemical characteristics of hydrate-bearing and adjacent layers at Site DS-W08. Sediment grain size analysis suggests that the studied layer was formed through the interaction of turbidity current-induced overbank suspended deposition and traction current deposition. By comprehensively analyzing the comparison of sediment Sr/Ba ratios and the data of foraminifera and calcareous nannofossils, it is found that the bank deposits and traction current deposits triggered by turbidity currents correspond to glacial periods and interglacial periods, respectively. Analysis of biological components shows that layers with high foraminifera content and traction current-modified sediments are more favorable for gas hydrate accumulation. Hydrate reservoirs are all composed of traction current deposits, and the cap rock rich in foraminifera fossils at the top promotes hydrate formation; while the fine-grained turbidites formed during the turbidite deposition process inhibit hydrate accumulation. This study aims to deepen the understanding of the enrichment mechanism of natural gas hydrates and support the commercial development of fine-grained sediments in the northern South China Sea.

1. Introduction

Natural gas hydrate (hereinafter referred to as hydrate) is a crystalline compound that forms under specific conditions of pressure, temperature, and water salinity [1,2,3]. It is an ice-like clathrate in which low-molecular-weight gases—primarily methane, but also ethane and carbon dioxide—are typically found in a marine environment at depths greater than 500 m or in terrestrial permafrost regions [2,4]. The decomposition of hydrate alters the mechanical properties and pore pressure of seabed sediments, potentially triggering geological hazards such as continental shelf collapse and submarine landslides [5,6,7,8]. The instability of hydrates releases methane, a potent greenhouse gas, which not only impacts the ocean carbon cycle but may also exacerbate global climate change [9,10,11,12]. Gas hydrates represent a potential and enormous energy treasure trove and are regarded as one of the important energy sources that may replace traditional fossil fuels in the future [13,14,15,16,17].
Currently, 98% of the explored global hydrate resources are located in submarine sediments, while only 2% are found on land [4,18]. In offshore hydrate accumulation systems, sediment grain size plays a critical role in the formation and enrichment of hydrates [19,20,21]. In sandy environments, gas hydrates preferentially accumulate in coarser sediments due to their higher porosity and permeability. For instance, highly saturated hydrates have been identified in sandy sediments within turbidity current channels in the Nankai Trough [22], Alaminos Canyon in the Gulf of Mexico [23], Krishna-Godavari Basin [24], and the Qiongdongnan area of the South China Sea [25]. Fine-grained sediments in offshore areas are one of the main carriers for gas hydrates, and such sediments usually have the characteristics of low porosity and low permeability [26]. Drilling results from the northern South China Sea [27,28] and the Ulleung Basin [29] confirm the potential for highly saturated hydrate reservoirs in fine-grained sediments. Similar findings are reported in fossil seep carbonates associated with gas hydrate destabilization, enclosed in hemipelagic and turbiditic fine-grained mudstones and siltstones [30]. The control mechanisms for hydrate accumulation in fine-grained sediments are not fully understood in some respects at present. Simulations of experimental samples confirmed that in fine-grained sediments, hydrates can form via a particle displacement model, leading to the development of massive or vein-like hydrates [31]. However, significant differences remain between experimental samples and actual field conditions. Field-based studies indicate that in fine-grained sediments, there is no linear correlation between sediment particle size and hydrate saturation [32]. Compared to non-hydrate layers, hydrate-bearing sediments may contain higher amounts of felsic detrital minerals (primarily quartz and feldspar) and lower concentrations of clay minerals, particularly illite–smectite mixed layers [33,34]. The impact of various mineral types on hydrate formation differs markedly. Molecular dynamics simulations confirm that hydrophilic quartz surfaces enhance the ordered arrangement of water molecules, significantly reducing the nucleation energy barrier of methane hydrate and effectively promoting its nucleation rate and crystal growth. In sediments, a high proportion of felsic minerals results in a looser overall structure and larger pores between sedimentary particles, providing essential spatial conditions for hydrate formation [35,36]. Clay minerals, particularly expansive clays like illite–smectite mixed layers, reduce porosity by filling pore spaces due to their high specific surface area and strong water absorption and expansion properties, thus inhibiting gas diffusion. Additionally, the complex microstructure formed hinders hydrate aggregation [37,38]. Sediments rich in illite–smectite mixed layers strongly bind methane gas and fluids, hindering their migration. Some studies have also suggested a correlation between foraminiferal abundance and the occurrence of high-quality hydrates [39]. However, within the hydrate stability zone, not all intervals with high foraminiferal content led to hydrate enrichment [26]. The sedimentary process is influenced by paleo-marine environments and paleoclimatic conditions, such as sea-level fluctuations, and affects the microstructure and composition of sediments [40,41,42,43]. Therefore, understanding sedimentary processes is essential for revealing hydrate accumulation in fine-grained sediments [44,45,46]. Turbidites are considered favorable for hydrate enrichment. In the Dongsha and Shenhu areas of the northern SCS, water depths are large, ranging from 800 to 1100 m, with a relatively low sediment source supply flux [47]. The sediments are mainly composed of silty clay or clay, with grain sizes all below silt grade (64 μm) [48]. Fine-grained turbidites in the submarine canyons are primarily formed by low-density turbidity currents [49,50,51,52]. The grain size of these sediments may not differ significantly from that of suspended deposits near the overflow margin. Therefore, the extent to which sedimentary processes influence hydrate accumulation in fine-grained layers requires further investigation. Sedimentary processes provide a link between the macroscopic accumulation of hydrates and the microscopic sediment structure, as well as mechanisms of hydrate formation.
The Dongsha area contains abundant gas hydrate resources. During the second China National Gas Hydrate Program Expedition (GMGS2) conducted by the Guangzhou Marine Geological Survey in 2013, both shallow and deep gas hydrate reservoirs were identified in the Dongsha area, offering valuable insights into the sedimentary processes associated with hydrate formation. We performed grain-size, geochemical, and biogenic analyses on sediment samples from hydrate reservoirs and adjacent strata in the Dongsha area. These analyses revealed differences in sedimentary features between hydrate-bearing and adjacent layers, provided insights into the evolution of the paleo-marine environment, and highlighted the role of sedimentary processes in controlling hydrate reservoir formation.

2. Geological Setting

The South China Sea is bordered to the west by a fossil subduction zone and to the east by a transform fault zone. Its tectonic framework shows notable similarities to other marginal seas in the western Pacific, such as the Komandor Basin in the Sea of Okhotsk, the Sulu Sea, and the Sulawesi Sea [53,54,55]. The northern slope of the South China Sea represents a typical passive continental margin, where numerous oil and gas basins have developed along a southwest-northeast direction. Notably, the eastern part of the northern South China Sea exhibits features of both passive and active continental margins [56]. The study site is situated in the Dongsha area, on the northeastern slope of the South China Sea (Figure 1a). The Dongsha area lies in the eastern part of the Pearl River Mouth Basin, near the central uplift zone of Taixinan Basin. Water depth in this area varies significantly, increasing gradually from 200 m to over 2400 m (Figure 1a). The geothermal gradient ranges from 3.3 to 4.5 °C/km, which favors the formation of hydrates. The seafloor morphology is complex, featuring numerous seamounts, canyons, and hills. A prominent submarine canyon extends from the northwest to the southeast, spanning from the upper shelf to the lower slope, and transports a large amount of sediment to the slope and rises [57]. The Dongsha area also contains numerous mud diapirs and faults. Some faults penetrate the basin floor, while others extend to the seafloor, facilitating the migration of methane and hydrocarbons, and promoting the formation of natural gas hydrates [58,59]. Gas chimneys are widely observed in the Dongsha area, particularly along submarine ridges [57,60]. Faults and gas chimneys serve as key pathways for the upward migration of fluids in the Dongsha area [21,57]. In the Dongsha area, natural gas hydrates primarily occur in massive, layered, veined, nodular, and scattered forms. However, multiple episodes of methane leakage have occurred within the hydrate-bearing layers, accompanied by anaerobic oxidation of methane (AOM), leading to the formation of abundant authigenic minerals, including carbonates, pyrite, and gypsum.
In 2013, the GMGS carried out the China Notions Gas Hydrate Program Expedition 2 (GMGS2), which marked a significant breakthrough by obtaining high-purity gas hydrate samples for the first time in China. At the Site W08 (Figure 1b), located at a water depth of 801 m and a drilling depth of 95 m, the lower boundary of the gas hydrate stability zone is approximately 120 m below the seafloor (mbsf). Two hydrate-bearing layers were identified at the depths of 8–23 mbsf and 66–92 mbsf.

3. Materials and Methods

3.1. Site and Samples

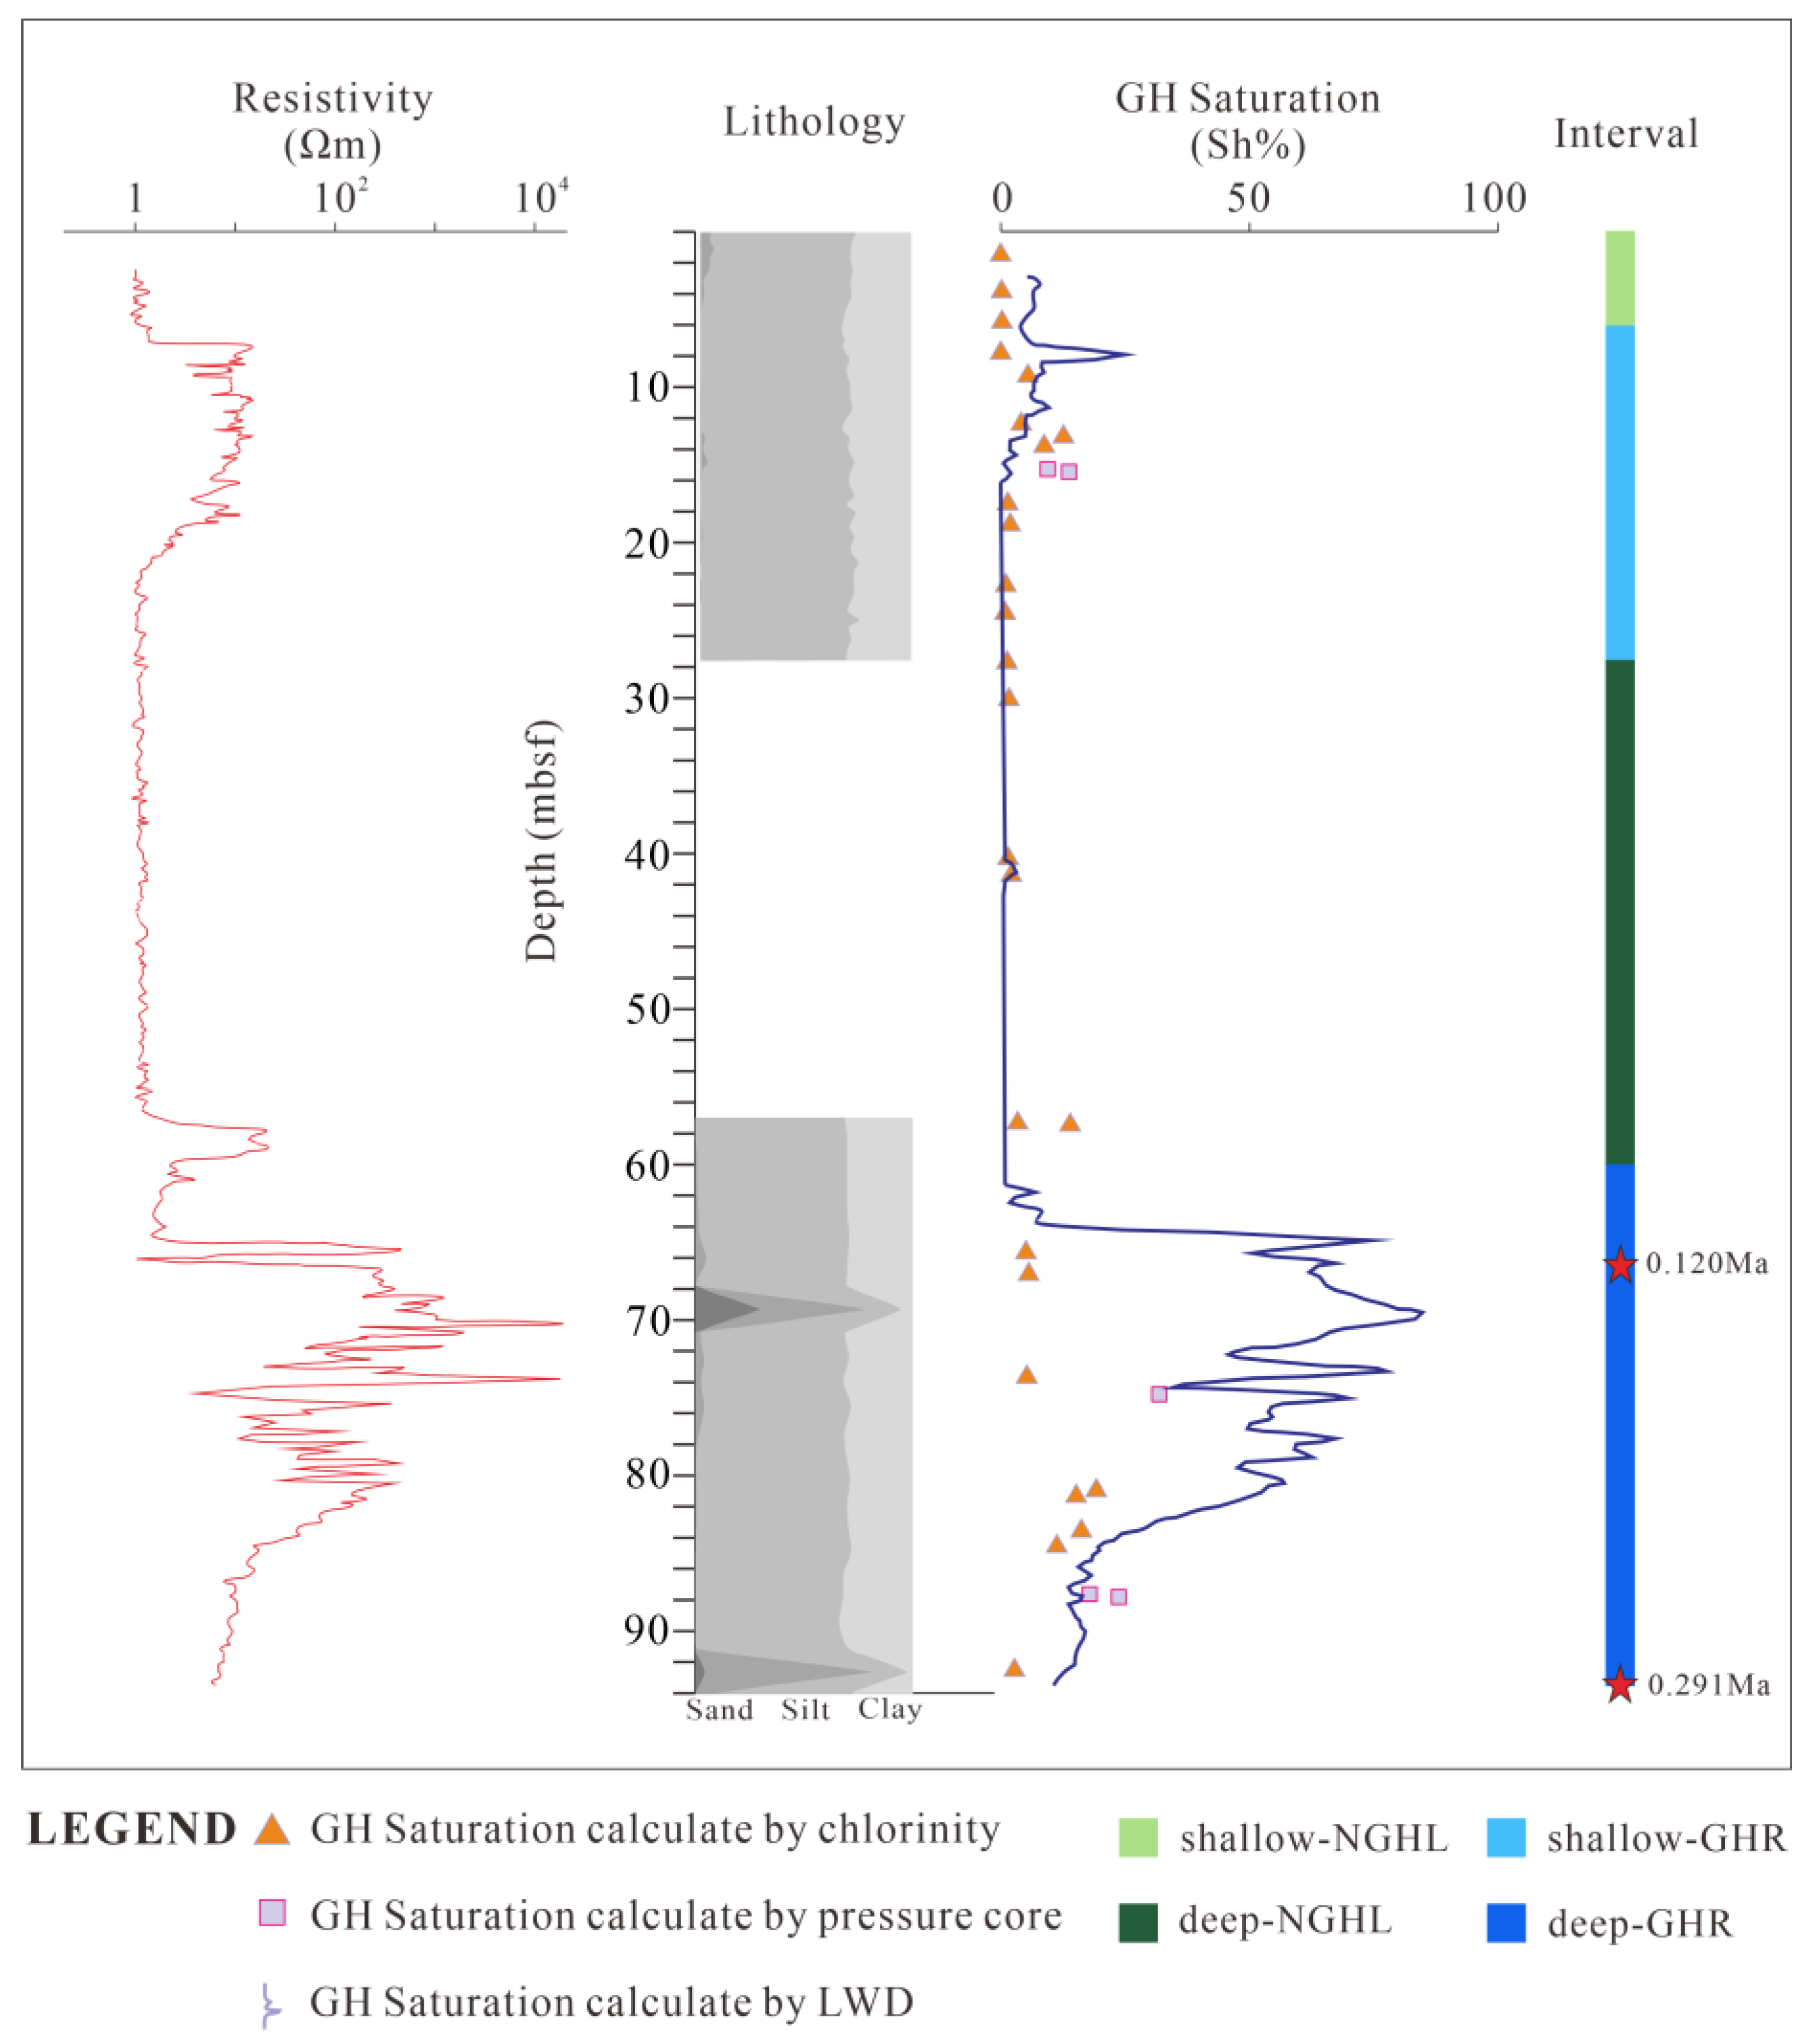
Core drilling at Site DS-W08 reached a depth of 95 mbsf, with samples primarily obtained from two intervals: the upper (0–28 mbsf) and lower (58–94 mbsf) intervals. Shallow gas hydrate reservoirs at Site W08 are found at 8–24 mbsf, primarily in massive, layered, veined, and nodular forms. Since the primary exploration target at this site is the hydrate-bearing zone, and the interval from 28 to 58 mbsf did not show clear hydrate occurrence characteristics in seismic exploration and well logging analysis, coring operations were not performed (Figure 2). Deep gas hydrate reservoirs occur at 66–92 m, predominantly in massive and dispersed forms. Additionally, authigenic carbonate minerals were identified near the seafloor and around the 60 mbsf sedimentary layer, leading to increased resistivity [61]. Sediment samples were extensively collected from both hydrate-bearing and adjacent non-hydrate layers. A total of 78 samples were analyzed for grain size, major and trace elements, and biological contents.

3.2. Grain-Size

This study employed laser diffraction for particle size analysis, requiring sample pretreatment prior to experimentation. Before sampling, the samples were thoroughly mixed to ensure representativeness. A gram of sediment sample was placed in a glass cup, with 5 ml of purified water and 0.5 mol/L sodium hexametaphosphate ([NaPO3]6) added. The sample was soaked for 24 h, with gentle stirring every 8 h to ensure complete dispersion. All soaked samples were transferred to the laser sample chamber, where ultrasonic vibration and high-speed centrifugation were applied to achieve thorough dispersion again. The testing program was then immediately initiated.
Laser diffraction was used for particle size analysis. The samples were previously mixed thoroughly to ensure representativeness. A Mastersizer 2000 laser particle size analyzer, manufactured by Malvern Instruments Ltd. (Malvern, Britain), was used for the measurements. This instrument has a measuring range of 0.02~2200 μm and a relative error of less than 3% for repeatability measurements [62]. The obtained data were converted using the Φ grain size scale of the Wudun–Wendehua system, with the formula Φ = −log2D (where D is the particle diameter in millimeters). The McManus’ method was employed to calculate grain size parameters, including mean size (Mz), sorting values (δi), skewness (Ski), kurtosis (Kg), and median size.
M z = φ 16 + φ 50 + φ 84 3
δ i = φ 84 φ 16 4 + φ 95 φ 5 6.6
S k i = φ 16 + φ 84 2 φ 50 2 φ 84 φ 16 + φ 5 + φ 95 2 φ 50 2 φ 95 φ 5
K g = φ 95 φ 5 2.44 φ 75 φ 25
where φ16, φ84, etc., are the particle size φ corresponding to the 16th, 84th, etc., percentiles on the probability cumulative curve, in units of mm.

3.3. Geochemistry

Major element analyses were performed at the GMGS Laboratory using a PerkinElmer Optima 830 ICP-OES instrument (PerkinElmer, Waltham, MA, USA). After cleaning, drying, and grinding, the samples were completely digested into solutions using a hydrofluoric acid, nitric acid, and perchloric acid system. Main elements (such as Si, Al, Fe, Mg) are directly determined by ICP-OES with relatively high precision. This method can accurately determine samples within the range of copper content (345–907 ppm) and zinc content (130–216 ppm). Trace element concentrations measured in this experiment were all in the ppm range, with copper content from 6.9 to 38 ppm and zinc content from 25.3 to 127 ppm. Inductively coupled plasma mass spectrometry (ICP-MS) was used for elements present below the quantification limit of ICP-OES. The sample was decomposed in a closed vessel with nitric, hydrofluoric, and perchloric acids. Hydrofluoric acid was subsequently evaporated in an open system. The resulting salts were dissolved by heating with hydrochloric acid and then converted to a nitric acid medium. Forty-four trace elements were analyzed using ICP-MS. Interference coefficients were determined following sample analysis. A single-element standard solution was used for interference correction, treated as a sample solution, and the concentration of each element was measured. The interference coefficient for each interfering element (barium, manganese, titanium, lanthanum, cerium, neodymium) was calculated as the ratio of its measured concentration to its concentration in the standard solution.

3.4. Microfossils

All samples were prepared using the direct smear method. Coarse-grained sediments were removed, and the fine-grained suspension was evenly spread across the surface of the glass slide. The slides were examined under a Zeiss Axio Imager A1 and A2m polarizing microscope at 1000 times magnification. A total of 200 fields of view were observed, and fossils in 10 randomly selected fields were counted to estimate the relative abundance of microfossil content. Fossil preservation was categorized into four grades: very good, good, moderate, and poor. Calcareous nannofossils were analyzed at the Key Laboratory of Submarine Mineral Resources, Guangzhou Marine Geological Survey.
A total of 16–100 g of dried sample was soaked thoroughly in water, dispersed, and then sieved using a 0.063 mm standard copper sieve. The retained fraction on the sieve was dried and examined under a Zeiss Discovery. V20/LEICA M165C binocular solid microscope (Zeiss, Oberkochen, Germany). Foraminiferal specimens larger than 0.15 mm were counted, and their abundance was quantified based on this size fraction. Foraminifera identification and relative abundance statistics were conducted at the Key Laboratory of Submarine Mineral Resources, Guangzhou Marine Geological Survey.

4. Results

4.1. Hydrate Saturation

Hydrate saturation data are primarily derived from chloride ion anomalies in pore water and gas release measurements from pressure-retaining cores. In addition, high resistivity anomalies are used as an indicator of hydrate-bearing reservoirs [61].
As shown in Figure 2, based on the GMGS2 cruise report and the logging-while-drilling (LWD) resistivity data at Site DS-W08, abnormally high resistivity values are observed between 8–24 mbsf and below 58 mbsf. Additionally, resistivity fluctuations are present within these high-resistivity intervals. In the 8–24 mbsf interval, hydrate saturation estimated from anomalous chloride concentrations in pore water ranges from 0% to 14%. Saturation derived from gas release volumes of pressure-retained cores also ranges from 10% to 14%, with a peak value at 17 mbsf.In the deeper layer (below 65 mbsf), hydrate saturation estimated from chloride anomalies ranges from 30% to 50%, with an average of 33%. Hydrate saturation derived from gas release volumes of pressure-retained cores ranges from 17% to 33%.

4.2. Particle Size

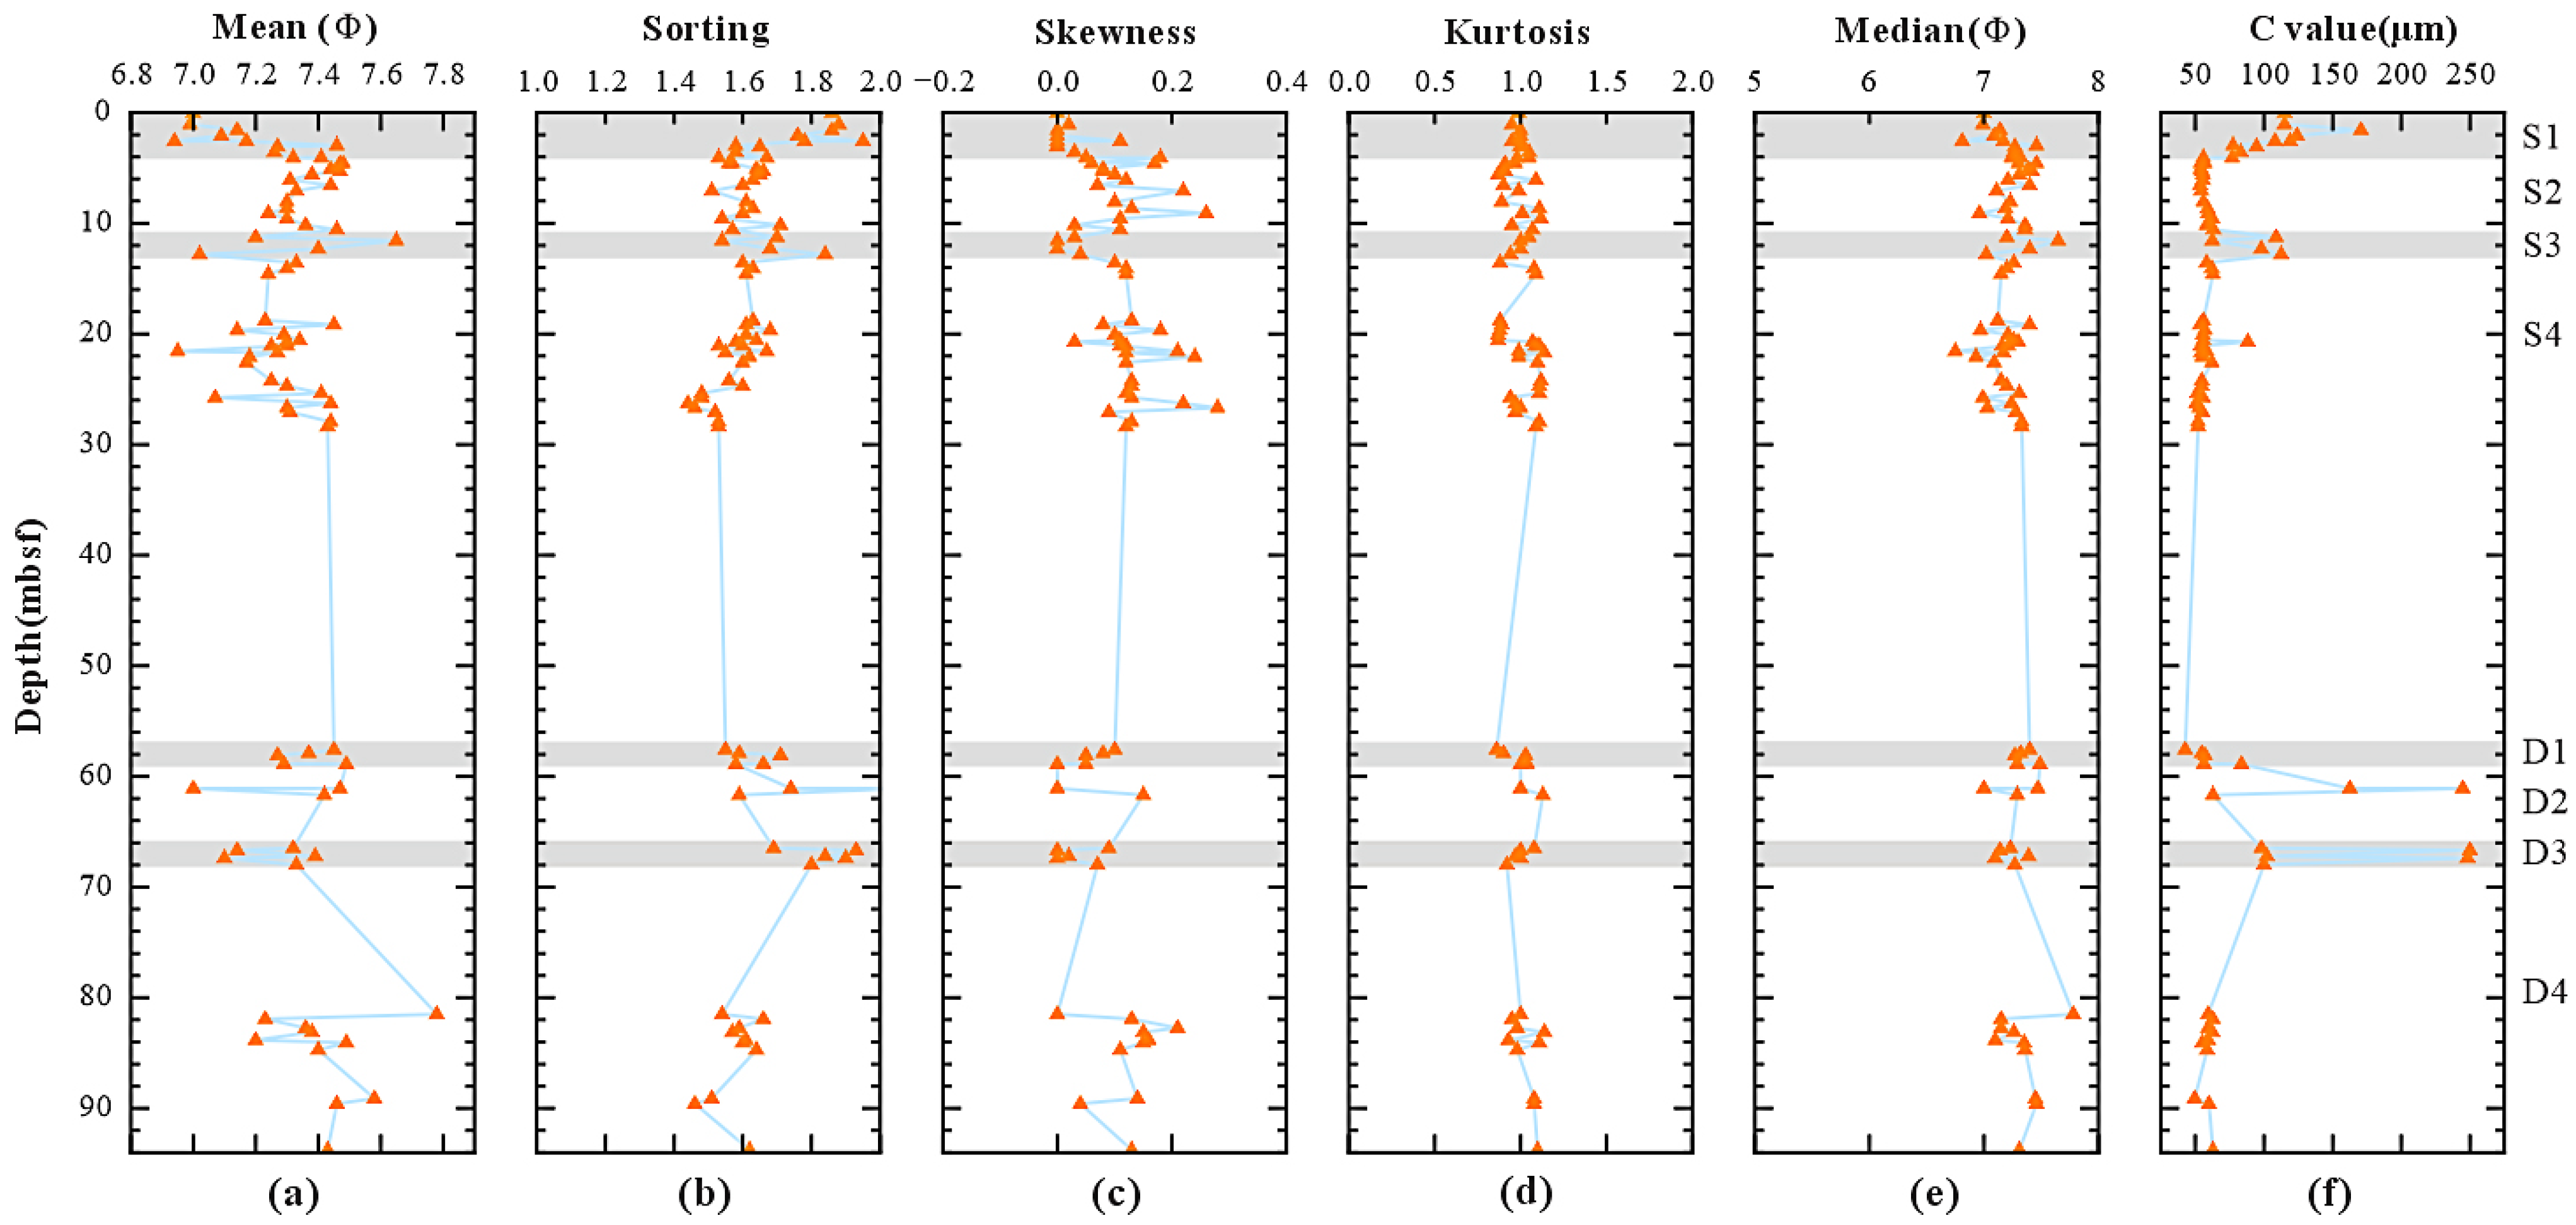
The grain-size parameters of 78 sediment samples from station W08 are presented in Figure 3. These parameters include average grain size, sorting, skewness, kurtosis, and median grain size. The average grain size ranges from 5.94 to 7.65 φ. Sorting values range from 1.44 to 2.07. Skewness ranges from 0 to 0.28, while kurtosis ranges from 0.87 to 1.14. The median grain size ranges from 6.81 to 7.78 φ.
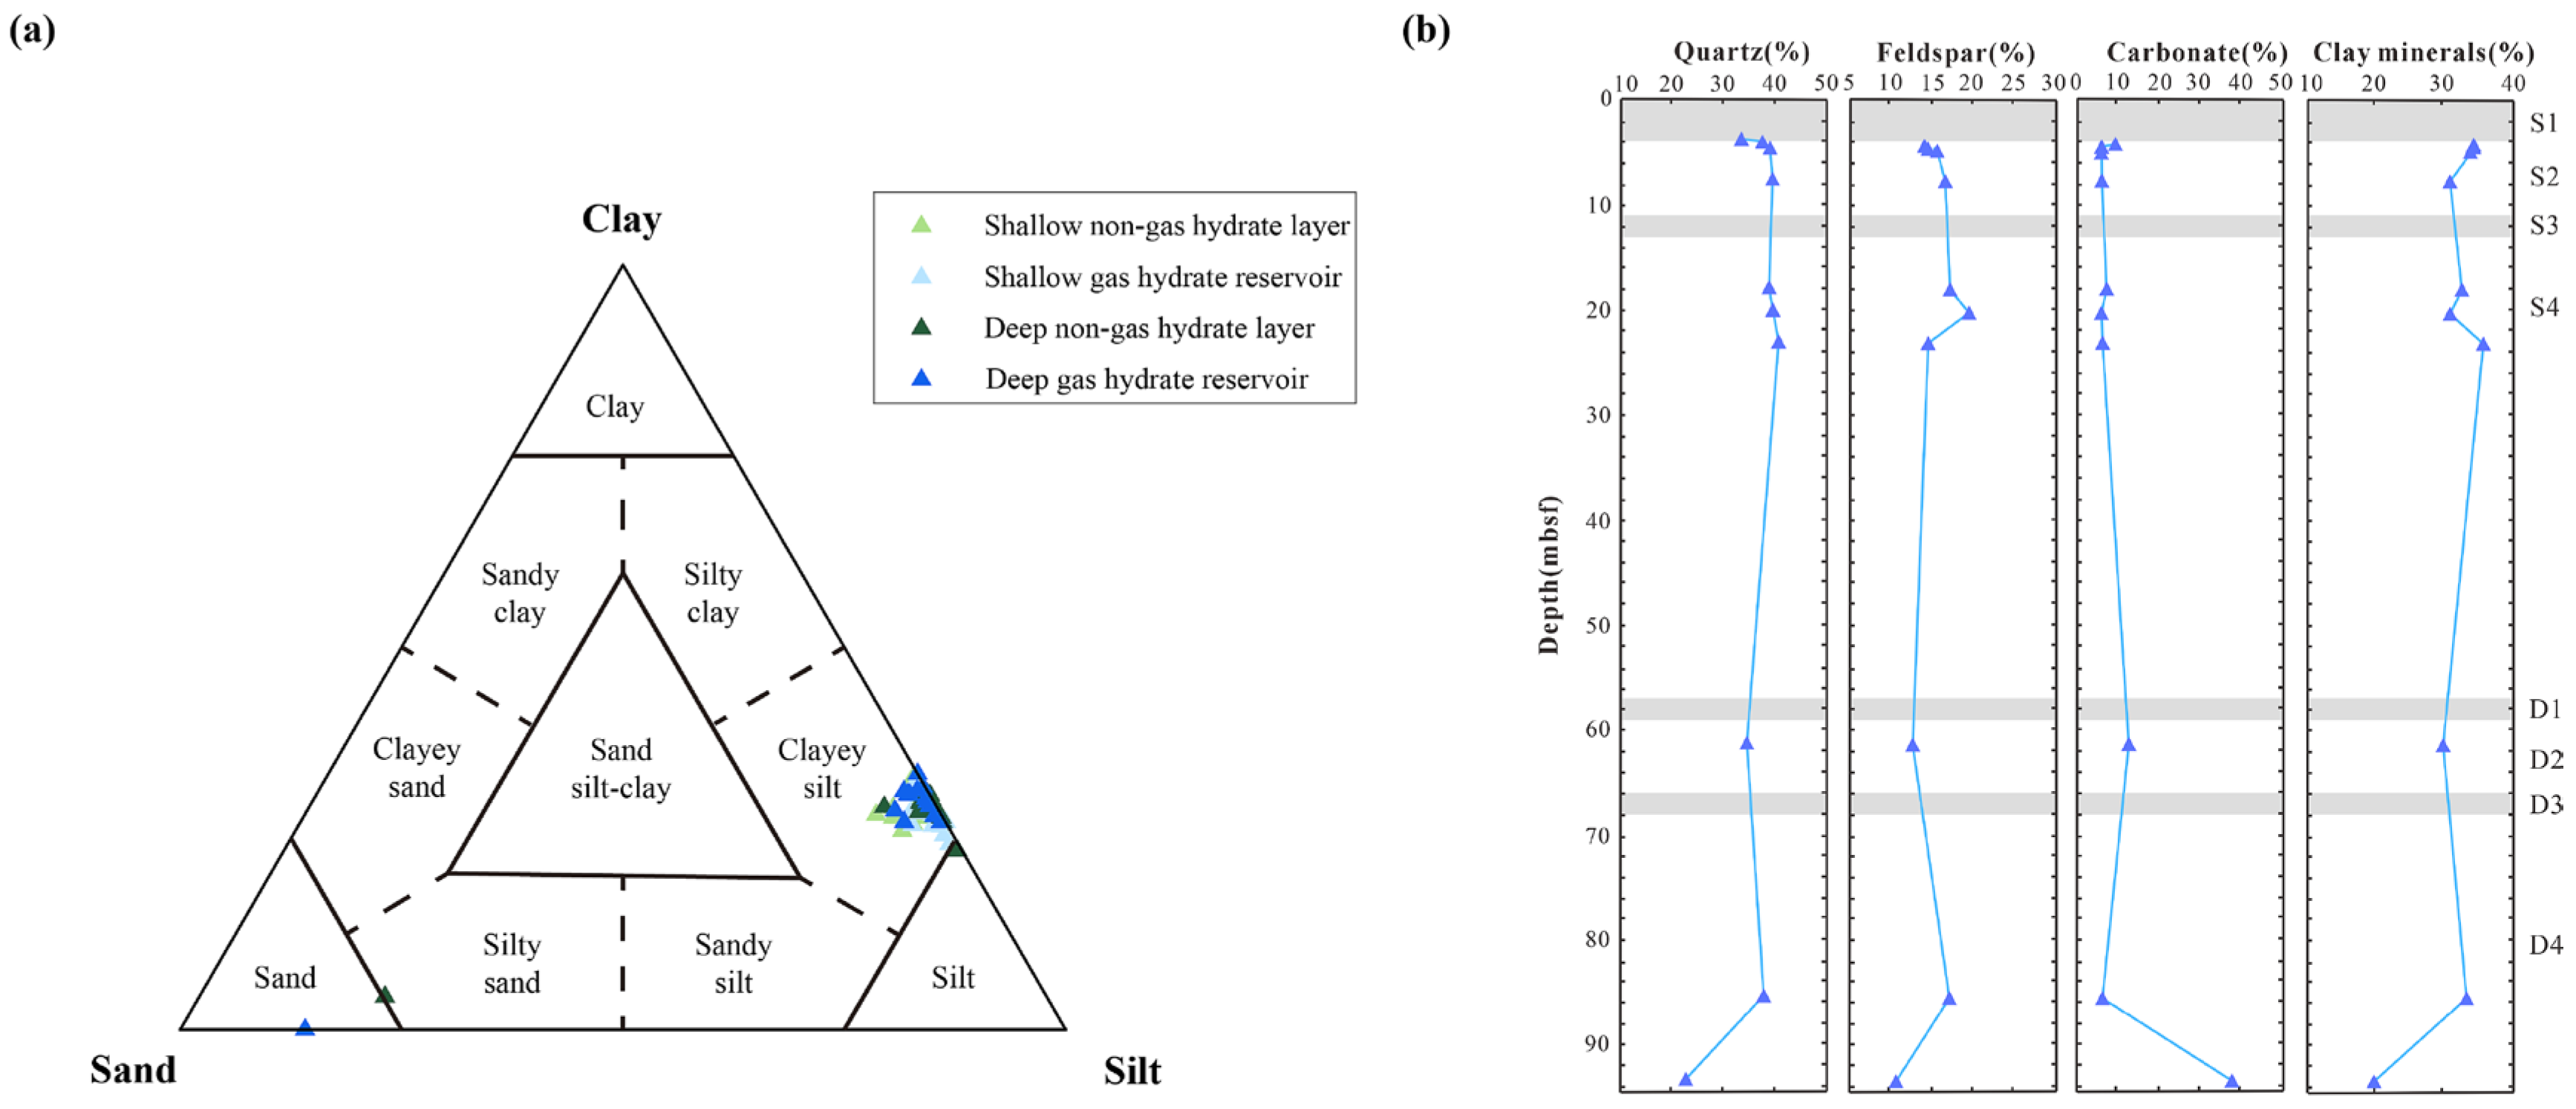
Grain size data indicate minimal lithological variation within the sediment succession at Site DS-W08. Silt dominates the sediment, with clayey silt being common. Silt is the most abundant component, followed by clay, whereas the sand content is minimal. Both shallow and deep hydrate reservoirs are closely associated with clayey silt.
Previous reports on Site DS-W08 indicate that sediment grains primarily consist of quartz, feldspar, carbonate minerals, and clay minerals, with minimal amounts of other heavy and metallic minerals (Figure 4b) [63]. Quartz and feldspar dominate the silt fraction, while the remaining fine-grained sediments are primarily clay minerals. Carbonate minerals mainly comprise calcareous microfossils and authigenic carbonates.

4.3. Geochemical Data

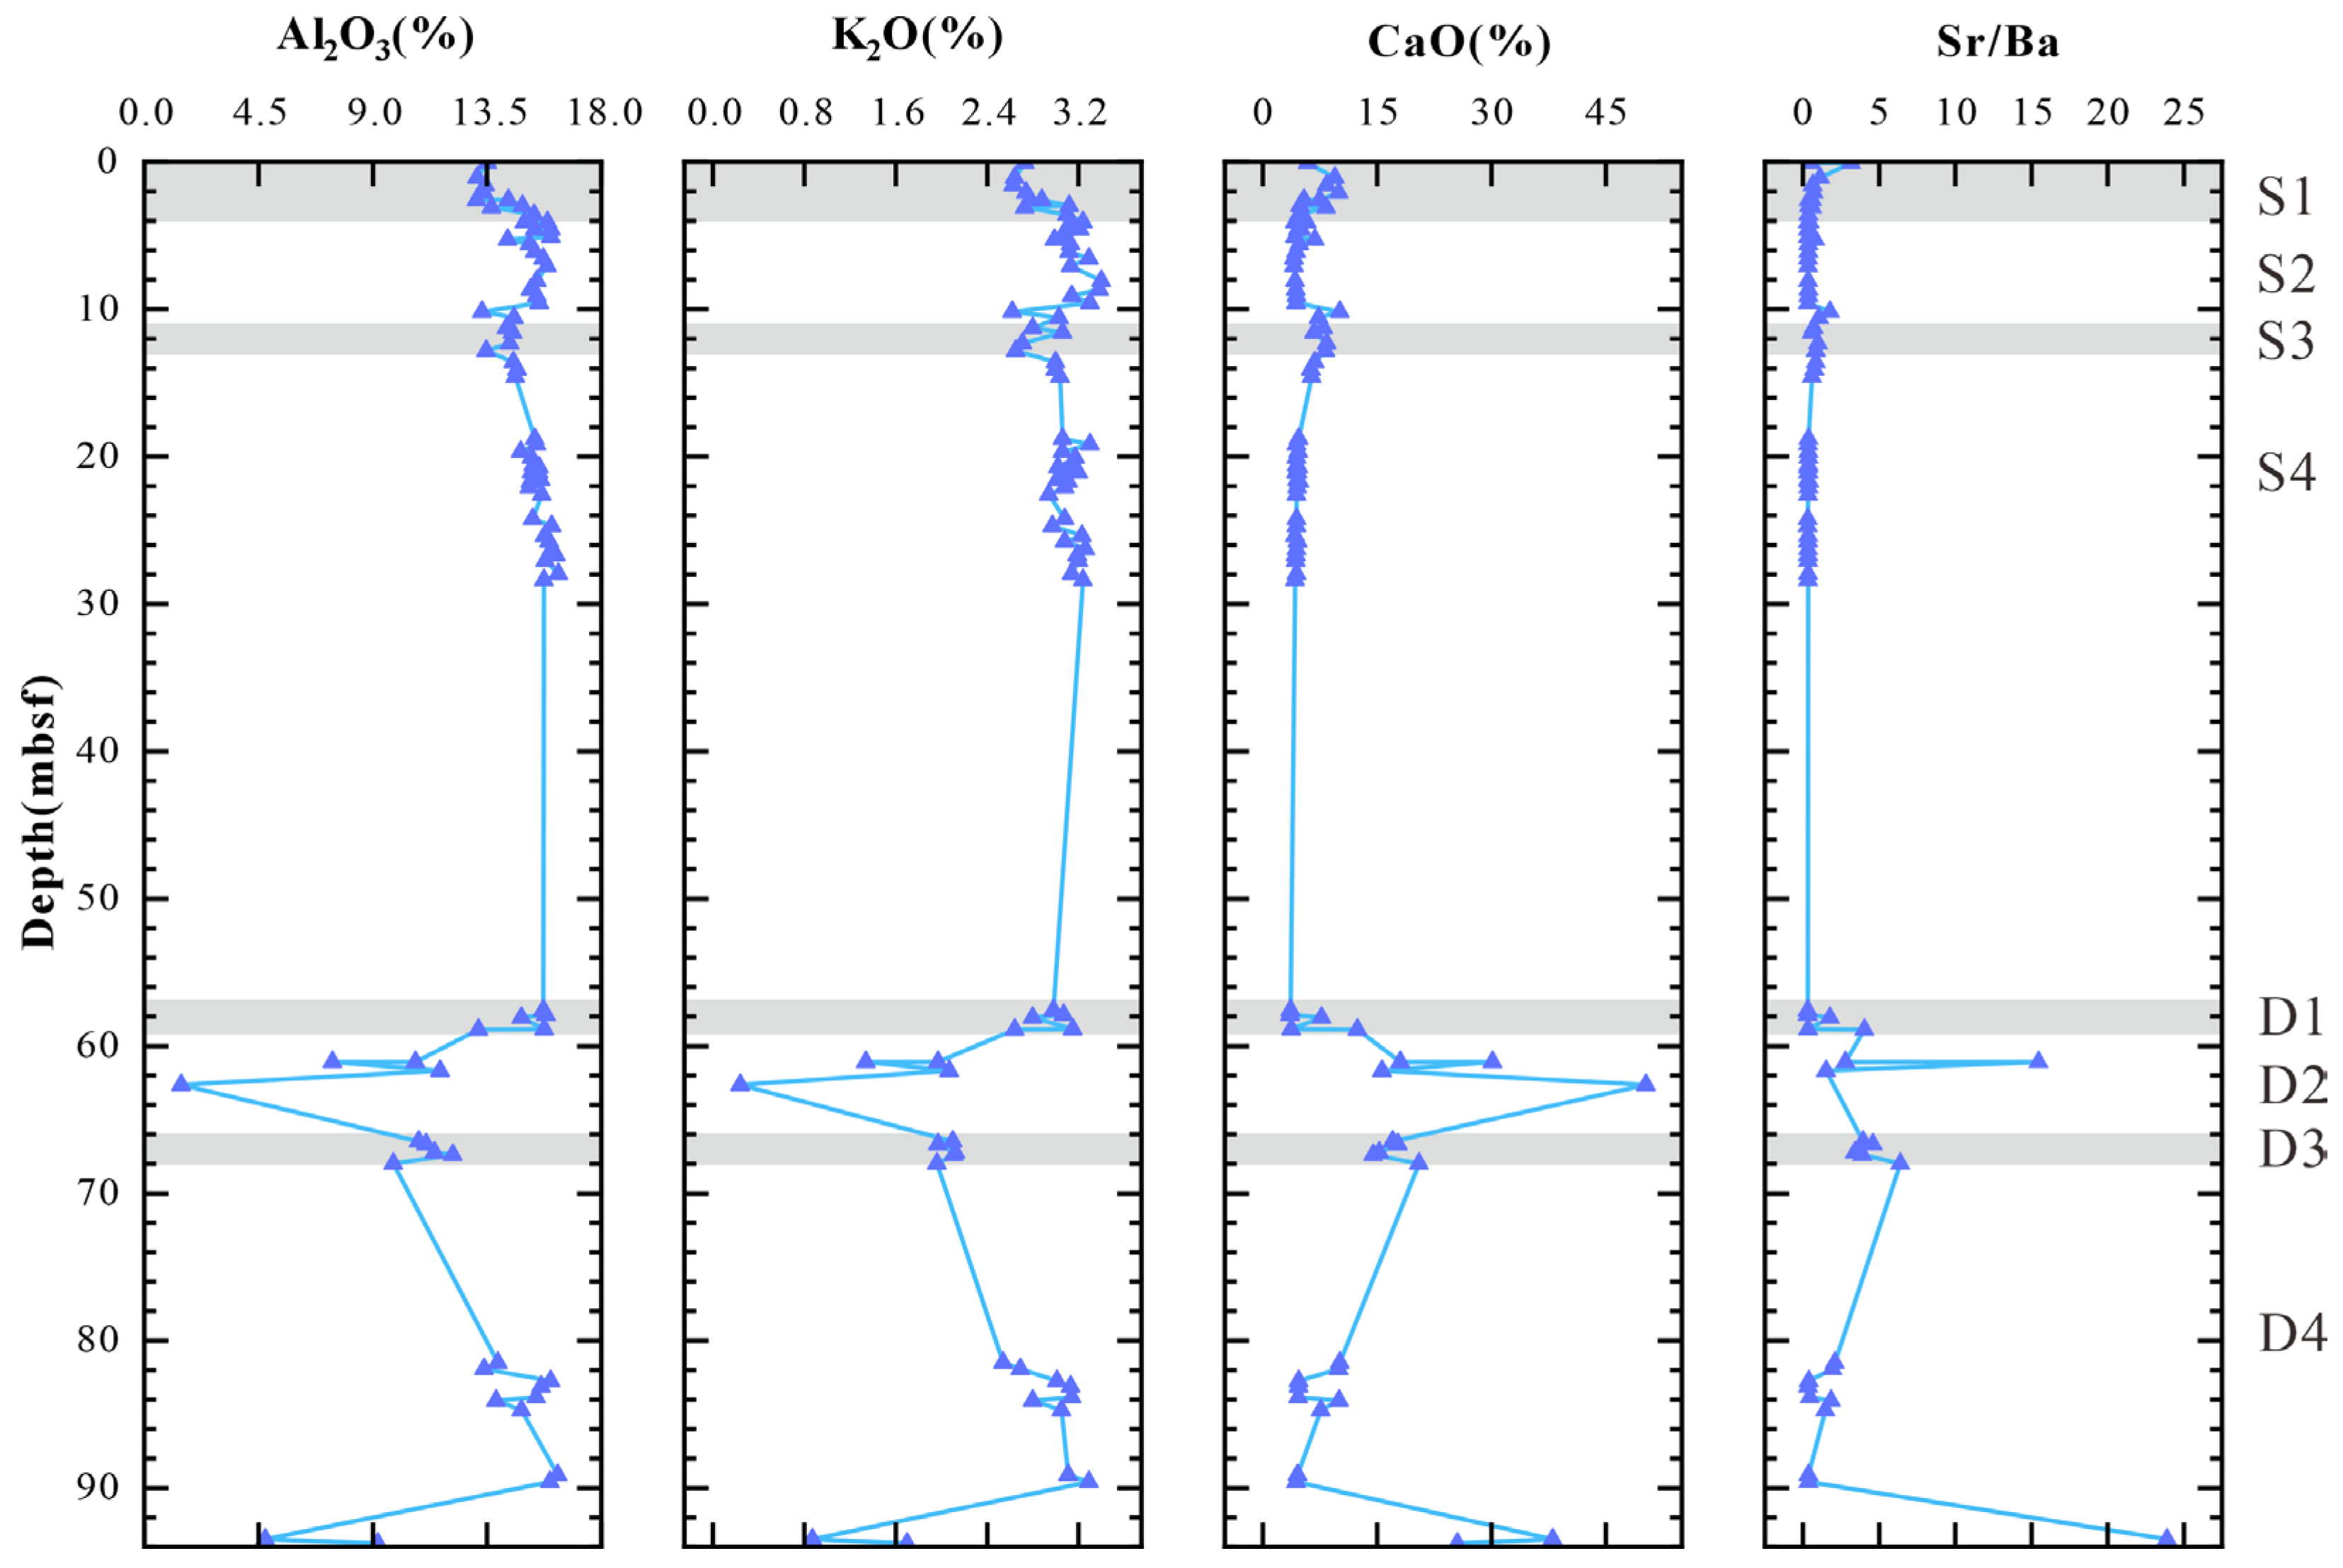
As shown in Figure 5, the main elements analyzed included Al2O3, CaO, K2O, and Al2O3, and ranged from 1.46% to 16.28%. The range of CaO was 3.58% to 50.29%. The range of K2O is 0.87% to 3.38%. The Sr/Ba, a trace element indicator used to infer ancient sea-level fluctuations, was also analyzed. The Sr/Ba ratio ranged from 0.33 to 23.90.

4.4. Microfossil Content

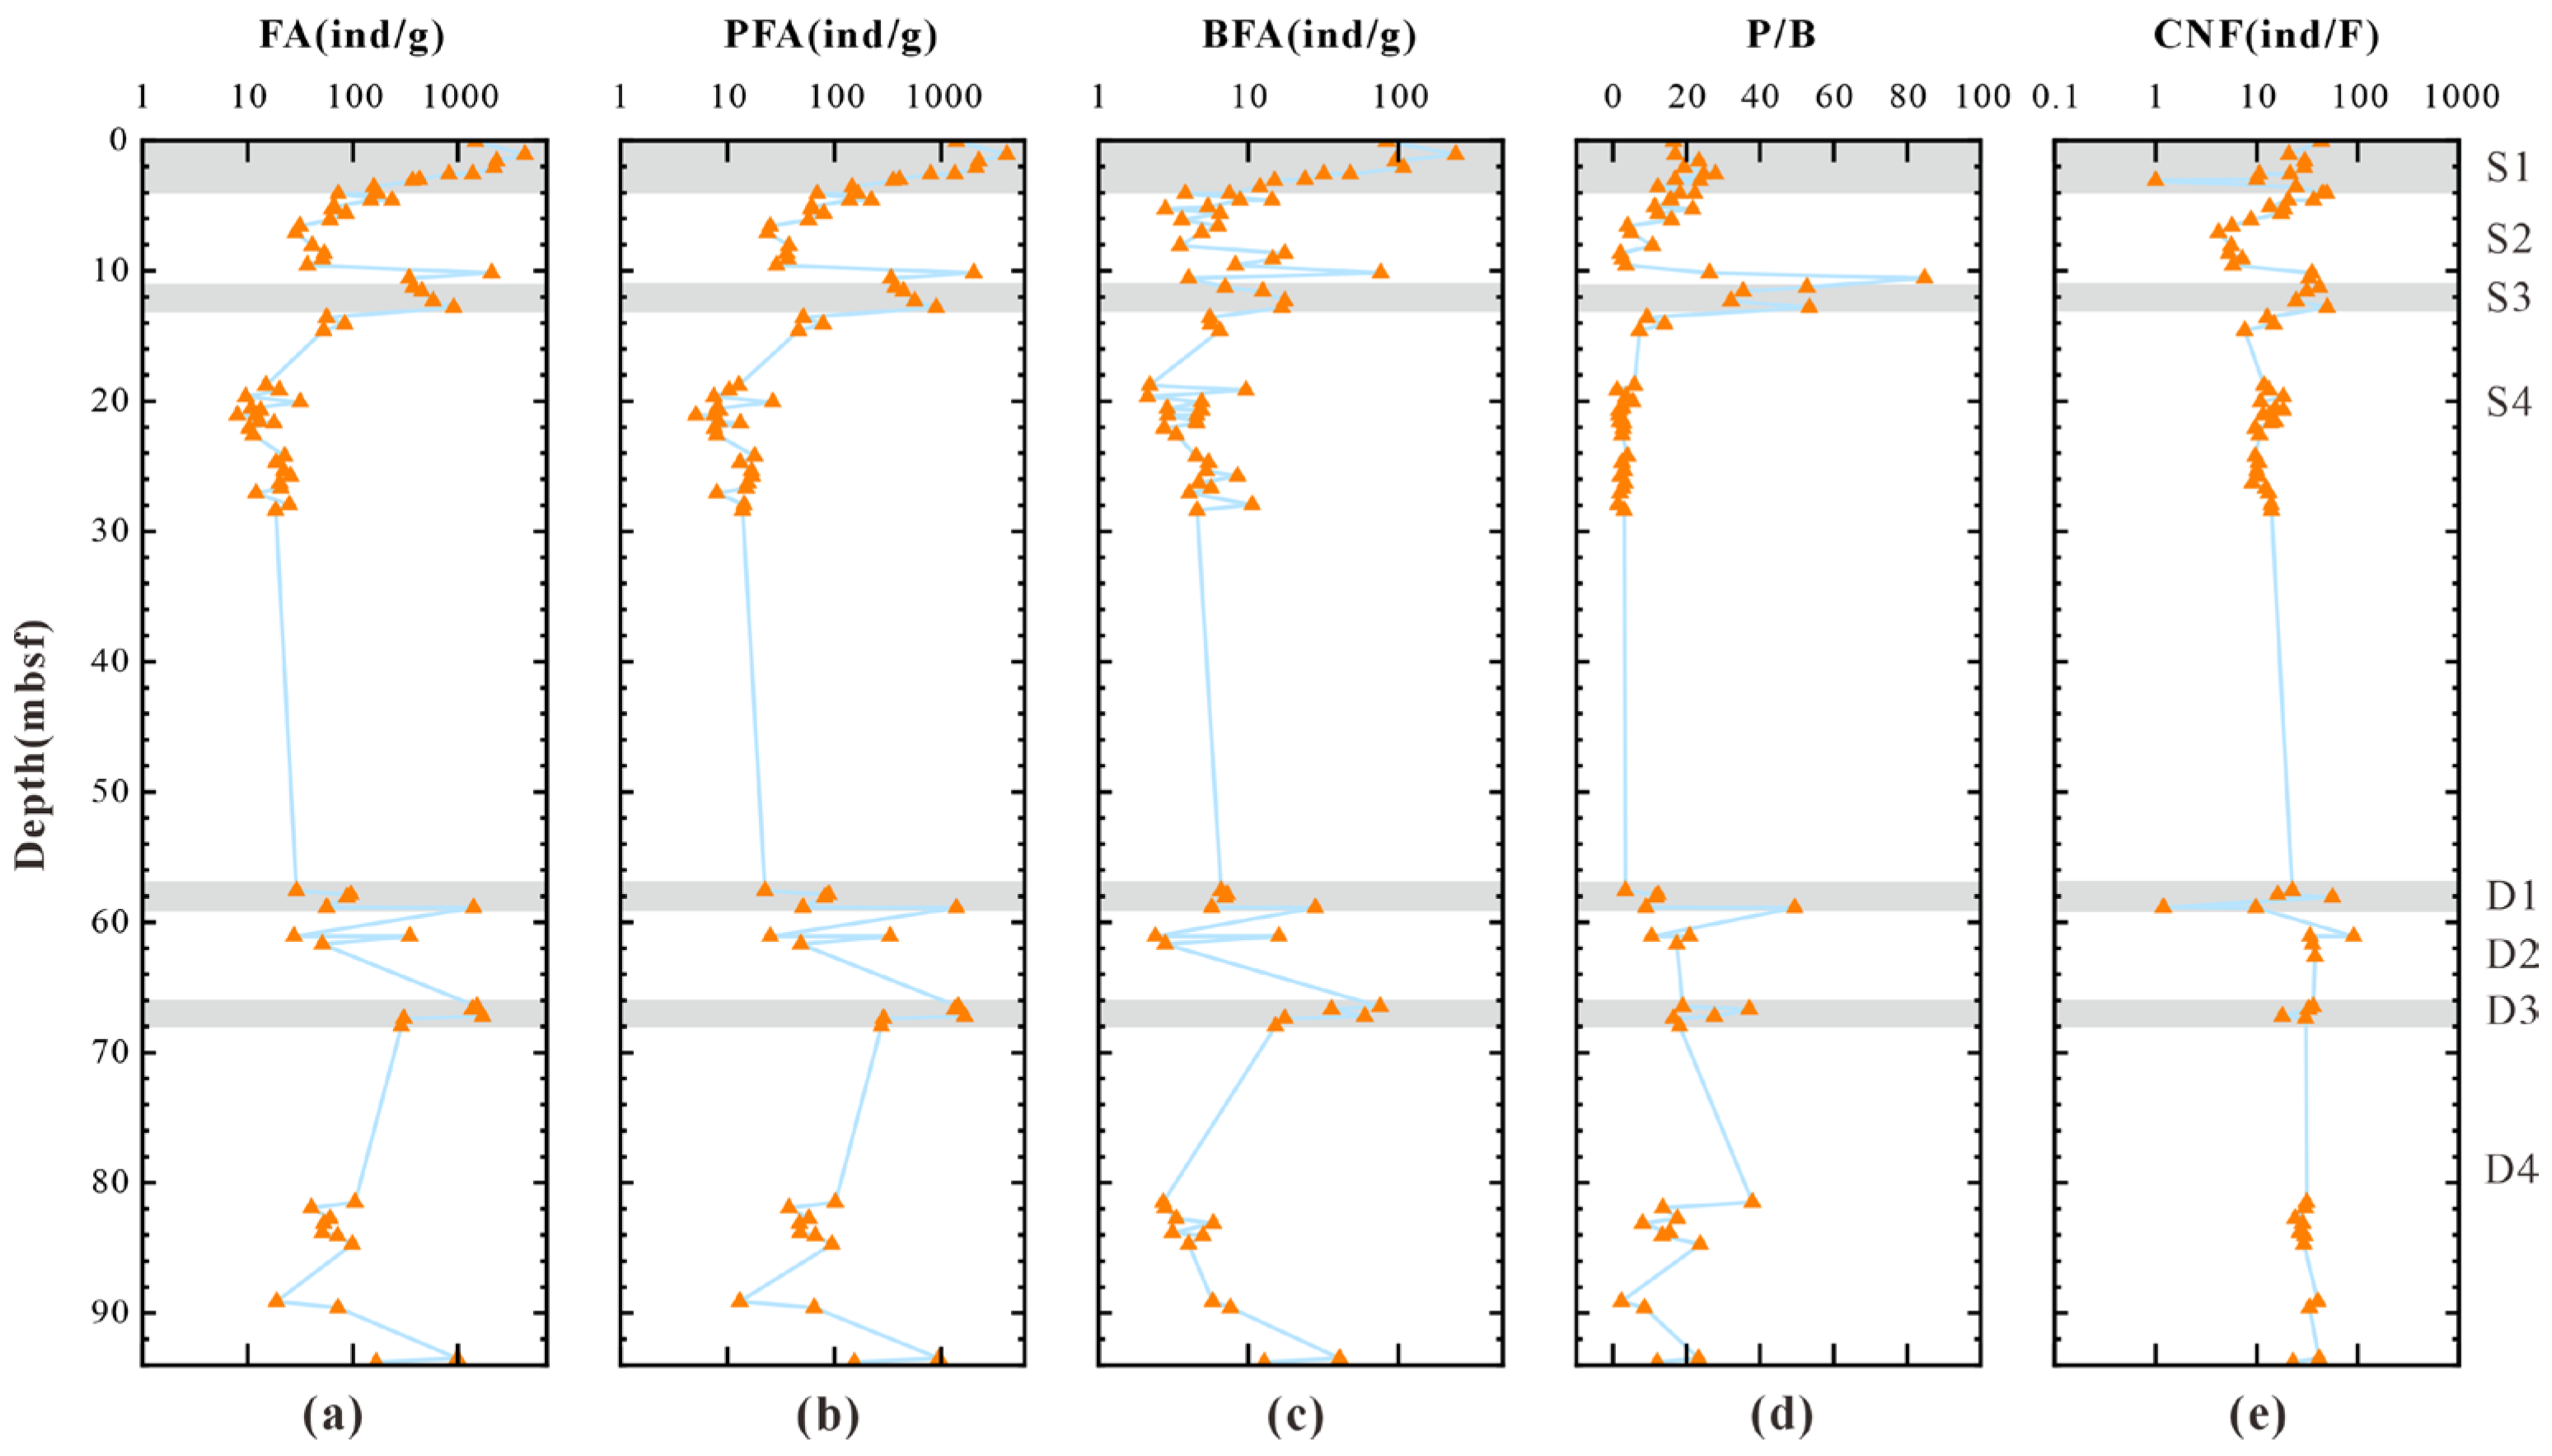
Figure 6 presents the abundance of foraminifera and calcareous nannofossils in the sediment samples from Site DS-W08. According to the cruise report, the samples are dominated by planktonic foraminifera, with Globigerinoides ruber, Neogloboquadrina dutertrei, and Globigerina bulloides as the dominant species. Benthic foraminifera have high abundance and diversity, mainly endobenthic species, with relatively high contents of Bolivina spathulata, Bolivinita quadrilatera, Cassidulina carinata, Cassidulinoides bradyi, Uvigerina peregrina, Bolivina subaenariensis, Bulimina mexicana, and Globobulimina affinis. The total foraminifera abundance ranged from 7.98 to 4352 individuals per gram (ind/g), with an average of 377.36 ind/g. Planktonic foraminifera ranged from 7.5 to 4108.8 ind/g, with an average of 359.18 ind/g. Benthic foraminifera ranged from 2.4 to 243.2 ind/g, with an average of 18.18 ind/g. The ratio of planktonic to benthic foraminifera abundance varied between 1.75 to 53.43, with an average ratio of 14.85. According to the cruise report, the calcareous nannofossils are dominated by Florisphaera profunda, Gephyrocapsa spp. (small), Emiliania huxleyi, and G. oceanica. Obvious recrystallization of calcareous nannofossils occurs at the interval of 59–62 mbsf. The calcareous nannofossils abundance ranged from 0 to 91.3 individuals per field of view (ind/F).

5. Discussion

5.1. Variation Pattern of Hydrate Saturation

Hydrate saturation is a key indicator for assessing hydrate enrichment. It is primarily determined by quantifying chloride ion anomalies in pore water or gas release from pressure-retaining cores [63]. Alternatively, hydrate saturation can be derived from LWD resistivity calculations [64,65]. Among these methods, saturation estimates based on gas release from pressure-retaining cores offer the highest accuracy. However, due to the complexities and high costs associated with pressure-retaining cores, data acquired using this approach are typically limited. Furthermore, the method based on chloride ion anomalies in pore water is not applicable to sediment intervals lacking core sampling. Although saturation estimates derived from LWD resistivity data exhibit good vertical continuity, they may be subject to multiple interpretations. Therefore, this study adopts the mutual verification and comparative analysis of these three methods to accurately determine the hydrate enrichment.
The hydrate saturation data exhibit nearly identical vertical variation trends across the three methods. However, within the 59–62 mbsf interval, resistivity values are markedly elevated. This phenomenon is attributed to the elevated CaO content present in this interval (Figure 5). In the study area, CaO primarily originates from authigenic carbonate minerals and calcareous fossils (specifically foraminifera and calcareous nannofossils) [66]. Figure 5 and Figure 6 indicate that the abundance of calcareous microfossil fossils in the 59–62 mbsf interval does not significantly increase compared with the underlying layers. Thus, these observations suggest a relative enrichment of authigenic carbonate minerals in this interval, which aligns with previous studies and the drilling results presented in the cruise report [67,68].
Based on variations in hydrate saturation, the research layer at Site DS-W08 can be divided into four intervals: shallow non-gas hydrate layer (shallow-NGHL), shallow gas hydrate reservoir (shallow-GHR), deep non-gas hydrate layer (deep-NGHL), and deep gas hydrate reservoir (deep-GHR). The shallow-GHR exhibits a maximum hydrate saturation of 14%. The deep-GHR shows a maximum hydrate saturation of 33% [63]. Clearly, the deep-GHR exhibits higher maximum hydrate saturation than the shallow-GHR.

5.2. Sedimentary Process Identification

Sedimentary processes may significantly control and indicate the accumulation of gas hydrates. Numerous studies on sandy reservoirs have long demonstrated that turbidite deposits facilitate hydrate accumulation. This observation is attributed to the coarse particle size and poor sorting of turbidite deposits in sandy sediments, which create greater reservoir space [69]. However, in fine-grained sediments, the theory may be less applicable because their particle sizes are more uniform. At Site DS-W08, the dominant lithology is silty clay. In the vertical direction, conventional particle size parameters exhibit minimal variation. Multiple peaks are observed in the C values—which represent the coarsest one percentile of sediments—in the study layer (Figure 3f). The C value is a robust indicator of hydrodynamic changes induced by various sedimentary processes and may also reveal major transformative events in these processes [31,70]. Based on these peaks of C values, the study depth was further subdivided: shallow coring layers were designated as sections S1 (0–4 mbsf), S2 (4–11 mbsf), S3 (11–13 mbsf), and S4 (13–28 mbsf), whereas deep coring layers were labeled sections D1 (57–59 mbsf), D2 (59–62 mbsf), D3 (66–68 mbsf), and D4 (80–94 mbsf) (Figure 3f).
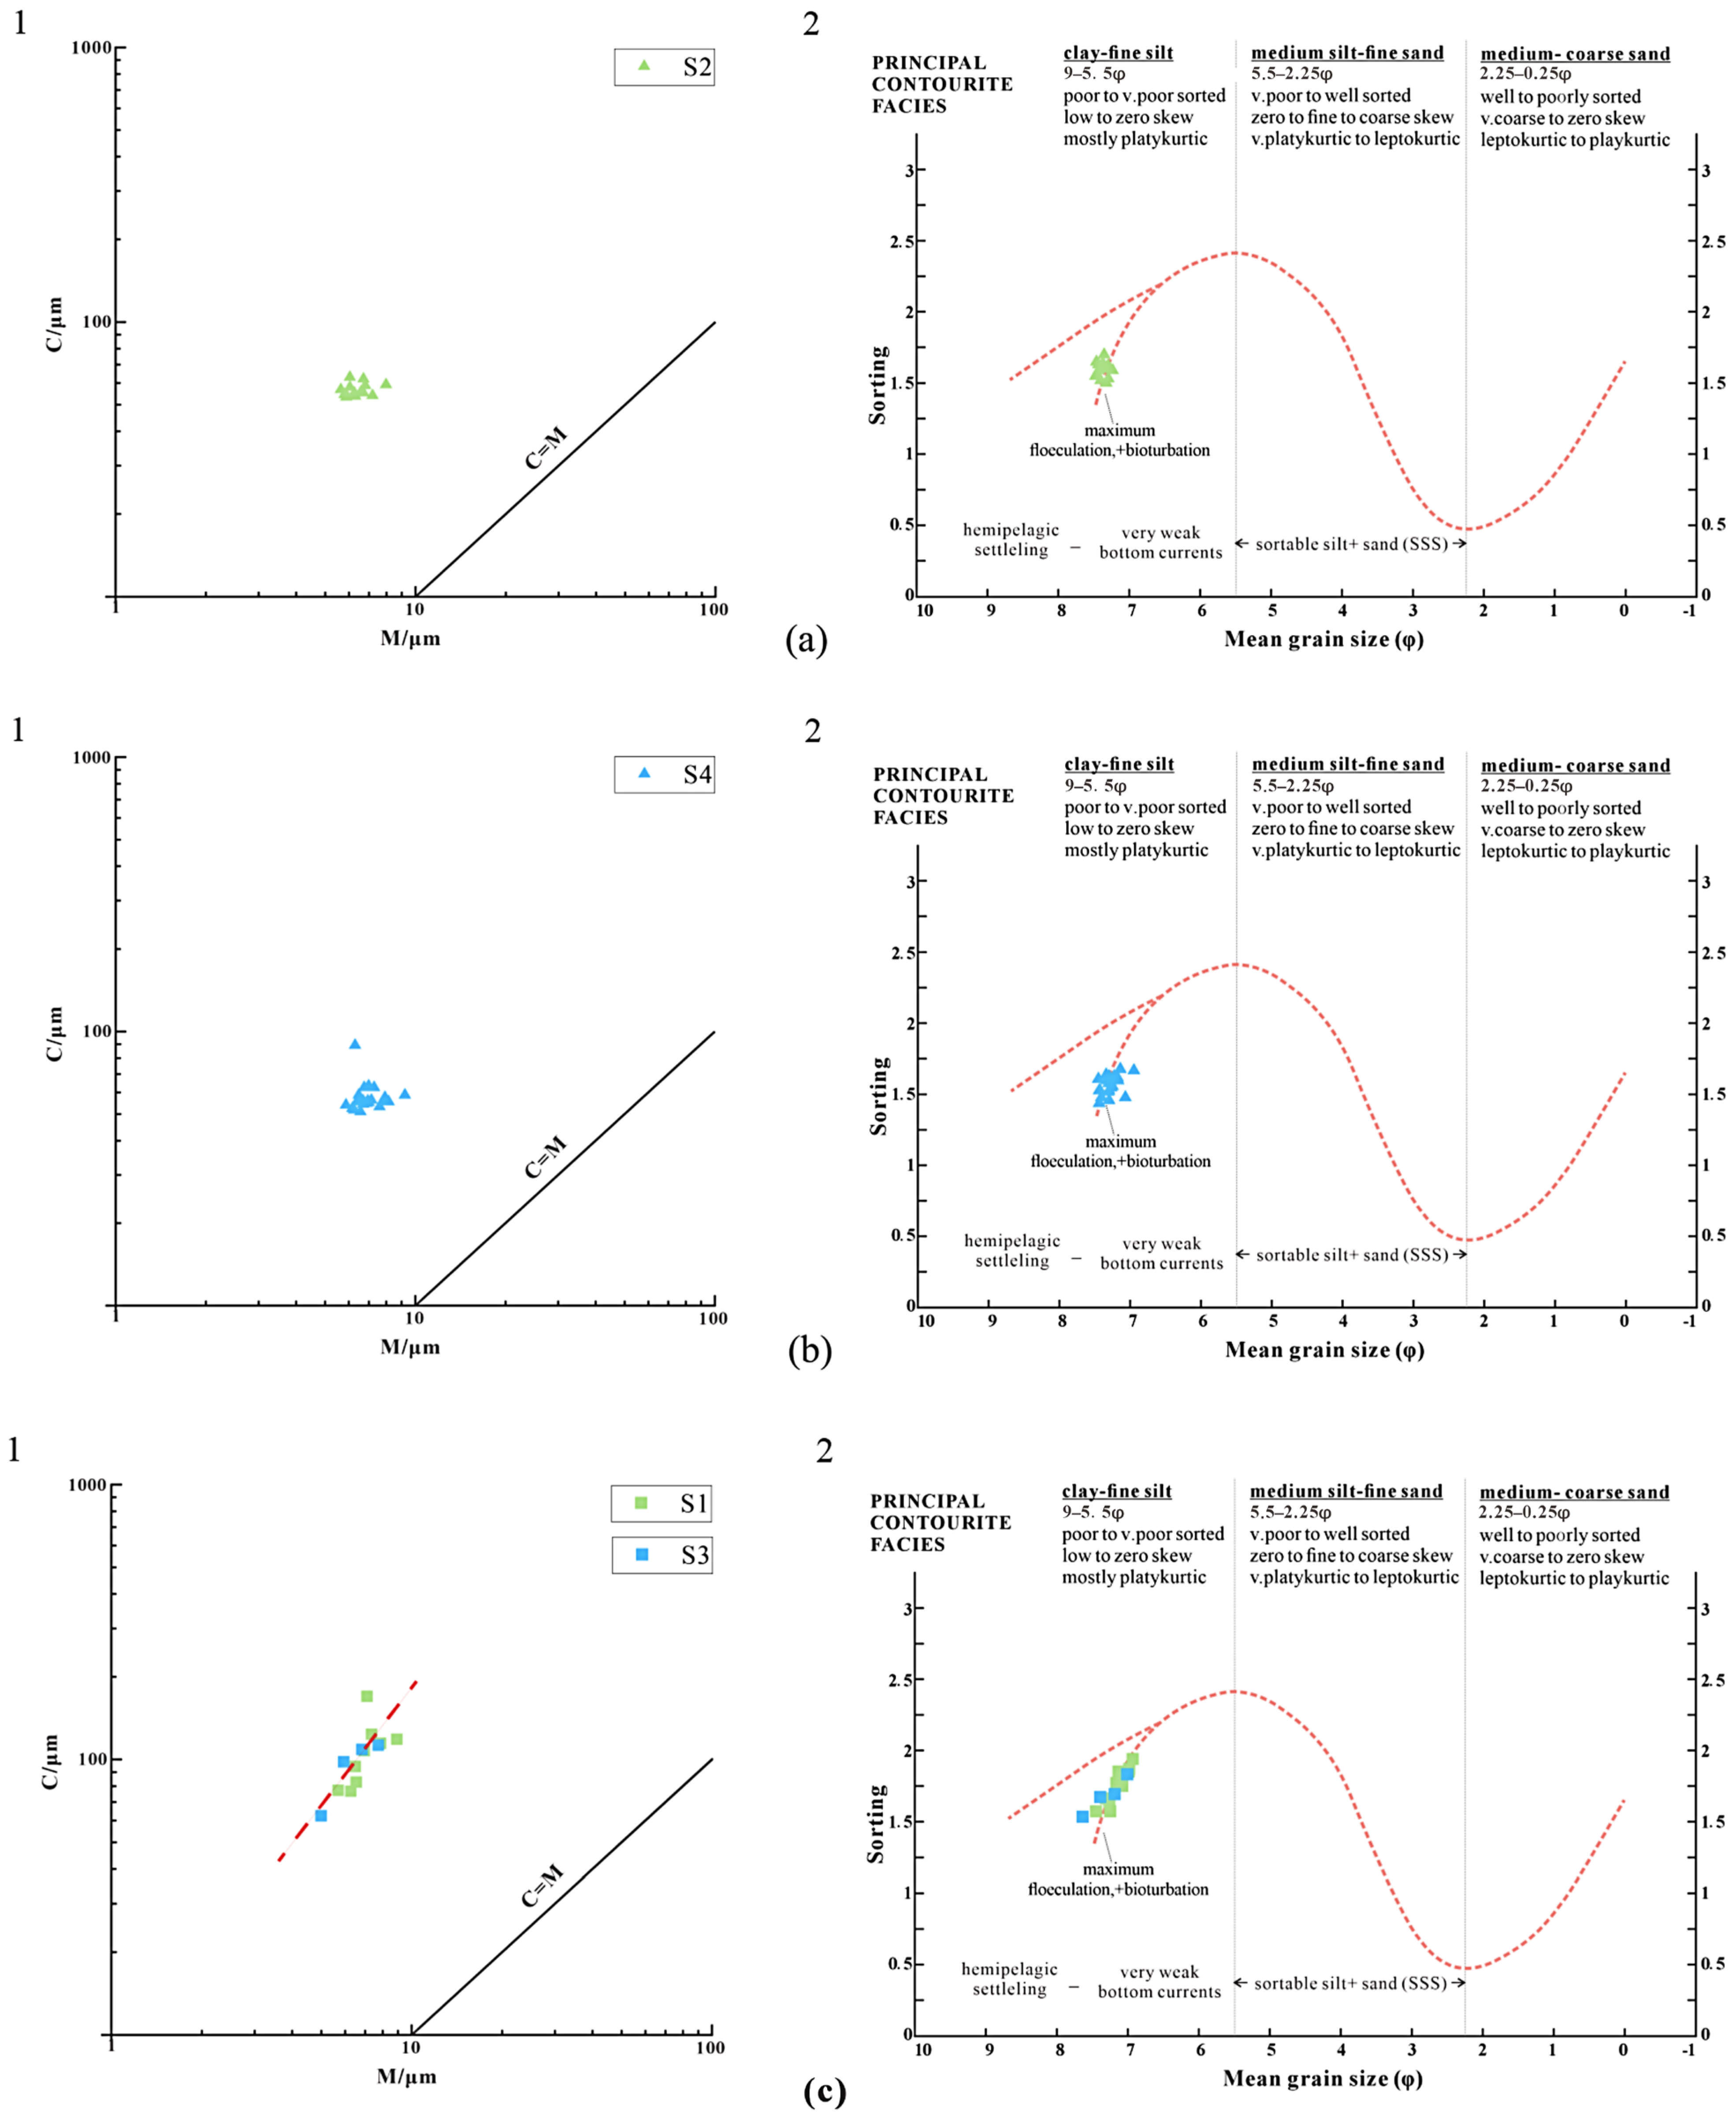
Determining the primary hydrodynamic conditions of various sedimentary intervals depends on sediment grain size data. The C-M pattern diagram typically illustrates the relationship between the coarsest and median grain sizes (Figure 7 and Figure 8). Points representing deep-water fine-grained sediment grain size parameters on the C-M diagram can determine if the sediment was formed by gravitational flow deposition, suspension deposition, or other non-gravitational processes [70]. Numerous studies indicate the presence of widespread traction currents, such as contour currents or internal waves, in the deep-water environment of the study area [71,72]. Consequently, the optimal fitting curve for the contourite current, derived from particle size parameters (average size and sorting) of modern contourite sediments (Figure 7 and Figure 8), effectively characterizes the dynamic conditions of traction flow deposition [73]. The sedimentary hydrodynamic analysis for the study’s layered section was performed using the two aforementioned diagrams (Figure 7 and Figure 8).
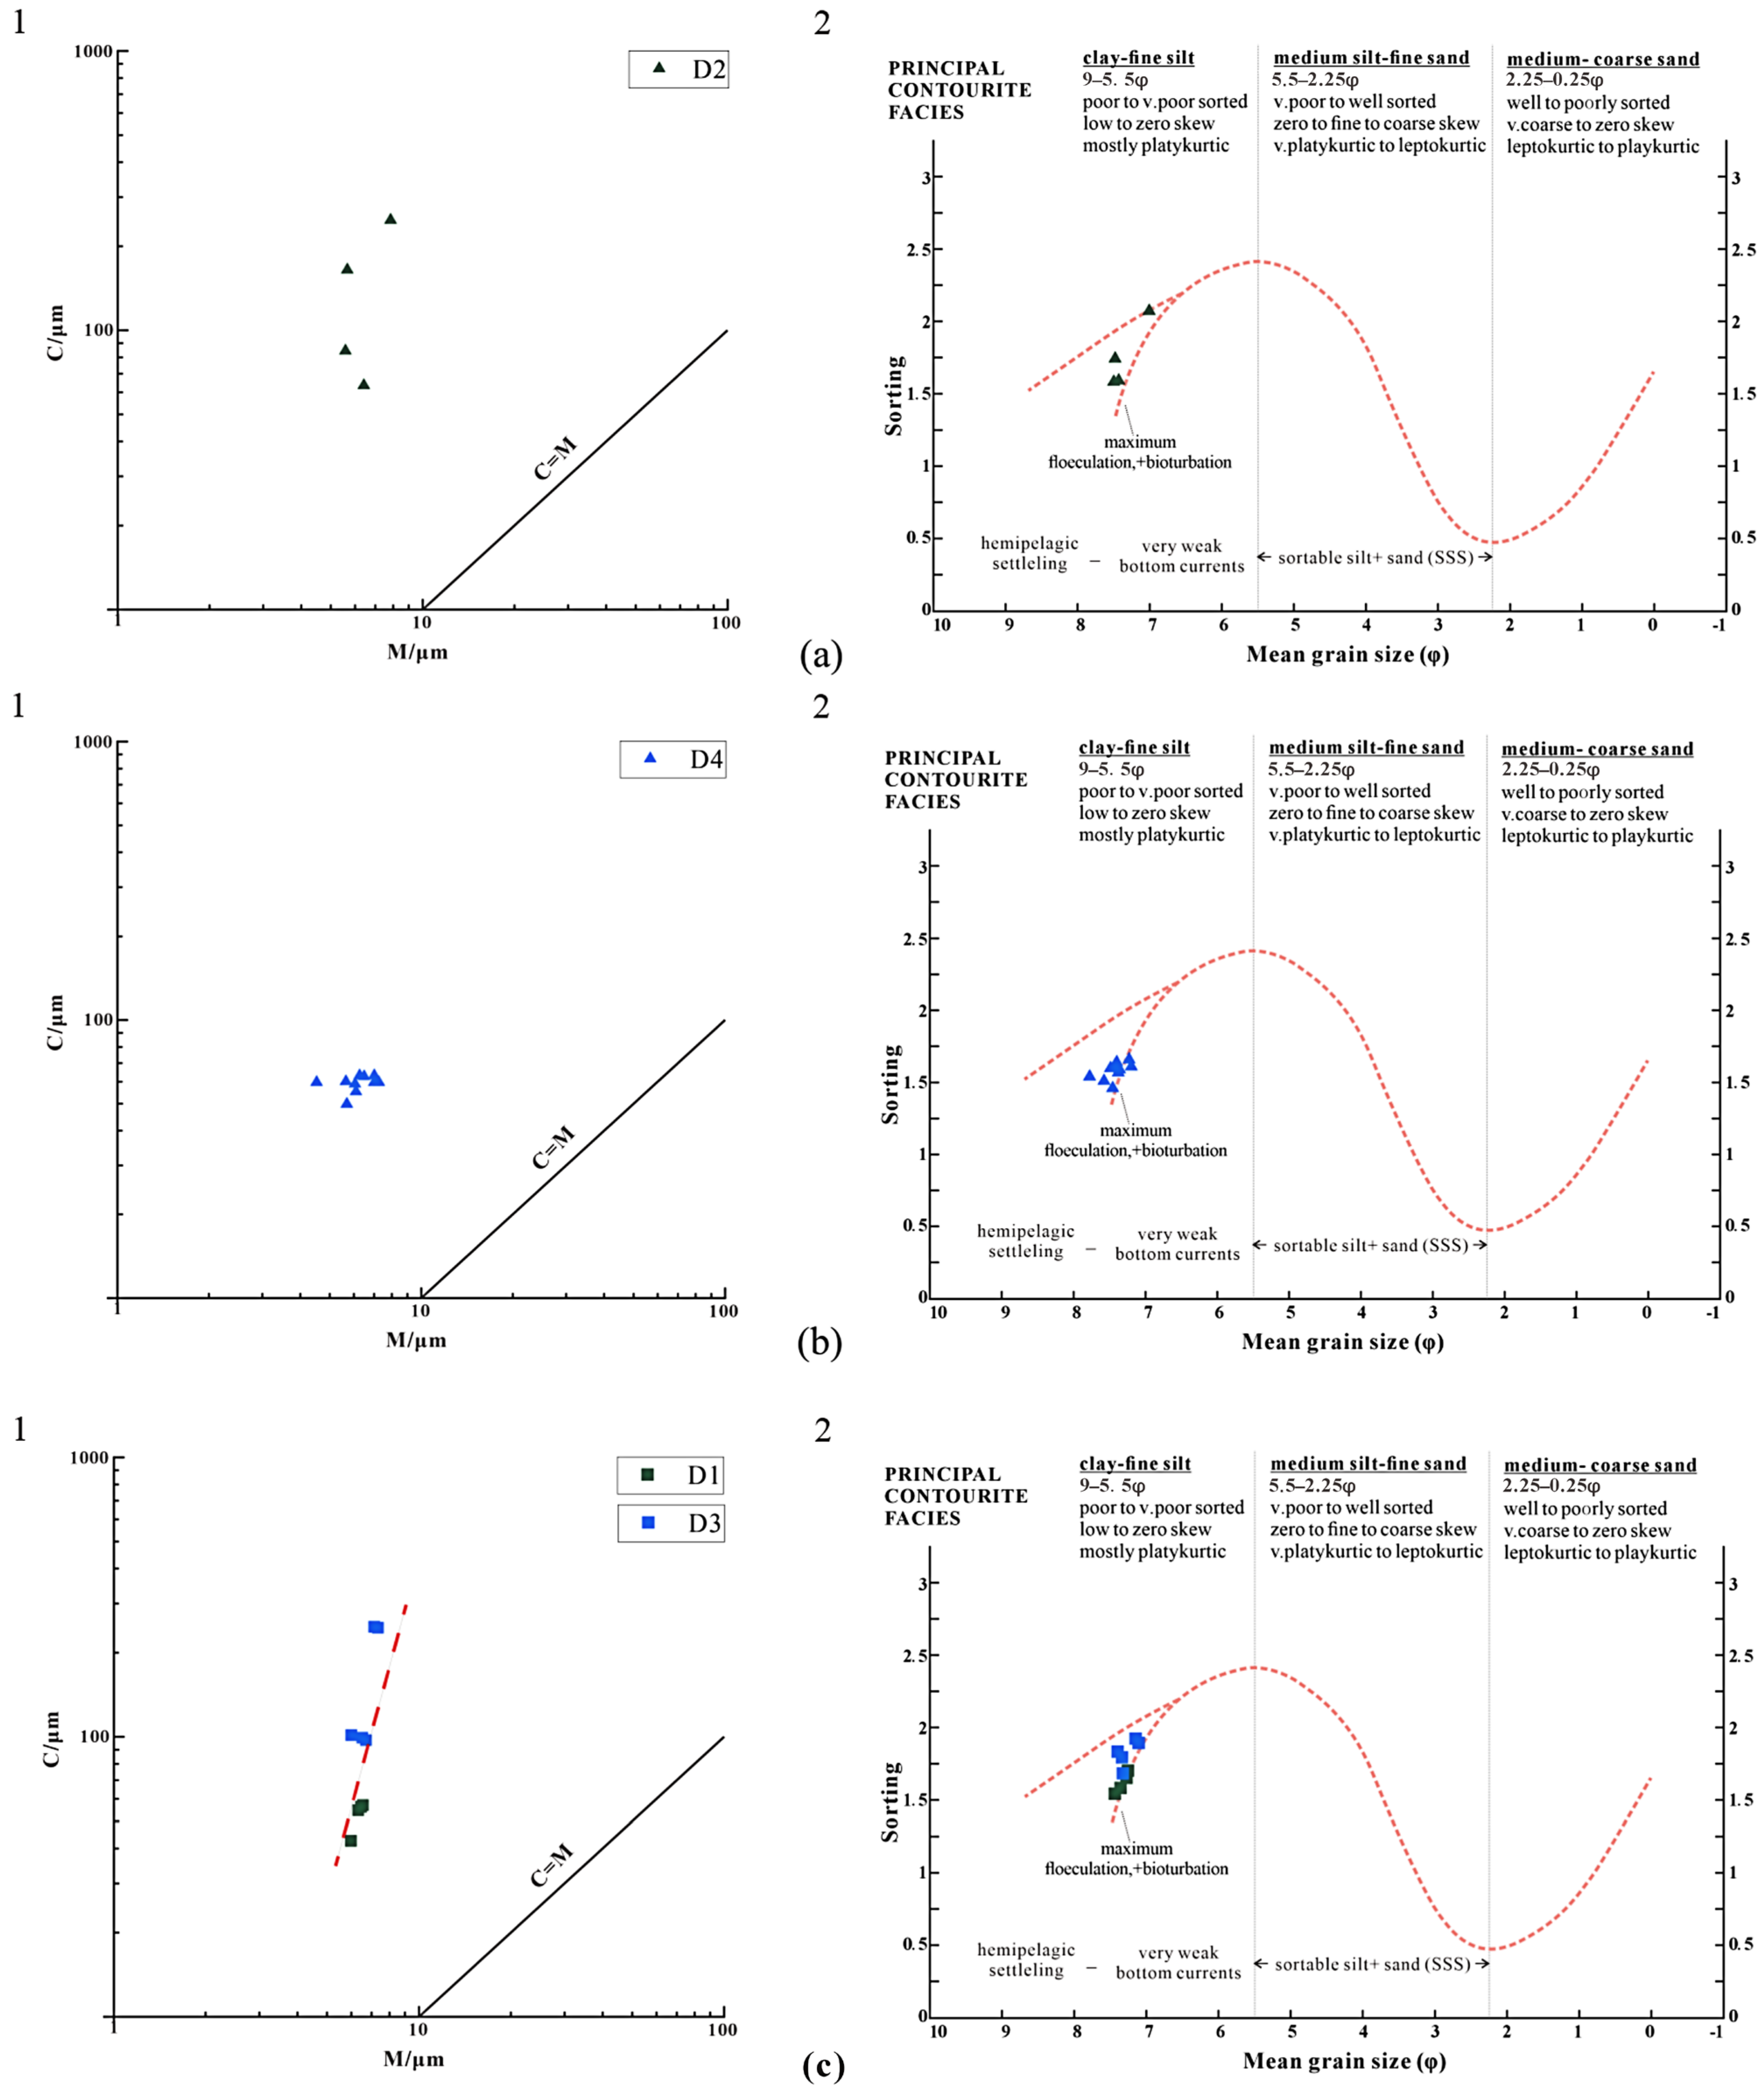
Notably, the increase in the C value in Section D2 may not be attributed to hydrodynamic factors. This is evidenced by the significant increase in carbonate minerals and CaO content in Section D2 (Figure 4b and Figure 5), while the abundance of calcareous microfossils remains unchanged (Figure 6), suggesting a rise in authigenic carbonates. Furthermore, cruise reports and previous studies indicate that hydrate decomposition throughout geological history has led to the accumulation of authigenic carbonates in Section D2 [74]. These authigenic carbonates form large aggregates, with particle sizes surpassing fine sediment particles, reaching up to the millimeter scale [75]. These authigenic carbonates may influence the grain size parameters of Section D2, thus excluding this section from the hydrodynamic sedimentation analysis.
In the C-M diagram, trend lines for sediment samples in Section S1 and S3 are inclined relative to both the C-M baseline and the X-axis (Figure 7c). Grain size parameters exhibit strong agreement with the fitting curve associated with weak bottom current traction flow identified in previous studies, indicating that traction currents predominantly control sedimentary dynamics [70]. Sediment samples from Section S2 align parallel to the X-axis and primarily consist of fine-grained sediments (Figure 7a). Furthermore, grain-size parameters do not align well with the fitting curve associated with contourite currents—a feature of suspension deposition typically observed at the end of gravity flows or during normal deep-water sedimentation [76]. On the C-M diagram, the trend line for sediment samples from Section S4 runs nearly parallel to the X-axis and does not align well with the fitting curve associated with contourite currents (Figure 7b). This pattern is characteristic of suspension deposition [77].
The trend line of sediment samples from Section D1 and D3 forms an angle with the C-M baseline (Figure 8c). The grain size distribution aligns with the fitting curve that characterizes weak bottom-current traction flow [73]. Consequently, this section exhibits pronounced traction flow characteristics. The sediment sample from Section D2 contains a substantial amount of authigenic carbonate and does not accurately reflect sediment dynamics (Figure 8a). The sediment samples from Section D4 are parallel to the X-axis and do not align well with the fitting curve associated with contourite currents (Figure 8b). This observation is indicative of suspension deposition [77].

5.3. Sea-Level Change

Due to sample limitations, Site DS-W08 lacks AMS radiocarbon dating and oxygen isotope data to support its chronostratigraphic framework. Biostratigraphic analysis indicates that the last occurrence of Globigerinoides ruber (pink) at 67.90 mbsf in Site DS-W08 corresponds to an estimated age of approximately 120 kyr [21]. The first appearance of the calcareous nannofossil Emiliania huxleyi at 94 mbsf marks an estimated age of ~291 kyr [78] (Figure 2). Integrating biostratigraphic dating data, the core interval at Site DS-W08 reflects sedimentary records dating since 291 kyr, whereas the interval above 65 mbsf corresponds to records since the last glacial period (120 kyr) [22]. Previous studies on the ancient marine environment of the northern SCS indicate significant sea level fluctuations during this period [22,23,24]. Sea level fluctuations are closely linked to the formation and decomposition of hydrates and also influence sediment properties [79,80]. Variations in sediment properties significantly impact the dynamic adjustment of hydrate reservoirs [60,81,82].
The Sr/Ba ratio is commonly used as a proxy for paleosalinity. It also serves as an important indicator of sea-level fluctuations [25]. Due to their high abundance and widespread distribution, foraminifera are extensively used in marine paleoclimate reconstruction. The P/B ratio, defined as the ratio of planktonic to benthic foraminifera, generally increases with water depth [26,29]. Therefore, both Sr/Ba and P/B ratios exhibit similar trends: they increase during sea-level rise and decrease during sea-level fall. Al2O3 and K2O typically exhibit higher concentrations in terrigenous sediments, serving as indicators of variations in terrigenous sediment input and indirectly reflecting sea level changes. Analysis of microfossil abundance and geochemical data revealed that sections S1, S3, D1, and D3 exhibit high-value intervals of P/B and Sr/Ba (Figure 5 and Figure 6), while the Al2O3 and K2O contents are relatively low in these sections (Figure 5). This suggests that sections S1, S3, D1, and D3 correspond to periods of high sea level. The remaining sections likely correspond to periods of low sea level. Sections D2 and the bottom of Section D4 (below 90 mbsf) contain outliers, with abnormally high CaO and carbonate mineral contents (Figure 4b). As previously mentioned, this anomaly may result from authigenic carbonates, indicating that the high Sr/Ba ratios in these intervals do not represent high sea-level periods.
Sedimentary processes exhibit a clear coupling with sea-level fluctuations. At Site DS-W08, sediments deposited during high sea level periods are primarily influenced by coastal bottom traction currents, including internal waves and contour currents. During low sea-level periods, sedimentation is dominated by overbank suspended deposits resulting from turbidity current processes.

5.4. Coupling Relationship Between Sedimentation Processes and Gas Hydrate Enrichment

A comparison of hydrate reservoirs at Site DS-W08, along with sedimentary process evolution and sea-level changes, reveals that the tops of both shallow and deep hydrate reservoirs are located within sedimentary sections influenced by traction currents, rather than in overbank deposits formed by turbidity currents. The shallow hydrate reservoir corresponds to sedimentary layers deposited during Sections S3 and S4 (Figure 2). The deep hydrate reservoir is associated with sedimentary layers from sections D3 and D4. Additionally, both shallow and deep hydrate reservoirs exhibit high foraminiferal abundance in the sediments (Figure 6a). Due to their relatively large particle size and internal chamber structures, foraminifera can provide additional pore space for hydrate accumulation. However, not all layers with high foraminiferal content correspond to hydrate reservoirs across all hydrate exploration sites in the SCS [83,84]. At Site DS-W08, layers with high foraminiferal content do not consistently correspond to zones of high hydrate saturation. Some studies suggest that clay minerals in fine-grained sediments significantly reduce effective reservoir space by occluding the chambers of foraminifera [85,86].
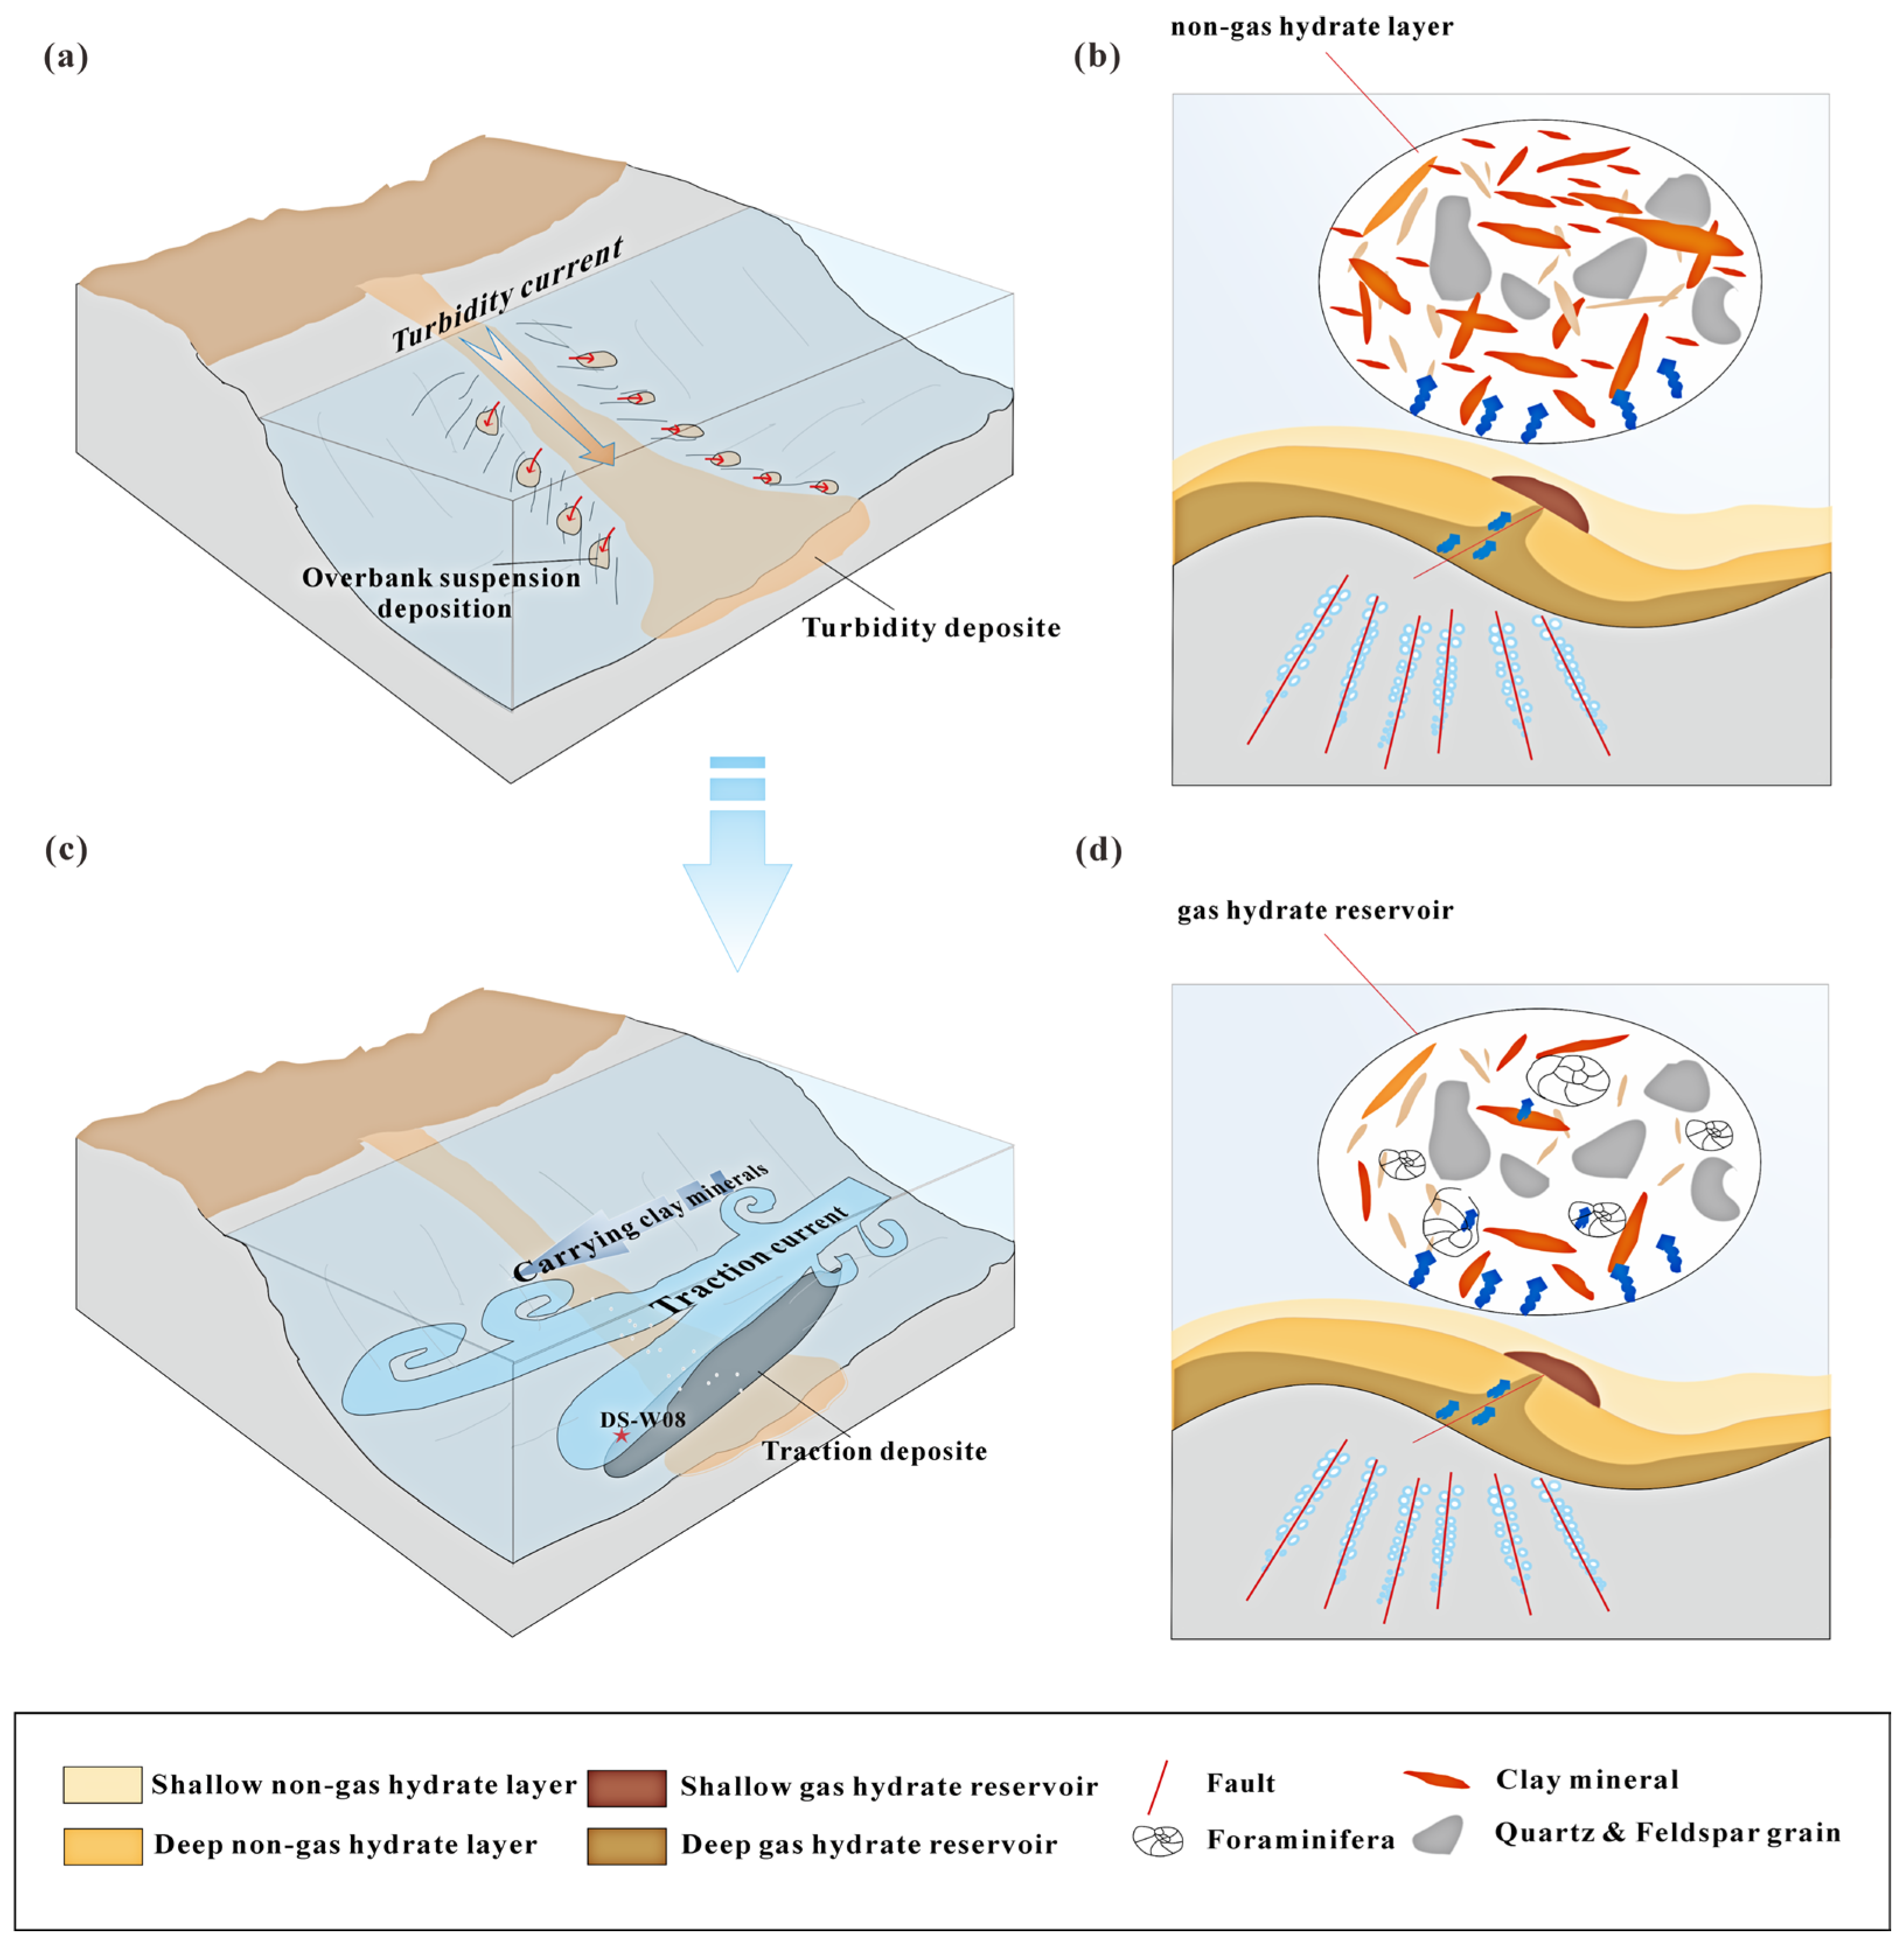
In shallow hydrate reservoirs, the high abundance of foraminifera provides favorable pore structures for hydrate accumulation [19,85]. Meanwhile, traction flow during Section S3 effectively removed fine-grained sediments, enhancing reservoir quality (Figure 9d). In the overlying section of shallow hydrate reservoirs, although foraminifera are also abundant, sedimentation is dominated by overbank suspension deposits from turbidity currents (Figure 9a). These deposits contain abundant fine-grained materials and lack effective transport dynamics to remove the fine-grained sediments (Figure 9b). As a result, the infilling of foraminiferal chambers with fine particles hinders hydrate enrichment. The deep hydrate reservoir exhibits similar conditions to the shallow reservoir. In the D1 section, although traction flow dominates, foraminiferal content is low and pore space is limited, which restricts hydrate accumulation. The D2 section may represent a layer enriched in authigenic carbonate minerals, potentially formed by hydrate decomposition. The D3 section also contains abundant foraminifera and is influenced by traction flow dynamics, which facilitates hydrate formation (Figure 9). In both shallow and deep hydrate reservoirs, hydrate formation significantly reduces porosity and permeability, forming a cap layer that restricts upward gas and fluid migration and promotes downward hydrate growth into underlying sediments. Consequently, hydrate saturation increases sharply from the top downward, followed by a gradual decline (Figure 2).

6. Conclusions

(1)
The sedimentary process of gas hydrate reservoirs and adjacent layers in the Dongsha Sea is complex. At Site DS-W08, overbank suspended sediments from turbidity currents are superimposed with deep-water traction current deposits. Traction currents dominate during the high sea level periods, while turbidity currents prevail during low sea level periods.
(2)
In the Dongsha area, both shallow and deep gas hydrate reservoirs are present. A strong coupling exists between the gas hydrate reservoirs and sedimentary processes. The tops of both shallow and deep gas hydrate reservoirs are associated with sedimentary layers influenced by traction currents.
(3)
Sedimentary layers formed by traction currents, rich in foraminifera fossils, promote the formation of high-saturation hydrate reservoirs. Fine-grained turbidites, resulting from turbidity flows, lack effective storage space, are not conducive to hydrate formation.
(4)
In foraminifera-rich sedimentary layers affected by traction flow transformation, gas hydrate accumulation leads to a sudden reduction in porosity and permeability. This results in the formation of a cap that inhibits the upward migration of gases and fluids, promoting hydrate growth into the overbank suspended sedimentary layers deposited by gravity-driven flows.

Author Contributions

Conceptualization, C.B. and H.W.; methodology, Y.W. and Z.W.; validation, C.B., W.C. and X.X.; formal analysis, X.X.; investigation, Y.W. and H.X.; resources, C.B. and H.W.; data curation, Y.W.; writing—original draft preparation, Y.W.; writing—review and editing, C.B., Z.W., and H.W.; visualization, Y.W. and W.C.; supervision, C.B.; project administration, H.W. and C.B.; funding acquisition, H.W. and C.B. All authors have read and agreed to the published version of the manuscript.

Funding

This research was funded by the Fundamental Research Funds for the Central Universities of China, grant number 3-7-10-2025-03, National Natural Science Foundation of China, grant number 42376217, and National Key Research and Development Program of China, grant number 2024YFC2814702.

Data Availability Statement

The datasets supporting the results of the study and findings are accessible through Figshare (DOI: http://doi.org/10.6084/m9.figshare.29493305).

Acknowledgments

We would like to thank the Guangzhou Marine Geological Survey (GMGS) for allowing the data of this research to be shared. We wish to thank all those who contributed to the China Notions Gas Hydrate Program Expedition 2.

Conflicts of Interest

Author Zhe Wang was employed by the company Bureau of Geophysical Prospecting INC., CNPC. The remaining authors declare that the research was conducted in the absence of any commercial or financial relationships that could be construed as a potential conflict of interest.

References

  1. Sloan, E.D. Fundamental Principles and Applications of Natural Gas Hydrates. Nature 2003, 426, 353–359. [Google Scholar] [CrossRef]
  2. Kvenvolden, K.A. Methane Hydrate—A Major Reservoir of Carbon in the Shallow Geosphere? Chem. Geol. 1988, 71, 41–51. [Google Scholar] [CrossRef]
  3. Sloan, E.D., Jr.; Koh, C.A. Clathrate Hydrates of Natural Gases; CRC Press: Boca Raton, FL, USA, 2007; ISBN 0-429-12914-9. [Google Scholar]
  4. Ruppel, C. Permafrost-Associated Gas Hydrate: Is It Really Approximately 1% of the Global System? J. Chem. Eng. Data 2015, 60, 429–436. [Google Scholar] [CrossRef]
  5. Paull, C.K.; Buelow, W.J.; Ussler, W., III; Borowski, W.S. Increased Continental-Margin Slumping Frequency during Sea-Level Lowstands above Gas Hydrate–Bearing Sediments. Geology 1996, 24, 143–146. [Google Scholar] [CrossRef]
  6. Paull, C.K.; Ussler, W., III; Dillon, W.P. Potential Role of Gas Hydrate Decomposition in Generating Submarine Slope Failures. Nat. Gas Hydrate Ocean. Permafr. Environ. 2000, 12, 149–156. [Google Scholar] [CrossRef]
  7. Maslin, M.; Owen, M.; Betts, R.; Day, S.; Dunkley Jones, T.; Ridgwell, A. Gas Hydrates: Past and Future Geohazard? Philos. Trans. R. Soc. Math. Phys. Eng. Sci. 2010, 368, 2369–2393. [Google Scholar] [CrossRef]
  8. Liu, J.; Gupta, S.; Rutqvist, J.; Ma, Y.; Wang, S.; Wan, K.; Fan, C.; Yan, W. Can Glacial Sea-Level Drop-Induced Gas Hydrate Dissociation Cause Submarine Landslides? Geophys. Res. Lett. 2024, 51, e2023GL106772. [Google Scholar] [CrossRef]
  9. Kvenvolden, K.A. Methane Hydrate in the Global Organic Carbon Cycle. Terra Nova 2002, 14, 302–306. [Google Scholar] [CrossRef]
  10. Ruppel, C.D.; Kessler, J.D. The Interaction of Climate Change and Methane Hydrates. Rev. Geophys. 2017, 55, 126–168. [Google Scholar] [CrossRef]
  11. Burton, Z.F.; Kroeger, K.F.; Hosford Scheirer, A.; Seol, Y.; Burgreen-Chan, B.; Graham, S.A. Tectonic Uplift Destabilizes Subsea Gas Hydrate: A Model Example from Hikurangi Margin, New Zealand. Geophys. Res. Lett. 2020, 47, e2020GL087150. [Google Scholar] [CrossRef]
  12. Ruffine, L.; Tang, A.M.; O’neill, N.; Toffin, L.; Paris, J.-D.; Yang, J.; Georgiev, V.; Fietzek, P.; Giustiniani, M.; Tinivella, U. Environmental Challenges Related to Methane Hydrate Decomposition from Climate Change Scenario and Anthropic Activities: State of the Art, Potential Consequences and Monitoring Solutions. Earth-Sci. Rev. 2023, 246, 104578. [Google Scholar] [CrossRef]
  13. Collett, T.S. Energy Resource Potential of Natural Gas Hydrates. AAPG Bull. 2002, 86, 1971–1992. [Google Scholar] [CrossRef]
  14. Boswell, R. Is Gas Hydrate Energy within Reach? Science 2009, 325, 957–958. [Google Scholar] [CrossRef] [PubMed]
  15. Makogon, Y.F.; Holditch, S.A.; Makogon, T.Y. Natural Gas-Hydrates—A Potential Energy Source for the 21st Century. J. Pet. Sci. Eng. 2007, 56, 14–31. [Google Scholar] [CrossRef]
  16. Boswell, R.; Collett, T.S. Current Perspectives on Gas Hydrate Resources. Energy Environ. Sci. 2011, 4, 1206–1215. [Google Scholar] [CrossRef]
  17. Chong, Z.R.; Yang, S.H.B.; Babu, P.; Linga, P.; Li, X.-S. Review of Natural Gas Hydrates as an Energy Resource: Prospects and Challenges. Appl. Energy 2016, 162, 1633–1652. [Google Scholar] [CrossRef]
  18. Dai, J.; Ni, Y.; Huang, S.; Peng, W.; Han, W.; Gong, D.; Wei, W. Genetic Types of Gas Hydrates in China. Pet. Explor. Dev. 2017, 44, 887–898. [Google Scholar] [CrossRef]
  19. Handwerger, A.L.; Rempel, A.W.; Skarbek, R.M. Submarine Landslides Triggered by Destabilization of High-saturation Hydrate Anomalies. Geochem. Geophys. Geosyst. 2017, 18, 2429–2445. [Google Scholar] [CrossRef]
  20. Dai, S.; Santamarina, J.C.; Waite, W.F.; Kneafsey, T.J. Hydrate Morphology: Physical Properties of Sands with Patchy Hydrate Saturation. J. Geophys. Res. Solid Earth 2012, 117, 2012JB009667. [Google Scholar] [CrossRef]
  21. Zhang, G.; Liang, J.; Lu, J.; Yang, S.; Zhang, M.; Holland, M.; Schultheiss, P.; Su, X.; Sha, Z.; Xu, H.; et al. Geological Features, Controlling Factors and Potential Prospects of the Gas Hydrate Occurrence in the East Part of the Pearl River Mouth Basin, South China Sea. Mar. Pet. Geol. 2015, 67, 356–367. [Google Scholar] [CrossRef]
  22. Cao, X.; Sun, J.; Gu, Y.; Qin, F.; Li, Y.; Yu, Y.; Ning, F. Revised Inflow Performance Relationship for Productivity Prediction from Marine Sandy Hydrate Reservoirs in Nankai Trough. Geoenergy Sci. Eng. 2024, 238, 212845. [Google Scholar] [CrossRef]
  23. Lee, M.W.; Collett, T.S.; Lewis, K.A. Anisotropic Models to Account for Large Borehole Washouts to Estimate Gas Hydrate Saturations in the Gulf of Mexico Gas Hydrate Joint Industry Project Leg II Alaminos Canyon 21 B Well. Mar. Pet. Geol. 2012, 34, 85–95. [Google Scholar] [CrossRef]
  24. Lee, M.W.; Collett, T.S. Gas Hydrate Saturations Estimated from Fractured Reservoir at Site NGHP-01-10, Krishna-Godavari Basin, India. J. Geophys. Res. Solid Earth 2009, 114, 2008JB006237. [Google Scholar] [CrossRef]
  25. Ren, J.; Cheng, C.; Xiong, P.; Kuang, Z.; Liang, J.; Lai, H.; Chen, Z.; Chen, Y.; Li, T.; Jiang, T. Sand-Rich Gas Hydrate and Shallow Gas Systems in the Qiongdongnan Basin, Northern South China Sea. J. Pet. Sci. Eng. 2022, 215, 110630. [Google Scholar] [CrossRef]
  26. Su, M.; Luo, K.; Fang, Y.; Kuang, Z.; Yang, C.; Liang, J.; Liang, C.; Chen, H.; Lin, Z.; Wang, C.; et al. Grain-Size Characteristics of Fine-Grained Sediments and Association with Gas Hydrate Saturation in Shenhu Area, Northern South China Sea. Ore Geol. Rev. 2021, 129, 103889. [Google Scholar] [CrossRef]
  27. Wei, J.; Fang, Y.; Lu, H.; Lu, H.; Lu, J.; Liang, J.; Yang, S. Distribution and Characteristics of Natural Gas Hydrates in the Shenhu Sea Area, South China Sea. Mar. Pet. Geol. 2018, 98, 622–628. [Google Scholar] [CrossRef]
  28. Yang, S.; Zhang, M.; Liang, J.Q.; Lu, J.; Zhang, Z.J.; Holland, M.; Schultheiss, P.; Fu, S.Y.; Sha, Z.B. Preliminary Results of China’s Third Gas Hydrate Drilling Expedition: A Critical Step from Discovery to Development in the South China Sea. Cent. Nat. Gas Oil 2015, 412, 386–7614. [Google Scholar]
  29. Ryu, B.-J.; Collett, T.S.; Riedel, M.; Kim, G.Y.; Chun, J.-H.; Bahk, J.-J.; Lee, J.Y.; Kim, J.-H.; Yoo, D.-G. Scientific Results of the Second Gas Hydrate Drilling Expedition in the Ulleung Basin (UBGH2). Mar. Pet. Geol. 2013, 47, 1–20. [Google Scholar] [CrossRef]
  30. Argentino, C.; Conti, S.; Fioroni, C.; Fontana, D. Evidences for Paleo-Gas Hydrate Occurrence: What We Can Infer for the Miocene of the Northern Apennines (Italy). Geosciences 2019, 9, 134. [Google Scholar] [CrossRef]
  31. Bai, C.; Su, P.; Xu, X.; Zhang, Y.; Han, S.; Liang, J. Controlling Effect of Particle Size on Gas Hydrate Enrichment in Fine-Grained Sediments. Earth Space Sci. 2024, 11, e2024EA003594. [Google Scholar] [CrossRef]
  32. Wang, X.; Hutchinson, D.R.; Wu, S.; Yang, S.; Guo, Y. Elevated Gas Hydrate Saturation within Silt and Silty Clay Sediments in the Shenhu Area, South China Sea. J. Geophys. Res. 2011, 116, B05102. [Google Scholar] [CrossRef]
  33. Bian, H.; Qin, X.; Sun, J.; Luo, W.; Lu, C.; Zhu, J.; Ma, C.; Zhou, Y. The Impact of Mineral Compositions on Hydrate Morphology Evolution and Phase Transition Hysteresis in Natural Clayey Silts. Energy 2023, 274, 127303. [Google Scholar] [CrossRef]
  34. Kumari, A.; Balomajumder, C.; Arora, A.; Dixit, G.; Gomari, S.R. Physio-Chemical and Mineralogical Characteristics of Gas Hydrate-Bearing Sediments of the Kerala-Konkan, Krishna-Godavari, and Mahanadi Basins. J. Mar. Sci. Eng. 2021, 9, 808. [Google Scholar] [CrossRef]
  35. Wang, X.; Feng, J.; Zhang, L.; Yuan, Y.; Xu, C.; Liang, J.; Yang, J. Mineralogy and Pore Characteristics of Marine Gas Hydrate-Bearing Sediments in the Northern South China Sea. Mar. Pet. Geol. 2022, 141, 105711. [Google Scholar] [CrossRef]
  36. He, Z.; Gupta, K.M.; Linga, P.; Jiang, J. Molecular Insights into the Nucleation and Growth of CH4 and CO2 Mixed Hydrates from Microsecond Simulations. J. Phys. Chem. C 2016, 120, 25225–25236. [Google Scholar] [CrossRef]
  37. Zhou, S.; Li, Q.; Zhu, J.; Gu, Q.; Wang, L.; Wu, Z. Experimental Study on Permeability of Methane Hydrate Clayey Interbedded Sediments Considering Effective Stress and Hydrate Dissociation. Energy Fuels 2023, 37, 11113–11124. [Google Scholar] [CrossRef]
  38. Quainoo, A.K.; Negash, B.M.; Bavoh, C.B.; Idris, A.; Shahpin, H.B.A.; Yaw, A.D. Inhibition Impact of Amino Acids on Swelling Clays: An Experimental and COSMO-RS Simulation Evaluation. Energy Fuels 2020, 34, 13985–14000. [Google Scholar] [CrossRef]
  39. Fang, C. Relations between Biogenic Component (Foraminifera) and Highly Saturated Gas Hydrates Distribution from Shenhu Area, Northern South China Sea. Earth Sci.-J. China Univ. Geosci. 2013, 38, 0907. [Google Scholar] [CrossRef]
  40. Wilson, M.D.; Pittman, E.D. Authigenic Clays in Sandstones; Recognition and Influence on Reservoir Properties and Paleoenvironmental Analysis. J. Sediment. Res. 1977, 47, 3–31. [Google Scholar] [CrossRef]
  41. Sun, S.Q.; Esteban, M. Paleoclimatic Controls on Sedimentation, Diagenesis, and Reservoir Quality: Lessons from Miocene Carbonates. AAPG Bull. 1994, 78, 519–543. [Google Scholar] [CrossRef]
  42. Burton, Z.F.; McHargue, T.; Kremer, C.H.; Bloch, R.B.; Gooley, J.T.; Jaikla, C.; Harrington, J.; Graham, S.A. Peak Cenozoic Warmth Enabled Deep-Sea Sand Deposition. Sci. Rep. 2023, 13, 1276. [Google Scholar] [CrossRef] [PubMed]
  43. Burton, Z.F.; McHargue, T.R.; Graham, S.A. Global Eocene-Oligocene Unconformity in Clastic Sedimentary Basins. Earth-Sci. Rev. 2024, 258, 104912. [Google Scholar] [CrossRef]
  44. Boswell, R.; Rose, K.; Collett, T.S.; Lee, M.; Winters, W.; Lewis, K.A.; Agena, W. Geologic Controls on Gas Hydrate Occurrence in the Mount Elbert Prospect, Alaska North Slope. Mar. Pet. Geol. 2011, 28, 589–607. [Google Scholar] [CrossRef]
  45. You, K.; Flemings, P.B.; Malinverno, A.; Collett, T.S.; Darnell, K. Mechanisms of Methane Hydrate Formation in Geological Systems. Rev. Geophys. 2019, 57, 1146–1196. [Google Scholar] [CrossRef]
  46. Dafov, L.N.; Burton, Z.F.; Haines, S.S.; Scheirer, A.H.; Masurek, N.; Boswell, R.; Frye, M.; Seol, Y.; Graham, S.A. Terrebonne Basin, Gulf of Mexico Gas Hydrate Resource Evaluation and 3-D Modeling of Basin-Scale Sedimentation, Salt Tectonics, and Hydrate System Evolution since the Early Miocene. Mar. Pet. Geol. 2025, 176, 107330. [Google Scholar] [CrossRef]
  47. Liang, J.; Zhang, W.; Lu, J.A.; Wei, J.; Kuang, Z.; He, Y. Geological Occurrence and Accumulation Mechanism of Natural Gas Hydrates in the Eastern Qiongdongnan Basin of the South China Sea: Insights from Site GMGS5-W9-2018. Mar. Geol. 2019, 418, 106042. [Google Scholar] [CrossRef]
  48. Shengqiang, Y.; Shiguo, W.; Thomas, L.; Genshun, Y.; Fuliang, L.; Feng, C.; Hairong, W.; Li, L. Fine-Grained Pleistocene Deepwater Turbidite Channel System on the Slope of Qiongdongnan Basin, Northern South China Sea. Mar. Pet. Geol. 2009, 26, 1441–1451. [Google Scholar] [CrossRef]
  49. Lowe, D.R. Sediment Gravity Flows; II, Depositional Models with Special Reference to the Deposits of High-Density Turbidity Currents. J. Sediment. Res. 1982, 52, 279–297. [Google Scholar] [CrossRef]
  50. Shanmugam, G. 50 Years of the Turbidite Paradigm (1950s–1990s): Deep-Water Processes and Facies Models—A Critical Perspective. Mar. Pet. Geol. 2000, 17, 285–342. [Google Scholar] [CrossRef]
  51. Piper, D.J.; Normark, W.R. Processes That Initiate Turbidity Currents and Their Influence on Turbidites: A Marine Geology Perspective. J. Sediment. Res. 2009, 79, 347–362. [Google Scholar] [CrossRef]
  52. Meiburg, E.; Kneller, B. Turbidity Currents and Their Deposits. Annu. Rev. Fluid Mech. 2010, 42, 135–156. [Google Scholar] [CrossRef]
  53. Taylor, B.; Hayes, D.E. The Tectonic Evolution of the South China Basin. In Geophysical Monograph Series; Hayes, D.E., Ed.; American Geophysical Union: Washington, DC, USA, 1980; Volume 23, pp. 89–104. ISBN 978-0-87590-023-0. [Google Scholar]
  54. Tang, W.; Zhao, Z.; Song, S.; Wang, Y.; Xie, X.; Liu, S. Differences in the Tectonic Evolution of Basins in the Central-Southern South China Sea and Their Hydrocarbon Accumulation Conditions. Acta Geol. Sin.-Engl. Ed. 2021, 95, 30–40. [Google Scholar] [CrossRef]
  55. Taylor, B.; Hayes, D.E. Origin and History of the South China Sea Basin. In Geophysical Monograph Series; Hayes, D.E., Ed.; American Geophysical Union: Washington, DC, USA, 1983; Volume 27, pp. 23–56. ISBN 978-0-87590-053-7. [Google Scholar]
  56. Li, X.; Wang, Z.; Yao, Y.; Gao, H.; Zhu, S.; Xu, Z. Formation and Evolution of the South China Sea since the Late Mesozoic: A Review. China Geol. 2023, 6, 154–167. [Google Scholar] [CrossRef]
  57. Sha, Z.; Liang, J.; Zhang, G.; Yang, S.; Lu, J.; Zhang, Z.; McConnell, D.R.; Humphrey, G. A Seepage Gas Hydrate System in Northern South China Sea: Seismic and Well Log Interpretations. Mar. Geol. 2015, 366, 69–78. [Google Scholar] [CrossRef]
  58. Shyu, C.-T.; Hsu, S.-K.; Liu, C.-S. Heat Flows off Southwest Taiwan: Measurements over Mud Diapirs and Estimated from Bottom Simulating Reflectors. Terr. Atmos. Ocean. Sci. 1998, 9, 795. [Google Scholar] [CrossRef]
  59. Yan, P.; Deng, H.; Liu, H. The Geological Structure and Prospect of Gas Hydrate over the Dongsha Slope, South China Sea. Terr. Atmos. Ocean. Sci. 2006, 17, 645. [Google Scholar] [CrossRef]
  60. Bai, C.; Zhang, G.; Lu, J.; Liang, J.; Yang, Z.; Yan, W.; Zhu, D.; Tian, Y. Deep-Water Sediment Waves as a Special Gas Hydrate Reservoirs in the Northeastern South China Sea. Mar. Pet. Geol. 2019, 101, 476–485. [Google Scholar] [CrossRef]
  61. Liu, C.; Jing, J.; Zhao, Q.; Luo, X.; Chen, K.; Wang, M.; Deng, M. High-Resolution Resistivity Imaging of a Transversely Uneven Gas Hydrate Reservoir: A Case in the Qiongdongnan Basin, South China Sea. Remote Sens. 2023, 15, 2000. [Google Scholar] [CrossRef]
  62. Li, G.; Du, R.; Tang, J.; Li, Z.; Xia, Q.; Shi, B.; Zhou, L.; Yang, Y.; Zhang, W. Comparison of the Graphic and Moment Methods for Analyzing Grain-Size Distributions: A Case Study for the Chinese Inner Continental Shelf Seas. Int. J. Sediment Res. 2022, 37, 729–736. [Google Scholar] [CrossRef]
  63. Bai, C.; Wang, H.; Li, Q.; Zhang, Y.; Xu, X. Controls on Deep and Shallow Gas Hydrate Reservoirs in the Dongsha Area, South China Sea: Evidence from Sediment Properties. J. Mar. Sci. Eng. 2024, 12, 696. [Google Scholar] [CrossRef]
  64. Li, H.; Liu, J.; Qu, C.; Song, H.; Zhuang, X. A Method for Calculating Gas Hydrate Saturation by Dual Parameters of Logging. Front. Earth Sci. 2022, 10, 986647. [Google Scholar] [CrossRef]
  65. Kim, G.Y.; Yi, B.; Kang, N.K.; Yoo, D.-G.; Lee, J.Y. Comparison of Logging-While-Drilling and Wireline Logging Data from Gas Hydrate-Bearing Deep-Sea Sediments, the Ulleung Basin, East Sea. Explor. Geophys. 2022, 53, 92–103. [Google Scholar] [CrossRef]
  66. Turchyn, A.V.; Bradbury, H.J.; Walker, K.; Sun, X. Controls on the Precipitation of Carbonate Minerals Within Marine Sediments. Front. Earth Sci. 2021, 9, 618311. [Google Scholar] [CrossRef]
  67. Wang, S.; Yan, W.; Magalhães, V.H.; Chen, Z.; Pinheiro, L.M.; Gussone, N. Factors Influencing Methane-Derived Authigenic Carbonate Formation at Cold Seep from Southwestern Dongsha Area in the Northern South China Sea. Environ. Earth Sci. 2014, 71, 2087–2094. [Google Scholar] [CrossRef]
  68. Tong, H.; Feng, D.; Cheng, H.; Yang, S.; Wang, H.; Min, A.G.; Edwards, R.L.; Chen, Z.; Chen, D. Authigenic Carbonates from Seeps on the Northern Continental Slope of the South China Sea: New Insights into Fluid Sources and Geochronology. Mar. Pet. Geol. 2013, 43, 260–271. [Google Scholar] [CrossRef]
  69. Yoneda, J.; Oshima, M.; Kida, M.; Kato, A.; Konno, Y.; Jin, Y.; Jang, J.; Waite, W.F.; Kumar, P.; Tenma, N. Permeability Variation and Anisotropy of Gas Hydrate-Bearing Pressure-Core Sediments Recovered from the Krishna–Godavari Basin, Offshore India. Mar. Pet. Geol. 2019, 108, 524–536. [Google Scholar] [CrossRef]
  70. Passega, R. Grain Size Representation by CM Patterns as a Geologic Tool. J. Sediment. Res. 1964, 34, 830–847. [Google Scholar] [CrossRef]
  71. Wang, X.; Cai, F.; Sun, Z.; Li, Q.; Li, A.; Sun, Y.; Wang, H.; Sun, Q. Tectonic and Oceanographic Controls on the Slope-Confined Dendritic Canyon System in the Dongsha Slope, South China Sea. Geomorphology 2022, 410, 108285. [Google Scholar] [CrossRef]
  72. Wang, X.; Kneller, B.; Sun, Q. Sediment Waves Control Origins of Submarine Canyons. Geology 2023, 51, 310–314. [Google Scholar] [CrossRef]
  73. Stow, D.; Smillie, Z. Distinguishing between Deep-Water Sediment Facies: Turbidites, Contourites and Hemipelagites. Geosciences 2020, 10, 68. [Google Scholar] [CrossRef]
  74. Zhuang, C.; Chen, F.; Cheng, S.; Lu, H.; Wu, C.; Cao, J.; Duan, X. Light Carbon Isotope Events of Foraminifera Attributed to Methane Release from Gas Hydrates on the Continental Slope, Northeastern South China Sea. Sci. China Earth Sci. 2016, 59, 1981–1995. [Google Scholar] [CrossRef]
  75. Chen, F.; Hu, Y.; Feng, D.; Zhang, X.; Cheng, S.; Cao, J.; Lu, H.; Chen, D. Evidence of Intense Methane Seepages from Molybdenum Enrichments in Gas Hydrate-Bearing Sediments of the Northern South China Sea. Chem. Geol. 2016, 443, 173–181. [Google Scholar] [CrossRef]
  76. Brackenridge, R.E.; Stow, D.A.V.; Hernández-Molina, F.J.; Jones, C.; Mena, A.; Alejo, I.; Ducassou, E.; Llave, E.; Ercilla, G.; Nombela, M.A.; et al. Textural Characteristics and Facies of Sand-rich Contourite Depositional Systems. Sedimentology 2018, 65, 2223–2252. [Google Scholar] [CrossRef]
  77. Passega, R. Significance of CM Diagrams of Sediments Deposited by Suspensions. Sedimentology 1977, 24, 723–733. [Google Scholar] [CrossRef]
  78. Fang, C.; Chang, Z.; Yang, Z.; Xin, S.; Xiao, D.; Guanghu, L.; Cong, W.; Xia, J. Calcareous Nannofossils and Foraminifera Biostratigraphy on the Northeastern Slope of the South China Sea and Variation in Sedimentation Rates. Earth Sci.-J. China Univ. Geosci. 2016, 41, 416. [Google Scholar] [CrossRef]
  79. Liu, F.; Huang, E.; Jin, X.; Tian, J. Glacial Methane Hydrate Dissociation in the South China Sea Margin During the Oligocene. Geophys. Res. Lett. 2025, 52, e2024GL114439. [Google Scholar] [CrossRef]
  80. Song, Y.; Lei, Y.; Zhang, L.; Cheng, M.; Li, C.; Liu, N. Spatial-Temporal Evolution of the Gas Hydrate Stability Zone and Accumulation Patterns of Double BSRs Formation in the Shenhu Area. Front. Earth Sci. 2022, 10, 880933. [Google Scholar] [CrossRef]
  81. Ren, J.; Yin, Z.; Lu, H.; Xu, C.; Kuang, Z.; Deng, W.; Liu, Y.; Linga, P. Effects of South China Sea Clayey-Silty Sediments on the Kinetics and Morphology of CH4 Hydrate: Implication on Energy Recovery. Appl. Energy 2024, 367, 123399. [Google Scholar] [CrossRef]
  82. Li, Y.; Xu, C.; Zhu, J.; Lu, H.; Liu, Y.; Gu, Y.; Pan, Z.; Linga, P.; Yin, Z. Comprehensive Characterizations of Core Sediments Recovered from Shenhu W17 Well in South China Sea and Its Impact on Methane Hydrate Kinetics. Gas Sci. Eng. 2024, 131, 205482. [Google Scholar] [CrossRef]
  83. Huang, Y.; Cheng, J.; Wang, M.; Wang, S.; Yan, W. Gas Hydrate Dissociation Events During LGM and Their Potential Trigger of Submarine Landslides: Foraminifera and Geochemical Records From Two Cores in the Northern South China Sea. Front. Earth Sci. 2022, 10, 876913. [Google Scholar] [CrossRef]
  84. Lu, Y.; Yang, H.; Huang, B.; Liu, Y.; Lu, H. Foraminifera Associated with Cold Seeps in Marine Sediments. Front. Mar. Sci. 2023, 10, 1157879. [Google Scholar] [CrossRef]
  85. Li, C.; Hu, G.; Zhang, W.; Ye, Y.; Liu, C.; Li, Q.; Sun, J. Influence of Foraminifera on Formation and Occurrence Characteristics of Natural Gas Hydrates in Fine-Grained Sediments from Shenhu Area, South China Sea. Sci. China Earth Sci. 2016, 59, 2223–2230. [Google Scholar] [CrossRef]
  86. Choi, K.; Jo, J. Morphodynamics and Stratigraphic Architecture of Compound Dunes on the Open-Coast Macrotidal Flat in the Northern Gyeonggi Bay, West Coast of Korea. Mar. Geol. 2015, 366, 34–48. [Google Scholar] [CrossRef]
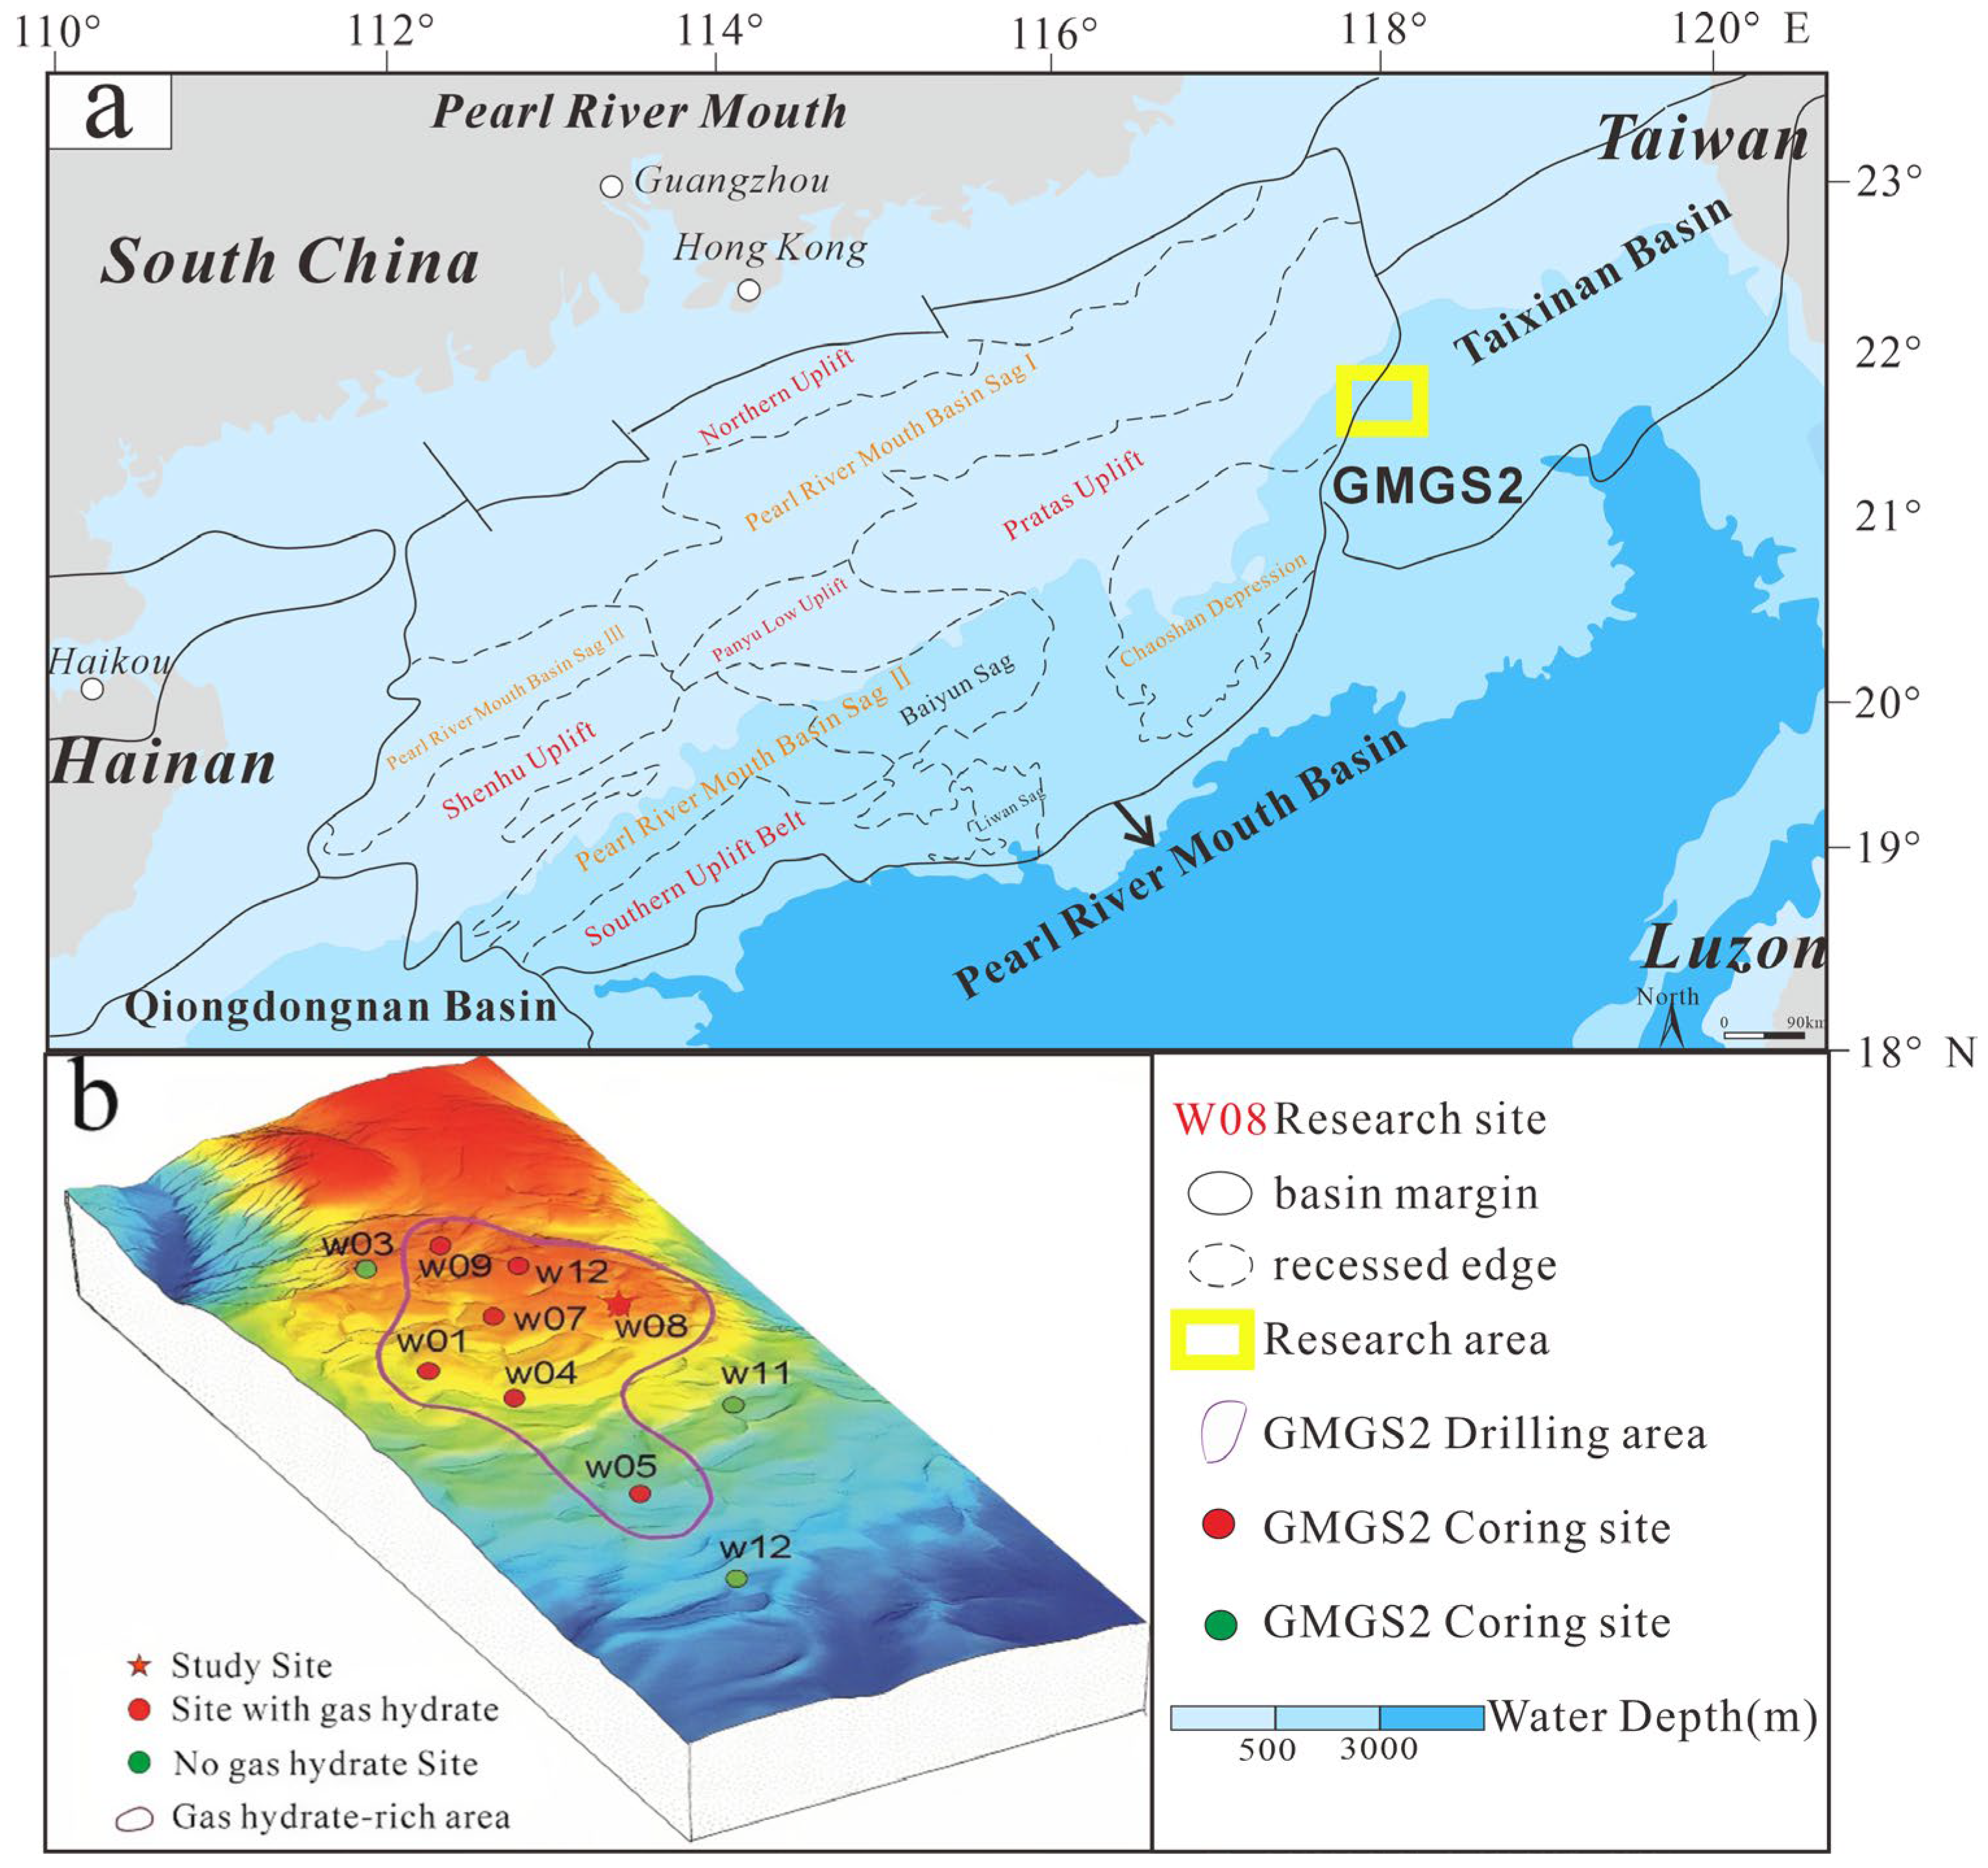
Figure 1. (a) Study area and marine currents (modified from [57]); (b) Enlarged view of the red box in (a) showing the drilling area of GMGS2 (modified from [21]). Multibeam-reconstructed seafloor topography, where water depth shallows from blue to red.
Jmse 13 01550 g001
Figure 2. Logs of gas hydrate saturation, resistivity, lithology, and grain-size parameters at Site DS-W08. Resistivity data is obtained through logging-while-drilling. Interval refers to the gas hydrate reservoirs and the non-gas hydrate layers (modified from [57,60]).
Jmse 13 01550 g002
Figure 3. Logs of grain-size parameters at Site DS-W08. (a) Mean grain size, (b) Sorting coefficient, (c) Skewness, (d) Kurtosis, (e) Median grain size, and (f) C value.
Jmse 13 01550 g003
Figure 4. Ternary plot of the lithology (a) and logs of mineral contents (b) of sediment from Site DS-W08.
Jmse 13 01550 g004
Figure 5. Depth profiles of major element oxide contents (expressed as mass percentages of the whole rock) and the Sr/Ba ratio.
Jmse 13 01550 g005
Figure 6. Variation in biogenic content with depth. (a) total foraminiferal abundance, (b) planktonic foraminiferal abundance, (c) benthic foraminiferal abundance, (d) ratio of planktonic to benthic foraminiferal abundance, and (e) calcareous nannofossil abundance.
Jmse 13 01550 g006
Figure 7. Identification of sedimentary processes in shallow core interval. C-M diagrams of S2 (a1), S4 (b1) and S1 and 3 (c1); traction current identification diagrams of S2 (a2), S4 (b2) and S1 and 3 (c2).
Jmse 13 01550 g007
Figure 8. Identification of sedimentary processes in shallow core interval. C-M diagrams of D2 (a1), D4 (b1) and D1 and 3 (c1); traction current identification diagrams of D2 (a2), D4 (b2) and D1 and 3 (c2).
Jmse 13 01550 g008
Figure 9. The model of the coupling relationship between sedimentary process and gas hydrate accumulation. The macroscopic (a) and microscopic (b) patterns of the constraints on gas hydrate enrichment imposed by the overbank suspended deposits formed by gravity flow; the macroscopic (c) and microscopic (d) controlling effects of traction current deposition on the enrichment of hydrates.
Jmse 13 01550 g009
Disclaimer/Publisher’s Note: The statements, opinions and data contained in all publications are solely those of the individual author(s) and contributor(s) and not of MDPI and/or the editor(s). MDPI and/or the editor(s) disclaim responsibility for any injury to people or property resulting from any ideas, methods, instructions or products referred to in the content.