Article

CFD Investigation on Effect of Ship–Helicopter Coupling Motions on Aerodynamic Flow Field and Rotor Loads

1
School of Ocean Engineering, Harbin Institute of Technology at Weihai, Weihai 264209, China
2
Dalian Changfeng Industrial Corporation, Dalian 116200, China
*
Author to whom correspondence should be addressed.
J. Mar. Sci. Eng. 2025, 13(8), 1544; https://doi.org/10.3390/jmse13081544
Submission received: 7 July 2025 / Revised: 8 August 2025 / Accepted: 9 August 2025 / Published: 12 August 2025
(This article belongs to the Special Issue Advances in Marine Computational Fluid Dynamics)

Abstract

As critical assets for surveillance, reconnaissance, and transport, shipborne helicopters play an indispensable role in modern maritime operations. Ensuring the safety and stability of shipboard landings is therefore of paramount importance, particularly under complex sea conditions. This study presents a comprehensive investigation into the dynamic interaction between helicopters and moving ships during the landing phase, with a particular emphasis on the influence of ship motions on the unsteady aerodynamic flow field and rotor loads. A coupled numerical–theoretical framework is developed, which overcomes the limitations of traditional models that typically consider static or single-degree-of-freedom (SDOF) ship motions. This work systematically analyzes the effects of multi-degree-of-freedom (MDOF) ship motions—including roll, pitch, and heave—on the coupled aerodynamic environment and rotor dynamic response. The results demonstrate that each motion component imposes a distinct influence on the flow-field characteristics, with pitch identified as the dominant contributor to turbulence intensity, particularly during the mid-to-late landing phase. Furthermore, it is found that a linear superposition of individual motions cannot accurately represent the combined effect of MDOF motions. Instead, their interaction leads to complex nonlinear effects, which may attenuate certain flow instabilities. These findings provide critical insights into ship–helicopter dynamic coupling and offer a scientific basis for improving landing safety under adverse sea conditions.

1. Introduction

The ocean represents humanity’s second living space, where maritime affairs not only concern oceanic security but also exert significant impacts on terrestrial safety. Naval forces primarily rely on military vessels, with shipborne helicopters serving as critical airborne assets for reconnaissance, anti-submarine operations, troop transport, and combat support. However, operational challenges become evident when considering helicopter landings on confined ship decks under realistic sea conditions with pronounced vessel motions. Statistical analyses have demonstrated that shipboard helicopter accident rates are 5 times higher than spaceflight operations, 10 times greater than jet bomber missions, and 54 times higher than those of commercial aviation [1].
Regarding operational complexity, wave-induced six-degree-of-freedom (6-DOF) ship motions fundamentally alter aerodynamic flow fields over the stern deck, significantly increasing pilot workload and jeopardizing landing safety. Furthermore, wind currents interacting with superstructures generate complex flow patterns, including deck-edge vortices (Figure 1a), hangar shear layers (Figure 1b), spiral-shaped superstructure vortices (Figure 1c), and mast-induced flow separations (Figure 1d). These flow fields may interact with rotor-induced vorticity to form more complex vortex systems [2], creating intricate aerodynamic interference on rotor blades. Therefore, the systematic investigation of coupled rotor–ship flow-field characteristics and rotor load variations under combined wind–wave excitations is crucial for enhancing the ship–helicopter operational compatibility.
Understanding the dynamics of shipborne helicopter landings requires comprehensive knowledge of the coupled aerodynamic interactions between the aircraft and the ship’s wake flows. Therefore, it is essential to study the flow-field characteristics on the ship deck to support predictive operational assessments. Current research methods for ship-wake analysis mainly fall into three categories: full-scale measurements, experimental modeling, and computational simulations.
Full-scale measurements, while offering the highest accuracy among these methods, face practical limitations such as long durations, high costs, and measurement uncertainties caused by stochastic maritime weather conditions. As a result, this approach is rarely used in academic research [4,5].
Experimental modeling provides a cost-effective alternative, albeit with reduced accuracy caused by scale effects. Wind tunnel testing has become the predominant experimental method [6,7,8], enhanced by advanced instrumentation such as seven-hole probes, oil flow visualization, and particle image velocimetry (PIV) systems [5,9]. Lee and Zan pioneered coupled rotor–ship experiments under wind tunnel conditions, evaluating helicopter dynamic loads at four hover positions through root-mean-square (RMS) load analysis [10]. Wu systematically investigated coupled flow-field structures during both ship roll and pitch motions using a similar experimental setup [11].
Computational Fluid Dynamics (CFD) has emerged as a transformative approach due to technological advancements. Widely adopted numerical frameworks include Reynolds-Averaged Navier–Stokes (RANS) methods [12], Unsteady RANS (URANS) formulations, Large Eddy Simulation (LES) techniques [13], and Hybrid RANS-LES strategies (e.g., Detached Eddy Simulation, DES). Numerical simulations predominantly employ commercial CFD platforms (Fluent, STAR-CCM+) to model marine vessels and helicopters under realistic sea states, enabling coupled aerodynamic analysis and structural load monitoring. The interaction mechanisms between rotor and ship flow fields can be categorized as one-way coupling or two-way coupling. One-way coupling simulates ship-wake effects independently and superimposes them onto helicopter flow fields, facilitating the rapid load prediction by isolating the ship-to-rotor interactions. However, this approach neglects rotor-induced feedback on ship wakes [14]. Shi et al. extended this methodology to dual-helicopter scenarios, where the rotor effects simulated via momentum source methods were unidirectionally imposed on the adjacent aircraft environments [15]. Two-way coupling comprehensively accounts for bidirectional ship–rotor interactions, including both wake impacts on rotors and rotor downwash effects on ship flows. Assessments of the coupled airwake model have been performed by many researchers [16,17,18,19], who addressed the need for a fully coupled solution between the helicopter rotor and the ship airwake. However, previous studies have not fully considered the motion characteristics of ships and often assume SDOF or even stationary ship conditions, largely neglecting the effects of MDOF ship motions on aerodynamic flow fields.
Furthermore, rotor modeling in numerical simulations is generally categorized into blade element methods and momentum source methods. The blade-resolved approach involves constructing detailed rotor geometries and resolving rotor forces or dynamic loads using dynamic mesh techniques like overset grids [20]. While achieving high computational accuracy, this method demands substantial computational resources. Conversely, the momentum source method represents the helicopter rotor as an infinitely thin actuator disk, simulating its effects through the momentum source terms in the fluid governing equations. This approach significantly improves computational efficiency by eliminating direct rotor geometry modeling, and its accuracy has been substantially enhanced with recent advancements in momentum source models [21,22,23]. However, scarce research has examined coupled rotor–ship flow fields’ effects on dynamic loads during helicopter landings.
Therefore, the primary contribution of this study lies in the comparative analysis of aerodynamic flow fields and rotor loads induced by SDOF versus MDOF ship motions. This approach offers new insights into how individual ship motion components influence the unsteady aerodynamic environment and rotor dynamics. The findings establish practical frameworks for enhancing the safety and reliability of shipboard helicopter operations, particularly in severe sea states.

2. Numerical Model and Method Validation

2.1. Wave Model Formulation

The commercial CFD software package STAR-CCM+, based on the Unsteady Reynolds-averaged Navier–Stokes method (URANS), was adopted for the numerical simulation. The finite volume method (FVM) was used to model the fluid flow. The pressure on the hull surface was obtained by solving the conservation equations of fluid mass and momentum. The control conservation equation for RANS is:
u i t + u j u ¯ i x j = 1 ρ p ¯ x i + ν 2 u ¯ i x i x j u i u j ¯ x j
where ρ represents the fluid density; p ¯ represents the average pressure; v is the dynamic viscosity; u ¯ is the average value of the normal component of velocity; u i u j ¯ is the Reynolds stress tensor coefficient; and xi and xj denote the spatial coordinates.
To effectively capture gravity-dominated air–water interfaces—i.e., free surfaces—the Volume of Fluid (VOF) method was employed. Its governing equation is formulated as follows:
α t + u i α x i = 0
where α is the volume fraction, which is the volume fraction of the phase fluid in a cell, that is,
{ α = 1 , w a t e r 0 < α < 1 , interface α = 0 , a i r
Accurate simulation of the wave systems is essential to predict ship motions. In the present CFD simulations, the VOF method was applied to simulate the surface gravity waves. Periodic sinusoidal wave patterns were replicated using first-order Stokes waves as the input wave model. This approach is standard in seakeeping analyses and sufficiently capture the wave characteristics required for the reliable prediction of ship and marine structure responses [24,25]. Implementation details followed those of CD-Adapco [26]. The free surface elevation η for first-order Stokes waves is [27]:
η = a cos ( K · x ω t )
where a denotes the wave amplitude (m); ω denotes the wave angular frequency (rad/s); and K denotes the wave vector.
For the infinite water depth conditions (where wave kinematics are independent of water depth), the dispersion relation simplifies to:
λ = g T 2 2 π
where λ denotes the wavelength (m), and T = 2 π ω denotes the wave period (s).
In wave motion simulations, mesh refinement at the free surface is essential. Wave propagation errors depend on both grid resolution and time-step size. The temporal discretization accuracy is determined by the Courant number, formally defined as the Courant–Friedrichs–Lewy (CFL) condition, quantified through the CFL number. The CFL number is defined as [24]:
C F L = U · Δ t Δ x
where U denotes the fluid velocity; Δx denotes the grid spacing (mesh size); and Δt denotes the time step. According to Tahsin [24], the CFL number must be calculated per cell and maintained ≤1 for numerical stability. Accordingly, the time step was set to 0.01 s, yielding CFL < 0.1.
Wave motion modeling necessitates solving the governing fluid equations. Among eddy–viscosity viscosity models, the k-Epsilon (k-ε) and k-Omega (k-ω) formulations are predominantly adopted. This work employed the k-ε model for wave generation due to its computational efficiency [24,28,29,30].
( ρ k ) t + ( ρ k u i ) x i = x j [ ( μ + u t σ k ) k x j ] + G k ρ ε
( ρ ε ) t + ( ρ ε u i ) x i = x j [ ( μ + u t σ ε ) ε x j ] + ρ C 1 E ε ρ C 2 ε 2 k + ν ε
where C1 and C2 denote the coefficients of average flow and turbulence properties, and μ denotes the viscosity coefficient.

2.2. Ship and Helicopter Models

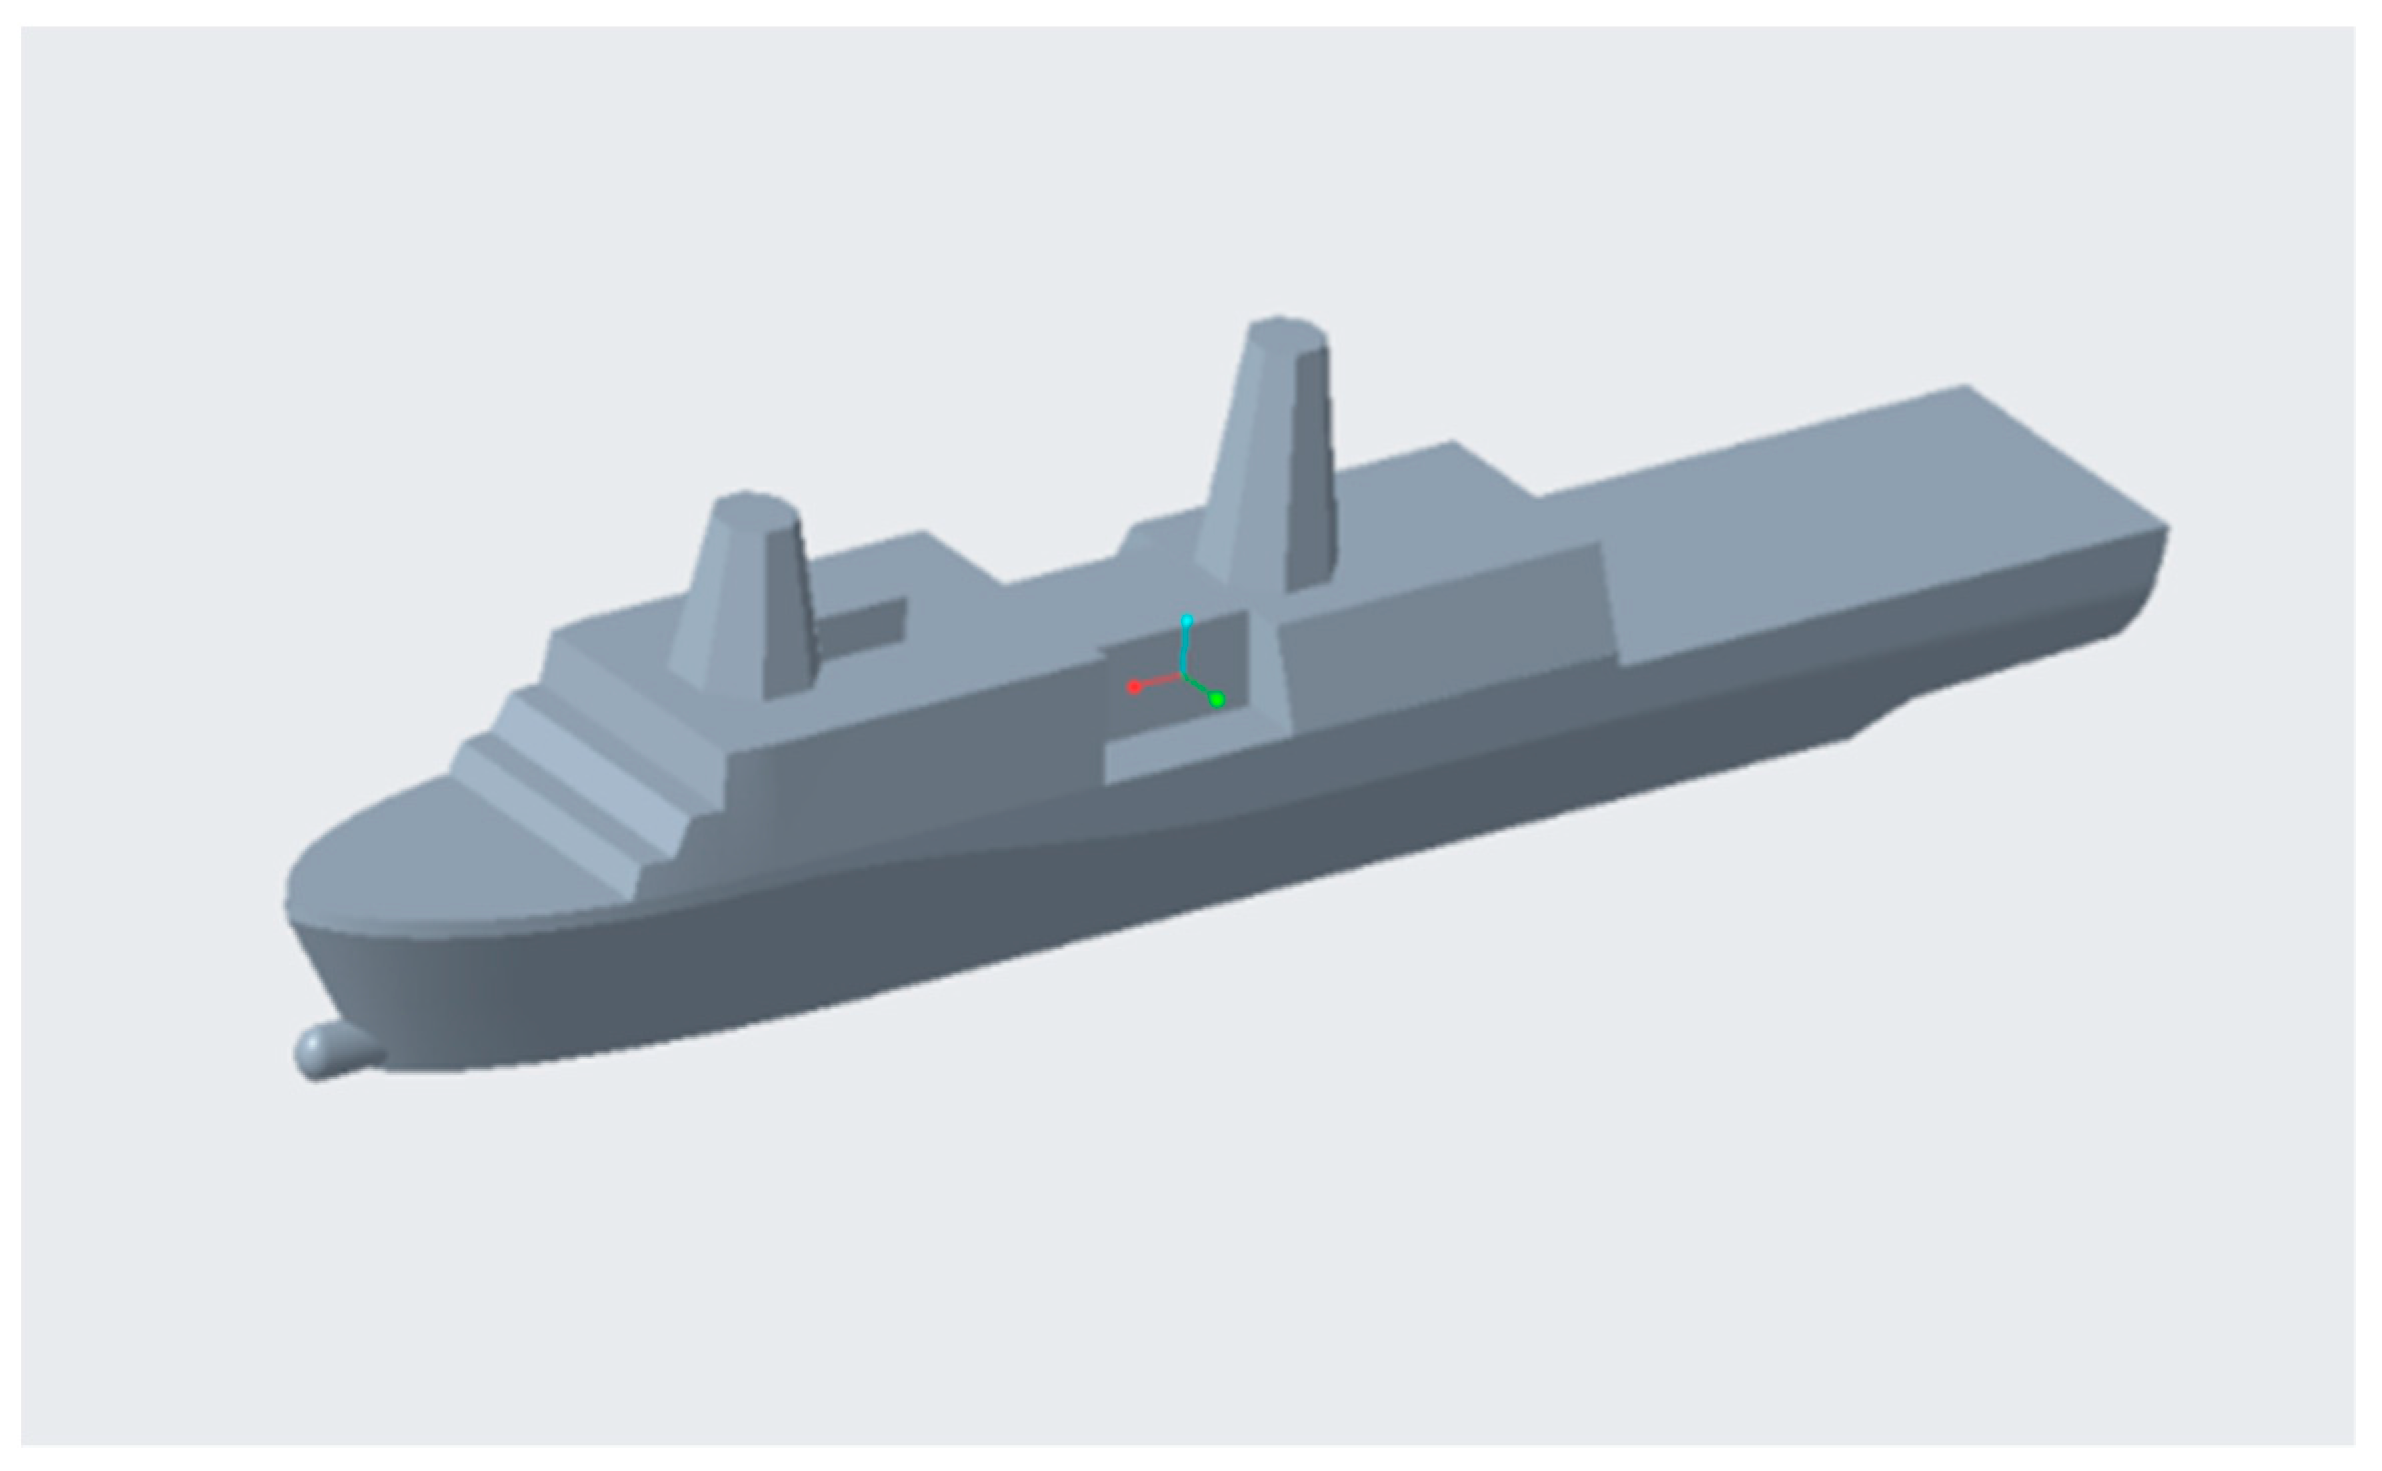
The benchmark model for the ship–helicopter coupling is based on the USS San Antonio-class amphibious transport dock, as shown in Figure 2. Principal dimensions of the full-scale vessel are detailed in Table 1. To optimize computational efficiency while minimizing numerical artifacts, a 1:20 scale ship model was employed in simulations using geometric similarity transformations.
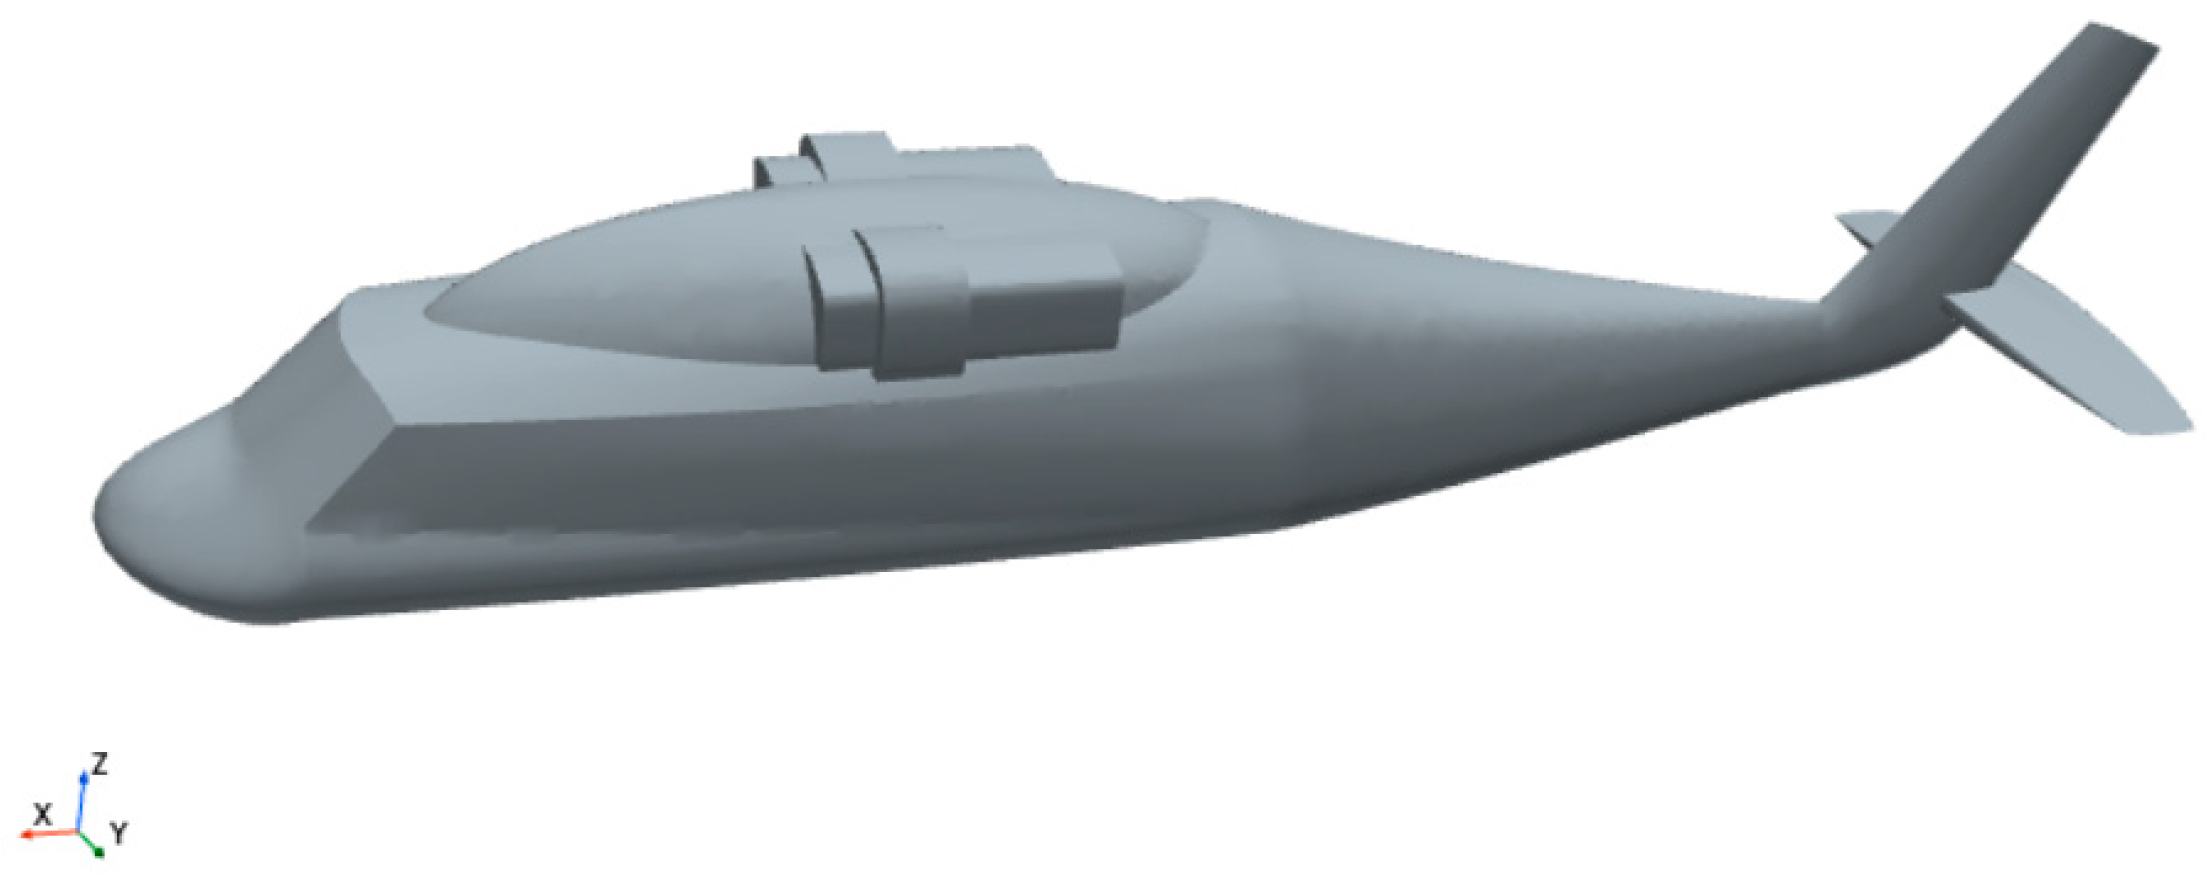
The helicopter model for ship–helicopter coupling derived from the UH-60 Black Hawk utility helicopter, geometrically scaled to 1:20. Its simplified fuselage geometry, excluding non-essential components, is depicted in Figure 3. Key parameters of the UH-60 are provided in Table 2.
Tail rotor effects were excluded from this study. The UH-60’s main rotor features a hybrid airfoil distribution: SC1095 from 0.1925R to 0.4658R, SC1094 R8 from 0.4658R to 0.8230R, and SC1095 from 0.8540R to the tip [33]. Computational considerations restricted the analysis to the SC1094 R8 airfoil profile.

2.3. Momentum Source Model

The momentum source method models the rotor as an infinitesimally thin actuator disk, with lift and drag forces computed based on blade element theory, that is,
d L = 1 2 ρ V 2 C l c d r
d D = 1 2 ρ V 2 C d c d r
where C l and C d denote the lift coefficient and drag coefficient, respectively [34]; V denotes the flow velocity; ρ denotes the fluid density; and r denotes the radius corresponding to the rotor element.
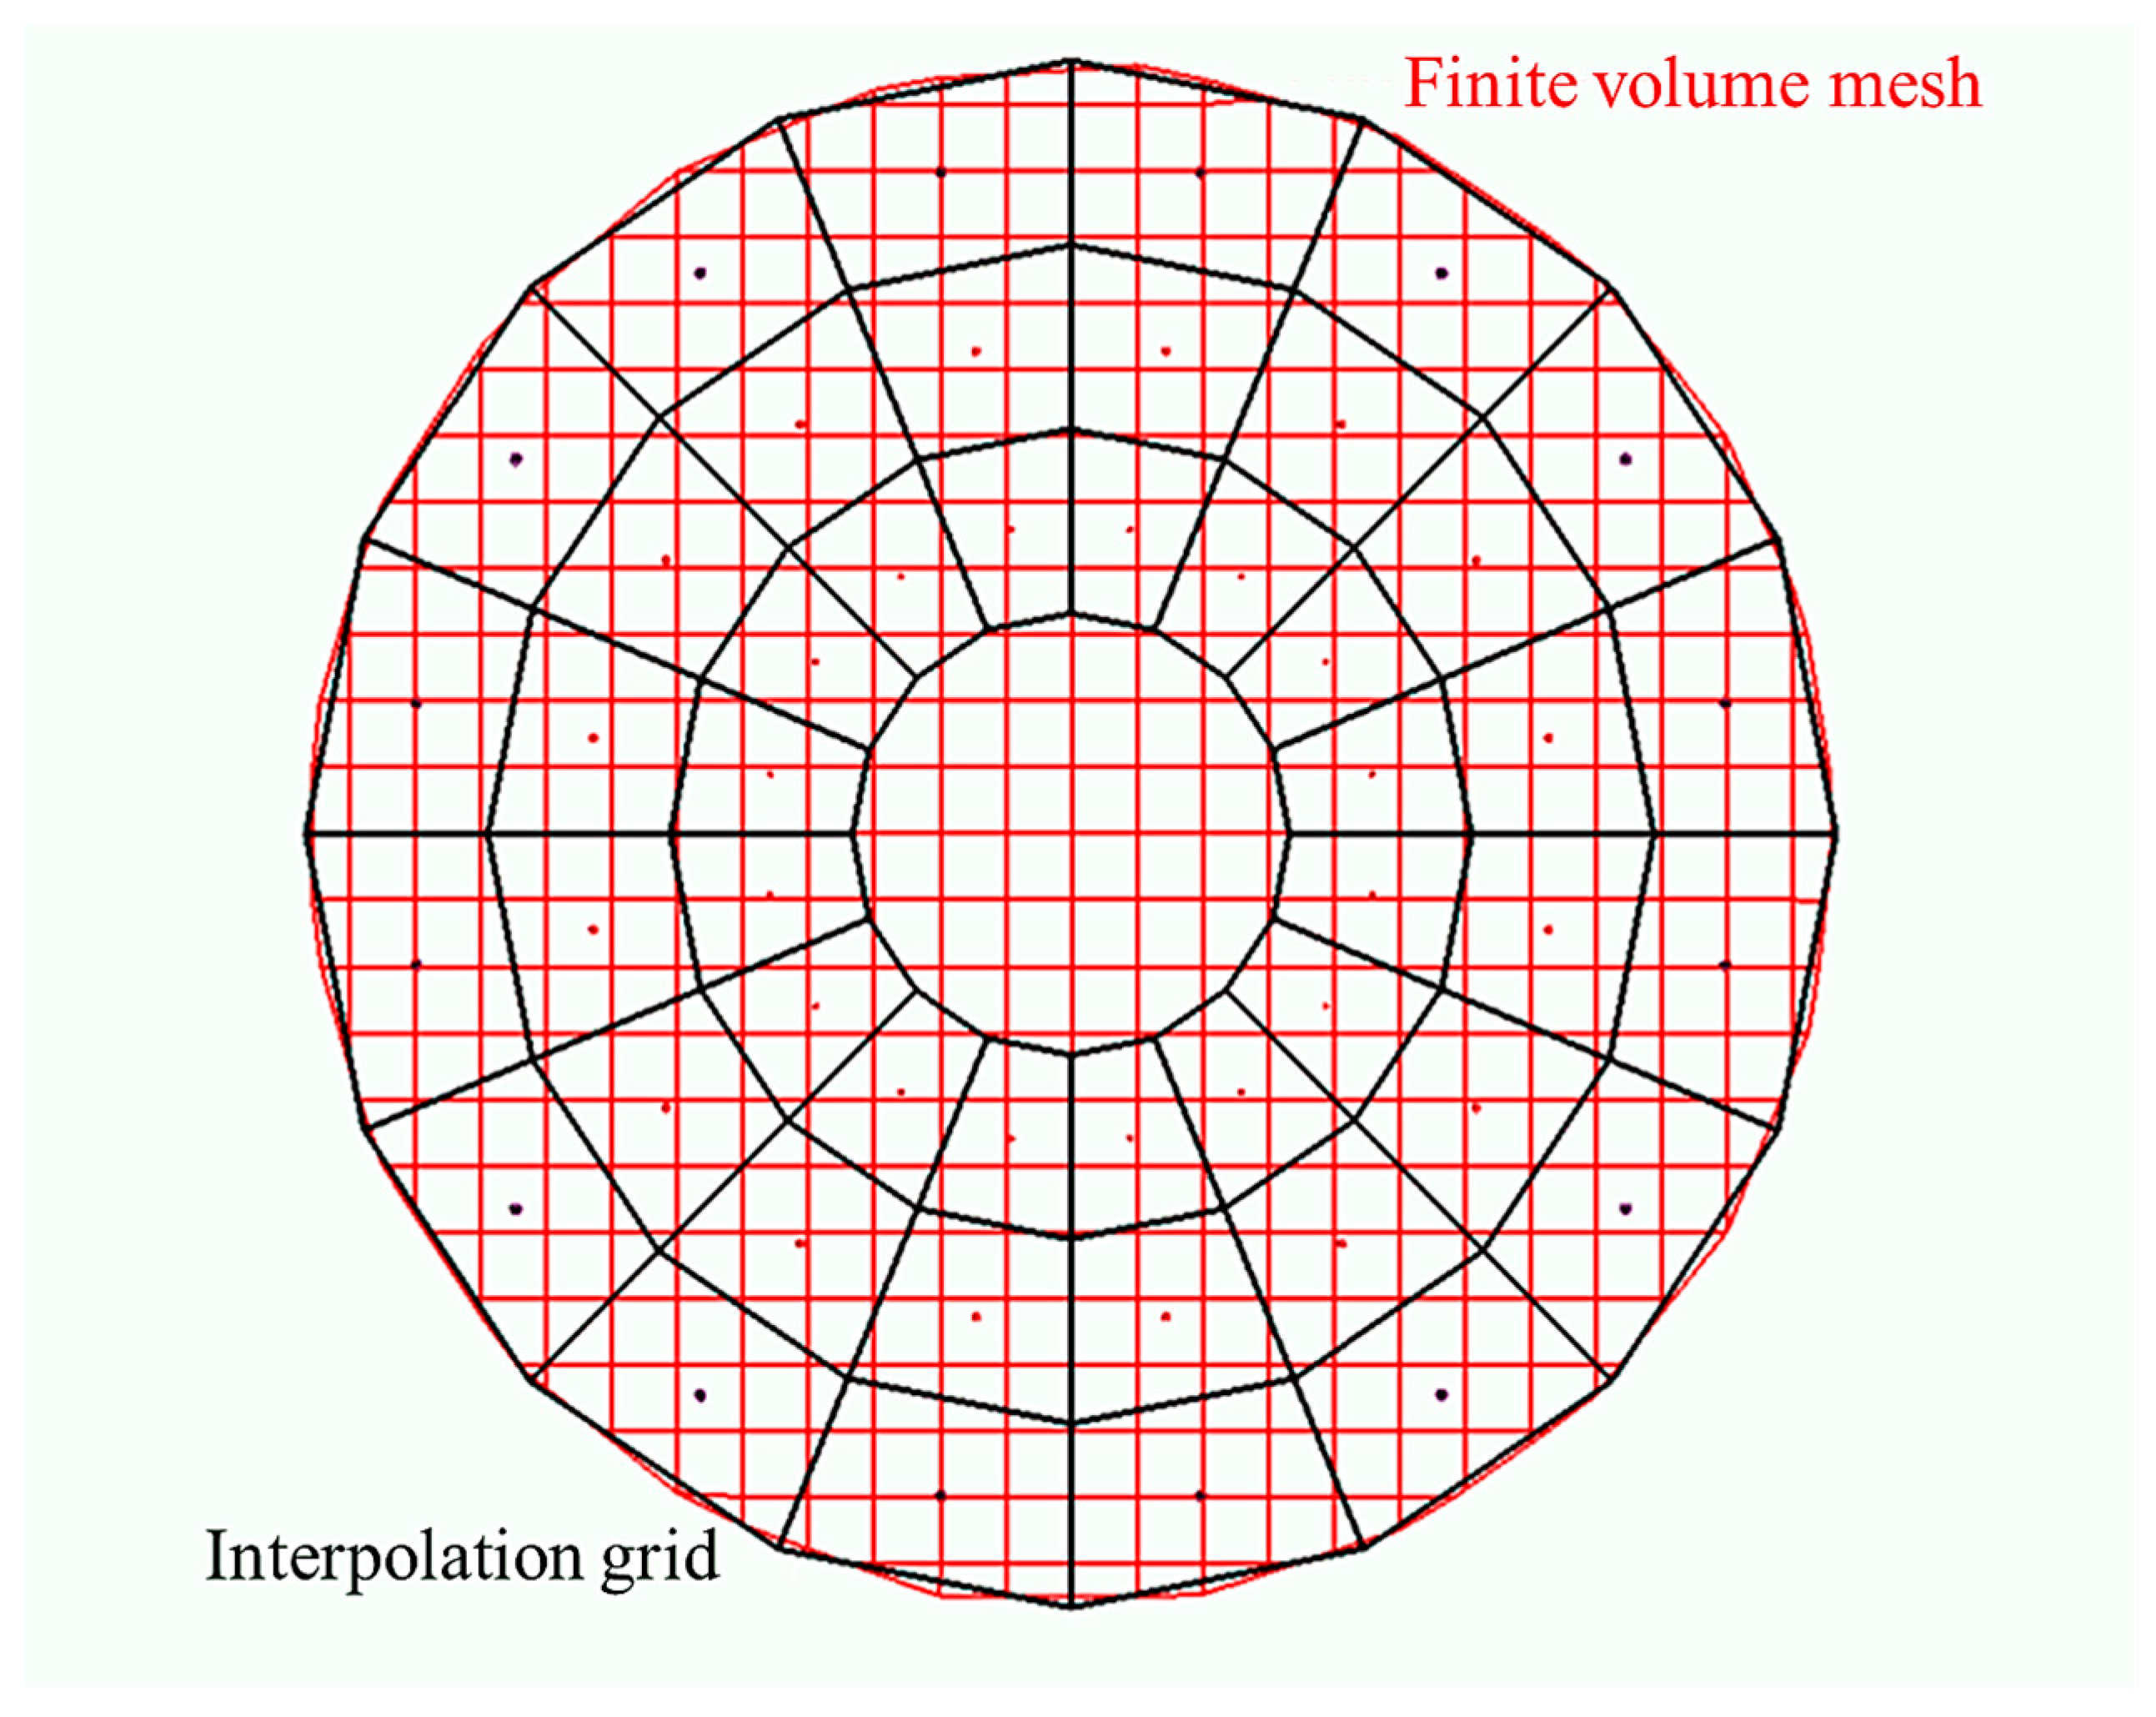
Rotor lift and drag coefficient curves, along with flow velocity, were input into the CFD solver, which dynamically generated a compatible computational grid. This approach utilized both a primary volume mesh and a surface-conformal interpolation grid for accurate blade element representation. Source terms were computed on the interpolation grid before being mapped to the volume mesh. Bidirectional data exchange between the volume mesh domains and rotor dynamics was required to resolve local flow-structure interactions. Figure 4 illustrates this dual-grid framework, showing the rotor blade interpolation grid (black) superimposed on the volume mesh (red).
Following the establishment of the momentum source model, the lift and drag forces were transformed into normal and tangential forces within the rotor disk coordinate system, expressed as:
F n = L cos β D sin β
F t = L sin β + D cos β
where Fn denotes the normal force component; Ft denotes the tangential force component; L denotes the lift force; D denotes the drag force; and β denotes the angular displacement between coordinate systems.
These forces were then converted into instantaneous fluid forces F = { F x , F y , F z } in the global coordinate system, generating corresponding source terms S = { S x , S y , S z } . However, since rotor blades only occupy control volumes during specific rotational phases, temporal correction factors must be applied to account for the blade passage periodicity:
S = b Δ φ 2 π ( F )
where b denotes the number of blades, and Δ φ denotes the blade passage angle.

2.4. Verification and Validation (VV) Study

2.4.1. Verification of Numerical Wave Generation

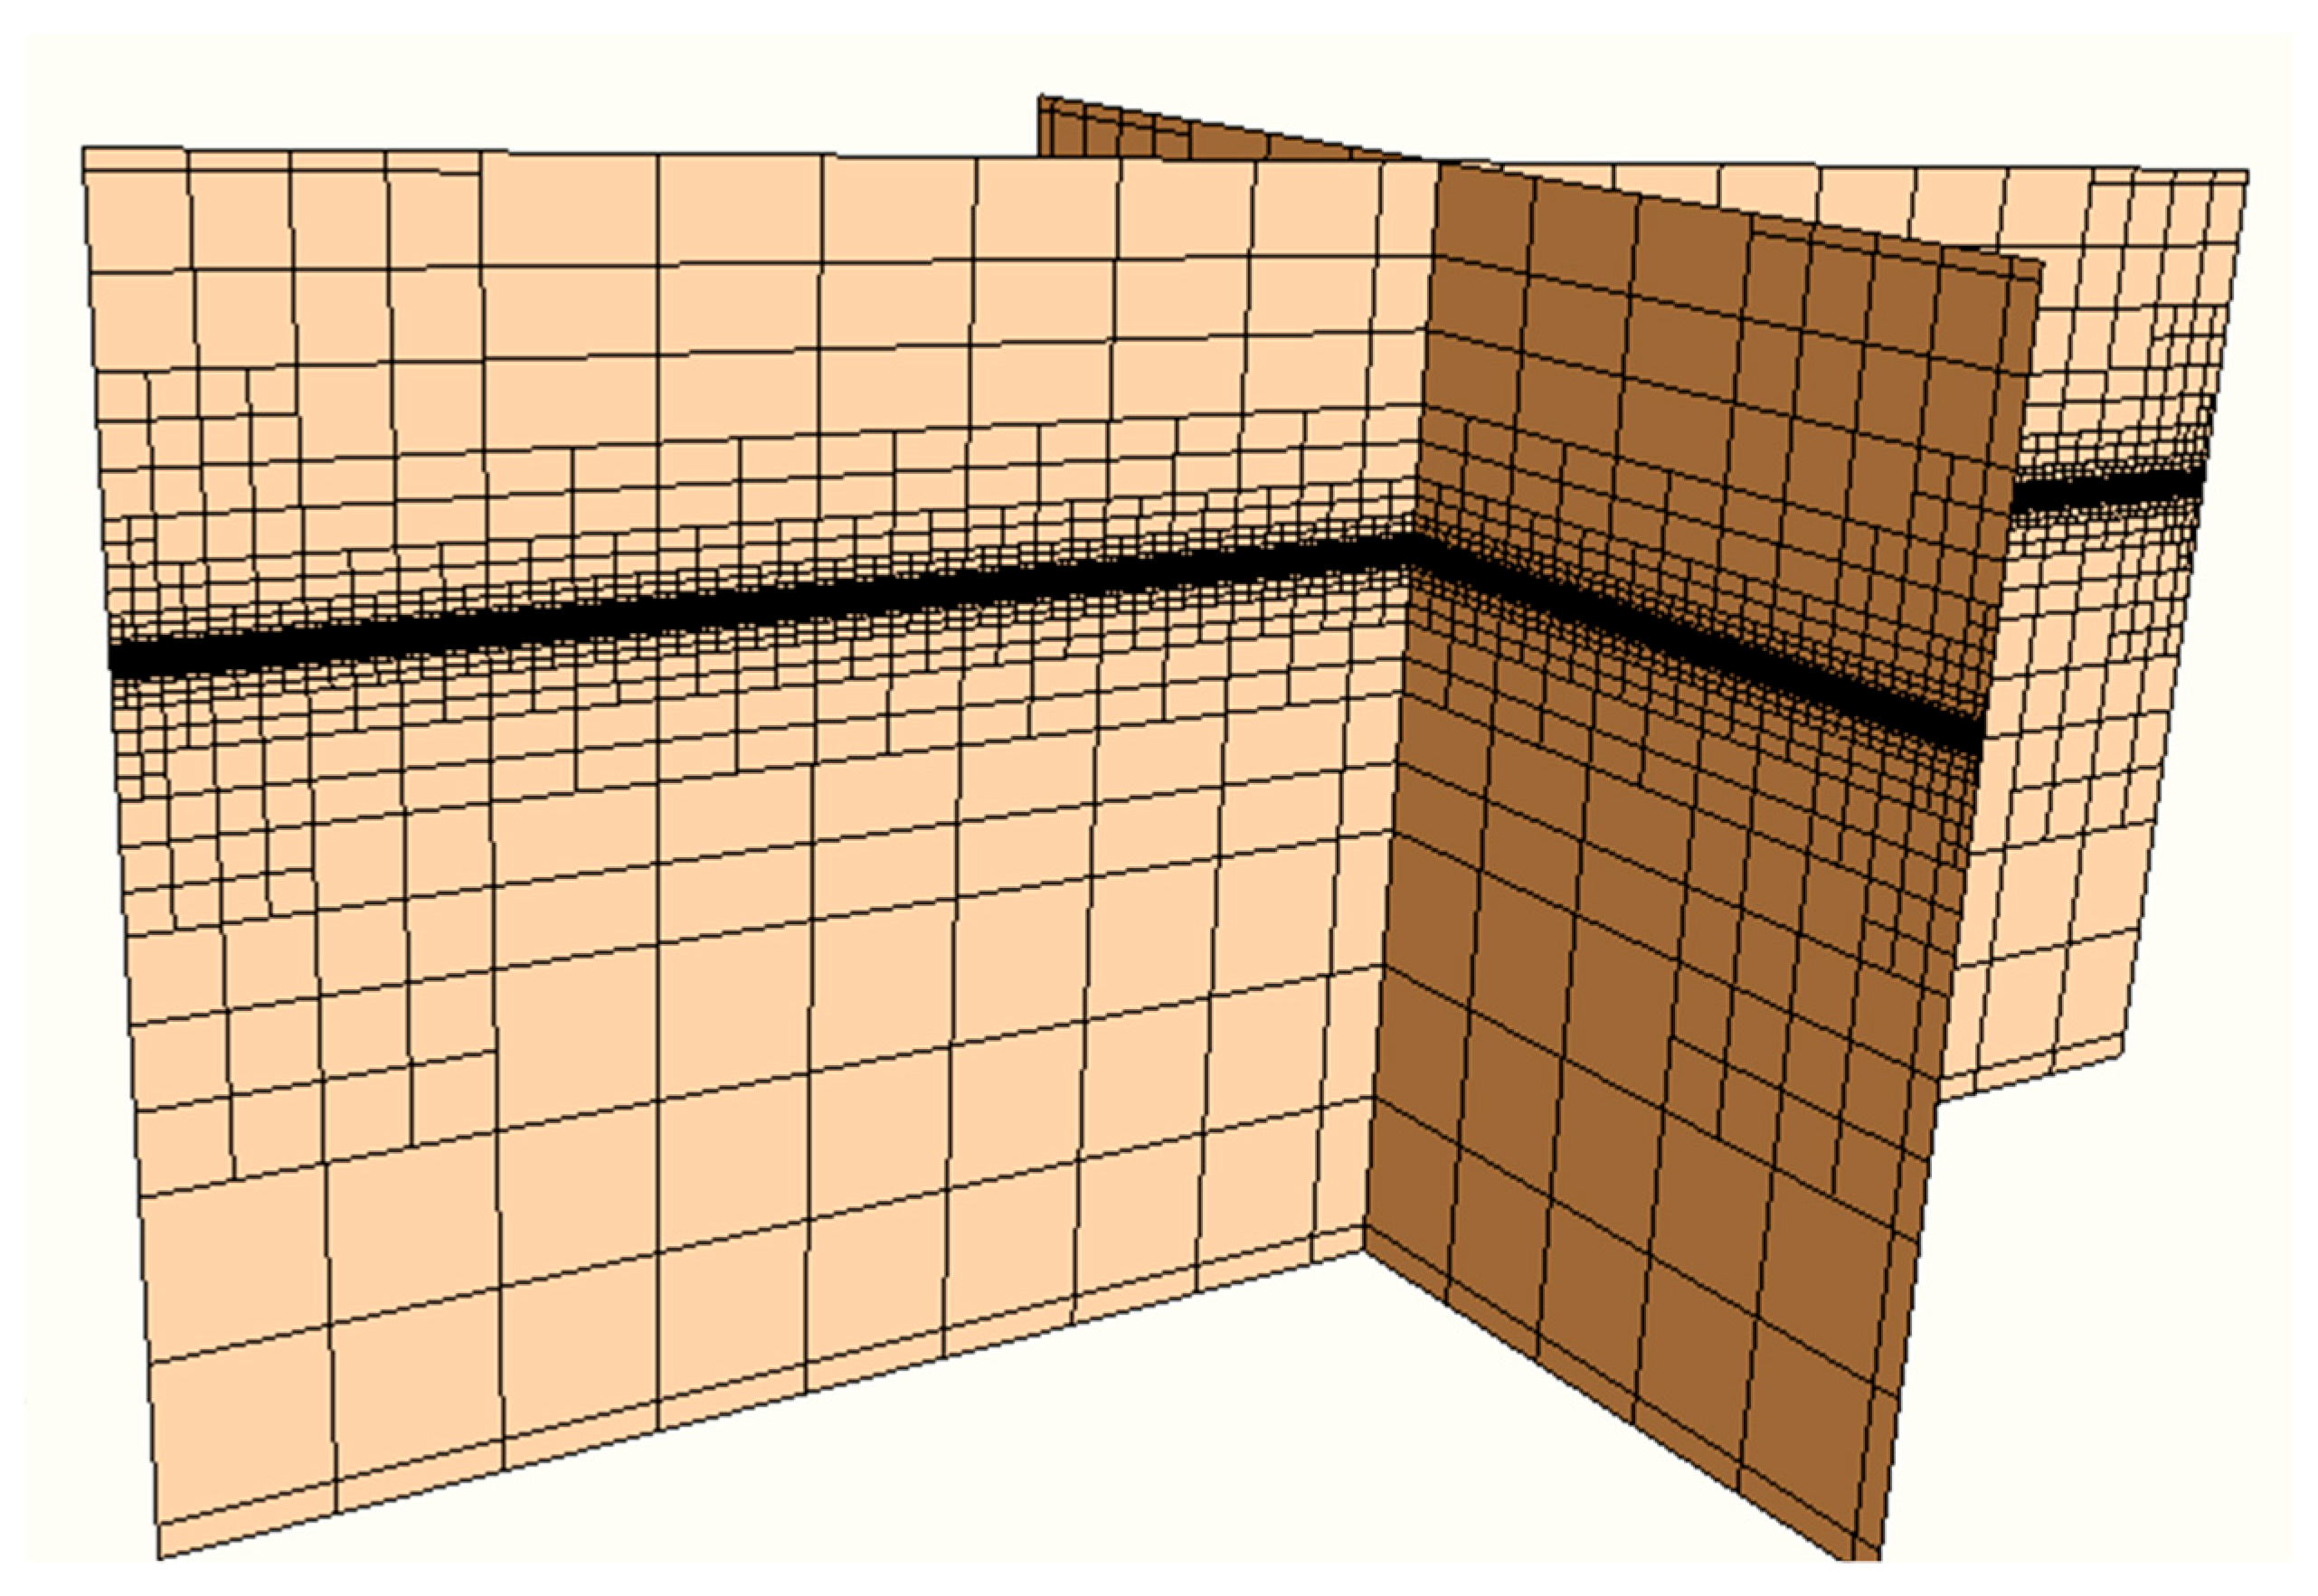
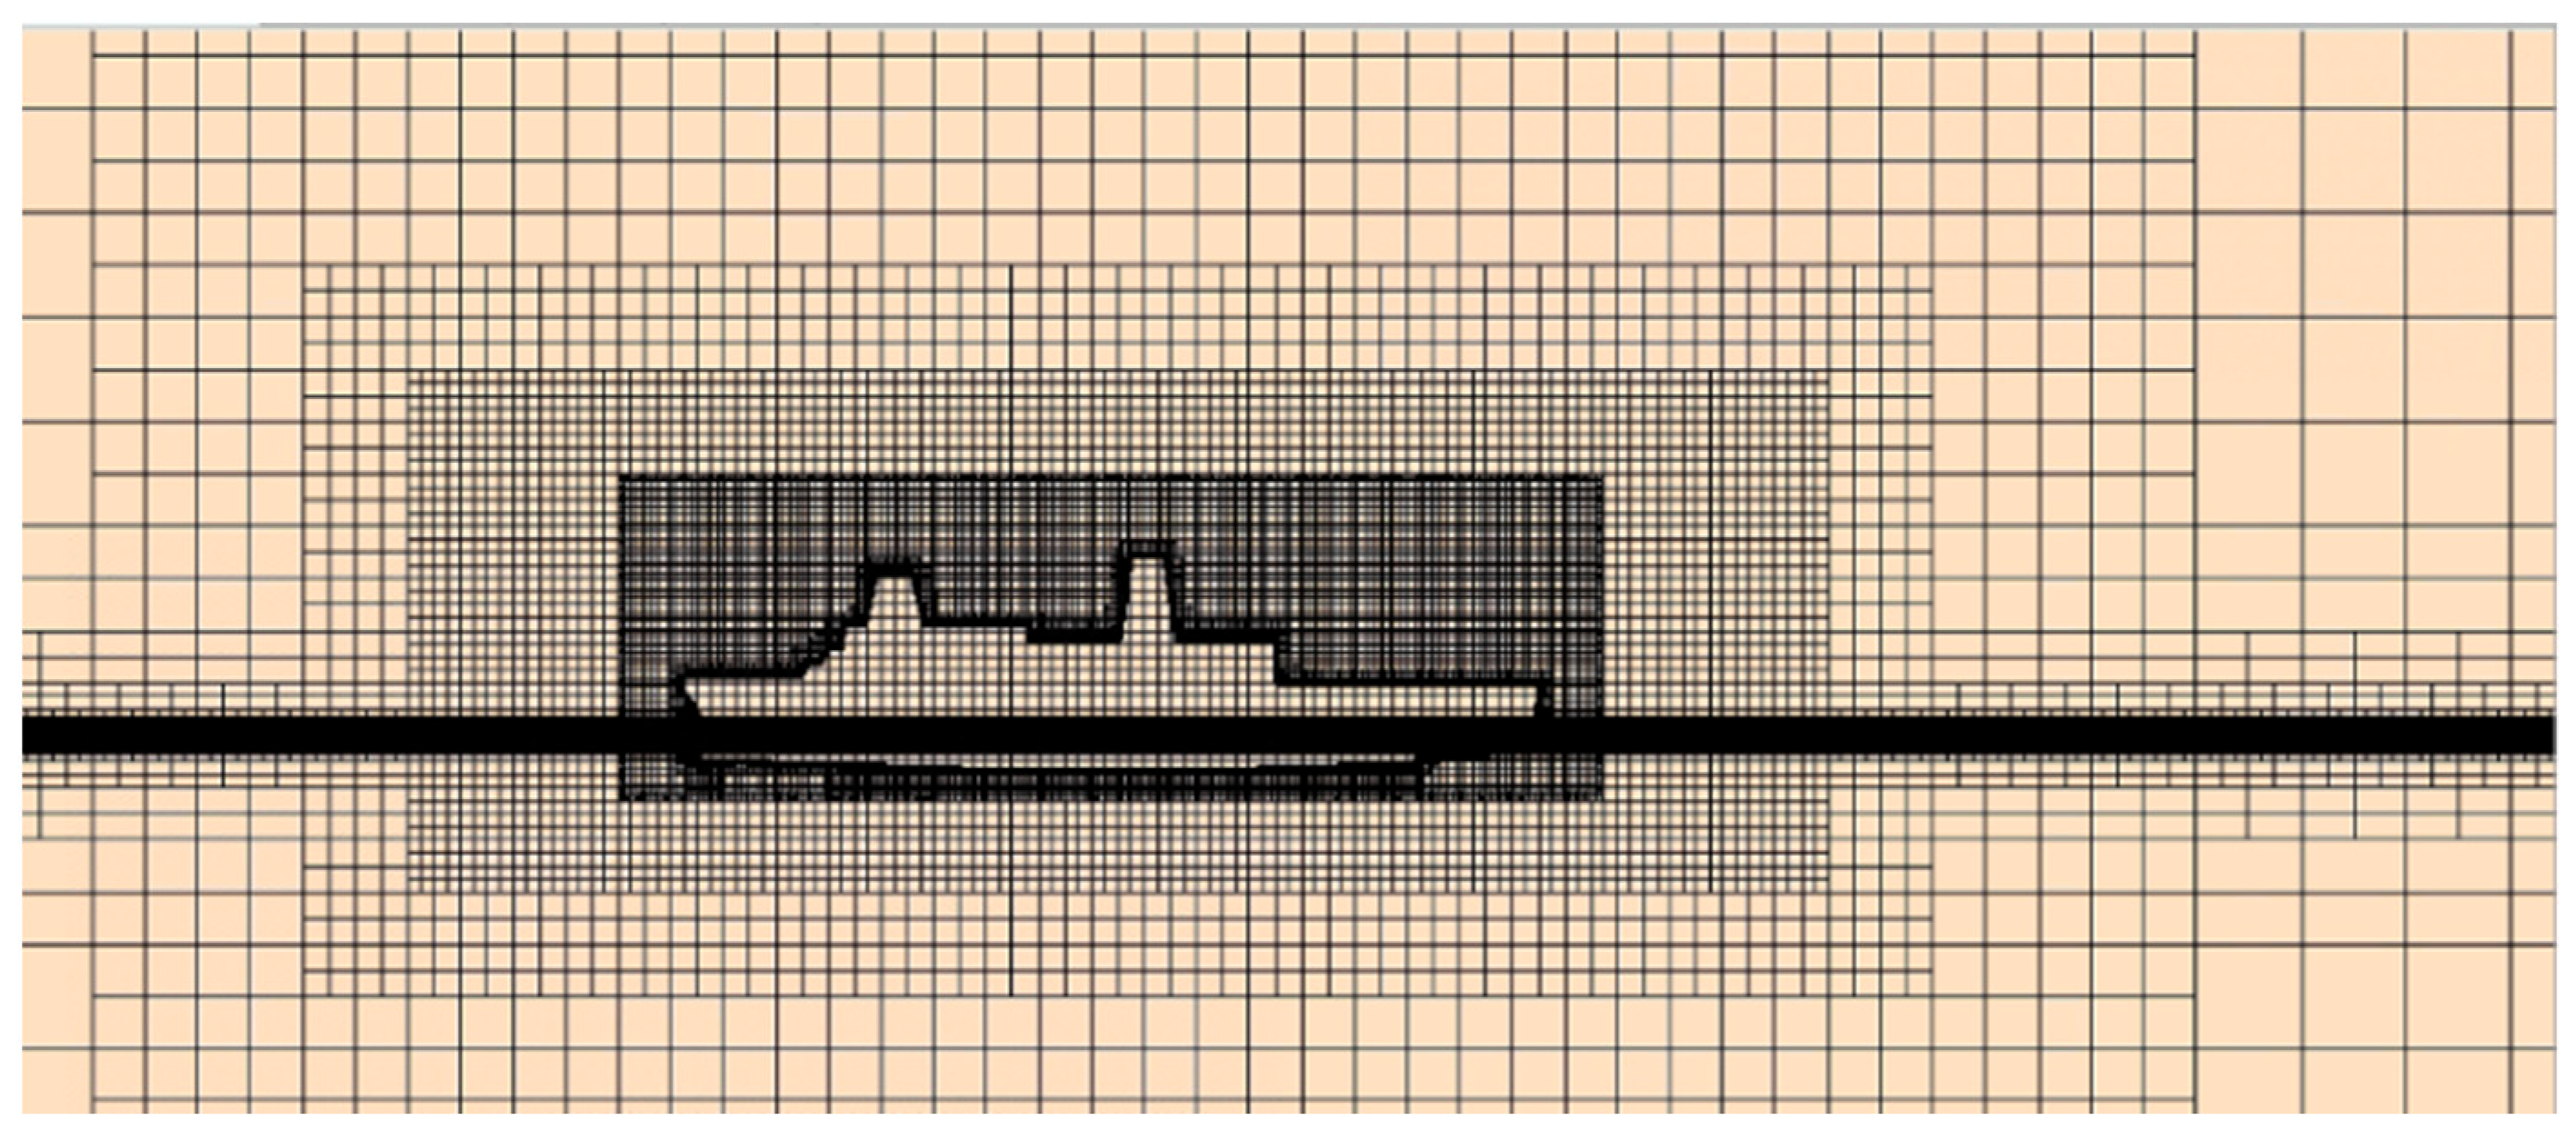
In this section, the numerical wave generation method is verified. Mesh generation was achieved using the automatic meshing facility in STAR-CCM+. The trimmed cell mesher was used to produce high-quality grids. In this study, the wave generation domain was 66 m × 5 m × 14 m, and the mesh refinement was conducted around the ship and free surface. To balance computational accuracy and efficiency, the vertical (z-direction) grid resolution was set to 20 cells per wave height, corresponding to a grid size of 0.0145 m. The horizontal (x- and y-direction) grid dimensions were determined based on the grid aspect ratio proposed by Lv and Chen [35]. The refined mesh in these zones is presented in Figure 5.
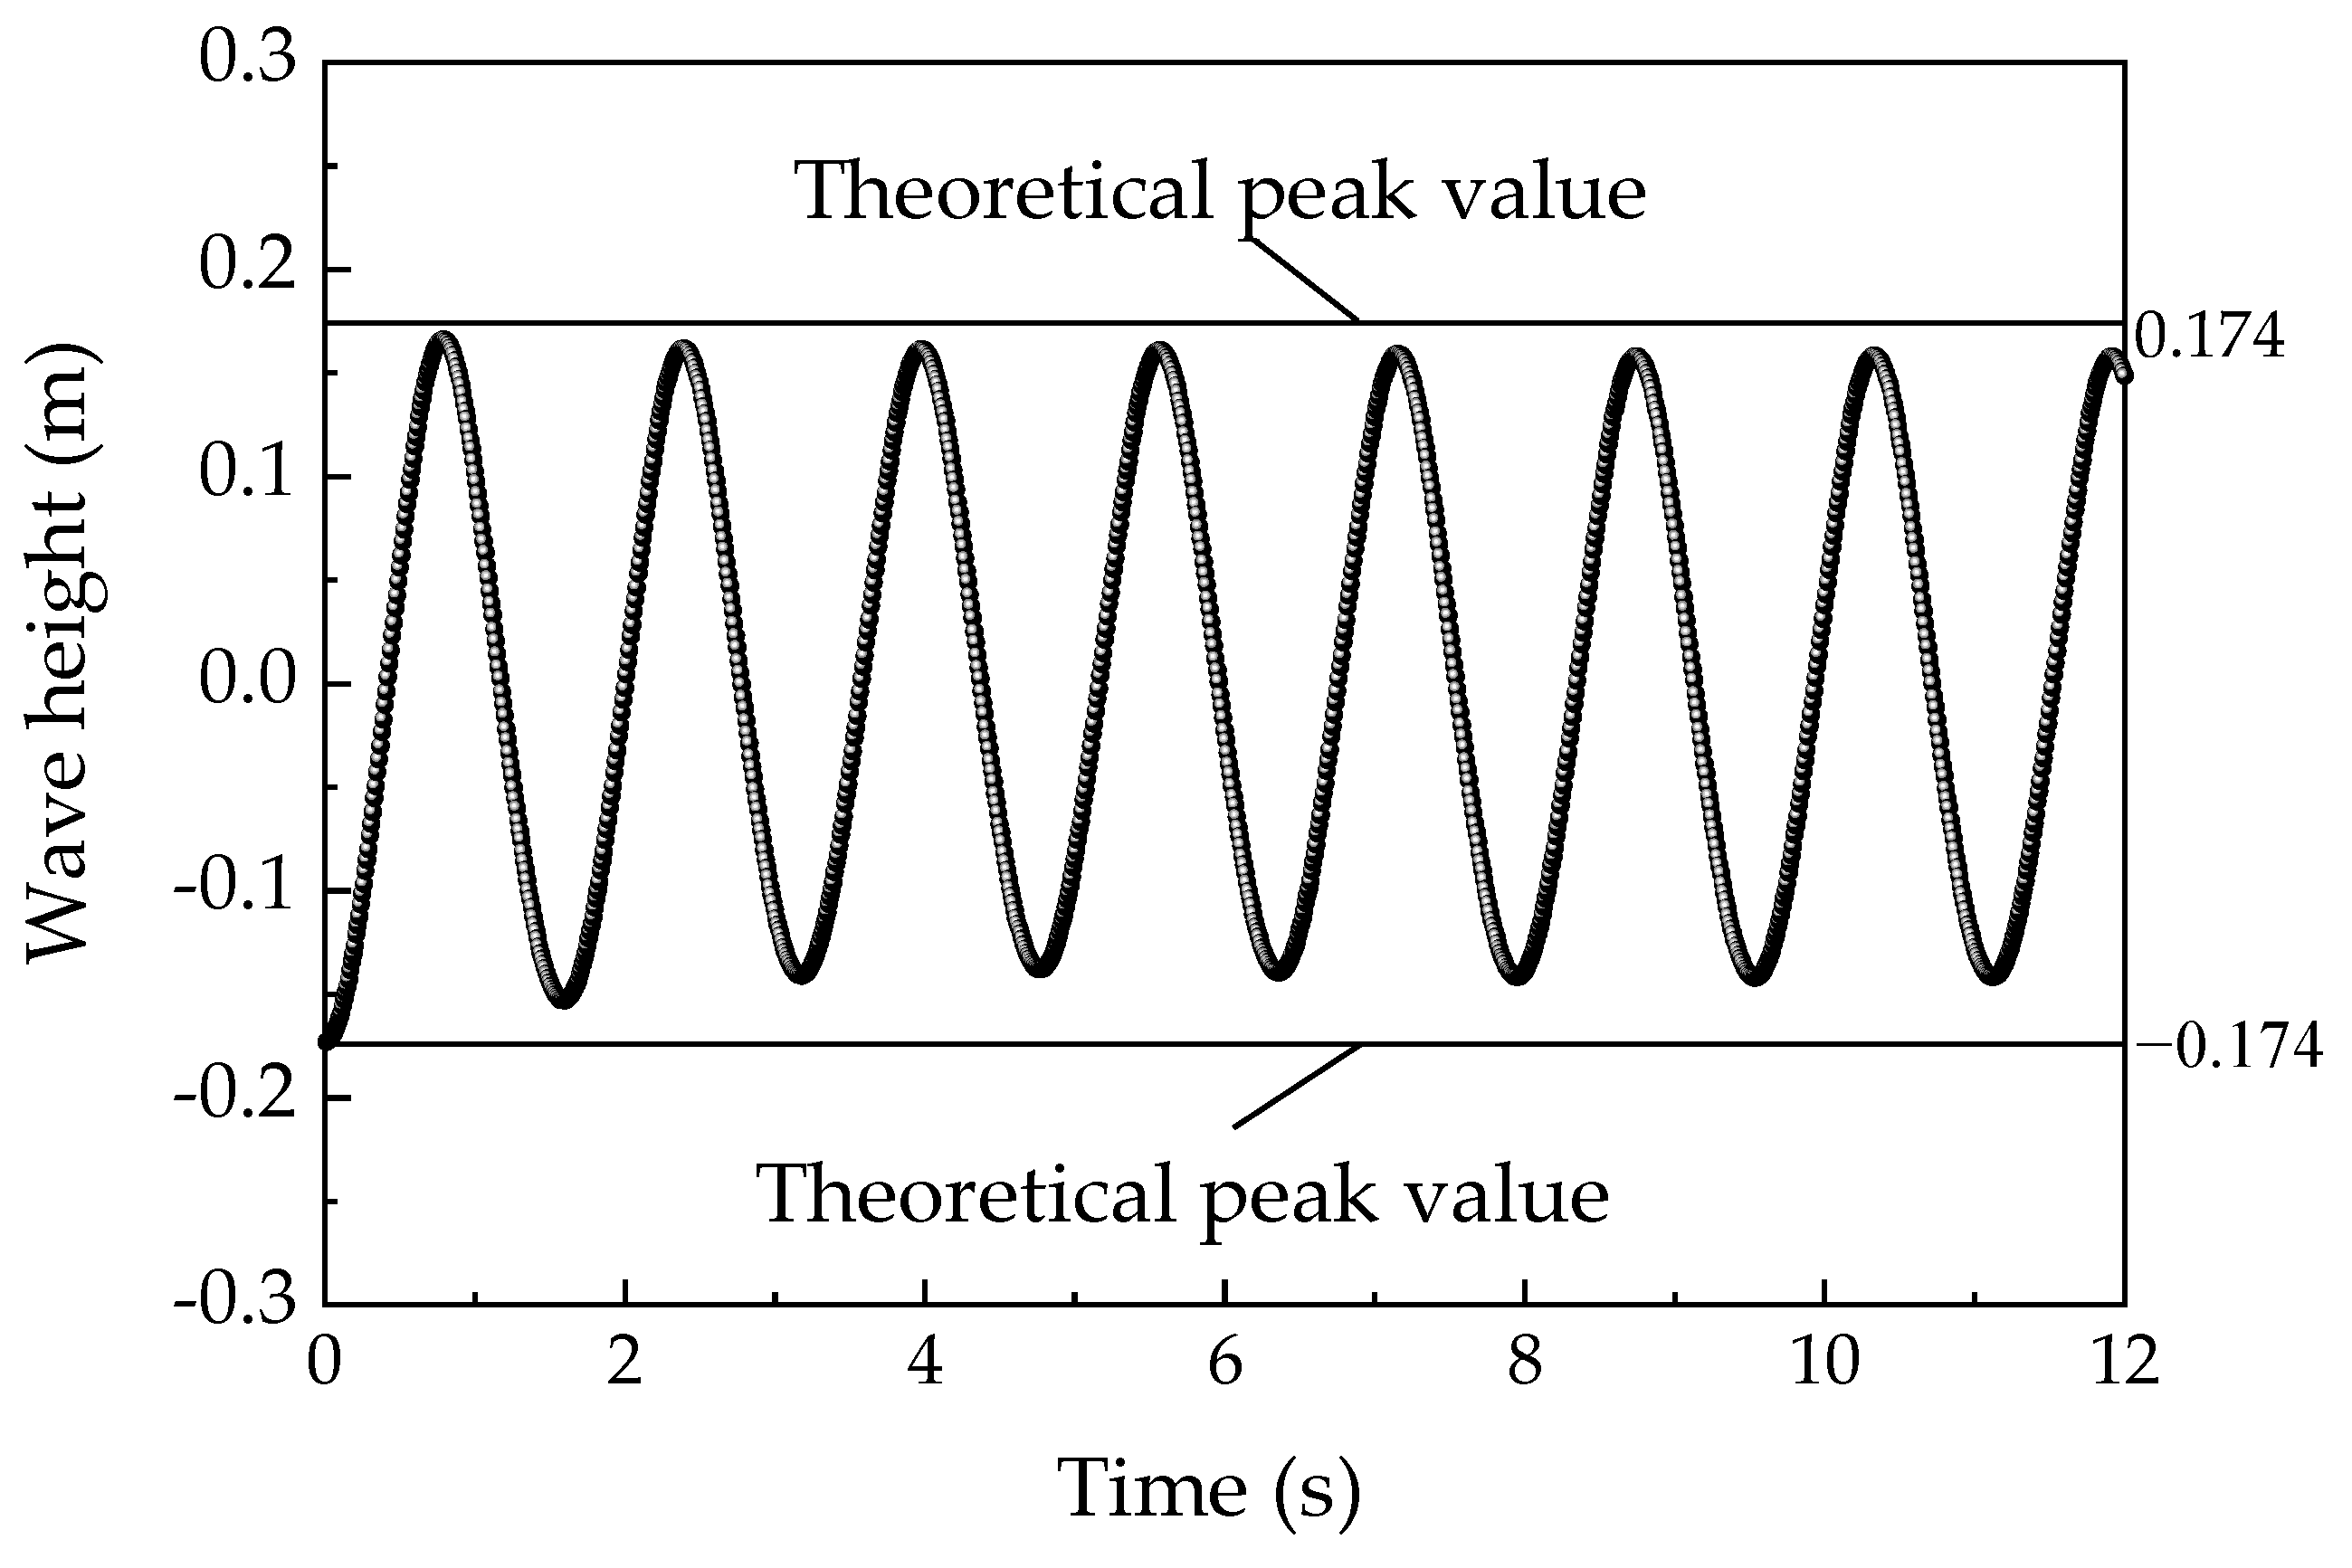
In this work, the simulation employed second-order temporal discretization, with 15 iterations per time step. The HRIC gradient smoothing option was enabled in the VOF wave model. The simulated free surface profile is shown in Figure 6. Wave-damping zones (10 m in length) were implemented along the basin perimeter to mitigate the wave reflection effects. To verify the simulated incident waves in this setup, a wave gauge was placed at x = −28 m, and an example comparing measured and theoretical wave elevations is presented in Figure 7. Note that the wave elevation measured by the wave probe included effects from the radiation wave, diffraction wave, and steady wave-making by the advancing ship. The results showed that the incident waves were well reproduced, with an error of 6.61%. This acceptable error margin validated the numerical wave generation methodology for subsequent simulations.

2.4.2. Ship-Wake Validation

To verify the accuracy of ship-wake predictions, the comparative analyses were performed against experimental data and numerical results for the SFS2 benchmark model. The validation model was scaled to 1:100, with the ship geometry and velocity measurement layout shown in Figure 8. The experimental data used in this study were adopted from Zhang’s numerical simulation, which examined the time-averaged velocity distributions above the deck of the SFS2 model under headwind conditions (wind velocity: 12.87 m/s) [36]. Velocity measurements were taken along the deck centroid line, parallel to the y-axis, at a height corresponding to the hangar elevation. For further methodological validation, computational results from Su et al. [3] were also included in the comparison.
The computed time-averaged velocities were non-dimensionalized and compared with both experimental data and Su’s computational results, as shown in Figure 9. The findings demonstrated that the simulation in this study effectively captured the overall flow trends in good agreement. In particular, the computed velocities closely matched the experimental data in the x and y directions. However, noticeable discrepancies occurred in the z direction compared to both experimental and Su’s results. These differences may be attributed to the inherently small velocity magnitudes vertically and the relatively coarse mesh resolution in that direction, which can limit the accurate resolution of vertical flow structures. To address this, a refined grid resolution was employed in the z direction for subsequent simulations. Furthermore, the results highlighted pronounced velocity variations in all three coordinate directions as the air flowed over the ship. The SFS2 superstructure induced significant flow disturbances and produced strong vortical structures.

2.4.3. Grid Independence Analysis

Before the simulations, a grid independence analysis was conducted to select an appropriate mesh configuration to balance accuracy and efficiency. According to the established simulation practices [22], computational domains typically range in size as follows: 2.5–6 L in length (where L represents ship length), 1–7.5 L in width, and 0.63–3.7 L in height. This study adopted a computational domain of 3.5 L × 1.5 L × 1.5 L. A monitoring line was defined 1 m above the deck, parallel to the y-axis at the center of the aft deck, as shown in Figure 10. Principal dimensions of the full-scale vessel are provided in Table 1. During the initial computation stages, velocity fluctuations occurred; therefore, time-averaged velocity calculations started only after the flow stabilized. The flow field stabilized at t = 0.7 s, with time-averaging commencing from that point onward.
Grid independence analysis quantifies the influence of mesh density on computational results. Since the mesh refinement factor r should exceed 1.3, a refinement factor of r = 2 was chosen. The refinement factor r is defined as:
r = h c o a r s e h f i n e
where h denotes the mesh size. A comparative view of the three mesh schemes is presented in Figure 11. Localized mesh refinement was applied above the deck to improve the resolution of flow-field features. Detailed parameters for the three grid sets are listed in Table 3.
The computational results are presented in Figure 12. The horizontal axis represents the positional parameter along the y-axis of the monitoring line, while the vertical axis denotes the non-dimensional velocity v, that is,
v * = v i v
where vi is the velocity component (i = x, y, z), and v is the velocity magnitude.
The results demonstrated negligible discrepancies in the x- and y-direction velocity components across the three grid configurations. However, the coarse grid exhibited significant errors in the z-direction velocity component. This indicates that the height direction velocity exhibited greater sensitivity to the mesh resolution than the other components, accounting for the suboptimal vertical agreement observed in Figure 9. After grid refinement, the medium grid adequately resolved flow-field details without numerical artifacts. Consequently, the medium grid configuration was employed for the subsequent simulations to balance computational accuracy and efficiency.

3. Calculation Conditions and Physical Outputs

In the authors’ previous work, although static hover conditions showed that they partially reflected the evolving aerodynamic flow field and dynamic load characteristics during actual landings, significant quantitative discrepancies were observed [37]. Thus, dynamic simulations were used to enhance the fidelity of modeling a helicopter landing on a moving vessel.

3.1. Seakeeping Analysis in Sea State 5

3.1.1. Calculation Conditions

Real-sea parameters were determined using the sea state–wind scale correlation table [38]. The scaled ship length was 10.425 m. The wavelength was set at 1.33 times the length of the ship, and the wave height was 0.19 m, corresponding to a full-scale wave height of 3.8 m for Sea State 5. The wave speed was calibrated to 2.53 m/s based on Froude’s scaling. A wave incident angle of 30° was selected to effectively excite the ship’s motion responses in all three degrees of freedom. Wind speed was determined to be 10.16 m/s in headwind configuration using this correlation.

3.1.2. Seakeeping Simulation

Following the determination of ship model parameters and wave characteristics, the seakeeping simulations were conducted. The first-order wave theory was employed for wave generation, with each wave height discretized into 20 grid cells to ensure wave capture accuracy. This discretization yielded vertical (z-direction) grid sizes of 0.0095 m at the water surface, and horizontal (x/y-direction) grid dimensions of 0.23 m near the free surface. The ship surface mesh was independently controlled with a refined size of 0.03 m. Boundary layer meshing was implemented with a total thickness of 0.05 m (five layers) and a growth rate of 1.2 to ensure a smooth transition to the outer grids. The final computational mesh comprised 3.33 million elements, with the grid configuration illustrated in Figure 13.
The simulation was conducted over 20 s with a time step of 0.008 s, ensuring the Courant number (CFL) remained below 0.1 in accordance with the temporal discretization scheme outlined in Section 2.4.1. The time histories of ship motions are presented in Figure 14. During the initial stage, significant motion oscillations occurred due to the gradual release of loads and progressively diminished as the simulation proceeded. The interval from 14 to 20 s captured sufficient motion cycles with the stabilized amplitude and was therefore selected as the input for the subsequent rotor–ship coupled simulations to define ship motions.

3.2. Case Configuration and Physical Outputs

3.2.1. Case Setup

The computational domain dimensions were 3.5 L × 1.5 L × 1.5 L, where L represents the ship length. To simulate the coupled motions of the ship and shipborne helicopter, the overset grid method was adopted. Separate meshing was performed for the ship zone, helicopter zone, and background grid zone. At the overlapping interfaces between the ship and helicopter zones, the grid refinement was applied based on the grid sizes validated in the grid independence analysis. Within the background grid, two refinement zones were established: one near the ship with a grid size of 0.06 m and another near the helicopter with a grid size of 0.03 m. The mesh near the ship surface was refined to 0.03 m based on grid independence analysis results, while the region around the helicopter fuselage was further refined to 0.01 m. To resolve flow details near the rotor, an additional refinement zone (0.0025 m grid size) fully encompassing the helicopter rotor was implemented. Rotor effects were simulated using the momentum source method. After meshing, the background domain contained 1.6 million cells, the ship overset zone comprised 1.88 million cells, and the helicopter overset zone included 2.95 million cells, yielding a total of 6.55 million cells. This grid resolution ensured accurate capture of coupled rotor–ship flow-field characteristics.
The k-ε turbulence model was selected with a headwind direction at 10.15 m/s corresponding to Sea State 5. Domain boundaries were configured as follows: the inlet was set as a velocity inlet, the outlet as a pressure outlet, and the surrounding walls were set as slip surfaces to prevent velocity gradients between the fluid and boundaries. The ship and helicopter surfaces were defined as no-slip boundaries. A time step of 0.001 s was used to maintain a Courant number of approximately 42 near the rotor region, ensuring the accurate resolution of rotor flow fields. Second-order temporal discretization was implemented with 10 inner iterations per time step to ensure computational precision. Data monitoring commenced at the 5000th time step to avoid errors from the initial numerical oscillations.
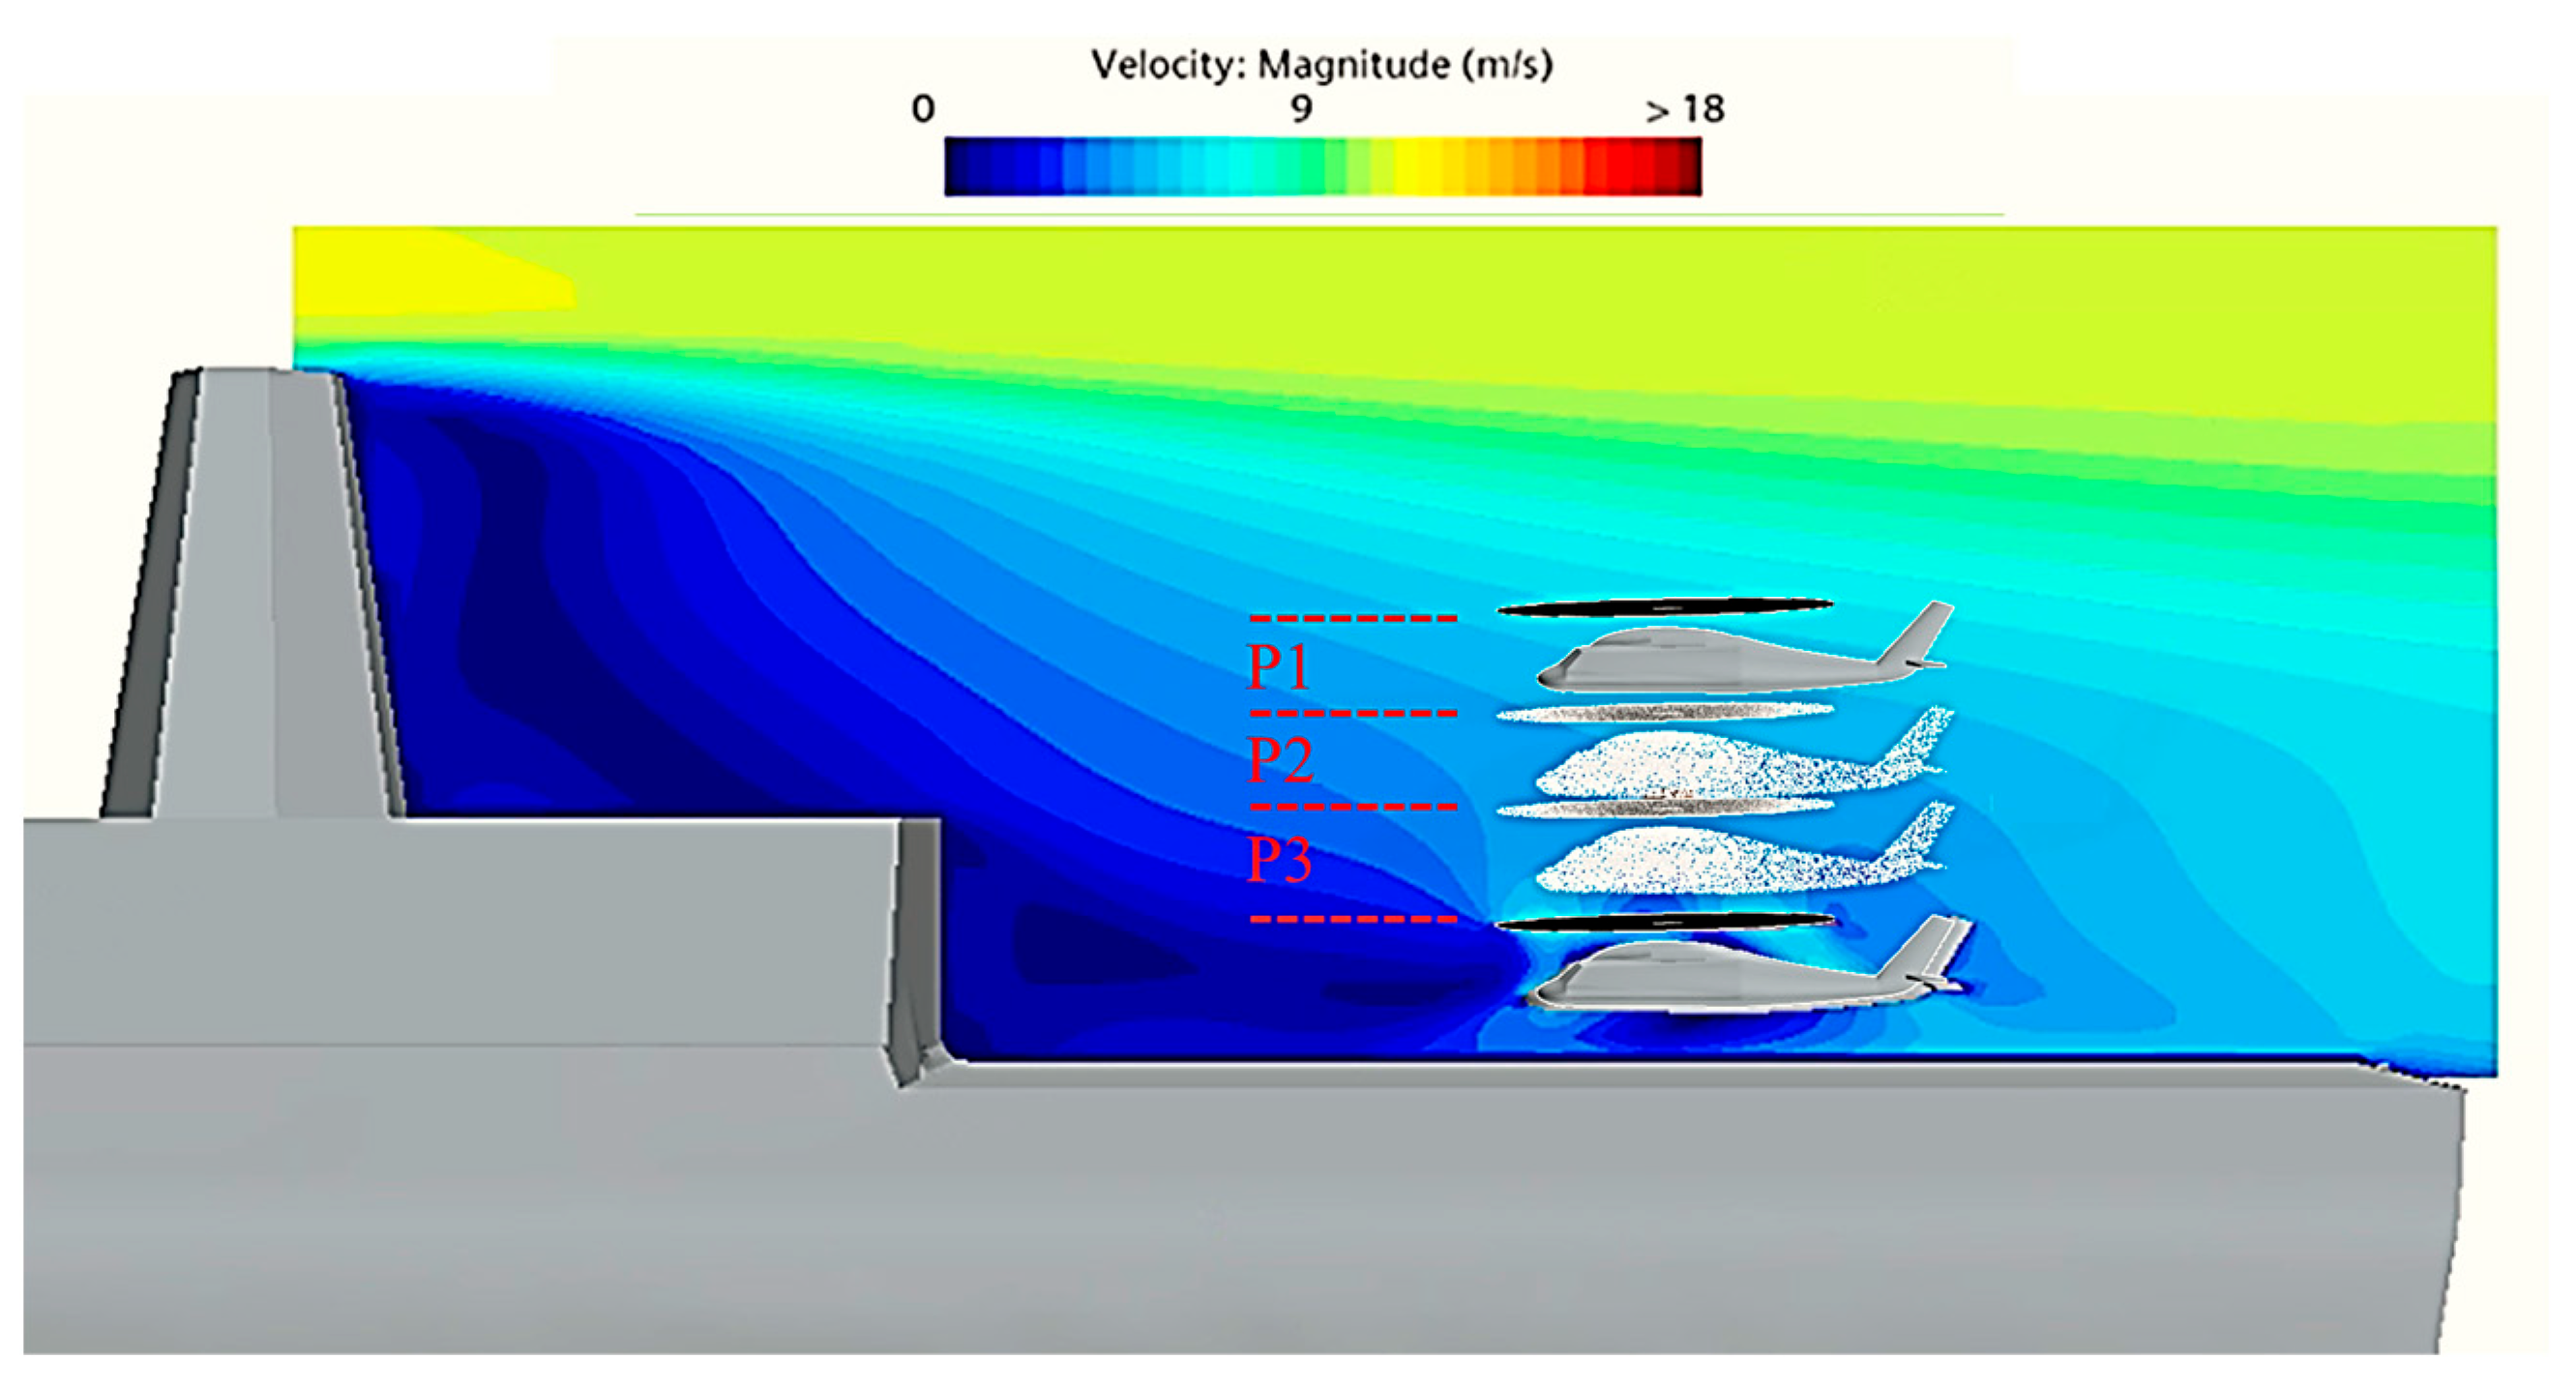
The ship motion period was approximately 2 s, leading to the division of the landing process into three phases: P1 (0–2 s), P2 (2–4 s), and P3 (4–5.5 s). Based on the helicopter descent velocity of 0.13 m/s, P1 corresponds to the phase from initial descent until the helicopter fuselage reaches hangar deck height; P2 represents the descent from fuselage-hangar alignment to rotor-hangar height parity; and P3 denotes the final approach phase where the rotor operates below hangar height, as illustrated in Figure 15.
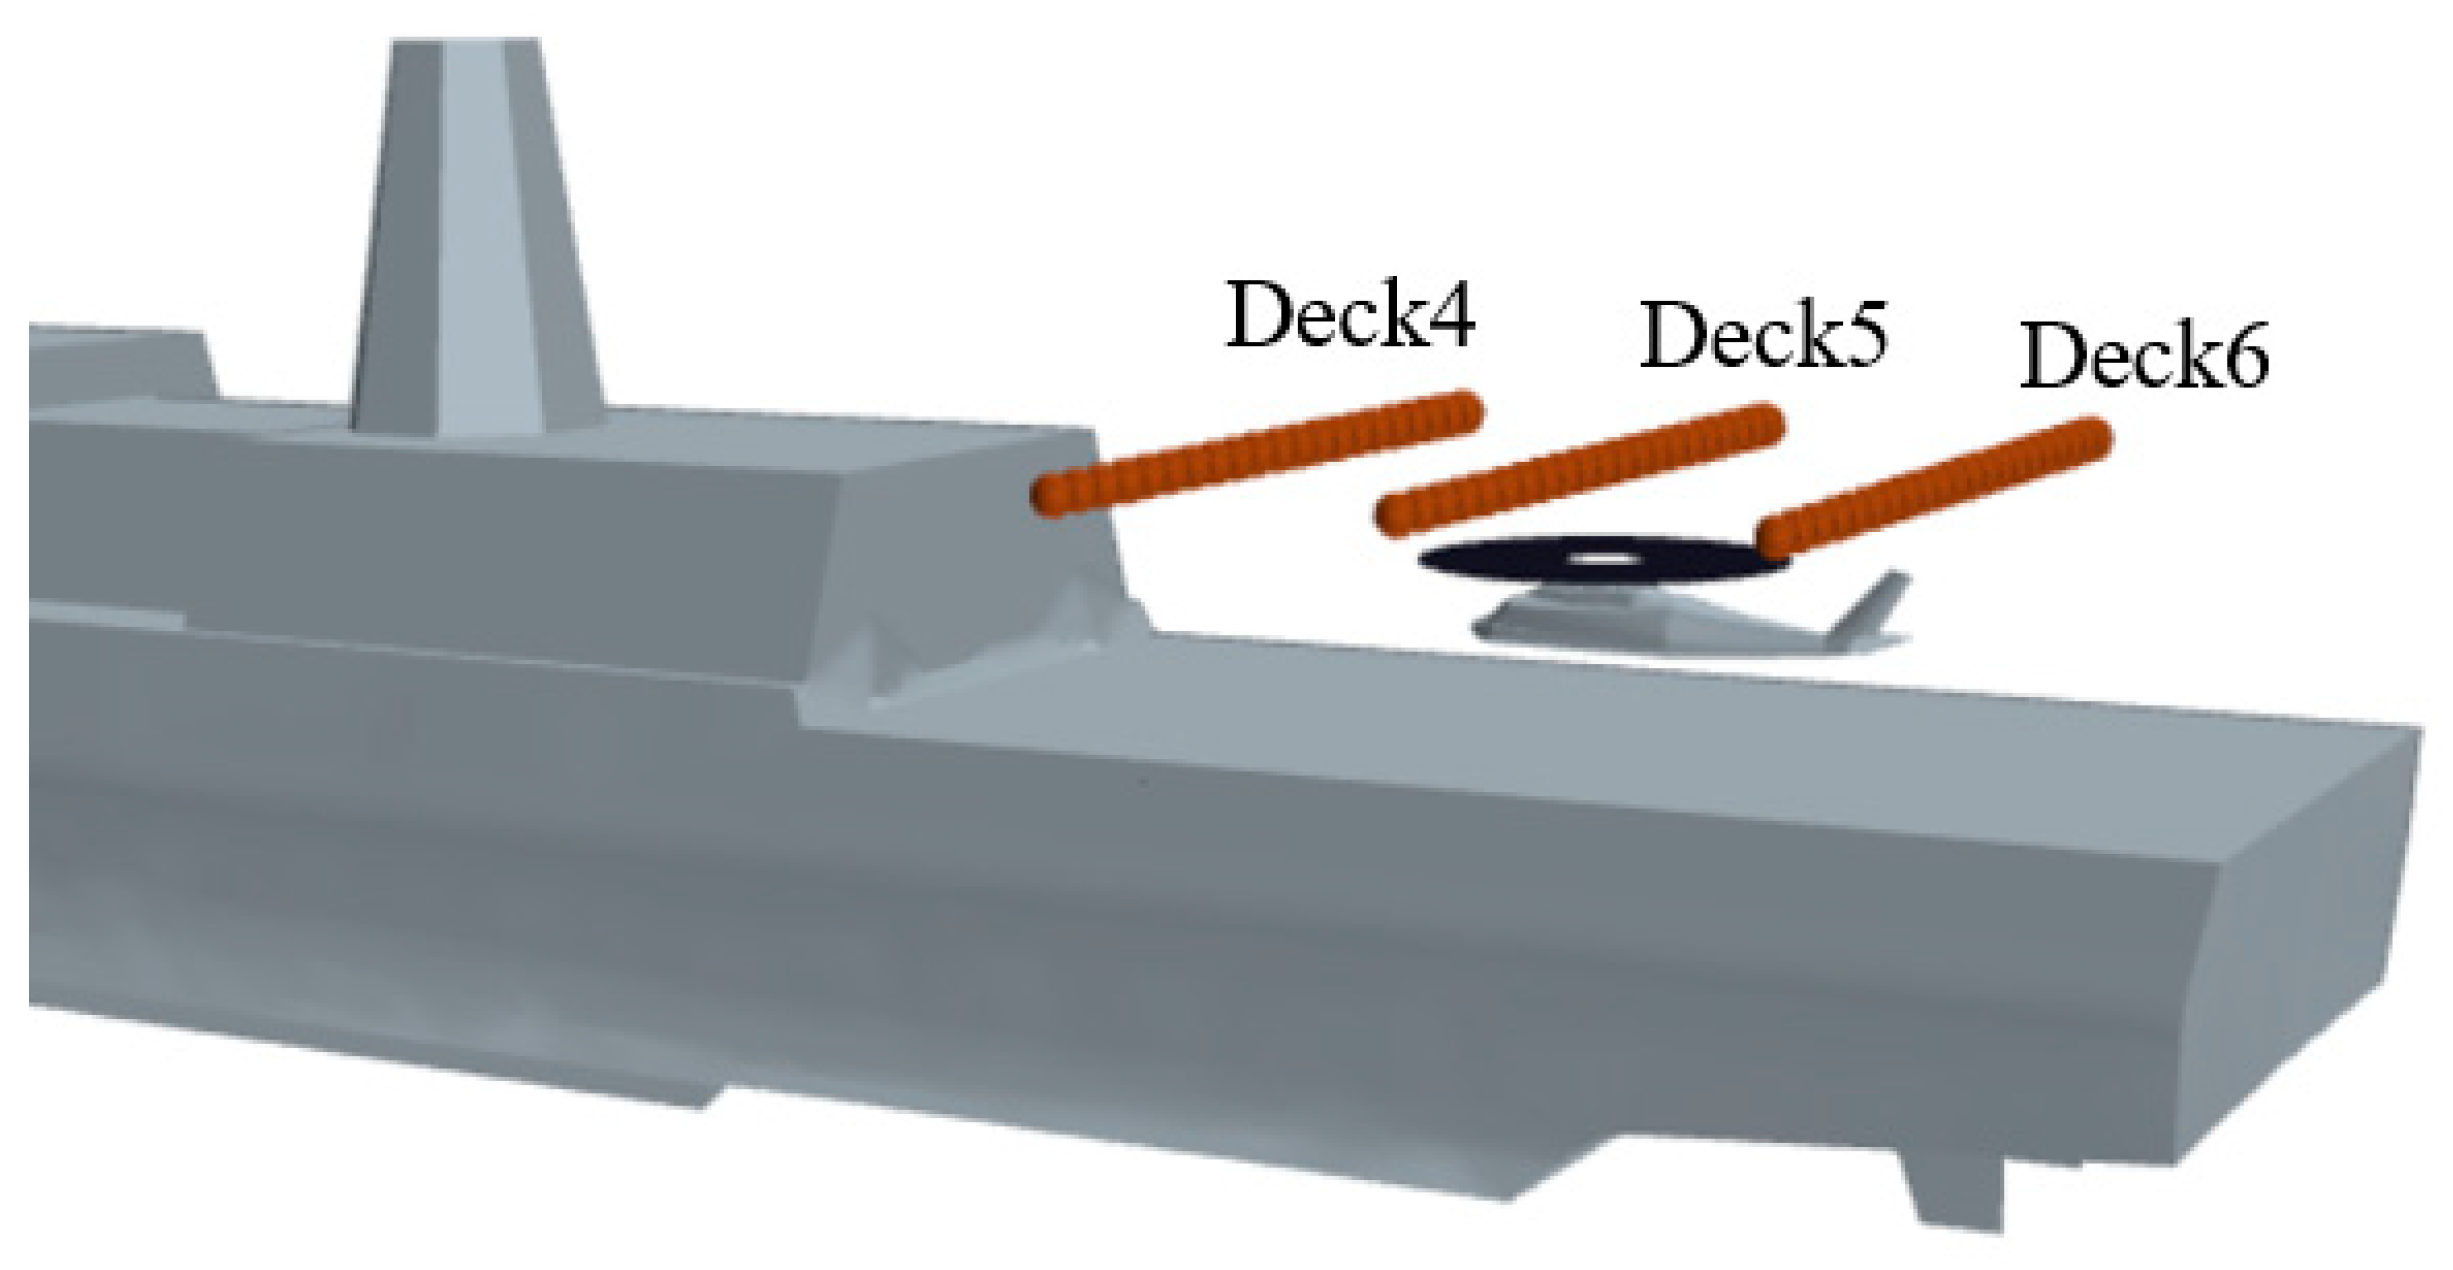
Three monitoring lines (Deck 4, Deck 5, and Deck 6) were selected within the mid-deck flow field, as shown in Figure 16.

3.2.2. Coupled Flow Field Analysis

The turbulence intensity (TI) was employed to characterize flow field structures in this study. TI can quantify flow instability and provide insights into flow-field characteristics. The turbulence intensity is defined as:
T I = σ U l o c a l
where σ represents the standard deviation of velocity during the sampling period, and U l o c a l denotes the time-averaged mean velocity.
Furthermore, the turbulence intensity characterizes the flow fluctuation characteristics within the flow field. During shipborne helicopter landings, the influence of ship motions on coupled flow fields directly impacts landing safety. Turbulence intensity calculations were performed across all three landing phases (P1, P2, P3) to analyze how ship motions affected the coupled flow fields during each stage. For the quantitative assessment, a turbulence intensity increment ΔX was defined as:
Δ X = T I M T I S T I S
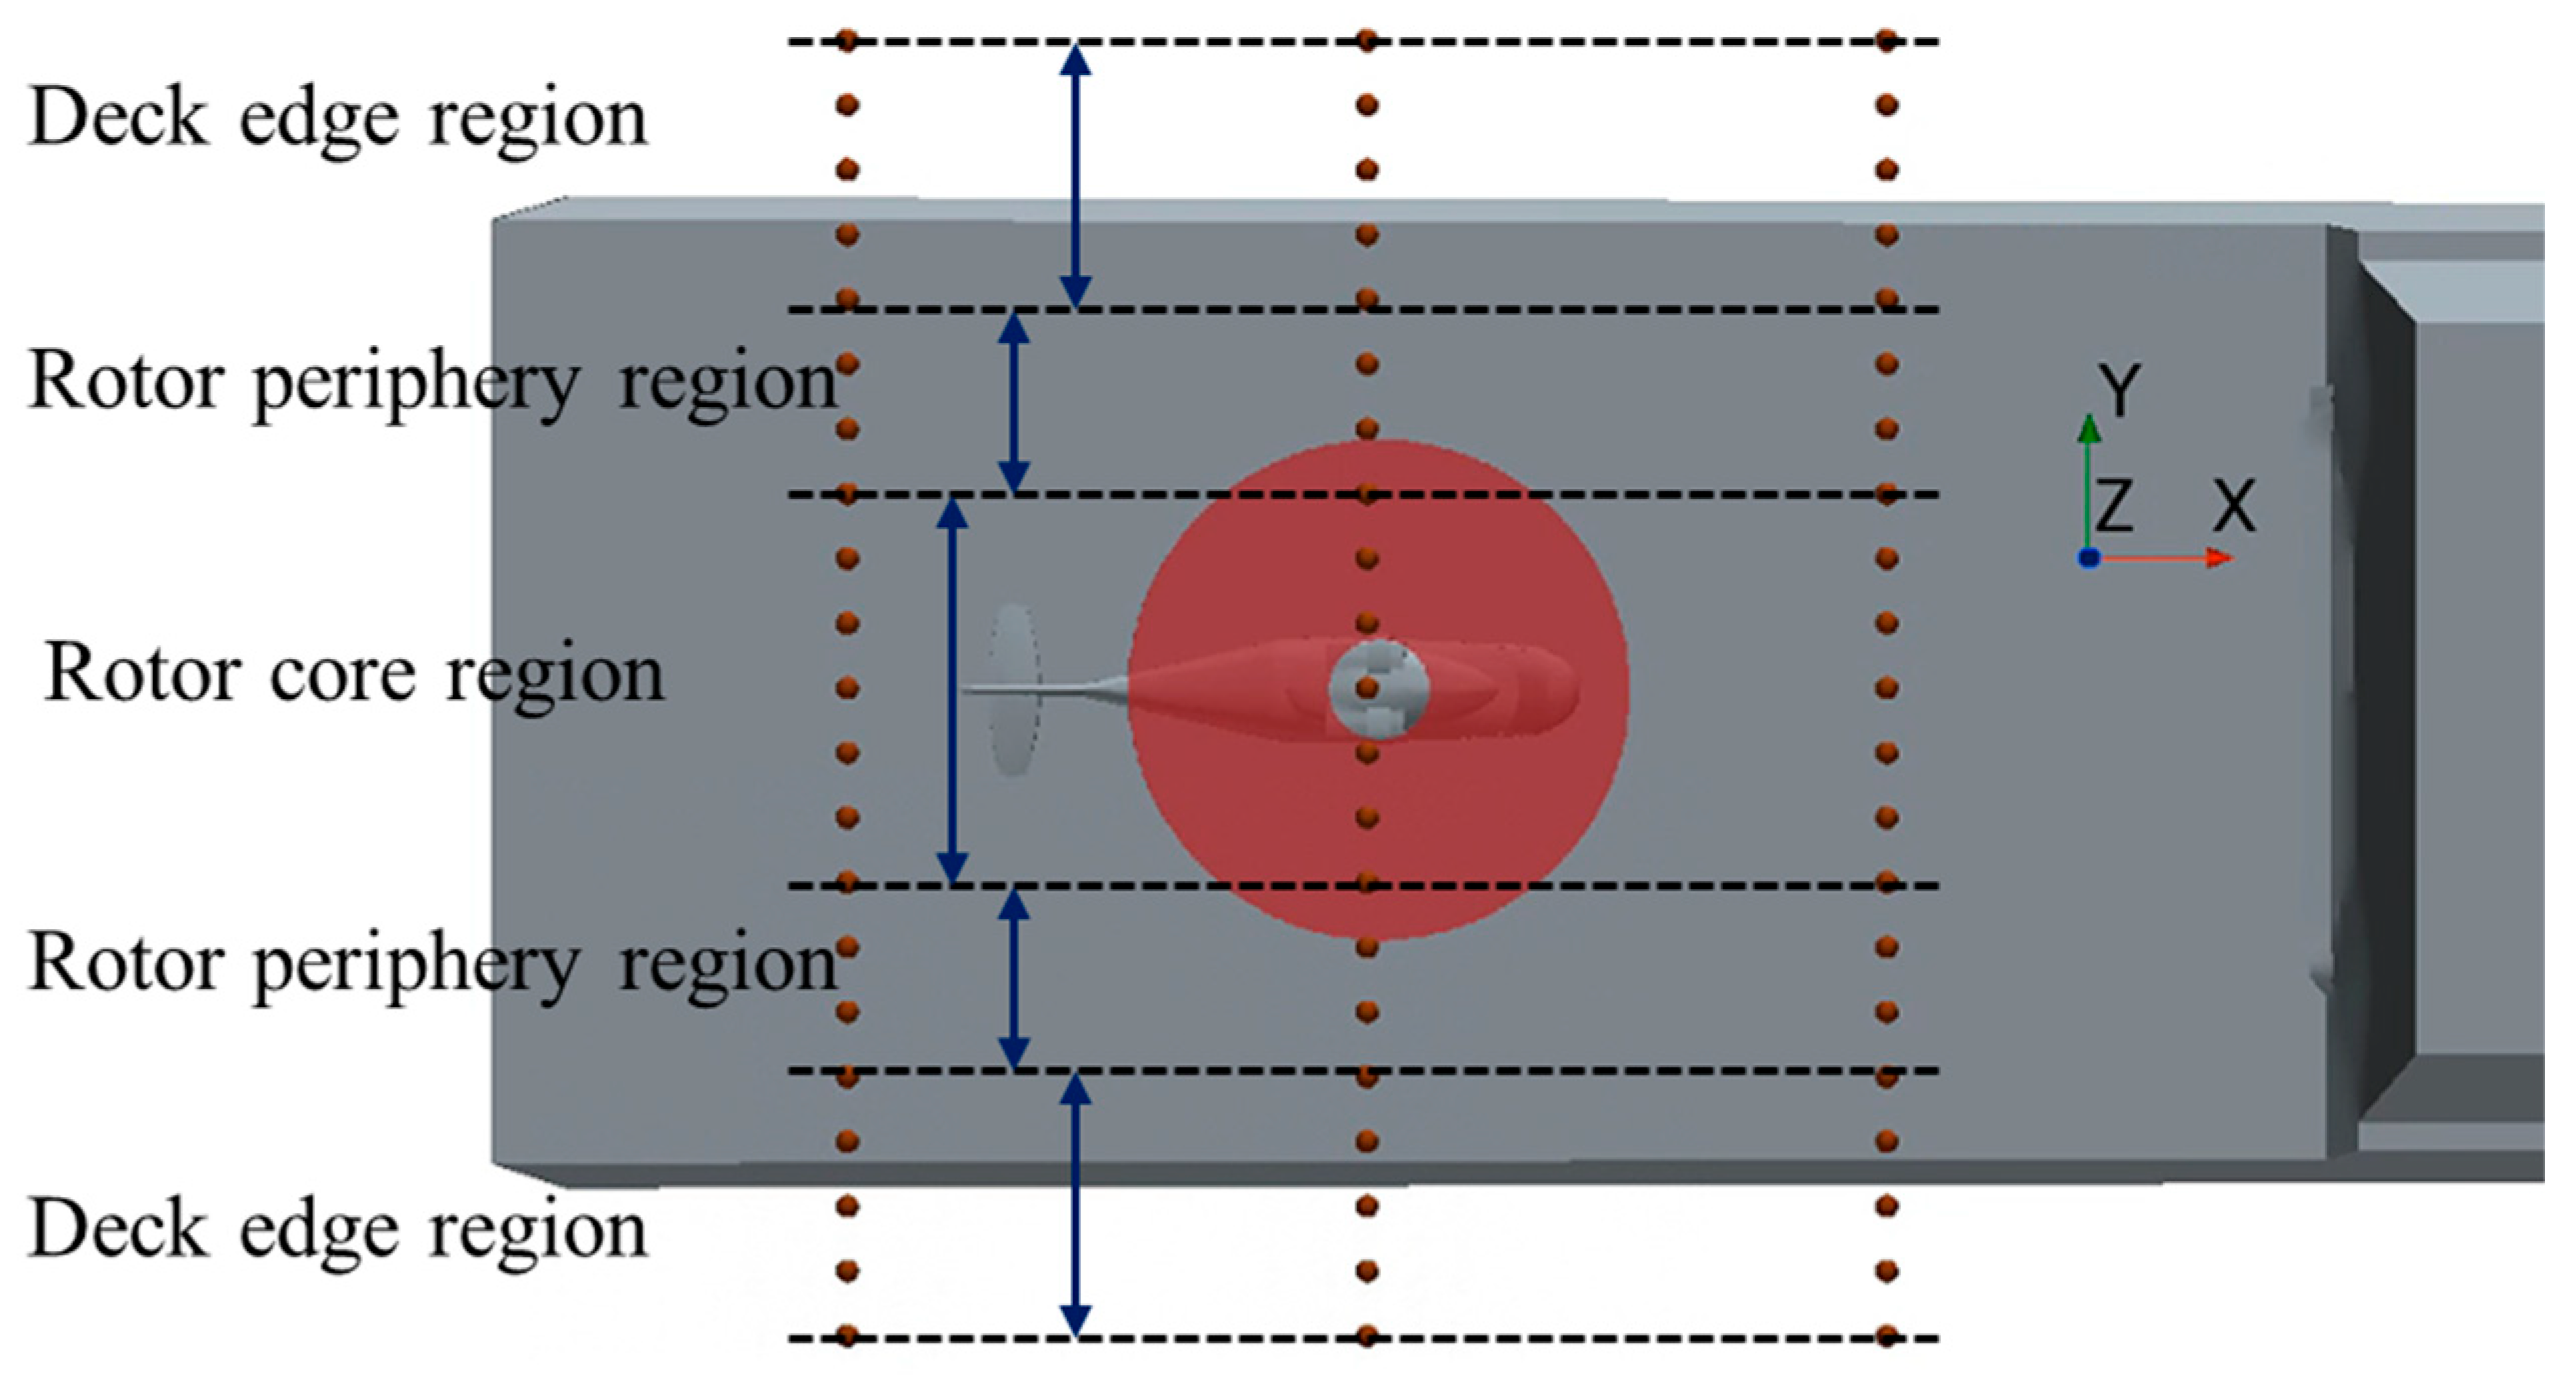
where T I M represents the turbulence intensity at a flow-field point during ship motion, and T I S represents the corresponding value under stationary ship conditions. The increment ΔX quantifies the impact of ship motion on flow instability. The larger the ΔX, the greater the impact of ship motion on turbulence intensity; conversely, the smaller the ΔX, the lesser the impact. For a systematic comparison, each monitoring line was divided into three regions (as shown in Figure 17): 150–250%R denoted the deck edge region (−1< y < −0.6 or 0.6 < y < 1), 70–150%R denoted the rotor periphery region (−0.6 < y < −0.3 or 0.3 < y < 0.6), and 0–70%R denoted the rotor core region (−0.3 < y < 0.3). The coordinate range of the three monitoring lines along the y-axis direction was −1 to 1, and R is the rotor radius. The turbulence intensity increment for each region was calculated by averaging the ΔX values across all monitoring points within that region.

3.2.3. Dynamic Load Analysis of Shipborne Helicopter

The simulations obtained load curves for two operational conditions, comprising rotor thrust (RZ), longitudinal force (RX), lateral force (RY), pitch moment (MX), roll moment (MY), torque (MZ), fuselage lift (HZ), fuselage drag (HX), and fuselage lateral force (HY). Forces and moments were non-dimensionalized using reference parameters ρ π R 2 ( Ω R ) 2 (for forces) and ρ π R 3 ( Ω R ) 2 (for moments).
Root-mean-square (RMS) loads, statistically derived, effectively quantify load instability. The RMS load is defined as the square root of the integral of the power spectral density curve over a finite bandwidth. In this study, power spectral densities were computed from time-domain force and moment measurements. Higher RMS values indicate greater load instability, while an RMS value of zero signifies steady-state loading [18]. The mathematical formulation is expressed as follows:
R M S = f 1 f 2 P S D
where RMS is the root-mean-square load, PSD is the power spectral density, and f1 and f2 are the frequency bandwidth.
For helicopter applications, the computational bandwidth in this study spanned 2–20 Hz. The dominant parameters influencing shipborne helicopter rotor loads are rotor thrust (RZ), roll moment (MX), and pitch moment (MY) [3]. Consequently, these three load components served as primary evaluation parameters in subsequent simulations.

4. Impact of SDOF Ship Motions on Coupled Flow Fields and Rotor Loads Under Sea State 5

Following the VV study of the proposed model, this study investigated how ship motions in individual degrees of freedom affected coupled flow fields and helicopter dynamics. In this section, the influence of distinct ship motion components on carrier-based helicopter landing safety is examined and quantitatively assessed through a comparative analysis of stationary and moving-ship scenarios. To improve computational efficiency and methodological clarity, the seakeeping response and rotor–ship interaction are decoupled during analysis. Time histories of ship motions extracted from seakeeping simulations serve as real-time input to dynamically control ship motions in coupled simulations. This methodology significantly improves computational efficiency while optimizing resource utilization.

4.1. Influence of Ship Roll Motion

4.1.1. Impact on Coupled Flow Fields

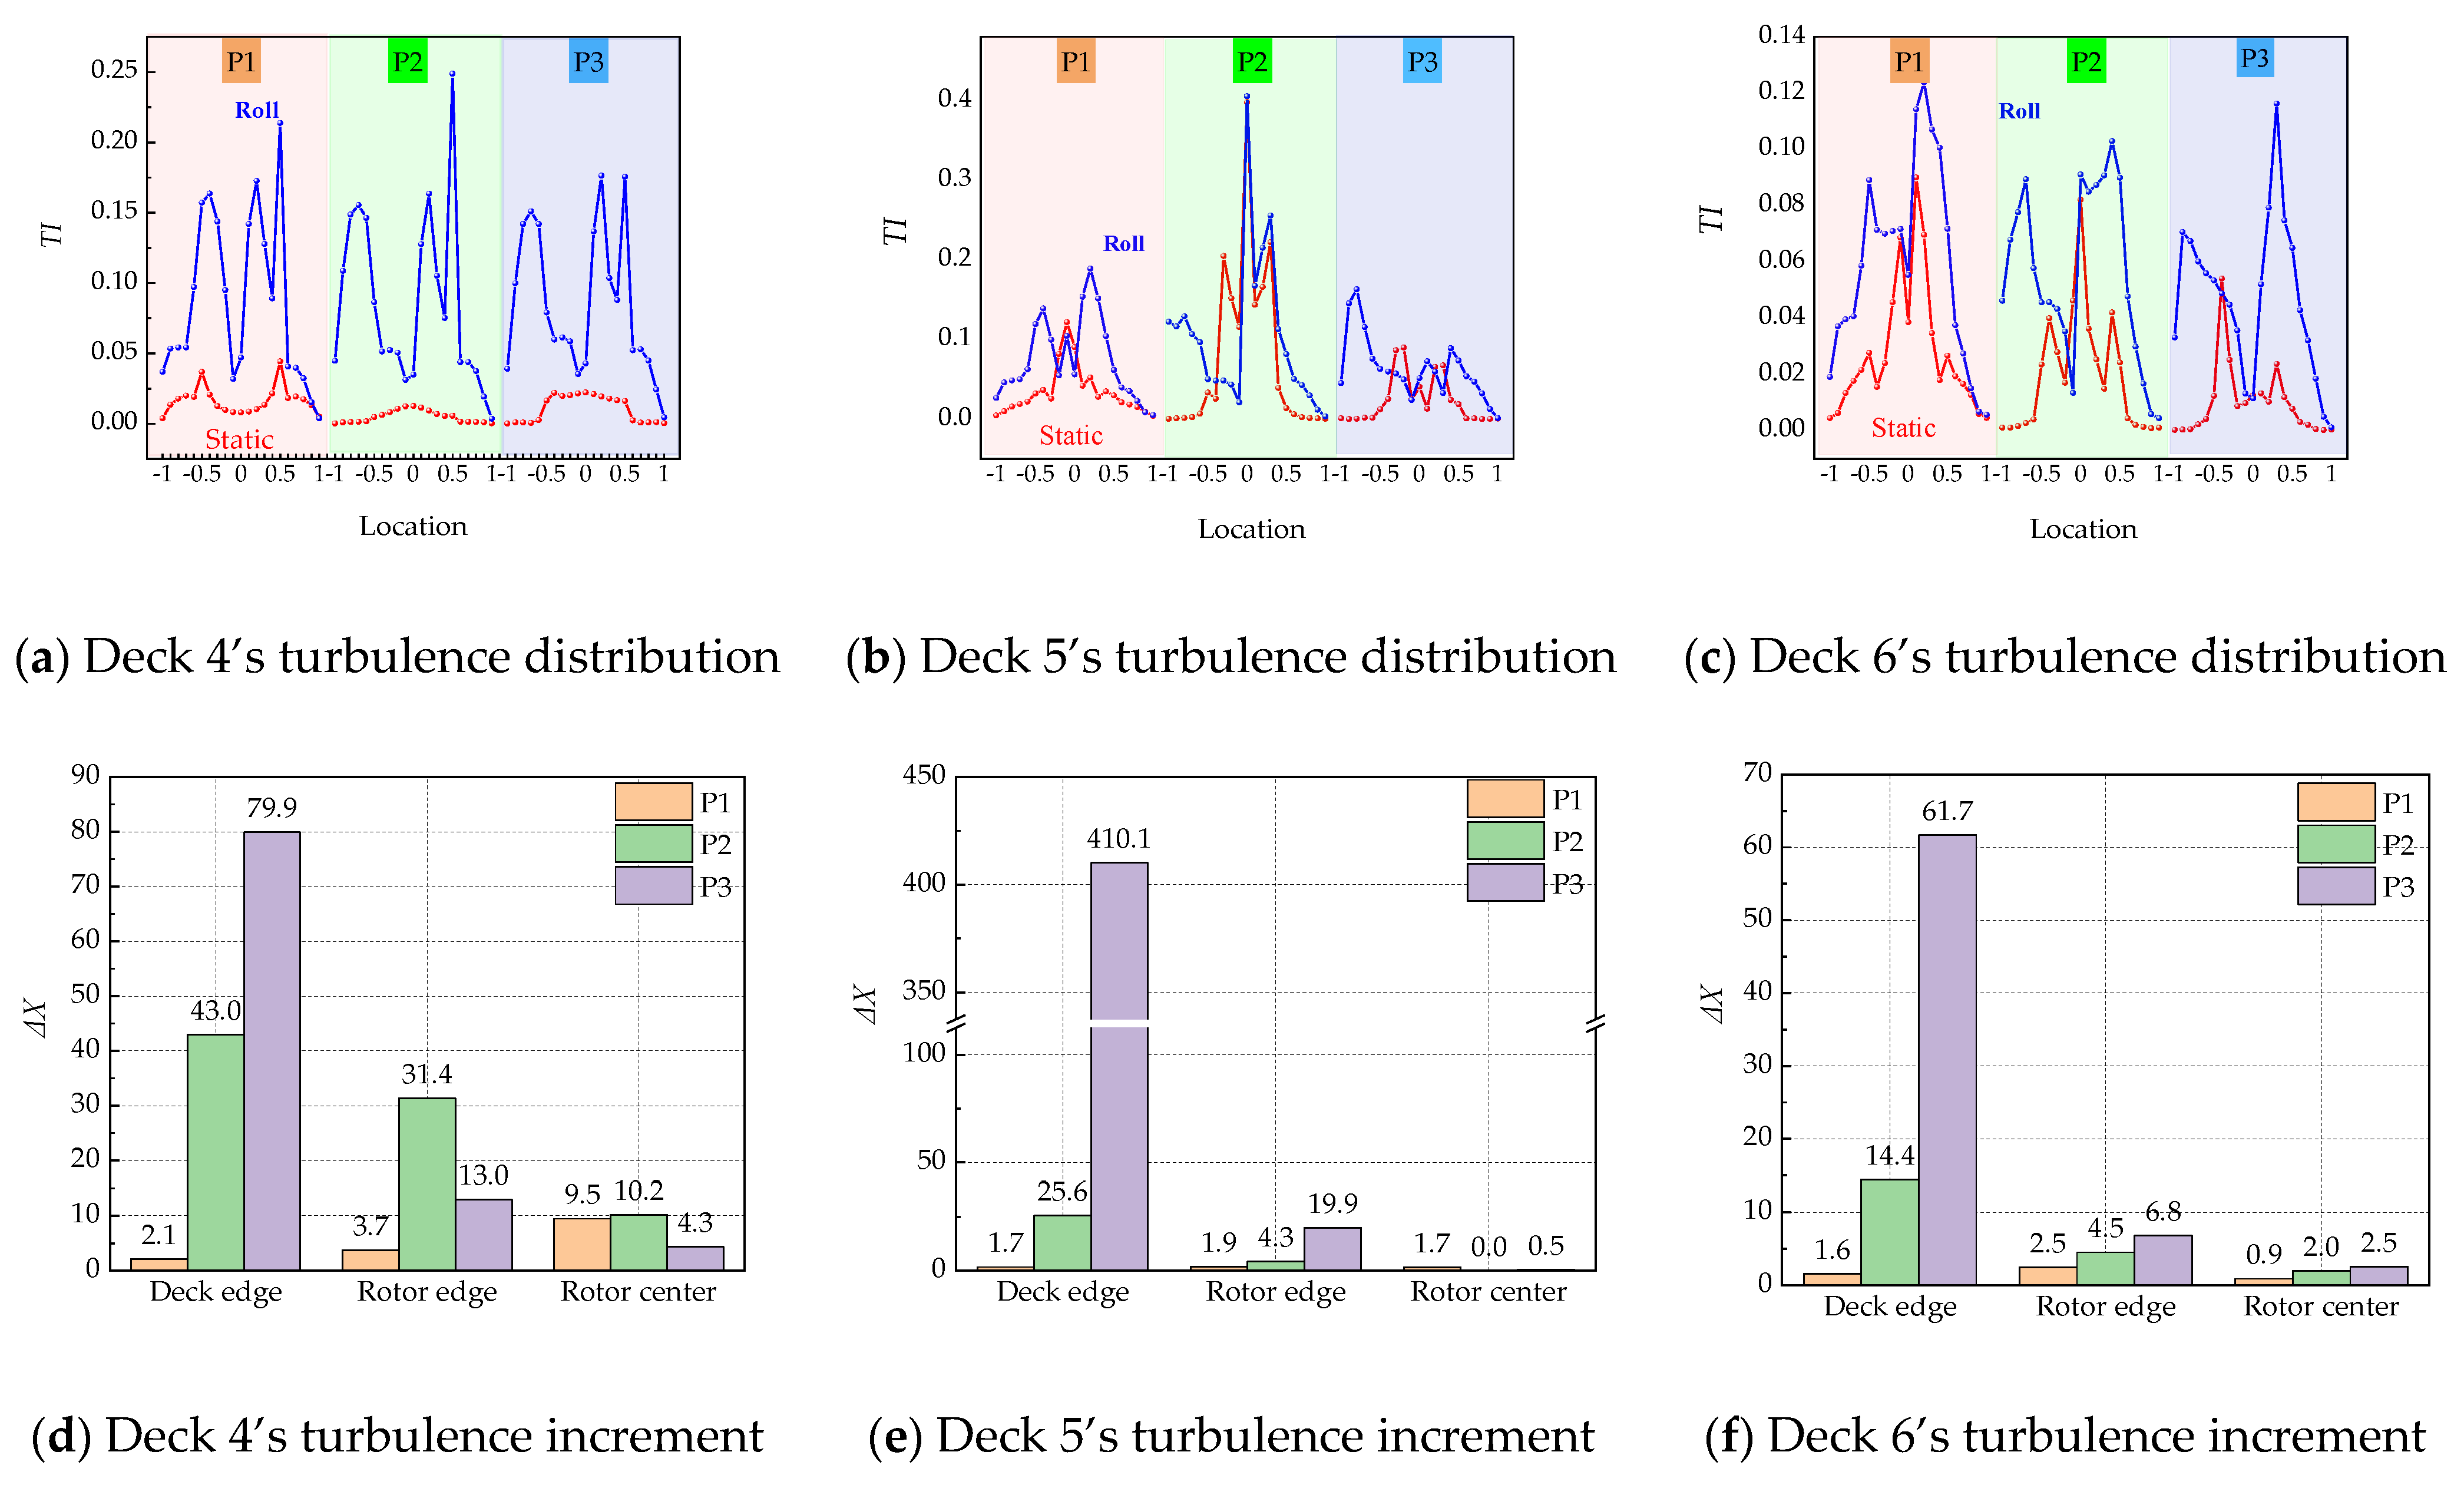
In this section, the ship motions are simulated using roll motion data over a 5.5 s simulation period corresponding to helicopter landing phases P1 to P3. Distributions of turbulence intensity under roll versus stationary conditions are compared and presented in Figure 18. As can be seen, roll motion significantly altered both the distribution pattern and magnitude of turbulence intensity compared to the stationary condition. All monitoring lines (Decks 4–6) exhibited significantly higher turbulence intensity under roll motion, indicating that roll motion exerted a greater influence on coupled flow fields than rotor-induced airflow. The turbulence intensity in Deck 4’s region, however, remained consistent across phases, suggesting that variations in helicopter-to-deck distance minimally affected this zone. This stability results from the limited roll amplitude, which enables interaction between the hangar wake and rotor downwash, forming a stable coupled flow region adjacent to Deck 4.
Turbulence intensity near Deck 5 increased moderately during P1 compared to stationary conditions, as the fuselage elevation above the deck allowed the rotor influence to dominate the flow field. Notably, differing from the stationary conditions, the turbulence curve under the roll condition exhibited a triple-peak characteristic. This is due to the intensified coupling between deck-edge vortices and rotor downwash, as shown in Figure 19. During P2, when the rotor traversed Deck 5, the peak turbulence values showed negligible variation between conditions, confirming the rotor dominance. Here, the ship motion impact was minimal. In P3, as the aircraft–deck distance decreased, the roll motion amplified the turbulence in Deck 5’s peripheral zones via vortex–downwash interactions. Although the rotor effects primarily governed Deck 5’s turbulence, roll motion redistributed intensity (especially in P3) and amplified the deck-edge turbulence during the final approach, consistent with Figure 1.
In the aft flow field near Deck 6, the roll motion markedly increased turbulence intensity across all phases compared to stationary conditions, indicating the ship motion’s dominance in influencing coupled flow in that region. Throughout the landing process under roll conditions, the turbulence distribution exhibited a distinct double-peak characteristic, with intensity in rotor periphery zones substantially exceeding other areas. This contrasted sharply with the single-peak characteristic observed under stationary conditions. Analysis of turbulence increments showed progressively intensifying roll motion effects across all Deck 6 regions during descent, most pronounced at deck edges.
Furthermore, the comparison of turbulence increments along Decks 4–6’s monitoring lines demonstrates that the maximum differences occurred at deck edges, with negligible changes in rotor core areas. This occurred since the maximum motion amplitude arose at deck edges during the ship’s roll motion—where motion exerts peak influence on turbulence—while the rotor core experienced minimal movement, comparable to stationary conditions. Consequently, the turbulence increments in the core region remained consistent across all three phases. The largest turbulence intensity increase along the monitoring line consistently occurred during P3, attributed to peak rotor–ship interaction when the rotor is closest to the deck.

4.1.2. Impact of Roll Motion on Helicopter Dynamic Loads

Rotor dynamic loads were analyzed using a root-mean-square (RMS) methodology. RMS values of thrust (RZ), roll moment (MX), and pitch moment (MY) were evaluated across the landing phases P1, P2, and P3. To quantify roll motion effects, RMS loads under rolling ship conditions were compared against stationary baselines, as shown in Figure 20.
Regarding the roll moment (MX), roll motion increased RMS loads across all phases—most notably a 270.8% surge during P2. This indicates drastic variations in rotor pitch moments near the hangar height compared to stationary conditions. Despite this amplification, MX RMS loads exhibited an overall decreasing trend during descent, peaking in P1.
For the pitch moment (MY), RMS loads showed a generally increasing progression. Although slightly decreasing in P3, the values remained higher than those of MX. Additionally, MY RMS curves largely coincided between roll and stationary conditions. Figure 20b reveals minimal roll motion effect on MY instability, with a maximum 5% increase occurring in P1.
For the rotor thrust (RZ), the RMS loads under roll conditions showed an initial rise followed by a decline across landing phases. From P1 to P2, progressive landing enhanced rotor–wake coupling and elevated ambient turbulence, amplifying RZ RMS loads. Crucially, roll motion accelerated this increase. During P1, roll motion reduced RZ loads—likely due to the disrupted formation of stable coupled flow fields, characteristic of stationary conditions, thereby diminishing thrust instability. In P2 and P3, roll progressively intensified RZ instability during descent, with magnitude escalating at lower altitudes, culminating in a 32.81% increase by P3. Since RZ governs collective pitch control, pilots must exercise heightened vigilance over collective pitch adjustments during deck approach.
Synthesizing these results, roll motion impacts RMS loads hierarchically: MX > RZ > MY. This indicates that during roll motion, pilots should prioritize mastering collective pitch (RZ-driven) and longitudinal cyclic pitch (MX-driven) adjustment, while lateral cyclic pitch (MY-driven) modifications remain comparable to stationary operations.

4.2. Influence of Ship Pitching Motion

4.2.1. Effect of Pitching Motion on the Coupled Flow Field

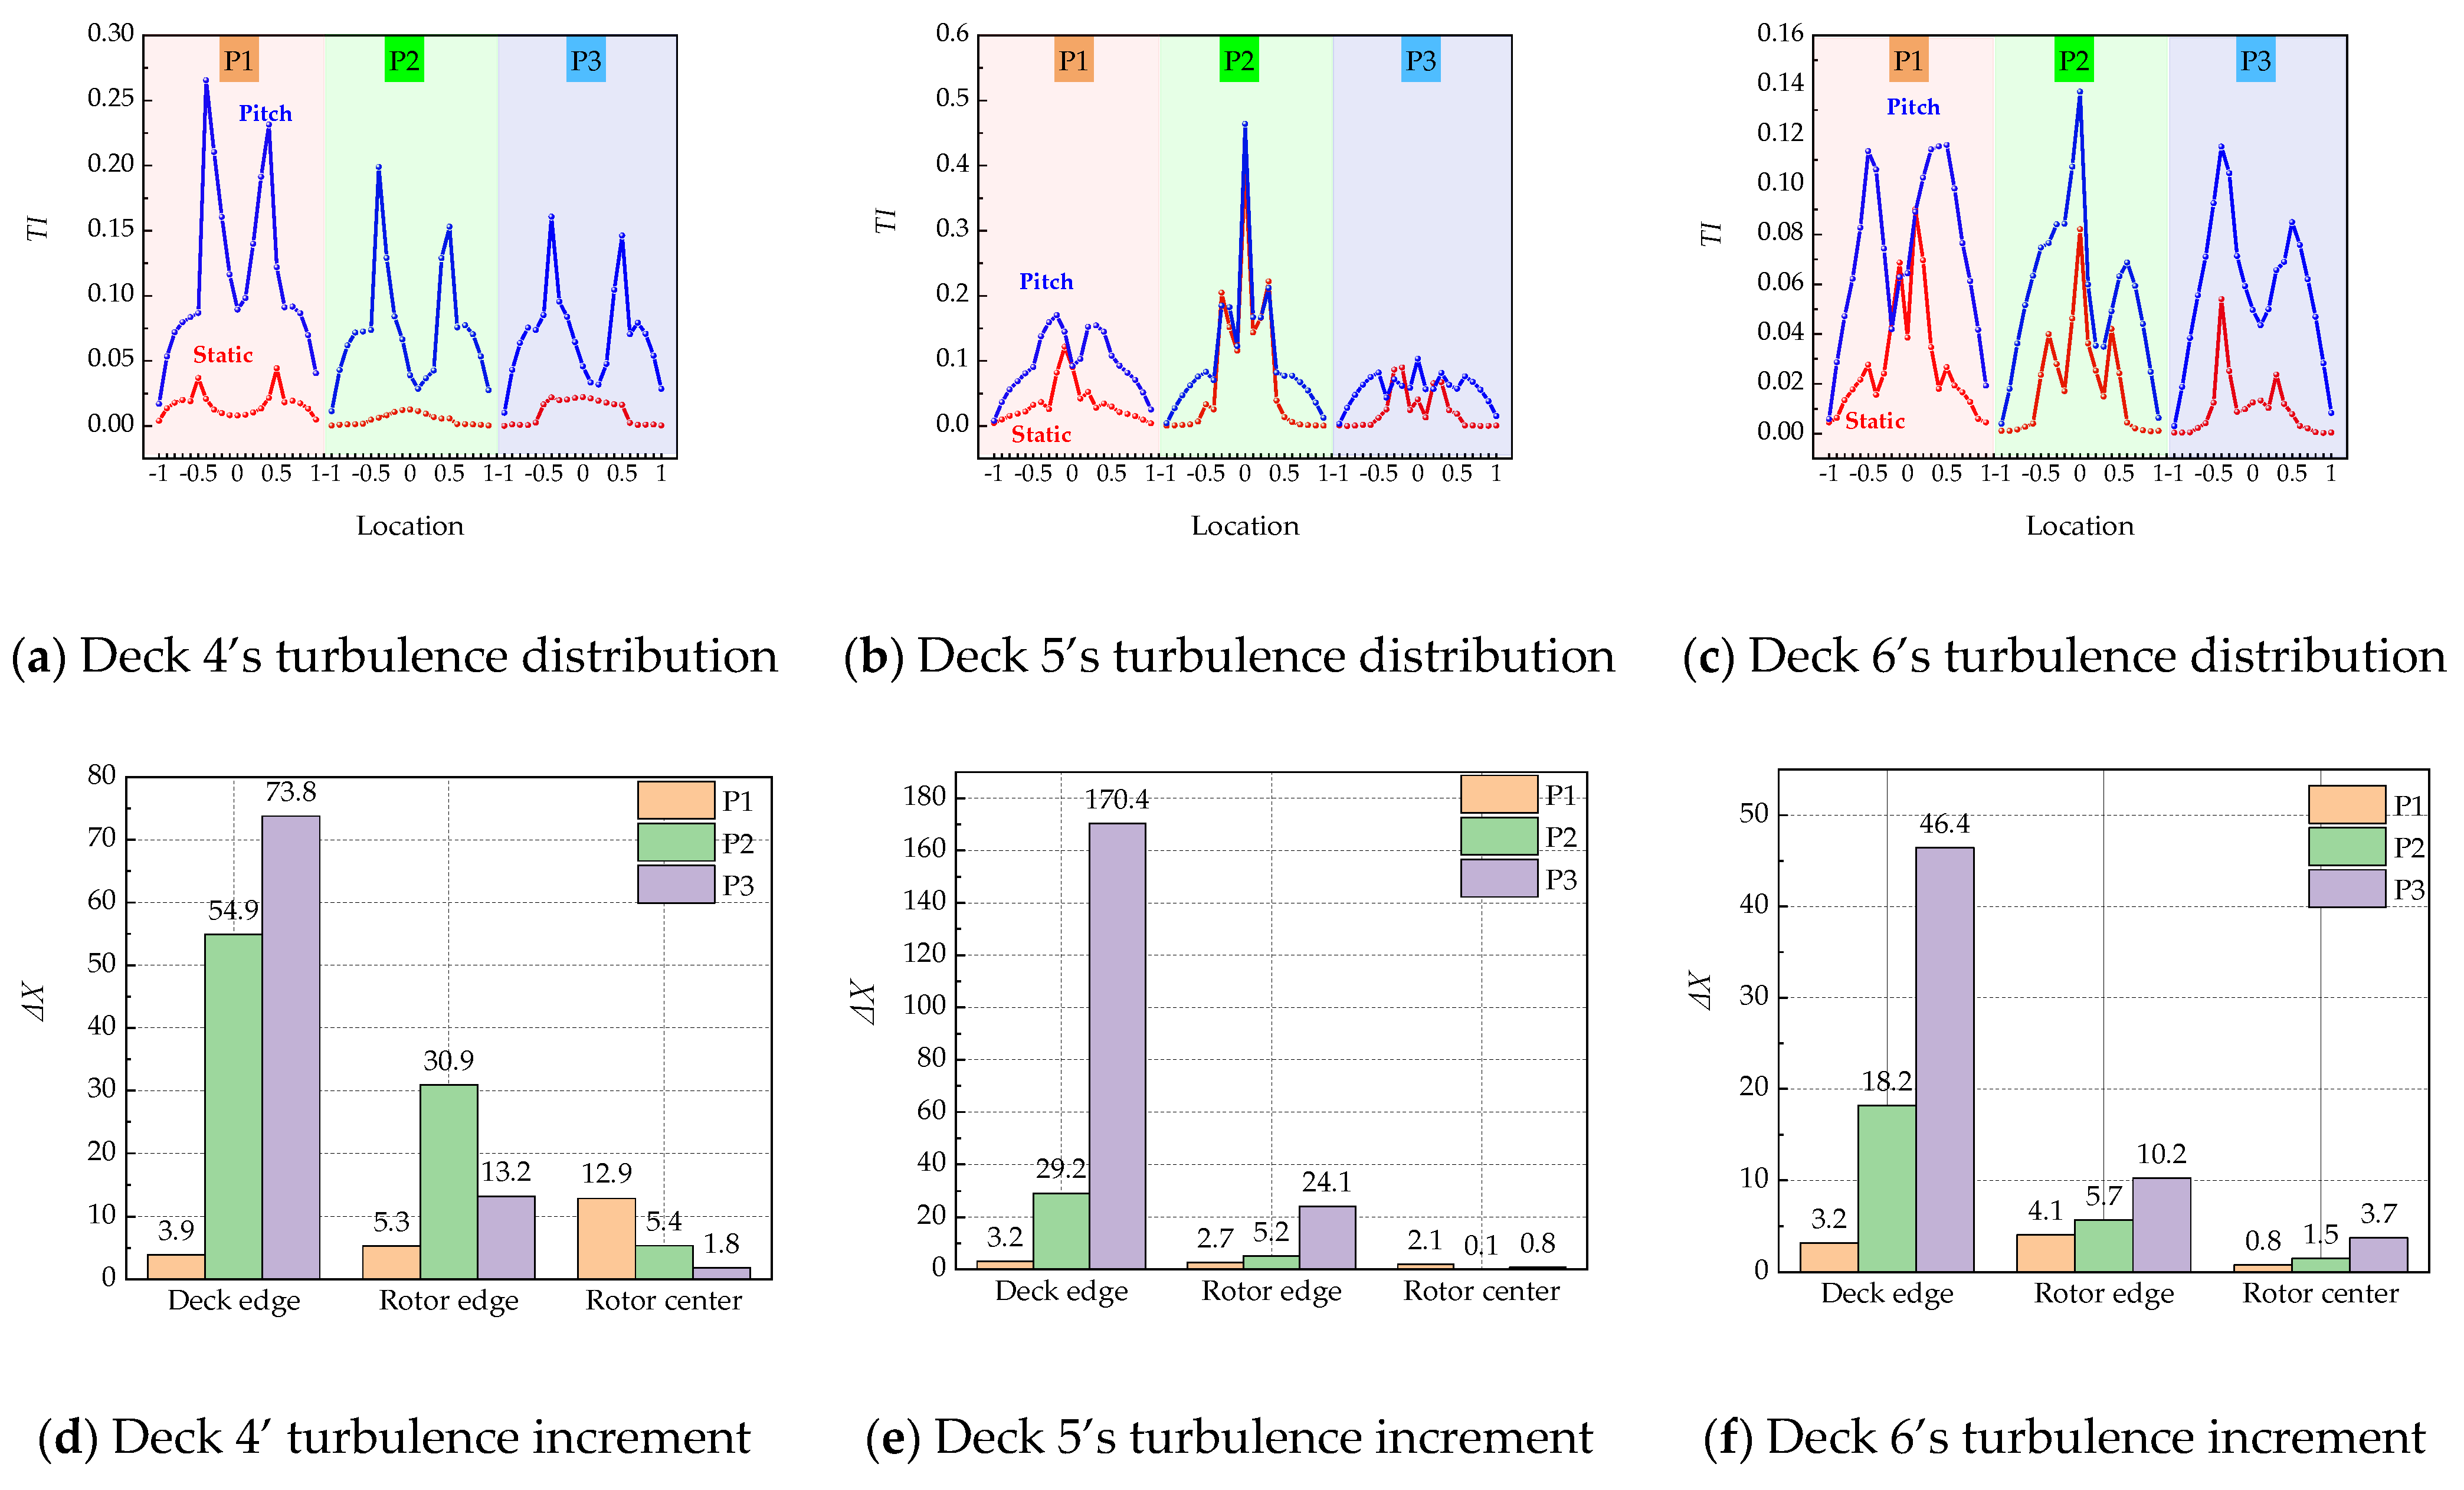
In this section, the simulation setup remained consistent with that of the previous study. Ship pitch motion was prescribed using recorded time histories. Turbulence levels under pitch and stationary conditions are shown in Figure 21. At Deck 4, the turbulence levels across all phases significantly exceeded stationary conditions, demonstrating pitch motion’s substantial influence on Deck 4’s coupled flow field. The stationary condition exhibited a double-peak characteristic only during P1, whereas the pitch condition maintained this pattern consistently across phases, with peak values consistently near rotor tip regions due to rotor-tip vortex–deck-edge vortex coupling. Turbulence amplitude decreased during descent because rotor-downwash/aft-hangar backflow coupling peaked during P1. In P2, as rotor height dropped below Deck 4, the downwash/aft-hangar wake coupling influence diminished, reducing turbulence. This further decreased in P3, confirming that rotor flow affected turbulence magnitude without altering its overall distribution trend on Deck 4.
Regarding turbulence increment, pitch motion’s influence within the coupled flow field intensified significantly throughout landing. During this process, pitch motion exerted its strongest effect on the deck edge zone, yielding a turbulence increment of 54.9, with progressively diminishing effects toward the rotor tip and center regions. By Phase P3, this increment had further increased compared to the stationary conditions. Pitch motion’s influence hierarchy across Deck 4 regions remained consistent: deck edge > rotor tip > rotor center. At the deck edge, the closer proximity of the helicopter intensified downwash impact on the deck, resulting in Deck 4’s edge’s largest turbulence increment (73.8). In the rotor tip region, the increment decreased relative to P2 due to rotor suction effects and downward shift of intense turbulent zones during descent. For Deck 4’s rotor center, the pitch motion’s influence was negligible. Overall, pitch motion considerably impacted Deck 4’s edge zone, peaked in the rotor tip zone during P2, and had minimal effect on the rotor center.
For the mid-flow field near Deck 5, the turbulence levels showed no significant difference between pitch and stationary conditions. This indicates that the rotor flow primarily governed the coupled flow-field turbulence in that region. In P1, the rotor downwash coupled with the ship deck vortex, causing the turbulence level to exhibit a distinct double-peak characteristic at rotor tip positions. In P2, the turbulence distribution was similar for both conditions. The turbulence levels peaked in the rotor center region as the rotor crossed Deck 5’s line, significantly affecting that zone. However, the peak turbulence level under the pitch condition exceeded the stationary condition, and the deck-edge turbulence was consistently higher under the pitch condition. This stemmed from repeated approach/retreat of the deck relative to the helicopter rotor during pitch motion, increasing the turbulence at the deck edge. In P3, with the rotor moving away from Deck 5, the overall turbulence levels were low.
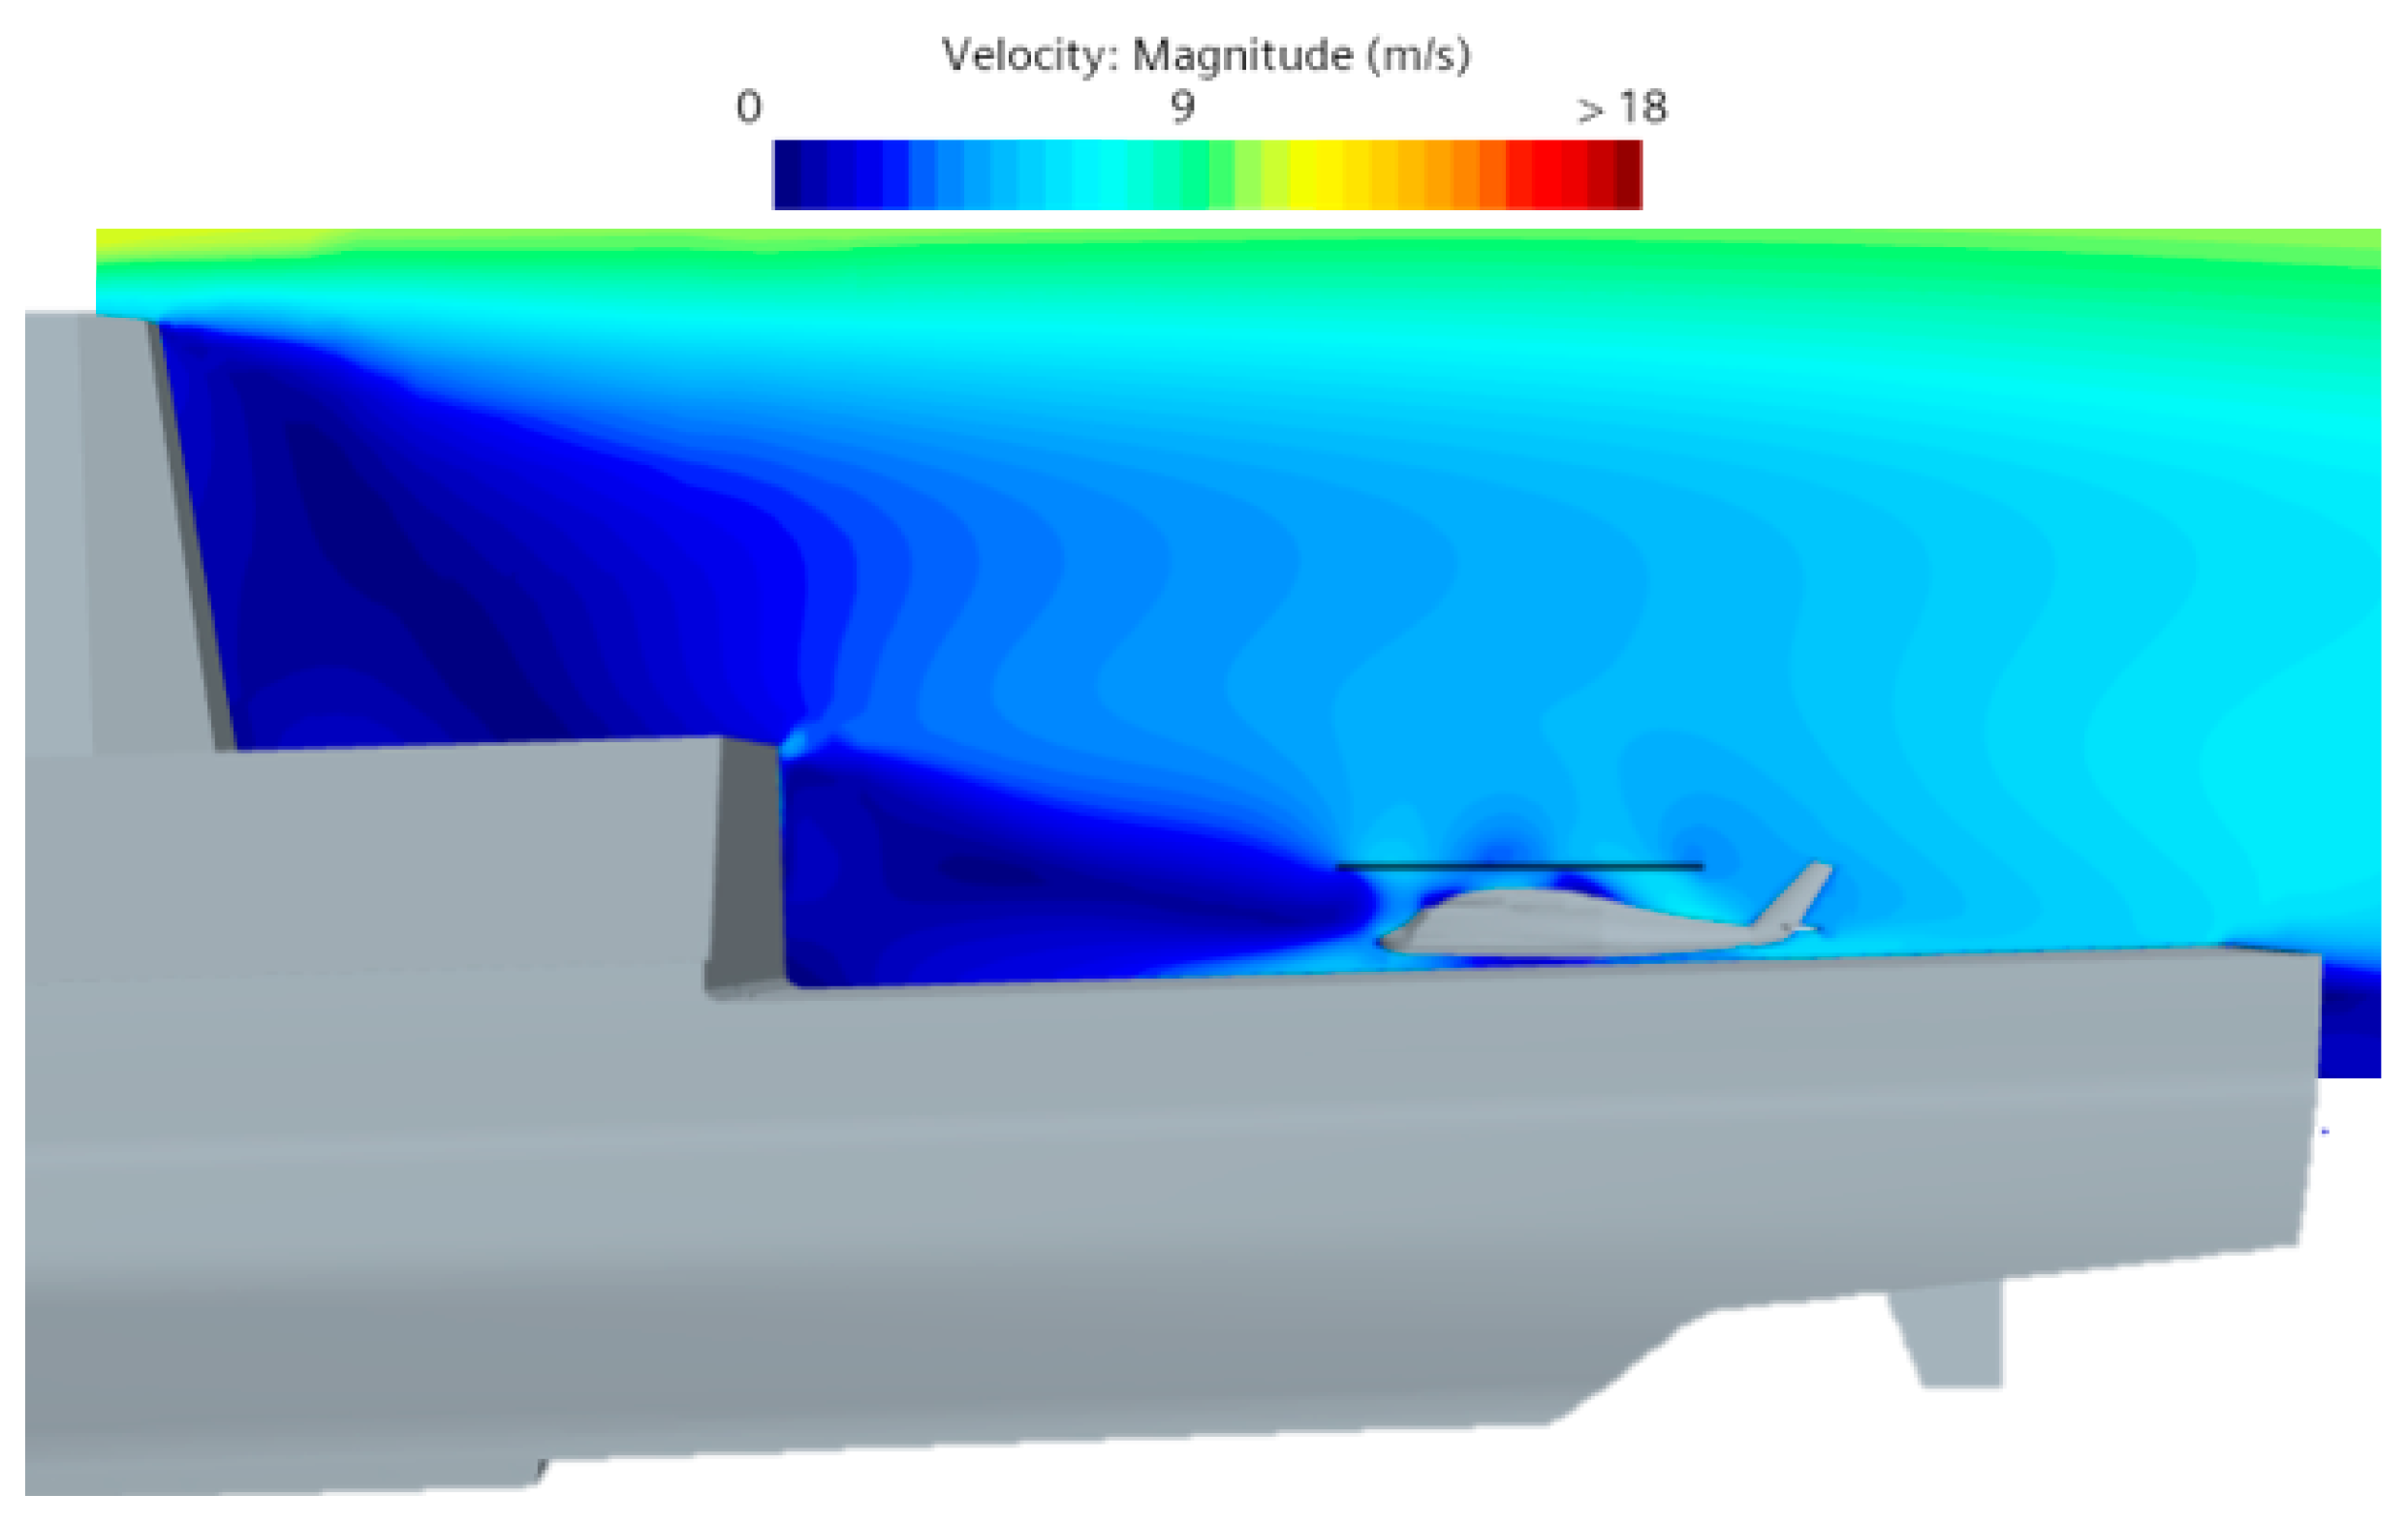
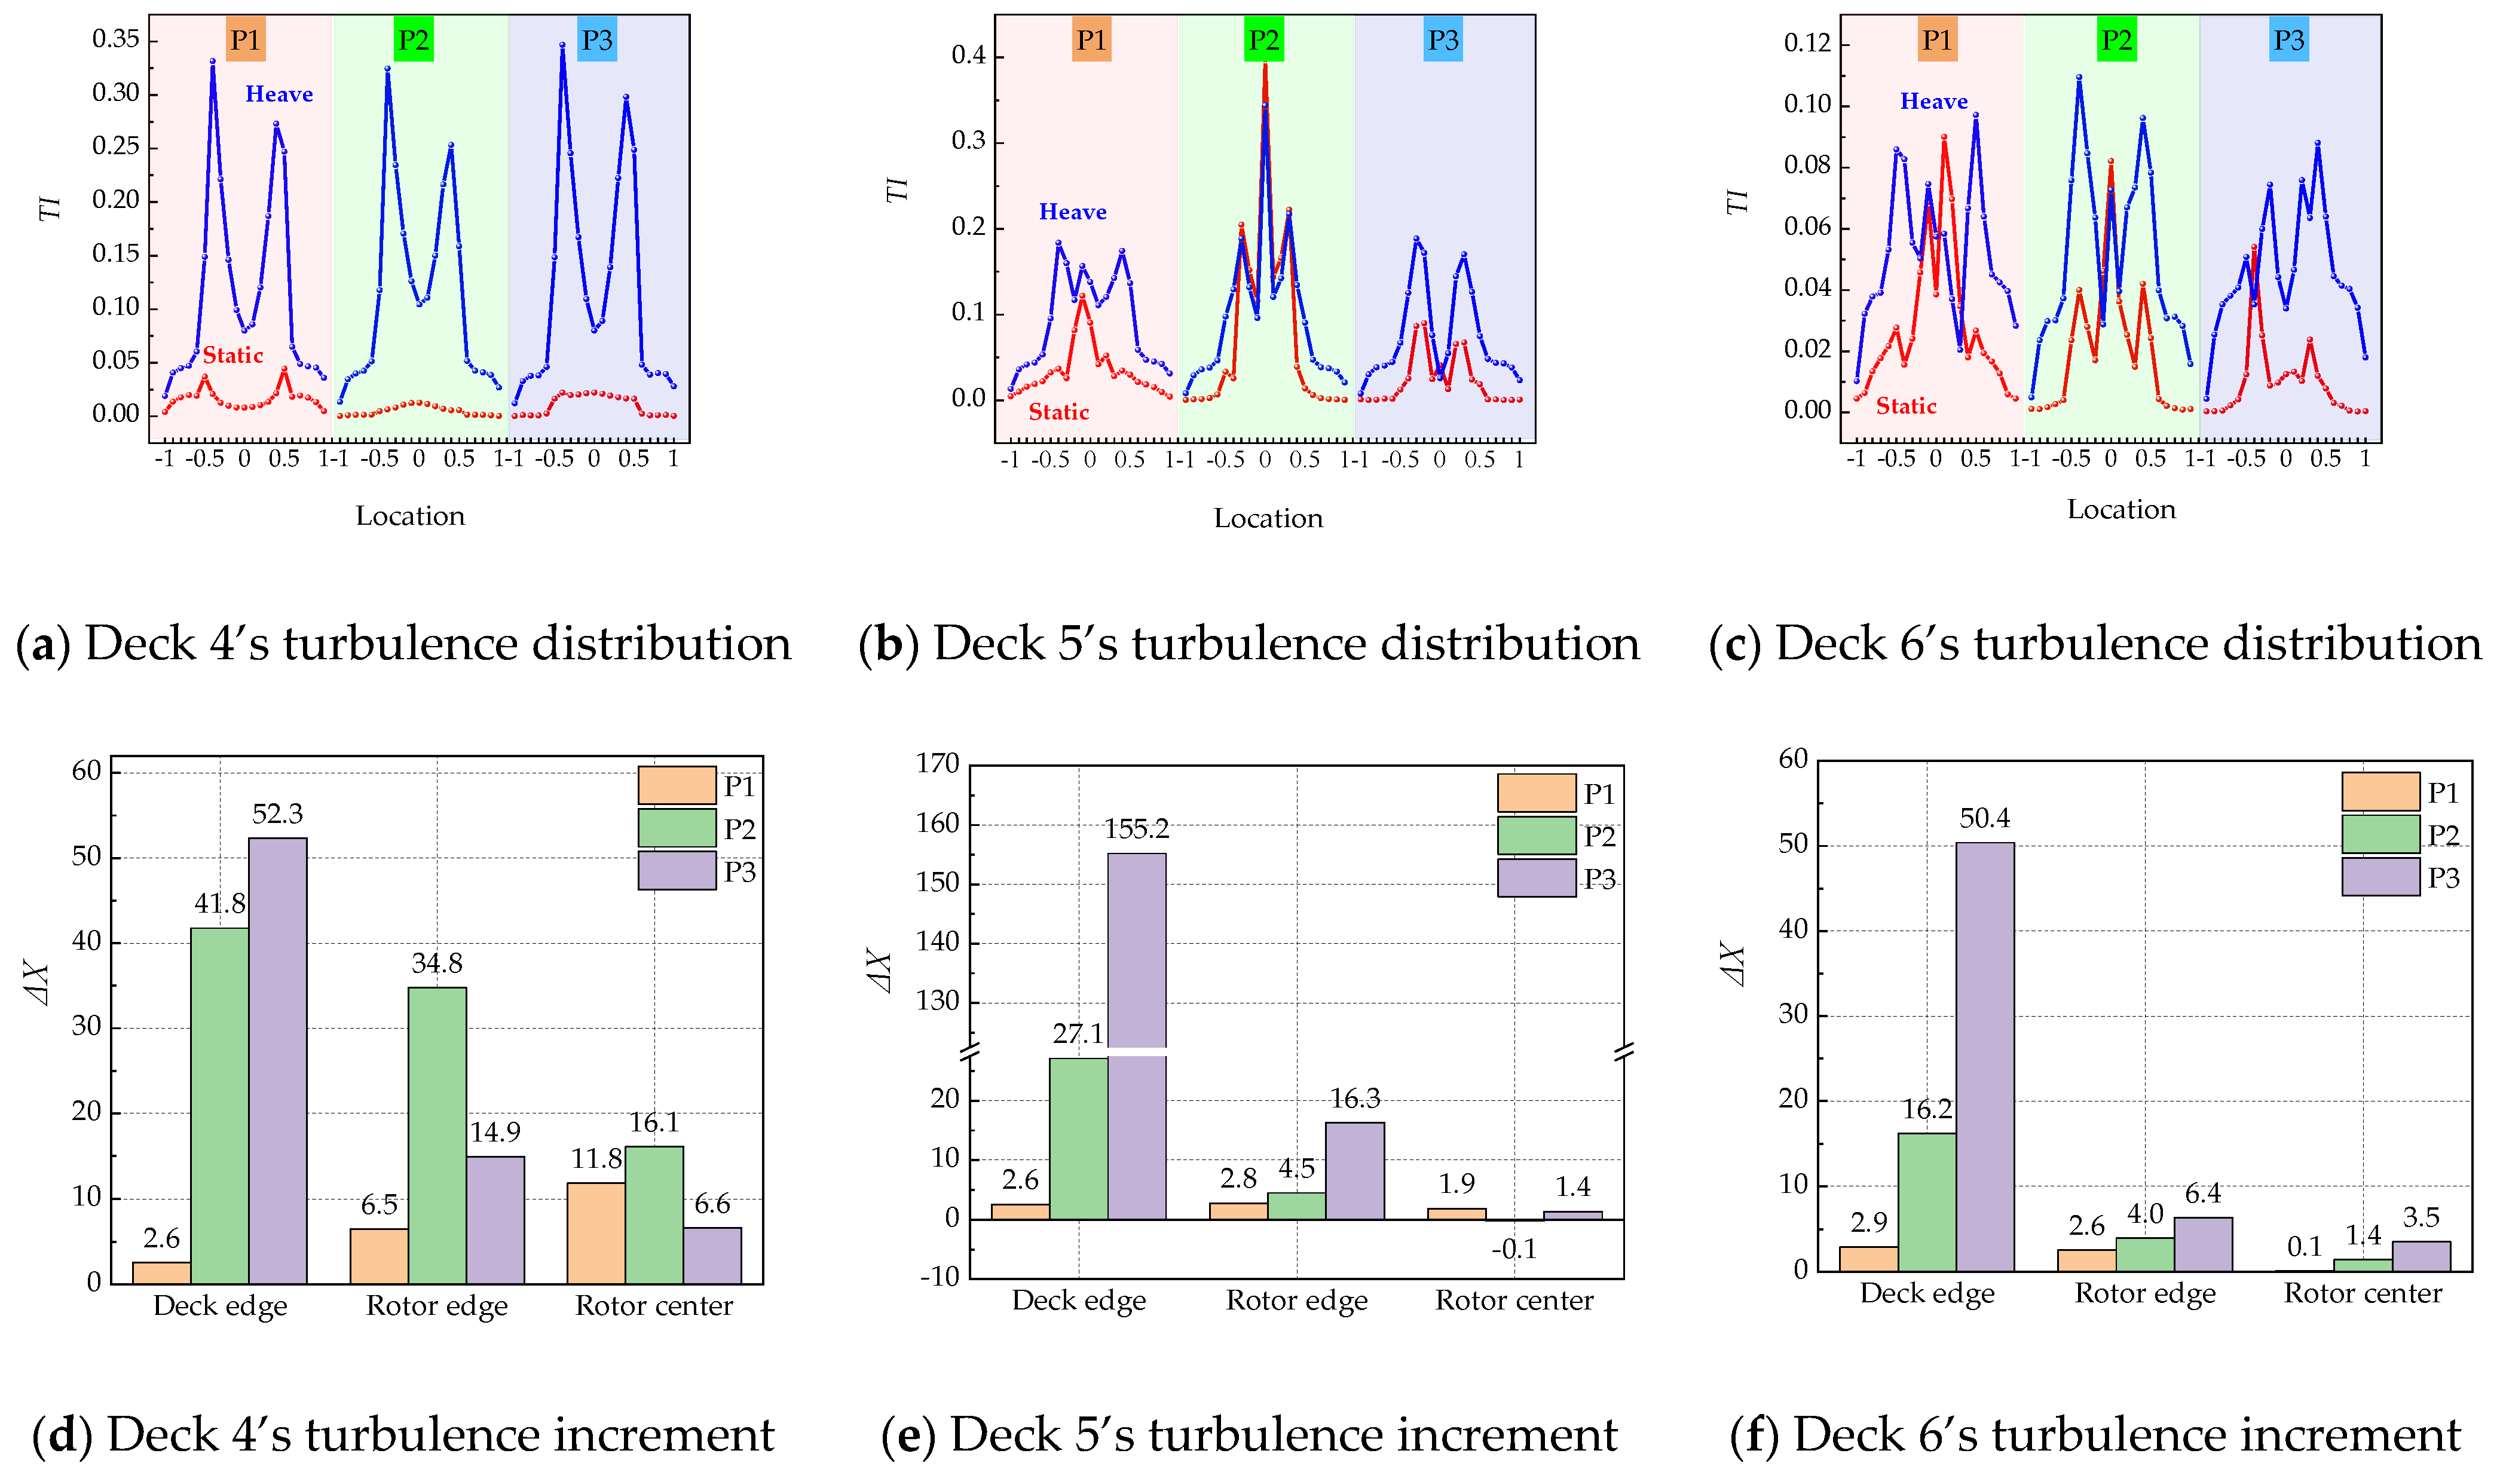
According to the turbulence increment diagram (Figure 21e), despite a notable increase in peak turbulence at the rotor center during P2 under pitch motion, its regional effect was limited, with the deck-edge increment at only 29. The pitch motion’s influence on the deck edge zone in P3 was substantial; the turbulence increment reached 170 under pitch condition, moderately affecting the rotor tip region (increment = 24.1). At Deck 5, the influence of pitch on the deck edge intensified progressively during landing, as shown in Figure 22. It significantly increased the rotor tip turbulence during P3 at extreme deck proximity, while negligibly affecting the rotor center region.
In Deck 6’s line, the influence of the pitch motion on the turbulence level became significant again. In Phase P1, the peak turbulence levels of the pitched ship were all located at the rotor tips, exhibiting a “double-peak” pattern, while the peak turbulence level of the stationary ship condition in P1 was located in the rotor center region. The reason for this difference is that the pitch motion caused the deck to continuously approach or retreat from the helicopter, intensifying the coupling between the deck vortex and the helicopter’s downwash flow; consequently, the turbulence level in the regions on both sides of the rotor increased abruptly. In P2, the turbulence level at the rotor center point of Deck 6 reached its peak value, and compared to the stationary ship condition, this peak value increased noticeably. The turbulence increment results showed that the influence of the pitch motion on the entire flow field region was significant; the degree of influence, from largest to smallest, was the deck edge, rotor tip, and rotor center. In P3, this trend further strengthened, with the deck-edge turbulence increment reaching 46.4. Simultaneously, the “double-peak” distribution of the turbulence level under the pitched ship condition became more pronounced, and the turbulence level significantly increased across the entire rotor tip region. To summarize, in Phase P1, pitch motion primarily affected the turbulence distribution near the edge of Deck 6, with its impact intensifying during landing, while the influence on other regions remained limited.

4.2.2. Influence of Pitch Motion on Shipborne Helicopter Dynamic Loads

Rotor loads under stationary and pitching conditions were predicted to evaluate RMS values and their increments, as shown in Figure 23. For the MX, the RMS loads of the pitch condition were overall more stable and smaller in value, indicating that the distribution of the rolling moment across phases was relatively stable during the pitch condition, with the RMS load even showing no change in Phases P2 and P3. In terms of increment, the pitch reduced MX in both Phases P1 and P3, increasing it only by 18.2% in Phase P2. This indicates that during the landing phase under the pitch condition, the overall instability of the rolling moment was greatly weakened, and the adjustment load for the longitudinal cyclic pitch was significantly reduced.
For the RMS load of MY, compared to the stationary ship condition, the RMS load of MY changed considerably. In Phases P1 and P2, the RMS load of MY increased by 7.78% and 20.49%, respectively. By Phase P3, the RMS load of MY instead decreased by 38.14% relative to the stationary ship condition. This occurred because as the shipborne helicopter descended, the coupling degree between the rotor and the ship deck edge vortex gradually increased. In Phase P3, the descending helicopter and the pitched ship formed a relatively stable coupled flow field, causing the helicopter to enter a relatively stable airflow region; the overall turbulence level decreased, consistent with Figure 21b. As a result, fluctuations in the rotor pitch moment were suppressed. Notably, pitch motion amplified MY instability at landing onset but mitigated it as landing progresses.
For the RMS load of RZ, it can be observed that compared to the stationary ship condition, the RMS load value was highest in P2, while being smaller in P1 and P3. The main reason is that in P2, the helicopter descended to a height comparable to that of the hangar, where it was affected by both the pitch motion and the backflow region aft of the hangar. This caused a sharp surge in the rotor’s RMS load during P2. Furthermore, in Phase P1, the RMS load of RZ under the pitched-ship condition decreased by 25.35% compared to the stationary ship condition. The reduction in RMS load of RZ during Phase P1 was attributed to the lack of a stable coupled flow and the deck’s movement away from the helicopter, which weakened the deck-edge vortex effect. By P2, under the influence of the deck-edge vortex and the backflow region aft of the pitched ship’s hangar, the RMS load of RZ increased by 45.58%. By P3, as the shipborne helicopter entered a relatively intense and stable coupled flow-field region, the RMS load of RZ under the pitched-ship condition increased by a smaller margin compared to the stationary ship condition.

4.3. Influence of Ship Heave Motion

4.3.1. Effect of Heave Motion on the Coupled Flow Field

The ship heave motion was controlled via the time histories of heave to simulate the shipborne helicopter landing on a ship undergoing heave motion. The turbulence levels of the coupled flow field across phases for both the stationary and heave conditions were analyzed, as shown in Figure 24. The distribution trends of the flow-field turbulence level near Deck 4 and Deck 6 remained largely unchanged throughout the three landing phases. This indicates that in the coupled flow-field regions near Deck 4 and Deck 6, the influence of the shipborne helicopter rotor flow on the coupled flow field was relatively minor. Among these, the peak turbulence levels on Deck 6 were mainly concentrated in the rotor center and rotor tip regions. In P2, the lateral turbulence peaks on both sides of the rotor increased noticeably. This indicates that the heave motion strengthened the coupling between the rotor tip downwash flow and the deck edge vortex, leading to a significant increase in turbulence level in the rotor tip region. The flow field near Deck 5 changed distinctly across different phases. In P1, the maximum turbulence levels occurred similarly in the rotor center and tip regions. In P2, the turbulence distribution for both the heave and stationary conditions was essentially consistent, but the peak turbulence level at the rotor center point increased noticeably. This is because the helicopter crossed Deck 5’s line at that time. By P3, the turbulence distribution pattern for the heave condition became basically consistent with that of the stationary condition; the turbulence level at the rotor center point abruptly decreased again, and the turbulence level exhibited a double-peak characteristic, with the turbulence peaks located on both sides of the rotor. However, the overall turbulence level for the heave condition was greater than that for the stationary ship condition, and the peak values increased more significantly.
For the turbulence increments on Deck 4 to Deck 6 during P1, since the aircraft was relatively far from the deck at that stage, the turbulence increment caused by heave motion was not significant. On Deck 4, the heave motion exerted its greatest influence on the turbulence level in the rotor center zone, with an increment of 11.8; its influence on the deck edge zone was secondary, and on the rotor tip zone, it was minimal. This occurred because the heave motion caused the hangar wake to move up and down, combined with the suction effect of the rotor, resulting in a greater turbulence increment near the rotor. For P2 and P3, the influence pattern of the heave motion on the turbulence level was consistent: the deck edge zone was most affected, followed by the rotor tip zone, with the rotor center zone experiencing the least impact. This occurred because as the shipborne helicopter landed, coupling between the deck-edge vortex and the helicopter intensified, significantly increasing turbulence in both the deck edge region and rotor tip region. Particularly for Deck 5 in P3, heave motion’s influence on the deck-edge flow field increased rapidly, causing its turbulence increment to reach a maximum of 155.2, as shown in Figure 25. However, the coupled flow field in the rotor center zone remained dominated by rotor downwash, so the heave motion caused only a small increase in turbulence level in that region. Overall, the heave motion interacted with the rotor flow in P1, exerting a greater influence on the rotor center zone; by P2 and P3, it interacted with the deck-edge vortex, exerting increasingly significant influence on the deck edge zone. Due to the formation of a relatively stable flow field coupled with the rotor, the influence of heave on the rotor tip and rotor center zones progressively diminished.

4.3.2. Influence of Heave Motion on Shipborne Helicopter Dynamic Loads

The rotor RMS loads between heave and stationary conditions were compared and are illustrated in Figure 26. For the RMS loads of MX and MY, heave motion primarily influenced Phase P3. This indicates that as the helicopter approached the deck during that phase, the intense coupling may increase the flow-field asymmetry across the rotor (left/right, front/rear), thereby increasing the RMS loads of the rolling moment and pitch moment. This implies that, compared to the stationary condition, pilots must adjust longitudinal and lateral cyclic pitch more frequently during the final approach.
For the RMS load of RZ, it was evident that during all three landing phases, the heave motion increased the RZ RMS load. The most significant increase occurred in P1, reaching 253.32% relative to the stationary condition. This indicates that heave motion exacerbated the lifting force fluctuations on the shipborne helicopter, particularly during P1. Consequently, pilots should pay close attention to collective pitch adjustments during this phase.

5. Impact of MDOF Ship Motions on Coupled Flow Fields and Rotor Loads Under Sea State 5

5.1. Coupling Index

5.1.1. Flow-Field Coupling Index

To facilitate analysis, the turbulence increment at each monitoring point within a region (deck edge, rotor tip, rotor center) was averaged to represent the region’s overall turbulence increment. This yielded the turbulence increment for each region under the three-DOF motions. Taking Deck 4 in Phase P1 as an example, the contribution of the three-DOF motions to the overall turbulence level was analyzed.
In previous sections, the turbulence increments (ΔX) for each region of Deck 4 in P1 corresponding to the different motion conditions were obtained. This section investigates the contribution of these individual motion increments (ΔX1, ΔX2, ΔX3) to the total turbulence increment (Y) under the combined roll+pitch+heave condition. A model was established to characterize the relationship between X1, X2, X3, and Y:
Y = Δ X · β + ε
where β is the intercept coefficient, and ε is the error term. Here, ΔX = [1 ΔX1 ΔX2 ΔX3]. β = [1 β1 β2 β3] represent the coefficient vector; β 1 is the roll coefficient; β 2 is the pitch coefficient; and β 3 is the heave coefficient. The objective is to find a set of coefficients such that the turbulence increment Y ^ = Δ X · β calculated using the coefficients minimizes the error with the actual computed value Y.
According to the least-squares method, the error between the predicted value and the actual computed value should be minimized; thus, coefficient β needs to satisfy:
ε = min β Y Δ X · β 2
Now, we have:
min β Y Δ X · β 2 = ( Y Δ X · β ) T ( Y Δ X · β ) = Y T Y Y T ( Δ X · β ) ( Δ X · β ) T Y + ( Δ X · β ) T ( Δ X · β ) = Y T Y 2 Y T ( Δ X · β ) + β T · Δ X T · Δ X · β
By taking the derivative of t and making it 0, we can obtain:
β Y Δ X · β 2 = 2 Y T · Δ X + 2 Δ X T · Δ X · β = 0
Ultimately, the coefficient vector is obtained:
β = ( Δ X T · Δ X ) 1 Y T · Δ X
Consequently, the calculated value for the combined roll+pitch+heave condition is:
Y ^ = β 0 + β 1 · Δ X 1 + β 2 · Δ X 2 + β 3 · Δ X 3
where β 1 · Δ X 1 is the contribution of the roll motion, β 2 · Δ X 2 is the contribution of the pitch motion, and β 3 · Δ X 3 is the contribution of the heave motion. The contribution proportion of each degree-of-freedom motion is then:
a = | β 1 · Δ X 1 | | β 1 · Δ X 1 | + | β 2 · Δ X 2 | + | β 3 · Δ X 3 |
b = | β 2 · Δ X 2 | | β 1 · Δ X 1 | + | β 2 · Δ X 2 | + | β 3 · Δ X 3 |
c = | β 3 · Δ X 3 | | β 1 · Δ X 1 | + | β 2 · Δ X 2 | + | β 3 · Δ X 3 |
Finally, the contribution ratio of different motions on each monitoring line at each stage to the overall turbulence increment is obtained.

5.1.2. Load Coupling Index

Through previous simulations, the RMS loads MX, MY, and RZ corresponding to the different motion conditions can be obtained. Thus, the superposition result of the loads under each SDOF condition can then be expressed as:
{ M X S u p e r p o s i t i o n = ( M X 1 2 + M X 2 2 + M X 3 2 ) M Y S u p e r p o s i t i o n = ( M Y 1 2 + M Y 2 2 + M Y 3 2 ) R Z S u p e r p o s i t i o n = ( R Z 1 2 + R Z 2 2 + R Z 3 2 )
The coupling index of RMS loads was computed to quantitatively evaluate the effect of motion coupling on the helicopter dynamic loads. The index is defined as the ratio of the actual RMS load under the three-DOF motions to the RMS load obtained by linear superposition of the SDOF results. If the coupling index exceeds 1, this signifies an amplifying effect of motion coupling on the helicopter dynamic loads. If the index is less than 1, it indicates a damping effect. When the index equals 1, the dynamic loads conform with the superposition principle.
K R M S = R M S A c t u a l R M S S u p e r p o s i t i o n

5.2. Influence of Coupled Motion on the Coupled Flow Field

The combined impact of roll, pitch, and heave motions on the flow field was further analyzed by quantifying their contributions. First, the turbulence levels in SDOF conditions were compared with the three-DOF condition, as shown in Figure 27. The bar charts represent the contribution proportions of roll, pitch, and heave to the total turbulence increment, respectively. To facilitate analysis, the contribution proportions at each deck level (Decks 4, 5, 6) were averaged, yielding the results summarized in Table 4.
In P1, for Decks 4 and 5, the heave motion exerted the most significant influence on the overall flow-field turbulence level, with contribution proportions of 70.5% and 57.3%, respectively. On Deck 6, however, the pitch motion became the dominant factor, with a contribution proportion reaching 54.1%. This indicates that during the initial landing stage (P1), the heave motion had the greatest impact on the overall turbulence level, particularly over the forward and mid-deck regions (Decks 4 and 5). Over the aft deck region (Deck 6), the influence of deck height variation due to pitch motion was more pronounced, while the roll motion also further affected the flow-field turbulence level.
In P2, on Deck 4, the roll motion dominated the turbulence level, with a contribution ratio reaching 54.6%. On Deck 5 and Deck 6, the pitch contribution was significantly greater than that of other motions, at 54.3% and 76.4%, respectively. This indicates that as the helicopter descended, the roll and pitch significantly influenced the turbulence level of the coupled flow field. On Deck 4, the height variation induced by pitch had a minimal effect on the coupled flow field, making roll the primary factor influencing the turbulence. In the Deck 5 and Deck 6 regions, however, increased pitch amplitude caused the pitch motion to significantly affect deck height variations. Consequently, the pitch motion dominated as the main influence on the turbulence in these regions, with its effect intensifying at more aft deck positions (i.e., with greater pitch amplitude).
In P3, the pitch motion became the primary factor affecting the turbulence levels across all deck lines, with its contribution proportion reaching 67.8%. On Deck 4, the roll, pitch, and heave motions all exerted relatively significant influence on the coupled flow-field region. The contribution proportions were 30.9%, for roll, 30.7% for heave, and 38.5% for pitch. However, in the Deck 5 and Deck 6 regions, the pitch contribution proportion soared to 80.3% and 84.7%, respectively. This indicates that during P3, when the helicopter was nearly on the deck, the height variation caused by the pitch motion had the most significant impact on the turbulence level in the mid-deck and aft regions (Decks 5 and 6) of the coupled flow field.

5.3. Influence of Coupled Motion on Rotor Dynamic Loads

The superposed values for roll, pitch, and heave were compared with the actual RMS loads obtained under the three-DOF motion condition, as presented in Figure 28 and Table 5.
As it is seen, the variations in all three load components (MX, MY, RZ) across the landing phases were significant. For the MX in Phase P1, the coupled three-DOF motion caused the actual RMS load to exceed the superposition result by up to 37.50%. This indicates that ship–helicopter coupling exerted a pronounced amplifying effect on rotor loads during that phase. This amplification occurred because MX, the rolling moment, arose from lateral flow-field asymmetry. The deck-edge vortices presented on both sides of the ship (Area (a) in Figure 1) couple with the rotor flow field, increasing the disparity between the left and right flow fields and exacerbating rotor lateral asymmetry (Figure 19). Consequently, the amplifying effect primarily impacted the rolling moment (MX). For the MY and RZ loads, the coupled three-DOF motion generally resulted in actual RMS loads being lower than the superposition results. This indicates that ship–helicopter coupling exerted a significant damping effect on the rotor loads. The most pronounced damping occurred for RZ in P1; the coupled motion reduced the actual RMS load by 65.68% compared to the superposition value, yielding a coupling index of 0.34. Furthermore, the differences in all three loads showed a trend of gradual reduction as the helicopter descended. This indicates that the ship–helicopter coupling influence decreased as the helicopter neared the deck. This reduction occurred because (1) from P1 to P2, the helicopter descended below the hangar level, entering a relatively stable coupled flow-field region; (2) from P2 to P3, proximity to the deck left insufficient distance to sustain strong coupling effects. During P3, all load components conformed more closely to the superposition principle, with coupling indices approaching 1.0. This signifies negligible amplifying or damping effects from the coupled motions on the RMS loads.

6. Conclusions and Recommendations

Existing research on shipborne helicopter landings has largely been limited to hovering conditions or SDOF ship motions. In this study, a dynamic simulation of the shipborne helicopter landing process was conducted based on the two-way coupling. The momentum source method was employed to model the rotor. Furthermore, the study investigated the evolution of the coupled flow field and rotor loading during dynamic landings under MDOF motion conditions, aiming to identify key factors influencing landing safety and performance.
Firstly, the influence of SDOF motion of the ship on the flow field and rotor loads is listed in Table 6.
Secondly, combined MDOF motion reduced coupled flow-field instabilities but increased the prediction errors of average turbulence level. Pitch motion dominated the coupled flow-field changes from P2 to P3. The MX RMS load approximately followed the superposition principle, while MY and RZ exhibited enhanced damping effects, with the coupling index dropping to 0.34. The average dynamic load error reached 50.74%, underscoring the necessity of MDOF coupling models for accurate load prediction.
Finally, this study addressed a constrained operational scenario: helicopter–ship coupling under headwind conditions with 30° wave direction at Sea State 5. Future work will investigate ship motions across broader sea states and wind directions. Additionally, given the strong dependence of the results on the specific geometries, we will extend this research to examine coupled aerodynamic flow fields and rotor loads for various ship and helicopter configurations.

Author Contributions

Conceptualization, Y.L.; methodology, Y.L.; software, Z.L.; validation, Z.L. and W.Z.; formal analysis, Y.M.; investigation, Y.L.; resources, Z.L.; data curation, Y.M.; writing—original draft preparation, Z.L.; writing—review and editing, Z.C. and W.Z.; visualization, Y.L.; supervision, Z.C.; project administration, Z.C.; funding acquisition, Z.C. All authors have read and agreed to the published version of the manuscript.

Funding

This research was funded by the Aeronautical Science Foundation of China, grant number 2024M074189001; Shandong Provincial Natural Science Foundation, grant number ZR2024ME139 and ZR2022QE092 for supporting this work.

Data Availability Statement

All data, models, or code generated or used during the study are available from the corresponding author upon request.

Conflicts of Interest

Authors Yang Liu and Yingnan Ma were employed by the Dalian Changfeng Industrial Corporation. The remaining authors declare that the research was conducted in the absence of any commercial or financial relationships that could be construed as potential conflicts of interest.

References

  1. Jiang, Z.L. Numerical Simulation of Coupled Interference Flow Field for Shipborne Aircraft and Ship in High Sea State. Master’s Thesis, Nanjing University of Aeronautics and Astronautics, Nanjing, China, 2020. [Google Scholar]
  2. Jeong, J.; Hussain, F. On the Identification of a Vortex. J. Fluid Mech. 1995, 332, 339–363. [Google Scholar] [CrossRef]
  3. Su, D.C.; Shi, Y.J.; Xu, G.H. Numerical study of the rotational direction effect on aerodynamic loading characteristics of shipborne helicopter rotor. Aeronaut. J. 2019, 123, 635–657. [Google Scholar] [CrossRef]
  4. Forrest, J.S.; Owen, I. An investigation of ship airwakes using Detached-Eddy Simulation. Comput. Fluids 2010, 39, 656–673. [Google Scholar] [CrossRef]
  5. Gu, Y.S.; Ming, X. Experimental Investigation on Flow Field Properties Around Aft-Deck of Destroyer. Acta Aeronaut. Astronaut. Sin. 2001, 06, 500–504. [Google Scholar]
  6. Lee, R.G.; Zan, S.J. Wind Tunnel Testing of a Helicopter Fuselage and Rotor in a Ship Airwake. In Proceedings of the 29th European Rotorcraft Forum, Friedrichshafen, Germany, 16–18 September 2003. [Google Scholar]
  7. Zan, S.J. Experimental Determination of Rotor Thrust in a Ship Airwake. J. Am. Helicopter Soc. 2002, 4, 100–108. [Google Scholar] [CrossRef]
  8. Czerwiec, R.; Plosky, S. LHA Airwake Wind Tunnel and CFD Comparison with and Without Bow Flap. In Proceedings of the 22nd Applied Aerodynamics Conference and Exhibit, Providence, RI, USA, 16–19 August 2004. [Google Scholar]
  9. Zheng, Y.Y. Investigations on Active Flow Control Methods for Helicopter/Ship Dynamic-Interface Optimization. Master’s Thesis, Nanjing University of Aeronautics and Astronautics, Nanjing, China, 2017. [Google Scholar]
  10. Lee, R.G.; Zan, S.J. Unsteady aerodynamic loading on a helicopter fuselage in a ship airwake. J. Am. Helicopter Soc. 2004, 2, 149–159. [Google Scholar] [CrossRef]
  11. Wu, S.Y. Study on the Influence of Dynamicsurface Moving Flow Field Underhelicopter/Ship Coupling. Master’s Thesis, Nanjing University of Aeronautics and Astronautics, Nanjing, China, 2019. [Google Scholar]
  12. Jaap, V.M.; Okko, J.B.; Jasper, V.V.; Joop, H.M.G. Computational ship airwake determination to support helicopter-ship dynamic interface assessment. In Proceedings of the 21st AIAA Computational Fluid Dynamics Conference, San Diego, CA, USA, 24–27 June 2013. [Google Scholar]
  13. Choi, J.; Miklosovic, D.S. LES Simulations using the Moving Mesh Method with Comparison to Experimental Results for a Periodic Ship Airwake. In Proceedings of the AIAA Aviation Forum, Online, 15–19 June 2020. [Google Scholar]
  14. Chun, C.W.; Gao, S.; Sun, W.S. Analysis of Unmanned Helicopter Hovering in Ship Flow Field over Flight Deck. J. Nanjing Univ. Aeronaut. Astronaut. 1999, 6, 614–629. [Google Scholar]
  15. Shi, Y.; Su, D.; Xu, G. Numerical investigation of the influence of passive/active flow control on ship/helicopter dynamic interface. Aerosp. Sci. Technol. 2020, 106, 106205. [Google Scholar] [CrossRef]
  16. Linton, D.; Thornber, B. Quantifying uncertainty in turbulence resolving ship airwake simulations. Ocean. Eng. 2021, 229, 108983. [Google Scholar] [CrossRef]
  17. Li, T.; Wang, Y.B.; Zhao, N. Influence of Ship Motion on Flow Field over Modified Simple Frigate Shapes. Trans. Nanjing Univ. Aeronaut. Astronaut. 2021, 38, 521–534. [Google Scholar]
  18. Praveen, B.; Vijayakumar, R.; Singh, S.N. Flow characteristics on helodeck of a generic frigate ship model through experiment and CFD. Ocean. Eng. 2022, 250, 110912. [Google Scholar] [CrossRef]
  19. Li, T.; Wang, Y.B.; Zhao, N.; Deng, S.Q. Optimization of ship airwake on a simple frigate. J. Ship Mech. 2023, 27, 10–22. [Google Scholar]
  20. Dooley, G.; Martin, J.E.; Buchholz, J.H.J. Ship Airwakes in Waves and Motions and Effects on Helicopter Operation. Comput. Fluids 2020, 208, 104627. [Google Scholar] [CrossRef]
  21. Zhao, D.; Yang, H.; Shuangji, Y.; Ni, T. Numerical investigation for coupled rotor/ship flowfield using two models based on the momentum source method. Eng. Appl. Comput. Fluid Mech. 2021, 15, 1902–1918. [Google Scholar] [CrossRef]
  22. Cao, Y.; Qin, Y.; Tan, W.; Li, G. Numerical Simulation of Fully Coupled Flow-Field and Operational Limitation Envelopes of Helicopter-Ship Combinations. J. Mar. Sci. Eng. 2022, 10, 1455. [Google Scholar] [CrossRef]
  23. Lu, Y.; Chang, X.; Chuang, Z. Numerical investigation of the unsteady coupling airflow impact of a full-scale warship with a helicopter during shipboard landing. Eng. Appl. Comput. Fluid Mech. 2020, 14, 954–979. [Google Scholar] [CrossRef]
  24. Tezdogan, T.; Demirel, Y.K.; Kellett, P.; Khorasanchi, M.; Incecik, A.; Turan, O. Full-scale unsteady RANS CFD simulations of ship behaviour and performance in head seas due to slow steaming. Ocean. Eng. 2015, 97, 186–206. [Google Scholar] [CrossRef]
  25. Lakshmynarayanana, P.A.K.; Hirdaris, S. Comparison of nonlinear one- and two-way FFSI methods for the prediction of the symmetric response of a containership in waves. Ocean. Eng. 2020, 203, 107179. [Google Scholar] [CrossRef]
  26. CD-Adapco. UserguideSTAR-CCM+, version 9.0.2; CD-Adapco: Melville, NY, USA, 2014.
  27. Jiao, J.L.; Huang, S.X.; Tezdogan, T.; Terziev, M.; Soares, C.G. Slamming and green water loads on a ship sailing in regular waves predicted by a coupled CFD–FEA approach. Ocean. Eng. 2021, 241, 110107. [Google Scholar] [CrossRef]
  28. Querard, A.B.G.; Temarel, P.; Turnock, S.R. Influence of viscous effects on the hydrodynamics of ship-like sections undergoing symmetric and anti-symmetric motions, using RANS. In Proceedings of the ASME 27th Interna-tional Conference on Offshore Mechanics and Arctic Engineering (OMAE), Estoril, Portugal, 15–20 June 2008. [Google Scholar]
  29. Kim, S.P.; Lee, H.H. Fully nonlinear seakeeping analysis based on CFD simulations. In Proceedings of the 21st International Offshore and PolarEngineering Conference, Maui, HI, USA, 19–24 June 2011. [Google Scholar]
  30. Enger, S.; Peric, M.; Peric, R. Simulation of flow around KCS-hull. In Proceedings of the Gothenburg 2010-A Workshop on Numerical Ship Hydrodynamics, Gothenburg, Sweden, 8–10 December 2010. [Google Scholar]
  31. Shinoda, P.M.; Norman, T.R.; Jacklin, S.A.; Bernhard, A.P.F.; Haber, A. Investigation of a Full-Scale Wide Chord Blade Rotor System in the NASA Ames 40-by 80-Foot Wind Tunnel. In Report of Aeroflightdynamics Directorate (AMRDEC); NASA: Washington, DC, USA, 2004. [Google Scholar]
  32. Shinoda, P.M.; Yeo, H.; Itss, R.; Norman, T.R. Rotor Performance of a UH-60 Rotor System in the NASA Ames 80- by 120-Foot Wind Tunnel. In Report of US Army Aeroflightdynamics Directorate (AMCOM); NASA: Washington, DC, USA, 2004. [Google Scholar]
  33. Xiao, Z.Y. Investigation of Computational ModelingTechniques for Rotor Flowfields; China Aerodynamics Research and Development Center: Mianyang, China, 2007. [Google Scholar]
  34. William, G.B. Aerodynamic Characteristics of SC1095 and SC1094 R8 Airfoils; Report No.: NASA-TP 2003-212265; NASA: Washington, DC, USA, 2003.
  35. Lv, L.; Chen, Z.G. Parametric design method for multiple period stablenumerical wave-generation. Chin. J. Ship Res. 2022, 17, 99–107. [Google Scholar]
  36. Zhang, F.; Xu, H.; Ball, N. Numerical Simulation of Unsteady Flow Over SFS 2 Ship Model. In Proceedings of the 47th AIAA Aerospace Sciences Meeting Including the New Horizons Forum and Aerospace Exposition, Orlando, FL, USA, 5–8 January 2009. [Google Scholar]
  37. Guo, D.M.; Chen, Z.Y.; Duan, F. Dynamic Simulations of influence of ship rolling motion on aerodynamic flow field and helicopter loading under helicopter-ship coupling. In Proceedings of the ASME 2024 43nd International Conference on Ocean, Offshore and Arctic Engineering, Singapore, 9–14 June 2024. [Google Scholar]
  38. Yan, L. Key Technologies of Ship Motionsimulation Base on Sea State. Master’s Thesis, Shanghai Jiao Tong University, Shanghai, China, 2008. [Google Scholar]
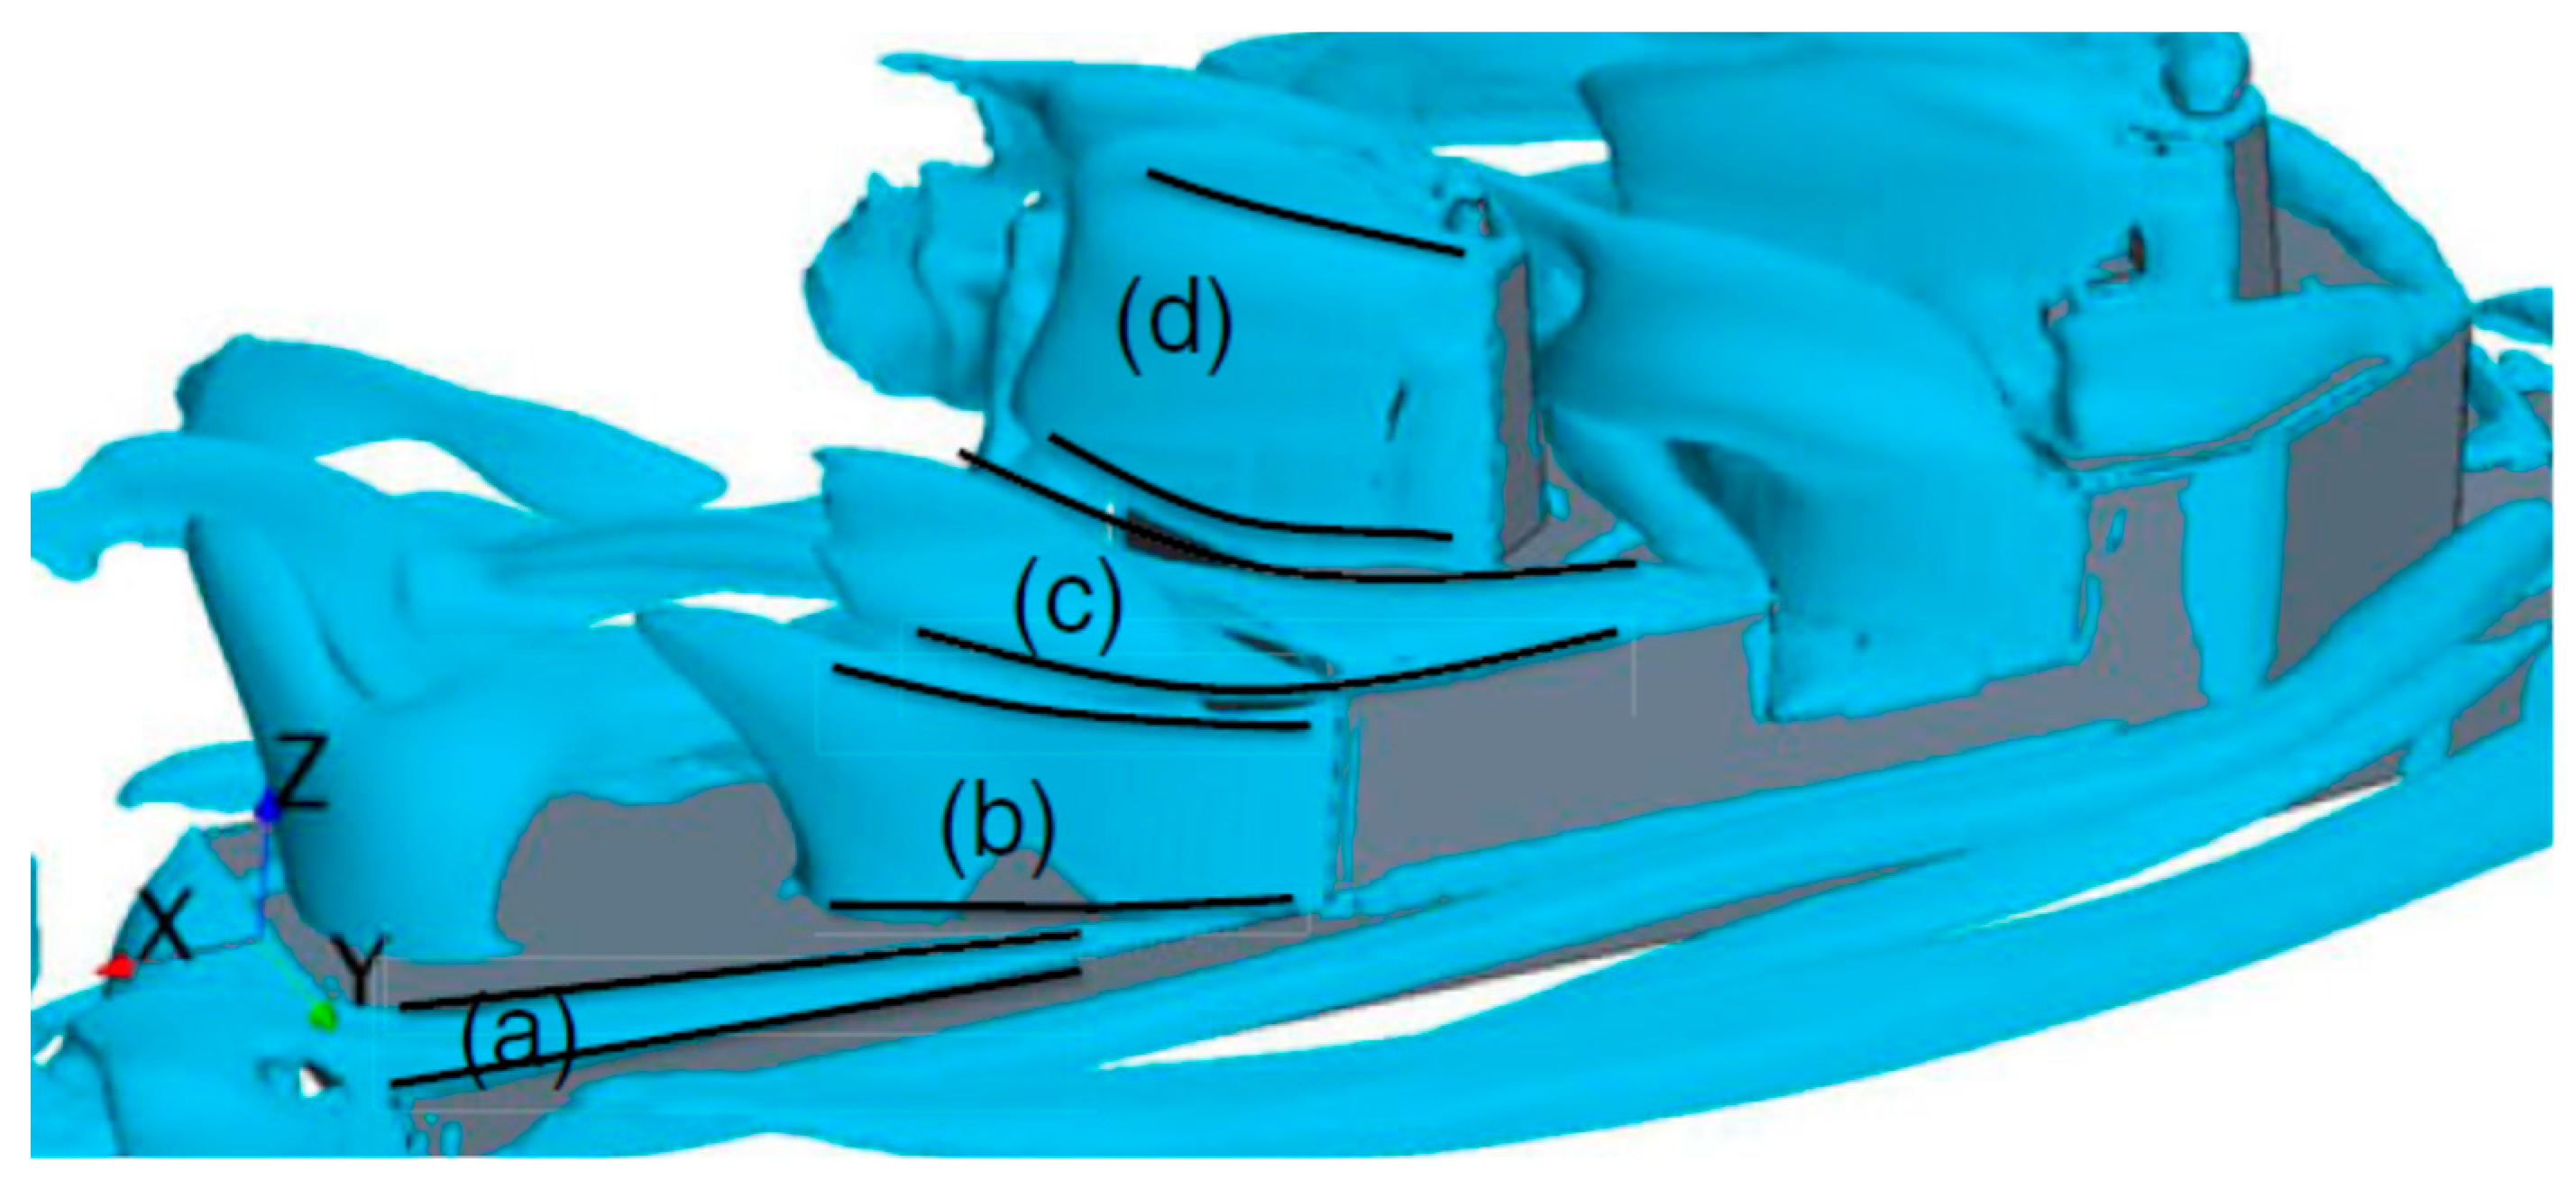
Figure 1. Ship-wake vortex structures [3]: (a) Deck-edge vortices; (b) Hangar shear layers; (c) Spiral-shaped superstructure vortices; (d) Mast-induced flow separations.
Jmse 13 01544 g001
Figure 2. USS San Antonio-class model [22].
Jmse 13 01544 g002
Figure 3. UH-60 Black Hawk model.
Jmse 13 01544 g003
Figure 4. Finite volume mesh and interpolation grid of rotor.
Jmse 13 01544 g004
Figure 5. A general view of the grid in the background and overset regions.
Jmse 13 01544 g005
Figure 6. Wave generation surface profile.
Jmse 13 01544 g006
Figure 7. Wave elevation measurement.
Jmse 13 01544 g007
Figure 8. SFS2 model and velocity measurement line configuration.
Jmse 13 01544 g008
Figure 9. Comparison of velocity [3,36].
Jmse 13 01544 g009
Figure 10. Location of monitoring line.
Jmse 13 01544 g010
Figure 11. Three mesh schemes.
Jmse 13 01544 g011
Figure 12. Comparisons of average velocity components.
Jmse 13 01544 g012
Figure 13. Seakeeping performance mesh configuration.
Jmse 13 01544 g013
Figure 14. Ship motions.
Jmse 13 01544 g014
Figure 15. Shipborne helicopter landing phases.
Jmse 13 01544 g015
Figure 16. Monitoring lines.
Jmse 13 01544 g016
Figure 17. Division of monitoring line.
Jmse 13 01544 g017
Figure 18. Comparison of coupled flow fields between rolling ship condition and stationary ship condition.
Jmse 13 01544 g018
Figure 19. Deck-edge vortices and rotor downwash in roll condition (Phase P1).
Jmse 13 01544 g019
Figure 20. RMS loads for rolling ship condition and stationary ship condition.
Jmse 13 01544 g020
Figure 21. Comparison of coupled flow fields between pitched-ship condition and stationary ship condition.
Jmse 13 01544 g021
Figure 22. Pitched-ship condition’s aircraft position (Phase P3).
Jmse 13 01544 g022
Figure 23. RMS loads for stationary and pitch conditions.
Jmse 13 01544 g023
Figure 24. Turbulence comparison between heave and stationary conditions.
Jmse 13 01544 g024
Figure 25. Coupling between rotor and deck-edge vortex under heave condition.
Jmse 13 01544 g025
Figure 26. RMS loads for stationary and heave conditions.
Jmse 13 01544 g026
Figure 27. Comparison of turbulence increment between SDOF and MDOF motion conditions.
Jmse 13 01544 g027
Figure 28. Comparison of RMS loads between roll/pitch/heave superposition and roll+pitch+heave condition.
Jmse 13 01544 g028
Table 1. Main dimensions of the ship model.
Main ParticularValue
Length (L, m)208.5
Beam (W, m)31.9
Draft (D, m)7
Displacement volume (m3)24,522
Longitudinal COG (xg/L)0.469
Transverse COG (yg/W)0.5
Vertical COG (zg/L)0.208
Ixx (kg·m2)1944.45
Iyy (kg·m2)26,335.49
Design speed (knot)22
Table 2. UH-60’s key parameters [31,32].
ParameterValue
Fuselage length19.76 m
Overall height5.13 m
Number of main rotor blades4
Main rotor diameter16.36 m
Main rotor chord length0.53 m
Main rotor tip sweep20°
Main rotor tip negative twist16°
Main rotor solidity0.083
Main rotor tip speed221 m/s
Main rotor airfoil profilesSC1094 R8, SC1095
Table 3. Three meshes’ configuration parameters.
Coarse MeshMedium MeshFine Mesh
Minimum grid size0.042 m0.03 m0.02 m
Total grid count0.897 million2.129 million7 million
Ship surface Y+353535
CFL111
Total computation time21.2 h64.8 h240.9 h
Table 4. Average influence of each degree of freedom on overall turbulence.
Monitoring LineRoll Average InfluencePitch Average InfluenceHeave Average Influence
P1Deck 40.2200.0750.705
Deck 50.1140.3130.573
Deck 60.4180.5410.041
Average influence0.2510.3100.439
P2Deck 40.5460.1920.262
Deck 50.2090.5430.249
Deck 60.2130.7640.023
Average influence0.3220.4990.178
P3Deck 40.3090.3850.307
Deck 50.0190.8030.178
Deck 60.0400.8470.113
Average influence0.1220.6780.199
Table 5. Coupling index for 3-DOF condition.
Coupling Index MXCoupling Index MYCoupling Index RZ
P11.370.510.34
P20.920.610.61
P31.010.860.82
Table 6. Summary of the effects of SDOF motion of ships.
MotionCoupled Flow FieldRotor Loads
RollDeck 4: Roll is the main influencing factor. Significant impact on TI at the deck edge and rotor edge.
Deck 5: Rotor airflow is the main factor, but roll may affect the turbulence distribution. In phase P3, the turbulence intensity at the edge of the deck increases significantly.
Deck 6: The numerical variation in TI is dominated by the rotor.
MX: Significant dynamic characteristics in P2.
MY: Minimal impact from rolling motion, with only a 5% increase in P1.
RZ: As the helicopter lands, the impact gradually intensifies, with a 32.81% increase in P3.
Summary: MX > RZ > MY
PitchDeck 4: Motion mainly affects the rotor center in P1. Motion mainly affects the deck/rotor edge in P2 and P3.
Deck 5–6: Influence on the coupled flow field is weak, especially in the rotor center.
MX: The MX component decreases during the early landing.
MY: MY instability increases in the early landing phase, necessitating careful longitudinal pitch control.
RZ: RZ reaches its peak in P2.
HeaveOverall, the impact on the deck edge increases with landing.
Deck 4: Rotor center is most significantly affected in P1.
Deck 5: Rotor edge region is most significantly affected in P3.
Deck 6: Basically no effect on the rotor edge zone and rotor center zone.
MX: Lateral asymmetry in the rotor’s surrounding flow leads to a sharp 160.94% surge in MX in P3.
MY: Attention should be paid to it in P3.
RZ: RMS continues to increase with landing.
Summary: MX > RZ > MY.
Disclaimer/Publisher’s Note: The statements, opinions and data contained in all publications are solely those of the individual author(s) and contributor(s) and not of MDPI and/or the editor(s). MDPI and/or the editor(s) disclaim responsibility for any injury to people or property resulting from any ideas, methods, instructions or products referred to in the content.