Article

Intelligent Optimization of Waypoints on the Great Ellipse Routes for Arctic Navigation and Segmental Safety Assessment

1
School of Geodesy and Geomatics, Wuhan University, Wuhan 430079, China
2
College of Marine Electrical Engineering, Dalian Maritime University, Dalian 116026, China
3
College of Electrical Engineering, Naval University of Engineering, Wuhan 430033, China
4
China Waterborne Transport Research Institute, Beijing 100088, China
*
Author to whom correspondence should be addressed.
J. Mar. Sci. Eng. 2025, 13(8), 1543; https://doi.org/10.3390/jmse13081543
Submission received: 13 July 2025 / Revised: 2 August 2025 / Accepted: 8 August 2025 / Published: 11 August 2025
(This article belongs to the Special Issue Maritime Transportation Safety and Risk Management)

Abstract

A great ellipse route (GER), as one of the fundamental routes for ocean voyages, directly influences the actual voyage distance and the complexity of vessel maneuvering through the location and number of its waypoints. Against the backdrop of global warming, the melting of Arctic sea ice has accelerated the opening of the Arctic shipping route. This paper addresses the issue of how to reasonably segment and adopt rhumb line routes to approximate the GER in the special navigational environment of the Arctic. Using historical routes, recommended routes, and geospatial data that have passed through the Arctic shipping lane as constraints, this paper proposes a waypoint optimization model based on an adaptive hybrid particle swarm optimization-genetic algorithm (AHPSOGA). Additionally, by integrating Arctic remote sensing ice condition data and the Polar Operational Limit Assessment Risk Indexing System (POLARIS), a safety assessment model tailored for this route has been developed, enabling the quantification of sea ice risks and dynamic evaluation of segment safety. Experimental results indicate that the proposed waypoint optimization model reduces the number of waypoints and voyage distance compared to recommended routes and conventional shipping industry methods. Furthermore, the AHPSOGA algorithm achieves a 16.41% and 19.19% improvement in convergence speed compared to traditional GA and PSO algorithms, respectively. In terms of computational efficiency, the average runtime is improved by approximately 12.00% and 14.53%, respectively. The risk levels of each segment of the optimized route are comparable to those of the recommended Northeast Passage route. This study provides an effective theoretical foundation and technical support for intelligent planning and decision-making for Arctic shipping routes.

1. Introduction

1.1. Research Review

As global warming progresses, the sea ice coverage in the Arctic region has been decreasing annually, gradually enhancing the feasibility of shipping operations in the Arctic region [1,2,3]. The emergence of intelligent navigation technology for vessels has further amplified the advantages of Arctic shipping routes. The opening of Arctic shipping routes will effectively alleviate the shipping pressure on traditional routes through the Malacca Strait and Suez Canal to Europe, while reducing vessel voyage time costs by approximately 40% [4,5,6]. As a key decision-making variable influencing shipping safety and economic efficiency, route optimization research has become an important frontier topic in the international shipping field.
The Northeast Passage in the Arctic, with its unique geographical advantages, is currently recognized as the Arctic shipping route with the greatest potential for commercial development. Based on differences in latitude, this passage can be divided into four main routes: the coastal route, the mid-latitude route, the high-latitude route, and the near-polar route. Considering both navigation safety and economic factors, merchant ships typically prioritize the mid-latitude route as their primary passageway. This study focuses on optimizing the mid-latitude route based on the recommended routes outlined in the “Arctic Shipping Route Navigation Guide (Northeast Passage)” [7].
The recommended routes in the Arctic Navigation Guide (Northeast Passage) are based on great circle routes (GCRs) [8,9]. However, the GCR is based on a spherical model of the Earth, which is different from the ellipsoidal model of the Earth used by modern navigation equipment such as GNSS and AIS, affecting the navigational accuracy and safety of the ship. As the shortest distance between two points on the Earth’s ellipsoid, the geodetic line is a spatial curve with both curvature and perturbation. Its calculation depends on the complex differential geometry method, which has significant limitations in practical application. The GER is a regular curve that closely follows the geodetic line, with minimal differences in distance between the two. According to Reference [10], between 0° N and 70° N, the distance error between the GER and the GCR is within 0.5%. In the high-latitude regions of the Arctic, the relative error between the GER and the GCR is more significant than in other regions, with route length errors reaching 1.8–2.5%. Therefore, using the GER as the basis for route planning ensures navigational accuracy while also offering better engineering feasibility. Compared to the GCR, the GER can also be classified into two types: one is to strictly follow the GER, and the other approximates the GER using segmented rhumb lines (RLs). Before the popularization of computers, related research mainly focused on the problem of parameter computation and the determination of the direct and inverse solutions for the GER. In terms of the computation of the GER, one method was proposed by Ding, which projects the ellipsoid onto a sphere and uses formulas of spherical trigonometry to solve the geographical coordinates on the GER, comparing the relationships between GCR and GER [11,12]. Earle utilized geometric differentials and position vector analysis to precisely compute the great elliptic azimuths and derived compact analytical expressions, using differential methods to calculate vertex coordinates and providing direct and inverse solution formulas through harmonic series [13,14,15]. A method was presented by Sjöberg for calculating the positive and negative solutions of the equation of an ellipse based on the position vector [16]. The GER was optimized by Liu et al. using the space vector method to improve the accuracy of maritime calculations [17]. In regard to the calculation of navigation parameters for GER, the formulas for azimuth and voyage were derived by Fang et al. based on the spatial curve equation and the curve-related vector [18]. A complete system of parameter calculation for great ellipse navigation was constructed by Li et al. using spatial curve equations and their associated vectors [19].
The above literature mainly focuses on the parameter calculation of GER and the forward and inverse problems of the route equation, that is, the mathematical modeling requirements for strictly following the GER. However, the use of RLs is a fundamental requirement for maritime navigation [20]. Therefore, how to reasonably divide the GER into segments is a key issue that needs to be addressed. In the era before computer technology was widely used, to simplify the complexity of calculations, scholars such as Bowditch Holm and Keys [21,22,23] used the right-angled spherical trigonometry formula in Napier’s formula in combination with the vertex coordinate method to solve for the position of the waypoint. The quadrant spherical triangle formula in Napier’s formula was adopted by Chen et al. [24] in conjunction with the equatorial intersection point for waypoint positioning. Traditional navigation science typically uses two methods to simplify calculations: the equi-longitude route design and the equidistance route design. However, these two methods have inherent flaws in the allocation and spatial distribution of waypoints, which significantly reduce navigational flexibility and practicality. In response, the Longitude Bisection Method (LBM), proposed by Hsieh et al. [25], dynamically inserts waypoints at intervals and terminates the iteration when the remaining distance benefit is less than one hour’s voyage time. Although this method considers waypoint quantity optimization, the waypoint locations determined by LBM are not globally optimal. Therefore, the team further proposed a genetic algorithm-based route point optimization strategy and a fuzzy logic-based waypoint quantity evaluation system in 2023 [9]. It should be noted that the above methods for determining waypoints are all based on great circle routes using a spherical Earth model and do not yet address the issue of optimizing waypoints for the GER using an ellipsoidal model. Therefore, this study proposes a solution using intelligent optimization algorithms to achieve the coordinated optimization of the number and spatial locations of waypoints for GER.
The determination of the number and location of waypoints on GER is essentially a process of “finding the optimal solution”. In recent years, intelligent optimization algorithms, such as Ant Colony Optimization (ACO) [26,27,28], Genetic Algorithm (GA) [29,30], and Particle Swarm Optimization (PSO) [31,32], have been widely used in fields like ship routing, vehicle path planning, drone navigation, and autonomous driving. For example, Tsou et al. [33] combined the International Regulations for Preventing Collisions at Sea (COLREGS) and the field of ship safety, using genetic algorithms and simulating biological evolution models to find the theoretically shortest collision avoidance route from an economic perspective. Shen et al. [34] established a static environmental model of the navigation area using the tangent diagram method and utilized a particle swarm optimization algorithm to search for the globally shortest route with the objective of minimizing the cost function. Tong et al. comprehensively considered factors influencing the navigation route in ice areas, including route distance, navigational operational complexity, and ice avoidance, and improved the ant colony optimization algorithm to enhance the planning effectiveness of ship navigation routes [35]. A multi-objective ice route planning model based on a three-dimensional ant colony algorithm was proposed by Zhang et al. to solve the optimization problem of fuel consumption and navigation risk during ship navigation in the Arctic [36]. A seeded genetic algorithm was employed by Lee et al., with the initial solution generated by the A* algorithm to improve computational efficiency [37]. Although the aforementioned studies have made significant contributions to solving the ice navigation path planning problem, they primarily focus on the application of single optimization algorithms and have not sufficiently addressed the optimization of the number and spatial distribution of waypoints. Moreover, sea ice is the most critical factor affecting the safety of polar navigation [38,39,40,41]. It is essential to conduct quantitative analysis of the sea ice risk in Arctic shipping routes and safety assessment studies for route segments.

1.2. Innovations and Contributions

The research work presented in this paper exhibits notable innovations and contributions. Specifically, aiming at the optimization of route points on Arctic shipping routes, this study proposes an adaptive hybrid PSO-GA algorithm (AHPSOGA). This algorithm effectively optimizes the number and spatial distribution of route points on the GER. By combining the advantages of PSO and GA algorithms, and through adaptive adjustments, the algorithm achieves effective optimization of route points. While ensuring the economic benefits of the shipping routes, it significantly reduces the voyage distance and the number of route points, thereby lowering the complexity of ship operations. This algorithmic innovation provides new theoretical support and technical assurance for Arctic shipping route planning.
Compared to standard GA and PSO algorithms, the AHPSOGA algorithm demonstrates significant advantages in convergence speed and computational efficiency. Furthermore, within the framework of the Polar Operational Limits Assessment Risk Index System (POLARIS), this paper integrates remote sensing ice data from the Arctic to construct a safety assessment model for Arctic shipping routes. This model comprehensively considers factors such as sea ice density, sea ice thickness, and ice-class ships, and establishes a navigation safety index for optimized route segments. It achieves sea ice risk calculation, safety assessment of voyage segments, and visual representation of sea ice risks along the segments. This contribution provides a scientific basis and technical support for operational decision-making and route design optimization for Arctic voyages. Finally, this research work validates the effectiveness and reliability of the optimization model through experiments, not only improving the convergence speed and computational efficiency of the algorithm but also ensuring the safety and feasibility of the optimized routes. This research result is of great significance for promoting the development and utilization of Arctic shipping routes and facilitating the sustainable development of the international shipping industry.
This article is organized as follows. Section 2 provides a detailed introduction to GER-related formulas, research areas, and research data. In Section 3, an optimal waypoint optimization model based on the adaptive hybrid particle swarm optimization genetic algorithm (AHPSOGA) is proposed. Section 4 is based on the POLARIS framework and constructs a segmented security assessment model. Section 5 experimentally verifies the effectiveness of the AHPSOGA algorithm in optimizing waypoints for Arctic shipping routes and quantifies the navigation risks for PC5 ice-class vessels on Arctic shipping routes. Section 6 discusses the innovation of the Arctic shipping route optimization and safety assessment study, pointing out the advantages of the AHPSOGA algorithm in waypoint optimization and computational efficiency and proposing future directions for improvement. And Section 7 discusses the results of the analysis, followed by the conclusions.

2. Methodology

2.1. Overview

The technical route is shown in Figure 1. First, the historical routes, recommended routes, and geospatial data that have passed through the Arctic shipping channel are used as constraints. These constraints are used to initially screen out the necessary waypoints without considering ice information. Second, the AHPSOGA algorithm is used to precisely determine the waypoints between GERs. Finally, based on the collected ice data, such as sea ice density and thickness in the Northeast Passage, and combined with POLARIS issued by the International Maritime Organization (IMO), a route safety assessment model is constructed to quantify the risk of Arctic sea ice to ships of different ice classes on the route.

2.2. Great Ellipse Route-Related Formulae

Section 2.2 of this chapter provides a detailed description of two methods for route calculation and determination of waypoint coordinates, as well as an assessment of the remaining benefit (RB) of the GER compared to the RL. Firstly, the distance of the GER (i.e., the shortest path between two points on the ellipsoidal surface of the Earth) is calculated based on fundamental mathematical models. This calculation takes into account the impact of the Earth’s ellipsoidal flattening on the results. Secondly, the methods for calculating the distance and course of an RL are introduced. The RL is a curve that maintains a constant angle with the meridians at all points. Subsequently, a method is provided for calculating the latitude of a waypoint when its longitude is known, using mathematical formulas. Finally, the concept of RB is introduced, which is a crucial indicator for assessing the economic viability of choosing a GER. It quantifies the distance advantage of a GER over an RL. These contents are of great significance for Arctic route planning, navigation efficiency assessment, and route design optimization. This chapter will focus on presenting these key points in detail.

2.2.1. Great Ellipse Route Distance

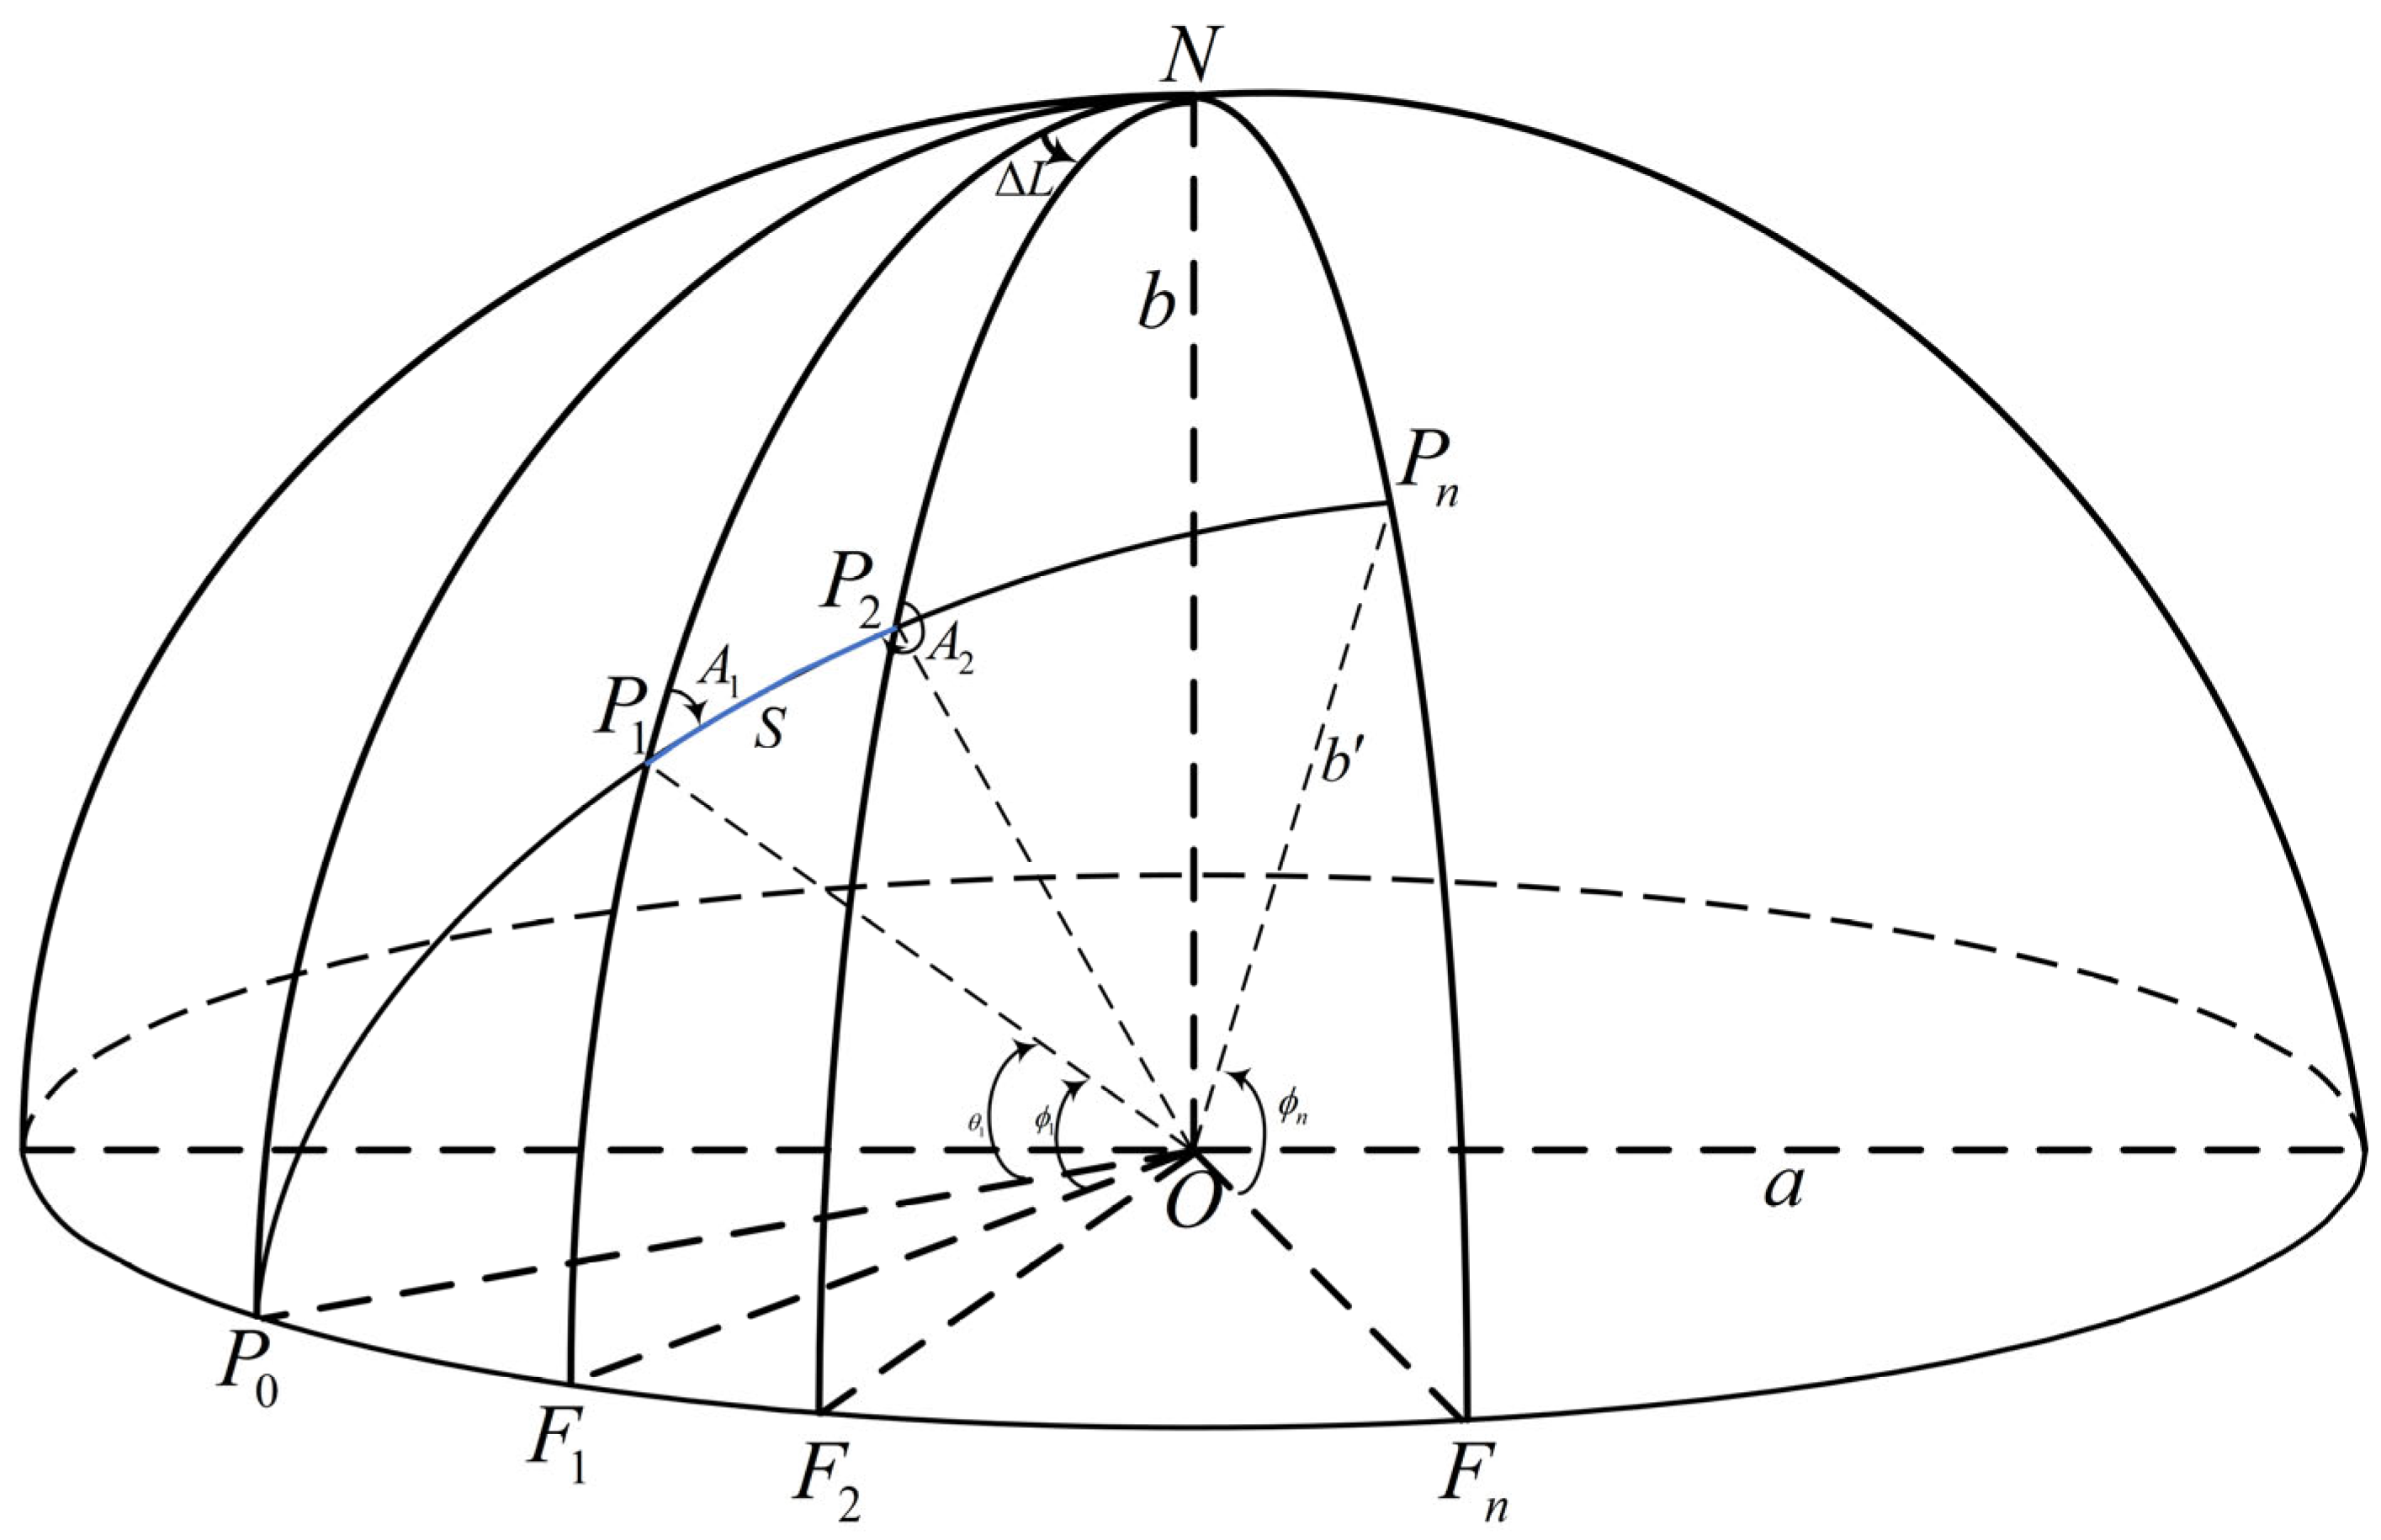
The GER is a minor arc formed by the plane through the starting point, endpoint, and center of the ellipsoid, intersecting the ellipsoidal surface, as shown in Figure 2. P 0 O P n is a sectional ellipse, and it is evident that the semi-major axis of this ellipse is equal to the Earth ellipsoid. P n is the orthogonal point between the sectional ellipse and a meridian of the ellipsoid.
Since the GER of a ship is generally not the largest ellipse on the ellipsoid, the first eccentricity of the ellipse is corrected in this article. If the short semi-axis of the sectional ellipse is b and the first eccentricity of ellipse is e , then the polar equation of the sectional ellipse with ( ρ , θ ) as the variable is
ρ = b 1 e 2 c o s 2   θ
Taking the derivative of Equation (1) with respect to ρ gives
ρ = b e 2 s i n   θ   c o s   θ ( 1 e 2 c o s 2   θ ) 3 / 2
The shorter semi-axis of the sectional ellipse is located at the highest point of latitude P n , so that b and e are
b = b 1 e 2 c o s 2   ϕ 1   s i n 2   A 1
e = a 2 b 2 a 2 = e 1 c o s 2   ϕ 1   s i n 2   A 1 1 e 2 c o s 2   ϕ 1   s i n 2   A 1
The length of a great elliptic arc between two points can be calculated using an elliptic integral. In navigation calculations on an ellipsoid, it is usually sufficient to retain the s i n   2 θ to meet accuracy requirements. Therefore, the distance S between P 1 and P 2 along the GER can be expressed as
S = θ 1 θ 2 d S = θ 1 θ 2 ρ 2 + ρ 2 d θ = b 1 + 1 4 e 2 + 13 64 e 4 + 45 256 e 6 + θ + 1 8 e 2 + 3 32 e 4 + 95 1024 e 6 + s i n   2 θ + θ 1 θ 2
The polar angles θ 1 , θ 2 can be found by solving a spherical triangle:
c o t   θ 1 = c o s   A 1 t a n   ϕ 1 c o t   θ 2 = c o s   A 2 t a n   ϕ 2

2.2.2. Rhumb Line Distance and Course

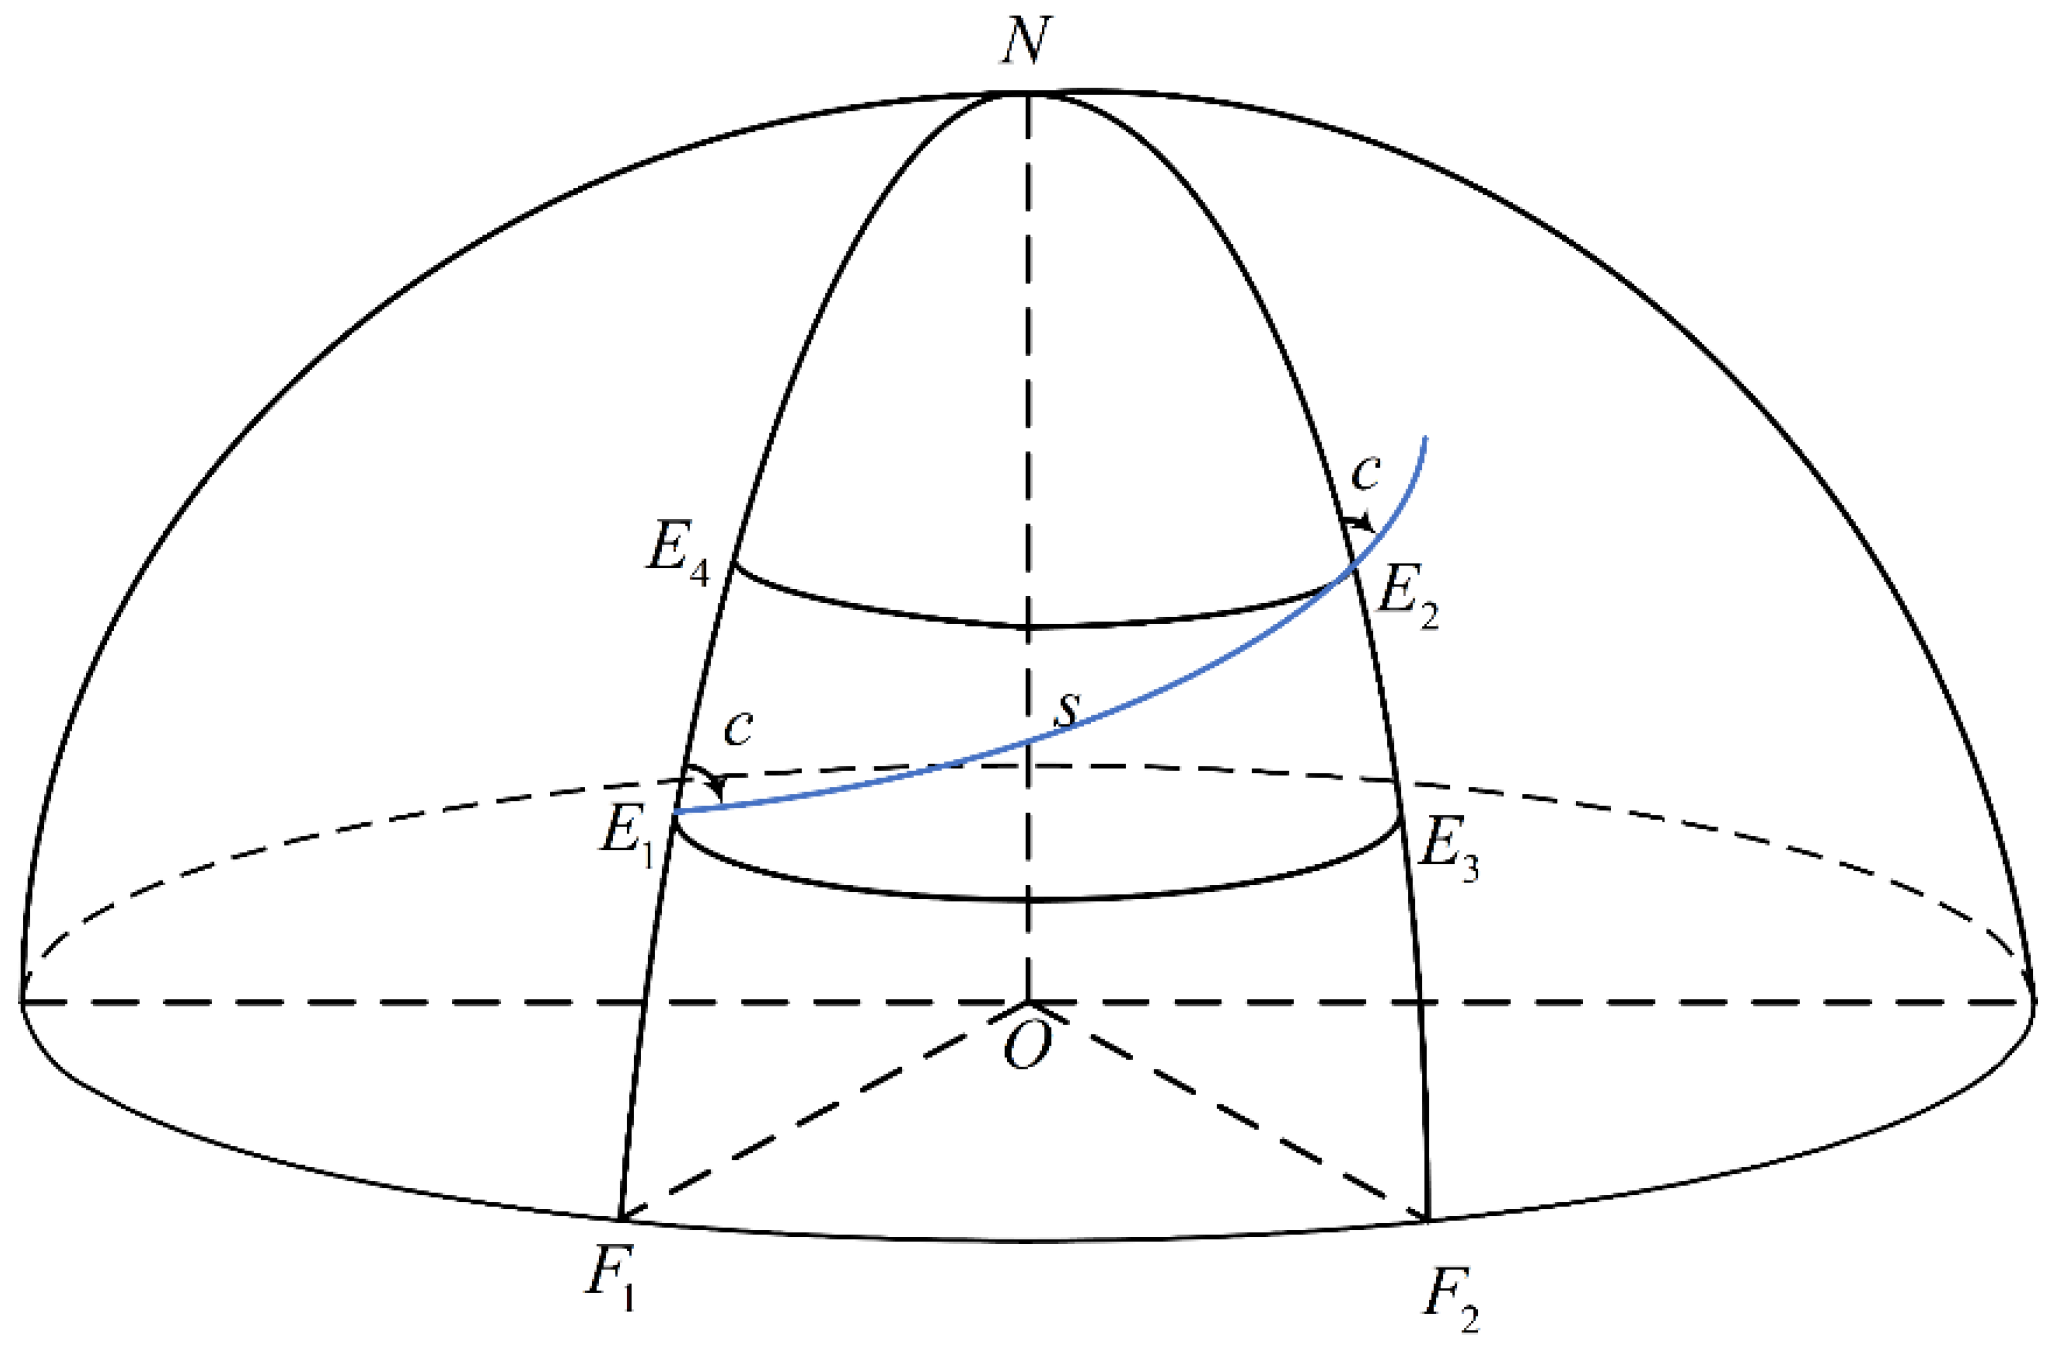
The RL is a curve on an ellipsoid that always maintains the same angle with the longitude lines, as shown in Figure 3. E 1 E 2 is an RL. Suppose the geodetic coordinate of the starting point E 1 is B 1 , L 1 , E 2 is B 2 , L 2 , the course is c, the voyage is s, and E 1 E 3 and E 2 E 4 are two parallel circles, while F 1 N and F 2 N are two meridians.
From the theory of map projections [42], it can be calculated that c is
M P = 7915.70447   l g t a n   π 4 + B 2 1 e   s i n   B 1 + e   s i n   B e 2
t a n   c = L 2 L 1 M P 2 M P 1
where M P is indicated as the latitude gradient rate, which represents the ratio of the map length of a meridian line from any latitude line to the equator to the map length of 1 longitude on the map. M P 1 is the latitude gradient rate of E 1 , and M P 2 is the latitude gradient rate of E 2 . The quadrant determination of c is shown in Table 1.
The formula for calculating the distance s of an RL is as follows:
s = X B 2 X B 1 c o s     c
where X B 1 and X B 2 are denoted as the meridian arc lengths of E 1 and E 2 , which can be obtained through reference [43].
In particular, when the course is 90 or 270 , s can be expressed as follows:
s = a   c o s   B 1 1 e 2 s i n 2   B 1 L 2 L 1

2.2.3. Coordinates of Waypoints

When the longitude of a waypoint is known, its latitude can be obtained using Equation (11).
t a n   B = t a n   B 1   s i n   L L 2 t a n   B 2   s i n   L L 1 s i n   L 1 L 2
where B is expressed as the latitude of the waypoints and L is denoted as the longitude of the waypoints.

2.2.4. Distance Remaining Benefit for the GER

The remaining benefit (RB) is a key indicator for determining whether a GER is worthwhile, as shown in Figure 4. This index quantifies the distance advantage of a GER compared to an RL to assess the economics of using the GER, thereby providing a basis for route selection. Specifically, it can be obtained by the following formula:
R B = S s P 1 E 1 + s E 1 E 2 + + s E n P 2
The R B is shown as the difference in distance between GER and RL. The distance of GER is determined by Equation (5), while the distance of RL is determined by Equation (9). According to the Royal Navy [44], the GER is only practical if it saves more than 1 h of sailing time. According to the “Arctic Navigation Guide (Northeast Passage)” [7], under conditions of ice thickness less than 1 m, the maximum speed of an icebreaker usually does not exceed 12 knots. Hence, when the RB value is less than 12 n mile, there is no need to further approximate the GER by increasing the number of waypoints.

2.3. Research Area and Data Acquisition of Ice Conditions

This article focuses on the entire area north of 60   N . Given the limited availability, scattered distribution, and partial non-disclosure of Arctic ice data, the daily average sea ice density and thickness data obtained from the University of Bremen in Germany are selected as the source of ice data after comprehensive comparison. The data are presented using UPS projections to indicate the geographical location of the grid. The specific attributes of the relevant ice data are shown in Table 2.

3. Model Optimization of Waypoints for the GER Based on the AHPSOGA Algorithm

This section introduces an optimization method based on the AHPSOGA algorithm, which is used to optimize the spatial distribution and number of waypoints on the GER. The method evaluates the merit of solutions through a fitness function, using the RB as the measure of effectiveness. The specific details and algorithm flow will be described in this section.

3.1. Waypoint Model Construction

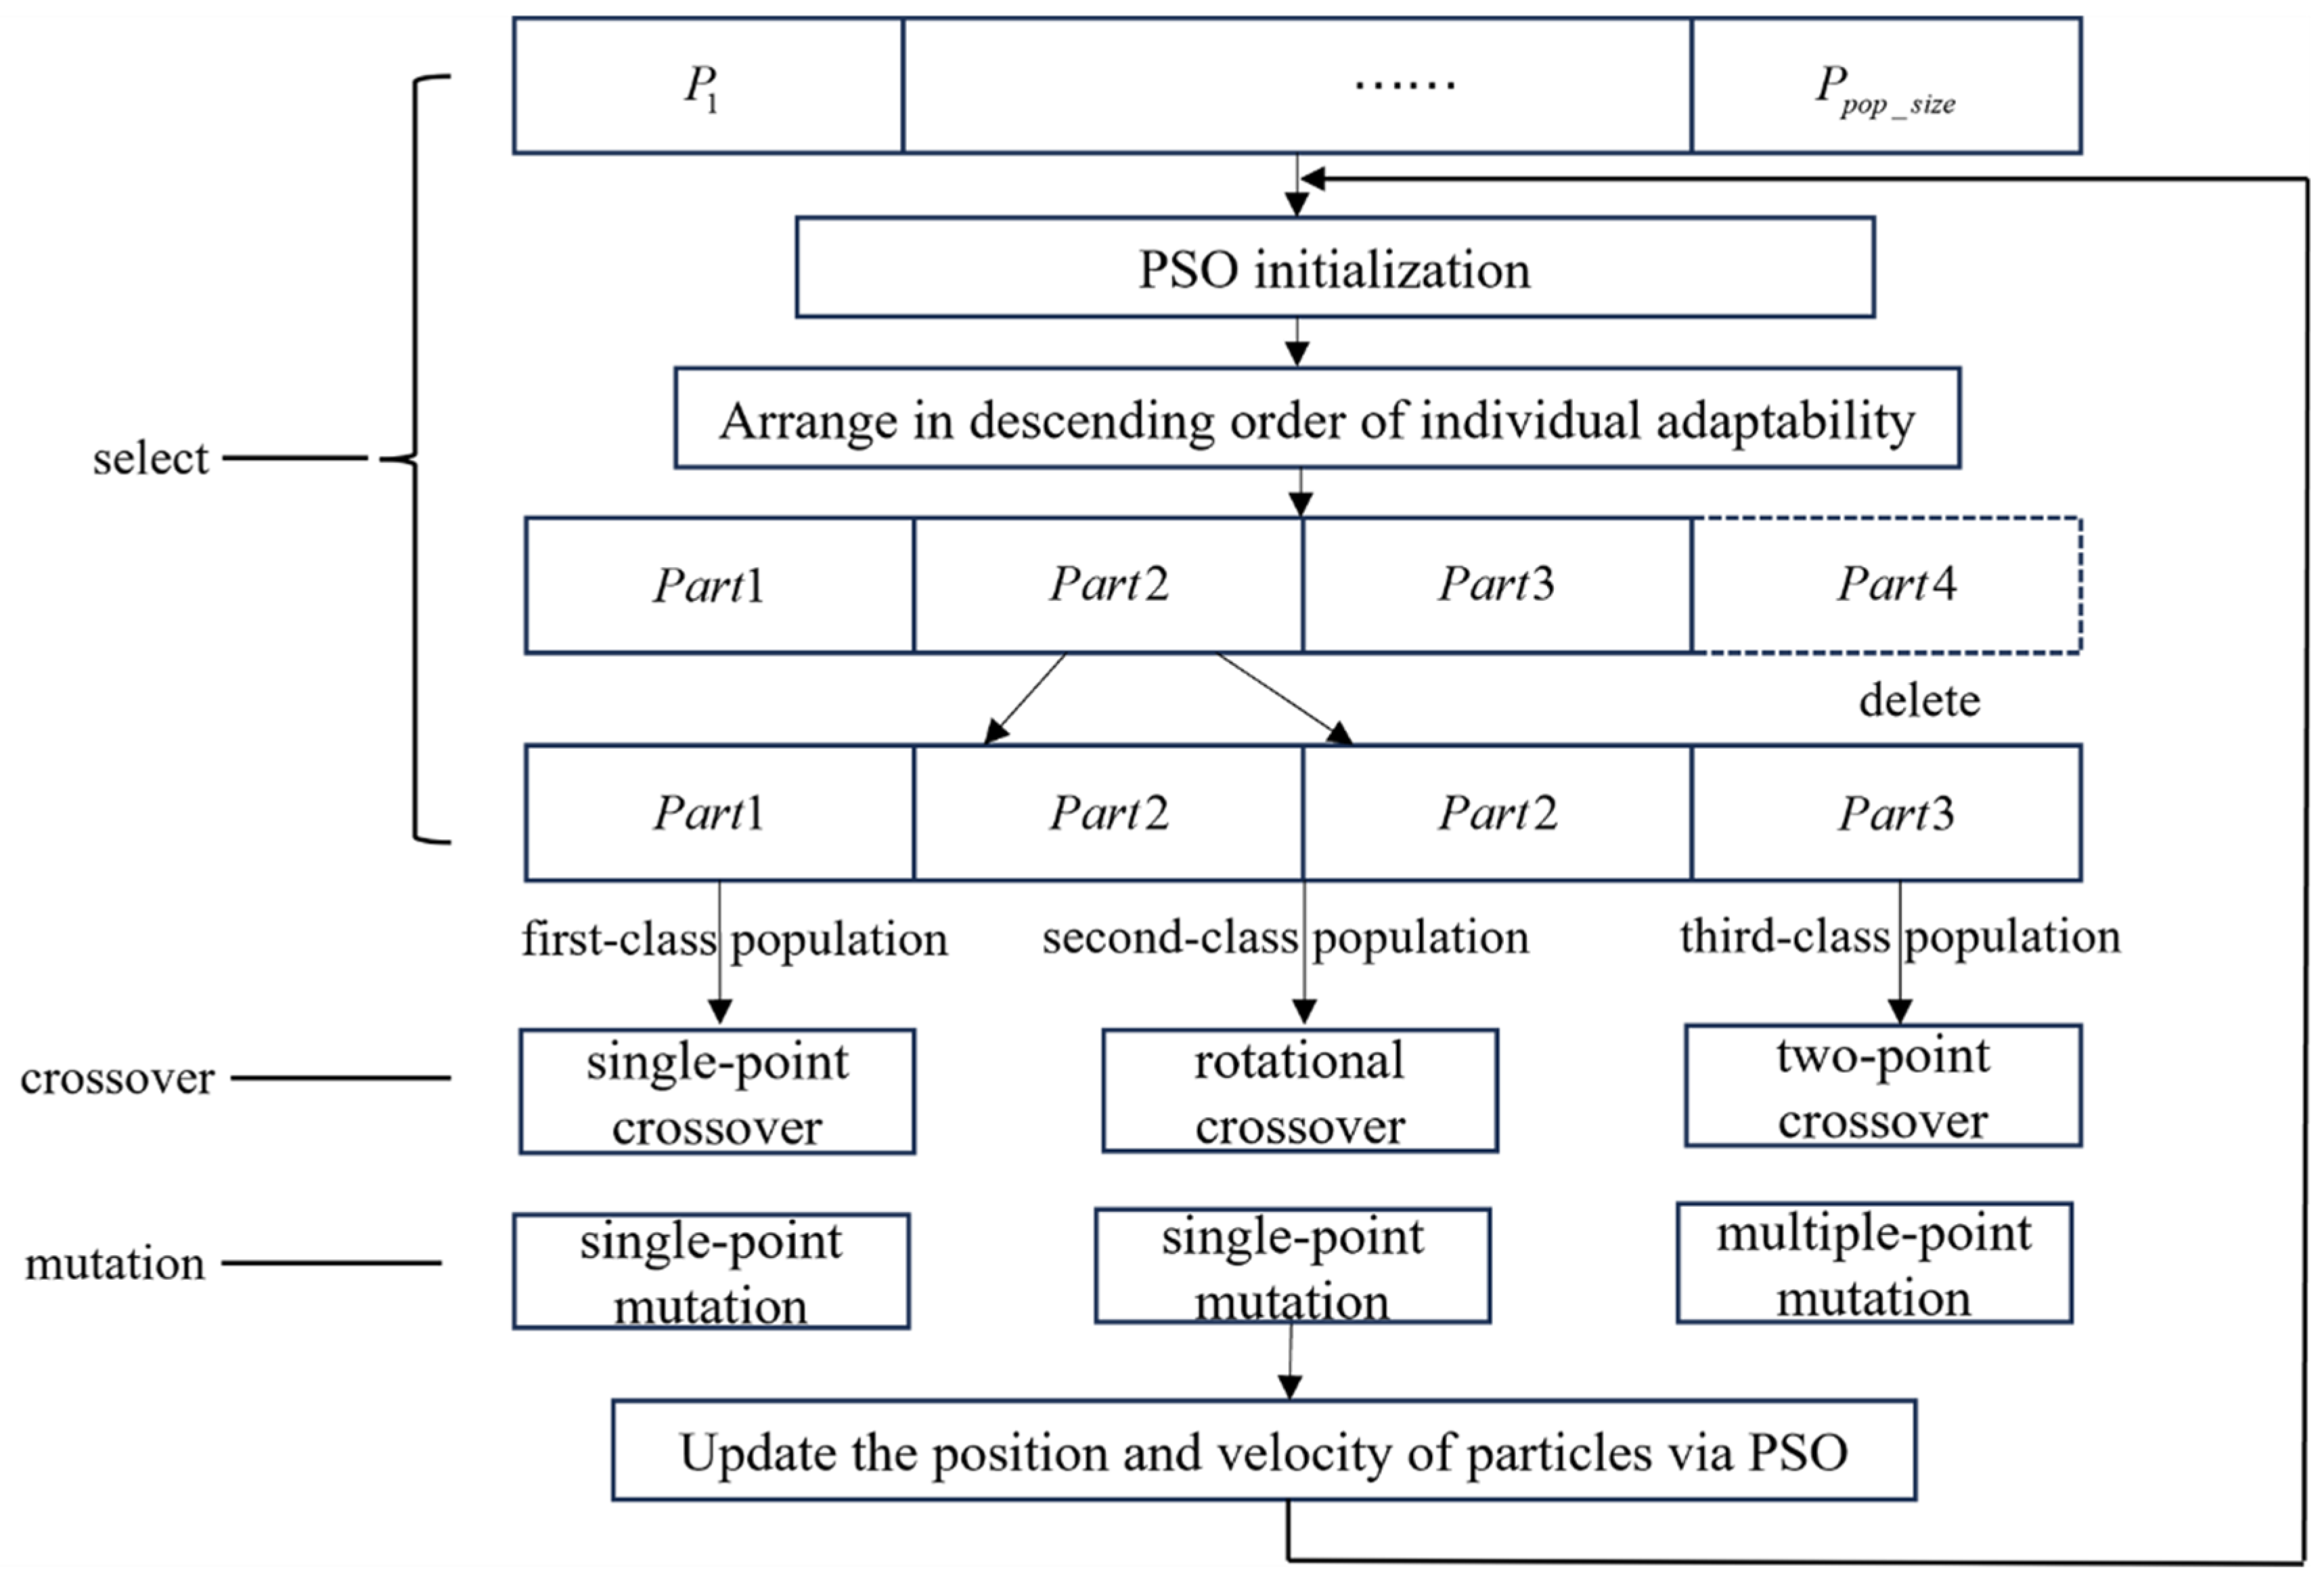
In order to optimize the spatial distribution and number of waypoints on the GER, an optimization method based on the AHPSOGA algorithm is proposed in this study. The detailed optimization process is shown in Figure 5. Appendix A specifically shows the implementation process for the algorithm. Then, we execute and implement the proposed method combined with MATLAB R2019a programming languages. The specific steps are as follows:
Step 1: Initialize the relevant parameters, including the position and velocity of the particles, and calculate the theoretical distance of the GER.
Step 2: Set the initial number of waypoints to 1.
Step 3: Calculate the fitness value of the particle and update the individual optimum and global optimum.
Step 4: Calculate the adaptive crossover rate and mutation rate according to Equations (13) and (14).
c t = c m i n c c m i n m a x × Δ f t Δ f t m a x m i n
m t = m m i n m m m i n m a x × Δ f t Δ f t m a x m i n
where c t is referred to as the adaptive crossover rate, m t is referred to as the adaptive mutation rate, c m i n and m m i n are denoted as the set minimum crossover rate and mutation rate, c m a x and m m a x are indicated as the set maximum crossover rate and mutation rate, Δ f t is referred to as the current improvement in fitness, Δ f m a x t is shown as the historical maximum value, and ε = 10 8 is a very small threshold used to determine whether there has been an improvement in fitness.
Step 5: Calculate the adaptive inertia weight according to Equation (15).
ω t = ω m i n ω ω m i n m a x × f m i n _ p r e v m i n f m i n m a x , Δ f > ε m i n
where ω t is represented as the adaptive inertia weight, ω m i n is expressed as the minimum inertia weight setting, ω m a x is indicated as the maximum inertia weight setting, f m i n is denoted as the minimum optimal fitness of the individuals in the current population, f m i n _ p r e v is represented as the global optimum fitness of the previous generation, and f m a x is referred to as the maximum optimal fitness of the individuals in the current population.
Step 6: Sort by fitness from high to low and remove the bottom 25% of individuals with the worst fitness values.
Step 7: Divide the remaining individuals into first-, second-, and third-class populations according to the grouping strategy.
Step 8: Duplicate the secondary population in the remaining individuals to form a new population.
Step 9: The individuals in the third-class population perform a two-point crossover and multiple-point mutation operation.
Step 10: The individuals in the secondary population perform a rotational crossover and single-point mutation operation.
Step 11: The individuals in the primary population perform a single-point cross and a single-point mutation operation.
Step 12: Update the speed and position of the particles according to Equations (16) and (17).
v i d k + 1 = ω t × v i d k + c 1 × r a n d × p p B e s t x i d k + c 2 × r a n d × p g B e s t x i d k
x i d k + 1 = x i d k + v i d k + 1 , i = 1 , 2 , , m ; d = 1 , 2 , , D
In the equation, v i d k is represented as the particle velocity of the i-th particle in the d-th dimension at the k-th iteration, x i d k is represented as the particle position of the i-th particle in the d-th dimension, c 1 and c 2 are represented as the cognitive and social factors, respectively, r a n d is defined as a random number on the interval [0, 1], p p Best is represented as the current optimal position of the i-th particle, and p g Best is defined as the current optimal position of the group.
Step 13: Determine whether the fitness value is optimal. If not, go to Step 3; otherwise, go to Step 14.
Step 14: Determine whether RB ≤ 12 is valid. If it is not valid, increase the number of waypoints by 1 and go to Step 2. Otherwise, output the number and position of waypoints and terminate the algorithm.

3.2. Definition of the Fitness Function

The fitness function is used to evaluate the degree of individual merit. High fitness means that superior individuals have a greater chance of participating in reproduction. The R B is used as a measure of individual adaptability in this paper. To find the location of the waypoints that best approximate the GER, the population’s fitness function can be expressed as
f i t = R B 1 , , R B j , R B M
where fit is represented as the fitness value vector of dimension M , and R B j is represented as the RB of the j-th individual, which can be obtained from Equation (12).

4. POLARIS-Based Sea Ice Risk Assessment Model

4.1. Preprocessing of Sea Ice Data

Since the ice condition dataset itself does not contain projection information, it is first necessary to convert the latitude and longitude coordinates B , L of the data to coordinates x , y in the rectangular coordinate system, and then map the rectangular coordinates x , y to coordinates u , v in the pixel coordinate system. The latitude and longitude coordinates of the original grid are based on the North Pole ( 90   N ) as the coordinate origin, with a latitude range of B 30   N , 90   N and a longitude range of L 0 , 360 . West longitude is negative and must be converted to a positive value using equation ( L = L W + 360 ). The range of values for the rectangular coordinate system is x 3850 , 3750 and y 5350 , 5850 , while the range of values for the pixel coordinates is u 0 , 7600 and v 0 , 11220 .
To achieve accurate calculation and spatial visualization of Arctic sea ice data, it is necessary to perform rigorous map projection conversion on the original ice condition observation data within the established polar region geographic visualization framework. This conversion process can be implemented based on the projection mathematical model proposed by Snyder [45], whose core formula is
x = ρ × s i n   θ y = P n × ρ × c o s   θ
u = r o u n d x + 3850 v = 5850 r o u n d y
where ρ is the radial distance, m 0 is the scaling factor of the meridian curvature radius at B 0 , and ρ = a × m 0 × t t 0 , m 0 = c o s   B 0 1 e 2 s i n 2 B 0 , t = t a n   90 B 2 1 e × s i n   B 1 + e × s i n   B e , B 0 is the standard latitude, which is taken as 70 , L 0 is taken as the standard longitude, which is 315 , P n is determined as the polar parameter, 1 for the north pole, and r o u n d ( ) is defined as the rounding function.
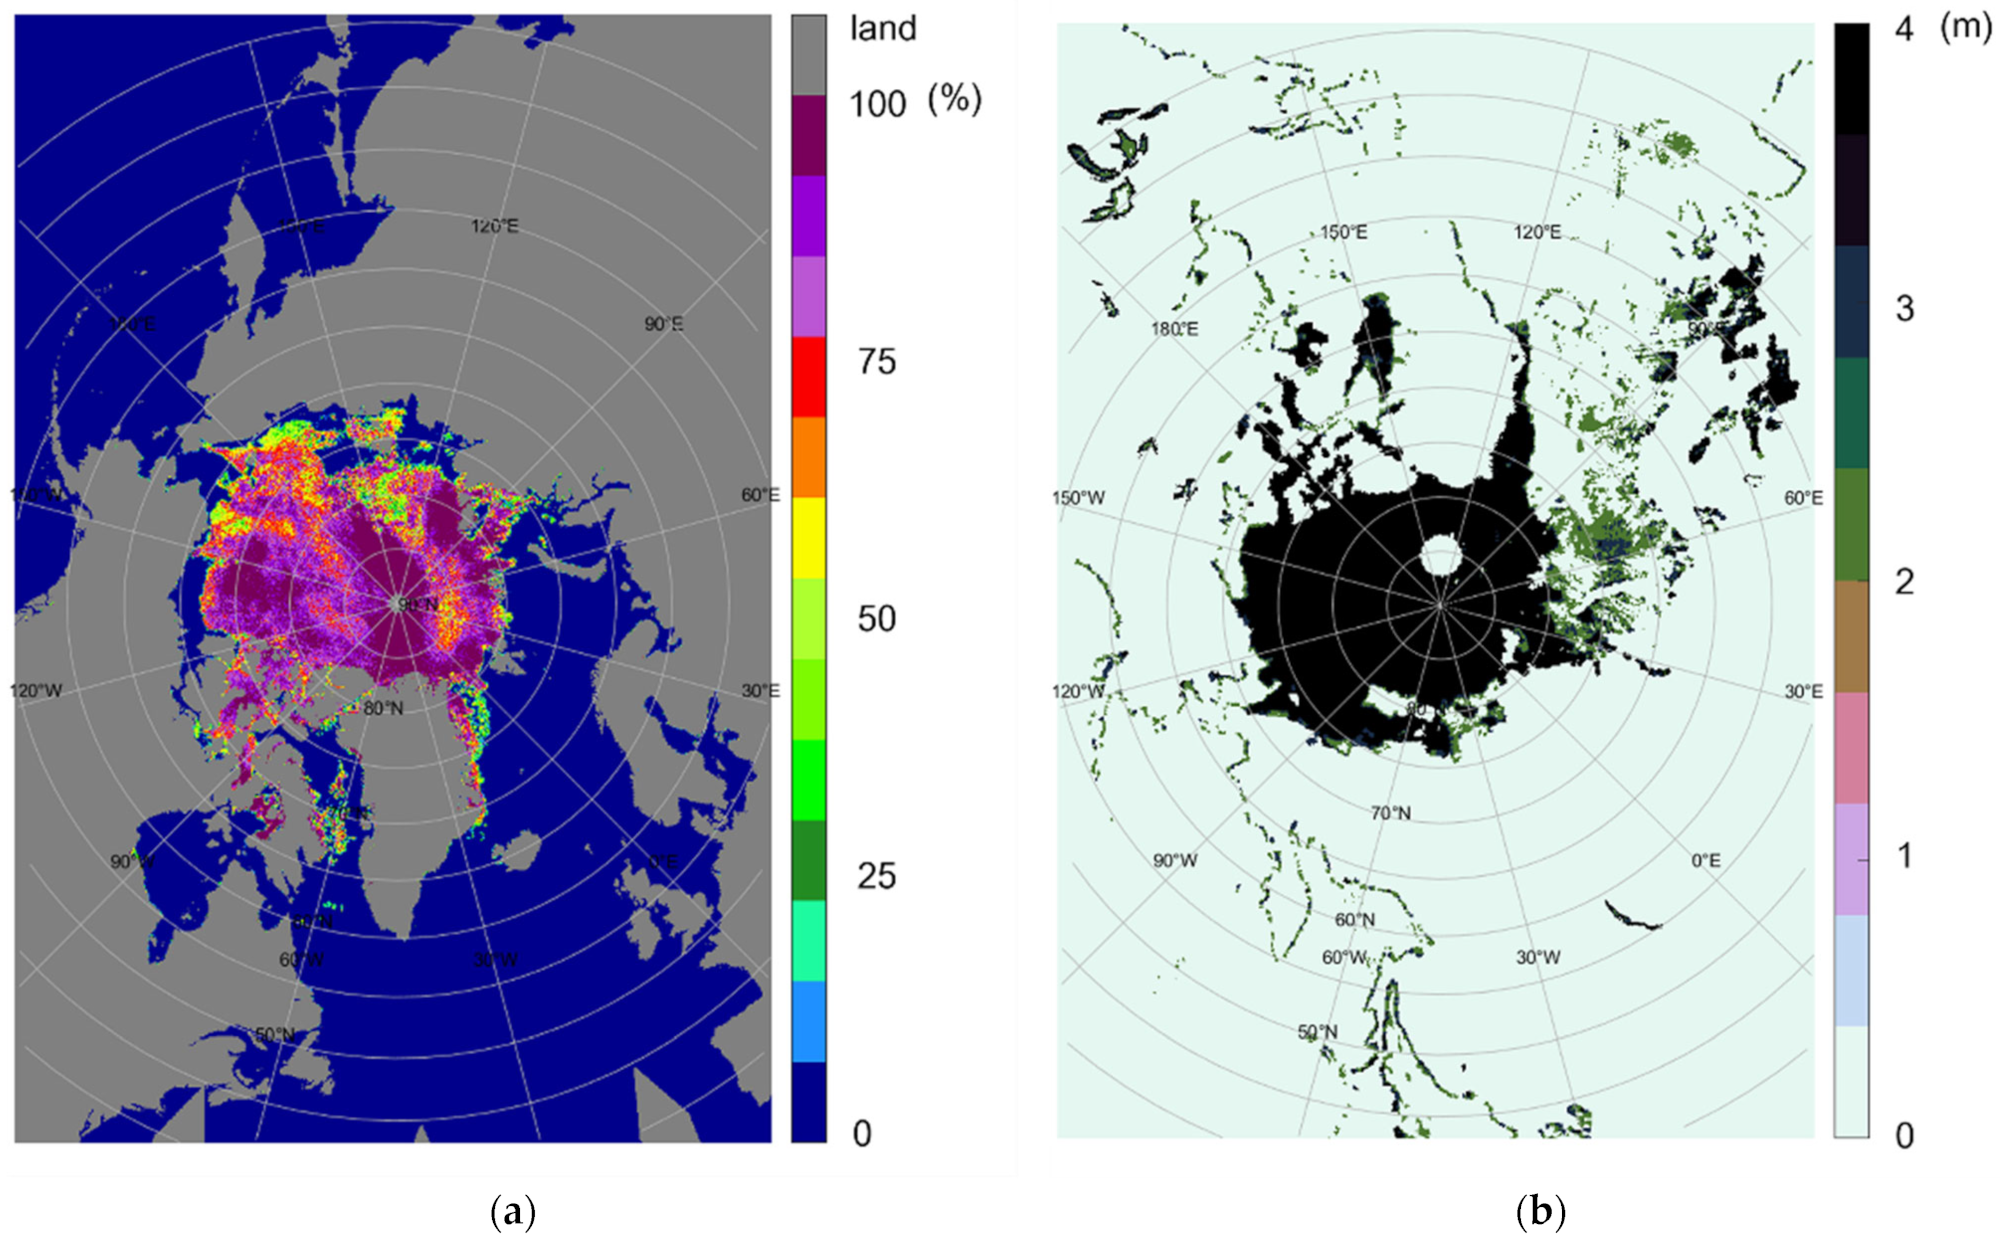
In the same UPS projection grid system, the dimension of the sea ice density data matrix is 3584 × 2432, while the dimension of the sea ice thickness is 896 × 608. To spatially match the data with the high-resolution pixel coordinate system (with a resolution of 11,200 × 7600), the mean interpolation method is used to fill in blank or missing values. Specifically, the sea ice concentration data matrix needs to be enlarged to 3.125 times the original size by interpolation, and the sea ice thickness data matrix needs to be expanded to 12.5 times the original size. Through the above pre-processing steps, the ice dataset is optimized in terms of spatial resolution and data integrity, laying a reliable foundation for subsequent analysis and visualization. At this point, the preprocessing of ice condition data is complete. The visualization results for sea ice density and sea ice thickness are shown in Figure 6.

4.2. Sea Ice Risk Identification Model

Section 4.2 of this chapter introduces the methodology for constructing a sea ice risk identification model based on POLARIS. First, we introduce the POLARIS framework, which computes the Risk Index Outcome (RIO) using sea ice density and thickness to quantify the risk level associated with polar navigation. Secondly, in order to more accurately capture the actual distribution and dynamic characteristics of sea ice, an improved calculation method for RIO based on remote sensing ice observation data is proposed. Finally, taking the navigation segment as the basic unit of analysis, the average value of sea ice risk within the segment is calculated, and then the safety of the section is evaluated. This provides a scientific basis for ship navigation decision-making. The detailed risk assessment details will be described in this section.

4.2.1. RIO Calculation

POLARIS is a standardized risk assessment tool developed under the auspices of the IMO, and its design is based on the International Association of Classification Societies (IACS) Polar Ice Class standard and the equivalent ice classification system in the Finnish-Swedish Ice Class Rules [46]. The system is intended to evaluate the operational limitations and associated risks for vessels navigating polar waters [37,47]. By constructing a quantitative model that integrates vessel type with ice condition data, POLARIS defines Risk Index Values (RIVs), and calculates the R I O through Equation (21). This provides a scientific basis for ship operators and regulatory agencies.
Within the POLARIS framework, the classification of sea ice types is defined according to the sea ice terminology rules established by the World Meteorological Organization (WMO). For ease of reference and analysis, the types of sea ice defined by the WMO and their thickness ranges are systematically organized in this article and summarized in Table 3. According to the R I O , POLARIS further defines three levels of operational restrictions and recommendations, and combines the ice class classification of the ship to clarify the operational levels corresponding to different RIOs, the details of which are shown in Table 4.
R I O = i = 1 n C i × R I V i
where C i is expressed as the density set of sea ice type i in tenths, and R I V i is indicated as the risk value, which is related to the ice class ship, sea ice type, and sea ice thickness and can be obtained by referring to Table 3.
Since the R I O calculated by Equation (21) does not fully consider the actual sea ice distribution and dynamic characteristics in the Arctic, a sea ice risk assessment method based on remote sensing ice observation data was proposed by Li et al. [48], as shown in Equation (22).
R I O * = C × R I V + 3 × 10 C
where C is expressed as the sea ice concentration of a grid and RIV is denoted as the sea ice risk value of the grid.

4.2.2. Safety Assessment of Route Segments

During the actual voyage, the pilot’s main concern is the risk of sea ice that may exist along the planned route. A route segment is defined as a link between two points based on the route information provided by the pilot, including the geographic coordinates of the starting point, waypoints, and endpoint. The coordinate points in the segment are converted to pixel coordinates by the coordinate conversion formula in Section 4.1. Each pixel is then iteratively processed to calculate its corresponding R I O * via Equation (22). In order to comprehensively respond to the risk status of the whole segment, according to reference [49], route segments are used as the basic analysis unit, and the sea ice risk mean value within each route segment is calculated using Equation (23).
S S I = R I O A * + i = 1 n R I O i * n + 1
where S S I is expressed as the segment safety index, R I O A * is defined as the sea ice risk index result for point A , and R I O i * is shown as the sea ice risk index result for point i .

5. Experimental Results

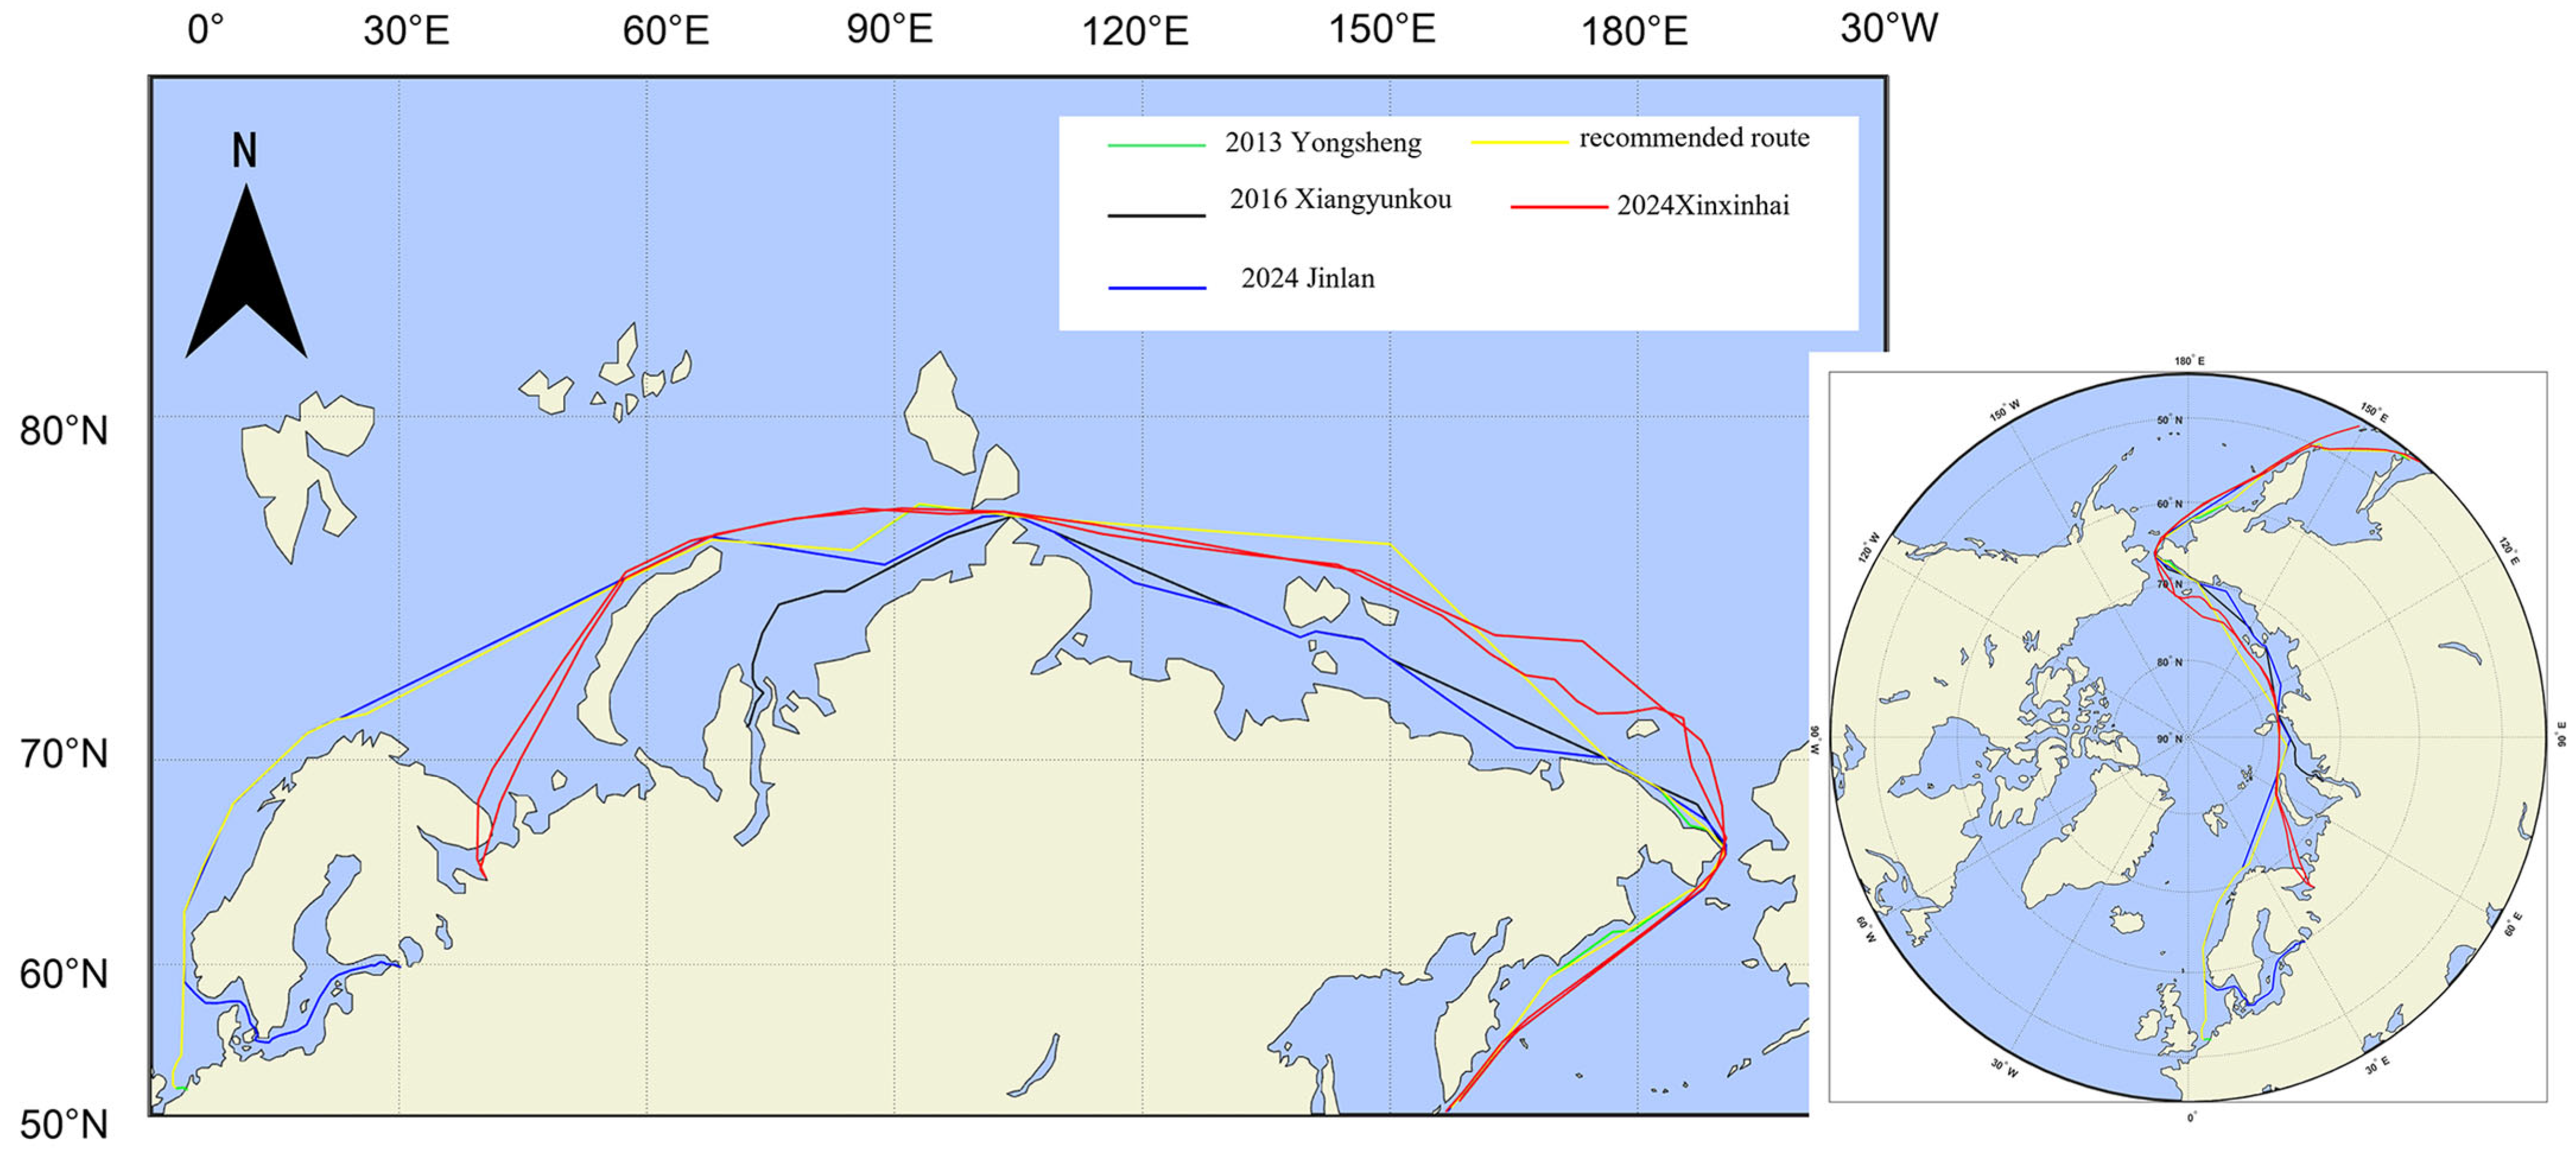
The Northeast Passage from the Bering Strait entrance ( 66   N , 169 32   W ) to the Rotterdam pilot station ( 51 59   N , 3 00   E ) was selected as the experimental area in this paper to verify the effectiveness of the AHPSOGA algorithm in the optimization of waypoints on the GER. Based on multi-source data constraints, including the recommended route of the Northeast Passage, the track of the Yongsheng in 2013, the track of the Xiangyunkou in 2016, the track of the Jinlan in 2024, the track of the Xinxinhai in 2024, and geographical spatial data (as shown in Figure 7), the necessary set of waypoints is initially selected without considering ice information.
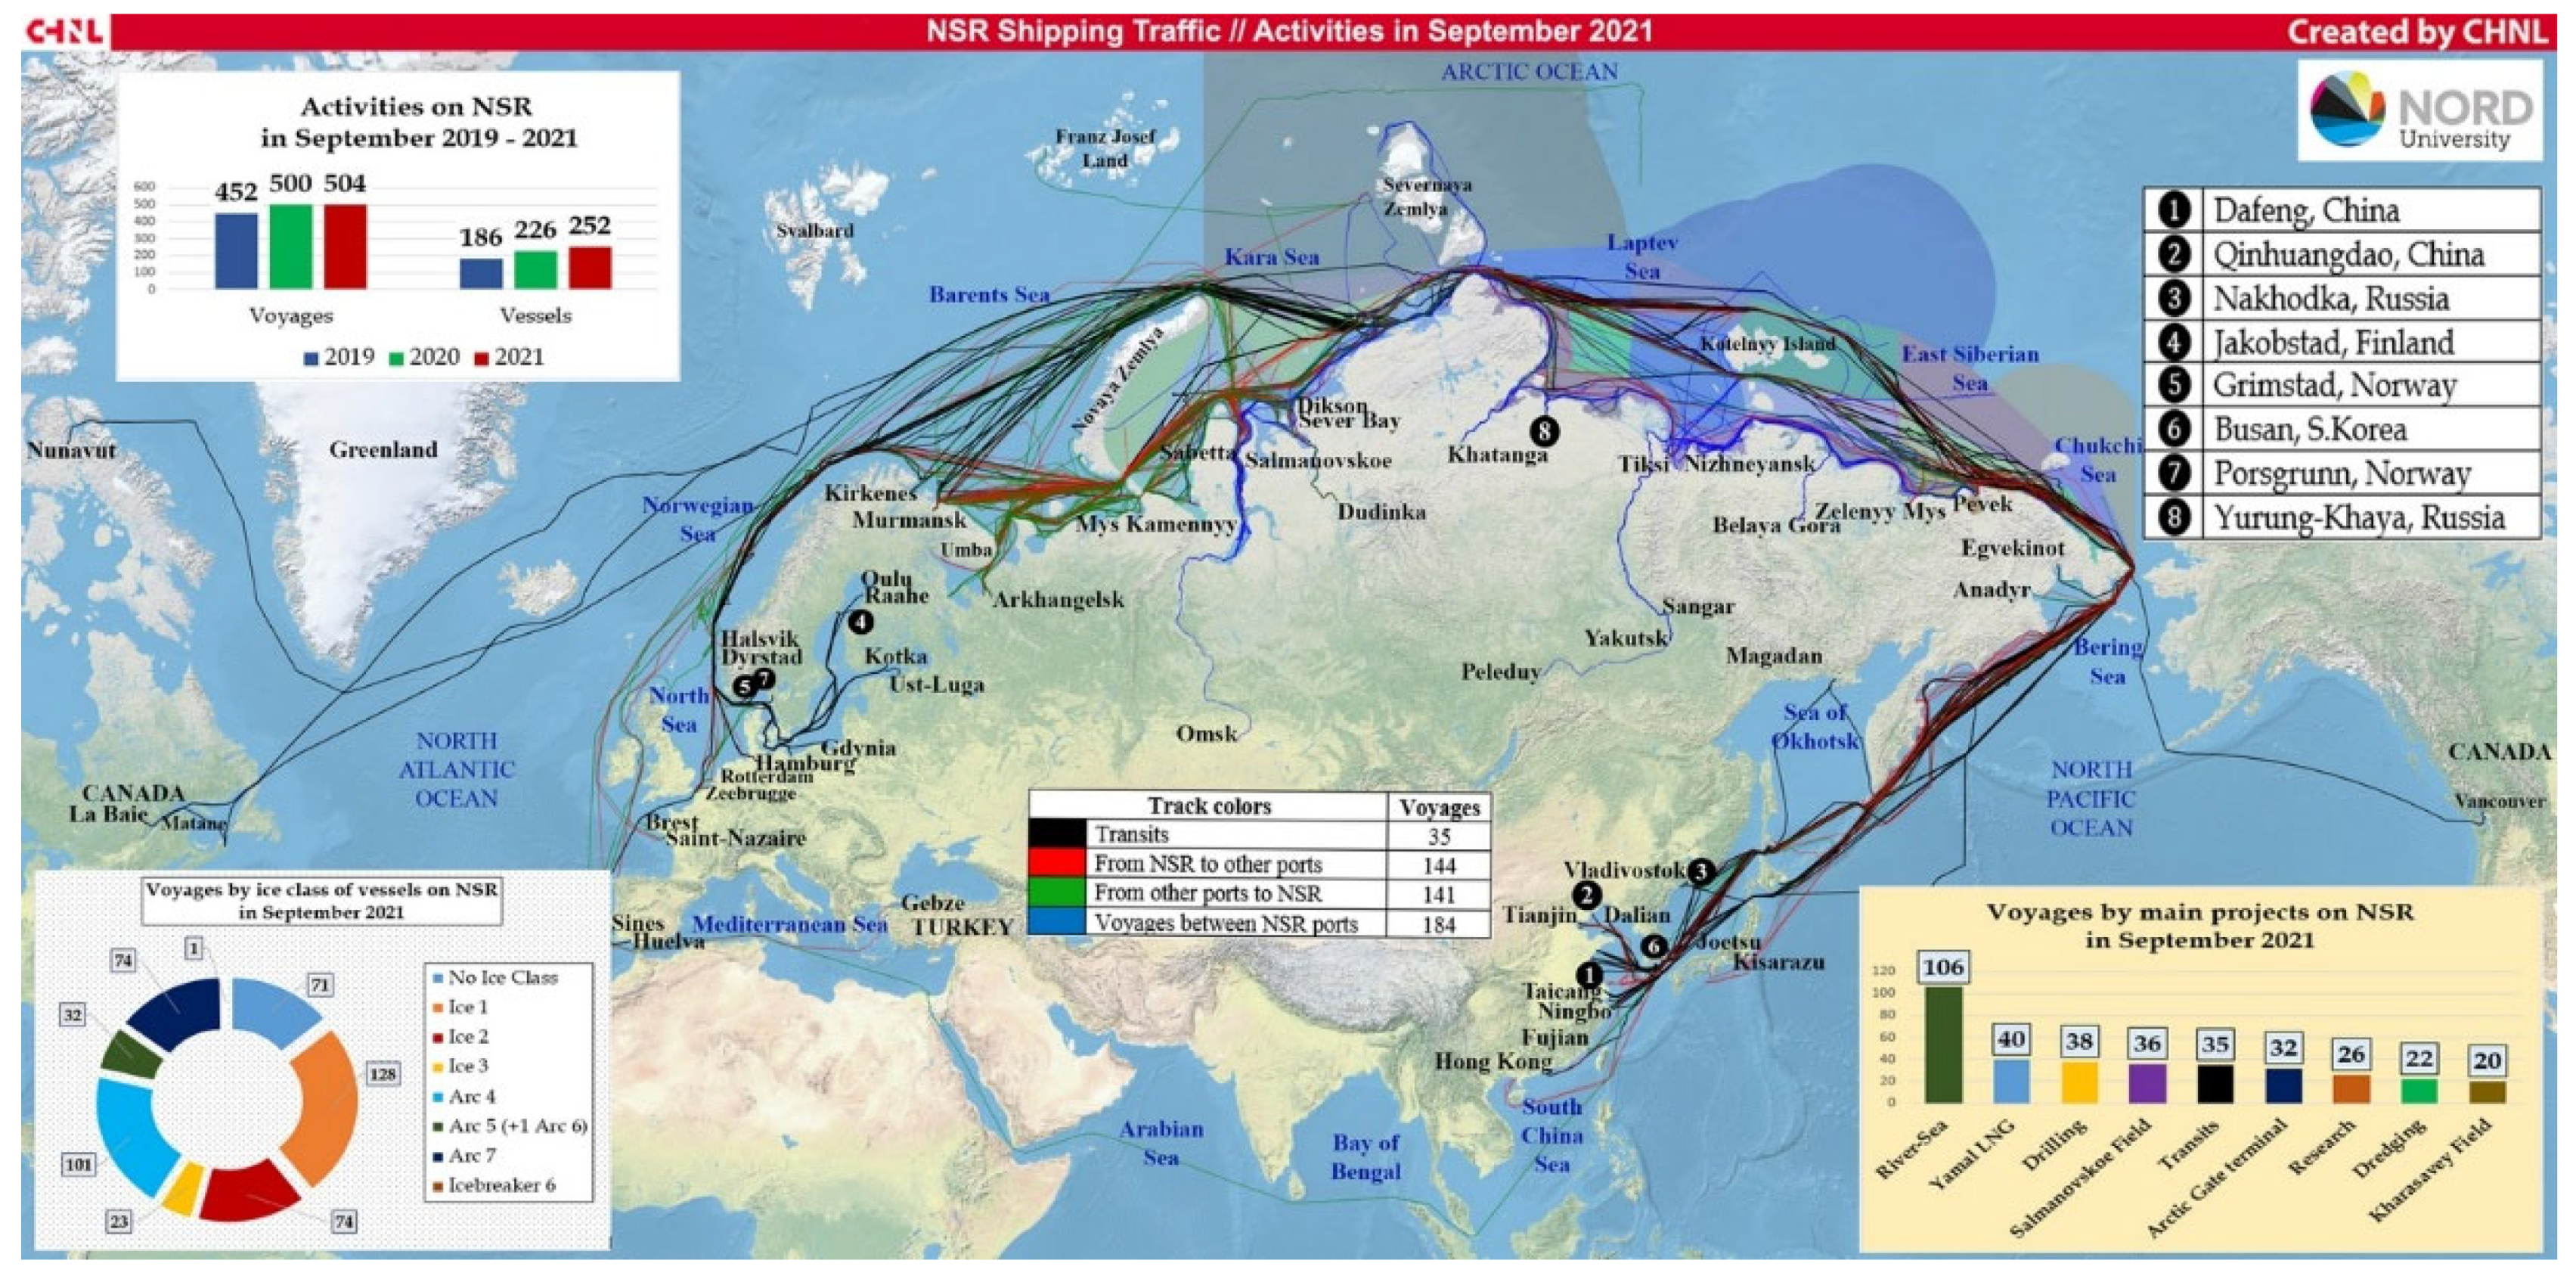
As shown in Figure 7, the distribution characteristics of the ship tracks indicate that the ships’ navigation paths exhibit a spatial pattern crossing the De Long Strait. To verify the general characteristics of track distribution in this region, this study obtained shipping traffic maps for the Northern Sea Route (NSR) between major ports in East Asia and Europe in September 2021 from the Centre for High North Logistics (CHNL, website: https://chnl.no/maps, accessed on 7 August 2025), as shown in Figure 8. Comparative analysis indicates that this shipping traffic map also clearly shows the stable spatial distribution characteristics of vessel tracks crossing the De Long Strait. Based on this significant geospatial pattern, this chapter selects the De Long Strait as the key segment boundary point, adopts a route segmentation method, and combines the recommended route for the Northeast Passage to extract a preliminary set of waypoints. The specific geographic coordinate parameters are detailed in Table 5. Considering that the practical application value of the GER needs to meet the condition of saving at least 1 h, this paper focuses on the research of waypoint optimization for the two routes from P 1 ( 68 50   N , 177 30   W ) to P 2 ( 77 45   N , 105 00   E ) and from P 3 ( 78 04   N , 93 00   E ) to P 4 ( 62 56   N , 4 00   E ).

5.1. Model Operation Analysis Based on the AHPSOGA Algorithm

According to Section 2.2, the theoretical distance of the GER of P 1 P 2 is 1319.8 n mile, and the theoretical distance of the GER of P 3 P 4 is 1760.3 n mile. The distance difference between the GER and the RL segments in the P 1 P 2 segment is 31.4 nautical miles, and the distance difference between the GER and the RL segments in the P 3 P 4 segment is 85.5 nautical miles, which meets the feasibility threshold for the optimization application of the GER. The AHPSOGA algorithm was tested in the following environment: Hardware environment: the processor is AMD Ryzen 7 5800H with Radeon Graphics 3.20 GHz, RAM is 16.0 GB; the graphics card is AMD Radeon (TM) Graphics. Software environment: Windows 11, 64-bit, MATLAB R2019av9.6.0. The core parameters of this algorithm are shown in Table 6.
Based on the AHPSOGA model constructed in Section 3.1, the initial number of waypoints is set to 1, and the waypoints for the two route segments are optimized separately. The summary of the optimization results includes the number of waypoints, the number of iterations, the position of the waypoints, and the RB, as shown in Table 7.
When the number of waypoints is 1, the P 1 P 2 segment terminates after 27 iterations, and the P 3 P 4 terminates after 36 iterations. At this time, the RB is 26.3506 n mile and 51.6626 n mile, respectively, which is greater than 12 n mile, so one waypoint should be added to each, as shown in Figure 9a. When the number of waypoints is 2, the P 1 P 2 terminates after 40 iterations, the P 3 P 4 terminates after 49 iterations, and the RB is 11.7220 n mile and 23.1115 n mile, respectively. The P 1 P 2 satisfies the constraint of being less than 12 n mile, so no additional waypoints are needed. However, the P 3 P 4 should have one additional waypoint, as shown in Figure 9b. When the number of waypoints is 3, P 3 P 4 terminates after 66 iterations, and the RB is 13.0156 n mile, which is still greater than 12 n mile. One more waypoint should be added, as shown in Figure 9c. When the number of waypoints is 4, the P 3 P 4 terminates after 68 iterations, with an RB of 8.3527 n mile, which is less than 12 n mile, indicating the end of the iteration, as shown in Figure 9d. To validate the effectiveness of the AHPSOGA algorithm, the coordinates of the waypoints of the Northeast Passage optimized using this algorithm were compared with the coordinates of the recommended waypoints in the Arctic Navigation Guide (Northeast Passage), and the results are summarized in Table 8.
Compared to the recommended route of the Northeast Passage, the number of waypoints in the P 1 P 2 segment is the same, but the voyage distance is reduced by approximately 19.64 nautical miles, accounting for approximately 1.45% of the voyage distance of the corresponding segment of the recommended route for the Northeast Passage. The P 3 P 4 segment not only reduces the voyage distance by approximately 77.17 nautical miles, accounting for approximately 4.18% of the voyage distance of the corresponding segment of the Northeast Passage recommended route, but also reduces the number of waypoints by half. As such, for segments with significant differences in voyage distance, the optimized route demonstrates clear advantages in terms of both the number of waypoints and voyage distance, effectively reducing voyage distance while simplifying vessel operations.
From the entrance of the Bering Strait to the Port of Rotterdam, a 100,000-ton cargo ship with PC5 ice class certification consumes an average of approximately 42 tons of fuel per day when sailing at a speed of 12 knots. Compared to the recommended Arctic shipping route, the optimized route is nearly 100 nautical miles shorter (3.2% of the total voyage). The voyage time is reduced by approximately 8.3 h, with fuel consumption decreasing by about 13.8 tons per voyage. Based on the price of low-sulfur fuel in the Arctic (approximately USD 600/ton), each voyage can save approximately USD 300 in fuel costs. Under the guidance of an icebreaker, the route can be navigated for at least 6 months (180 days) per year, with approximately 15 voyages, resulting in annual savings of approximately USD 158,000. Calculating the payback period, the cost can be recovered in approximately 14 years. For PC7 ice-class vessels, based on the safety assessment results for PC7 ice-class vessels on this route as shown in Appendix B, under the guidance of an icebreaker, the route can be navigated for up to 3 months (90 days) throughout the year. This indicates that PC5 ice-class vessels demonstrate superior adaptability and long-term profitability potential in Arctic route operations.
To verify the stability and efficiency of the AHPSOGA algorithm, the standard GA algorithm, the standard PSO algorithm, and the AHPSOGA algorithm were selected for comparative experiments. The optimization ability of the AHPSOGA algorithm was comprehensively evaluated by recording the total number of iterations of each algorithm and performing 50 independent tests, respectively, to calculate the shortest and average running times.
As can be seen from Table 9, in terms of the number of iterations, the AHPSOGA algorithm proposed in this paper has a total of 219 iterations, which is a reduction of about 16.41% compared to the standard GA algorithm and a decrease of about 19.19% compared to the standard PSO algorithm. Regarding computational efficiency, the AHPSOGA algorithm has a minimum running time of 5.8746 s, which is an improvement of about 4.14% and 9.97% compared to the standard GA algorithm and standard PSO algorithm, respectively. The average running time is 6.6383 s, which is about 12.00% and 14.53% better than that for the standard GA algorithm and standard PSO algorithm, and has a smaller standard deviation. The experimental results show that the AHPSOGA algorithm is superior to traditional optimization algorithms in terms of convergence rate and computational efficiency and demonstrates stronger global optimization capabilities.

5.2. Comparative Analysis of the Optimization Model Based on the AHPSOGA Algorithm and the Conventional Methods Used in the Shipping Industry

When designing a route with equal differences of longitude, this paper selects a fixed longitude difference of 10 , the number of waypoints of P 1 P 2 is 7, and the value of the RB is 1.5155 n mile. The number of waypoints of P 3 P 4 is 8 and the value of the RB is 1.9523 n mile, as shown in Figure 10a. In the equidistance flight path design, when the fixed distance is set to 100 n mile, the number of waypoints acquired by ab increases to 13, and the value of RB is 0.6963 n mile. The number of waypoints for P 3 P 4 increases to 17, and the value of RB is 0.6793 n mile, as shown in Figure 10b. Although the two traditional methods mentioned above can generate paths that are relatively close to the GER, compared with the results optimized by the adaptive hybrid PSO-GA algorithm, the number of waypoints increased by 32.14% and 55.81%, respectively. This not only increased the complexity of the route but also led to unnecessary turning operations, thereby reducing navigational efficiency.

5.3. Optimized Route Segment Safety Assessment

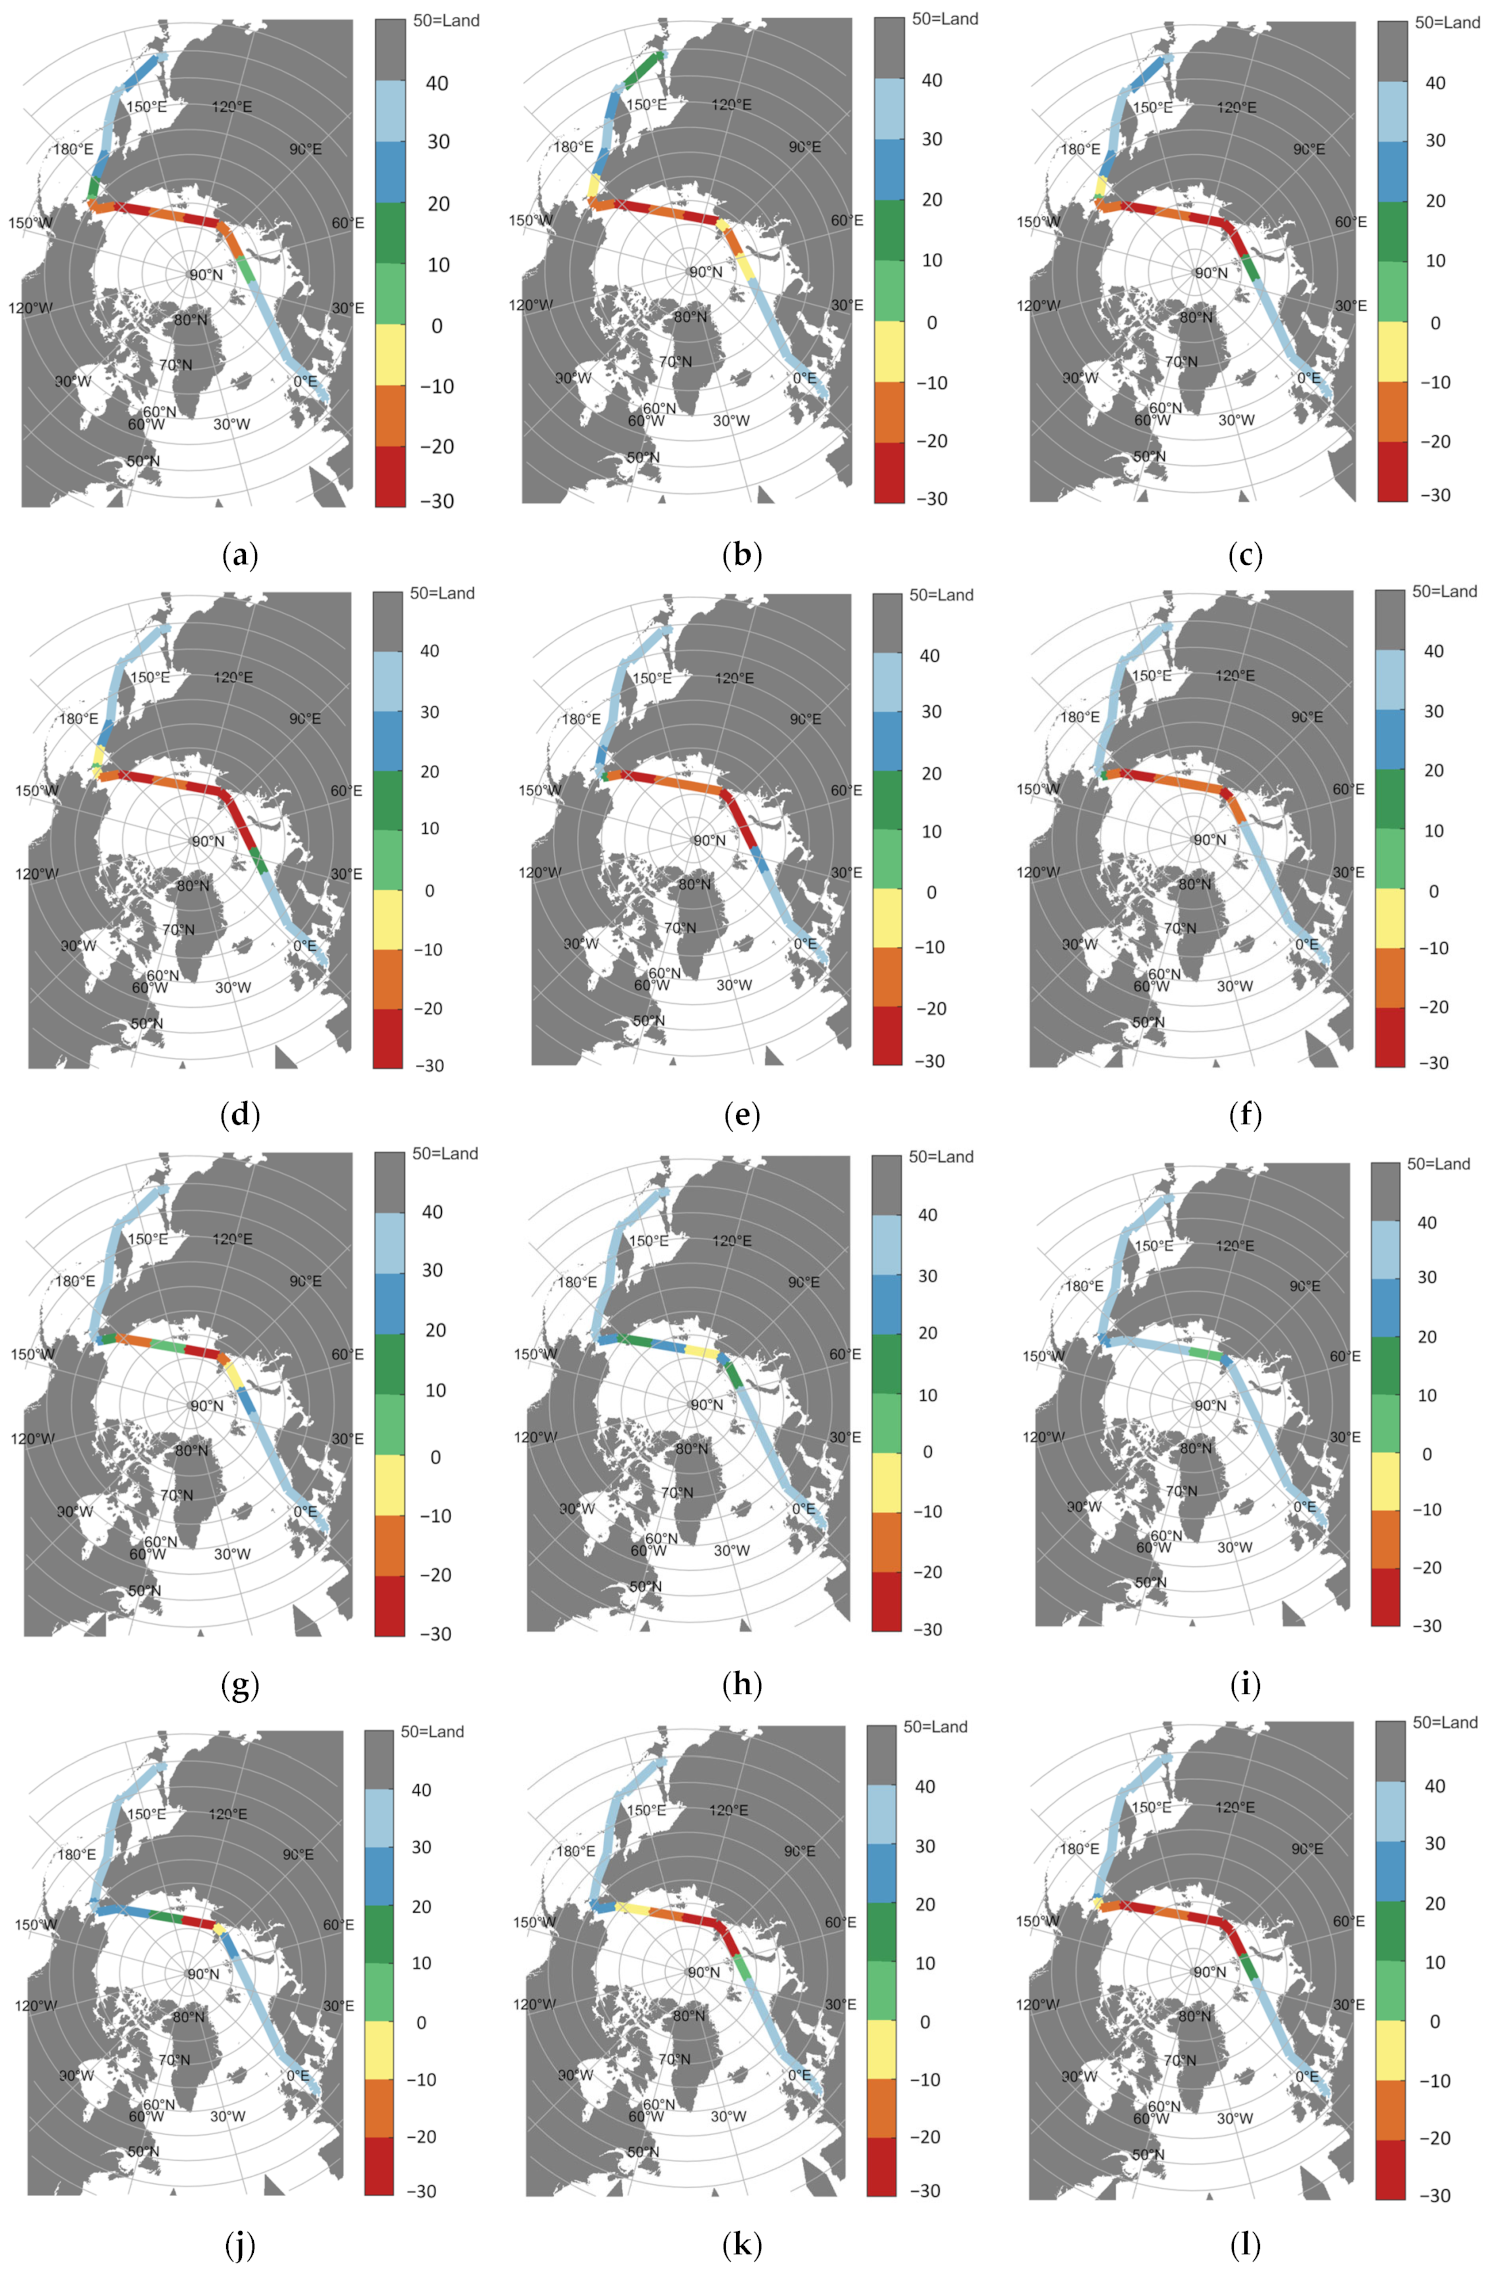
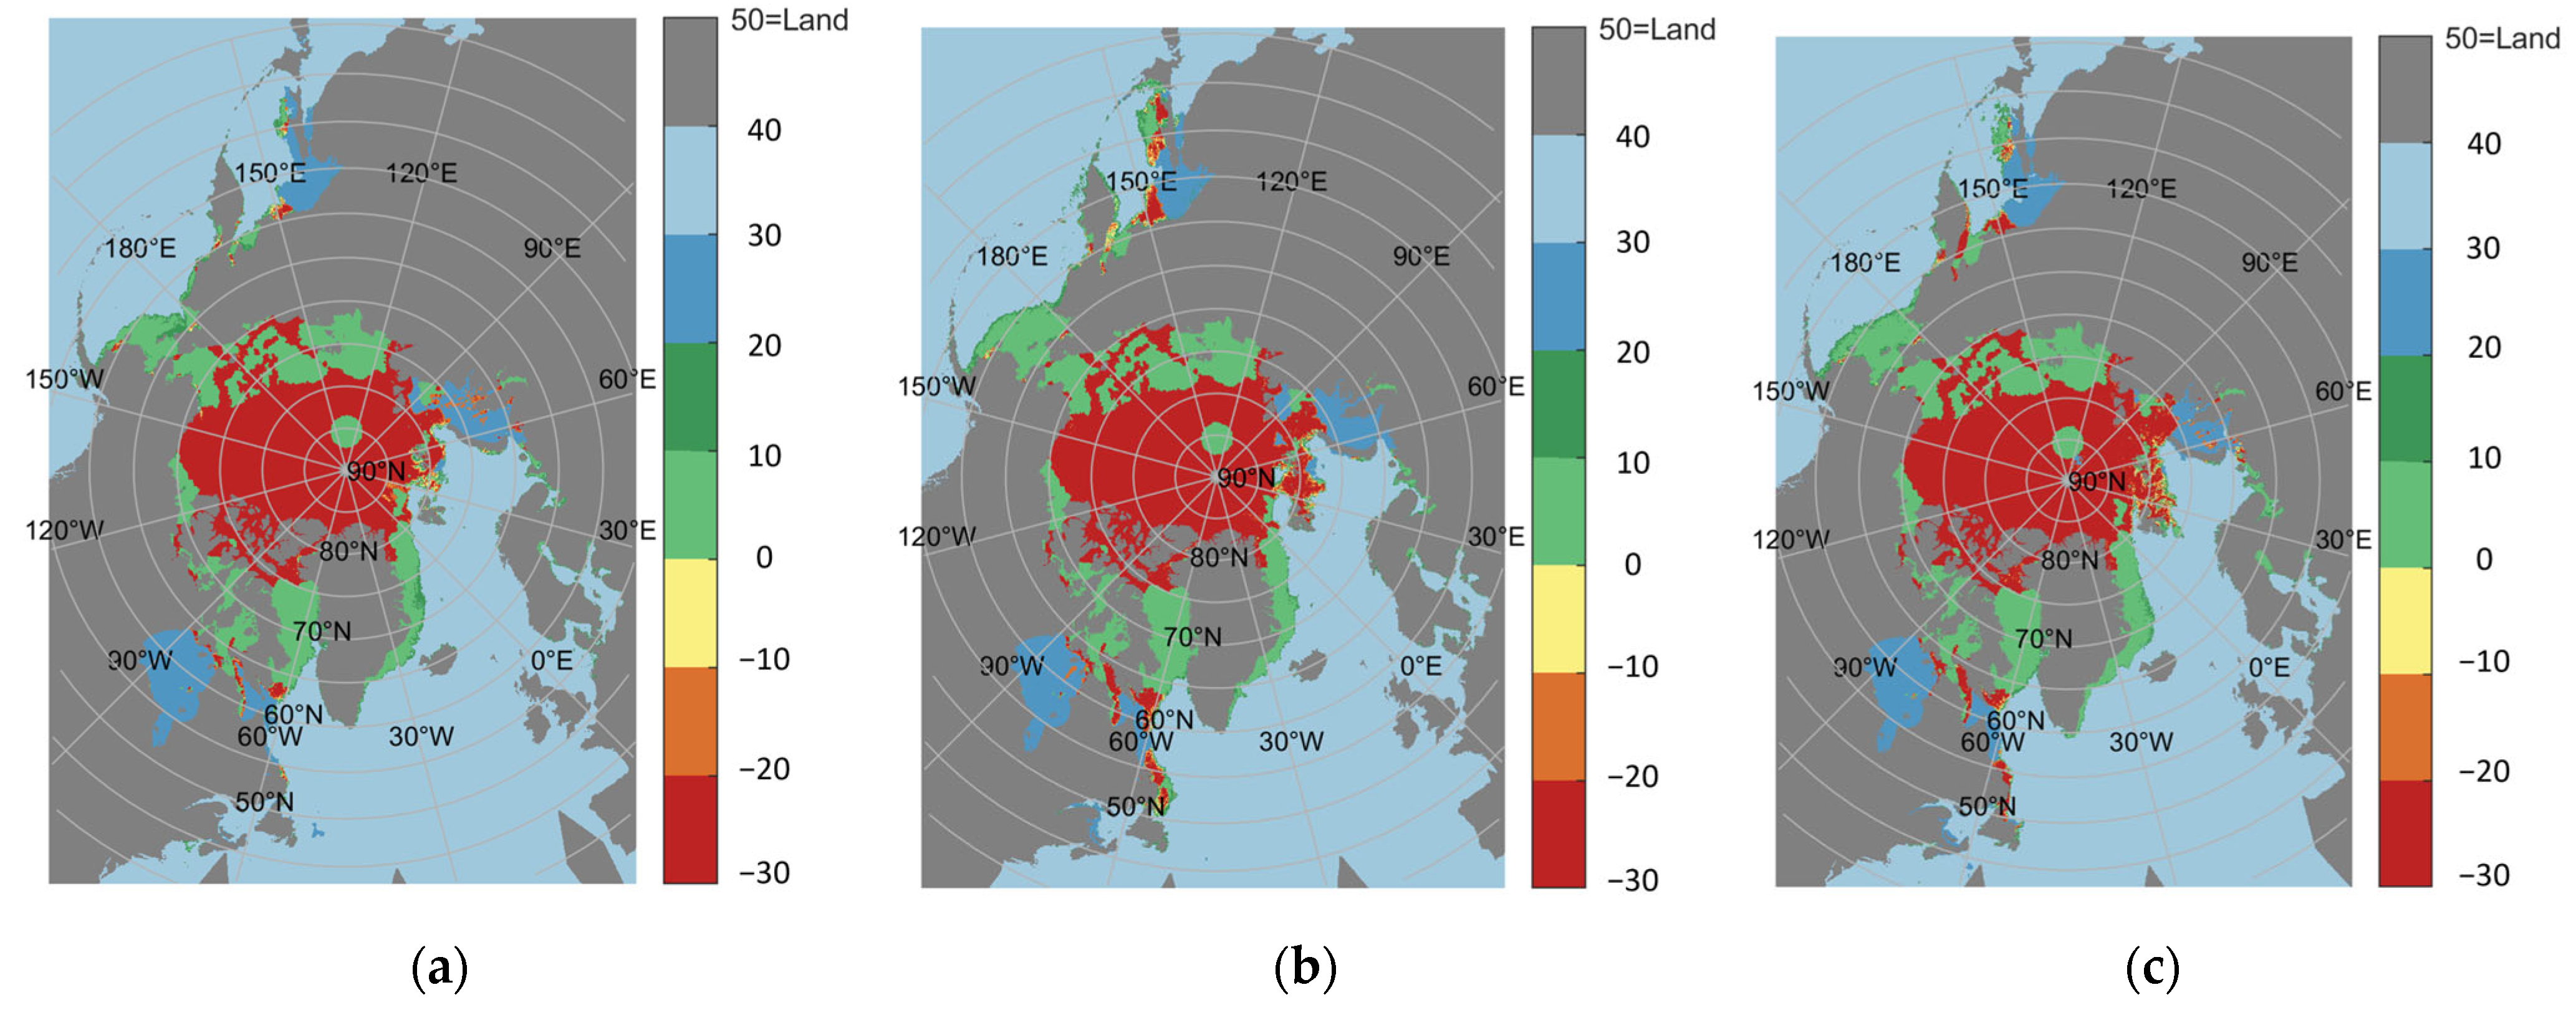
In order to evaluate the safety of the route formed by the waypoints connected using the AHPSOGA algorithm proposed in this paper, sea ice density and thickness data provided by the University of Bremen database for the 15th of each month in 2023 were used to assess the risk of sea ice for the optimized route from the Yangtze River estuary light vessel to the Rotterdam pilot station. According to the calculation method in Equation (22) in Section 4.2.1, Figure 11 shows the R I O * of the PC5 ice-class ship at each pixel on the 15th of each month in 2023. Furthermore, according to the R I O * , the SSI is used to quantitatively evaluate the safety of PC5 ice-class ships in each route segment, as shown in Figure 10.
As shown in Figure 11, the navigational risk faced by PC5 ice-class vessels south of 85° begins to decrease from July, with the most significant reduction occurring in September, reaching the lowest level of the year. After November, the risk level gradually increases again. This change in trend shows that the period from July to October is the best window for ship navigation on this route segment. During this period, the extent of sea ice in the Arctic reaches its annual minimum, and the thickness and density of the sea ice decrease significantly. This conclusion is consistent with the research results in reference [37], further verifying the rationality and reliability of this period as the navigation period for the Arctic route.
Based on the analysis results in Figure 12 and the risk levels in Table 4, for PC5 ice-class ships, normal passage can be achieved for the entire route segment only during the months of August and September, while during the remaining months, speed limits or route adjustment strategies are required for some route segments to cope with the risk of sea ice. Under icebreaker assistance conditions, PC5-class ice-strengthened vessels can achieve a continuous navigation period of no less than 6 months per year. This phenomenon shows that the ice risk level of each route segment can be fully and accurately reflected by the S S I , which provides a scientific basis for ship navigation decisions.
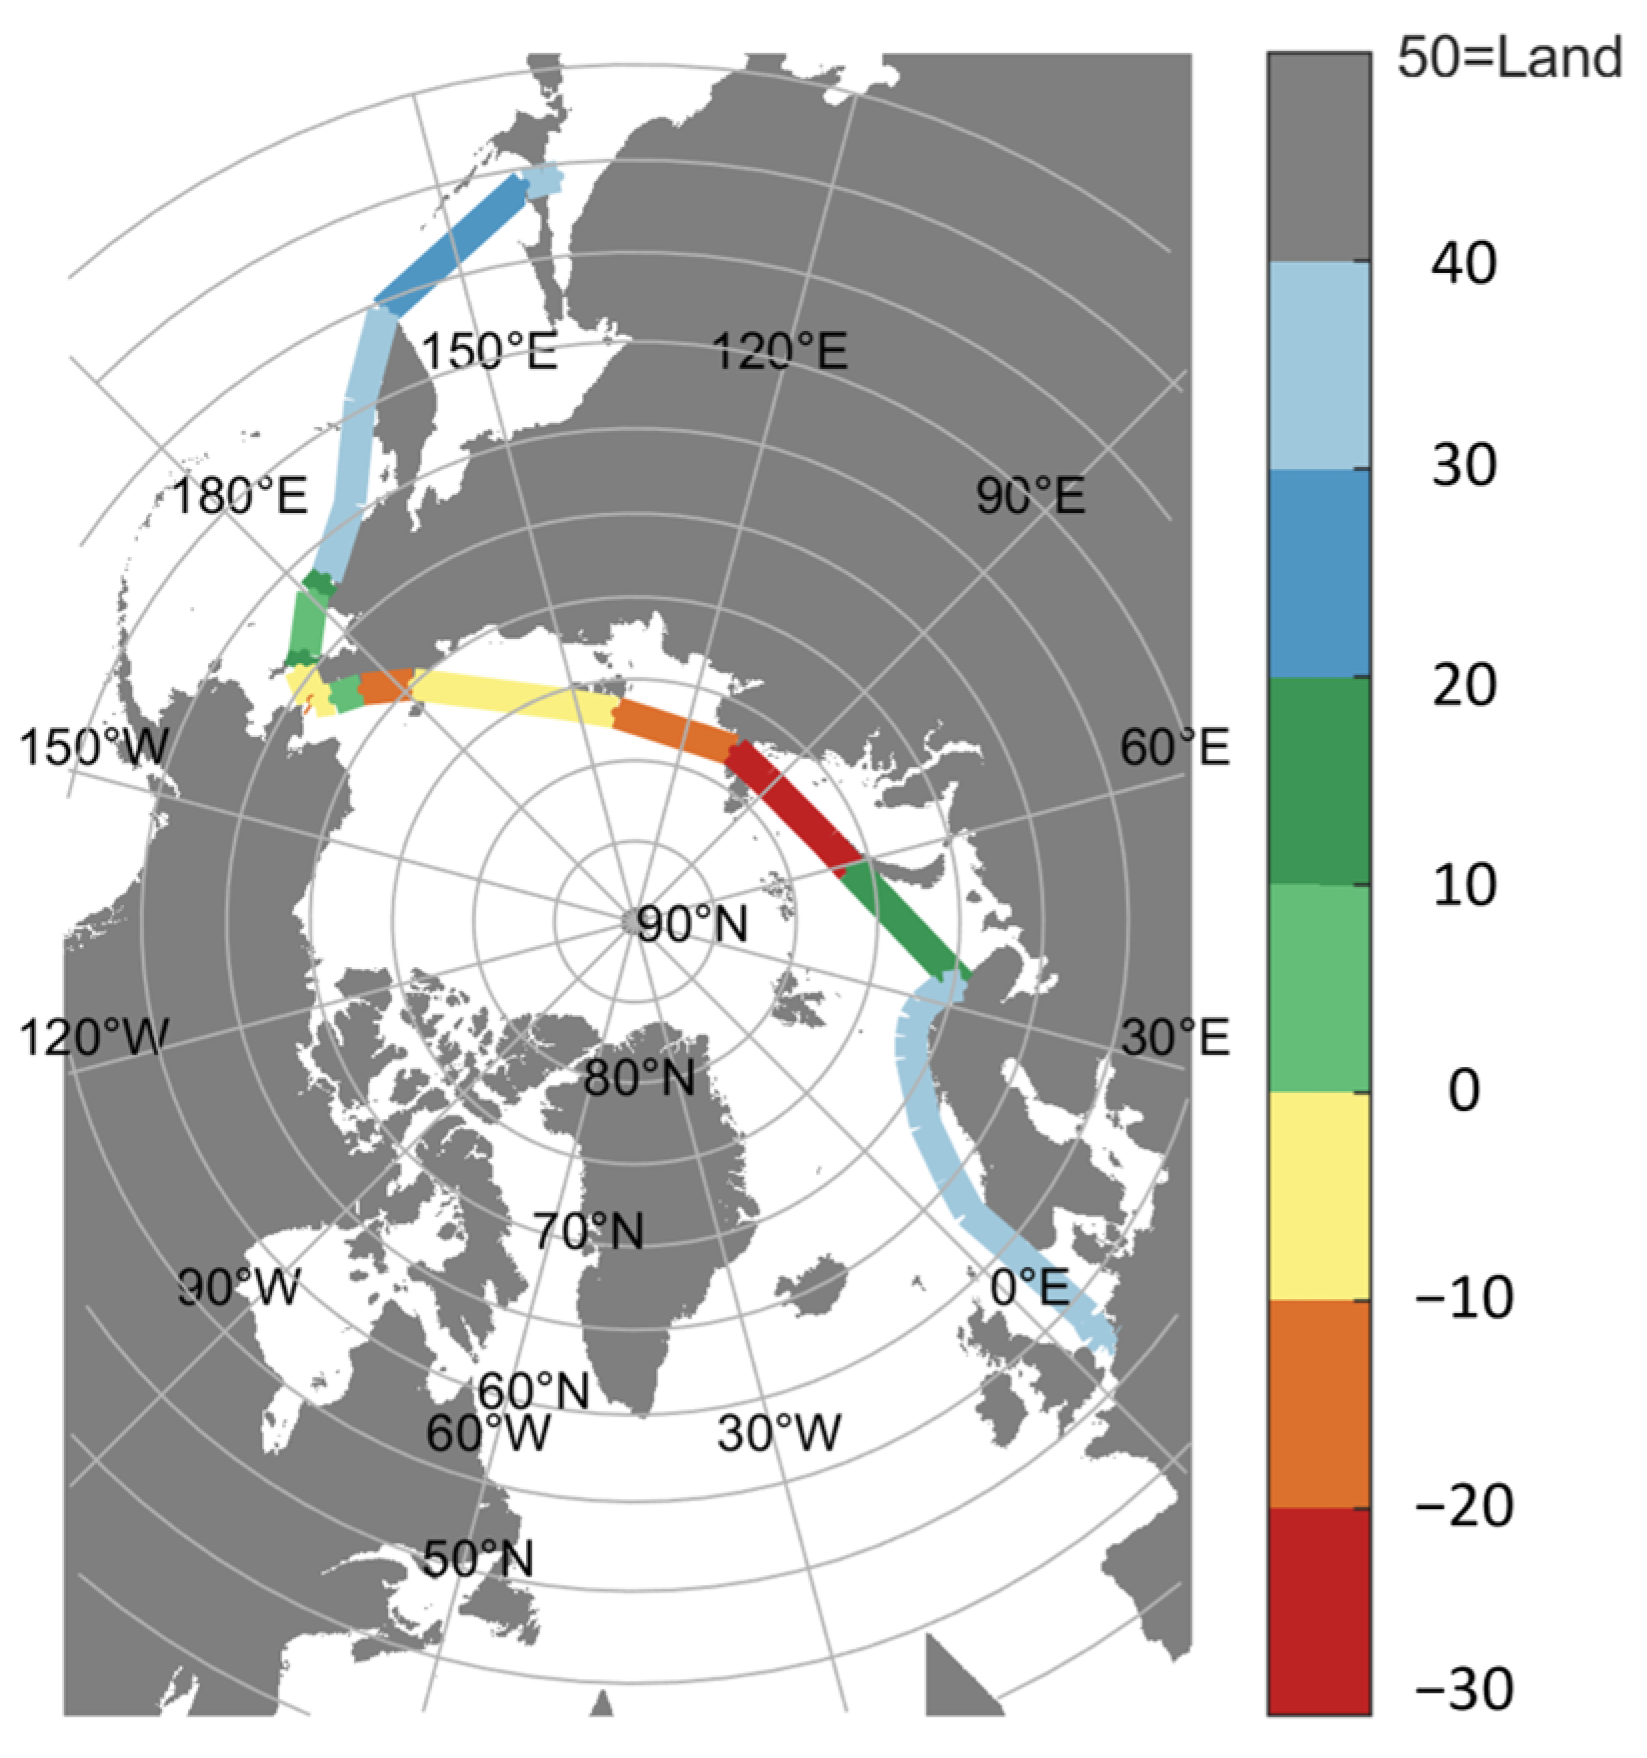
To verify the safety and feasibility of the optimized route, a safety assessment of the recommended route for the Northeast Passage was conducted on 15 April 2023, and the results are visualized in Figure 13. Analysis indicates that the optimized route shown in Figure 12d has a risk level comparable to that of the recommended Northeast Passage route in each section. However, in some sections, it still faces navigation challenges similar to those of the recommended route, such as high sea ice density and complex ice floe distribution. Nevertheless, this optimized scheme significantly shortens the total voyage and reduces the number of waypoints through route design optimization, thereby improving the economic efficiency and operability of the route while ensuring navigation safety.

6. Discussion

At present, the optimization of Arctic shipping routes and navigational safety have emerged as pivotal research focuses in the field of Arctic maritime transportation. For example, Liu et al. constructed a dynamic Bayesian network model to realize the real-time dynamic prediction of navigational risk by integrating environmental, ship, and human factors [50]. Building on this foundation, Li et al. integrated an improved A* algorithm for route planning, which provides a scientific basis for ship navigation decision-making [51]. Shu et al. converted the path planning problem into a multi-objective optimization problem and addressed it by integrating dynamic programming with numerical simulation [52]. Wang et al. built a Bayesian network to evaluate risk by combining data from multiple sources [53]. They also used the POLARIS model to limit the speed of the vessel and the improved A* algorithm to make the route planning better. Zvyagina et al. approached route optimization by considering multiple dimensions, including route length, risk level, and the number of maneuvers, and proposed a multi-objective route optimization method [54]. These studies have made significant progress in enhancing the safety of Arctic navigation, and the methods they use are comparable to those proposed in this paper. However, most of the existing studies focus on the application of a single optimization algorithm, with insufficient attention paid to the optimization of the number of steering points and their spatial distribution. Moreover, the safety assessment of Arctic routes still relies more on expert judgment, which is inherently subjective and lacks adequate quantification.
The proposed AHPSOGA algorithm and accompanying safety assessment model have demonstrated promising potential in optimizing Arctic shipping routes. The experimental results indicate that this method not only reduces the number of waypoints and total voyage and improves the convergence speed and computational efficiency, but also ensures the safety and feasibility of the optimized route. This performance improvement is particularly significant in the context of Arctic navigation, where reducing unnecessary maneuvering is critical for operational efficiency and safety.
Despite these strengths, several limitations merit discussion. First, the current model primarily focuses on sea ice parameters and does not incorporate other dynamic factors such as meteorological conditions, ocean currents, or fuel consumption, which are also vital for comprehensive route planning. Future work should explore the integration of these additional environmental and operational parameters to enhance the model’s predictive capabilities. Second, the impact of static obstacles (such as large icebergs, multi-year ice layers, reefs, etc.) and dynamic obstacles (such as drifting ice, etc.) on ship route optimization has not been considered. Factors such as ship navigation conditions and ship performance should be comprehensively considered to construct a multi-objective optimization model that includes route distance, number of turns, navigational risk, etc., to ensure the safety and economic efficiency of ship navigation. Third, although the AHPSOGA algorithm demonstrates outstanding performance in test scenarios, it requires continuous adjustment during actual navigation in ice-covered waters. By developing a real-time dynamic routing mechanism that integrates real-time data streams, the algorithm can utilize daily ice condition data updates to adjust the navigation safety index, allowing waypoints to have a deviation of ±1 nautical mile. Finally, the resolution and quality of remote sensing ice data significantly influence the accuracy of the risk assessment. Efforts to refine data preprocessing and interpolation methods, or the incorporation of higher-resolution datasets, could improve the reliability of the risk indices derived.
In summary, this study provides a robust framework for optimizing Arctic routes through a combined approach of advanced hybrid optimization and detailed risk assessment. The encouraging results highlight the potential of the proposed methods to enhance navigational safety and efficiency in polar regions. Future research aimed at integrating additional environmental variables and developing real-time routing capabilities will be crucial for advancing the practical application of this technology in the evolving landscape of Arctic maritime operations.

7. Conclusions

To optimize the number and spatial distribution of waypoints on a GER and evaluate the reliability and applicability of the optimized route, an AHPSOGA algorithm is proposed. Based on the POLARIS framework and combined with Arctic remote sensing ice data, an Arctic route safety assessment model was developed. The experimental results show that compared with the recommended routes for the Northeast Passage, the steering point optimization model based on the AHPSOGA algorithm shortens the voyage by nearly 100 n mile and effectively the number of steering points under the premise of guaranteeing the route economic benefits of R B 12   nm . In comparison with the traditional designs of equal differences in longitude and equidistance, this model significantly reduces the number of waypoints and the complexity of ship operations. From the perspective of algorithm performance, the AHPSOGA algorithm improves the convergence rate by 16.41% and 19.19% compared to the traditional GA and PSO algorithms, respectively, and enhances computational efficiency by approximately 12.00% and 14.53%, respectively. In terms of navigational safety, the risk level of each route segment of the optimized route for PC5 ice-class ships is comparable to that of the recommended route for the Northeast Passage.
Despite the significant innovations and contributions made by this paper in the optimization and safety analysis of Arctic shipping routes, there are still some deficiencies that can be further improved. Firstly, in terms of algorithm design, although the AHPSOGA algorithm combines the advantages of PSO and GA, in practical applications, more detailed parameter adjustments and algorithm optimizations may be required for specific problems. For example, the performance of the algorithm in terms of convergence, stability, and robustness can be further optimized to cope with various complex situations that may arise in Arctic route planning. Secondly, in terms of the safety assessment model, although this paper comprehensively considers factors such as sea ice density, sea ice thickness, and ice-class ships, more influencing factors can be taken into account, such as meteorological conditions (including wind, waves, currents, etc.), ship performance parameters, and environmental protection requirements around the route. These factors may have a significant impact on the safety and feasibility of Arctic shipping routes, so the assessment model needs to be further refined to improve the accuracy and reliability of the assessment results. Furthermore, in practical applications, the planning of Arctic shipping routes also needs to consider the acquisition and processing of real-time data. Although this paper incorporates remote sensing ice data for the Arctic, in actual navigation, it is necessary to establish a mechanism for acquiring and processing real-time data to achieve dynamic adjustments and optimizations of the routes. In summary, this paper has made significant innovations and contributions in the optimization and safety assessment of Arctic shipping routes, but there are still some deficiencies. By further improving research on algorithm design, safety assessment models, and real-time data processing mechanisms, the academic rigor and practicability of Arctic shipping route planning can be further enhanced.

Author Contributions

Conceptualization, C.J.; methodology, C.J.; software, C.J. and Z.L.; validation, J.L. and X.W.; formal analysis, X.W.; investigation, J.H.; resources, J.H.; data curation, J.L.; writing—original draft preparation, C.J.; writing—review and editing, X.W.; visualization, Z.L.; supervision, J.L. All authors have read and agreed to the published version of the manuscript.

Funding

This research is funded by the Natural Science Foundation of Hubei Province of China (No. 2022CFB865), the National Natural Science Foundation of China (No. 52301410), and the Basic Research Operating Expenses Project of the Water Transport Science Research Institute of the Ministry of Transport (No. WTI182402).

Informed Consent Statement

Informed consent was obtained from all subjects involved in the study.

Data Availability Statement

The data presented in this study are available on request from the corresponding author.

Conflicts of Interest

The authors declare no conflicts of interest.

Abbreviations

The following abbreviations are used in this manuscript:
PSOParticle Swarm Optimization
GAGenetic Algorithm
ACOAnt Colony Optimization
GCRGreat Circle Route
GERGreat Ellipse Route
POLARISPolar·Operational·Limits·Assessment Risk Index·System
RLRhumb Line
GNSSGlobal Navigation Satellite System
AISAutomatic Identification System
IMOInternational Maritime Organization
WMOWorld Meteorological Organization
RIORisk Index Outcome
IACSInternational Association of Classification Societies

Appendix A

Detailed pseudocode flow of implementation process of the AHPSOGA algorithm (Supplement to Section 3.1).
Algorithm A1: Adaptive Hybrid Particle Swarm Optimization-Genetic Algorithm
  Initialization the relevant parameters
  Input PopSize, max_iter
  Calculate the theoretical distance of the GER
  Set the initial number of waypoints: n = 1
  Initialize particle positions and velocities
  For iteration < max_iter:
    Calculate the fitness value of the particle and update the individual optimum and global optimum
    Calculate the adaptive crossover rate c t and mutation rate m t
    Calculate the adaptive inertia weight ω t
    Descending order of adaptability
    Delete the 1/4 individuals with the worst fitness values
    Divide the remaining individuals into first-, second- and third-class populations according to the grouping strategy
    Duplicate the secondary population in the remaining individuals to form a new population
    The individuals in the third-class population perform a two-point crossover and multiple-point mutation operation
    The individuals in the secondary population perform a rotational crossover and single-point mutation operation
    The individuals in the primary population perform a single-point cross and single-point mutation operation
    Update the speed and position of the particles
    Judging whether the fitness value is optimal
    If the fitness value is not optimal
      update the individual optimum and global optimum and calculate the fitness value of the particle
    Else
      Judging whether the RB value is less than 12
        If the RB value is not less than 12
          n = n + 1
        Else
        Output the position and number of waypoints
End

Appendix B

R I O * at each pixel under the PC7 ice class ship (Supplement to Section 5.3).
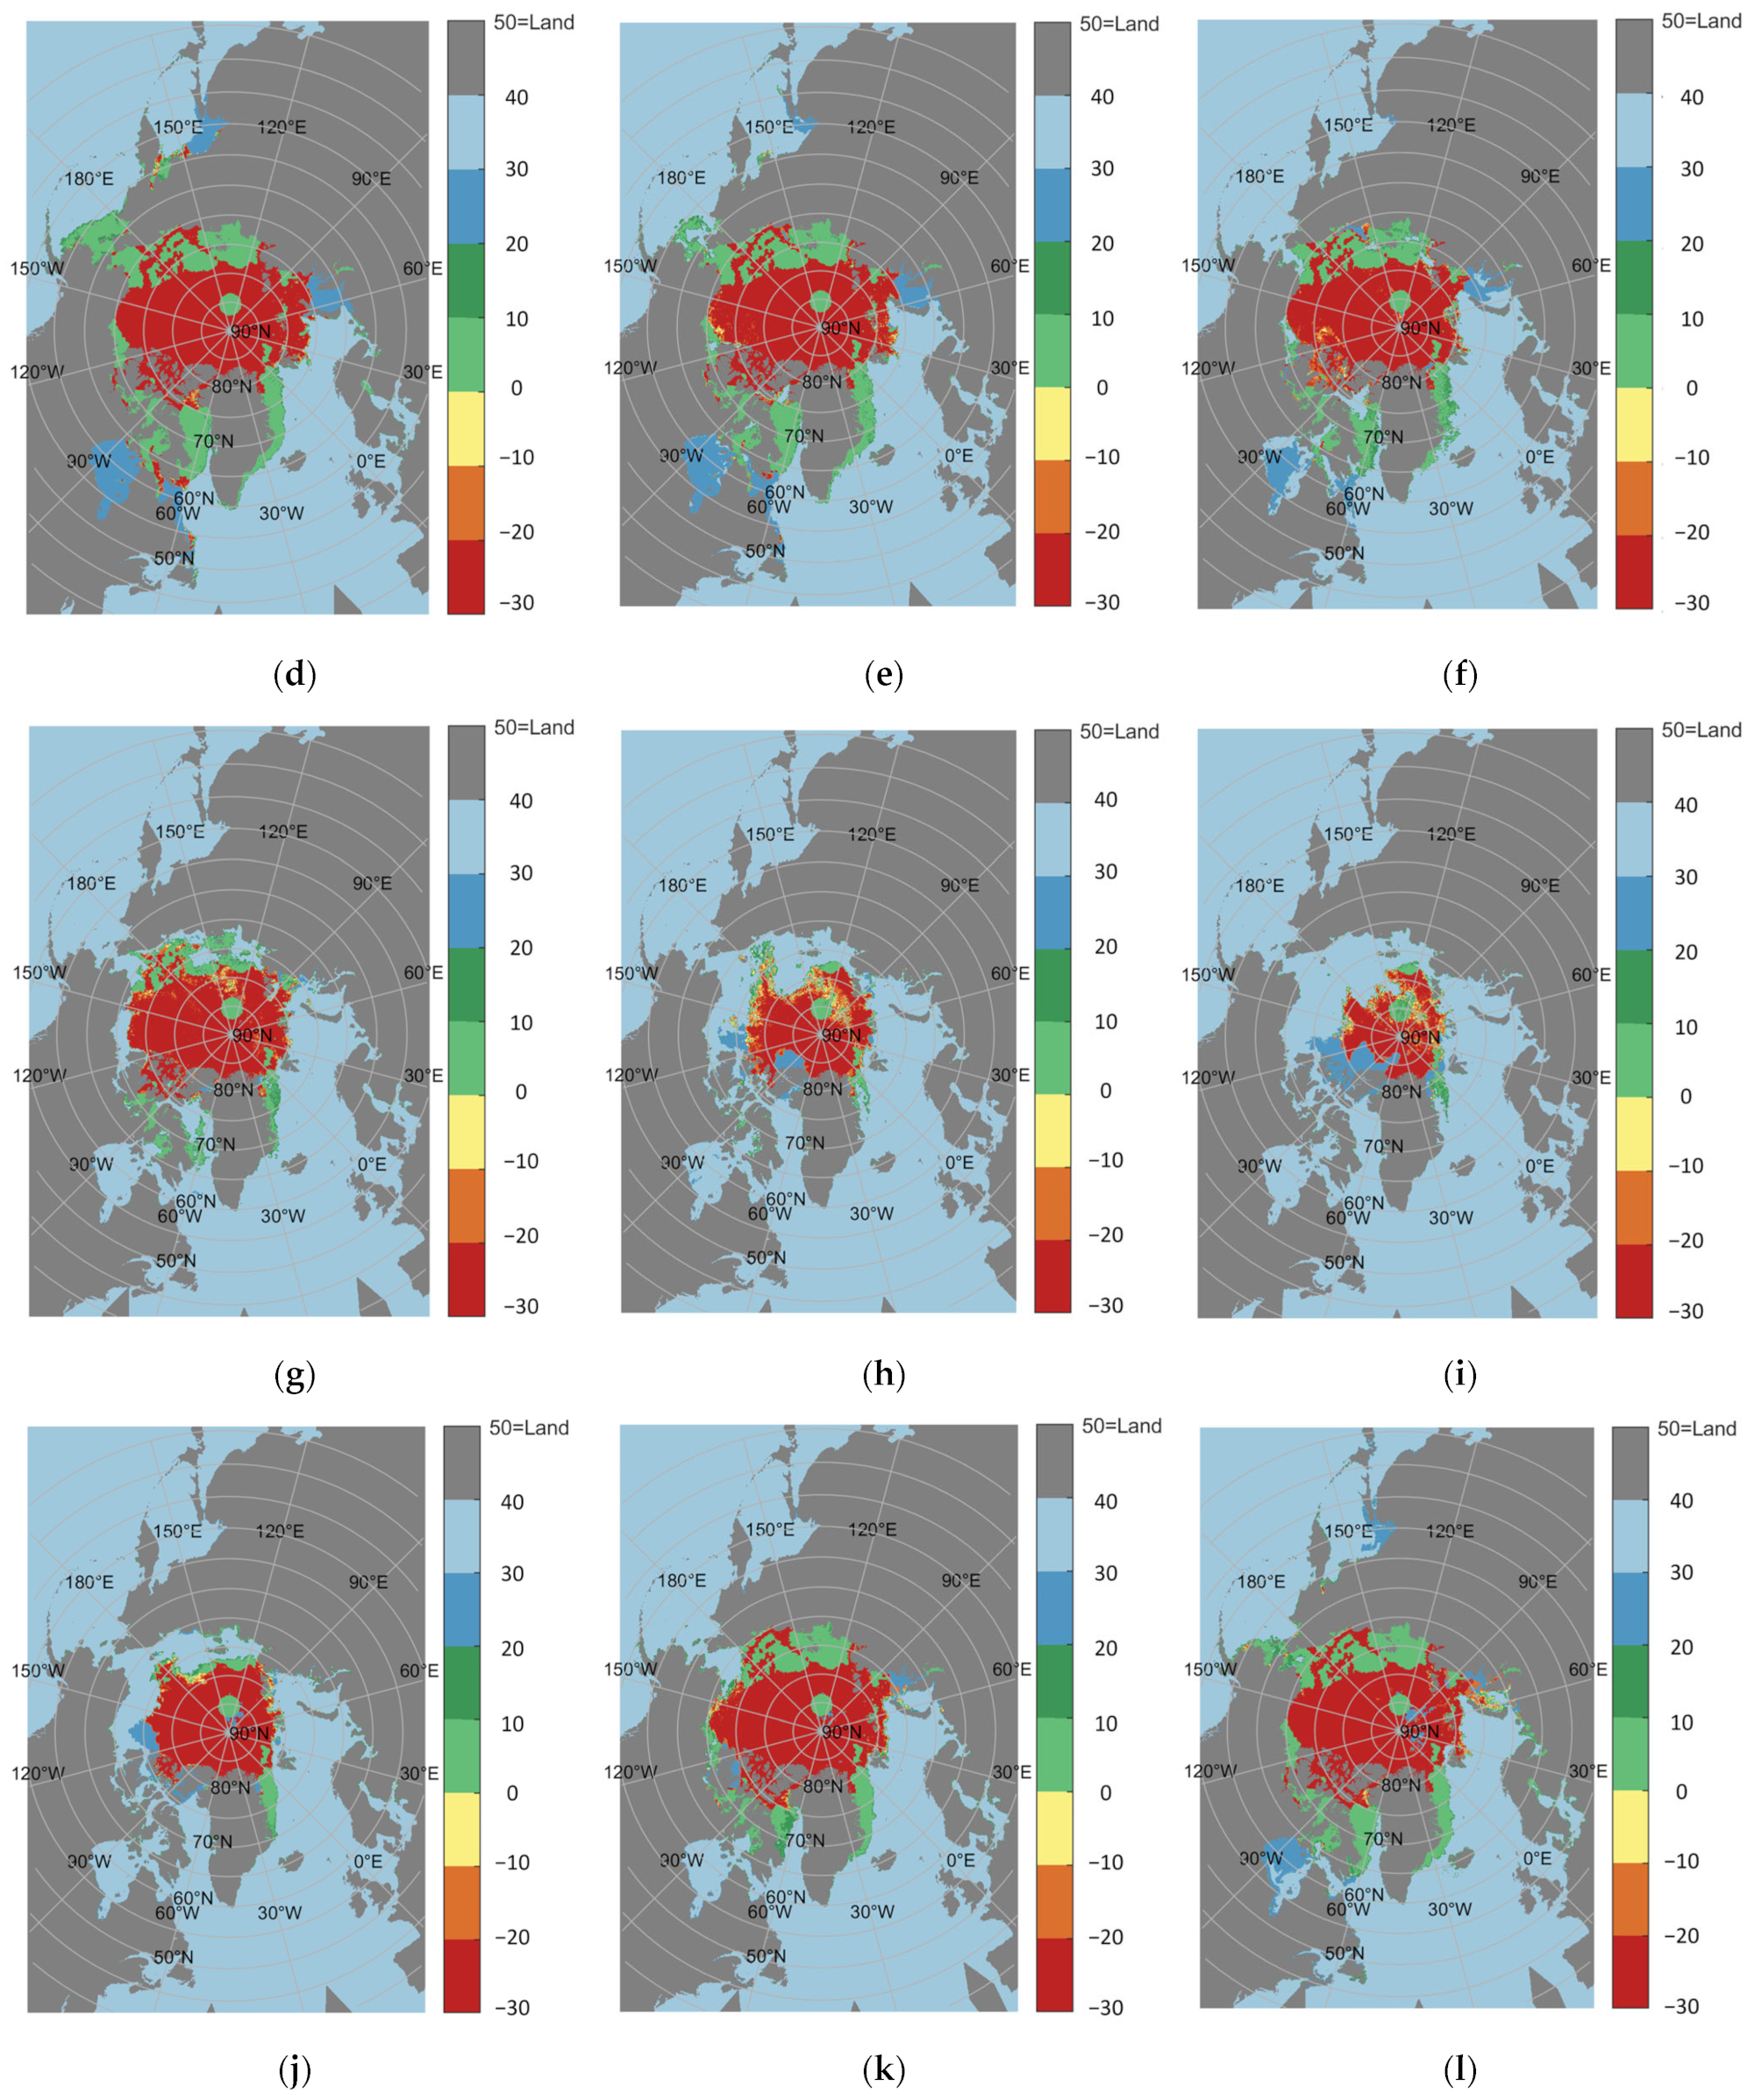
Figure A1. R I O * at each pixel under the PC7 ice class ship ((a) 15 January 2023; (b) 15 February 2023; (c) 15 March 2023; (d) 15 April 2023; (e) 15 May 2023; (f) 15 June 2023; (g) 15 July 2023; (h) 15 August 2023; (i) 15 September 2023; (j) 15 October 2023; (k) 15 November 2023; (l) 15 December 2023).
Jmse 13 01543 g0a1

References

  1. Fu, S.; Yan, X.; Zhang, D.; Zhang, M. Risk influencing factors analysis of Arctic maritime transportation systems: A Chinese perspective. Marit. Policy Manag. 2018, 45, 439–455. [Google Scholar] [CrossRef]
  2. Bilge, T.A.; Fournier, N.; Mignac, D.; Hume-Wright, L.; Bertino, L.; Williams, T.; Tietsche, S. An Evaluation of the Performance of Sea Ice Thickness Forecasts to Support Arctic Marine Transport. J. Mar. Sci. Eng. 2022, 10, 265. [Google Scholar] [CrossRef]
  3. Shu, Y.; Cui, H.; Song, L.; Gan, L.; Xu, S.; Wu, J.; Zheng, C. Influence of sea ice on ship routes and speed along the Arctic Northeast Passage. Ocean. Coast Manag. 2024, 256, 107320. [Google Scholar] [CrossRef]
  4. Ma, L.; Qian, S.; Dong, H.; Fan, J.; Xu, J.; Cao, L.; Xu, S.; Li, X.; Cai, C.; Huang, Y.; et al. Navigability of Liquefied Natural Gas Carriers Along the Northern Sea Route. J. Mar. Sci. Eng. 2024, 12, 2166. [Google Scholar] [CrossRef]
  5. Zheng, Q.; Li, W.; Shao, Q.; Han, G.; Wang, X. A mid-and long-term arctic sea ice concentration prediction model based on deep learning technology. Remote Sens. 2022, 14, 2889. [Google Scholar] [CrossRef]
  6. Liu, Y.; Xue, Y.; Lu, Y.; Yuan, L.; Li, F.; Li, R. A Dynamic Bayesian Network model for ship navigation risk in the Arctic Northeast Passage. Ocean Eng. 2024, 312, 119024. [Google Scholar] [CrossRef]
  7. Maritime Safety Administration of the People’s Republic of China. Arctic Navigation Guide (Northeast Passage); People’s Transportation Publishing House: Beijing, China, 2021.
  8. Wang, X.; Tang, Z.; Ji, C.; Guo, Z. Polar navigation method based on the great circle chart of the positive axis. Navig. China 2022, 45, 62–68. [Google Scholar]
  9. Hsieh, T.-H.; Meng, Q.; Han, B.; Wang, S.; Wu, X. Optimization of waypoints on the great circle route based on genetic algorithm and fuzzy logic. J. Mar. Sci. Eng. 2023, 11, 358. [Google Scholar] [CrossRef]
  10. Earle, M. Sphere to spheroid comparisons. J. Navig. 2006, 59, 491–496. [Google Scholar] [CrossRef]
  11. Ding, J. The Formula for Calculating the Great Ellipse Geographic Coordinate. Tianjin Naut. 1993, 41–43. [Google Scholar]
  12. Ding, J. On the relationship between the isometric route and the great ellipse. Tianjin Navig. 1994, 28–29. [Google Scholar]
  13. Earle, M. A vector solution for navigation on a great ellipse. J. Navig. 2000, 53, 473–481. [Google Scholar] [CrossRef]
  14. Earle, M. Vector solutions for azimuth. J. Navig. 2008, 61, 537–545. [Google Scholar] [CrossRef]
  15. Earle, M. Accurate harmonic series for inverse and direct solutions for the great ellipse. J. Navig. 2011, 64, 557–570. [Google Scholar] [CrossRef]
  16. Sjöberg, L.E. Solutions to the direct and inverse navigation problems on the great ellipse. J. Geod. Sci. 2012, 2, 200–205. [Google Scholar] [CrossRef][Green Version]
  17. Liu, W.; Bian, H.; Wang, R.; Wen, C. Space vector method for great ellipse route design. Acta Geod. Cartogr. Sin. 2015, 44, 741–746. [Google Scholar]
  18. Fang, X. RNAV Route Design Based on Ellipsoid Model. Sci. Surv. Mapp. 2008, 33, 149–150. [Google Scholar]
  19. Li, H.; Wang, R. Great Elliptic Route method and its navigation parameter calculation. J. Nav. Univ. Eng. 2009, 21, 7–12. [Google Scholar]
  20. Jiao, C.; Wan, X.; Li, H.; Bian, S. Dynamic projection method of electronic navigational charts for polar navigation. J. Mar. Sci. Eng. 2024, 12, 577. [Google Scholar] [CrossRef]
  21. Bowditch, N. An epitome of navigation and nautical astronomy. In American Practical Navigator; US Government Printing Office: Washington, NW, USA, 1912. [Google Scholar]
  22. Holm, R.J. Great Circle Waypoints for Inertial Equipped Aircraft. Navig. J. Inst. Navig. 1972, 19, 191–194. [Google Scholar] [CrossRef]
  23. Keys, G. Practical Navigation by Calculator; Osprey Publishing: Oxford, UK, 1983. [Google Scholar]
  24. Chen, C.-L.; Hsieh, T.-H.; Hsu, T.-P. A novel approach to solve the great circle track based on rotation transformation. J. Mar. Sci. Technol. 2015, 23, 13–20. [Google Scholar]
  25. Hsu, T.-P.; Hsieh, T.-H. Evaluation and Execution of Great Elliptic Sailing. J. Navig. 2017, 70, 1023–1040. [Google Scholar] [CrossRef]
  26. Wang, X.; Gao, Y.; Zhou, J.; Wu, H. Mini-Review of Unmanned Vehicle Route Planning Based on Ant Colony Algorithm. Autom. Mach. Learn. 2023, 4, 42–46. [Google Scholar] [CrossRef]
  27. Zhao, L.; Li, F.; Sun, D.; Zhao, Z. An improved ant colony algorithm based on Q-Learning for route planning of autonomous vehicle. Int. J. Comput. Commun. Control 2024, 19, 5382. [Google Scholar] [CrossRef]
  28. Heng, H.; Mohd, G.M.H.; Wan, R. Exploring the application of ant colony optimization in path planning for Unmanned Surface Vehicles. Ocean Eng. 2024, 311, 118738. [Google Scholar] [CrossRef]
  29. Pehlivanoglu, Y.V.; Perihan, P. An enhanced genetic algorithm for path planning of autonomous UAV in target coverage problems. Appl. Soft Comput. 2021, 112, 107796. [Google Scholar] [CrossRef]
  30. Shi, K.; Huang, L.; Jiang, D.; Sun, Y.; Tong, X.; Xie, Y.; Fang, Z. Path planning optimization of intelligent vehicle based on improved genetic and ant colony hybrid algorithm. Front. Bioeng. Biotechnol. 2022, 10, 905983. [Google Scholar] [CrossRef]
  31. Zhao, W.; Wang, Y.; Zhang, Z.; Wang, H. Multicriteria ship route planning method based on improved particle swarm optimization–genetic algorithm. J. Mar. Sci. Eng. 2021, 9, 357. [Google Scholar] [CrossRef]
  32. Zhao, J.; Deng, C.; Yu, H.; Fei, H.; Li, D. Path planning of unmanned vehicles based on adaptive particle swarm optimization algorithm. Comput. Commun. 2024, 216, 112–129. [Google Scholar] [CrossRef]
  33. Tsou, M.-C.; Hsueh, C.-K. The Study of Ship Collision Avoidance Route Planning by Ant Colony Algorithm. J. Mar. Sci. Technol. Taiwan 2010, 18, 16. [Google Scholar] [CrossRef]
  34. Shen, Y.; Wang, F.; Zhao, P.; Tong, X.; Huang, J.; Chen, K.; Zhang, H. Ship route planning based on particle swarm optimization. In Proceedings of the 2019 34rd Youth Academic Annual Conference of Chinese Association of Automation (YAC), Jinzhou, China, 6–8 June 2019; pp. 211–215. [Google Scholar]
  35. Tong, B.; Hu, J. Path planning for ships navigating in ice areas based on an improved ant colony algorithm. Navig. China 2020, 43, 24–28. [Google Scholar]
  36. Zhang, C.; Zhang, D.; Zhang, M.; Zhang, J.; Mao, W. A three-dimensional ant colony algorithm for multi-objective ice routing of a ship in the Arctic area. Ocean Eng. 2022, 266, 113241. [Google Scholar] [CrossRef]
  37. Lee, H.-W.; Roh, M.-I.; Kim, K.-S. Ship route planning in Arctic Ocean based on POLARIS. Ocean Eng. 2021, 234, 109297. [Google Scholar] [CrossRef]
  38. Wang, L.; Scott, K.A.; Clausi, D.A. Sea ice concentration estimation during freeze-up from SAR imagery using a convolutional neural network. Remote Sens. 2017, 9, 408. [Google Scholar] [CrossRef]
  39. Choi, M.; De Silva, L.W.A.; Yamaguchi, H. Artificial neural network for the short-term prediction of arctic sea ice concentration. Remote Sens. 2019, 11, 1071. [Google Scholar] [CrossRef]
  40. Jiang, J.; He, S.; Jiang, H.; Chen, X.; Ji, S. Research on Sea Ice and Local Ice Load Monitoring System for Polar Cargo Vessels. J. Mar. Sci. Eng. 2025, 13, 808. [Google Scholar] [CrossRef]
  41. Zhu, X.; Wang, J.; Wang, G.; Jiang, Y.; Sun, Y.; Zhao, H. STDNet: Spatio-Temporal Decompose Network for Predicting Arctic Sea Ice Concentration. Remote Sens. 2024, 16, 4534. [Google Scholar] [CrossRef]
  42. Huang, X.; Bian, S. A new solution to the length of the sectional ellipse arc in geodetic problems. Hydrogr. Surv. Charting 2007, 21–23. [Google Scholar]
  43. Zhang, X.; Jiao, C.; Li, H.; Bian, S.; Zhang, S. Analysis of three forms of meridian arc length positive and negative solution expressions. Mar. Surv. Mapp. 2023, 43, 70–76. [Google Scholar]
  44. Royal, N. Admiralty Manual of Navigation. In The Principles of Navigation, 10th ed.; Stationery Office Books: London, UK, 2008. [Google Scholar]
  45. Snyder, J. An equal-area map projection for polyhedral globes. Cartogr. Int. J. Geogr. Inf. Geovis. 1992, 29, 10–21. [Google Scholar] [CrossRef]
  46. Ma, L.; Qian, S.; Mou, X.; Fan, J.; Xu, J.; Cao, L.; Xu, B.; Yao, B.; Li, X.; Li, Y. Comparative Research on Vessel Navigability on the Northern Sea Route Based on the NSR Admission Criteria and POLARIS Methodology. J. Mar. Sci. Eng. 2025, 13, 1282. [Google Scholar] [CrossRef]
  47. An, L.; Ma, L.; Wang, H.; Zhang, H.-Y.; Li, Z.-H. Research on navigation risk of the Arctic Northeast Passage based on POLARIS. J. Navig. 2022, 75, 455–475. [Google Scholar] [CrossRef]
  48. Li, Z.; Ringsberg, J.W.; Rita, F. A voyage planning tool for ships sailing between Europe and Asia via the Arctic. Ships Offshore Struct. 2020, 15, S10–S19. [Google Scholar] [CrossRef]
  49. Xie, Z.; Xu, H.; Wang, S.; Han, B.; Wu, Z.; Liu, W. Sea-ice risk calculation for the Arctic shipping routes based on segmental safety assessment. Navig. China 2023, 46, 36–41, 58. [Google Scholar]
  50. Liu, C.; Zhou, Y.; Yang, Z.; Li, Y.; Li, T. Optimizing the scheduling scheme for NSR/SCR tramp vessel shipping between Asia and Europe. Ocean Eng. 2024, 304, 117747. [Google Scholar] [CrossRef]
  51. Li, Z.; Yao, C.; Zhu, X.; Gao, G.; Hu, S. A decision support model for ship navigation in Arctic waters based on dynamic risk assessment. Ocean Eng. 2022, 244, 110427. [Google Scholar] [CrossRef]
  52. Shu, Y.; Zhu, Y.; Xu, F.; Gan, L.; Lee, P.T.-W.; Yin, J.; Chen, J. Path planning for ships assisted by the icebreaker in ice-covered waters in the Northern Sea Route based on optimal control. Ocean Eng. 2023, 267, 113182. [Google Scholar] [CrossRef]
  53. Wang, B.; Liu, Y.; Dai, W.; Li, J. Incremental route planning based on daily risk assessment for Arctic navigation. Ocean Eng. 2025, 320, 120294. [Google Scholar] [CrossRef]
  54. Zvyagina, T.; Zvyagin, P. A model of multi-objective route optimization for a vessel in drifting ice. Reliab. Eng. Syst. Saf. 2022, 218, 108147. [Google Scholar] [CrossRef]
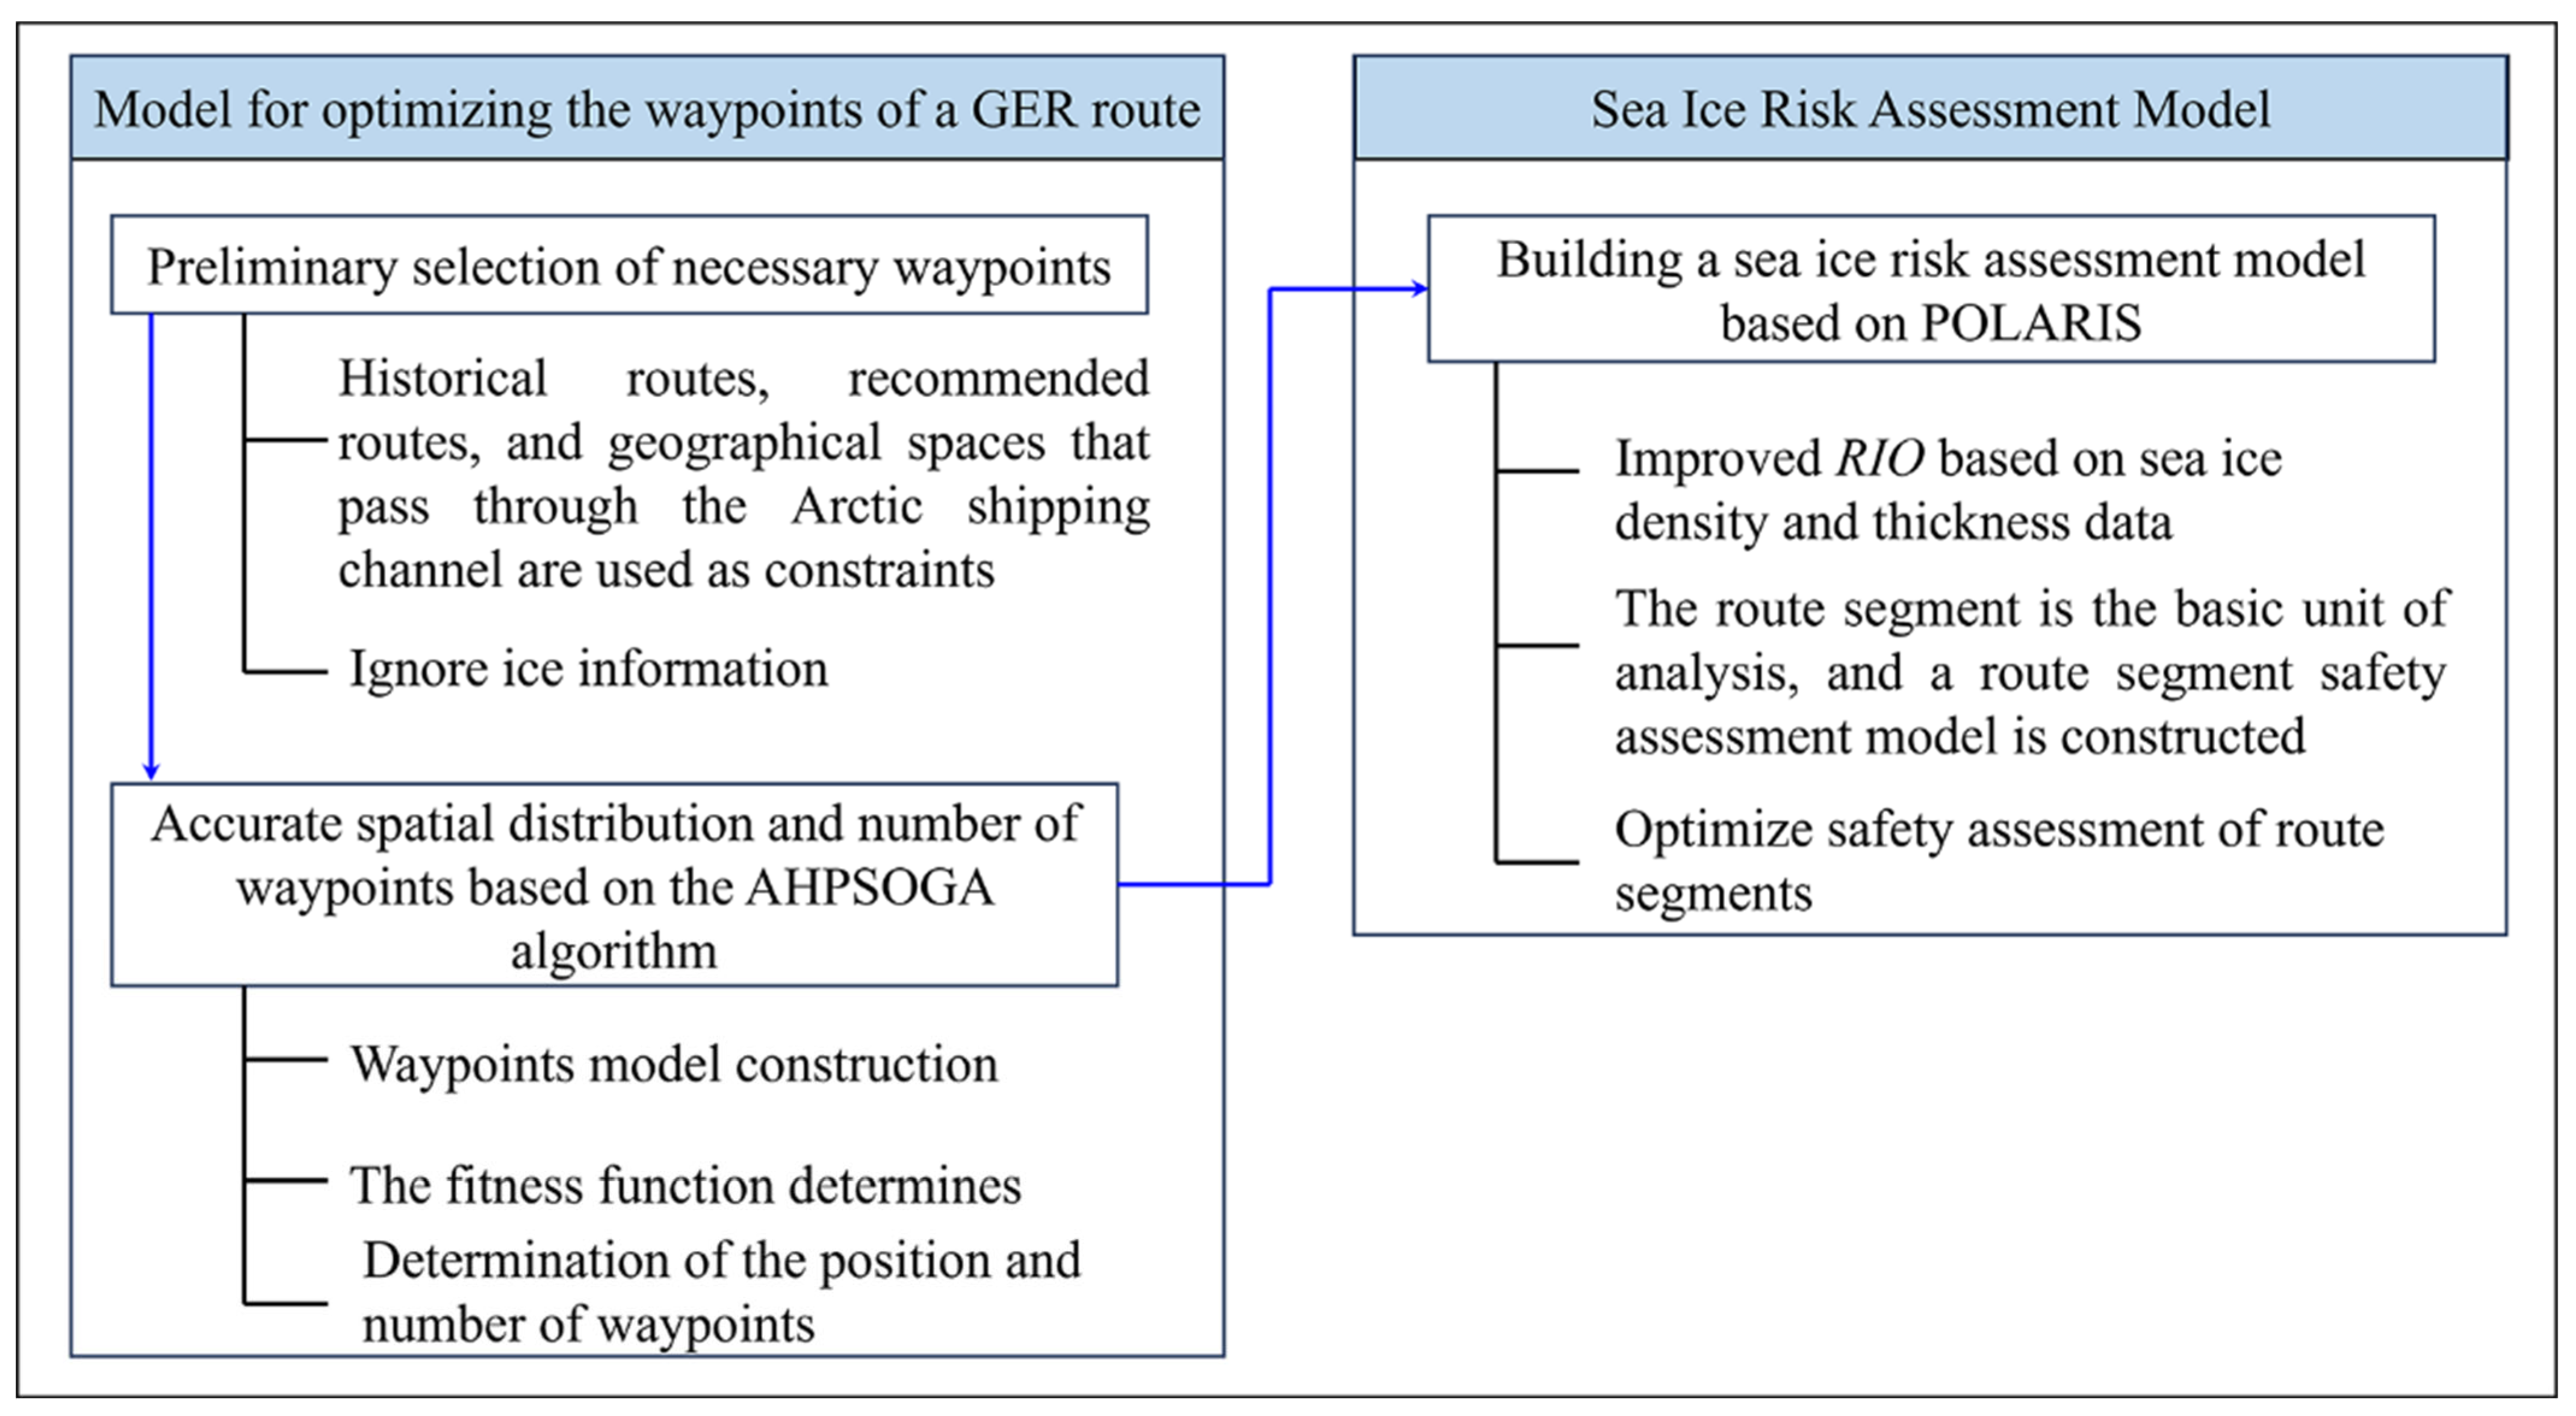
Figure 1. Methodological overview.
Jmse 13 01543 g001
Figure 2. Schematic diagram of the GER.
Jmse 13 01543 g002
Figure 3. Schematic diagram of an RL.
Jmse 13 01543 g003
Figure 4. Schematic diagram of the RB of a GER.
Jmse 13 01543 g004
Figure 5. Detailed optimization process of AHPSOGA.
Jmse 13 01543 g005
Figure 6. Visualization results for Arctic sea ice density and thickness ((a) Sea ice density; (b) Sea ice thickness).
Jmse 13 01543 g006
Figure 7. Routes collected through the Northeast Passage.
Jmse 13 01543 g007
Figure 8. September 2021 Northern Sea Route (NSR) Shipping Traffic Map.
Jmse 13 01543 g008
Figure 9. Schematic diagram of the AHPSOGA algorithm for optimizing the waypoints of the GER ((a) P 1 P 2 : n = 1 , P 3 P 4 : n = 1 ; (b) P 1 P 2 : n = 2 , P 3 P 4 : n = 2 ; (c) P 1 P 2 : n = 2 , P 3 P 4 : n = 3 ; (d) P 1 P 2 : n = 2 , P 3 P 4 : n = 4 ).
Jmse 13 01543 g009
Figure 10. Schematic diagram of waypoints for traditional GER ((a) route with equal differences in longitude; (b) route with equidistance).
Jmse 13 01543 g010
Figure 11. R I O * at each pixel under the PC5 ice-class ship ((a) 15 January 2023; (b) 15 February 2023; (c) 15 March 2023; (d) 15 April 2023; (e) 15 May 2023; (f) 15 June 2023; (g) 15 July 2023; (h) 15 August 2023; (i) 15 September 2023; (j) 15 October 2023; (k) 15 November 2023; (l) 15 December 2023).
Jmse 13 01543 g011aJmse 13 01543 g011b
Figure 12. Safety assessment of an optimized route for a PC5 ice-class vessel ((a) 15 January 2023; (b) 15 February 2023; (c) 15 March 2023; (d) 15 April 2023; (e) 15 May 2023; (f) 15 June 2023; (g) 15 July 2023; (h) 15 August 2023; (i) 15 September 2023; (j) 15 October 2023; (k) 15 November 2023; (l) 15 December 2023).
Jmse 13 01543 g012aJmse 13 01543 g012b
Figure 13. Safety assessment of PC5 ice-class vessels along the recommended Northeast Passage route.
Jmse 13 01543 g013
Table 1. Quadrant judgment for c.
B 2 = B 1 , L 2 > L 1 B 2 = B 1 , L 2 < L 1 B 2 > B 1 , L 2 L 1
π 2 3 π 2 a r c t a n L 2 L 1 M P 2 M P 1
B 2 < B 1 , L 2 L 1 B 2 > B 1 , L 2 L 1 B 2 < B 1 , L 2 L 1
π a r c t a n L 2 L 1 q 2 q 1 2 π + a r c t a n L 2 L 1 q 2 q 1 π + a r c t a n L 2 L 1 M P 2 M P 1
Table 2. Attributes of sea ice data.
Data SourceVariablesSpatial Resolution/kmTemporal ResolutionMatrix SizeData FormatWebsite
University of Bremen, Bremen, Germanydensity3.125daily average3584 × 2432.hdfhttps://data.seaice.uni-bremen.de/amsr2/asi_daygrid_swath/ (accessed on 7 August 2025)
thickness12.5896 × 608.nchttps://data.seaice.uni-bremen.de/smos/ (accessed on 7 August 2025)
Table 3. Sea ice risk values.
Ice Class
/cm
Ice Free0 New Ice
( 0 , 10 ]
Grey Ice
( 10 , 15 ]
Grey White Ice
( 15 , 30 ]
Thin First-Year Ice 1st Stage
( 30 , 50 ]
Thin First-Year Ice 2nd Stage
( 50 , 70 ]
Medium First-Year Ice 1st Stage
( 70 , 100 ]
Medium First-Year Ice 2nd Stage
( 100 , 120 ]
Thick First-Year Ice
( 120 , 170 ]
Second-Year Ice ( 170 , 200 ] Light Multi-Year Ice
( 200 , 250 ]
Heavy Multi-Year Ice
>250
PC1333322222211
PC2333322222110
PC333332222210−1
PC43333222210−1−2
PC5333322110−1−2−2
PC632222110−1−2−3−3
PC73222111−1−2−3−3−3
1AS3222210−1−2−3−4−4
1A322210−1−2−3−4−5−5
1B32210−1−2−3−4−5−6−6
1C3110−1−2−3−4−5−6−7−8
Note: 1. Below the name of the ice level is the ice thickness, which is given in cm. 2. The background color uses a color gradient to visually represent the data: the green spectrum (light green to dark green) corresponds to higher values, with darker green indicating a higher safety factor. As the values decrease, the color gradually changes to light yellow and light orange until it reaches the red spectrum (light red to dark red), which corresponds to lower values. The darker the red, the higher the danger factor.
Table 4. Criteria for risk index results.
R I O PC1~PC7<PC7
R I O 0 normal sailingnormal sailing
10 R I O < 0 high-risk operation (speed limit)special operation (change route)
R I O < 10 special operation (change route)special operation (change route)
Note: In the background color, green represents “normal navigation”, yellow represents “high-risk operation”, and red represents “special operation”.
Table 5. Preliminary selection of waypoints.
NumberLatitudeLongitudeNumberLatitudeLongitude
1 66 0 0   N 169 3 2   W 8 60 0 0   N 4 0 0   E
2 66 1 0   N 169 3 2   W 9 54 1 7   N 3 3 9   E
3 67 0 0 N 171 3 4   W 10 53 4 4   N 3 0 3   E
4 ( P 1 ) 68 5 0   N 177 3 0   W 11 53 0 7   N 2 3 9   E
5 ( P 2 ) 77 4 5   N 105 0 0   E 12 52 1 2   N 2 3 9   E
6 ( P 3 ) 78 0 4   N 93 0 0   E 13 51 5 9   N 3 0 0   E
7 ( P 4 ) 62 5 6   N 4 0 0   E
Table 6. AHPSOGA algorithm parameters.
ParameterNameValue
ω m a x maximum inertia weight0.9
ω m i n minimum inertia weight0.4
c 1 cognitive factor1.5
c 2 social factor1.5
c m a x maximum crossover rate0.9
c m i n minimum crossover rate0.4
m m a x maximum mutation rate0.2
m m i n minimum mutation rate0.05
p o p _ s i z e population size50
Table 7. Information on waypoints for the optimized AHPSOGA algorithm for the GER.
Route SegmentNumber of WaypointsNumber of IterationsThe Position of the WaypointsRB/n Mile
P 1 P 2 n = 1 27 76 36.0 1   N , 155 28.5 7   E 26.3506
n = 2 40 74 26.3 6   N , 167 14.9 9   E 11.7220
78 0.4 9   N , 140 11.5 3   E
P 3 P 4 n = 1 36 74 58.9 7   N , 28 18.7 9   E 51.6626
n = 2 49 77 43.0 3   N , 45 27.0 8   E 23.1115
71 21.8 0   N , 16 58.1 7   E
n = 3 66 78 31.6 0   N , 56 31.6 7   E 13.0156
74 58 . 9   7     N , 28 18.4 8   E
69 22.7 6   N , 12 47.8 4   E
n = 4 68 78 48.0 5   N , 63 48.2 1   E 8.3527
76 46.0 4   N , 37 46.9 0   E
72 52.6 3   N , 20 57.1 4   E
68 8.5 4   N , 10 40.2 3   E
Table 8. Comparison of the coordinates of waypoints generated by the AHPSOGA algorithm optimization with the coordinates of waypoints recommended in the Arctic Navigation Guide (Northeast Passage).
NumberRecommended Route Waypoint CoordinatesOptimized Route Waypoint Coordinates
LatitudeLongitudeLatitudeLongitude
P 1 68 5 0   N 177 3 0   W 68 5 0   N 177 3 0   W
1 70 0 1   N 176 2 0   E 74 26.3 6   N 167 14.9 9   E
2 77 0 3   N 150 0 0   E 78 0.4 9   N 140 11.5 3   E
P 2 77 4 5   N 105 0 0   E 77 4 5   N 105 0 0   E
P 3 78 0 4   N 93 0 0   E 78 0 4   N 93 0 0   E
1 76 5 3   N 084 5 0   E 78 48.0 5   N 63 48.2 1   E
2 77 1 0   N 068 0 0   E 76 46.0 4   N 37 46.9 0   E
3 76 1 4   N 058 4 8   E 72 52.6 3   N 20 57.1 4   E
4 71 4 5   N 026 0 0   E 68 8.5 4   N 10 40.2 3   E
5 71 3 3   N 022 2 5   E
6 71 0 2   N 018 5 3   E
7 68 1 1   N 009 5 7   E
8 65 1 5   N 006 1 5   E
P 4 62 5 6   N 4 0 0   E 62 5 6   N 4 0 0   E
Table 9. Comparison of results.
AlgorithmTotal Number of IterationsMinimum Running Time/sAverage Running Time ± Standard Deviation/s
GA2626.12847.5414 ± 0.61
PSO2716.52517.7669 ± 0.58
AHPSOGA2195.87466.6383 ± 0.52
Disclaimer/Publisher’s Note: The statements, opinions and data contained in all publications are solely those of the individual author(s) and contributor(s) and not of MDPI and/or the editor(s). MDPI and/or the editor(s) disclaim responsibility for any injury to people or property resulting from any ideas, methods, instructions or products referred to in the content.