Article

Dynamic Response Analysis of a New Combined Concept of a Spar Wind Turbine and Multi-Section Wave Energy Converter Under Operational Conditions

1
Faculty of Maritime and Transportation, Ningbo University, Ningbo 315211, China
2
State Key Laboratory of Coastal and Offshore Engineering, Dalian University of Technology, Dalian 116024, China
3
School of Ocean Engineering and Technology, Sun Yat-Sen University, Zhuhai 519082, China
4
Department of Civil Engineering, International Hellenic University, 57001 Thermi, Greece
*
Author to whom correspondence should be addressed.
J. Mar. Sci. Eng. 2025, 13(8), 1538; https://doi.org/10.3390/jmse13081538
Submission received: 30 June 2025 / Revised: 26 July 2025 / Accepted: 5 August 2025 / Published: 11 August 2025
(This article belongs to the Special Issue Optimized Design of Offshore Wind Turbines)

Abstract

To achieve the ‘zero carbon’ target, offshore renewable energy exploration plays a key role in many countries. Offshore wind energy and wave energy are both important offshore renewable energies. With the target to reduce the cost of energy, a new combined wind and wave energy converter is proposed in this work. The new concept consists of a spar-type floating wind turbine and a multi-section pitch-type wave energy converter (WEC). The WEC is attached to the spar column and consists of multiple sections with different lengths to absorb wave energy at different wave frequencies, i.e., multi-band absorption. Through multi-band wave energy absorption, the total power is expected to increase. In addition, through synergetic design, the dynamic motions of the platform are expected to decrease. In this paper, a fully coupled numerical model of the concept is established, based on the hybrid time–frequency-domain simulation framework. The frequency-domain hydrodynamic properties were transferred to the time domain. Then, the dynamic performance of the combined concept under wind–wave conditions was studied, especially under operational conditions. Mechanical couplings among multiple floating bodies were taken into account. To demonstrate the WEC effects on the floating wind turbine, the dynamic performance of the combined wind–wave energy converter concept was compared with the segregated floating wind turbine, with a focus on motions and output power. It was expected that the average overall output power of the multi-section WEC could be above 160 kW. The advantages of the combined concept are demonstrated.

1. Introduction

Under the Paris Agreement’s mandate for carbon neutrality by 2050 [1], the development of offshore renewable energy has emerged as a critical pathway for achieving decarbonization. Among offshore renewable energy, wind and wave energy both represent energy types with plentiful resources. The rapid development of offshore wind energy has led to advancements in floating platform designs, including barge-type, semi-submersible, spar, and TLP configurations. Over the past 15 years, there has been a significant increase in the size and power capacity of these floating wind turbines, from 2 MW to 20 MW capacity scale [2]. Concurrently, various concepts of WEC, such as oscillating water column (OWC), oscillating body systems, and overtopping converters, have been developed.
Offshore wind energy has almost achieved commercial viability through technological advancements. With offshore wind turbines progressively moving into deeper waters, where resources and space are more abundant, floating wind turbines provide better solutions compared with the bottom-fixed type in terms of economic and technological aspects. Nevertheless, the levelized cost of energy (LCOE) for floating wind turbines is still high, approximately 50% higher than that of onshore wind turbines, due to strict system requirements arising from complex environmental conditions and heavy infrastructure costs [3]. Meanwhile, scholars such as Ali [4] and Wang [5] et al. also performed floating platforms optimizations to enhance platform stability and reduce costs. However, wave energy converters (WECs) are far from commercialization. The reasons are multifaceted. Currently, wave energy conversion technologies face challenges such as high costs, reliability issues, and technological immaturity. Compared to other clean energy installations, the energy absorption efficiency of WEC is low (less than 30% [6]), and the absorption frequency bands are narrow and limited. The cost of infrastructure is very high, encompassing investments from research and development to operation and maintenance [7]. Furthermore, reliability under long-term wave loading [8] and adaptability to extreme sea conditions [9] must also be considered. Therefore, most of the WEC concepts are still in the demonstration phases, exemplified by the Pelamis attenuator, the WaveStar WEC array, etc. These limitations underscore the necessities to combine wind and wave energy systems into one integrated system. Through the integration, capital expenditure of infrastructures can be reduced, and power capacity can be increased.
In recent years, technological advancements in hybrid wind–wave systems have demonstrated promising pathways for cost reduction and performance optimization. The European Union has been leading in supporting several initiatives aimed at fostering the development of multi-purpose platforms, including H2OCEAN [10], MERMAID [11], TROPOS [12] and MARINA Platform Projects [13]. In addition, scholars have also proposed WINDFLOAT [14] and REFOS hybrid projects [15]. The TROPOS project explores four key areas—transport, energy, aquaculture, and leisure—exploring the synergies that can be achieved by combining these functions on a single platform [16]. The MERMAID project conducts a comprehensive analysis of the policy, economic, social, technical, environmental, and legal aspects of multi-purpose platforms across diverse locations [17,18]. The H2OCEAN project aims to create a combined wind-wave energy platform, capable of producing hydrogen, catering for diverse energy applications. The WINDFLOAT project aims to produce clean hydrogen using floating wind turbines in offshore wind farms as platforms. The MARINA Platform Project and the REFOS hybrid projects, in particular, were focused on the integration of offshore wind and wave energy into the mixed energy system. These projects highlight the potential of multi-purpose platforms in enhancing energy capture efficiency and dynamic stability.
There have been many combined wind–wave energy converters proposed and studied in recent years. One notable example is the Spar-Torus Combination (STC) [19] proposed by researchers at NTNU, which combines a spar-type floating wind turbine with a heave-type torus WEC. Through numerical simulations and wave tank experiments, Wan et al. [20,21] demonstrated that the STC concept exhibits favorable dynamic performance under both operational and extreme conditions, with the WEC contributing to additional energy capture while minimally affecting platform stability. Michailides et al. [22,23] introduced the combined concept of SFC (Semi-submersible Flap Combination), which consists of a 5 MW semi-submersible wind turbine and three flap-type wave energy converters. Their studies confirmed that the flaps not only enhance power output but also reduce platform motions under extreme sea conditions. Ren et al. [24] studied a combined wind–wave energy device consisting of a tension-leg platform (TLP) and a heave-type wave energy converter, where a heave-type WEC was found to increase total power generation while maintaining structural stability. Besides, there are other innovative designs. Homayoun et al. [25] investigated a combined system of a 5 MW semi-submersible wind turbine and three heave-type point absorbers, known as the SWWC. The simulation results showed a complementary relationship between wind and wave energy systems, which is a synergistic effect where wave energy compensates for wind intermittency. Zhang et al. [26] and Jin et al. [27] explored combinations of the DeepCwind floating turbine with Wavebob and Wavestar WECs, demonstrating that WECs can enhance platform performance without compromising stability. Kim et al. [28] analyzed the motion responses of wave-wave combined energy platforms with and without wave energy converters (WECs) through numerical modeling and wave tank tests. Rony et al. [29,30] successively conducted coupling dynamic analyses on the hexagon-shaped Frustum Tension-leg platform (FTLP) and three other types of offshore floating platforms, all of which supported a 5 MW wind turbine and were combined with various wave energy converters (WECs). These studies have enabled us to further understand the structural integrity, power performance and dynamic response of the floating wind energy platform in combination with WECs. Wan et al. [31] provided a comprehensive review of the technical development of combined wind–wave energy conversion systems, proposing a novel categorization method that identifies dynamic response characteristics based on the working principles of offshore wind turbines and wave energy converters. It was also highlighted that multi-body WECs in the combined system, which mitigate dynamic responses and amplify total power output, seem to be promising for achieving synergies. This suggests that future designs should focus on the multi-body WEC arrangement and optimizations to maximize synergies between wind and wave energy capture.
Although the proposed wind–wave combined systems have demonstrated that relatively reduced costs and increased energy output can be achieved, most of them obviously accommodate WECs that resonate within a single or narrow frequency band, i.e., WECs, and are designed to capture wave energy within a specific frequency band. With the aim to achieve multi-band or broad-band energy absorption within frequencies, a novel combined wind–wave energy converter is proposed in this work. This system combines a spar-type floating wind turbine with multi-section pitch-type wave energy converters, inspired by the ‘Pelamis’ concept [32]. However, unlike the ‘Pelamis’, the pitch-type WECs have different lengths in the proposed concept, targeting different resonant frequencies. They are connected to each other in series by a power take off (PTO) system. The first WEC is connected to the cylinder of the spar by a heave-type torus, with the aim to allow the relative yaw motions to make the WECs weather-vaned and to minimize the coupling effects between the wind turbine and WECs.
The aim of this paper is to investigate the dynamics of the proposed concept and explore the potential advantages and synergies of the combined concept. This paper is organized as follows: Section 2 describes the proposed concept; Section 3 introduces the theories and methodologies applied in this study; Section 4 provides the numerical modelling, verification study, and the simulation load cases; the results, discussions, and analysis are provided in Section 5. The conclusions are drawn in Section 6.

2. Concept Description

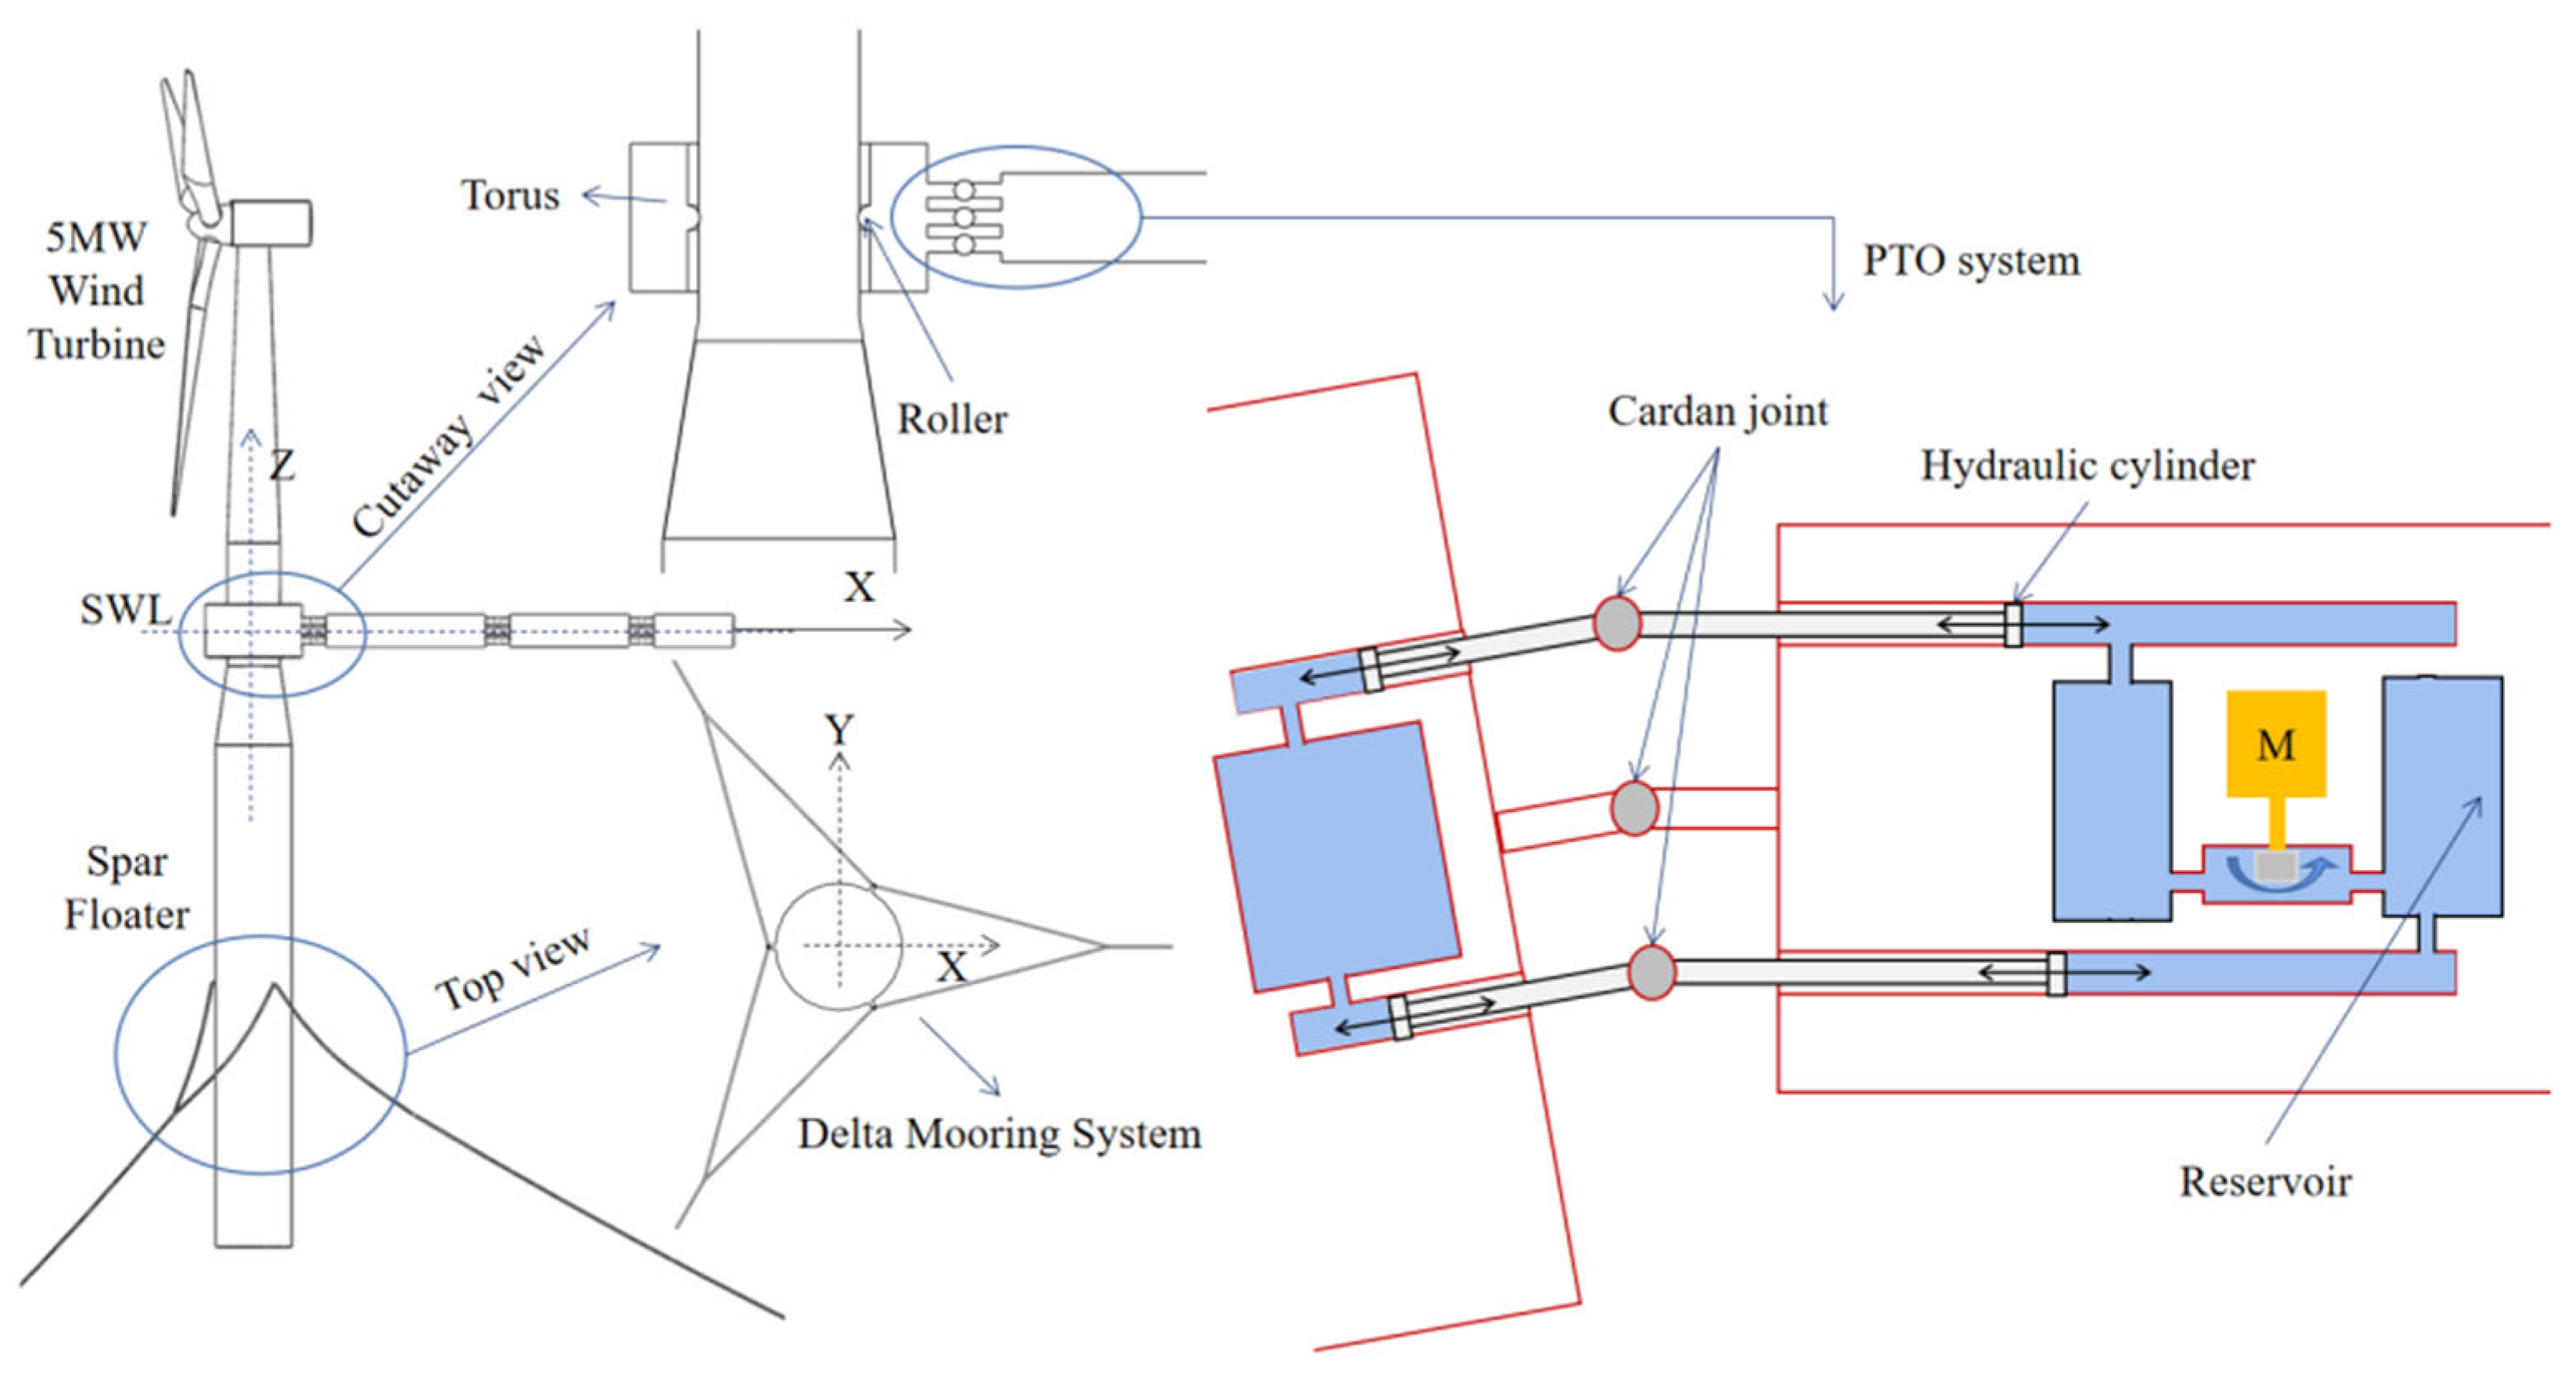
In this study, OC3-Hywind spar [33] is selected as the floating platform, supporting the NREL 5 MW baseline wind turbine [34]. We refer to it as the spar wind turbine or SWT for short. In SWT, the delta mooring system is designed to provide additional yaw stiffness. Taking SWT as a platform, pitch-type WECs are attached to it, through a torus. In this combined concept, the WECs are connected through a rotational hydraulic power take-off (PTO) system. Relative motions in the pitch and yaw degrees of freedom (DOF) are allowed, but with an end-stop system to prevent excessive relative motions. The relative rotations drive PTO rods to actuate hydraulic cylinders, then generate electricity using high- and low-pressure tanks, as depicted in Figure 1. In surge, sway, heave and roll DOFs, they are restrained through mechanical couplings. It is noted that the WECs are connected to each other in series and are designed with different lengths, with the aim to achieve resonance at different wave frequencies and multi-band absorption. A torus is installed along the spar cylinder and is also used to connect the first WEC to the SWT. The relative yaw motions of the spar and the torus are allowed, to achieve the “weather-vane” feature of the WEC system, so that the WECs face the varying incoming wave directions.
To investigate the single-WEC and multi-WEC effects on the combined concept, two combined concepts are studied here. As shown in Figure 2. The first combined concept includes one-section WEC, with the length of 15 m, referred to as S1W for short; the second combined concept includes three-section WECs, with lengths of 35 m, 25 m and 15 m respectively, referred to as S3W for short. The coordinate system is at the still water line, with the origin located at the spar cylinder center, and the positive x-axis points to the longitudinal direction of the WEC.
The draft of the OC3-Hywind spar floating platform is 120 m. The tower is located at the top of the floating platform, which is 10 m above the SWL. The more detailed platform properties are presented in Table 1, and more information can be found in [33]. It is noted that the moments of roll and pitch inertia (Ixx and Iyy) are calculated relative to the center of gravity, and the moment of yaw inertia (Izz) is calculated relative to the platform centerline. A 5 MW NREL reference wind turbine is used here, and detailed information can be found in [34].
The torus dimensions and WEC dimensions are presented in Table 2. The WECs in series have different lengths, i.e., 35 m, 25 m and 15 m, respectively. Their masses and moments of inertia are also different, and the radii of gyration are calculated with respect to their own centers of gravity. The ‘delta-type’ mooring system properties are given in Table 3. The SWT, S1W and S3W models all use the same mooring system. One of the mooring lines is aligned with the positive x-axis, with the other two evenly distributed at 120° and 240°.

3. Methodology

In the present study, potential flow theory is used in the frequency domain to calculate the hydrodynamic characteristics of the floaters. Panel models for both the spar and the WECs, based on potential flow theory, are employed to compute the hydrodynamic properties. The hydrodynamic loads in the frequency domain are determined using first-order calculations, and the mean wave drift forces are calculated. Hydrodynamic interactions between multiple bodies are considered.
To accurately capture the important nonlinear effects from wind turbine loads and the control, viscous effects on the floaters and mooring system, and the nonlinear forces in PTO systems, it is essential to perform time-domain calculations. Frequency-domain hydrodynamic parameters can be transferred to the time domain using retardation functions [35]. For slender bodies, where diffraction effects are often considered insignificant when the diameter is less than one-fifth of the wavelength, the Morison formula provides a practical approach, accounting for viscous effects in this work. Therefore, the Morison equation is used to consider the viscous effects on the cylinders of the spar and the WEC, focusing solely on the viscous term, while inertia effects are inherently included in the panel model. In the time domain, the hydrodynamic model used is linear and does not account for strong nonlinear effects such as water entry and exit. The time-domain motion dynamic equation is expressed as in Equation (1) [36]:
M + A x ¨ t + C q x ˙ t x ˙ t + 0 t k t τ x ˙ τ d τ + R x t = F t , x , x ˙
where A ( ) is the added mass matrix of the floater at infinite frequency; x , x ˙ and x ¨ are the displacement, velocity and acceleration vectors in the time domain, respectively; C q is the quadratic viscous damping coefficients matrix; F t , x , x ˙ is the hydrodynamic excitation forces in the time domain; k τ is the retardation function matrix caused by the wave memory effects. R is the hydrostatic restoring matrix provided by the mooring system.
Additionally, the S1W and S3W models must account for the hydrodynamic coupling effects. Taking S1W as an example, there are three rigid bodies, namely the spar, torus, and WEC floater. The motion equations have 18 degrees of freedom. Considering the aerodynamic forces acting on the floating wind turbine and the mechanical coupling force between the rigid bodies, Equation (1) can be rewritten as [20]:
M 1 + A 11 A 12 A 13 A 21 M 2 + A 22 A 23 A 31 A 32 M 3 + A 33 x ¨ 1 ( t ) x ¨ 2 ( t ) x ¨ 3 ( t ) + B 11 0 0 0 B 22 0 0 0 B 33 x ˙ 1 ( t ) x ˙ 1 t x ˙ 2 ( t ) x ˙ 2 t x ˙ 3 ( t ) x ˙ 3 t + 0 t k 11 t τ k 12 t τ k 13 t τ k 21 t τ k 22 t τ k 23 t τ k 31 t τ k 32 t τ k 33 t τ x ˙ 1 ( τ ) x ˙ 2 ( τ ) x ˙ 3 ( τ ) d τ + R 11 0 0 0 R 22 0 0 0 R 33 x 1 t x 2 t x 3 t = F w ( t ) 0 0 + F 1 m ( t ) F 2 m ( t ) F 3 m ( t ) + F 12 c ( t ) F 21 c ( t ) + F 23 c ( t ) F 32 c ( t )
where the subscripts 1 and 11 represent the variables of body 1 (spar), 12 and 21 represent the coupling variables between body 1 and body 2 (torus), and the remaining subscripts follow the same logic; F w ( t ) is the thrust of the wind acting on the spar, which is calculated as a drag force; F m ( t ) is the hydrodynamic excitation forces in the time domain; F c ( t ) is the mechanical coupling term between the two bodies, where, F 12 c ( t ) = F 21 c ( t ) and F 23 c ( t ) = F 32 c ( t ) . Take F 12 c ( t ) as an example, and it can be written as
F 12 c ( t ) = B 12 c x ˙ 1 ( t ) x ˙ 2 ( t ) + R 12 c x 1 t x 2 t
where B 12 c is the coupling damping coefficient matrix between body 1 and body 2, and R 12 c is the coupling stiffness coefficient matrix between body 1 and body 2.
The aerodynamic load of the wind turbine is typically determined using the blade element momentum (BEM) theory [37], which combines blade element theory and momentum theory, and is crucial for analyzing and optimizing the energy and aerodynamic performance of turbine blades. Momentum theory incorporates the principles of conservation of linear and angular momentum. By dividing the rotor into ‘n’ circular elements, the forces on each element are calculated, then the aerodynamic forces are calculated based on integration. In BEM theory, the forces on each element are derived using lift (CL) and drag (CD) coefficients, with the lift force dL and drag force dD expressed as [38]
d L = 1 2 ρ C L V 1 2 d r
d D = 1 2 ρ C D V 1 2 d r
The power coefficient (Cp) [39] can be calculated by using Equation (6):
C p = P s 1 2 ρ π R 2 U 0 3
where P S is the shaft power output in Watts and U 0 is the upstream undisturbed wind speed in m/s.
The wave power is extracted through the relative motions between different bodies. The motion referred to here is rotation. Therefore, the instantaneous absorbed wave power [40,41] generated by the motion of the WEC can be expressed in the form of Equation (7):
P i = π 180 M θ ˙ = π 180 C · θ ˙ · θ ˙
where P i is the instantaneous power (in kW) on a rotational flex joint of the WEC; C is the rotational damping coefficient (in KN·ms/deg) of the rotational flex joint; M is the rotational moment (in kN·m) of the rotational flex joint; θ is the relative angle (in deg) of pitch between two adjacent floating bodies; θ ˙ is the relative angular velocity (in deg/s) of pitch between two adjacent floating bodies. It is noted that the current investigation excludes the yaw motions between adjacent floating bodies and the energy that might be generated. Additionally, the impact of rotational stiffness between adjacent floating bodies on the motion and power generation performance is not accounted for, and its value is assumed to be small.
For the model with three-section WECs, three PTOs are designed. The first PTO is taken as the joint connecting the torus and the first WEC, and the power in the first PTO is denoted as P1; the second PTO connects the first WEC and the second WEC, and the power is denoted as P2; the last PTO connects the second and the third WEC, and the power is denoted as P3. Then, the total power (Pt) of three-section WECs is calculated as P1 + P2 + P3. In order to quantify the power performance index of the WECs in the combined concepts, the term capture width ratio (CWR) is used. CWR [42,43] is defined as the ratio of the power P (in kW) converted by the WEC to the available wave power J (in kW/m) and the characteristic dimension D (in m) of the WEC per unit wave front:
C W R = P J D × 100 %
The CWR (in %) is considered as the wave crest width that is fully captured and absorbed by the WEC. The wave resource J is wave power flux [44,45] and represents the wave power available per meter of wave crest width. The wave power flux in deep water can be calculated using Equation (9):
J = ρ g 2 64 π H s 2 T e
where Hs is the significant wave height; Te is the energy period, 1.12Te= Tp; and Tp is the peak period of the JONSWAP spectrum.

4. Numerical Models and Validation

4.1. Numerical Simulation Models

The panel models of the floaters were firstly established and the frequency-domain hydrodynamics with interactions were calculated in WADAM, which is a hydrodynamic module in HydroD [46] of SESAM. The wave period considered ranges from 2 to 30 s, with a 1 s interval. The wave directions were set to 0 to 360 deg, with an interval of 45 deg. To accurately capture the nonlinear features of the model, the time-domain model was used in the analysis. The frequency-domain hydrodynamic parameters are transferred to time-domain using Cummins function. Time-domain simulation models were established in SIMA [47], which is a time-domain modelling and simulation software developed by Sintef Ocean and DNV.
The NREL 5 MW wind turbine, with a control strategy, was used in the simulations. A delta-shaped mooring system was considered, using beam elements with the Morison equation to account for the hydrodynamic forces. Mean wave drift forces were considered, and the second-order slow drift motions were simulated based on Newman’s approximation, with Pinkster’s formula [48]. In the time domain, the connections between different bodies were established. The rotational PTOs were modeled using nonlinear rotational stiffness and damping coefficients, where end-stops were also considered. The rotational stiffness coefficient (K) of the joints and the rotational damping coefficient (C) of the joints can be adjusted to model the various PTO scenarios. Rotational limits of 30 degrees were imposed to prevent excessive relative angular motions between adjacent WECs. To prevent excessive relative heave between the torus and the spar, an end-stop was also set between them, limiting the relative heave to 2.5 m in the current design; however, this value is subject to change. In addition, the spar and the torus can move freely in the relative yaw direction so that the system can be weather-vaned under different environmental loading directions.
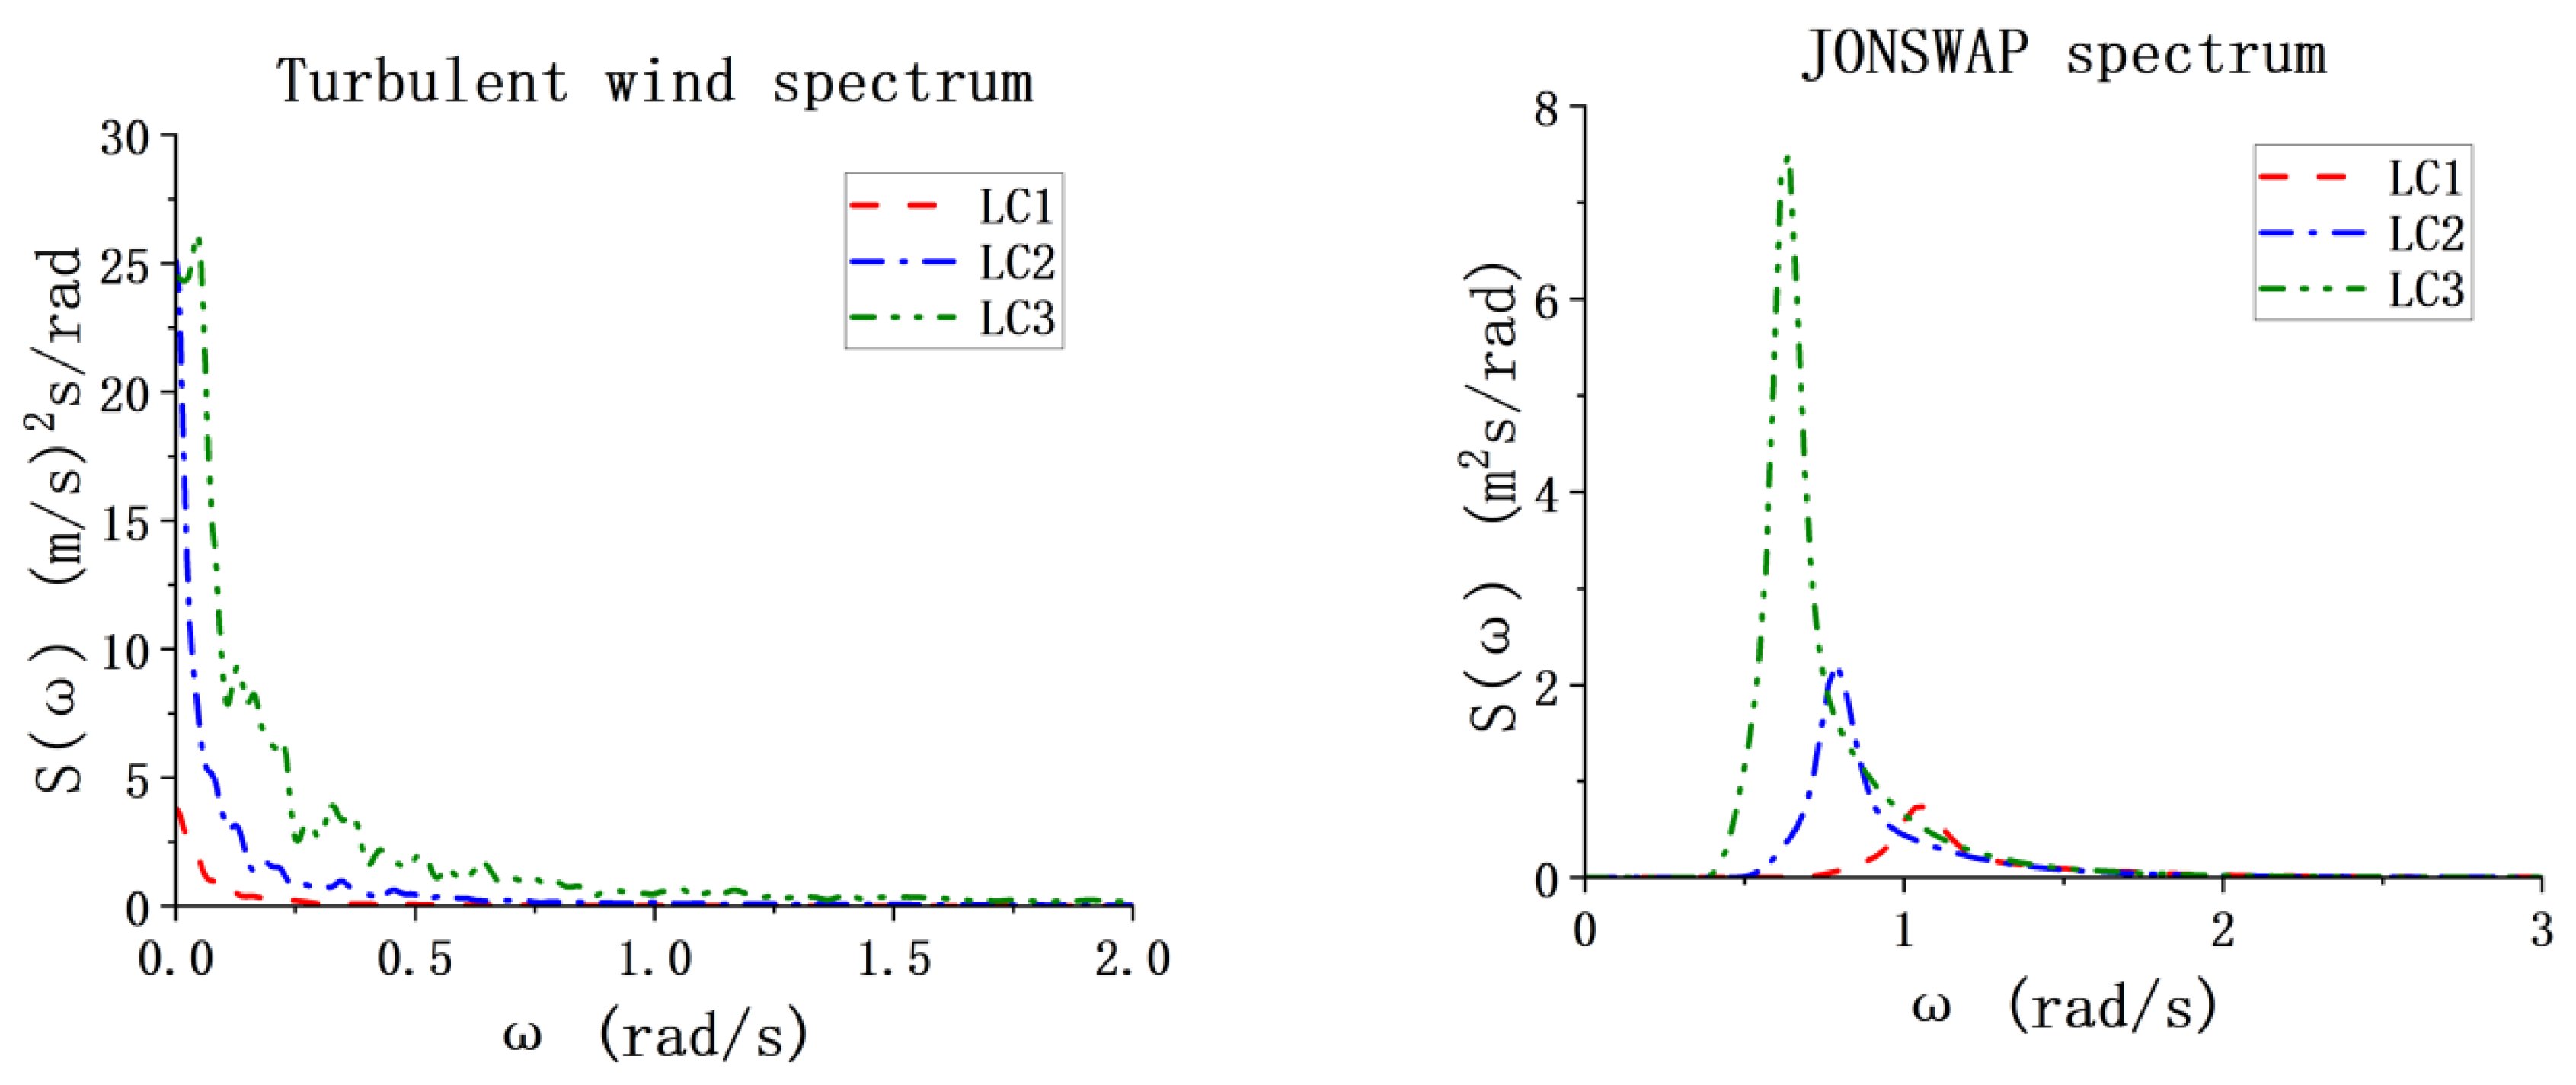
In time-domain simulations, decay tests were firstly carried out to identify the natural periods of the 6 DOFs. Joint wind–wave conditions were studied as key load cases (LCs) that cover the important environmental conditions. Wind velocities were successively considered as 6, 12 and 22 m/s, respectively, to cover the typical operational conditions of the wind turbine in different control regions. The Kaimal spectrum was used with a turbulent intensity of 0.16. The turbulent wind field was generated by Turbsim and covered the entire wind blade swept area. Wave conditions were also increased accordingly with the wind conditions, based on the South China Sea data [49]. The JONSWAP spectrum was used in this study. The LCs are listed in Table 4, specifying the significant wave height (Hs), spectral peak period (Tp) and wind speed at the wind turbine hub height (Uw). From LC1 to LC3, the wind velocities increase, covering the range from below-rated to above-rated wind speeds. The sea states are also increased accordingly. Figure 3 shows the wind spectrum and the wave spectrum of the LCs. A simulation time of 4200 s was adopted, with the last one hour of steady-state data used for analysis.

4.2. Model Validation

To ensure the correctness and accuracy of the current simulations, preliminary verification was carried out based on the comparison of motion RAOs of the SWT from the simulation in this work and the model test data from ref. [50]. Time-domain results on surge, heave and pitch motions are shown in Figure 4, respectively. The red lines represent the results obtained in this study, while the black dots are the results derived from the data in the reference. It is noted that the results of the model test do not contain data in frequencies below 0.2 rad/s; therefore, the numerical simulation results in the reference are used.
It is observed that, in the comparisons, the results follow the same trend and the values are close, indicating that the current simulation model can be used with confidence. The discrepancies between the simulation in this study and the model test data may be due to different damping levels due to the hydrodynamic viscous effects that are applied on the models, especially at the peak frequencies. In addition, there may be some bias and random errors that may not be fully taken into account in this comparison, due to a lack of detailed model test data. Comprehensive model tests and validation work will be further carried out in the future.

5. Results and Analysis

To fully understand the dynamic characteristics of the proposed combined concept, and to study the effects of the additional WECs onto the spar wind turbine, various simulation cases were performed, with the comprehensive results presented in this part. The impact of the WECs on the spar was firstly analyzed through decay tests. The natural periods and the dynamic response results of the spar under three different conditions are presented below. Since the PTO system of the WECs may play a role in system identifications, a PTO damping coefficient (C) of 500 kN·ms/deg is assumed in the analysis. In addition, the influence of the rotational stiffness coefficient is not considered in the paper; it is assumed that the rotational stiffness coefficient is very small and will not affect the system dynamics. Subsequently, white noise simulations were conducted. White noise is used to identify the optimal range of the PTO and the pitch RAO of the WECs for S1W and S3W. The white noise analysis and the settings for the PTO damping coefficient will be explored in detail in later sections. Finally, the effects of damping coefficients in the PTO on system dynamics and power performance are further carried out based on different LCs. In addition, the motion and power data of the three models in this study are comprehensively compared and analyzed, with a focus on the potential and feasibility of multiple frequency-band absorption of the three-section WEC.

5.1. Natural Periods

The natural periods of the spar in the three models, i.e., SWT, S1W and S3W are firstly identified in the six DOFs based on decay tests. The identified natural periods are presented in Table 5, with the decay curves in surge, heave and pitch shown in Figure 5. It is observed that the spar’s natural periods in heave and yaw are the same across the three models. This is due to the fact that the torus moves freely along the spar in heave and yaw; thus, it does not affect the spar’s mass or restoring stiffness in the two DOFs. In surge and sway, the WECs increase the total mass; thus, the natural periods increased gradually from SWT to S3W. The same situation occurs for roll and pitch. In the decay tests conducted under identical conditions, the amplitudes of surge, heave and pitch motions of the spar in both the S1W and S3W scenarios were observed to be less pronounced than those of the SWT. This is also a consequence of the presence of the torus and WECs, as well as the additional damping they introduce.

5.2. Comparative Analysis of Dynamics for the Three Models

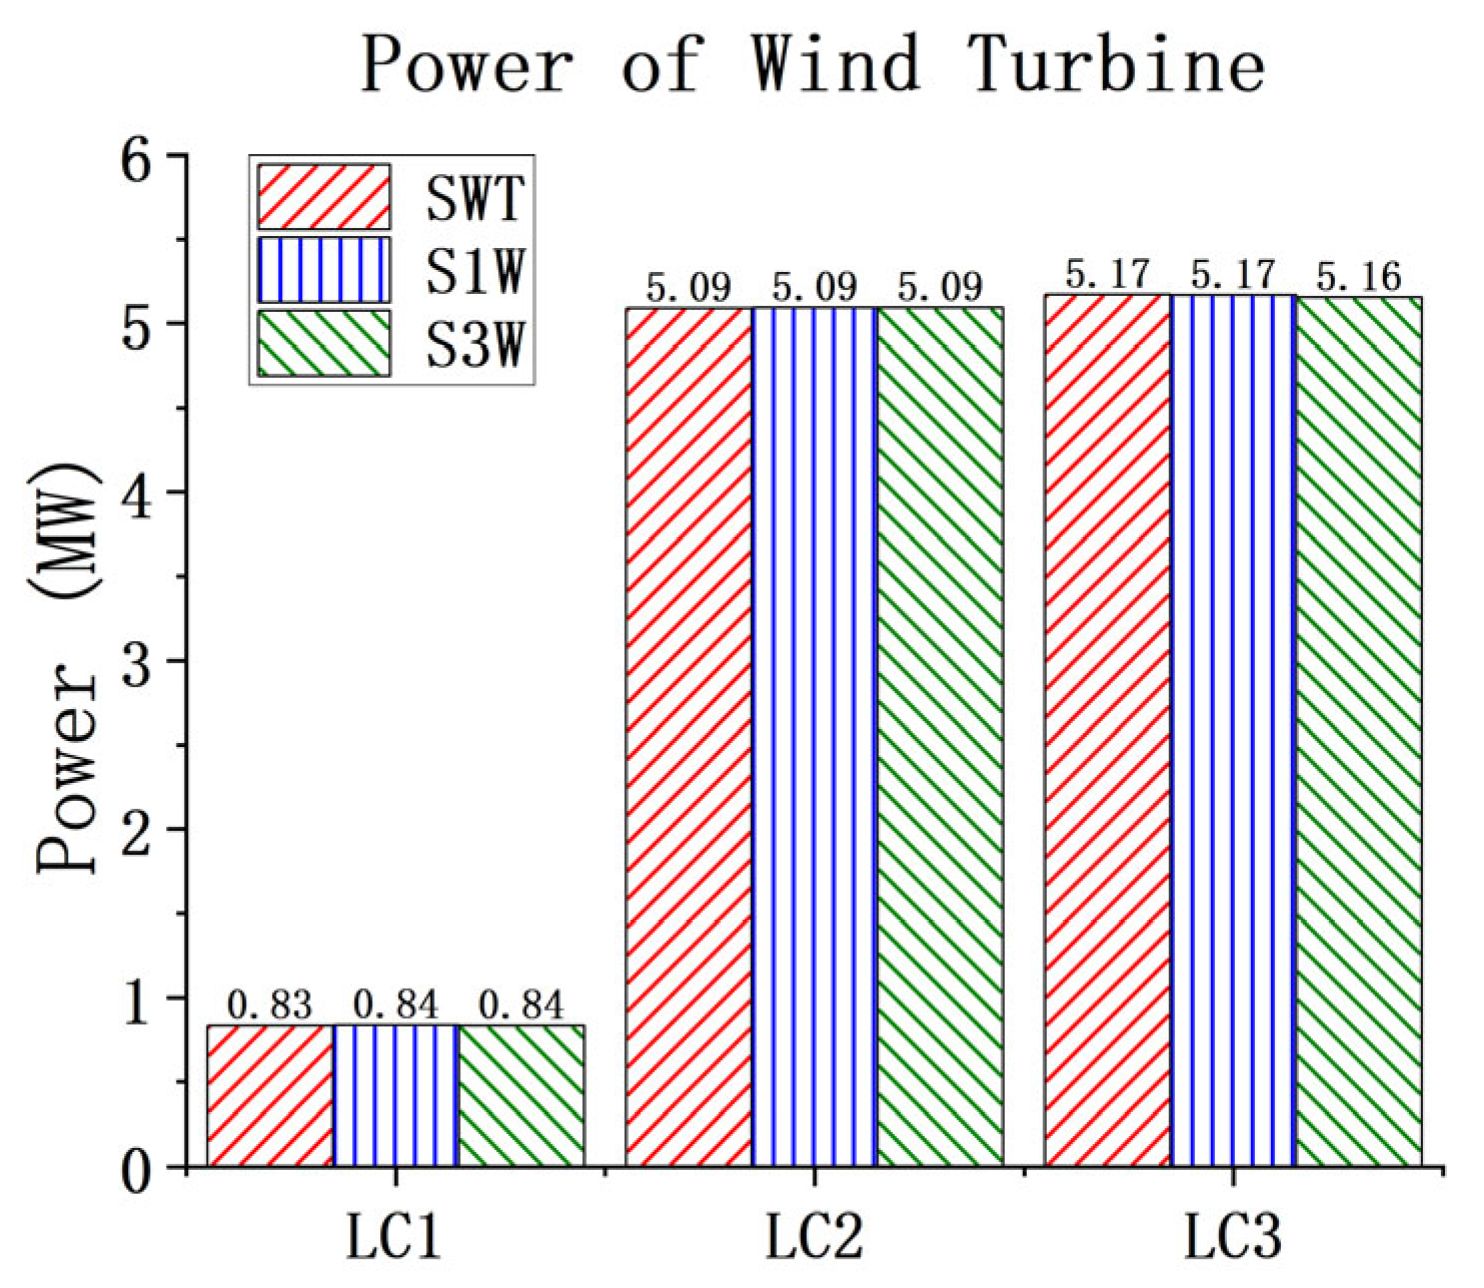
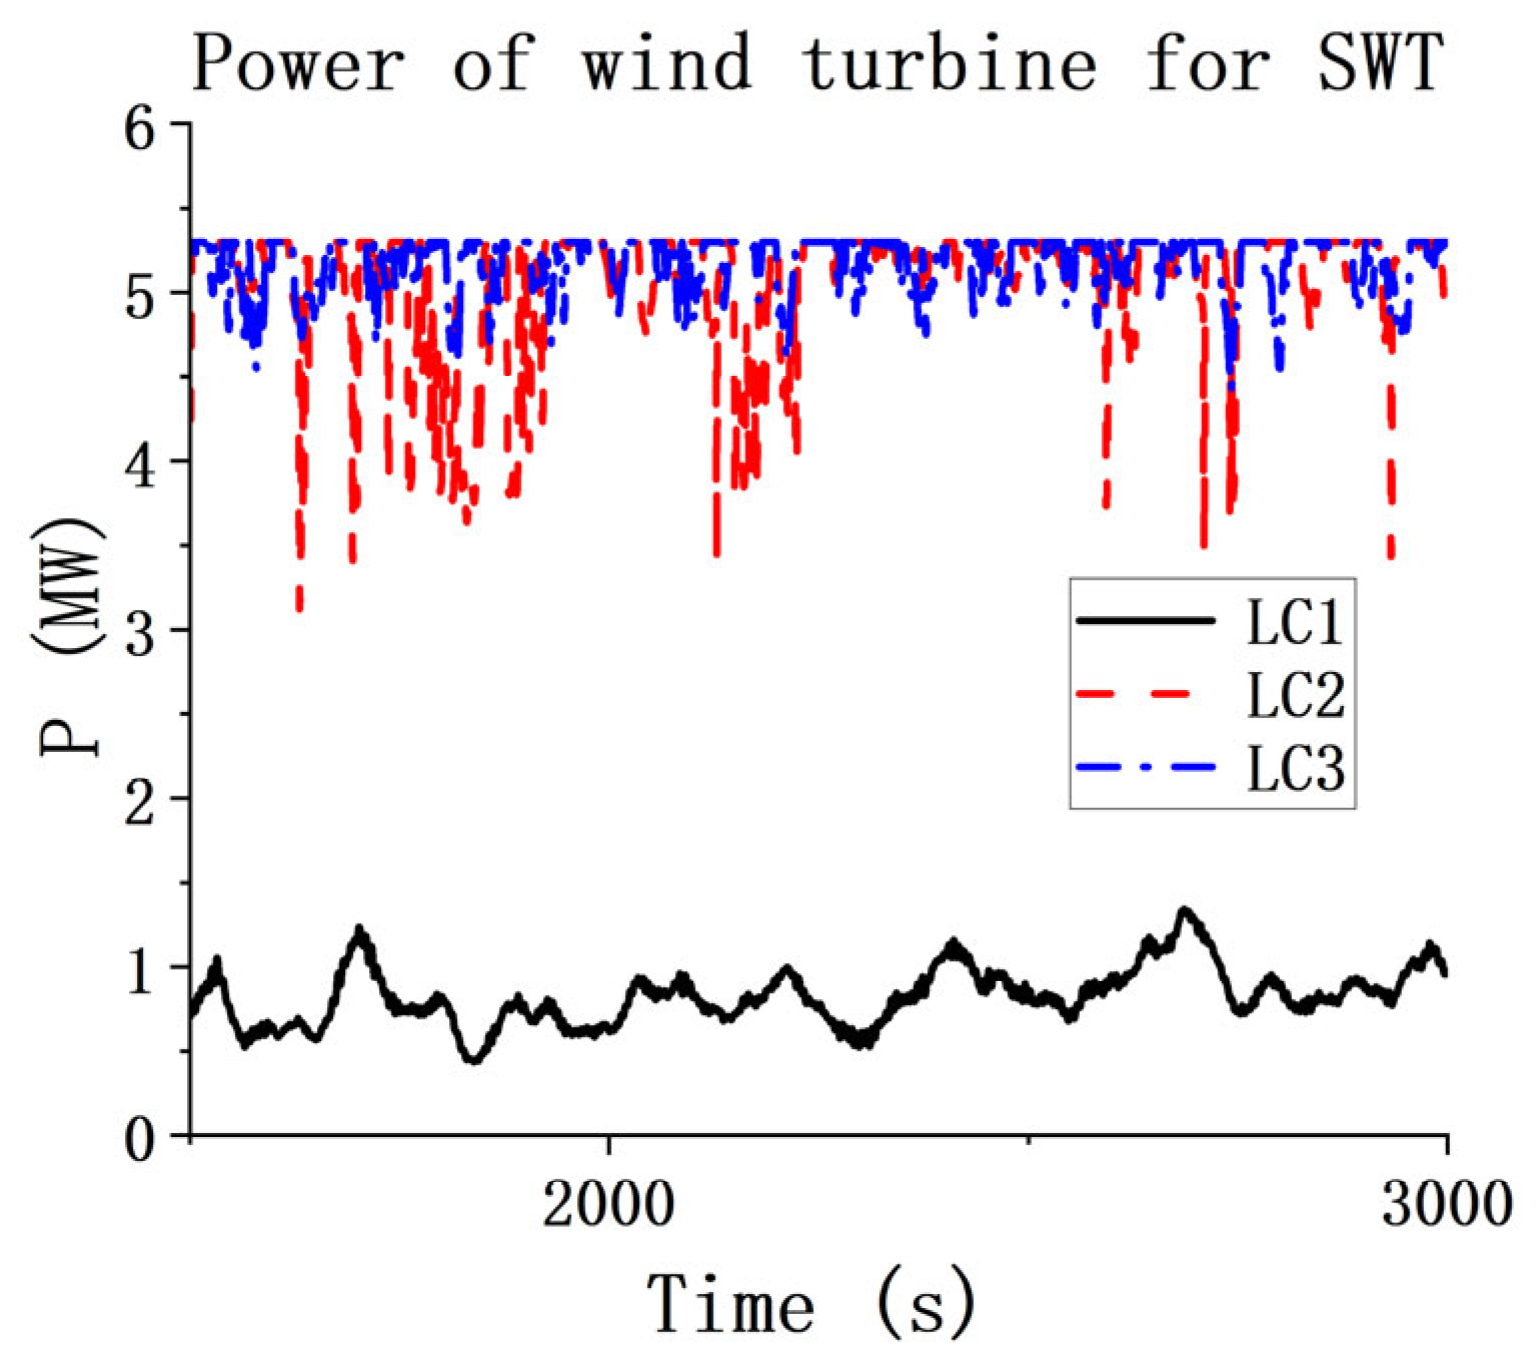
In order to facilitate the comprehensive and accurate comparisons of the dynamics for the three models, the PTO damping of C = 500 kN·ms/deg is employed in this section. The power output of the wind turbine for the three models under three loading conditions (LCs) is shown in Figure 6. As can be seen from Figure 6, the output power of the wind turbines for the three models remains nearly the same, indicating that the WECs have barely any influence on the wind turbine’s output power. Meanwhile, Figure 7 presents the output power time series of the wind turbine for the SWT. It can be seen that the power output is in line with the applied wind conditions, i.e., 5 MW for LC2 and LC3, while for LC1, the wind power output is much smaller. These results indicate the negligible effects from the WECs.
Figure 8, Figure 9 and Figure 10 illustrate the motion characteristics of the spar for the three models in the three LCs, to investigate the impact of the WEC on the floating wind turbine. It can be clearly observed from Figure 8 and Figure 10 that, under all loading conditions, the surge and pitch motions of the spar for the combined concepts exhibit some variations compared to those for the SWT. However, these differences are relatively small in terms of statistical values. It can be concluded that the presence of the WECs has little effect on the surge and pitch motions of the spar. To ensure the clear presentation of the data, Table A1, Table A2 and Table A3 in the Appendix A provide the relevant statistical values.
In LC1, the heave motion of the spar in the combined concepts differs only marginally from that of the SWT. However, at higher sea states, the heave of the spar in the combined concepts is more drastic. For instance, although the differences do not exceed one meter, the heave statistical values (excluding the mean) of the spar in the combined concepts are about twice those of the SWT in the LC3. This indicates that the heave motion of spar in the combined concepts, compared with that of the SWT, increases with increasing sea state. This may be due to the end-stops being set at 2.5 m in the combined concepts, which limits the relative heave between the spar and the torus. During high sea states, the heave of the torus increases, potentially leading to contact with the end-stop. Due to the forces exerted by the end-stop, this interaction can drive the spar to enlarge its heave motion. It is expected that this issue may be mitigated by optimizing the design of the torus to extend the end-stop range. Alternatively, the end-stop can be eliminated by fixing the torus on the spar. Figure 11 presents the surge, heave and pitch of the spar for the three models under LC3, including the heave motion of the torus for S1W and S3W.

5.3. Identification of the Optimal Damping Coefficient Based on White Noise

PTO damping, which is denoted as the parameter ‘C’ here, is a critical parameter that significantly influences the wave energy capture efficiency and the dynamic responses of both wave energy converters (WECs) and floating wind turbines. Before comparing and analyzing the three models, it is imperative to perform an initial assessment of the PTO damping to identify the optimal damping values. This preliminary analysis is essential for understanding the impact of the C, and for determining its optimal range. Such an analysis enables a precise evaluation of the dynamic responses across the models, as well as an in-depth analysis of their motion and power spectrum.
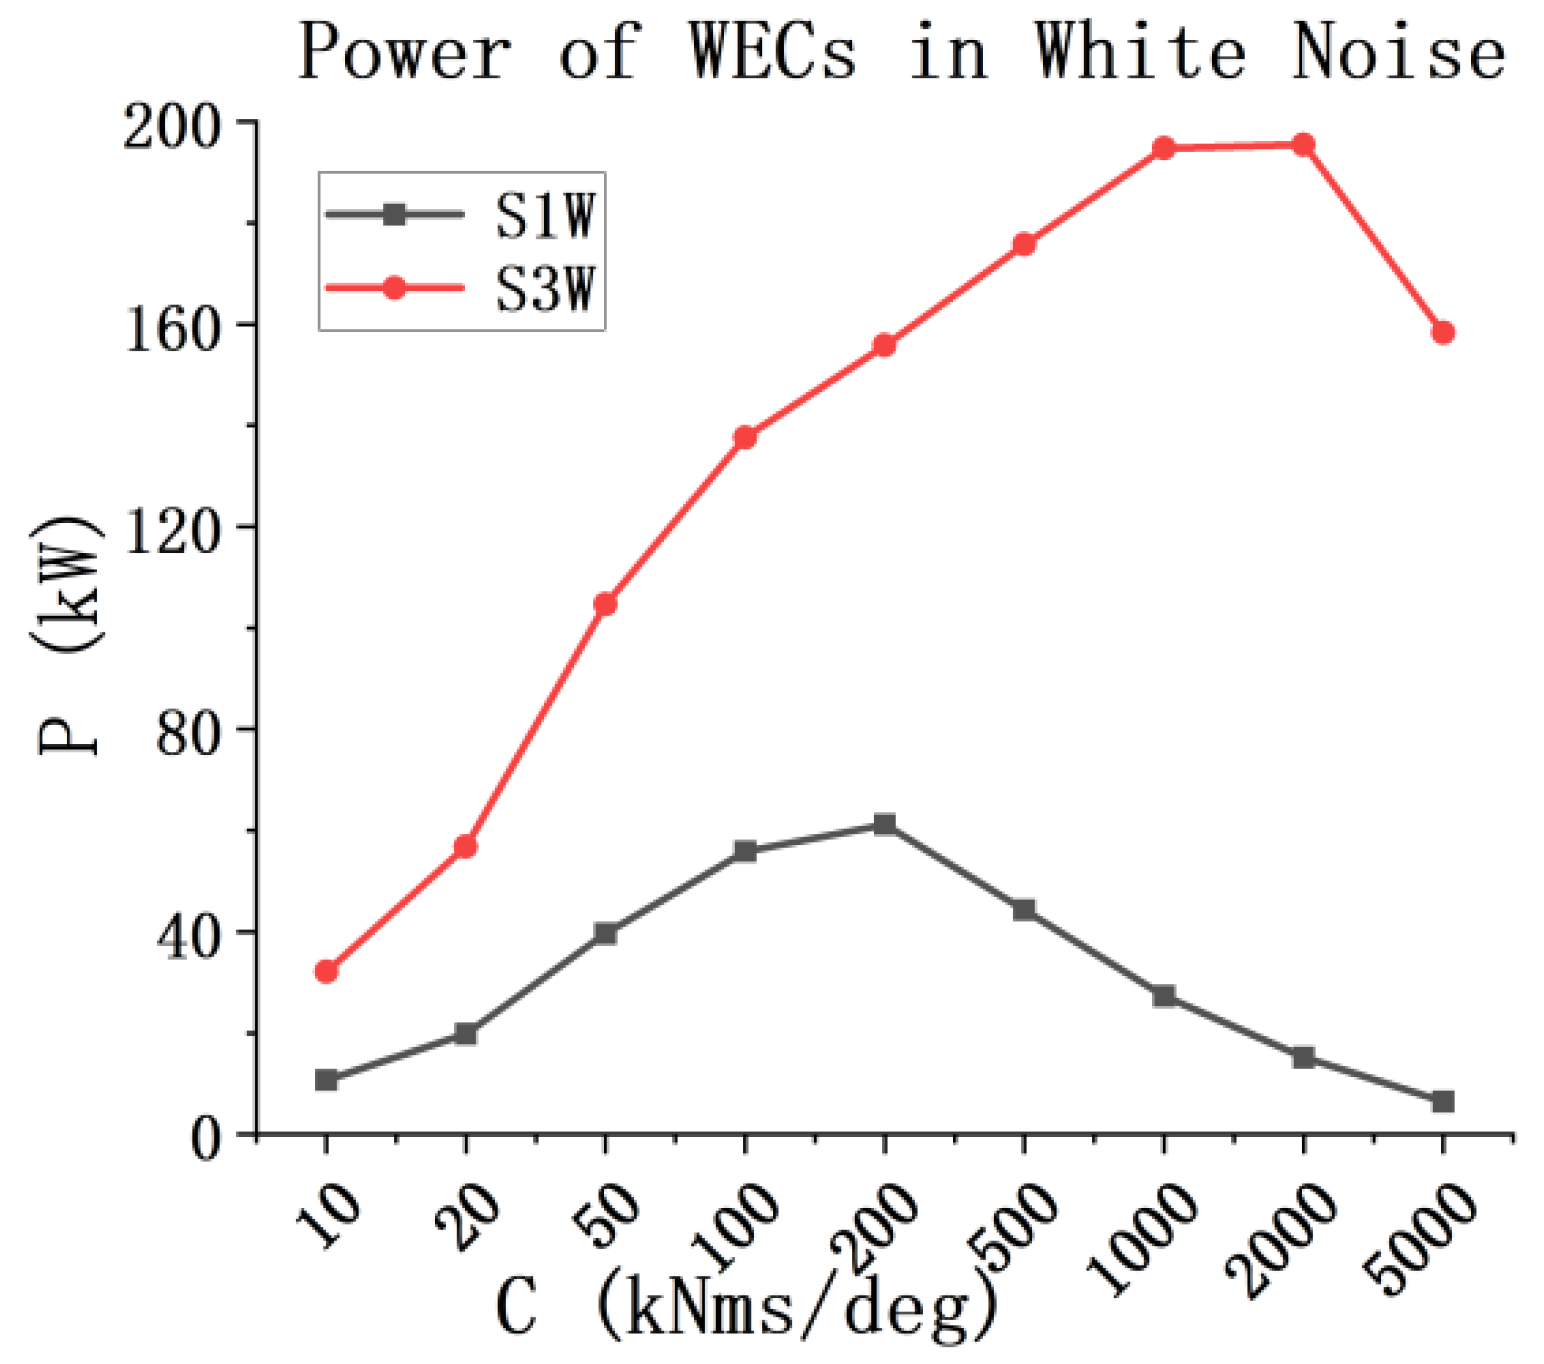
In this section, we focus on a comparative study on the PTO damping parameter for the S1W and S3W under white noise. White noise has uniform energy along all the frequencies, which can excite all the responses; therefore, it is better than the JONSWAP spectrum, which represents the energy distribution of the real sea states, in terms of identifying the optimum PTO damping and corresponding system responses. This study encompasses a damping range from 10 to 5000 kN·ms/deg, based on a certain scale, to facilitate a systematic investigation. Figure 12 illustrates the power output of the S1W and S3W as the PTO damping changes under the white noise, with the fitted curves representing the relationship between the WEC power output and the PTO damping.
From the results in Figure 12, it can be seen that the total power of the three-section WEC is always greater than that of the one-section WEC. The optimal PTO damping for the one-section WEC is around 200 kN·ms/deg, while that for the three-section WEC is around 2000 kN·ms/deg. It can be determined that the feasible optimal PTO damping range is between 200 and 2000 kN·ms/deg. To further investigate the influence of the C, we selected specific values of the C, namely 200, 500, 1000 and 2000 kN·ms/deg, for subsequent simulation and analysis.

5.4. WEC RAOs for S1W and S3W

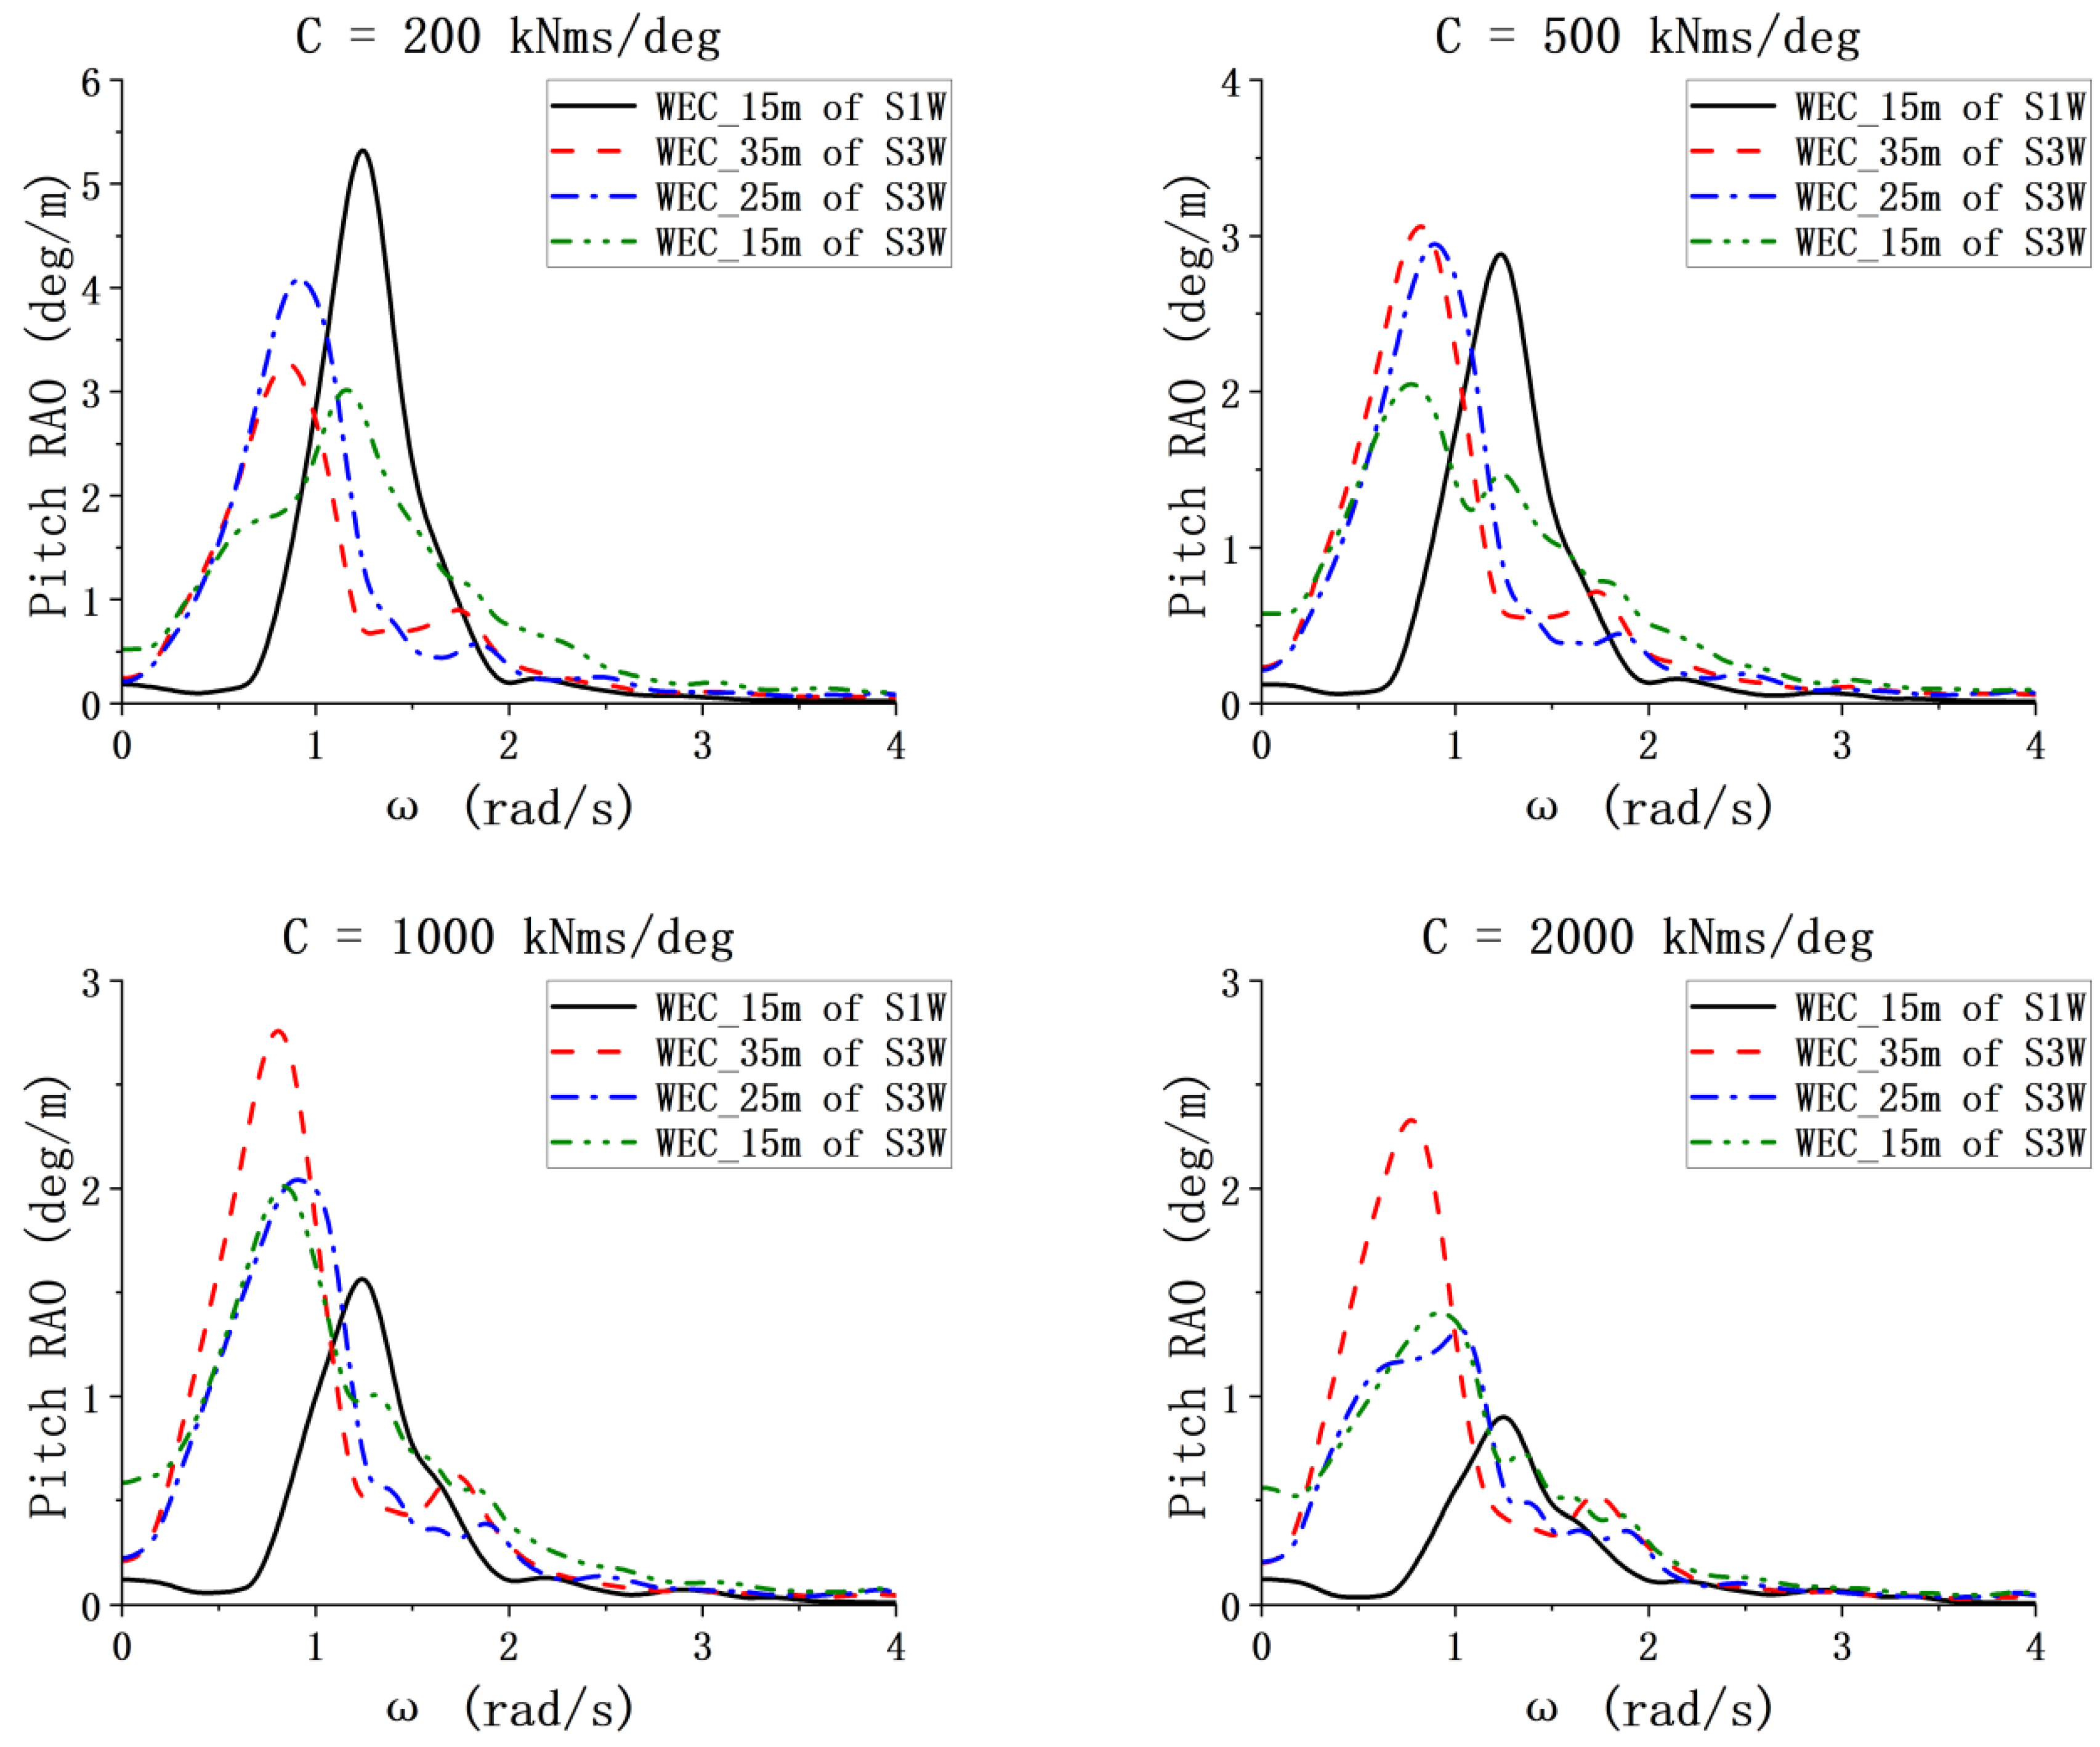
In the combined concept incorporating multi-section WECs, the pitch natural periods of the individual WECs vary, owing to their distinct dimensional attributes. This variation is conducive to the potential for multi-band wave energy capture. To substantiate the multi-band energy absorption capability of this combined concept, it is imperative to ascertain the pitch RAOs of the WECs. The optimal range of the PTO damping is preliminarily determined, then the data of C = 200, 500, 1000 and 2000 kN·ms/deg are selected successively for comparison and analysis of the WEC pitch RAOs. The pitch RAOs of the WECs for S1W and S3W, under the varied PTO damping conditions, are extracted from the white noise excitation spectra, with the outcomes depicted in Figure 13.
Figure 10 illustrates that the pitch RAO trends for the three floating bodies of the three-section WEC are relatively close. This similarity is attributed to the mechanical coupling effect through the interconnected PTO systems. However, the frequencies corresponding to the peaks are notably different, affirming the multi-band absorption capability of the three-body WEC model, i.e., due to the differing dimension of each WEC. There are differences between the pitch RAOs of the three-section WEC and the one-section WEC. This difference is likely caused by the different layouts of the WECs in S1W and S3W. In addition, the range of the pitch RAO for the three-section WEC is significantly larger than that of the one-section WEC. As the value of C changes, the peaks of RAOs of the WEC bodies with lengths of 25 m and 15 m also vary, highlighting the impact of PTO damping on the dynamic characteristics of the system of multi-section WECs.

5.5. Overall Dynamic Response and Spectral Analysis of S1W and S3W Under the Optimal PTO

5.5.1. Motion Response of Spar

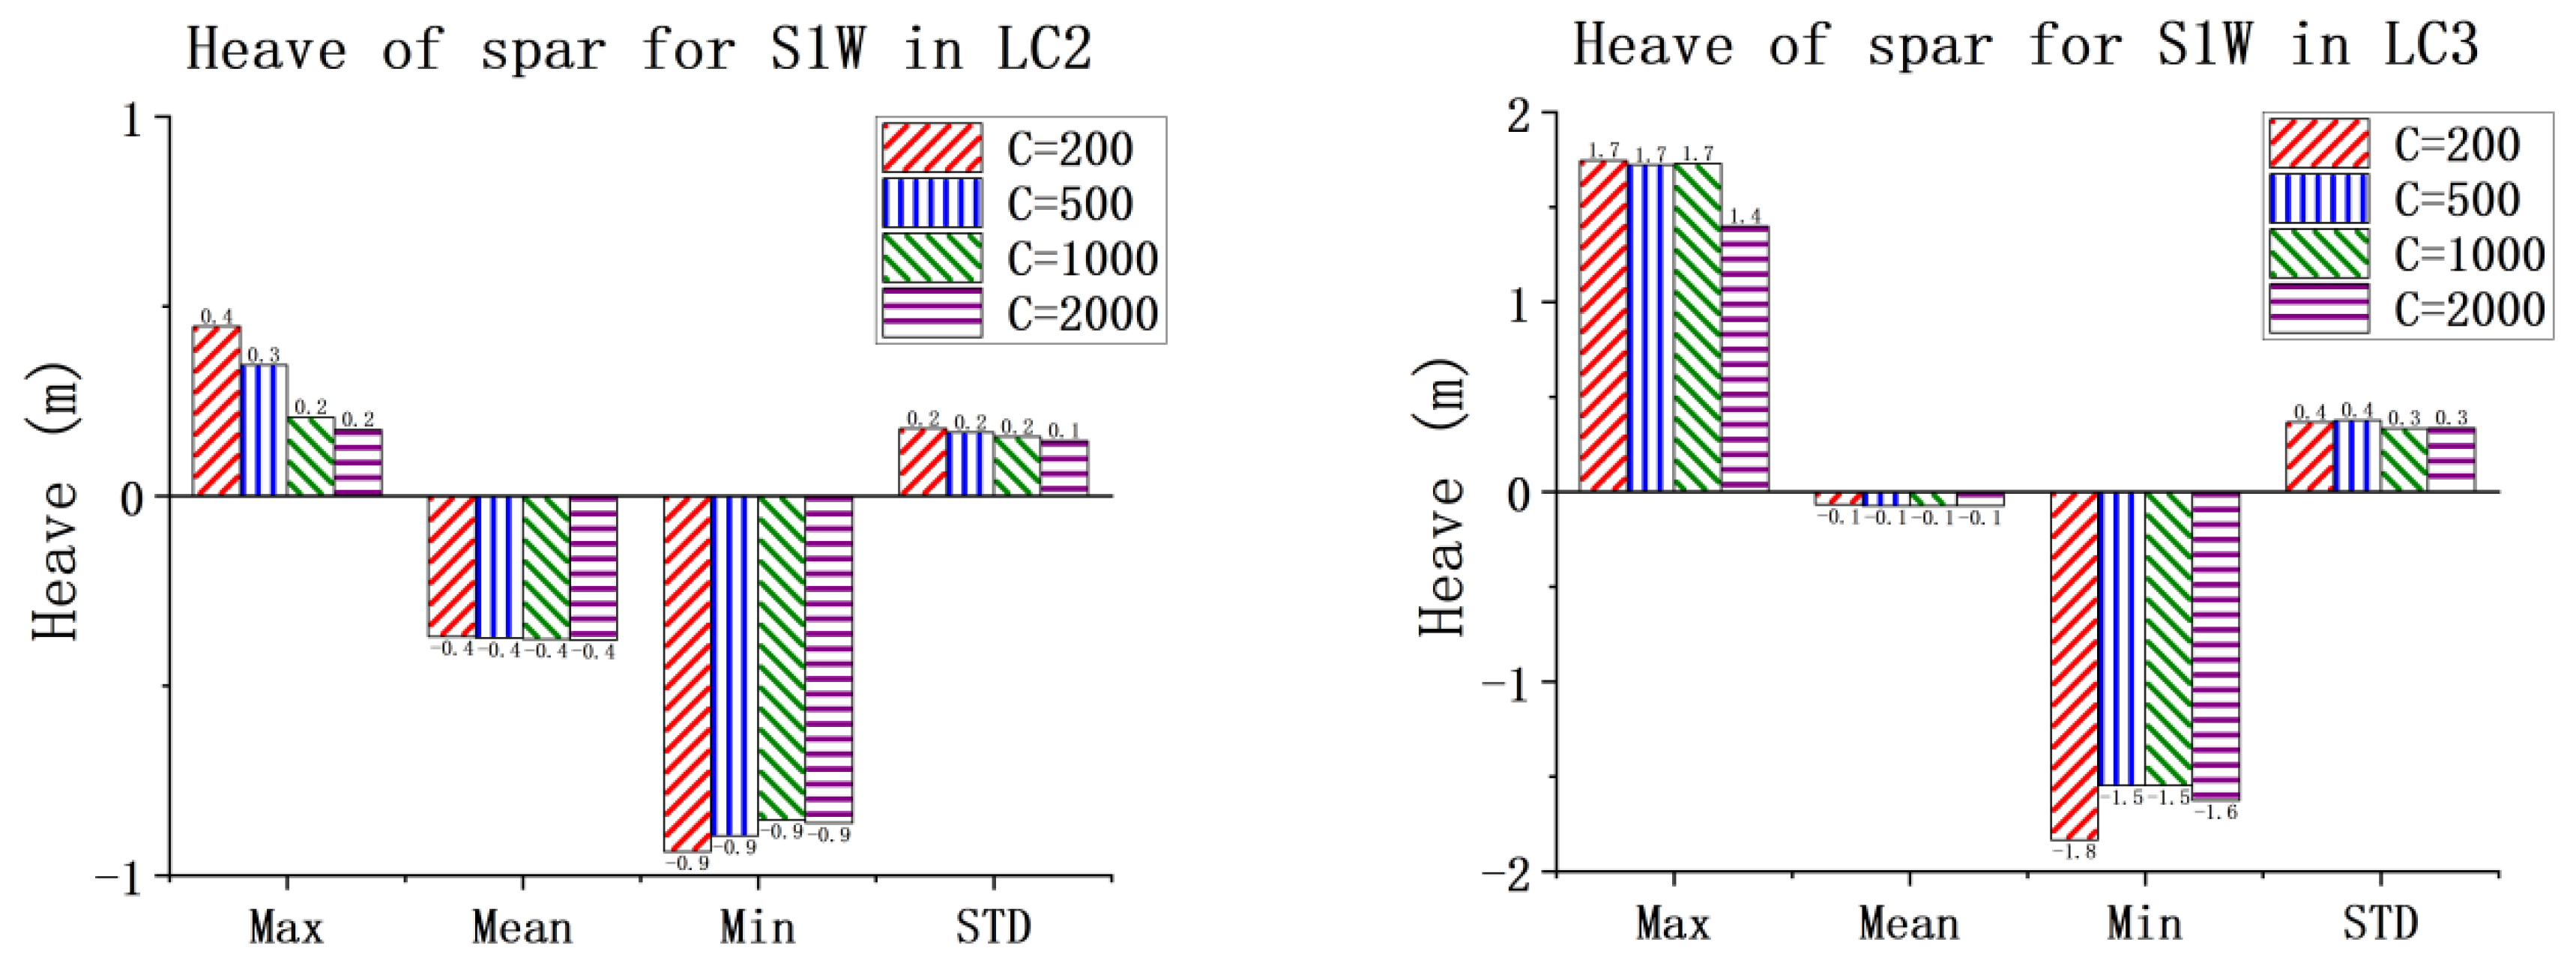
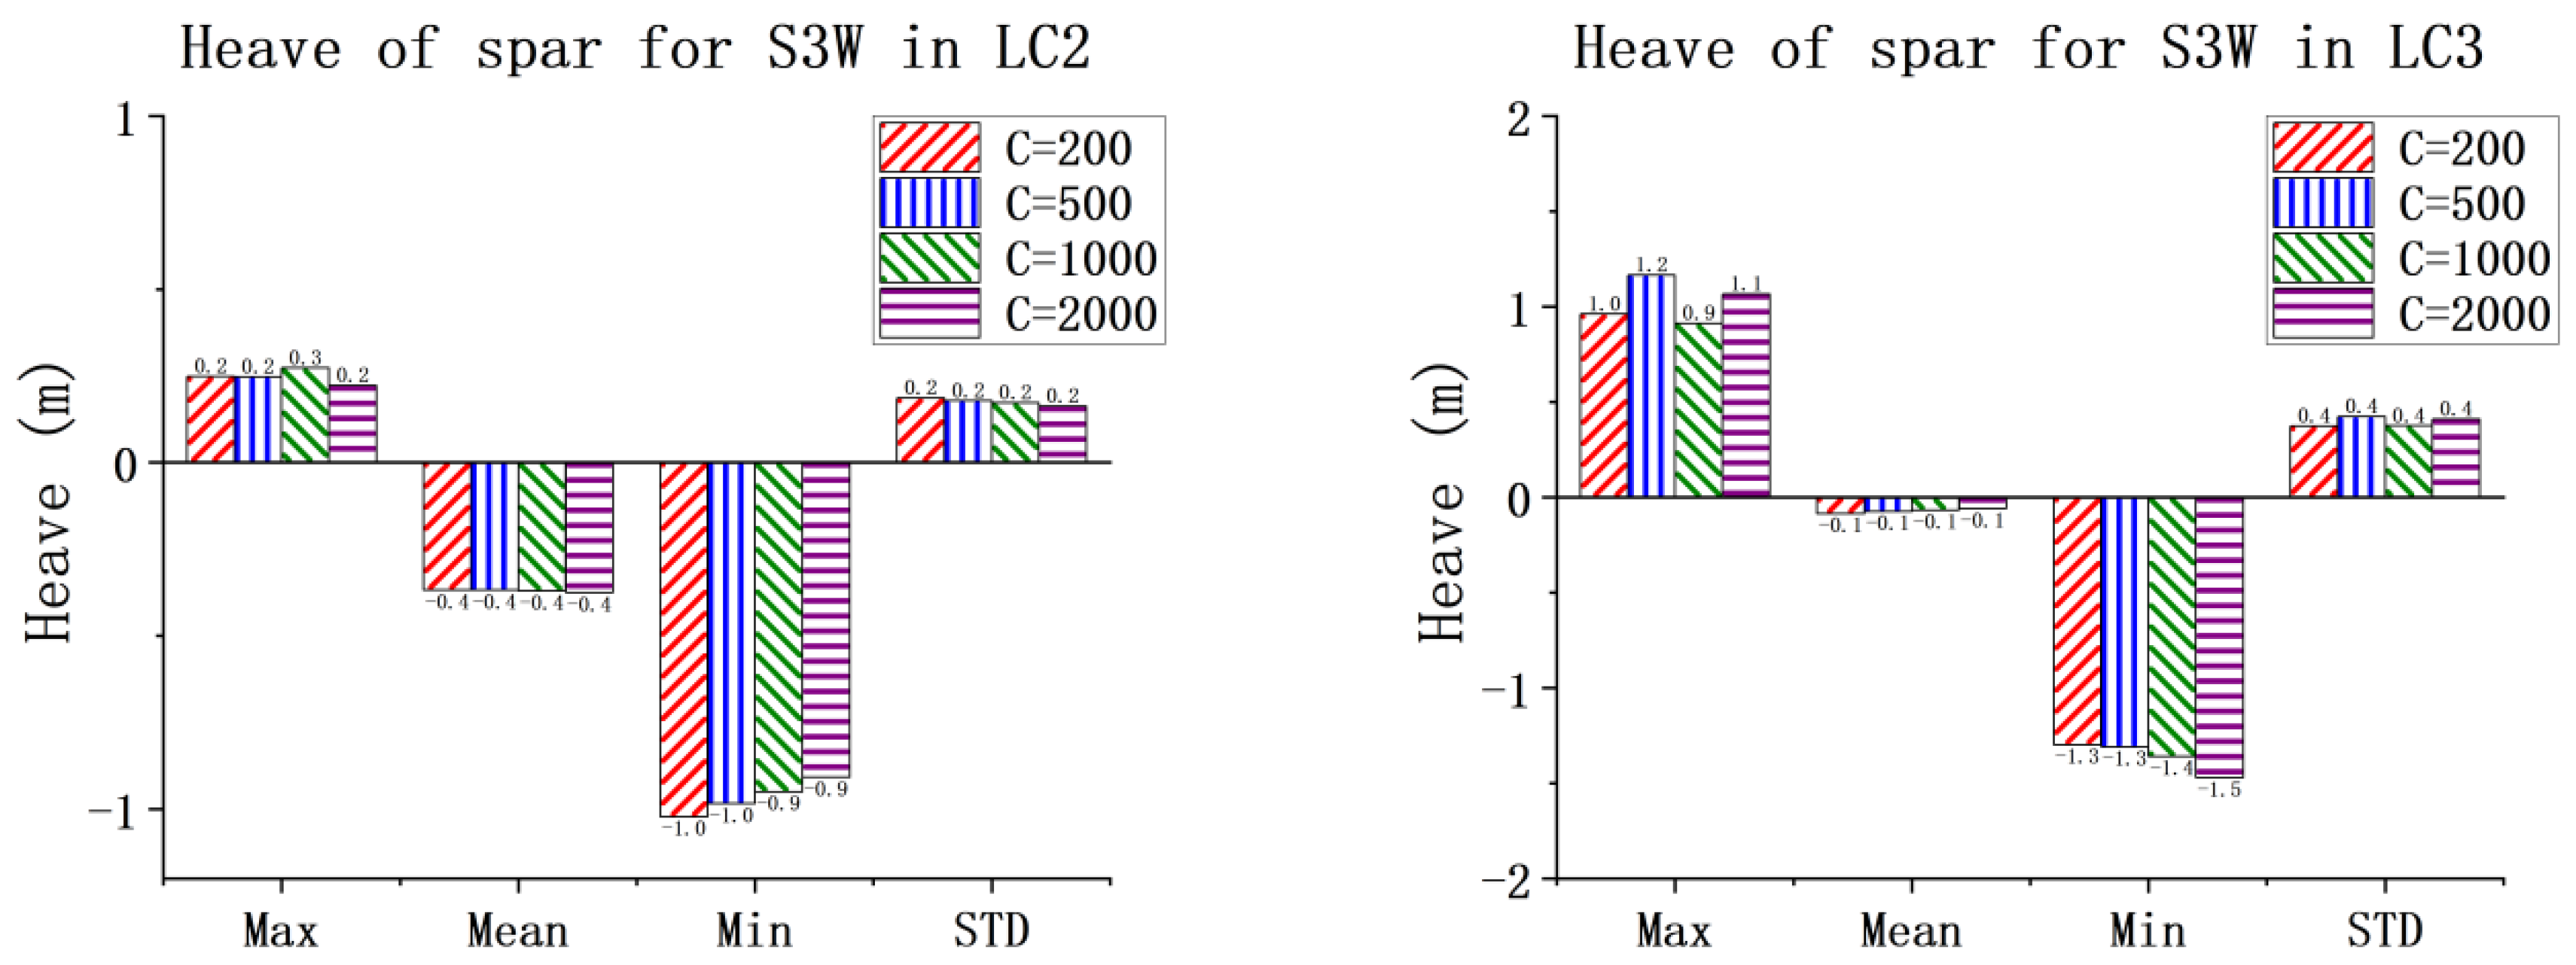
It is necessary to further study the impact of the PTO damping on the system dynamics, based on the findings in Section 5.2, which determined that the presence of the WEC has a minimal impact on the surge and pitch motions of the spar, and a slight effect on its heave motion under LC1. Given this, this section will focus solely on comparing and analyzing the results of the heave motion of the spar for the combined concepts under higher sea states. Figure 14 and Figure 15 present the statistical values of the heave motion of the spar for the combined concepts under LC2 and LC3. To ensure the clear presentation of the data, Table A4 and Table A5 in the Appendix A provide the relevant statistical values.
With the exception of individual cases, the general trend observed is that the greater the PTO damping, the smaller the heave motion of the spar. The maximum numerical difference observed is less than 0.3 m, which is not considered a significant variation. Therefore, it can be concluded that the PTO damping has little impact on the motion of the spar within the combined concepts.

5.5.2. Pitch Motion and Spectrum of WECs

Figure 16, Figure 17, Figure 18 and Figure 19 present the pitch motions of WECs for the combined concepts under three LCs. Under the same condition, the pitch motion amplitudes of floating bodies of the three-section WEC are basically smaller than those of the one-section WEC. As the severity of the sea states increases, the motions of the WECs increase significantly, which is reasonable. In addition, an obvious trend is that with increasing PTO damping, the WEC pitch dynamics decrease, with little exceptions for WEC_15 in the S3W model. One possible reason is that WEC_15 is in the free-end of the three-section WEC, and it is influenced significantly by the adjacent WEC, i.e., WEC_25. To ensure the clear presentation of the data, Table A6, Table A7, Table A8 and Table A9 in the Appendix A provide the relevant statistical values.
To ensure that the relevant theories have validity constraints when performing time-domain calculations on the model, it is necessary to determine whether there is an obvious water outflow phenomenon from the WEC floating body. Since the WEC of S1W exhibits the largest amplitude of pitch motion, it is taken as an example, and the maximum displacement of the lowest points at both ends of the WEC is calculated. Based on the significant wave height corresponding to the sea states, it is determined that there is no obvious water outflow at either end of the WEC floating body. Table 6 presents the results and comparisons of the relevant calculations.
To further analyze the influence of PTO damping on the pitch motion of the WECs and the differences between the three-section WEC and the one-section WEC, it is necessary to analyze the pitch spectrum of the WEC. For this analysis, two PTO damping values under LC2 are selected: 500 and 2000 kN·ms/deg. Figure 20 shows the corresponding pitch spectrum. The results of the pitch spectrum can lead to the same conclusion as the statistical values. The bandwidth and peak frequency of the pitch spectrum of the WEC are essentially the same as those of the wave spectrum, with negligible oscillations in the low-frequency region. This observation confirms that the pitch motions of WECs are dominated by wave conditions.

5.5.3. Power Output and Spectrum of WECs

To comprehensively study the impact of PTO damping on the power performance of the WECs, a comparison and analysis of the power output under different PTO damping values are comprehensively conducted. Figure 21 shows the power output of the WECs for S1W and S3W under various damping values. Notably, since the three-section WEC has three PTO joints, its average power is calculated as one-third of the total power and is also presented in the results.
As determined in Section 5.3, the optimal damping value for the one-section WEC is around 200 kN·ms/deg, while that for the three-section WEC it is around 2000 kN·ms/deg. However, optimal damping varies significantly under different sea states. Under a low sea state (LC1), the optimal damping value for both WECs is around 200 kN·ms/deg, and the output power decreases as damping increases. In high sea states (LC2, LC3), the optimal damping value for the one-section WEC shifts to around 500 kN·ms/deg, while that for the three-section WEC returns to approximately 2000 kN·ms/deg.
The output power of the WECs is significantly affected by the damping condition. The total power of the three-section WEC consistently exceeds that of the one-section WEC. In LC1, the average power of S3W is less than that of S1W under small PTO damping values; however, with increased damping, S3W exhibits better performance. This trend is more obvious in LC2 and LC3. It can be concluded that a large PTO damping value is optimum for S3W, which is also confirmed in Figure 12. In addition, with the increasing sea states and PTO damping, the average power output of the three-section WEC is increasingly larger than the total power output of the one-section WEC. Therefore, we can conclude that in general, the power generation capacity of the three-section WEC is superior to that of the one-section WEC, especially for large sea states.
To facilitate the exploration of the potential and feasibility of multi-band absorption of three-section WEC in S3W, this section selects the power spectrum with the same loading conditions and PTO damping as the previous section for analysis, as shown in Figure 22. From the power spectrum, it is evident that for the three-section WEC, the second PTO joint generates the largest power and the third PTO joint exhibits the smallest power output. However, when the PTO damping is large enough, the power spectrum coverage range of the three-section WEC is significantly broader than that of the one-section WEC. Therefore, it is confirmed that the three-section WEC has the capability and feasibility for broader frequency band absorption.

5.5.4. CWR of WECs

To more effectively compare the power output performance of the WEC for two combined concepts, Figure 23 presents a comparison of their capture width ratios (CWRs). The characteristic dimension of the WEC is the diameter of the floating body, and the characteristic dimension adopted by the three-section WEC is the sum of the diameters of the three floating bodies. As sea states intensify, the CWR of WECs for the combined concepts decreases. It can be observed that the trend of WECs’ CWR variation with PTO damping is similar to that of their respective power outputs. With an increase in PTO damping, the CWR of the three-section WEC caught up with and even surpassed that of the one-section WEC. This finding is consistent with the earlier conclusions regarding the total power of S1W and the average power of S3W.

6. Conclusions and Prospects

This study introduces a novel combined concept that combines a spar-type floating wind turbine with a multi-section pitch-type wave energy converter (WEC), referred to as S1W or S3W, depending on the number of WEC floating bodies. The WEC is attached to the spar column and consists of multiple sections with different WEC lengths to absorb wave energy across multiple frequency bands. The torus serves as the connection between the WEC and the spar, allowing for free heave movement to reduce the spar motion influenced by the WEC, while constraining the relative horizontal motion between the spar and the torus. The design also includes a weather-vane capability.
This study confirms the synergistic design of the WEC through simulations. It demonstrates that the existence of WECs has little impact on the overall dynamic response of the spar wind turbine and has only a certain influence on the heave motion. Through the comparison and analysis of the total power for the one-section WEC and the three-section WEC with different PTO damping conditions under white noise, the optimal PTO damping range is determined. The given results indicate that the total power of the three-section WEC is always greater than that of one-section WEC. The pitch RAO results of the WEC floating bodies for S1W and S3W are also obtained. Differences in the pitch natural frequencies of different WEC floating bodies are identified. This observation indicates the potential of multi-band energy absorption for the three-section WEC.
The PTO damping condition has little effect on the motion responses of the spar wind turbine but has significant impacts on the pitch motions of the WECs. As PTO damping increases, the amplitude of WEC pitch clearly decreases, with the exception of WEC_15 m in the S3W model. Under low sea states, the average power of the three-section WEC is lower than the total power of the one-section WEC. However, as the sea state and PTO damping increase, the average power of the three-section WEC increases significantly, indicating that under optimal PTO damping, the energy absorption capability of the multi-section WEC is greatly enhanced. The CWR results of the WECs also confirm this conclusion. The power spectrum results also confirm the multi-frequency energy absorption capability of the three-section WEC. In general, by the comprehensive analysis of the dynamics of the combined concepts, particularly under the three operational conditions, it reveals that the dynamic responses are within a reasonable range. This observation indicates the feasibility of the proposed concepts.
Moving forward, the intricacy of the combined concept necessitates additional research efforts. For instance, the accuracy of the numerical model should be further confirmed through experimental model testing, and the dynamics of the combined concept under extreme environmental conditions needs to be examined. Moreover, the design and optimization of the WECs, including the number and dimensions of the floating bodies, as well as the selection of rotational stiffness and damping coefficients for different joints, will play a critical role in enhancing multi-band absorption. Additionally, implementing adaptive damping control that responds to environmental fluctuations could be key to optimizing the efficiency of wave energy capture.
Author Contributions

Writing–original draft, J.X. (Jiahao Xu); editing, J.X. (Jiahao Xu) and L.W.; simulation, J.X. (Jiahao Xu); visualization, J.X. (Jiahao Xu); review, L.W., G.X., J.X. (Jianjian Xin), W.S., K.W. and C.M.; methodology, L.W., G.X., J.X. (Jianjian Xin) and W.S.; conceptualization, L.W., K.W. and C.M.; supervision, L.W., G.X. and J.X. (Jianjian Xin); funding acquisition, L.W.; resources, W.S. All authors have read and agreed to the published version of the manuscript.

Funding

This research was funded by Ministry of Science and Technology of the People’s Republic of China, the Department of International Cooperation Intergovernmental International Science and Technology Innovation Cooperation [grant no. 2024YFE0101200], Key R&D Project of Zhejiang Province [2024C03031], the National Natural Science Foundation of Zhejiang Province, China [LY24E090001], Key R&D Project of Ningbo, China [2024H029], and the “111” Project “Centre on Safety and Intelligent Operation of Sea Bridge” [D21013].

Data Availability Statement

Data will be made available on request.

Acknowledgments

The authors would like to acknowledge the financial support from the Ministry of Science and Technology of the People’s Republic of China, the Department of International Cooperation Intergovernmental International Science and Technology Innovation Cooperation Key R&D Project of Zhejiang Province, the National Natural Science Foundation of Zhejiang Province, China, Key R&D Project of Ningbo, China, and the “111” Project “Centre on Safety and Intelligent Operation of Sea Bridge”.

Conflicts of Interest

The authors declare that they have no known competing financial interests or personal relationships that could have appeared to influence the work reported in this paper.

Appendix A

Table A1. The surge of the spar for three models in three LCs.
Surge (m) of SparMaxMeanMinSTD
SWT in LC18.96.64.01.0
S1W in LC19.16.84.11.0
S3W in LC19.16.74.11.0
SWT in LC225.717.08.83.1
S1W in LC225.417.19.43.0
S3W in LC225.417.19.53.1
SWT in LC312.68.44.31.0
S1W in LC312.78.54.61.0
S3W in LC312.88.44.71.1
Table A2. The heave of the spar for three models in three LCs.
Heave (m) of SparMaxMeanMinSTD
SWT in LC10.0−0.1−0.20.0
S1W in LC1−0.1−0.1−0.20.0
S3W in LC1−0.1−0.1−0.20.0
SWT in LC20.0−0.4−0.90.1
S1W in LC20.3−0.4−0.90.2
S3W in LC20.2−0.4−1.00.2
SWT in LC30.7−0.1−0.70.2
S1W in LC31.7−0.1−1.50.4
S3W in LC31.2−0.1−1.30.4
Table A3. The pitch of the spar for three models in three LCs.
Pitch (deg) of SparMaxMeanMinSTD
SWT in LC12.01.50.90.2
S1W in LC12.01.50.90.2
S3W in LC12.01.50.90.2
SWT in LC25.73.60.90.8
S1W in LC25.63.51.00.8
S3W in LC25.73.51.00.8
SWT in LC33.31.90.20.5
S1W in LC33.51.90.20.5
S3W in LC33.61.90.20.6
Table A4. Heave of the spar for S1W in LC2 and LC3.
Heave (m) of Spar for S1WMaxMeanMinSTD
LC2C = 2000.4−0.4−0.90.2
C = 5000.3−0.4−0.90.2
C = 10000.2−0.4−0.90.2
C = 20000.2−0.4−0.90.1
LC3C = 2001.7−0.1−1.80.4
C = 5001.7−0.1−1.50.4
C = 10001.7−0.1−1.50.3
C = 20001.4−0.1−1.60.3
Table A5. Heave of the spar for S3W in LC2 and LC3.
Heave (m) of Spar for S3WMaxMeanMinSTD
LC2C = 2000.2−0.4−1.00.2
C = 5000.2−0.4−1.00.2
C = 10000.3−0.4−0.90.2
C = 20000.2−0.4−0.90.2
LC3C = 2001.0−0.1−1.30.4
C = 5001.2−0.1−1.30.4
C = 10000.9−0.1−1.40.4
C = 20001.1−0.1−1.50.4
Table A6. The pitch of WEC_15m for S1W in three LCs.
Pitch (deg) of WECMaxMeanMinSTD
LC1C = 2008.0−0.9−10.32.7
C = 5004.4−0.8−6.31.6
C = 10002.4−0.8−3.91.0
C = 20001.0−0.8−2.60.6
LC2C = 20011.6−2.0−13.63.8
C = 5007.2−2.0−9.82.7
C = 10004.3−2.0−7.81.7
C = 20002.2−1.9−5.71.0
LC3C = 20017.4−1.1−20.04.8
C = 50012.2−1.1−15.53.6
C = 100012.5−1.1−12.32.4
C = 20007.7−1.0−8.41.5
Table A7. The pitch of WEC_35m for S3W in three LCs.
Pitch (deg) of WECMaxMeanMinSTD
LC1C = 2003.7−0.2−4.11.0
C = 5003.1−0.2−3.40.8
C = 10002.6−0.2−3.00.7
C = 20001.8−0.2−2.50.5
LC2C = 2006.4−0.6−8.62.3
C = 5006.1−0.6−8.12.2
C = 10005.6−0.6−7.22.0
C = 20005.2−0.6−6.51.7
LC3C = 2008.9−0.3−8.92.9
C = 5008.6−0.3−8.62.8
C = 10008.2−0.3−8.12.7
C = 20007.6−0.3−8.12.5
Table A8. The pitch of WEC_25m for S3W in three LCs.
Pitch (deg) of WECMaxMeanMinSTD
LC1C = 2005.20.1−4.81.4
C = 5003.50.1−3.20.9
C = 10002.50.1−2.20.7
C = 20001.60.1−1.40.4
LC2C = 2009.20.3−8.52.6
C = 5007.30.3−6.81.9
C = 10006.00.3−5.11.4
C = 20004.20.3−3.20.8
LC3C = 20013.10.1−12.23.4
C = 50010.90.1−9.52.7
C = 10008.90.2−8.02.1
C = 20006.30.2−6.41.5
Table A9. The pitch of WEC_15m for S3W in three LCs.
Pitch (deg) of WECMaxMeanMinSTD
LC1C = 2003.0−0.1−3.30.9
C = 5001.9−0.1−2.00.5
C = 10002.2−0.1−2.20.6
C = 20001.6−0.1−1.90.5
LC2C = 2004.5−0.2−4.91.3
C = 5004.4−0.2−5.11.5
C = 10005.1−0.3−5.71.4
C = 20003.9−0.2−4.41.0
LC3C = 2006.3−0.1−6.92.0
C = 5008.0−0.1−7.82.2
C = 10008.8−0.2−8.92.2
C = 20007.3−0.2−7.71.6

References

  1. Agency, I.E. World Energy Outlook 2020; OECD Publishing: Paris, France, 2020. [Google Scholar]
  2. Koragappa, P.; Verdin, P.G. Design and optimisation of a 20 MW offshore wind turbine blade. Ocean. Eng. 2024, 305, 117975. [Google Scholar] [CrossRef]
  3. Desalegn, B.; Tamrat, B.; Tadiwose, T.; Lata, A. Onshore versus offshore wind power trends and recent study practices in modeling of wind turbines’ life-cycle impact assessments. Clean. Eng. Technol. 2023, 17, 100691. [Google Scholar] [CrossRef]
  4. Ali, A.; Shi, W.; Wang, S.S.; Zhai, H.; Haider, R.; Leng, S.; Li, X.; Han, X. Dynamic analysis of a TetraSpar floating offshore wind turbine with different tendons failure scenario. Ocean Eng. 2025, 323, 120607. [Google Scholar] [CrossRef]
  5. Wang, J.Z.; Ren, Y.J.; Shi, W.; Collu, M.; Venugopal, V.; Li, X. Multi-objective optimization design for a 15 MW semisubmersible floating offshore wind turbine using evolutionary algorithm. Appl. Energy 2025, 377, 124533. [Google Scholar] [CrossRef]
  6. Aderinto, T.; Li, H. Review on Power Performance and Efficiency of Wave Energy Converters. Energies 2019, 12, 4329. [Google Scholar] [CrossRef]
  7. Astariz, S.; Iglesias, G. The economics of wave energy: A review. Renew. Sustain. Energy Rev. 2015, 45, 397–408. [Google Scholar] [CrossRef]
  8. Kolios, A.; Di Maio, L.F.; Wang, L.; Cui, L.; Sheng, Q.H. Reliability assessment of point-absorber wave energy converters. Ocean Eng. 2018, 163, 40–50. [Google Scholar] [CrossRef]
  9. Li, L.; Cheng, Z.S.; Yuan, Z.M.; Gao, Y. Short-term extreme response and fatigue damage of an integrated offshore renewable energy system. Renew. Energy 2018, 126, 617–629. [Google Scholar] [CrossRef]
  10. H2OCEAN Project. Available online: https://cordis.europa.eu/project/id/288145 (accessed on 7 December 2024).
  11. MERMAID Project. Available online: https://cordis.europa.eu/project/id/288710 (accessed on 7 December 2024).
  12. TROPOS Project. Available online: https://cordis.europa.eu/project/id/288192 (accessed on 7 December 2024).
  13. MARINA Platform Project. Available online: https://cordis.europa.eu/project/id/241402 (accessed on 7 December 2024).
  14. Lucas, T.R.; Ferreira, A.F.; Pereira, R.B.S.; Alves, M. Hydrogen production from the WindFloat Atlantic offshore wind farm: A techno-economic analysis. Appl. Energy 2022, 310, 118481. [Google Scholar] [CrossRef]
  15. Konispoliatis, D.N.; Katsaounis, G.M.; Manolas, D.I.; Soukissian, T.H.; Polyzos, S.; Mazarakos, T.P.; Voutsinas, S.G.; Mavrakos, S.A. REFOS: A Renewable Energy Multi-Purpose Floating Offshore System. Energies 2021, 14, 3126. [Google Scholar] [CrossRef]
  16. Quevedo, E.; Cartón, M.; Delory, E.; Castro, A.; Hernández, J.; Llináset, O.; de Lara, J.; Papandroulakis, N.; Anastasiadis, P.; Bard, J.; et al. (Eds.) Multi-use offshore platform configurations in the scope of the FP7 TROPOS Project. In Proceedings of the 2013 MTS/IEEE OCEANS-Bergen, Bergen, Norway, 10–14 June 2013; IEEE: New York, NY, USA. [Google Scholar]
  17. Stuiver, M.; Soma, K.; Koundouri, P.; Van den Burg, S.; Gerritsen, A.; Harkamp, T.; Dalsgaard, N.; Zagonari, F.; Guanche, R.; Schouten, J.-J.; et al. The Governance of multi-use platforms at sea for energy production and aquaculture: Challenges for policy makers in European seas. Sustainability 2016, 8, 333. [Google Scholar] [CrossRef]
  18. Van den Burg, S.; Stuiver, M.; Norrmam, J.; Garção, R.; Söderqvist, T.; Röckmann, C.; Schouten, J.-J.; Petersen, O.; García, R.G.; Diaz-Simal, P.; et al. Participatory design of multi-use platforms at sea. Sustainability 2016, 8, 127. [Google Scholar] [CrossRef]
  19. Muliawan, M.J.; Karimirad, M.; Moan, T. Dynamic response and power performance of a combined spar-type floating wind turbine and coaxial floating wave energy converter. Renew. Energy 2013, 50, 47–57. [Google Scholar] [CrossRef]
  20. Wan, L.; Gao, Z.; Moan, T. Experimental and numerical study of hydrodynamic responses of a combined wind and wave energy converter concept in survival modes. Coast. Eng. 2015, 104, 151–169. [Google Scholar] [CrossRef]
  21. Wan, L.; Gao, Z.; Moan, T.; Lugni, C. Experimental and numerical comparisons of hydrodynamic responses for a combined wind and wave energy converter concept under operational conditions. Renew. Energy 2016, 93, 87–100. [Google Scholar] [CrossRef]
  22. Michailides, C.; Luan, C.; Gao, Z.; Moan, T. Effect of flap type wave energy converters on the response of a semi-submersible wind turbine in operational conditions. In Proceedings of the International Conference on Ocean, Offshore and Arctic Engineering (OMAE), San Francisco, CA, USA, 8–13 June 2014; p. 45547, V09BT09A014. [Google Scholar]
  23. Michailides, C.; Gao, Z.; Moan, T. Experimental and numerical study of the response of the offshore combined wind/wave energy concept SFC in extreme environmental conditions. Mar. Struct. 2016, 50, 35–54. [Google Scholar] [CrossRef]
  24. Ren, N.X.; Ma, Z.; Shan, B.H.; Ning, D.Z.; Ou, J.P. Experimental and numerical study of dynamic responses of a new combined TLP type floating wind turbine and a wave energy converter under operational conditions. Renew. Energy 2020, 151, 966–974. [Google Scholar] [CrossRef]
  25. Homayoun, E.; Panahi, S.; Ghassemi, H.; He, G.H.; Liu, P.F. Power absorption of combined wind turbine and wave energy converter mounted on braceless floating platform. Ocean Eng. 2022, 266, 113027. [Google Scholar] [CrossRef]
  26. Zhang, H.J.; Zhang, N.C.; Cao, X.Y. Conceptualization and dynamic response of an integrated system with a semi-submersible floating wind turbine and two types of wave energy converters. Ocean Eng. 2023, 269, 113517. [Google Scholar] [CrossRef]
  27. Jin, P.; Zheng, Z.; Zhou, Z.M.; Zhou, B.Z.; Wang, L.; Yang, Y.; Liu, Y.Y. Optimization and evaluation of a semi-submersible wind turbine and oscillating body wave energy converters hybrid system. Energy 2023, 282, 128889. [Google Scholar] [CrossRef]
  28. Kim, H.; Koo, W. Numerical and experimental study of the dynamic response of a wind-wave combined energy platform under WEC motion constraints. Int. J. Nav. Archit. Ocean Eng. 2024, 16, 100627. [Google Scholar] [CrossRef]
  29. Rony, J.S.; Karmakar, D. Dynamic analysis of frustum TLP-type wind turbine multi-purpose floating platform. Ships Offshore Struct. 2023, 19, 323–337. [Google Scholar] [CrossRef]
  30. Rony, J.S.; Sai, K.C.; Karmakar, D. Numerical investigation of offshore wind turbine combined with wave energy converter. Mar. Syst. Ocean. Technol. 2023, 8, 14–44. [Google Scholar] [CrossRef]
  31. Wan, L.; Moan, T.; Gao, Z.; Shi, W. A review on the technical development of combined wind and wave energy conversion systems. Energy 2024, 294, 130885. [Google Scholar] [CrossRef]
  32. Ghaedi, A.; Sedaghati, R.; Mahmoudian, M.; Bazyari, S. Reliability modeling of wave energy converters based on pelamis technology. Electr. Power Syst. Res. 2024, 227, 109977. [Google Scholar] [CrossRef]
  33. Jonkman, J. Definition of the Floating System for Phase IV of OC3; No. NREL/TP-500-47535; National Renewable Energy Lab (NREL): Golden, CO, USA, 2010. [Google Scholar]
  34. Jonkman, J.; Butterfield, S.; Musial, W.; Scott, G. Definition of a 5-MW Reference Wind Turbine for Offshore System Development; No. NREL/TP-500-38060; National Renewable Energy Lab (NREL): Golden, CO, USA, 2009. [Google Scholar]
  35. Naess, A.; Moan, T. Stochastic Dynamics of Marine Structures; Cambridge University Press: Cambridge, UK, 2013. [Google Scholar]
  36. Li, Y.; Li, H.R.; Wang, B.; Meng, H.; Su, O.M.; Tang, Y.G. Effects of various freak waves on dynamic responses of a spar-buoy floating offshore wind turbine. Ocean Eng. 2024, 311, 118837. [Google Scholar] [CrossRef]
  37. Özkan, R.; Genç, M.S. Aerodynamic design and optimization of a small-scale wind turbine blade using a novel artificial bee colony algorithm based on blade element momentum (ABC-BEM) theory. Energy Convers. Manag. 2023, 283, 116937. [Google Scholar] [CrossRef]
  38. Dai, J.C.; Hu, Y.P.; Liu, D.S.; Long, X. Aerodynamic loads calculation and analysis for large scale wind turbine based on combining BEM modified theory with dynamic stall model. Renew. Energy 2011, 36, 1095–1104. [Google Scholar] [CrossRef]
  39. Bavanish, B.; Thyagarajan, K. Optimization of power coefficient on a horizontal axis wind turbine using beam theory. Renew. Sustain. Energy Rev. 2013, 26, 169–182. [Google Scholar] [CrossRef]
  40. Wang, D.J.; Gou, Y. Numerical Simulation Study on Electric Power Parameters of Pelamis Wave Energy Converter. Port. Eng. Technol. 2015, 52, 68–72. [Google Scholar] [CrossRef]
  41. Ni, W.C.; Zhang, X.; Zhang, W.; Liang, S.L. Numerical investigation of adaptive damping control for raft-type wave energy converters. Renew. Energy 2021, 175, 520–531. [Google Scholar] [CrossRef]
  42. Babarit, A. A database of capture width ratio of wave energy converters. Renew. Energy 2015, 80, 610–628. [Google Scholar] [CrossRef]
  43. Jin, S.Y.; Zheng, S.M.; Greaves, D. On the scalability of wave energy converters. Ocean Eng. 2022, 243, 110212. [Google Scholar] [CrossRef]
  44. Choupin, O.; Río-Gamero, B.D.; Schallenberg-Rodríguez, J.; Yánez-Rosales, P. Integration of assessment-methods for wave renewable energy: Resource and installation feasibility. Renew. Energy 2022, 185, 455–482. [Google Scholar] [CrossRef]
  45. Choupin, O.; Têtu, A.; Ferri, F. Wave energy converter power and capture width classification. Ocean Eng. 2022, 260, 111749. [Google Scholar] [CrossRef]
  46. DNV. HydroD for Experts User Manual; Det Norske Veritas: Høvik, Norway, 2017. [Google Scholar]
  47. DNV. Coupled Analysis of Floating Wind Turbines; DNV GI.RP-0286; Det Norske Veritas: Høvik, Norway, 2019. [Google Scholar]
  48. Faltinsen, O.M. Sea Loads on Ships and Offshore Structures; Cambridge University Press: Cambridge, UK, 1993. [Google Scholar]
  49. Wen, Y.D.; Wang, W.J.; Liu, H.; Mao, L.; Mi, H.; Wang, W.; Zhang, G. A shape optimization method of a specified point Absorber wave energy converter for the South China sea. Energies 2018, 11, 2645. [Google Scholar] [CrossRef]
  50. Ahn, H.J.; Shin, H. Model test and numerical simulation of OC3 spar type floating offshore wind turbine. Int. J. Nav. Archit. Ocean Eng. 2019, 11, 1–10. [Google Scholar] [CrossRef]
Figure 1. Proposed combined wind and wave energy converter concepts and the working principle of the hydraulic PTO system.
Jmse 13 01538 g001
Figure 2. The SWT (left), S1W (middle) and S3W (right).
Jmse 13 01538 g002
Figure 3. Turbulent wind and JONSWAP spectrum in three LCs.
Jmse 13 01538 g003
Figure 4. Comparison of surge, heave and pitch RAOs.
Jmse 13 01538 g004
Figure 5. The decay curves in surge, heave and pitch of the spar across the three models.
Jmse 13 01538 g005
Figure 6. Power output of wind turbine in three LCs.
Jmse 13 01538 g006
Figure 7. Power of wind turbine for SWT.
Jmse 13 01538 g007
Figure 8. The surge of the spar for three models in three LCs.
Jmse 13 01538 g008
Figure 9. The heave of the spar for three models in three LCs.
Jmse 13 01538 g009
Figure 10. The pitch of the spar for three models in three LCs.
Jmse 13 01538 g010
Figure 11. Surge, heave and pitch of the spar and the heave of tours in LC3.
Jmse 13 01538 g011
Figure 12. Power of WECs for S1W and S3W in white noise conditions.
Jmse 13 01538 g012
Figure 13. Pitch RAOs of WECs for S1W and S3W.
Jmse 13 01538 g013
Figure 14. Heave of the spar for S1W in LC2 and LC3.
Jmse 13 01538 g014
Figure 15. Heave of the spar for S3W in LC2 and LC3.
Jmse 13 01538 g015
Figure 16. The pitch of WEC for S1W in three LCs.
Jmse 13 01538 g016
Figure 17. The pitch of WEC_35 m for S3W in three LCs.
Jmse 13 01538 g017
Figure 18. The pitch of WEC_25 m for S3W in three LCs.
Jmse 13 01538 g018
Figure 19. The pitch of WEC_15 m for S3W in three LCs.
Jmse 13 01538 g019
Figure 20. The pitch spectrum of WECs in LC2.
Jmse 13 01538 g020
Figure 21. Comparison of the power output of WECs for S1W and S3W.
Jmse 13 01538 g021
Figure 22. The power spectrum of WECs in LC2.
Jmse 13 01538 g022
Figure 23. Comparison of CWR for WECs in S1W and S3W.
Jmse 13 01538 g023
Table 1. Structural properties of the floating platform.
Total Draft (m)120
Platform Top Height (m)10
Platform Diameter Above Taper (m)6.5
Taper Top Depth (m)4
Taper Bottom Depth (m)12
Platform Diameter Below Taper (m)9.4
CM Below SWL (m)89.9
Total Mass (kg)7.46633 × 10⁶
Ixx (kg m2)4.22923 × 10⁹
Iyy (kg m2)4.22923 × 10⁹
Izz (kg m2)1.6423 × 10⁸
Table 2. Torus and WEC properties.
PropertiesTorusWEC_35 mWEC_25 mWEC_15 m
Diameter (m)7(inner)\12(external)3.63.63.6
Height (torus) or length (WEC) (m)6352515
COG (global coordinate) (m)(0, 0, −0.82)(24.5, 0, 0)(55.5, 0, 0)(76.5, 0, 0)
Mass (kg)228,996.52181,281.68129,042.3778,409.64
Rxx (m) w.r.t COG3.9371.5841.5571.481
Ryy (m) w.r.t COG3.94211.5408.4835.279
Rzz (m) w.r.t COG4.91511.5408.4835.279
Table 3. Mooring system properties.
Angle Between Mooring Lines (deg)120
Water Depth (m)320
Fairleads Depth Below SWL (m)70
Fairleads Radius from Centerline (m)5.2
Anchors Radius from Centerline (m)853
Delta Mooring Line Length (m)50
Mooring Line Length (Except Delta-Line) (m)852
Mooring Line Diameter (m)0.09
Mooring Line Mass Density (kg/m)77.7066
Mooring Line Extensional Stiffness (kN)3.84243 × 10⁵
Table 4. Loading conditions in the simulations.
Loading ConditionsUw (m/s)Hs (m)Tp (s)
LC1626
LC21238
LC322510
Table 5. Natural periods in the six DOFs of the three models.
DOF/T (s)SurgeSwayHeaveRollPitchYaw
spar in SWT118.7118.731.528289.2
spar in S1W120119.631.528.928.89.2
spar in S3W121.2120.331.529.229.49.2
Table 6. Displacement of the lowest points at both ends of WEC_15 m for S3W in three LCs.
Pitch (deg) of WECLC1LC2LC3
Max pitch motion (deg)10.313.620.0
Center of the ends above SWL (m)1.341.762.57
Lowest points of the ends above SWL (m)−0.430.010.87
Half of Hs (m)11.52.5
Disclaimer/Publisher’s Note: The statements, opinions and data contained in all publications are solely those of the individual author(s) and contributor(s) and not of MDPI and/or the editor(s). MDPI and/or the editor(s) disclaim responsibility for any injury to people or property resulting from any ideas, methods, instructions or products referred to in the content.