Article

Climate Variability and Atlantic Surface Gravity Wave Variability Based on Reanalysis Data

by
Yuri Onça Prestes
1,*,
Alex Costa da Silva
1,
André Lanfer Marquez
2,
Gabriel D’annunzio Gomes Junior
1 and
Fabrice Hernandez
3
1
Laboratório de Oceanografia Física Estuarina e Costeira, Departamento de Oceanografia, Universidade Federal de Pernambuco—LOFEC/CTG/UFPE, Recife 50670-901, Brazil
2
Centro de Previsão do Tempo e Estudos Climáticos—CPTEC/INPE, São José dos Campos 12227-010, Brazil
3
Laboratoire d’Études en Géophysique et Océanographie Spatiales (LEGOS), Institut de Recherche pour le Développement (IRD) et Université de Toulouse, CNRS, CNES, 31401 Toulouse, France
*
Author to whom correspondence should be addressed.
J. Mar. Sci. Eng. 2025, 13(8), 1536; https://doi.org/10.3390/jmse13081536
Submission received: 25 June 2025 / Revised: 31 July 2025 / Accepted: 5 August 2025 / Published: 10 August 2025
(This article belongs to the Section Physical Oceanography)

Abstract

Wave climate variability, including seasonal cycles, long-term trends, and interannual anomalies of wave parameters, was investigated across five latitudinal sectors using ERA5 reanalysis data from 1980 to 2023. Pronounced seasonal cycles were observed in both Northern and Southern Hemisphere sectors, although the variability was more marked in the Northern Hemisphere. In contrast, the tropical region exhibited comparatively stable conditions throughout the year. Long-term trends revealed increases in both significant wave height and peak period across most sectors. The tropical region exhibited a trimodal regime driven by wind waves at low latitudes and remotely generated swells from both hemispheres. Teleconnections associated with the North Atlantic Oscillation (NAO) explained interannual variability in wind-wave direction in the tropics with an r2 of 0.74 and wind-wave height variability in the Northern Hemisphere with an r2 of 0.81. Additional indices, such as the Arctic Oscillation (AO), the Tropical North Atlantic (TNA) index, and the Northern Annular Mode (NAM), explained 30 to 60 percent of the directional variability. These results underscore the need to account for climate-driven variability in wave modeling frameworks to improve forecast accuracy and representation of directional trends.

1. Introduction

Ocean surface gravity wind-driven wave dynamics are a fundamental driver of air sea flux exchange and mass and energy transport in marine and coastal environments. As critical indicators of climatic variability, long-term wave records reveal patterns mirroring key atmospheric and oceanic variables, including atmospheric sea level pressure, precipitation, river discharge, air temperature, and wind speed and direction [1]. Moreover, waves exert substantial influence on coastal and offshore infrastructure and operations, impacting structural design, maritime navigation, hydrodynamic modeling, sediment transport, and coastal-hazard mitigation [2,3,4]. Within this global context, the Atlantic Ocean stands out due to its unique characteristics and significant role in regional and global climate systems.
The Atlantic Ocean occupies a central role in modulating global climate variability, influencing atmospheric and oceanic processes across multiple temporal and spatial scales. Its distinctive geography—extending meridionally between hemispheres but bounded longitudinally by the Americas to the west and Africa–Europe to the east—fosters a wide range of wind regimes and diverse wave-generation and propagation mechanisms [5,6,7,8]. The complex interplay between surface winds and atmospheric circulation produces pronounced spatial heterogeneity in significant wave height (SWH), peak period (PP), and mean wave direction (MWD) across its tropical, subtropical, and extratropical latitudes.
Wave climatology in the Atlantic exhibits pronounced hemispheric contrasts. In the North Atlantic, strong pressure gradients and frequent storm systems drive marked seasonal variability, with elevated wave activity during boreal winter [9,10]. Conversely, the Atlantic Southern ocean—dominated by the Antarctic Circumpolar Current (ACC)—displays more consistent year-round wave conditions [11,12]. The tropical Atlantic is characterized by relatively low seasonal amplitude and sustained long-period swell primarily originating from remote storm systems [13,14]. Seasonal wave behavior is further modulated by fluctuations in the Intertropical Convergence Zone (ITCZ) and by mid- to high-latitude westerlies.
Beyond these seasonal patterns, significant upward trends in wave parameters—particularly SWH—have been widely documented over recent decades. These trends have been linked to rising sea surface temperatures (SSTs), intensified wind regimes, and alterations in the global energy balance associated with anthropogenic climate change [15,16,17]. However, these changes are regionally and temporally heterogeneous, reflecting the influence of interannual and decadal atmosphere–ocean variability [18,19].
Large-scale climate modes such as the Atlantic Multidecadal Oscillation (AMO), North Atlantic Oscillation (NAO), Arctic Oscillation (AO), El Niño–Southern Oscillation (ENSO), Southern Annular Mode (SAM), and Northern Annular Mode (NAM) modulate wind patterns and, by extension, ocean wave fields [20,21,22]. In the North Atlantic, positive phases of the AMO and NAO generally correspond to enhanced wave energy, whereas in the South Atlantic, SAM phases and regional SST anomalies are linked to intensified swell conditions [23,24]. The present study investigates the interrelationships between anomalies in key wave parameters and the interannual variability of eleven large-scale climate indices.
Given the escalating impacts of climate change on coastal systems and ocean dynamics, a comprehensive understanding of wave climatology, long-term trends, and anomaly patterns in the Atlantic Ocean is imperative. Such knowledge is crucial for improving forecasts of extreme events, enhancing maritime safety, and guiding sustainable coastal planning and risk-management strategies. This study comprehensively addresses these objectives by examining monthly climatologies, long-term temporal trends, and wave anomalies across the entire Atlantic Ocean, subdivided into five different sectors, further assessing their interrelationships with a comprehensive suite of eleven large-scale climate indices.
Ocean surface gravity wind-driven waves (waves from here on) are generated by energy transfer from surface winds to waves. Wave growth might be limited by wind intensity, wind duration, and fetch. The typical wave periods are from 3 to 30 s, and heights vary from 0.1 to 30 m. An ocean state can be represented by height, period, and direction statistics or momentum orders. SWH, PP, and MWD are examples of the representations of a sea state. A complex full spectrum can be reduced to those representative parameters. The representative wave parameters directly respond to wind fluctuations and variability. The wave responses to intra-seasonal wind forcing occur on time scales of days to months [25], reflecting variations on synoptic and seasonal variabilities. In the extratropical North Atlantic, winter storms generate large fetch-limited wave fields whose build-up and decay occur over periods of one to two weeks, leading to the pronounced boreal-winter peak in SWH and PP [26]. In contrast, the tropical sector experiences a quasi-steady trade wind regime: locally generated wind seas dominate on 3–5 day time scales [27], while remotely generated swells from mid-latitude storms propagate into the tropics with group velocities of 10–20 m s−1, imprinting broader seasonal modulation (3–6 months) via shifts in storm tracks and ITCZ position [28,29]. The extratropical South Atlantic exhibits an intermediate pattern, combining storm-driven processes and trade wind influences that result in smoother seasonal variability [6].
On decadal to multi-decadal scales, wave climate integrates gradual changes in wind-forcing statistics driven by anthropogenic warming and natural oscillations [18,30]. The AMO (~60 yr period) and Pacific Decadal Oscillation (PDO) (~20–30-year period) modulate mean wind speeds and storm frequency over decades, yielding trends in SWH and PP of order 0.01 m yr−1 and 10−5 s yr−1, respectively [31,32]. These persistent effects occur because swells generated under anomalous wind regimes can travel and interact across seasons, allowing positive SST anomalies in one hemisphere to influence wave fields thousands of kilometers away [33]. Linking these time scales to our five-sector scheme clarifies the mechanisms driving both seasonal cycles and long-term trends across each latitude band.
The remainder of the paper is structured as follows. Section 2 describes the study area and methodological framework. Section 3 details the seasonal climatologies, long-term trends, and wave anomalies, along with their relationships with the selected climate indices. Section 4 provides a comprehensive discussion of the Atlantic wave climate dynamics, particularly highlighting the influence of the NAO in the tropical sector. Concluding remarks and future recommendations are provided in Section 5.

2. Methods

2.1. Atlantic Ocean

The study area encompasses the entire Atlantic Ocean basin, from 70° N to 70° S, including tropical and subtropical zones (Figure 1). Climatic variability in the Atlantic is controlled by phenomena operating across multiple temporal scales. Atmospheric circulation is strongly modulated by the North and South Atlantic subtropical highs and by extratropical low-pressure centers [7,34,35].
Spatial variability of SST influences tropical convection and cyclone development, especially in the North Atlantic, where hurricane activity is pronounced [14,25,36,37]. In the tropical region, southeast and northeast trade winds converge to form the ITCZ, while jet streams and frontal systems prevail at mid and high latitudes, affecting moisture transport and pressure distribution [38,39].
Surface waves exhibit significant interannual variability superimposed on a distinct seasonal cycle [8,13,40]. During the boreal winter, intensified westerlies in the North Atlantic generate low-pressure systems that enhance both wave period and significant wave height, with a predominance of swell [30,41]. In the tropics, local wind seas driven by the trade winds produce shorter-period, lower-height waves, although extreme events may occur during hurricanes [14,42,43]. In the South Atlantic, the combined influence of the ACC, mid-latitude westerlies, and synoptic conditions yields longer-period waves whose propagation directions are modulated by cold fronts [6,44,45].
Large-scale climate indices—such as the North Atlantic Oscillation (NAO), El Niño–Southern Oscillation (ENSO), Southern Annular Mode (SAM), Northern Annular Mode (NAM), and Arctic Oscillation (AO)—also modulate the Atlantic wave climate by altering the intensity and position of pressure systems [46,47]. Significant wave heights are generally maximized in extratropical latitudes, while tropical regions exhibit lower wave energy. Wave periods lengthen under extratropical storms and frontal systems, and mean wave directions reflect the seasonal cycle of wind and pressure fields [6,25]. These characteristics underpin the delineation and analysis of the northern (70° N–50° N), subtropical north (50° N–23.5° N), tropical (23.5° N–23.5° S), subtropical south (23.5° S–50° S) and southern (50° S–70° S) subdomains in this study (Figure 1). The eastern Pacific Ocean and the Mediterranean Sea were excluded from the analyses.

2.2. Wave and Atmospheric Data

The ERA5 reanalysis database [25] was developed by the European Centre for Medium-Range Weather Forecasts (ECMWF) under the Copernicus Climate Change Service (C3S). ERA5 represents the fifth generation of global climate reanalysis produced by ECMWF, providing data from 1940 onward and replacing ERA-Interim. It combines global meteorological observations with numerical models through data assimilation, yielding comprehensive and consistent records of the atmosphere, ocean surface, and continental conditions. This approach enables the reconstruction of past climate conditions with improved accuracy. The spatial resolution of the grid was enhanced to 0.5° latitude and longitude, offering significant improvements over the previous version and being widely used in various scientific studies [48,49,50].
In this study, ERA5 data were used over a 44-year period (1980–2023) at three different sampling rates: annual means, monthly means, and 3-hourly data. The spatial resolution of wave and wind data is 0.5° × 0.5° in longitude and latitude, respectively. Numerous studies have confirmed the quality of ERA5 wave data in various regions around the globe [28,29,51,52].
Ten wave parameters from ERA5 were used: SWH, significant wave height of wind waves (SHWW), significant wave height of swell (SWHS), peak period (PP), mean wave period (MWP), mean period of wind waves (MPWW), mean period of swell (MPS), mean wave direction (MWD), mean direction of wind waves (MDWW), and mean direction of total swell (MDTS). The atmospheric parameters used in this study were the U and V components of 10-m wind speed (u10 and v10), and mean sea level pressure (MSLP). All wave and atmospheric parameters were separated according to the latitudinal sectors defined in this study: NA, SNA, TA, SSA, and SA. This allows the wave climate of the ten wave variables to be distinguished across the five sectors of the Atlantic Ocean.

2.3. Climate Indices

To represent the climate variability within the Earth system and its correlation with wave parameters in the Atlantic Ocean, eleven climate indices were used. These indices were selected based on their relevance and influence on atmospheric patterns over the Atlantic. They include the following: the North Atlantic Oscillation (NAO) [53], Arctic Oscillation (AO) [54], El Niño–Southern Oscillation (ENSO) [55], Southern Annular Mode (SAM) [56], Northern Annular Mode (NAM) [57], Atlantic Multidecadal Oscillation (AMO) [58], Southern Oscillation Index (SOI) [59], Pacific Decadal Oscillation (PDO) [32], Tropical Northern Atlantic (TNA) [60], Tropical Southern Atlantic (TSA) [61], and Tropical Atlantic SST Index (TASI) [62]. Annual time series were created for all indices to ensure a homogeneous dataset, enabling consistent comparison with the annual statistics of the wave parameters.

2.4. Data Processing

The ERA5 dataset was processed to obtain climatological means, interannual and monthly time series, as well as the original 3-hourly resolution series. First, wave parameters were calculated within each of the five latitudinal sectors (NA, SNA, TA, SSA, and SA). Next, the interannual series was employed to estimate temporal trends of each wave parameter by fitting the linear model:
P t =   P 0 + β . t
where P t denotes the wave parameter (e.g., SWH or PP) at time t , P 0 is the initial value, and β represents the rate of change. After removal of these trends, anomalies were computed by subtracting the climatological mean from the original series, and these anomalies were correlated with the interannual series of the climate indices to assess their influence on wave variability.
Trends, anomalies, and significance levels were evaluated using the parametric Mann–Kendall test (MKT) [63,64,65,66]. Seasonal variability was analyzed from the monthly wave-parameter series. Finally, frequency histograms and distribution curves (both normal and Gumbel) were generated from the original 3-hourly time series over the 44-year period for each sector. The Gumbel distribution, employed to characterize extreme events, was defined by the probability density function:
f x =   1 β   e x p x   μ β e x p   e x p x   μ β
where μ is the location parameter and β is the scale parameter. This processing enabled a robust analysis of trends and variability in Atlantic wave parameters, facilitating the identification of significant relationships with large-scale climate indices at both interannual and seasonal scales.
Although monthly averages capture the broad seasonal cycle, the original 3-hourly series retain high-frequency variability and extreme events that would be smoothed out by coarser aggregation [67]. By constructing histograms and fitting Gumbel distributions to the sub-daily data, we ensure robust characterization of peak wave heights and periods alongside the lower-frequency signals. This present work does not deal with extreme event variability, so distributions like Generalized Pareto Distributions or Generalized Extreme Value were not used.
To complement the statistical analysis of wave parameters, Pearson’s correlation coefficient r was calculated between the wave-parameter anomalies and the climate indices:
r =   ( X i X ¯ ) ( Y i Y ¯ ) ( X i X ¯ ) 2 ( Y i Y ¯ ) 2
where X i denotes the anomaly of the wave parameter at year, Y i denotes the corresponding value of the normalized climate index, and X _ and Y _ are their respective means. Correlations were computed between the interannual anomaly series of each wave parameter and each index. Statistical significance was assessed at the 95% confidence level (ρ < 0.05). This analysis provided a quantitative basis for evaluating the influence of large-scale climate phenomena—such as ENSO, NAO, and SAM—on the Atlantic wave climate and supported the interpretation of teleconnection patterns.

3. Results

3.1. Monthly Climatology

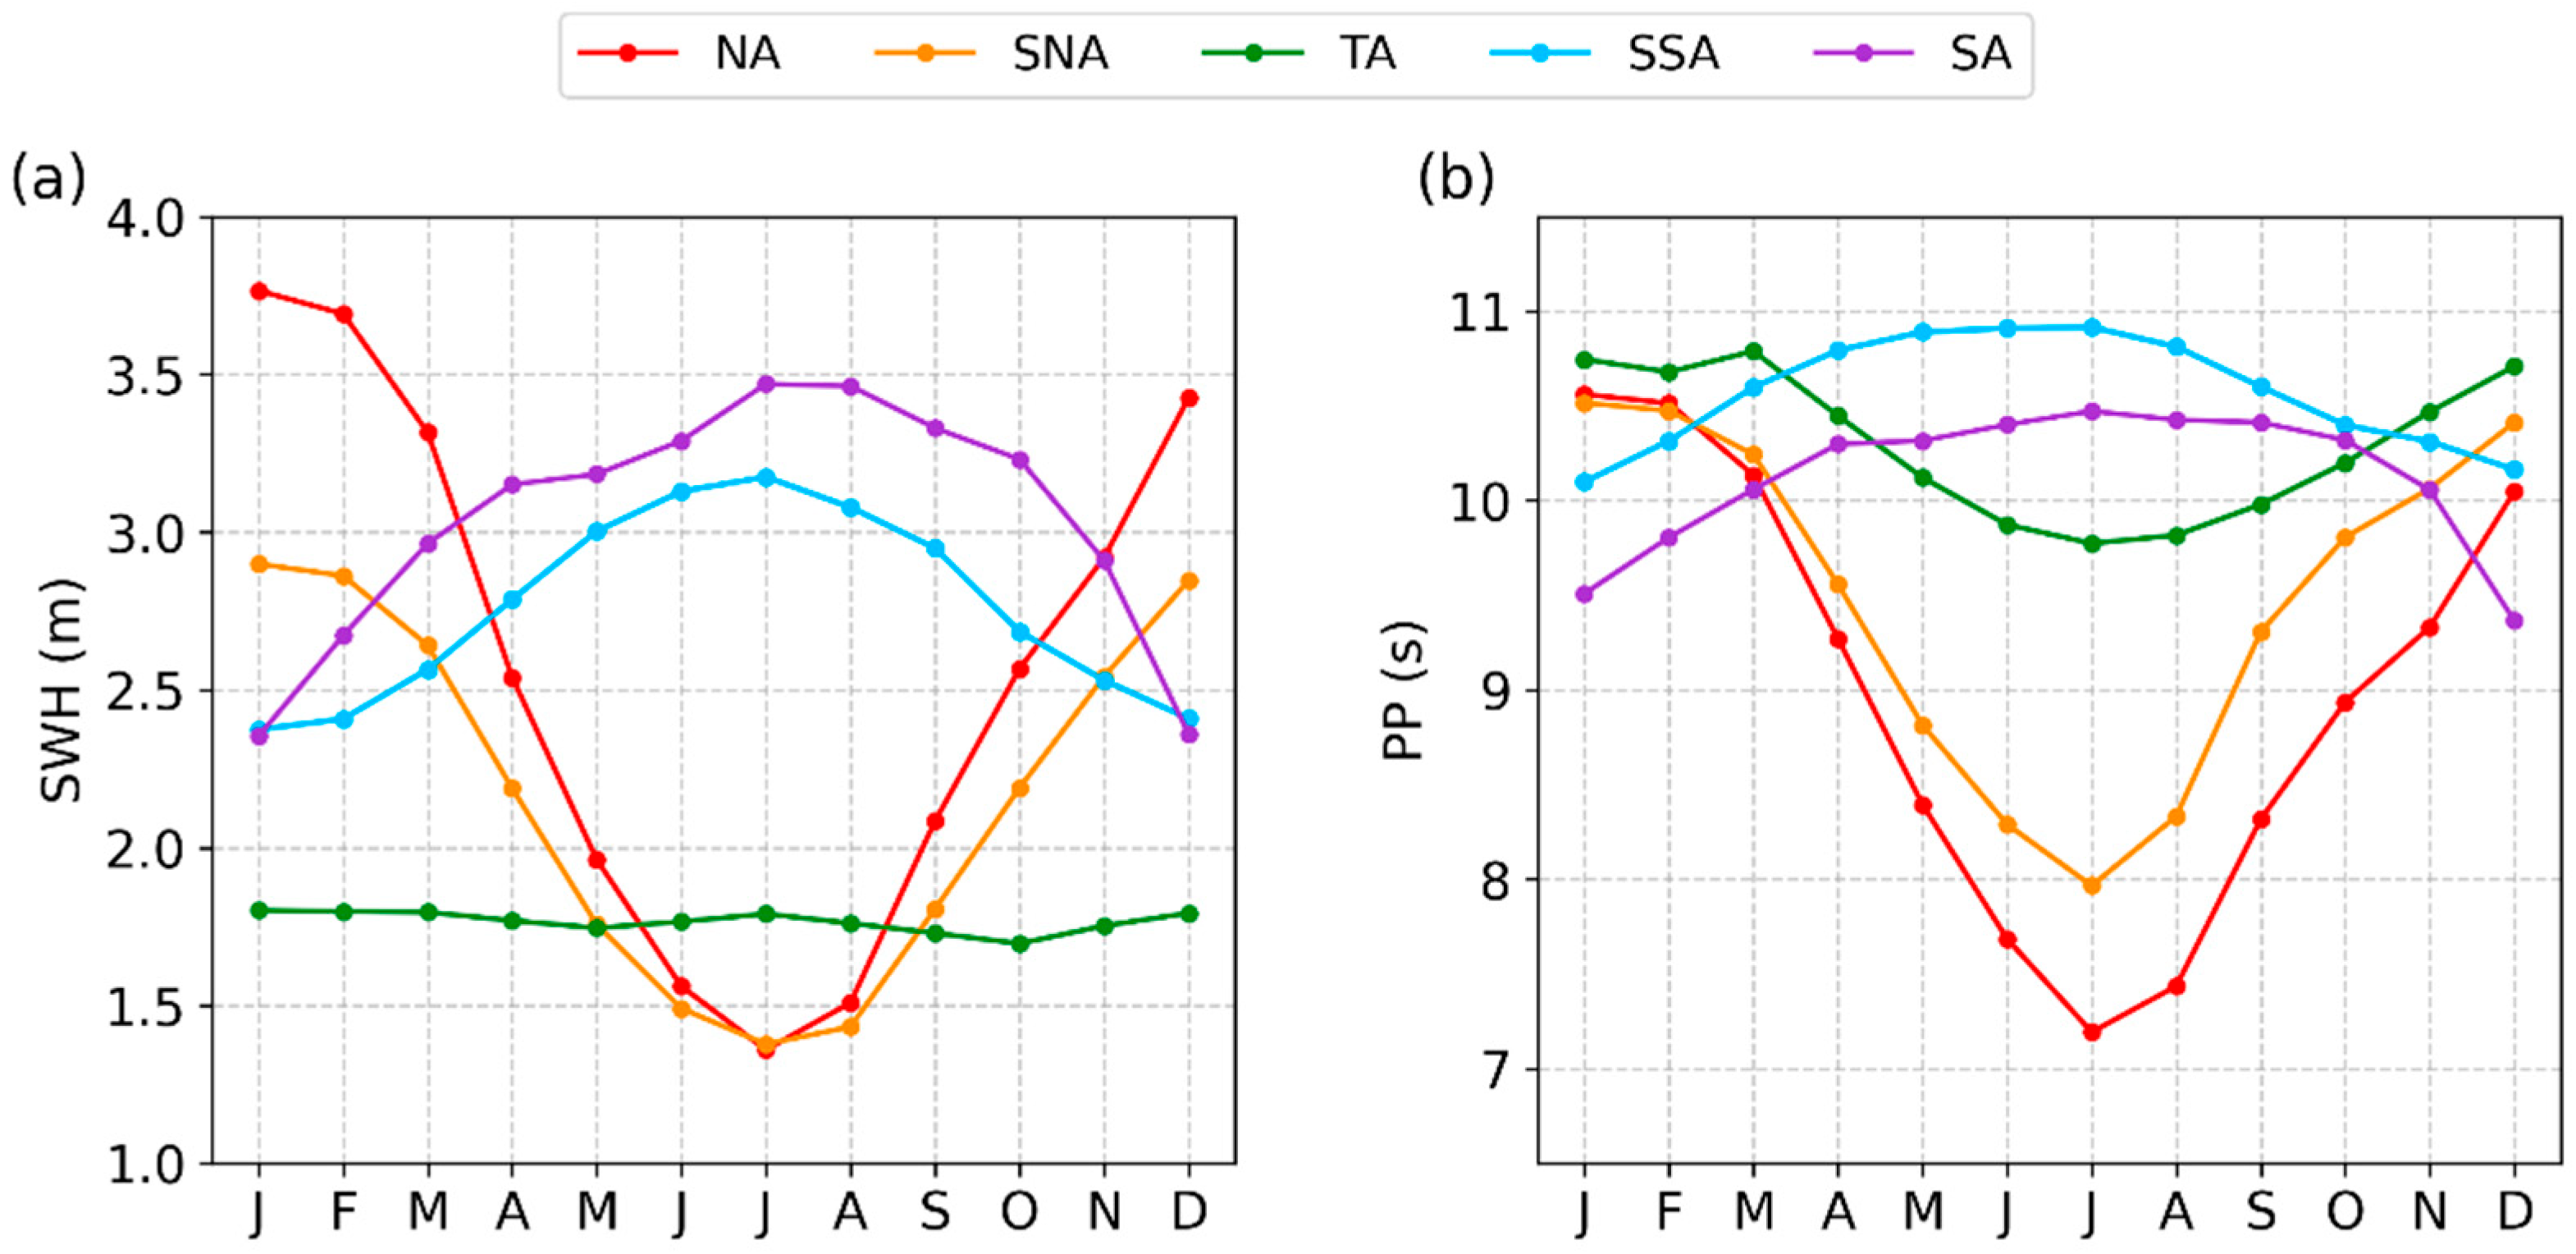
Figure 2 presents the monthly climatological means for SWH and PP. Seasonal variability in both SWH and PP is most pronounced in the NA and SNA sectors (red and orange lines, respectively), with differences exceeding 3.0 m and 3.0 s between winter and summer. In the SA and SSA sectors (purple and blue), seasonal variations are also observed, although with lower height and period gradients compared to the Northern Hemisphere (~1.0 m and <1.0 s). The tropical Atlantic region (TA sector, in green) shows no evident seasonal variability in SWH. Average SWH and PP values in the tropical sector are 1.7 m and 10.3 s, respectively.
The maximum SWH was observed during winter in the NA sector, reaching 3.7 m. The minimum SWH, also recorded in the NA sector, was 1.4 m. In the Southern Hemisphere, the highest value was 3.5 m in the SA sector during austral winter, while the lowest was 2.3 m during summer (Figure 2a). For PP, the highest value occurred during austral winter in the SSA sector, reaching approximately 11 s. The seasonal variability of PP in the TA sector resembles that of the Northern Hemisphere (red and orange lines), with higher PP values during boreal winter; however, this variability is less pronounced than in NA and SNA. Interestingly, average PP values in the tropical region are higher than those observed in the NA and SNA sectors throughout the year. The minimum PP occurred during boreal summer in the NA sector, at 7.2 s (Figure 2b).

3.2. Climatology, Trends, and Anomalies

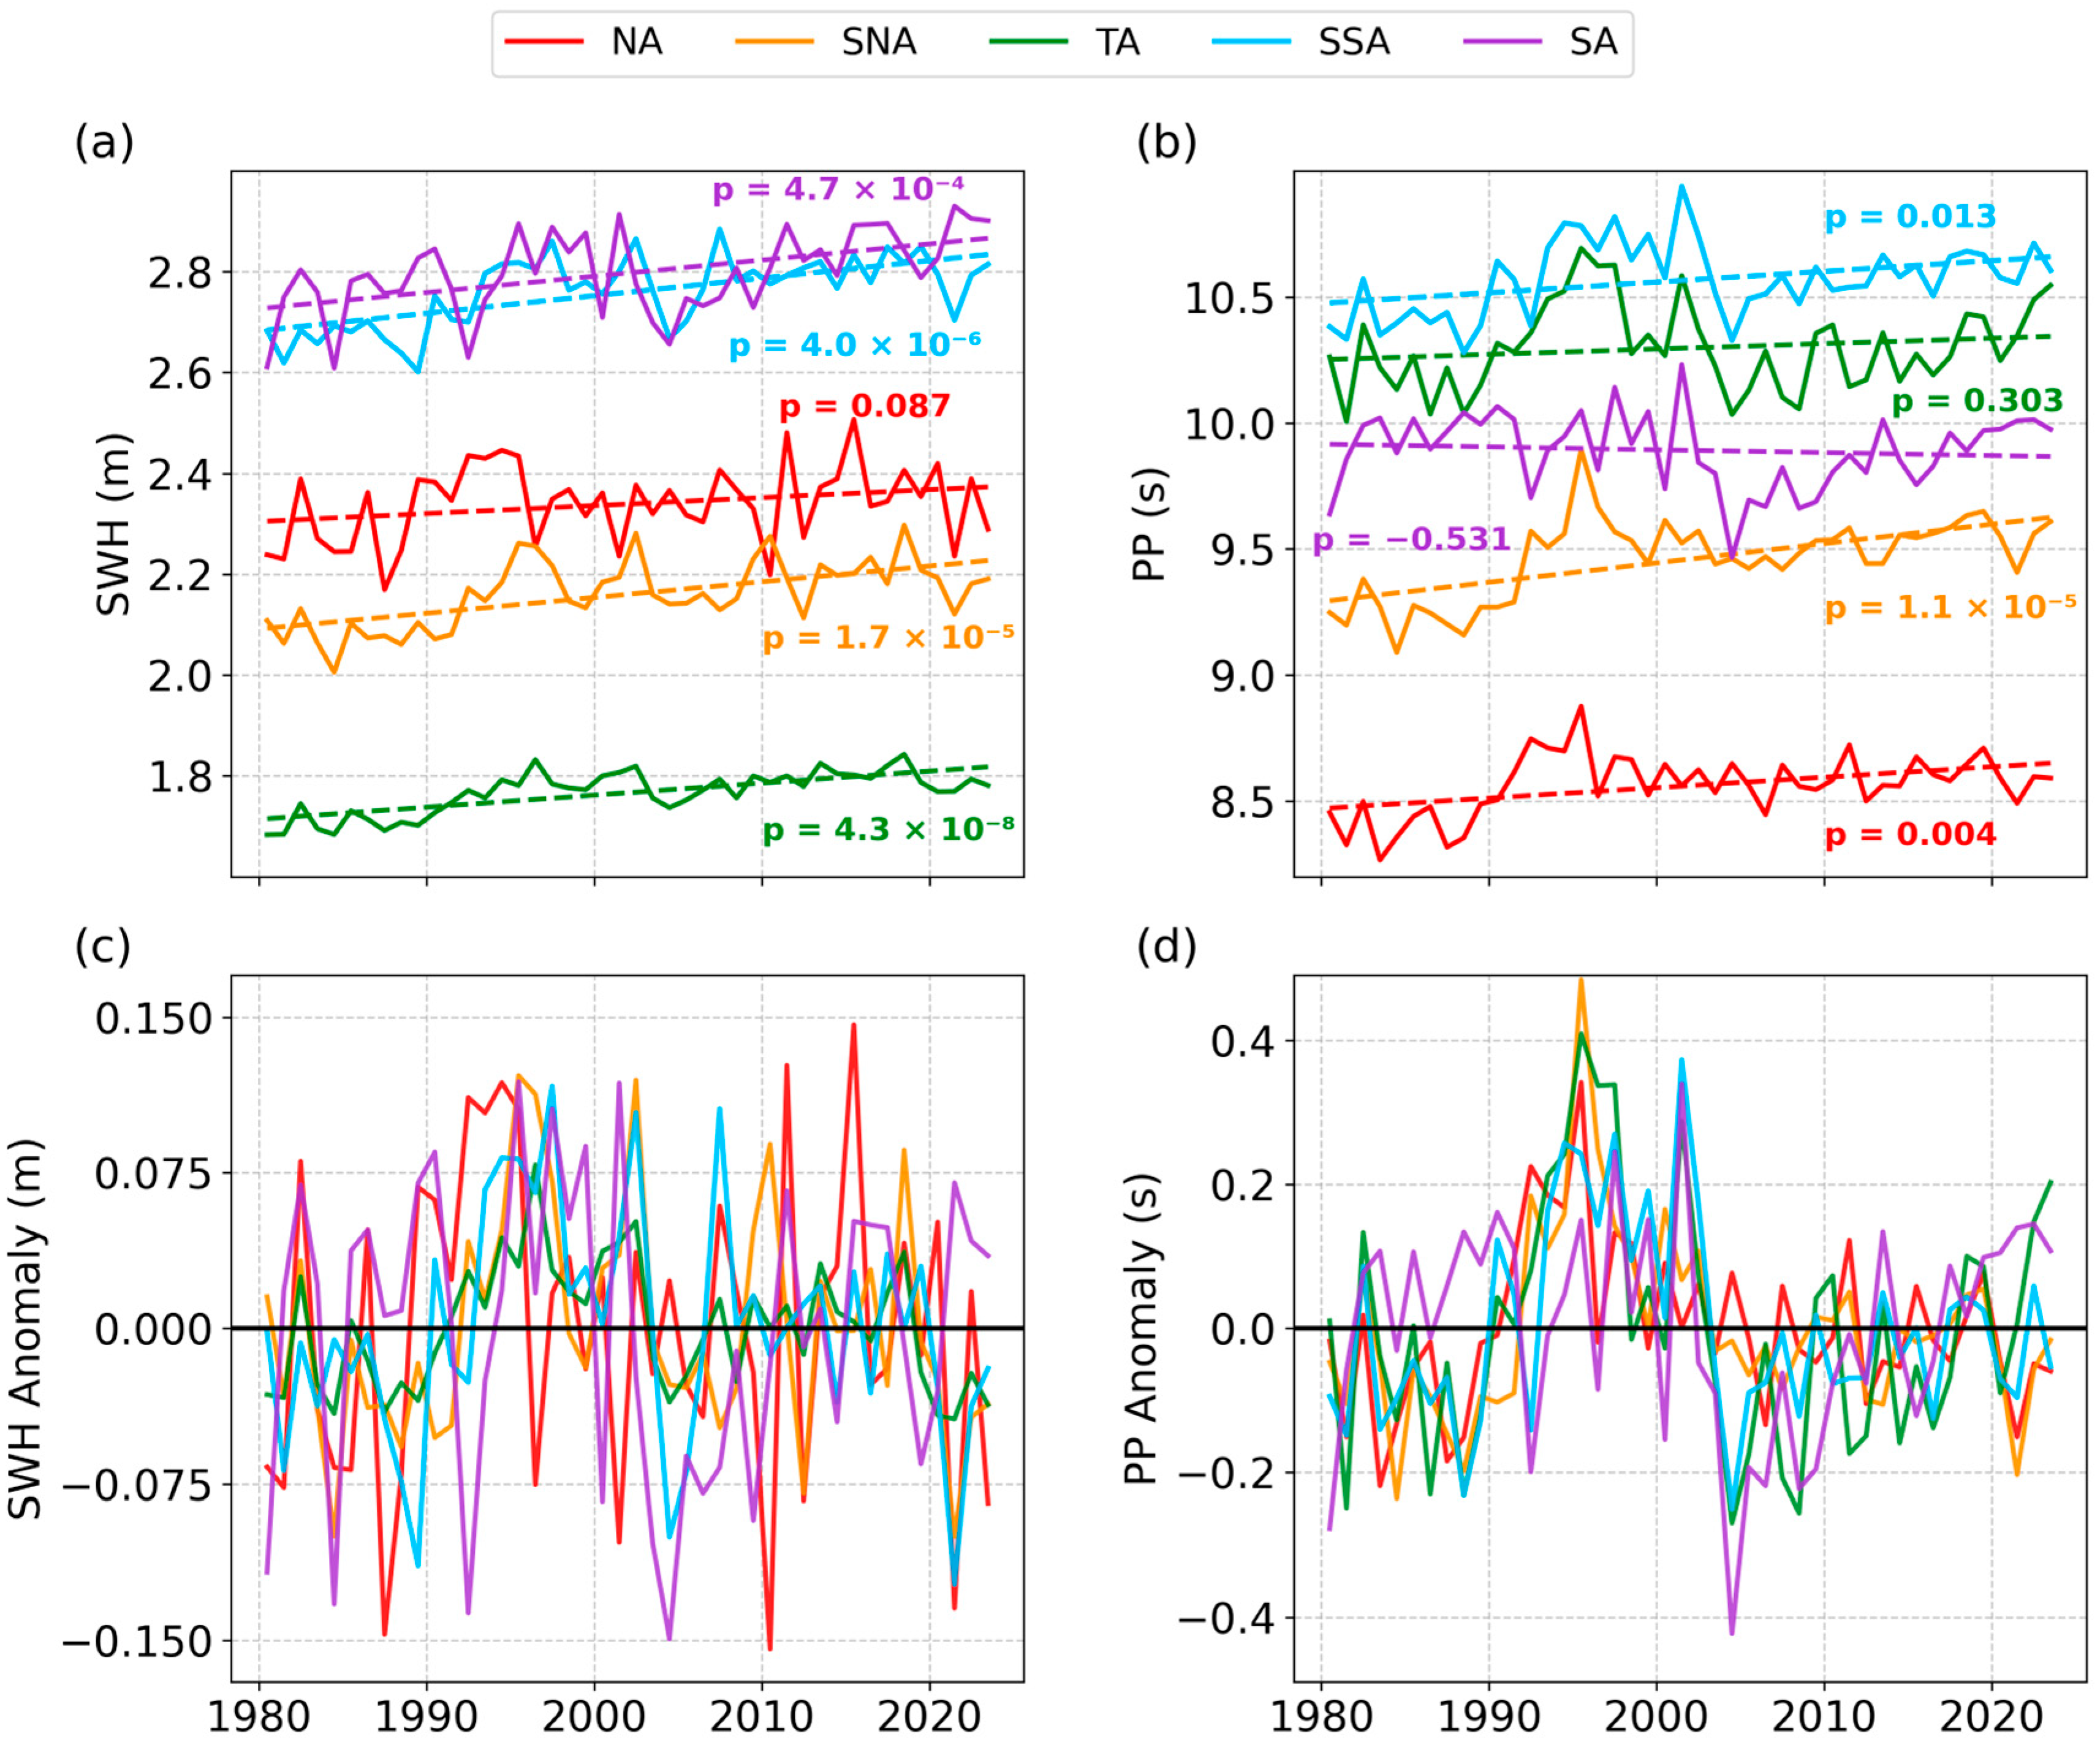
Climatological means for the 44-year period of the wave parameters used in this study are presented in Table 1. The highest interannual values of SWH were recorded in the Southern Hemisphere, specifically in the SA and SSA sectors (purple and blue—Figure 3a), which also showed the highest climatological means: 2.80 m for SA and 2.76 m for SSA (Table 1). Those higher mean values of SWH for SA and SSA might be related to the lower interseasonal (summer against winter) variability, but also to the extent of fetch, wind persistence, and pressure gradient stability. The tropical region (TA sector) exhibited both the lowest climatological mean (1.7 m) and the smallest interannual variability. In the Northern Hemisphere, the climatological means were 2.34 m and 2.16 m for the NA and SNA sectors, respectively.
Regarding PP, the highest interannual variability was observed in the SSA sector (blue—Figure 3b), with a climatological mean of 10.5 s. The TA sector had the second-highest mean (10.3 s), despite its lower SWH values compared to other sectors. The lowest interannual variability in PP was found in the NA sector, with a mean of 8.5 s.
The climatological patterns of SWH and PP across the Atlantic sectors are consistent with established mechanisms of wave generation and prevailing wind regimes. The highest values in the SA and SSA sectors are associated with persistent and intense westerlies linked to the Southern Hemisphere storm belt, which ensure long and uninterrupted fetch conditions. In contrast, the TA sector, influenced by the ITCZ and weak trade winds, shows both the lowest mean SWH and the smallest interannual variability. These spatial patterns reflect the influence of large-scale atmospheric circulation on wave energy input [68].
The elevated swell heights in the SSA and SNA sectors indicate the contribution of remotely generated wave systems, as swells travel thousands of kilometers with minimal energy dissipation. This remote forcing affects both the mean and variability of wave parameters, even in regions with weak local wind forcing. The positive trends in SWH and PP identified in most sectors may reflect long-term changes in wind intensity or shifts in storm track position, as noted in previous assessments of Atlantic wave climate variability [6,16]. These results highlight the combined influence of local and remote atmospheric processes in shaping wave conditions at decadal timescales.
In general, the trend lines for annual mean SWH and PP are upward in all five latitudinal sectors across the Atlantic Ocean. An exception is found in the SA sector for PP, where the trend is slightly negative (α = −3.1 × 10⁻⁶); however, this trend is not statistically significant (p-value = 0.53) and was therefore not considered for further analysis (Figure 3b). Although this exception is not statistically significant, it may raise discussions about wave energy dissipation related to wave steepness, as suggested in [69]. The MKT analysis also showed non-significant trends for PP in the TA and SA sectors. In the Northern Hemisphere (NA and SNA), increasing trends were found for PP. The SSA sector also presented a statistically significant upward trend. According to Figure 3a, the NA sector did not show a significant trend in SWH, despite α > 0. All other sectors showed significant positive trends with p-value < 0.05.
The maximum positive SWH anomaly was recorded in the NA sector in 2015, with 0.15 m above the climatological mean. The largest negative anomaly, also in the NA sector, occurred in 2010 with the same magnitude. In the SA sector, substantial negative anomalies were also observed throughout the interannual series, especially in 1985, 1992, and 2005. Consistent with the seasonal (Figure 2a) and climatological variability (Figure 3a), the TA sector exhibited minimal anomalies, on the order of 0.03 m.
Positive PP anomalies were observed across the Atlantic from 1993 to 2000. Prior to this period, negative anomalies predominated, particularly in the Northern Hemisphere. After 2000, negative anomalies became more prominent than positive ones. The maximum positive PP anomaly was recorded in the SNA sector in 1995, while the most pronounced negative anomaly occurred in the SA sector in 2005 (Figure 3d). In the tropical region, the anomaly pattern for PP was similar to that observed in the other sectors.

3.3. Climate Indices and Wave Climate

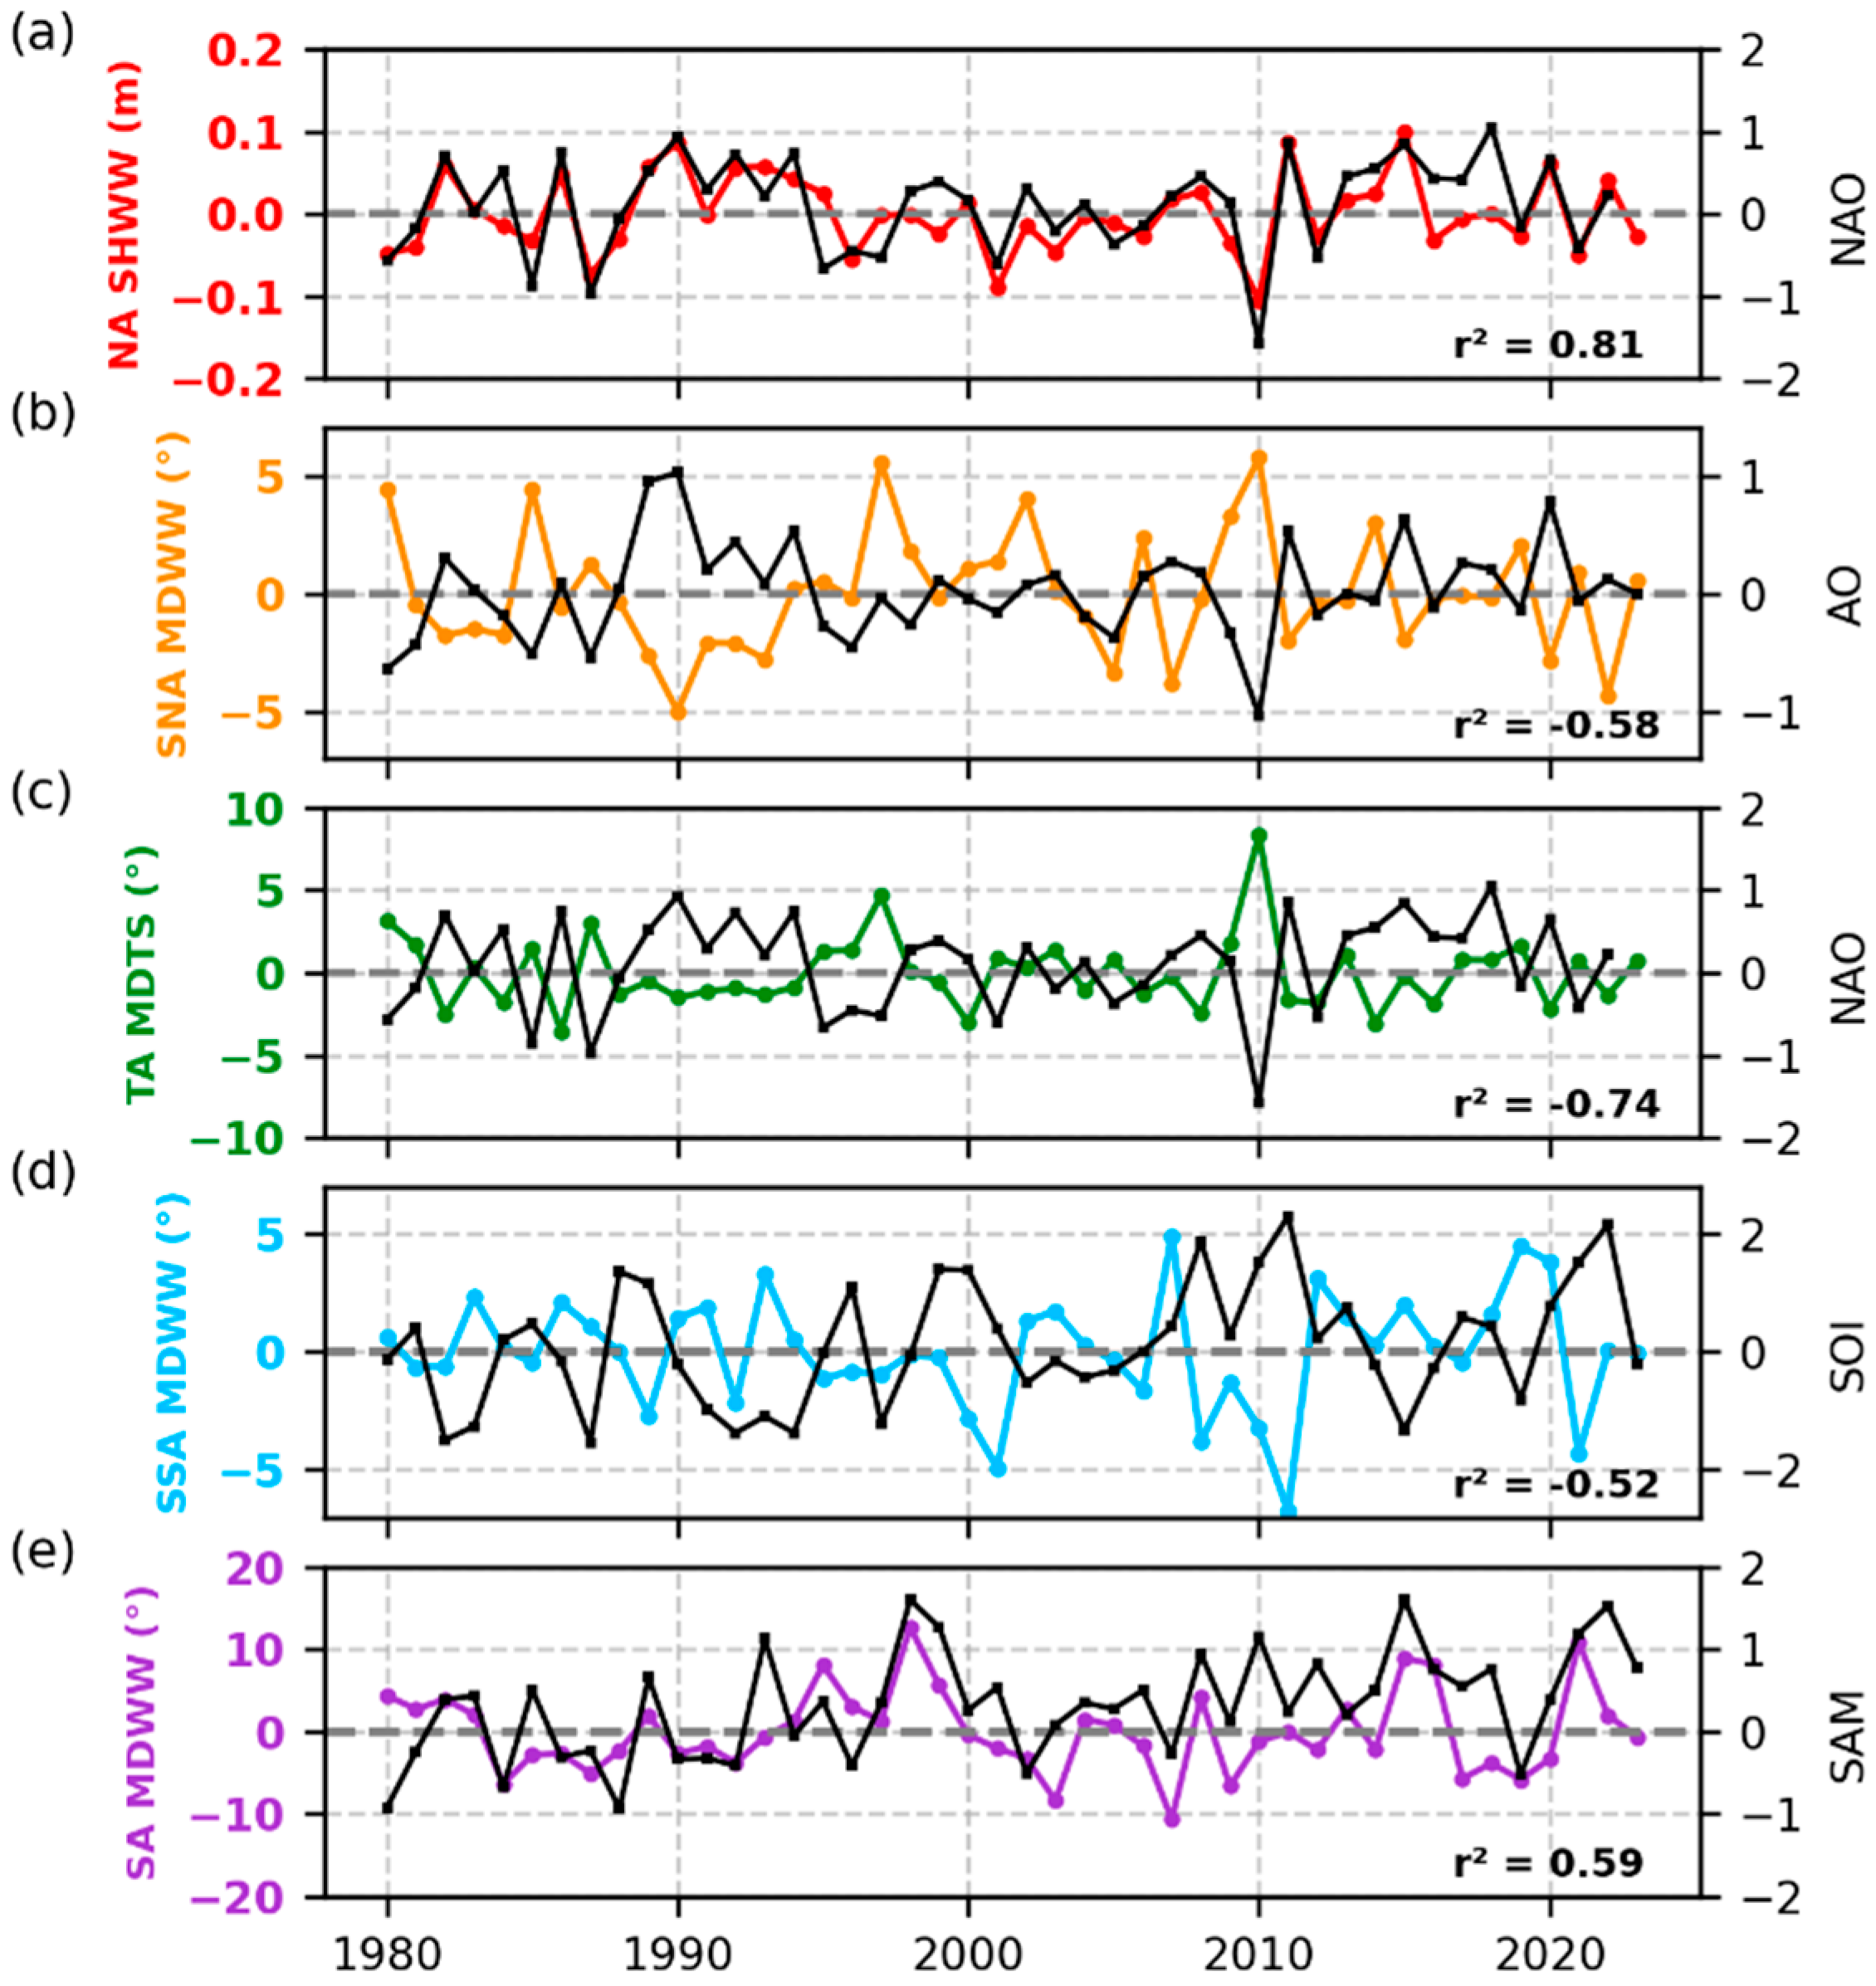
The climate indices comprising Figure 4 and exhibiting correlations above 50% with the wave climate are described below. Each climate index responds to different ocean–atmosphere processes. For instance, the NAO index stands for surface-level pressure differences from subtropical highs and subpolar lows. The positive phase of NAO reflects below-normal heights and pressure over high latitudes at the North Atlantic and above-normal heights and pressures across the central North Atlantic. The positive NAO reflects an increase in the pressure gradients from high latitudes and the central portion of the North Atlantic; the direct response to that is an increase in local surface wind speeds and the subsequent increase in local wave generation (SHWW; see Figure 4a). The opposite occurs in the negative phase of the NAO, with below=normal pressure gradients, surface winds, and local waves. Since, after generations, waves travel from the generation zones abroad, the impacts may also be felt in swells and might reach other zones. More than that, the positive NAO affects the Tropical North Atlantic trade wind patterns and cyclone tracks [70]. The combination of these effects leads to a teleconnection from the surface level pressure oscillations over the Northern and central North Atlantic to wind and wave patterns in the TA sector (r2 = −0.74; Figure 4c).
The AO index represents the principal mode of sea-level pressure variability between the Arctic and mid-latitudes [54]. In its positive phase, anomalously low pressure over the Arctic and high pressure over the mid-latitudes intensify the polar vortex and strengthen the westerlies, shifting storm tracks poleward and enhancing both local wave generation and swell export. In contrast, the negative phase weakens the polar vortex and reduces the westerlies, allowing storm tracks to shift equatorward, which alters wave generation and propagation patterns. Although the AO reflects atmospheric dynamics centered in the Arctic, a significant correlation (r2 = −0.58) was found between this index and wind-wave direction in the SNA sector (Figure 4b). This highlights the role of atmospheric teleconnections in remotely modulating wind-wave direction in the subtropical North Atlantic, extending the influence of Arctic-driven circulation well beyond the polar region.
The SOI index is defined as the standardized difference in monthly mean sea-level pressure between Tahiti and Darwin, normalized to zero mean and unit variance over a base period [59]. It measures the strength of the Walker circulation by quantifying pressure contrasts across the tropical Pacific. A positive SOI indicates stronger-than-normal easterly trade winds and La Niña conditions, whereas a negative SOI reflects weakened trade winds and El Niño events. By modulating equatorial pressure gradients and the Walker cell, the SOI significantly affects both local wind-wave generation and swell propagation toward remote basins. In the subtropical South Atlantic, the SOI shows a significant correlation with wind-wave directions (r2 = −0.52; Figure 4d). Similar to the AO relationship with MDWW in the North Atlantic, the SOI represents a climatic mechanism with a remote influence on wind-wave directions in this region.
The SAM index represents a fluctuation in the meridional pressure gradient between Antarctica and the mid-latitudes (~45° S). It is commonly derived from the leading mode of Empirical Orthogonal Function (EOF) analysis applied to monthly means of geopotential height at 500 or 700 hPa. During its positive phase, negative geopotential height anomalies prevail over Antarctica, while positive anomalies dominate near 45° S, intensifying the zonal wind field at high latitudes and weakening it at mid-latitudes. As storm tracks in the Southern Ocean are primarily zonal, these wind anomalies influence local wave generation. This mechanism explains the moderate correlation (r2 = 0.59) observed between the SAM index and wind-wave direction in the South Atlantic (Figure 4e).
The NAM index is defined as the leading EOF of Northern Hemisphere sea-level pressure anomalies north of 20° N [57chang]. In its positive phase, below-normal pressure over the Arctic and above-normal pressure at mid-latitudes strengthen the circumpolar westerlies and shift storm tracks poleward, resulting in increased surface wind speeds and enhanced wind-wave generation in high-latitude North Atlantic sectors. In the negative phase, weakened westerlies and equatorward-displaced storm tracks produce reduced wave activity at high latitudes and altered swell propagation toward lower latitudes. Thus, through modulation of large-scale pressure gradients, the NAM exerts a primary control over both wind–sea and swell characteristics in the North Atlantic.
The climatic indicators referenced above are chiefly linked to atmospheric pressure or mean sea level variability. However, within the tropical region and, to a smaller extent, the Northern Hemisphere, two SST indices (TNA and TASI) have been identified as having notable associations with wave climate. The TNA index is calculated as the area-averaged SST anomaly over 12–25° N and 60–20° W [71] and is associated with a strengthening of the meridional SST gradient and a deepening of the tropical low-pressure trough during its positive phase. This, in turn, leads to intensified northeasterly trade winds and enhanced wind-wave generation and swell export. The TASI is defined as the SST anomaly difference between the northern tropical band (10–20° N) and the southern tropical band (10° S–0° N) [62] and modulates the interhemispheric pressure gradient and trade wind strength. Its positive phase results in increased wind-wave activity and swell export, whereas the negative phase causes reduced wave energy and altered propagation pathways. Both indices play key roles in shaping regional and downstream wave climates through their influence on atmospheric circulation and surface winds.
Correlations between anomalies of the ten wave parameters and the eleven climate indices (as described in Section 2.4) are presented in Appendix A. Figure 4 shows the highest r2 values obtained for the correlation between a given wave parameter and a climate index in each of the five sectors. The NAO is the only index that appears in multiple sectors. Positive correlations with NAO and SAM are observed in the NA and SA sectors, respectively (Figure 4a,e). In contrast, negative correlations are found in the SNA, TA, and SSA sectors with the AO, NAO, and SOI indices, respectively—indicating that an increase in index value corresponds to a decrease in the wave parameter anomaly (Figure 4b–d). The strongest correlation in the entire study (r2 = 0.81) was obtained between SHWW and NAO in the NA sector. The second-highest correlation (r2 = 0.74) occurred between MDTS in the TA sector and NAO.
All sectors exhibited correlations above r2 = 0.30 with indices driven by remote atmosphere–ocean dynamics. For example, the strongest correlation in the TA sector was between MDTS and NAO, an index associated with North Atlantic atmospheric dynamics (Figure 4c). In the TA sector, NAO also modulated MPWW (r2 = 0.51) and SHWW (r2 = 0.48), while AO (r2 = −0.53), TNA (r2 = 0.47), and NAM (r2 = −0.40) showed additional moderate correlations with mean wave direction.
The NAO also exerts influence on MPWW (r2 = 0.51) and SHWW (r2 = 0.48). In the NA sector, wave heights and directions are modulated by the NAO (r2 = 0.81 with SHWW; r2 = 0.67 with MWD), NAM (r2 = 0.64 with SHWW; r2 = 0.50 with MWD), and AO (r2 = 0.79 with SHWW; r2 = 0.70 with MWD). Additionally, negative correlations (r2 > 0.3) are observed for the TNA and TSA indices. The strongest correlation in the NA sector is between NAO and SHWW (Figure 4a). In the SNA sector, the most pronounced correlation is found between MDWW and AO (r2 = −0.59; Figure 4b). NAM also influences SHWW (r2 = −0.36), MPWW (r2 = −0.42), and MDWW (r2 = −0.42), while NAO primarily modulates MDWW (r2 = −0.55).
In the Southern Hemisphere, within the SSA sector, the strongest correlation was found between the SOI index and MDWW (r2 = −0.52; Figure 4d). Additional relevant correlations involving MDWW were observed with the PDO (r2 = 0.40) and ENSO (r2 = 0.37) indices. In the SA sector, SAM was identified as the main modulator of wind-wave direction (r2 = 0.59; Figure 4e), period (r2 = 0.47), and height (r2 = 0.49). The AMO primarily influenced wave period (r2 = −0.36; PP). A comparative analysis of wave climate and climate indices indicates that all eleven indices are correlated with wave climate in at least one of the five latitudinal sectors. Among them, NAO, NAM, and AO emerge as the primary modulators of wave climate throughout the Atlantic Ocean.

3.4. Histograms and Distribution Curves

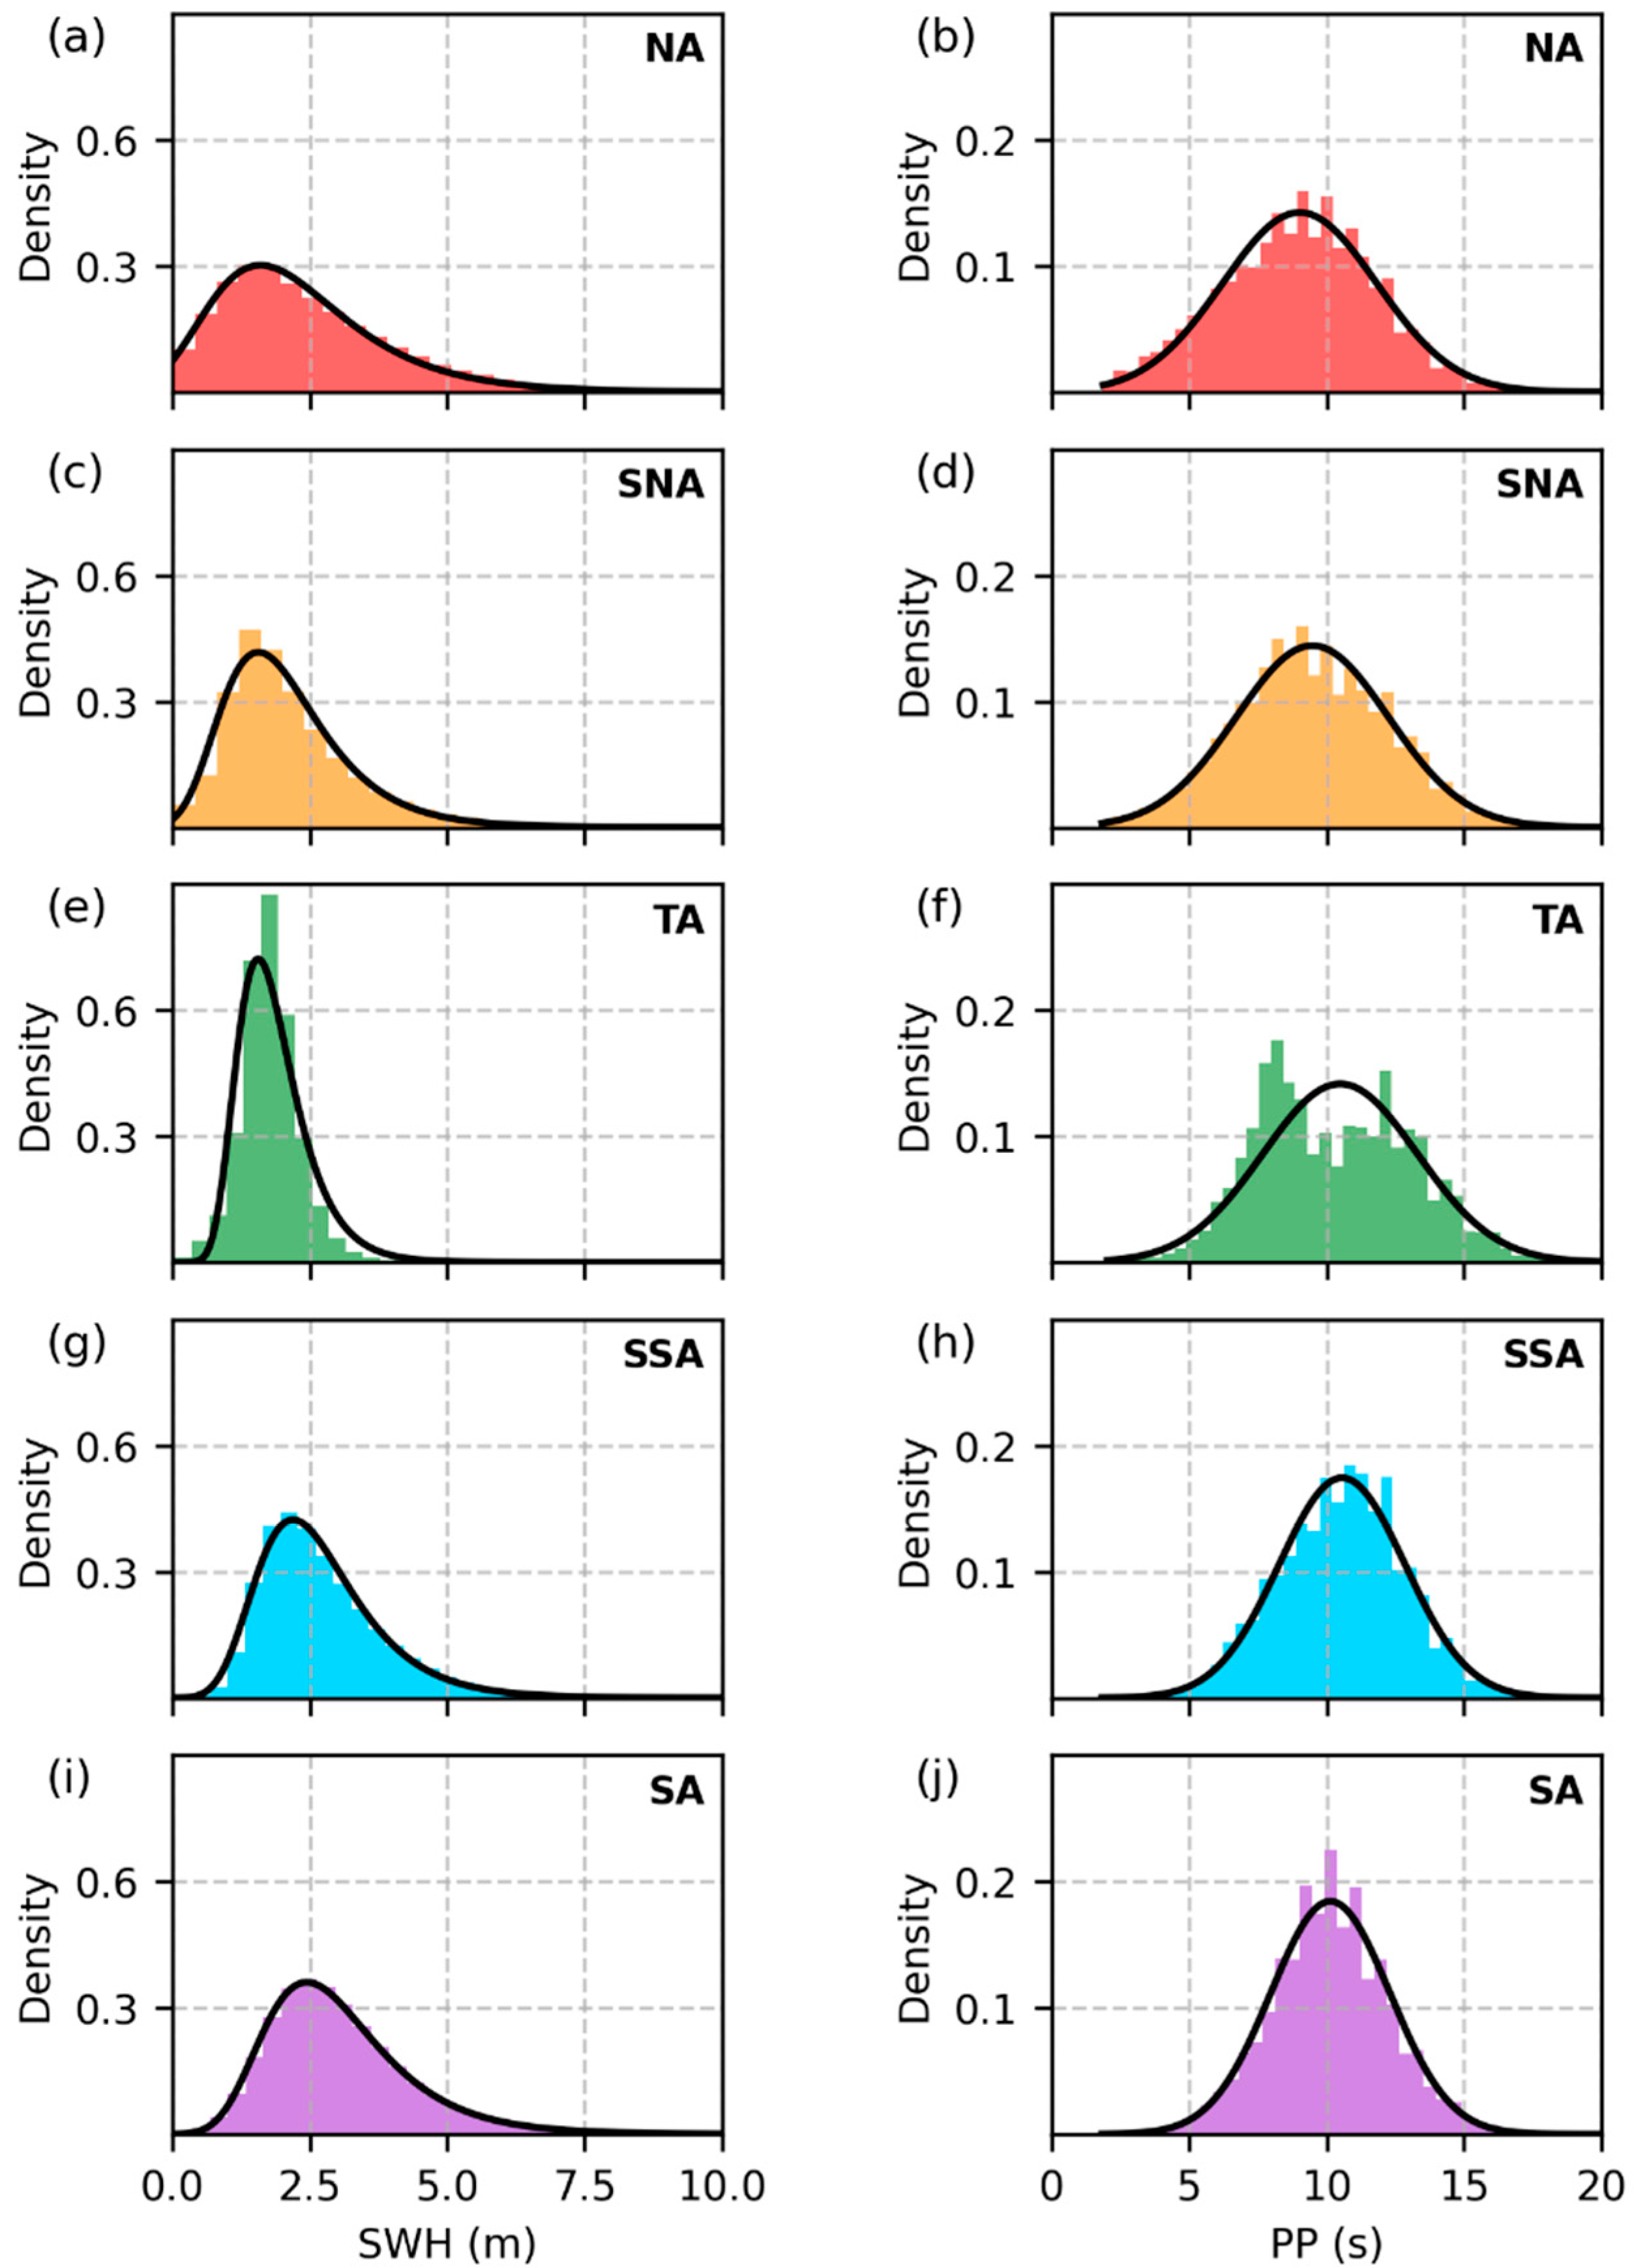
The 3-hourly dataset (1980–2023) was used to compute histograms and distribution curves for SWH and PP in all five Atlantic sectors (Figure 5). Histograms corroborate the monthly and interannual climatologies: mean SWH is higher in the Southern Hemisphere (SA ~ 3.0 m; Figure 5i). In the SSA sector, SWH averaged 2.4 m with a peak probability density of 0.42 (Figure 5g). The SNA sector also displayed a probability density of ~0.4, but with a mean SWH of 1.6 m (Figure 5c). The NA sector’s maximum probability density occurred at 1.7 m (Figure 5a). The highest peak density overall (0.7) was found in the TA sector at SWH = 1.5 m, corresponding to the lowest mean among all sectors (Figure 5e).
For PP, the Southern Hemisphere again exhibited the highest mean values: 10.1 s in SA and 10.5 s in SSA, both with probability densities of ~0.18 (Figure 5j,h). In the Northern Hemisphere, PP means were 8.9 s (0.14 density) in NA (Figure 5b) and 9.4 s (0.14) in SNA (Figure 5d), representing the lowest values observed. The TA sector’s PP mean (10.2 s, 0.14 density) was similar to Southern Hemisphere values (Figure 5f). A pronounced bimodal character was detected in the TA sector’s PP histogram, with peaks at 8.1 s and 12.1 s (Figure 5f), a pattern not seen for SWH.
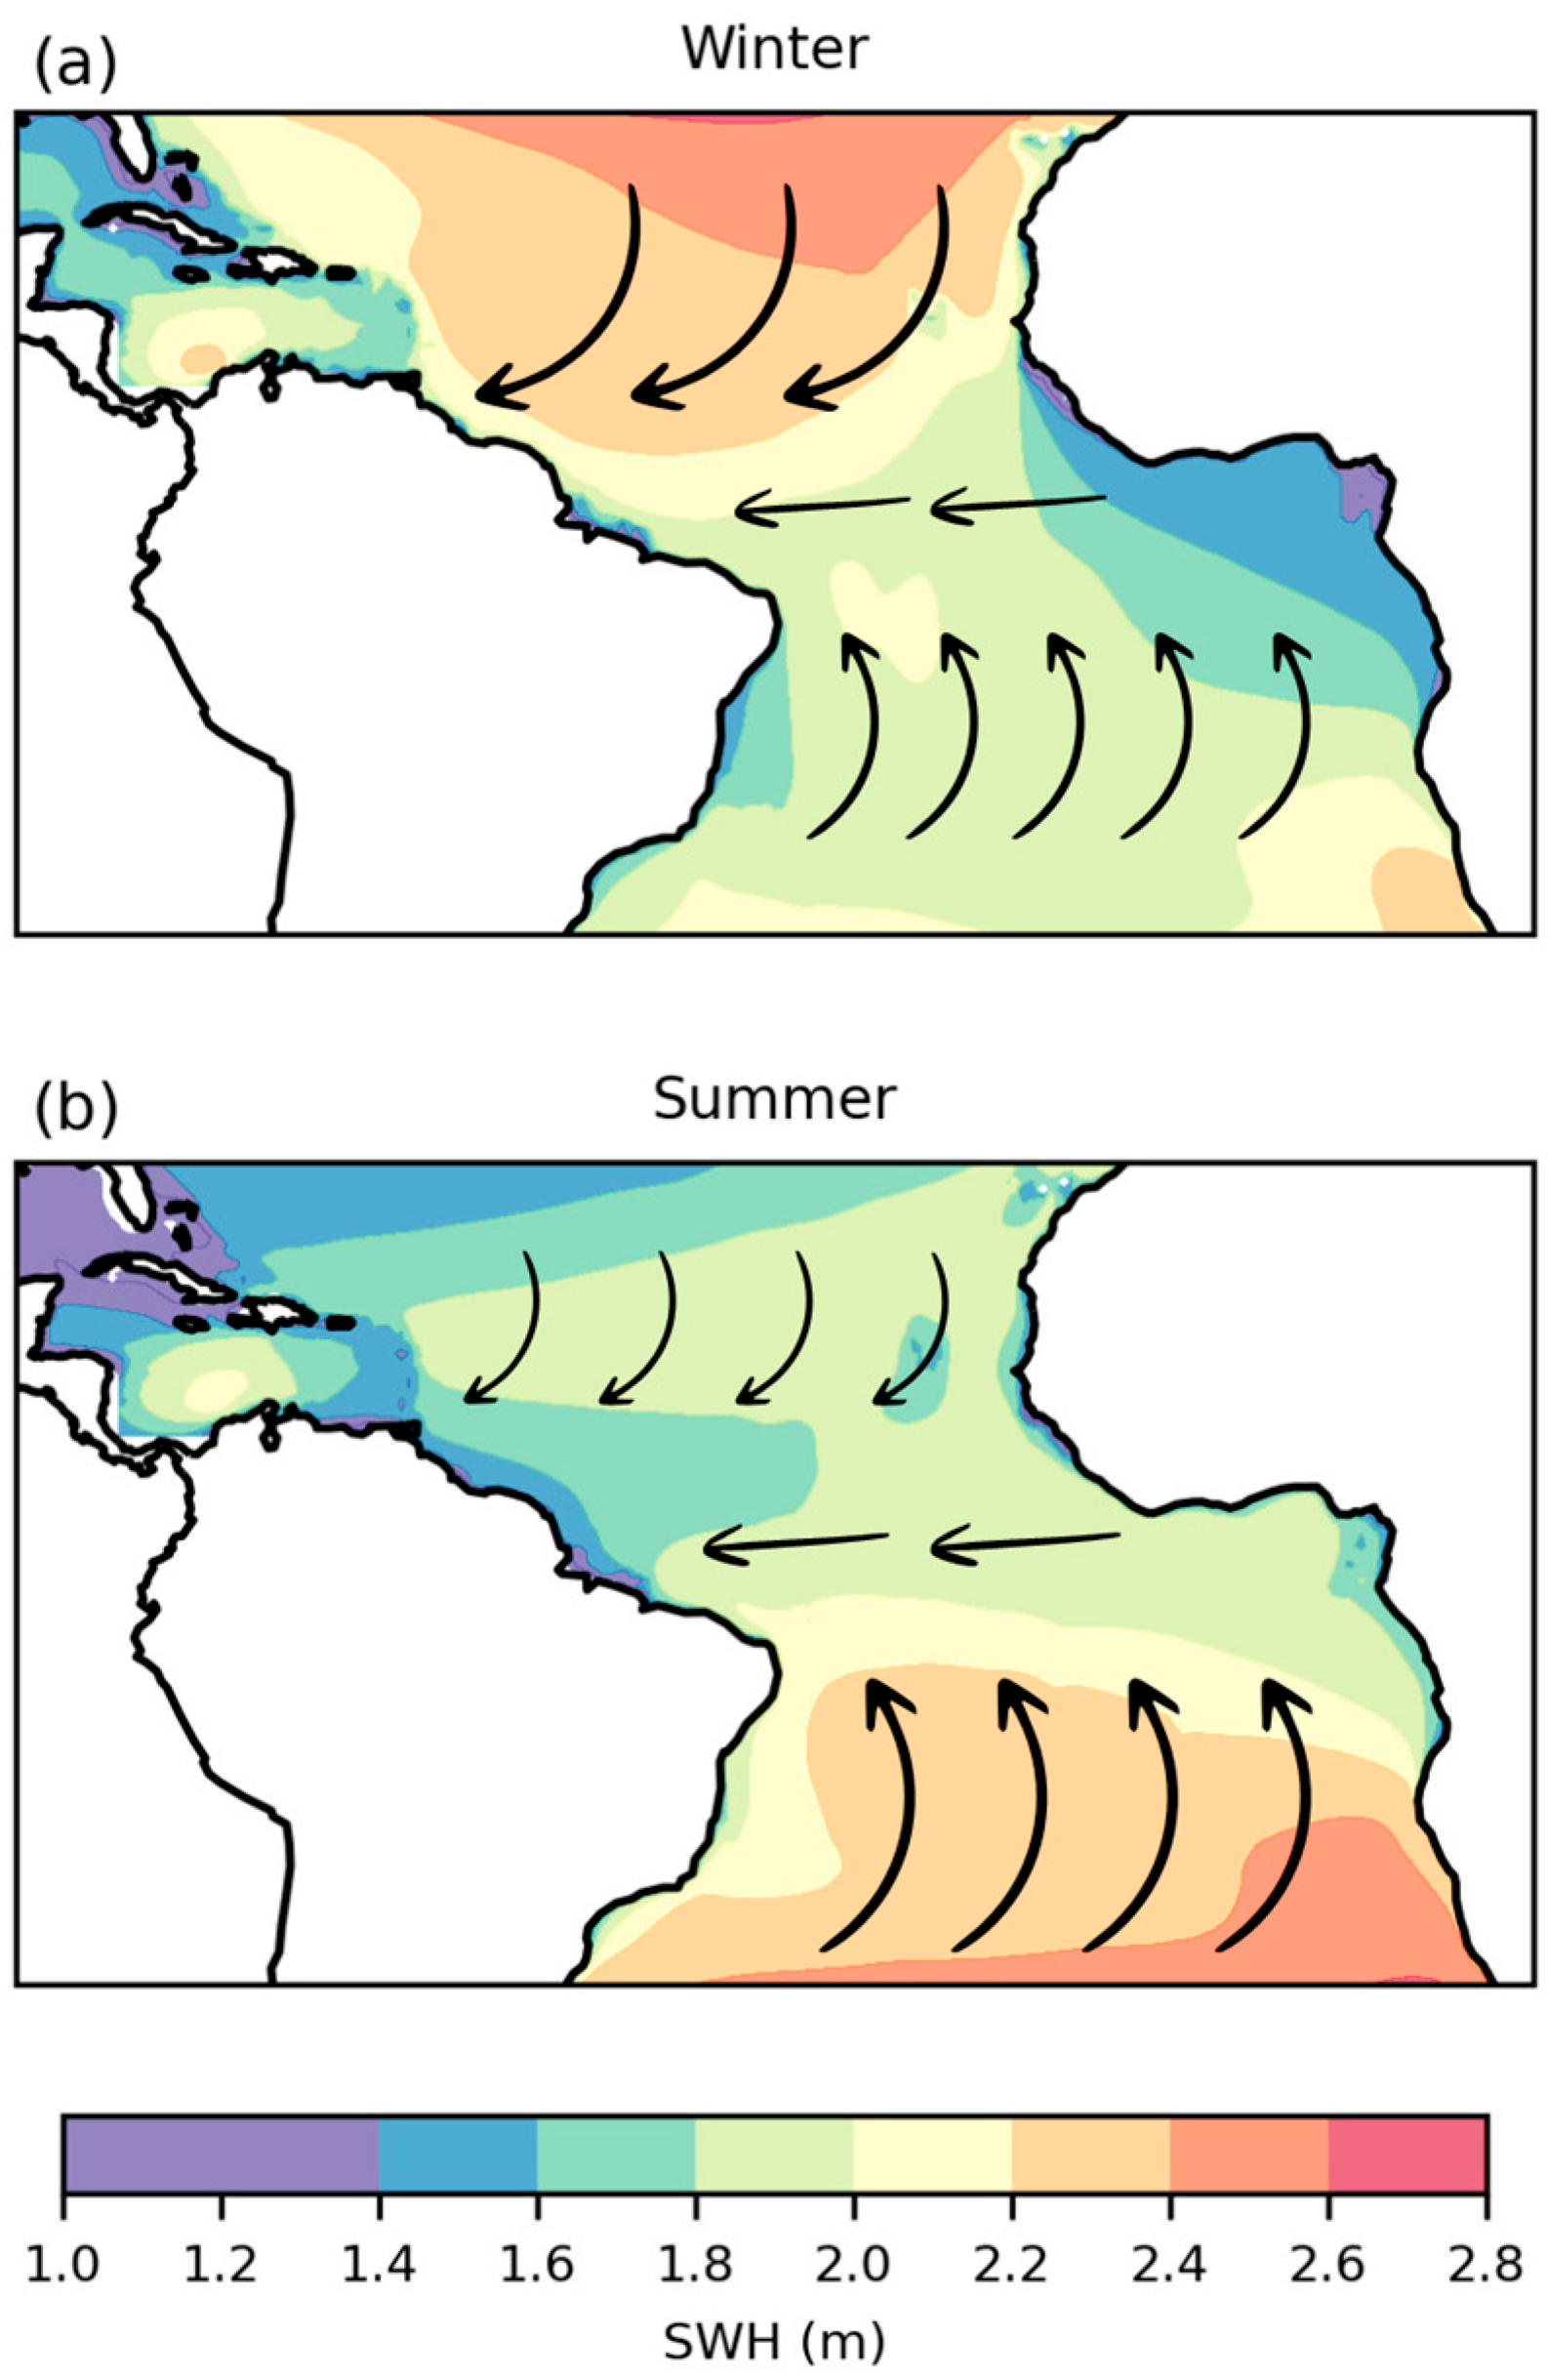
The histogram in Figure 5f reveals two distinct wave groups with different PP identified in the TA sector. In the tropical region, swell waves with shorter PP originate from Northern Hemisphere extratropical systems, particularly during boreal winter (Figure 6a). Swell waves with longer PP are generated by Southern Hemisphere extratropical systems, driven by the persistent action of the South Atlantic subtropical high throughout the year, with enhanced intensity during boreal summer (Figure 6b). In summary, the low seasonality of the Southern Hemisphere wave climate results in the continuous propagation of swell waves generated in extratropical latitudes. In contrast, the Northern Hemisphere exhibits a wave climate with pronounced seasonal variability.
The bimodal swell system in the tropical region is evident in the histogram for the TA sector in Figure 5f. However, in addition to the influence of swell waves from both hemispheres, the tropical region also exhibits its own wind–sea system, generated by local winds and characterized by westward-propagating waves near the equator. Wind–sea signals are not as clearly identified in the TA sector histogram of PP (Figure 5f) as the Northern and Southern Hemisphere swell waves. Therefore, we conclude that the wave climatology in the tropical region follows a trimodal regime, driven by swell waves from the Northern and Southern Hemispheres and by local wind–seas at low latitudes.

3.5. Climate Indices Modulating Wave Direction in the Tropical Region

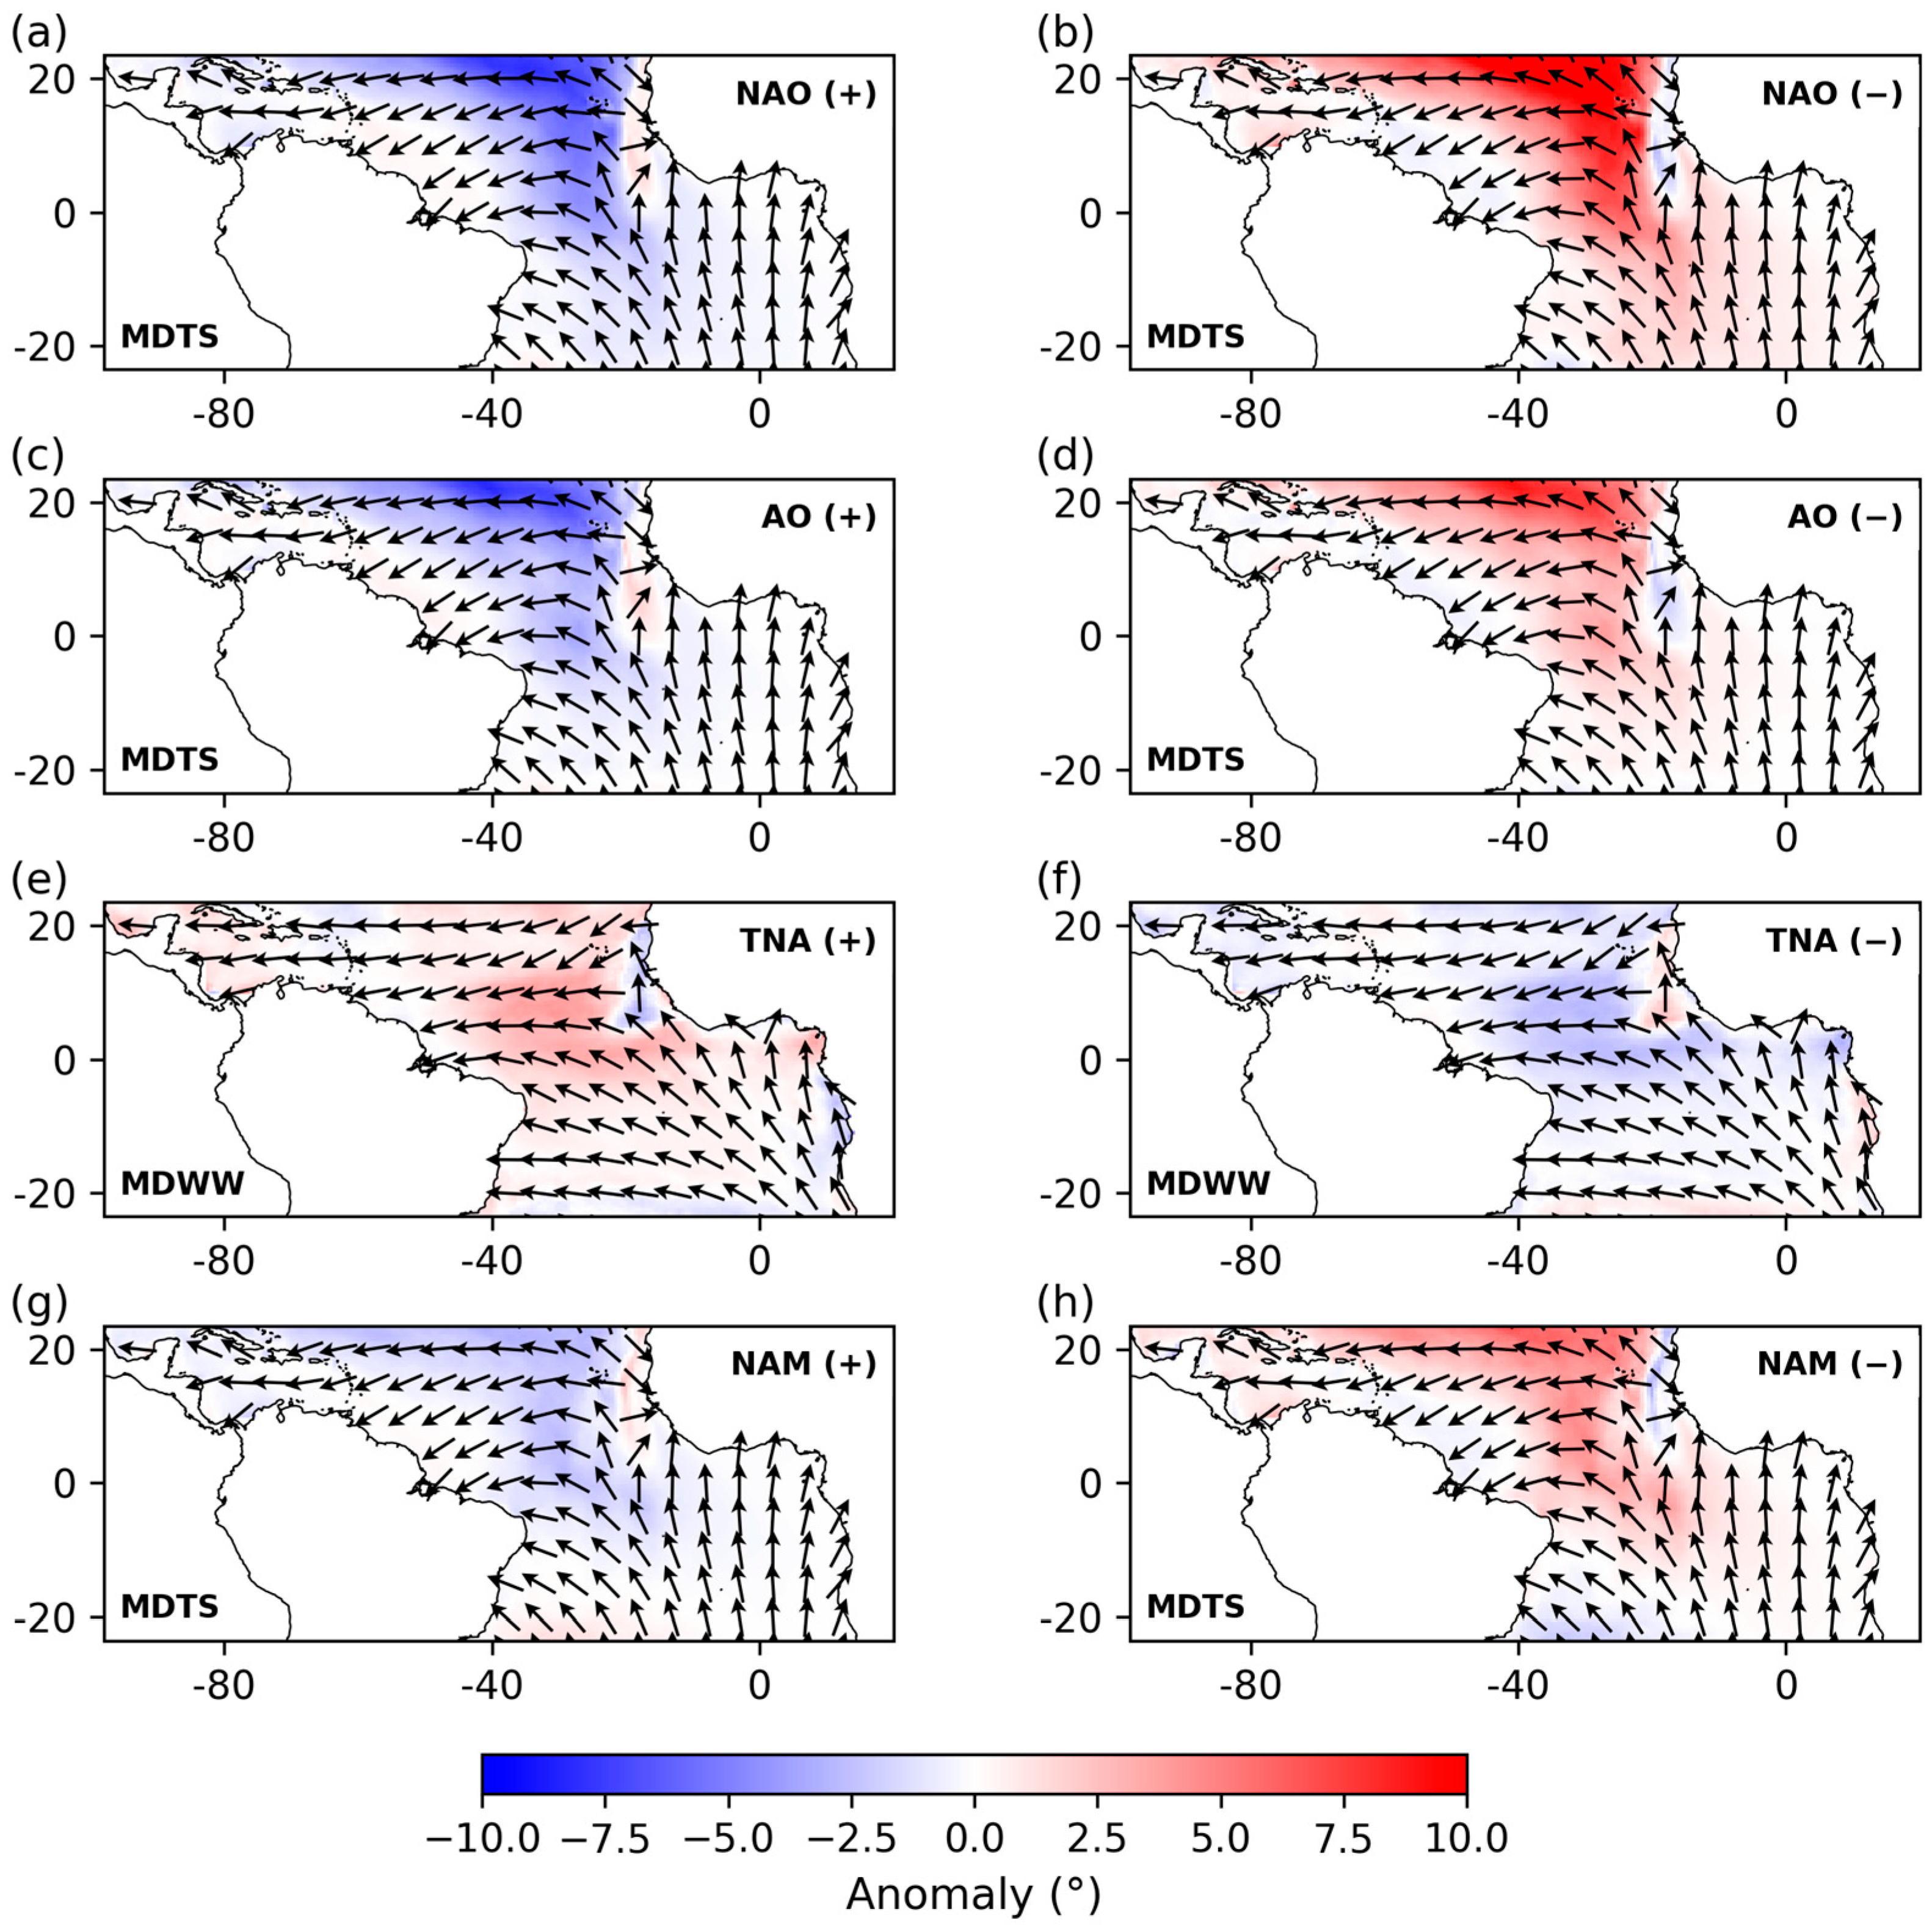
Correlation analyses revealed that climate indices primarily modulate wave-propagation direction in the Atlantic, followed by wave height and, to a lesser extent, period. Figure 7 displays composites of positive and negative phases for the four main indices correlated with wave direction in the Tropical Atlantic (TA): NAO, AO, TNA, and NAM. For each index phase, anomalies of MDTS and MDWW were calculated from annual averages.
Positive direction anomalies denote clockwise deviations (Figure 7b), whereas negative anomalies indicate counterclockwise shifts (Figure 7a). NAO-driven anomalies reach ~10°. Its greatest influence on swell direction in the tropical Atlantic occurs north of the equator between 40° W and 20° W, reflecting how NAO-induced pressure configurations in the NA and SNA sectors affect TA swell propagation. Similar but weaker patterns were observed for AO (Figure 7c,d) and NAM (Figure 7g,h). All three indices are linked to Northern Hemisphere dynamics.
The TNA index (Figure 7e,f), which reflects local Tropical Atlantic dynamics, modulates wind-wave direction. Its zone of influence lies near the equator between 50° W and 10° W, though TNA-induced anomalies (~3° in MDWW) are smaller than those associated with NAO, AO, and NAM. Thus, TNA exerts a local effect on trade wind variability and consequently on wind-wave direction in the equatorial region.

4. Discussion

4.1. Wave Climatology in the Atlantic Ocean

The monthly climatology of wave parameters demonstrated that the Northern Hemisphere exhibits a more pronounced seasonal cycle than the Southern Hemisphere, as well as minimal seasonal variability in the tropical region. These characteristics have been reported in numerous previous studies on Atlantic wave climate [8,10,13,30,40,70,72,73,74,75,76,77]. Northern Hemisphere atmospheric instability is driven by unequal solar radiation, resulting in elevated temperature gradients and enhanced atmospheric dynamics. Interannual variability of SST in the Atlantic has been associated with solar radiation fluctuations, planetary boundary-layer and ocean mixed-layer physics, ocean circulation, seasonal, intra-annual, and interannual anomalies, climatic feedback mechanisms, and variability in wave-parameter climatologies [78,79]. The North Atlantic exhibits greater intra-annual variability than other Atlantic regions, leading to more frequent and intense phenomena such as heatwaves, cyclones, anticyclones, and severe storms.
As expected, in the Northern Hemisphere sectors (NA and SNA), the highest monthly means of significant wave height (SWH) and peak period (PP) occur during boreal winter (December–March) and the lowest occur during boreal summer (June–August), with differences exceeding 3.0 m in SWH and 3.0 s in PP (Figure 2). This pattern arises from the distribution of continental and oceanic masses, which amplifies seasonal temperature gradients, alters atmospheric dynamics, and intensifies wind fields [80]. In the Southern Hemisphere, the ACC dampens atmospheric seasonal variability, thereby reducing seasonal SWH fluctuations in the austral sector [11,12].
Climatological means (Table 1) indicate that the Southern Hemisphere exhibits larger wave heights and periods than both the Northern Hemisphere and the tropical region, with the exception of wind waves in the NA sector, where height and period are comparable to those in the SA and SSA sectors. In the Southern Hemisphere, swell heights and periods are up to 60% larger than in the Northern Hemisphere, while the tropical sector displays the smallest heights yet longer periods than the Northern Hemisphere. Wave directions in the Atlantic reflect variability of the ITCZ at low latitudes and westerly winds associated with subtropical and subpolar pressure systems at mid and high latitudes.
This pronounced hemispheric contrast is primarily attributed to the broader and less obstructed oceanic fetches in the Southern Hemisphere, where persistent westerly winds and frequent extratropical cyclones generate high-energy, long-period swell systems. In contrast, the Northern Hemisphere is more fragmented by landmasses, which restrict fetch and disrupt wave propagation. These differences pose greater challenges for wave modeling in the Southern Hemisphere, as small biases in wind intensity or storm representation may lead to significant underestimation of swell characteristics. Reanalysis products such as ERA5 are known to underestimate strong wind events at high latitudes, potentially resulting in lower simulated swell heights and periods compared to observations [29].
The SA and SSA sectors exhibit the highest climatological means of SWH and wave energy. These enhanced values can be attributed to the main features, the frequent presence of extratropical cyclones within the mid-latitudes of the South Atlantic, typically between 30° S and 60° S, and the Antarctic Circumpolar belt, with its persistent zonal winds. Those systems generate strong and persistent winds, often exceeding 14 m s−1, and act over broad, unobstructed oceanic fetches, particularly during the austral autumn and winter [81]. As a result, the generation of long-period and high-energy wave systems is favored across these sectors. Numerical wave modeling and reanalysis-based studies have shown that maximum values of SWH are concentrated in the southeastern portion of the South Atlantic, gradually extending northward [6].
In contrast, the NA sector displays the lowest interannual variability in PP. This behavior is likely associated with the more stable trade wind regime prevailing in the tropical North Atlantic, where large-scale transient systems such as cyclones and frontal disturbances are less frequent [19,82]. Moreover, the variability of wave energy in the North Atlantic has been shown to be strongly modulated by the NAO, which affects the intensity and position of extratropical storm tracks. In equatorial regions, where the NAO influence is less pronounced, wave generation tends to remain more consistent across years [82].
Recent studies have documented a trend of increasing SWH in the Atlantic and globally [9,18,19,42,83,84,85]. In the present study, positive trends were identified for periods (MWP and PP) and for wave heights (SWH, MWH, SHWW, and SHS). The prevalence of positive SST anomalies over recent decades—evidence of global warming—has contributed to the positive trend slopes observed in SWH climatologies [15,78,79]. According to [16], wind-wave direction and intensity in the Atlantic are being altered by changes in atmospheric dynamics and interhemispheric teleconnections associated with positive temperature anomalies.
As previously observed by several authors (as cited above), the present study also identified slight positive trends in SWH across the Atlantic Ocean. The most pronounced increases in SWH were found in the Southern Hemisphere, particularly in the SSA sector (Figure 3a; shown in blue), which exhibited the highest slope coefficient of the trend line (α = 9.5 × 10⁻⁶; p-value = 4 × 10⁻⁶). However, for PP, the present study found that the strongest increasing trends occurred in the Northern Hemisphere (NA and SNA sectors). Although previous studies have also identified increasing trends in SWH globally, our results indicate that in the Atlantic Ocean, there has also been an increase in PP, with a trend slope approximately one order of magnitude greater than that observed for SWH. The highest slope coefficient was recorded in the SNA sector (α = 2.1 × 10⁻⁵; p-value = 1.1 × 10⁻⁵; Figure 3b).
Decadal variability was also evident in wave-height anomalies. Positive anomalies in SWH were observed across all five sectors between 1993 and 2003 (Figure 3c,d). This phenomenon is linked to the combined influence of multiple climate indices. These effects are reflected in the maximum positive SWH anomaly recorded in the NA sector in 2015 (Figure 3c) and in the predominance of positive PP anomalies between 1993 and 2000, particularly the peak observed in the SNA sector in 1995 (Figure 3d). Positive phases of the AMO and NAO have been shown to intensify winds and the momentum transferred to the ocean, thereby increasing SWH and PP during the 1990s and 2000s [21,86,87,88,89]. In the Southern Hemisphere, this period coincided with positive phases of AMO, TSA, and SAM [23].
Beyond direct AMO and NAO effects, analysis of the interannual series of climate indices reveals that other modes of variability also played significant roles in modulating the observed anomalies. In particular, ENSO teleconnections and the modulation of wind patterns by the PDO and SAM contributed to interannual variations in SWH and PP between 1993 and 2003 [20,22,31,89]. This interaction among climate modes suggests that, over the study period, ocean–atmosphere conditions were influenced by multiple forces that together intensified wave phenomena and produced positive SWH and PP anomalies.
The positive trends in SWH and PP observed across all five latitudinal sectors of the Atlantic are consistent with several recent regional and global studies [17,33]. However, contrasting results have been reported at local scales, where either neutral trends or decreasing SWH have been documented [16,90]. These discrepancies highlight the influence of spatial scale and local atmospheric and oceanographic conditions on wave climate trends. Local factors such as coastal morphology, bathymetry, and regional wind variability can modulate the wave climate independently from broader regional or global patterns. Therefore, the interpretation of positive trends in the Atlantic must consider the multi-scale nature of wave climate variability, distinguishing between local, regional, and global influences.
Although ERA5 data are widely used for their global coverage and temporal consistency, it is important to recognize that both wind and wave fields carry biases that can affect climatological analyses. The ERA5 atmospheric model tends to underestimate strong winds during extratropical storms and cyclones, potentially resulting in underestimated wave heights, since the wave model is directly forced by wind fields [25]. This bias can smooth extremes and affect the statistical distribution of data. Additionally, studies have shown that ERA5 may overestimate SWH in some tropical regions and underestimate it at high latitudes [91,92], which can directly impact the physical interpretation of interannual and decadal patterns. The discussion of wave-parameter anomalies and their correlation with climate indices is presented below.

4.2. Influence of the NAO in the Tropical Region

Correlations between anomalies of the ten wave parameters and the eleven climate indices demonstrate that all five Atlantic latitudinal sectors are strongly influenced by at least one climate index. In each sector, at least 30% of interannual variability in a given parameter is accounted for by these indices. The highest correlations between interannual anomaly series of wave parameters and climate indices are shown in Figure 4. In the Northern Hemisphere sectors (NA and SNA), the NAO (r2 = 0.81) and AO (r2 = −0.58) were the primary controls on wind-wave height and mean direction, respectively. In the Southern Hemisphere, wind-wave direction was modulated by the SAM in the SA sector (r2 = 0.59) and by the SOI in the SSA sector (r2 = −0.52). In the tropical sector (TA), the NAO exerted the strongest control over mean swell direction (r2 = −0.74).
It is important to assess whether NAO-driven anomalies in wave parameters exceed the inherent uncertainties associated with the datasets. For instance, these anomalies in mean wave direction may reach 10°, a magnitude that falls within the typical uncertainty range reported for reanalysis products, estimated at approximately ±10–15°, e.g., [24,33,45,93]. This is also comparable to the uncertainty found in buoy observations, which can range from ±5° to ±10° depending on sea state and spectral estimation methods [29]. Despite these inherent uncertainties, the presence of a strong and statistically significant correlation between the NAO index and the swell wave direction in the tropical region, with a correlation coefficient of –0.74, indicates that these anomalies are unlikely to be random fluctuations or artifacts of model limitations. Instead, their spatial consistency and systematic association with a well-established mode of atmospheric variability support their physical relevance. This points to a real modulation of wave climate by large-scale climatic forcing.
The tropical wave regime is complex, involving both locally generated wind waves and swells arriving from the Northern and Southern Hemispheres. This combination supports the interpretation of a trimodal pattern. However, the PP histograms (Figure 5f) display a bimodal distribution, with peaks around 8.1 s and 12.1 s. Peak periods associated with wind waves generated both locally and remotely in each hemisphere are similar and tend to overlap in the histogram. A recent study [94] classified the wave and wind regimes in the tropical Atlantic as bimodal. Despite the seasonal variability in the Northern and Southern Hemispheres, the tropical region receives swell energy throughout the year. Swells from the Northern Hemisphere prevail between November and March, while those from the Southern Hemisphere are more frequent between April and October. There is a slight predominance of Southern Hemisphere swell due to its lower intra-annual variability (Figure 6).
Histogram analyses in Figure 5 for Northern and Southern Hemisphere sectors confirm larger wave heights and periods in the Southern Hemisphere. Wave heights arriving in the tropical sectors (NA, SNA, SSA, and SA) are similar yet differ in period and direction. Despite the complex and seemingly bimodal characteristic observed in the TA sector (see Figure 5f), the regime is truly trimodal, as locally generated waves interact with swells from both hemispheres (Figure 6). The research described in [94] also identified wave–climate variability driven by both local and remote processes in the tropical Pacific. In the North and tropical Atlantic, SWH variations are more strongly impacted by remotely generated swells than by locally generated wind waves. In other words, the highest wave heights in the tropics are related to remote generation—either in the Northern or Southern Hemisphere. Some authors have pointed in the same direction, additionally associating local forcing (e.g., wind speed) and storm events quantified by cyclone occurrences [37,95,96].
This work presents correlations between eleven climate indices and the main wave parameters. The strongest correlations between climate indices and wave parameters are found for wave direction rather than period or height. Furthermore, the results indicate that variability in remotely acting climate indices in the tropical region primarily influences wave-propagation direction. Our analysis shows that the NAO is responsible for 74% of interannual variability in swell-direction anomalies in the TA sector, underscoring the importance of understanding climatic teleconnections, whereby phenomena in one region can exert significant effects in remote areas. Evidence of this dynamic is present in the correlation results, with NAO, AO, TNA, and NAM each modulating at least 30% of wave-direction variability in the tropics. The influence of these indices is observed for both wind-wave and swell mean directions.
In our analysis, climate indices in the Atlantic primarily influence wave climate through wave directions (especially wind-wave direction), which are more affected than height and period. Previous studies have shown that the NAO is a primary factor influencing North Atlantic wave–climate variability, with its positive phase increasing wave and extreme wave heights in the eastern portion (Norwegian Sea) and decreasing them in the western portion (Labrador Sea) [8,10,21]. In the present study, only the NA sector exhibited a significant correlation (r2 > 0.3) for SWH. PP was influenced by NAM (NA and TA sectors), TSA (NA, SNA, and TA sectors), and AMO (SA sector). The influence of climate indices on wave climate across different Atlantic latitudes warrants further investigation, as studies to date focus mainly on SWH and wave-period variability. Changes in wave-propagation direction in the tropical region remain largely unexplored.
Tropical processes also exert significant influence on the NAO, particularly through the Madden–Julian Oscillation (MJO), whose effects are most evident at time scales relevant to atmospheric dynamics and teleconnection formation [53,97]. These authors further indicate that tropical circulation plays an attenuating role in NAO patterns, modulated by extratropical processes. In the tropical Indian Ocean, SST variability is a principal modulator of the NAO [35].
In the North Atlantic, interannual SST differences are also important factors in NAO fluctuations [98]. In the tropical Atlantic, gradual SST increases directly impact boreal winter climate variability and mean sea level pressure [99]. In the Southern Hemisphere, tropical South Atlantic SST anomalies can shift the ITCZ position, thereby affecting precipitation patterns and NAO variability [100]. Therefore, understanding teleconnection processes—particularly changes in wave-propagation direction and consequent shifts in wave generation zones—requires further scientific attention.
The results indicate that the NAO influences both wave-generation source areas and propagation pathways, either by expanding generation zones or shifting them geographically. Northern Atlantic region indices (e.g., NAO, AO, and NAM) influence wave period and especially wind-wave height, but only the NAO influences wave-propagation direction. For these three climate indices, the strongest correlations with mean swell direction were r2 = −0.74 (NAO), r2 = −0.56 (AO), and r2 = −0.42 (NAM) (Appendix A; Figure 7). The TNA index exhibited r2 = 0.59 in correlation with mean wind-wave direction. According to Figure 7, positive (negative) NAO phases produce ~10° changes in wave-propagation direction between 40° W and 20° W in the Northern Hemisphere. A 10° difference over a 3000 km path results in a 500 km lateral displacement. In coastal zones, this spatial scale is important for microscale dynamics [45,95]. Impacts of extreme-event variability in the tropical wave climate linked to NAO variability can therefore be anticipated along coastlines, given that wave direction is the primary parameter influenced by Atlantic teleconnection oscillations.
These findings highlight the need for localized validation of wave direction in reanalysis products, especially in tropical regions subject to remote climatic forcing. High-resolution regional models, assimilation of buoy data, or directional corrections based on dominant climate modes may help mitigate directional biases and improve reliability for coastal impact assessments.

5. Conclusions

In this study, the climatology of wave parameters in the Atlantic Ocean and their relationship with large-scale climate variability were examined. The results are consistent with previously documented seasonal and climatological patterns in the basin, reinforcing established differences between hemispheres. The Northern Hemisphere displayed stronger seasonal variation, primarily due to intense thermal gradients, atmospheric instabilities, and the asymmetric distribution of land and ocean masses. In contrast, more homogeneous wave patterns were observed in the Southern Hemisphere and the tropical region. This asymmetry highlights the influence of regional dynamics and geographic setting in shaping wave regimes and producing distinct responses to the same large-scale climatic drivers. In the Northern Hemisphere, wave parameters showed substantial seasonal ranges, with SWH and PP varying by more than 3.0 m and 3.0 s, respectively, between winter and summer. The Southern Hemisphere, influenced by the persistent ACC, exhibited more moderate variability, characterized by stable wind and swell conditions throughout the year. Although the tropical region showed an intermediate response, a key result of this study is the identification of statistical relationships between wave patterns and physical processes reflected in climate indices, such as pressure gradients, sea surface temperature anomalies, and sea level variations. These processes, which originate beyond tropical latitudes, appear to influence wave regimes primarily through changes in wave direction, particularly in wind waves and, to a lesser extent, in swells. The tropical region, in turn, displays intermediate responses, where local physical processes, combined with the interaction of remotely generated waves, modulate wave regimes in distinct ways, with wave direction emerging as the most responsive parameter to remote climatic forcing.
Temporal analyses reveal positive trends in wave parameters across the 44-year study period, with notable linear trend coefficients, particularly in the Southern Atlantic (e.g., α = 9.5 × 10⁻⁶ yr−1 for SWH) and in the Subtropical North Atlantic (e.g., α = 2.1 × 10⁻⁵ yr−1 for PP) sectors. Comparative analyses between wave climate and climate indices suggest that global thermal anomalies are enhancing momentum transfer processes, resulting in more energetic waves with longer periods, supporting the global increasing trend observed in climatological series. In the tropical region, two distinct swell systems were identified in the PP histograms, with peaks near 8.1 and 12.1 s, corresponding to waves generated by extratropical systems in the Northern and Southern Hemispheres, respectively. Although the signature of locally generated wind seas was less pronounced, their presence near the equator was inferred from seasonal and directional patterns. These results indicate that the tropical wave climate is characterized by a trimodal regime composed of northern swells, southern swells, and equatorial wind seas. These findings reinforce the complexity of wave parameter behavior and the importance of climatic teleconnections in modulating not only wave intensity but also their distribution and propagation direction throughout the Atlantic Ocean.
Additionally, the results reveal that climate indices predominantly influence wave-propagation direction, more so than wave height and period. In the tropical region, for example, the NAO proves decisive, explaining about 74% of the interannual variability in swell direction, while indices such as the AO, TNA, and NAM account for at least 30% of this variability. This strong dependence on teleconnected mechanisms highlights that remote oscillations can significantly alter wave source regions and propagation paths—an effect that, given the spatial scales of several hundred kilometers, has direct implications for coastal dynamics and the prediction of extreme impacts.
To translate these findings into modeling improvements, it is recommended that climate-index-driven variability be explicitly integrated into wave model forcing fields, for example, by modulating wind stress or wave generation areas according to dominant climate modes such as NAO and SAM. Furthermore, regional wave models should incorporate directional bias corrections based on teleconnection patterns, particularly in the tropics, where swell direction variability is significant. The assimilation of observational data capturing these teleconnections, combined with higher-resolution atmospheric inputs, is expected to reduce uncertainties in wave height and direction forecasts, thereby enhancing coastal risk assessments. Therefore, the incorporation of these factors into future modeling efforts and studies is essential for improving the understanding of ocean–atmosphere interactions and mitigating risks associated with climatic variability in the Atlantic Ocean wave regime.

Author Contributions

Y.O.P.: Conceptualization, data curation, investigation, formal analysis, software, and writing—original draft. A.C.d.S.: Methodology and writing—review and editing. A.L.M.: Conceptualization, methodology, and writing—review and editing. G.D.G.J.: Data curation, supervision, and project administration. F.H.: Funding acquisition, writing—review and editing. All authors have read and agreed to the published version of the manuscript.

Funding

This research was funded by the Laboratoire Mixte International TAPIOCA between Institut de Recherche pour le Développement (IRD) and the Federal University of Pernambuco (UFPE), through the French program TOSCA-CNES SWOT-Brésil project agreement n. 4500081707. The Article Processing Charge (APC) was funded by the Institut de Recherche pour le Développement (IRD).

Data Availability Statement

The ERA5 wave reanalysis data used in this study are publicly available from the Copernicus Climate Data Store at https://cds.climate.copernicus.eu (accessed on 30 June 2024) under the ERA5 single-level and wave model datasets (doi:10.24381/cds.adbb2d47). The following climate indices were obtained from publicly accessible portals: the North Atlantic Oscillation (NAO) and Arctic Oscillation (AO) indices were obtained from NOAA’s Climate Prediction Center (CPC) (https://www.cpc.ncep.noaa.gov/products/precip/CWlink/pna/nao.shtml, accessed on 10 September 2024, and https://www.cpc.ncep.noaa.gov/products/precip/CWlink/daily_ao_index/ao.shtml, accessed on 10 September 2024, respectively); the annual ENSO variability was sourced from NOAA CPC’s ENSO Monitoring portal (https://www.cpc.ncep.noaa.gov/products/analysis_monitoring/ensostuff/ONI_v5.php, accessed on 10 September 2024); the Southern Annular Mode (SAM) index was obtained from the British Antarctic Survey (https://legacy.bas.ac.uk/met/gjma/sam.html, accessed on 10 September 2024); the Northern Annular Mode (NAM) index from the Climate Data Guide (https://climatedataguide.ucar.edu/climate-data/hurrell-wintertime-slp-based-northern-annular-mode-nam-index, accessed on 10 July 2024); the Pacific Decadal Oscillation (PDO) index from NOAA (https://www.ncdc.noaa.gov/teleconnections/pdo, accessed on 10 September 2024); the Atlantic Multidecadal Oscillation (AMO), Southern Oscillation Index (SOI), Tropical North Atlantic (TNA), and Tropical South Atlantic (TSA) indices were obtained from NOAA’s Physical Sciences Laboratory (PSL) (https://psl.noaa.gov/data/timeseries/AMO/, accessed on 10 September 2024, https://psl.noaa.gov/data/timeseries/month/SOI/, accessed on 10 September 2024, https://psl.noaa.gov/data/timeseries/month/DS/TNA/, accessed on 10 September 2024, and https://psl.noaa.gov/data/timeseries/month/DS/TSA/, accessed on 10 September 2024, respectively); and the Tropical Atlantic SST Index (TASI) was obtained from the State of the Ocean Climate portal (https://stateoftheocean.osmc.noaa.gov/sur/atl/tasi.php, accessed on 10 September 2024).

Acknowledgments

The authors acknowledge the project (CNPq-424753/2021-9); many thanks to the FACEPE (Project NOPE APQ-0235-1.08/23 and SarAlert APQ-0411-1.08/22). A.C.S. and F.H. were supported by the Laboratoire Mixte International TAPIOCA between Institut de Recherche pour le Développement (IRD) and the Federal University of Pernambuco (UFPE), and funded by the French program TOSCA-CNES SWOT-Brésil project agreement n.4500081707. Y.O.P. and G.D.G. thanks the Surfguru Internet Portal. A.L.M. is partially supported by the project “Development of the Community Earth System Model—MONAN” under contract No. 01340.005344/2021-50.

Conflicts of Interest

The authors declare no conflicts of interest.

Appendix A. Correlation Matrix of Wave Parameters and Climate Indices

Table A1. Correlation coefficients between wave parameters and the 11 climate indices are presented for the NA sector from 1980 to 2023.
NA SectorAMOENSONAMNAOPDOSAMAOSOITNATSATASI
SWH (m)−0.050.250.630.690.000.120.68−0.25−0.23−0.340.00
SHWW (m)−0.210.210.640.810.020.090.79−0.20−0.31−0.31−0.13
SHS (m)0.120.230.510.43−0.030.110.45−0.24−0.10−0.330.14
PP (s)0.080.150.350.16−0.070.150.20−0.170.00−0.340.25
MWP (s)0.160.180.370.19−0.040.180.21−0.200.02−0.310.26
MPWW (s)−0.170.210.630.790.020.110.77−0.19−0.27−0.32−0.08
MPS (s)0.130.180.410.24−0.040.190.26−0.190.00−0.330.25
MWD (°)−0.290.010.500.67−0.03−0.240.70−0.10−0.41−0.29−0.25
MDWW (°)−0.270.030.530.69−0.06−0.160.74−0.10−0.35−0.32−0.18
MDTS (°)−0.29−0.020.510.68−0.05−0.270.71−0.08−0.43−0.30−0.27
Table A2. Correlation coefficients between wave parameters and the 11 climate indices are presented for the SNA sector from 1980 to 2023.
SNA SectorAMOENSONAMNAOPDOSAMAOSOITNATSATASI
SWH (m)0.190.08−0.03−0.15−0.020.11−0.170.000.13−0.090.26
SHWW (m)0.16−0.14−0.36−0.25−0.14−0.03−0.350.270.260.240.18
SHS (m)0.200.120.09−0.07−0.010.15−0.09−0.070.07−0.200.26
PP (s)0.080.090.23−0.01−0.010.180.01−0.11−0.02−0.310.23
MWP (s)0.170.130.20−0.050.030.18−0.04−0.130.03−0.260.25
MPWW (s)0.17−0.20−0.42−0.25−0.17−0.03−0.390.310.290.260.18
MPS (s)0.200.080.14−0.07−0.020.19−0.09−0.070.08−0.210.27
MWD (°)0.080.17−0.16−0.310.090.01−0.22−0.05−0.040.030.00
MDWW (°)0.280.03−0.42−0.550.050.18−0.590.090.220.200.15
MDTS (°)0.070.16−0.13−0.210.06−0.02−0.13−0.05−0.090.05−0.06
Table A3. Correlation coefficients between wave parameters and the 11 climate indices are pre-sented for the TA sector from 1980 to 2023.
TA SectorAMOENSONAMNAOPDOSAMAOSOITNATSATASI
SWH (m)0.220.080.050.06−0.140.060.00−0.05−0.06−0.230.16
SHWW (m)0.130.120.160.48−0.16−0.070.35−0.01−0.22−0.13−0.10
SHS (m)0.190.050.02−0.09−0.090.08−0.11−0.070.00−0.240.21
PP (s)−0.060.220.01−0.280.080.14−0.13−0.27−0.01−0.330.25
MWP (s)0.120.110.01−0.250.030.16−0.18−0.150.05−0.180.22
MPWW (s)0.090.070.140.51−0.15−0.100.350.02−0.27−0.10−0.17
MPS (s)0.150.150.04−0.190.010.16−0.14−0.170.03−0.210.23
MWD (°)0.060.12−0.40−0.710.200.18−0.53−0.030.470.200.38
MDWW (°)0.130.08−0.30−0.610.180.28−0.48−0.090.590.090.54
MDTS (°)0.130.11−0.42−0.740.160.13−0.560.010.510.190.44
Table A4. Correlation coefficients between wave parameters and the 11 climate indices are pre-sented for the SSA sector from 1980 to 2023.
SSA SectorAMOENSONAMNAOPDOSAMAOSOITNATSATASI
SWH (m)0.230.130.170.02−0.090.010.07−0.13−0.03−0.110.09
SHWW (m)0.090.060.090.13−0.04−0.230.15−0.02−0.040.02−0.02
SHS (m)0.220.120.15−0.04−0.100.110.03−0.13−0.01−0.150.13
PP (s)0.040.130.14−0.04−0.130.150.07−0.18−0.10−0.250.09
MWP (s)0.180.100.15−0.05−0.110.160.02−0.15−0.02−0.170.13
MPWW (s)0.060.030.060.12−0.02−0.210.120.01−0.020.02−0.01
MPS (s)0.190.090.13−0.06−0.120.160.01−0.130.00−0.160.15
MWD (°)−0.170.260.170.010.28−0.190.04−0.40−0.22−0.06−0.22
MDWW (°)−0.180.370.230.100.40−0.130.07−0.52−0.24−0.16−0.16
MDTS (°)−0.190.230.14−0.010.26−0.210.04−0.37−0.21−0.05−0.20
Table A5. Correlation coefficients between wave parameters and the 11 climate indices are pre-sented for the SA sector from 1980 to 2023.
SA SectorAMOENSONAMNAOPDOSAMAOSOITNATSATASI
SWH (m)−0.23−0.180.00−0.07−0.100.310.110.08−0.06−0.12−0.03
SHWW (m)−0.070.020.050.06−0.050.490.110.000.03−0.200.08
SHS (m)−0.27−0.29−0.04−0.13−0.120.140.090.14−0.10−0.05−0.09
PP (s)−0.36−0.23−0.06−0.15−0.100.050.120.08−0.14−0.07−0.09
MWP (s)−0.31−0.21−0.06−0.18−0.030.050.080.04−0.14−0.06−0.09
MPWW (s)−0.10−0.040.040.06−0.080.470.080.050.02−0.180.05
MPS (s)−0.25−0.22−0.05−0.15−0.090.150.090.05−0.11−0.12−0.03
MWD (°)−0.200.010.020.06−0.010.280.04−0.050.040.010.05
MDWW (°)−0.070.010.060.11−0.020.590.030.020.16−0.070.21
MDTS (°)−0.210.030.050.05−0.010.210.04−0.10−0.04−0.05−0.01

References

  1. Sobey, R.J.; Orloff, L.S. Intensity-Duration-Frequency Summaries for Wave Climate. Coast. Eng. 1999, 36, 37–58. [Google Scholar] [CrossRef]
  2. Dahunsi, A.M.; Foli, B.A.K. Assessment of Past and Future Potential of Ocean Wave Power in the Gulf of Guinea. Int. J. Sustain. Eng. 2023, 16, 302–323. [Google Scholar] [CrossRef]
  3. Melet, A.; Meyssignac, B.; Almar, R.; Le Cozannet, G. Under-Estimated Wave Contribution to Coastal Sea-Level Rise. Nat. Clim. Change 2018, 8, 234–239. [Google Scholar] [CrossRef]
  4. Storlazzi, C.D.; Gingerich, S.B.; Van Dongeren, A.; Cheriton, O.M.; Swarzenski, P.W.; Quataert, E.; Voss, C.I.; Field, D.W.; Annamalai, H.; Piniak, G.A.; et al. Most Atolls Will Be Uninhabitable by the Mid-21st Century Because of Sea-Level Rise, Exacerbating Wave-Driven Flooding. Sci. Adv. 2018, 4, eaap9741. [Google Scholar] [CrossRef]
  5. Dobrynin, M.; Kleine, T.; Düsterhus, A.; Baehr, J. Skilful Seasonal Prediction of Ocean Surface Waves in the Atlantic Ocean. Geophys. Res. Lett. 2019, 46, 1731–1739. [Google Scholar] [CrossRef]
  6. Semedo, A.; Sušelj, K.; Rutgersson, A.; Sterl, A. A Global View on the Wind Sea and Swell Climate and Variability from ERA-40. J. Clim. 2011, 24, 1461–1479. [Google Scholar] [CrossRef]
  7. Wang, C. Atlantic Climate Variability and Its Associated Atmospheric Circulation Cells. J. Clim. 2002, 15, 1516–1536. [Google Scholar] [CrossRef]
  8. Woolf, D.K.; Challenor, P.G.; Cotton, P.D. Variability and Predictability of the North Atlantic Wave Climate. J. Geophys. Res. 2002, 107, 9-1–9-14. [Google Scholar] [CrossRef]
  9. Bromirski, P.D. Climate-Induced Decadal Ocean Wave Height Variability from Microseisms: 1931–2021. JGR Ocean. 2023, 128, e2023JC019722. [Google Scholar] [CrossRef]
  10. Morales-Márquez, V.; Orfila, A.; Simarro, G.; Marcos, M. Extreme Waves and Climatic Patterns of Variability in the Eastern North Atlantic and Mediterranean Basins. Ocean Sci. 2020, 16, 1385–1398. [Google Scholar] [CrossRef]
  11. Cerrone, D.; Fusco, G.; Cotroneo, Y.; Simmonds, I.; Budillon, G. The Antarctic Circumpolar Wave: Its Presence and Interdecadal Changes during the Last 142 Years. J. Clim. 2017, 30, 6371–6389. [Google Scholar] [CrossRef]
  12. Kim, Y.S.; Orsi, A.H. On the Variability of Antarctic Circumpolar Current Fronts Inferred from 1992–2011 Altimetry*. J. Phys. Oceanogr. 2014, 44, 3054–3071. [Google Scholar] [CrossRef]
  13. Semedo, A. Seasonal Variability of Wind Sea and Swell Waves Climate along the Canary Current: The Local Wind Effect. JMSE 2018, 6, 28. [Google Scholar] [CrossRef]
  14. Xie, S.-P.; Carton, J.A. Tropical Atlantic Variability: Patterns, Mechanisms, and Impacts. In Geophysical Monograph Series; Wang, C., Xie, S.P., Carton, J.A., Eds.; American Geophysical Union: Washington, DC, USA, 2013; pp. 121–142. ISBN 978-1-118-66594-7. [Google Scholar]
  15. Karbi, I.; Chemke, R. A Shift towards Broader and Less Persistent Southern Hemisphere Temperature Anomalies. NPJ Clim. Atmos. Sci. 2023, 6, 200. [Google Scholar] [CrossRef]
  16. Reguero, B.G.; Losada, I.J.; Méndez, F.J. A Recent Increase in Global Wave Power as a Consequence of Oceanic Warming. Nat. Commun. 2019, 10, 205. [Google Scholar] [CrossRef] [PubMed]
  17. Young, I.R.; Babanin, A.V.; Zieger, S. Response to Comment on “Global Trends in Wind Speed and Wave Height”. Science 2011, 334, 905. [Google Scholar] [CrossRef]
  18. Erikson, L.; Morim, J.; Hemer, M.; Young, I.; Wang, X.L.; Mentaschi, L.; Mori, N.; Semedo, A.; Stopa, J.; Grigorieva, V.; et al. Global Ocean Wave Fields Show Consistent Regional Trends between 1980 and 2014 in a Multi-Product Ensemble. Commun. Earth Env. 2022, 3, 320. [Google Scholar] [CrossRef]
  19. Timmermans, B.W.; Gommenginger, C.P.; Dodet, G.; Bidlot, J.-R. Global Wave Height Trends and Variability from New Multimission Satellite Altimeter Products, Reanalyses, and Wave Buoys. Geophys. Res. Lett. 2020, 47, e2019GL086880. [Google Scholar] [CrossRef]
  20. Deser, C.; Alexander, M.A.; Xie, S.-P.; Phillips, A.S. Sea Surface Temperature Variability: Patterns and Mechanisms. Annu. Rev. Mar. Sci. 2010, 2, 115–143. [Google Scholar] [CrossRef]
  21. Hurrell, J.W.; Kushnir, Y.; Ottersen, G.; Visbeck, M. An Overview of the North Atlantic Oscillation. In Geophysical Monograph Series; Hurrell, J.W., Kushnir, Y., Ottersen, G., Visbeck, M., Eds.; American Geophysical Union: Washington, DC, USA, 2003; Volume 134, pp. 1–35. ISBN 978-0-87590-994-3. [Google Scholar]
  22. Zhang, R.; Delworth, T.L. Impact of Atlantic Multidecadal Oscillations on India/Sahel Rainfall and Atlantic Hurricanes. Geophys. Res. Lett. 2006, 33, 2006GL026267. [Google Scholar] [CrossRef]
  23. Maia, N.Z.; Almeida, L.P.; Nicolodi, J.L.; Calliari, L.; Castelle, B. Long-Term Trends and Wave Climate Variability in the South Atlantic Ocean: The Influence of Climate Indices. Reg. Stud. Mar. Sci. 2023, 66, 103131. [Google Scholar] [CrossRef]
  24. Young, I.R.; Fontaine, E.; Liu, Q.; Babanin, A.V. The Wave Climate of the Southern Ocean. J. Phys. Oceanogr. 2020, 50, 1417–1433. [Google Scholar] [CrossRef]
  25. Hersbach, H.; Bell, B.; Berrisford, P.; Hirahara, S.; Horányi, A.; Muñoz-Sabater, J.; Nicolas, J.; Peubey, C.; Radu, R.; Schepers, D.; et al. The ERA5 Global Reanalysis. Q. J. R. Meteorol. Soc. 2020, 146, 1999–2049. [Google Scholar] [CrossRef]
  26. Young, I.R.; Verhagen, L.A. The growth of fetch limited waves in water of finite depth. Part 1. Total energy and peak frequency. Coast. Eng. 1996, 29, 47–78. [Google Scholar] [CrossRef]
  27. Komen, G.J.; Cavaleri, L.; Donelan, M.; Hasselmann, K.; Hasselmann, S.; Janssen, P.A.E.M. Dynamics and Modelling of Ocean Waves; Cambridge University Press: Cambridge, UK, 1994; p. 532. ISBN 9780521577816. [Google Scholar]
  28. Bruno, M.F.; Molfetta, M.G.; Totaro, V.; Mossa, M. Performance Assessment of ERA5 Wave Data in a Swell Dominated Region. JMSE 2020, 8, 214. [Google Scholar] [CrossRef]
  29. Bessonova, V.; Tapoglou, E.; Dorrel, R.; Dethlefs, N.; York, K. Global evaluation of wave data reanalysis: Comparison of the ERA5 dataset to buoy observations. Appl. Ocean Res. 2025, 157, 104490. [Google Scholar] [CrossRef]
  30. Bromirski, P.D.; Cayan, D.R. Wave Power Variability and Trends across the N Orth A Tlantic Influenced by Decadal Climate Patterns. JGR Ocean. 2015, 120, 3419–3443. [Google Scholar] [CrossRef]
  31. Knight, J.R.; Folland, C.K.; Scaife, A.A. Climate Impacts of the Atlantic Multidecadal Oscillation. Geophys. Res. Lett. 2006, 33, 2006GL026242. [Google Scholar] [CrossRef]
  32. Boer, G.J.; Sospedra-Alfonso, R. Assessing the Skill of the Pacific Decadal Oscillation (PDO) in a Decadal Prediction Experiment. Clim. Dyn. 2019, 53, 5763–5775. [Google Scholar] [CrossRef]
  33. Hemer, M.A.; Katzfey, J.; Trenham, C.E. Global Dynamical Projections of Surface Ocean Wave Climate for a Future High Greenhouse Gas Emission Scenario. Ocean Model. 2013, 70, 221–245. [Google Scholar] [CrossRef]
  34. Garreaud, R.D.; Vuille, M.; Compagnucci, R.; Marengo, J. Present-Day South American Climate. Palaeogeogr. Palaeoclimatol. Palaeoecol. 2009, 281, 180–195. [Google Scholar] [CrossRef]
  35. Yu, B.; Lin, H. Tropical Atmospheric Forcing of the Wintertime North Atlantic Oscillation. J. Clim. 2016, 29, 1755–1772. [Google Scholar] [CrossRef]
  36. Mendes, D.; Souza, E.P.; Marengo, J.A.; Mendes, M.C.D. Climatology of Extratropical Cyclones over the South American–Southern Oceans Sector. Theor. Appl. Clim. 2010, 100, 239–250. [Google Scholar] [CrossRef]
  37. Zhang, L.; Yang, X.; Zhao, J. Impact of the Spring North Atlantic Oscillation on the Northern Hemisphere Tropical Cyclone Genesis Frequency. Front. Earth Sci. 2022, 10, 829791. [Google Scholar] [CrossRef]
  38. Hurrell, J.W.; Deser, C. North Atlantic Climate Variability: The Role of the North Atlantic Oscillation. J. Mar. Syst. 2009, 78, 28–41. [Google Scholar] [CrossRef]
  39. Trenberth, K.E.; Caron, J.M. Estimates of Meridional Atmosphere and Ocean Heat Transports. J. Clim. 2001, 14, 3433–3443. [Google Scholar] [CrossRef]
  40. Colosi, L.V.; Villas Bôas, A.B.; Gille, S.T. The Seasonal Cycle of Significant Wave Height in the Ocean: Local Versus Remote Forcing. JGR Ocean. 2021, 126, e2021JC017198. [Google Scholar] [CrossRef]
  41. Stopa, J.E.; Ardhuin, F.; Girard-Ardhuin, F. Wave Climate in the Arctic 1992–2014: Seasonality and Trends. Cryosphere 2016, 10, 1605–1629. [Google Scholar] [CrossRef]
  42. Shi, J.; Feng, X.; Toumi, R.; Zhang, C.; Hodges, K.I.; Tao, A.; Zhang, W.; Zheng, J. Global Increase in Tropical Cyclone Ocean Surface Waves. Nat. Commun. 2024, 15, 174. [Google Scholar] [CrossRef]
  43. Wang, C.; Dong, S.; Evan, A.T.; Foltz, G.R.; Lee, S.-K. Multidecadal Covariability of North Atlantic Sea Surface Temperature, African Dust, Sahel Rainfall, and Atlantic Hurricanes. J. Clim. 2012, 25, 5404–5415. [Google Scholar] [CrossRef]
  44. Pianca, C.; Mazzini, P.L.F.; Siegle, E. Brazilian Offshore Wave Climate Based on NWW3 Reanalysis. Braz. J. Oceanogr. 2010, 58, 53–70. [Google Scholar] [CrossRef]
  45. Silva, A.P.; Klein, A.H.F.; Fetter-Filho, A.F.H.; Hein, C.J.; Méndez, F.J.; Broggio, M.F.; Dalinghaus, C. Climate-Induced Variability in South Atlantic Wave Direction over the Past Three Millennia. Sci. Rep. 2020, 10, 18553. [Google Scholar] [CrossRef]
  46. Maia, N.Z.; Almeida, L.P.; Emmendorfer, L.; Nicolodi, J.L.; Calliari, L. Wave Climate Trends and Breakpoints during the Atlantic Multidecadal Oscillation (AMO) in Southern Brazil. Ocean Coast. Res. 2022, 70, e22027. [Google Scholar] [CrossRef]
  47. Young, I.R.; Ribal, A. Multiplatform Evaluation of Global Trends in Wind Speed and Wave Height. Science 2019, 364, 548–552. [Google Scholar] [CrossRef]
  48. Campos, R.M.; Gramcianinov, C.B.; De Camargo, R.; Da Silva Dias, P.L. Assessment and Calibration of ERA5 Severe Winds in the Atlantic Ocean Using Satellite Data. Remote Sens. 2022, 14, 4918. [Google Scholar] [CrossRef]
  49. Omonigbehin, O.; Eresanya, E.O.; Tao, A.; Setordjie, V.E.; Daramola, S.; Adebiyi, A. Long-Term Evolution of Significant Wave Height in the Eastern Tropical Atlantic between 1940 and 2022 Using the ERA5 Dataset. JMSE 2024, 12, 714. [Google Scholar] [CrossRef]
  50. Sainsbury, E.M.; Schiemann, R.K.H.; Hodges, K.I.; Baker, A.J.; Shaffrey, L.C.; Bhatia, K.T. What Governs the Interannual Variability of Recurving North Atlantic Tropical Cyclones? J. Clim. 2022, 35, 3627–3641. [Google Scholar] [CrossRef]
  51. Patra, A.; Min, S.; Seong, M. Climate Variability Impacts on Global Extreme Wave Heights: Seasonal Assessment Using Satellite Data and ERA5 Reanalysis. JGR Ocean. 2020, 125, e2020JC016754. [Google Scholar] [CrossRef]
  52. Sreelakshmi, S.; Bhaskaran, P.K. Wind-Generated Wave Climate Variability in the Indian Ocean Using ERA-5 Dataset. Ocean Eng. 2020, 209, 107486. [Google Scholar] [CrossRef]
  53. Ding, R.; Nnamchi, H.C.; Yu, J.-Y.; Li, T.; Sun, C.; Li, J.; Tseng, Y.; Li, X.; Xie, F.; Feng, J.; et al. North Atlantic Oscillation Controls Multidecadal Changes in the North Tropical Atlantic−Pacific Connection. Nat. Commun. 2023, 14, 862. [Google Scholar] [CrossRef]
  54. Dai, P.; Tan, B. The Nature of the Arctic Oscillation and Diversity of the Extreme Surface Weather Anomalies It Generates. J. Clim. 2017, 30, 5563–5584. [Google Scholar] [CrossRef]
  55. Geng, X.; Zhao, J.; Kug, J.-S. ENSO-Driven Abrupt Phase Shift in North Atlantic Oscillation in Early January. NPJ Clim. Atmos. Sci. 2023, 6, 80. [Google Scholar] [CrossRef]
  56. King, J.; Anchukaitis, K.J.; Allen, K.; Vance, T.; Hessl, A. Trends and Variability in the Southern Annular Mode over the Common Era. Nat. Commun. 2023, 14, 2324. [Google Scholar] [CrossRef]
  57. Black, R.X.; McDaniel, B.A. Diagnostic Case Studies of the Northern Annular Mode. J. Clim. 2004, 17, 3990–4004. [Google Scholar] [CrossRef]
  58. Zheng, F.; Liu, X.; Chen, J.; Huang, W.; Sun, C.; Wang, H. Physical Mechanism of Winter Temperature Multidecadal Variations in Arid Central Asia: The Role of the Atlantic Multidecadal Oscillation (AMO). J. Clim. 2023, 36, 7363–7377. [Google Scholar] [CrossRef]
  59. Kawamura, A.; McKerchar, A.I.; Spigel, R.H.; Jinno, K. Chaotic Characteristics of the Southern Oscillation Index Time Series. J. Hydrol. 1998, 204, 168–181. [Google Scholar] [CrossRef]
  60. Gbangou, T.; Ludwig, F.; Van Slobbe, E.; Greuell, W.; Kranjac-Berisavljevic, G. Rainfall and Dry Spell Occurrence in Ghana: Trends and Seasonal Predictions with a Dynamical and a Statistical Model. Theor. Appl. Clim. 2020, 141, 371–387. [Google Scholar] [CrossRef]
  61. Chen, S.-F.; Wu, R. An Enhanced Influence of Sea Surface Temperature in the Tropical Northern Atlantic on the Following Winter ENSO since the Early 1980s. Atmos. Ocean. Sci. Lett. 2017, 10, 175–182. [Google Scholar] [CrossRef]
  62. Chang, P.; Ji, L.; Li, H. A decadal variation in the tropical Atlantic Ocean from thermodynamic air-sea interactions. Nature 1997, 385, 516–518. [Google Scholar] [CrossRef]
  63. Caloiero, T.; Aristodemo, F.; Algieri Ferraro, D. Trend Analysis of Significant Wave Height and Energy Period in Southern Italy. Theor. Appl. Clim. 2019, 138, 917–930. [Google Scholar] [CrossRef]
  64. Mann, H.B. Nonparametric Tests Against Trend. Econometrica 1945, 13, 245. [Google Scholar] [CrossRef]
  65. Nguyen, H.M.; Ouillon, S.; Vu, V.D. Sea Level Variation and Trend Analysis by Comparing Mann–Kendall Test and Innovative Trend Analysis in Front of the Red River Delta, Vietnam (1961–2020). Water 2022, 14, 1709. [Google Scholar] [CrossRef]
  66. Kendall, M.G. Rank Correlation Methods, 2nd ed.; Charles Griffin & Co.: London, UK, 1955; p. 196. [Google Scholar]
  67. Holthuijsen, L.H. Waves in Oceanic and Coastal Waters; Cambridge University Press: Cambridge, UK, 2007; p. 404. ISBN 9780511618536. [Google Scholar]
  68. Young, I.R. Seasonal Variability of the Global Ocean Wind and Wave Climate. Int. J. Climatol. 1999, 19, 931–950. [Google Scholar] [CrossRef]
  69. Ardhuin, F.; Chapron, B.; Collard, F. Observation of Swell Dissipation across Oceans. Geophys. Res. Lett. 2009, 36, 2008GL037030. [Google Scholar] [CrossRef]
  70. George, S.E.; Saunders, M.A. North Atlantic Oscillation Impact on Tropical North Atlantic Winter Atmospheric Variability. Geophys. Res. Lett. 2001, 28, 1015–1018. [Google Scholar] [CrossRef]
  71. Foltz, G.R.; McPhaden, M.J.; Lumpkin, R. A Strong Atlantic Meridional Mode Event in 2009: The Role of Mixed Layer Dynamics. J. Clim. 2012, 25, 363–380. [Google Scholar] [CrossRef]
  72. Wang, X.L.; Zwiers, F.W.; Swail, V.R. North Atlantic Ocean Wave Climate Change Scenarios for the Twenty-First Century. J. Clim. 2004, 17, 2368–2383. [Google Scholar] [CrossRef]
  73. Bell, R.; Kirtman, B. Seasonal Forecasting of Wind and Waves in the North Atlantic Using a Grand Multimodel Ensemble. Weather Forescasting 2019, 34, 31–59. [Google Scholar] [CrossRef]
  74. Castelle, B.; Dodet, G.; Masselink, G.; Scott, T. A New Climate Index Controlling Winter Wave Activity along the Atlantic Coast of Europe: The West Europe Pressure Anomaly. Geophys. Res. Lett. 2017, 44, 1384–1392. [Google Scholar] [CrossRef]
  75. Goharnejad, H.; Perrie, W.; Toulany, B.; Casey, M.; Zhang, M. Impacts of Climate Change on Seasonal Extreme Waves in the Northwest Atlantic Using a Spatial Neural Gas Clustering Method. J. Ocean Eng. Sci. 2023, 8, 367–385. [Google Scholar] [CrossRef]
  76. Jones, P.D.; Jonsson, T.; Wheeler, D. Extension to the North Atlantic Oscillation Using Early Instrumental Pressure Observations from Gibraltar and South-West Iceland. Int. J. Climatol. 1997, 17, 1433–1450. [Google Scholar] [CrossRef]
  77. Vinogradov, S.V.; Ponte, R.M. Low-frequency Variability in Coastal Sea Level from Tide Gauges and Altimetry. J. Geophys. Res. 2011, 116, 2011JC007034. [Google Scholar] [CrossRef]
  78. Röthlisberger, M.; Papritz, L. Quantifying the Physical Processes Leading to Atmospheric Hot Extremes at a Global Scale. Nat. Geosci. 2023, 16, 210–216. [Google Scholar] [CrossRef]
  79. Woollings, T.; Drouard, M.; O’Reilly, C.H.; Sexton, D.M.H.; McSweeney, C. Trends in the Atmospheric Jet Streams Are Emerging in Observations and Could Be Linked to Tropical Warming. Commun. Earth Env. 2023, 4, 125. [Google Scholar] [CrossRef]
  80. Reguero, B.G.; Méndez, F.J.; Losada, I.J. Variability of Multivariate Wave Climate in Latin America and the Caribbean. Glob. Planet. Change 2013, 100, 70–84. [Google Scholar] [CrossRef]
  81. Rocha, R.P.; Sugara, S.; Silveira, R.B. Sea Waves Generated by Extratropical Cyclones in the South Atlantic Ocean: Hindcast and Validation against Altimeter Data. Weather Forescasting 2004, 19, 398–410. [Google Scholar] [CrossRef]
  82. Reguero, B.G.; Losada, I.J.; Méndez, F.J. A Global Wave Power Resource and Its Seasonal, Interannual and Long-Term Variability. Appl. Energy 2015, 148, 366–380. [Google Scholar] [CrossRef]
  83. Cabral, I.S.; Young, I.R.; Toffoli, A. Long-Term and Seasonal Variability of Wind and Wave Extremes in the Arctic Ocean. Front. Mar. Sci. 2022, 9, 802022. [Google Scholar] [CrossRef]
  84. Laloue, A.; Ghantous, M.; Faugère, Y.; Dalphinet, A.; Aouf, L. Statistical Analysis of Global Ocean Significant Wave Heights from Satellite Altimetry over the Past 2 Decades. State Planet 2024, 4-osr8, 1–9. [Google Scholar] [CrossRef]
  85. Takbash, A.; Young, I. Long-Term and Seasonal Trends in Global Wave Height Extremes Derived from ERA-5 Reanalysis Data. JMSE 2020, 8, 1015. [Google Scholar] [CrossRef]
  86. Bader, J.; Latif, M. The Impact of Decadal-scale Indian Ocean Sea Surface Temperature Anomalies on Sahelian Rainfall and the North Atlantic Oscillation. Geophys. Res. Lett. 2003, 30, 2003GL018426. [Google Scholar] [CrossRef]
  87. Czaja, A.; Frankignoul, C. Observed Impact of Atlantic SST Anomalies on the North Atlantic Oscillation. J. Clim. 2002, 15, 606–623. [Google Scholar] [CrossRef]
  88. Delworth, T.L.; Mann, M.E. Observed and Simulated Multidecadal Variability in the Northern Hemisphere. Clim. Dyn. 2000, 16, 661–676. [Google Scholar] [CrossRef]
  89. Seager, R.; Harnik, N.; Kushnir, Y.; Robinson, W.; Miller, J. Mechanisms of Hemispherically Symmetric Climate Variability*. J. Clim. 2003, 16, 2960–2978. [Google Scholar] [CrossRef]
  90. Ruggerio, P.; Kratzmann, M.G.; Himmelstoss, E.A.; Reid, D.; Allan, J.; Kaminsky, G. National Assessment of Shoreline Change: Historical Shoreline Change Along the Pacific Northwest Coast; Open-File Report: Reston, VA, USA, 2013; p. 76. [CrossRef]
  91. Aarnes, O.J.; Abdalla, S.; Bidlot, J.-R.; Breivik, Ø. Marine Wind and Wave Height Trends at Different ERA-Interim Forecast Ranges. J. Clim. 2015, 28, 819–837. [Google Scholar] [CrossRef]
  92. Young, I.R.; Sanina, E.; Babanin, A.V. Calibration and Cross Validation of a Global Wind and Wave Database of Altimeter, Radiometer, and Scatterometer Measurements. J. Atmos. Ocean. Technol. 2017, 34, 1285–1306. [Google Scholar] [CrossRef]
  93. Hemer, M.A.; Church, J.A.; Hunter, J.R. Variability and Trends in the Directional Wave Climate of the Southern Hemisphere. Int. J. Climatol. 2010, 30, 475–491. [Google Scholar] [CrossRef]
  94. Jiang, H.; Mu, L. Wave Climate from Spectra and Its Connections with Local and Remote Wind Climate. J. Phys. Oceanogr. 2019, 49, 543–559. [Google Scholar] [CrossRef]
  95. Reis, B.L.R.; Parise, C.K.; Correia, G.S.; De Lima, L.G.; Perotto, H.; Bose, N.D.A.; De Mendonça, L.F.F. The Bimodal Regime of Ocean Waves and Winds over the Continental Shelf of Maranhão. Reg. Stud. Mar. Sci. 2024, 77, 103629. [Google Scholar] [CrossRef]
  96. Gulev, S.K.; Grigorieva, V. Variability of the Winter Wind Waves and Swell in the North Atlantic and North Pacific as Revealed by the Voluntary Observing Ship Data. J. Clim. 2006, 19, 5667–5685. [Google Scholar] [CrossRef]
  97. Manola, I.; Haarsma, R.J.; Hazeleger, W. Drivers of North Atlantic Oscillation Events. Tellus A Dyn. Meteorol. Oceanogr. 2013, 65, 19741. [Google Scholar] [CrossRef]
  98. Mehta, V.M.; Suarez, M.J.; Manganello, J.V.; Delworth, T.L. Oceanic Influence on the North Atlantic Oscillation and Associated Northern Hemisphere Climate Variations: 1959–1993. Geophys. Res. Lett. 2000, 27, 121–124. [Google Scholar] [CrossRef]
  99. Hoerling, M.P.; Hurrell, J.W.; Xu, T. Tropical Origins for Recent North Atlantic Climate Change. Science 2001, 292, 90–92. [Google Scholar] [CrossRef]
  100. Zhao, Y.; Capotondi, A. The Role of the Tropical Atlantic in Tropical Pacific Climate Variability. NPJ Clim. Atmos. Sci. 2024, 7, 140. [Google Scholar] [CrossRef]
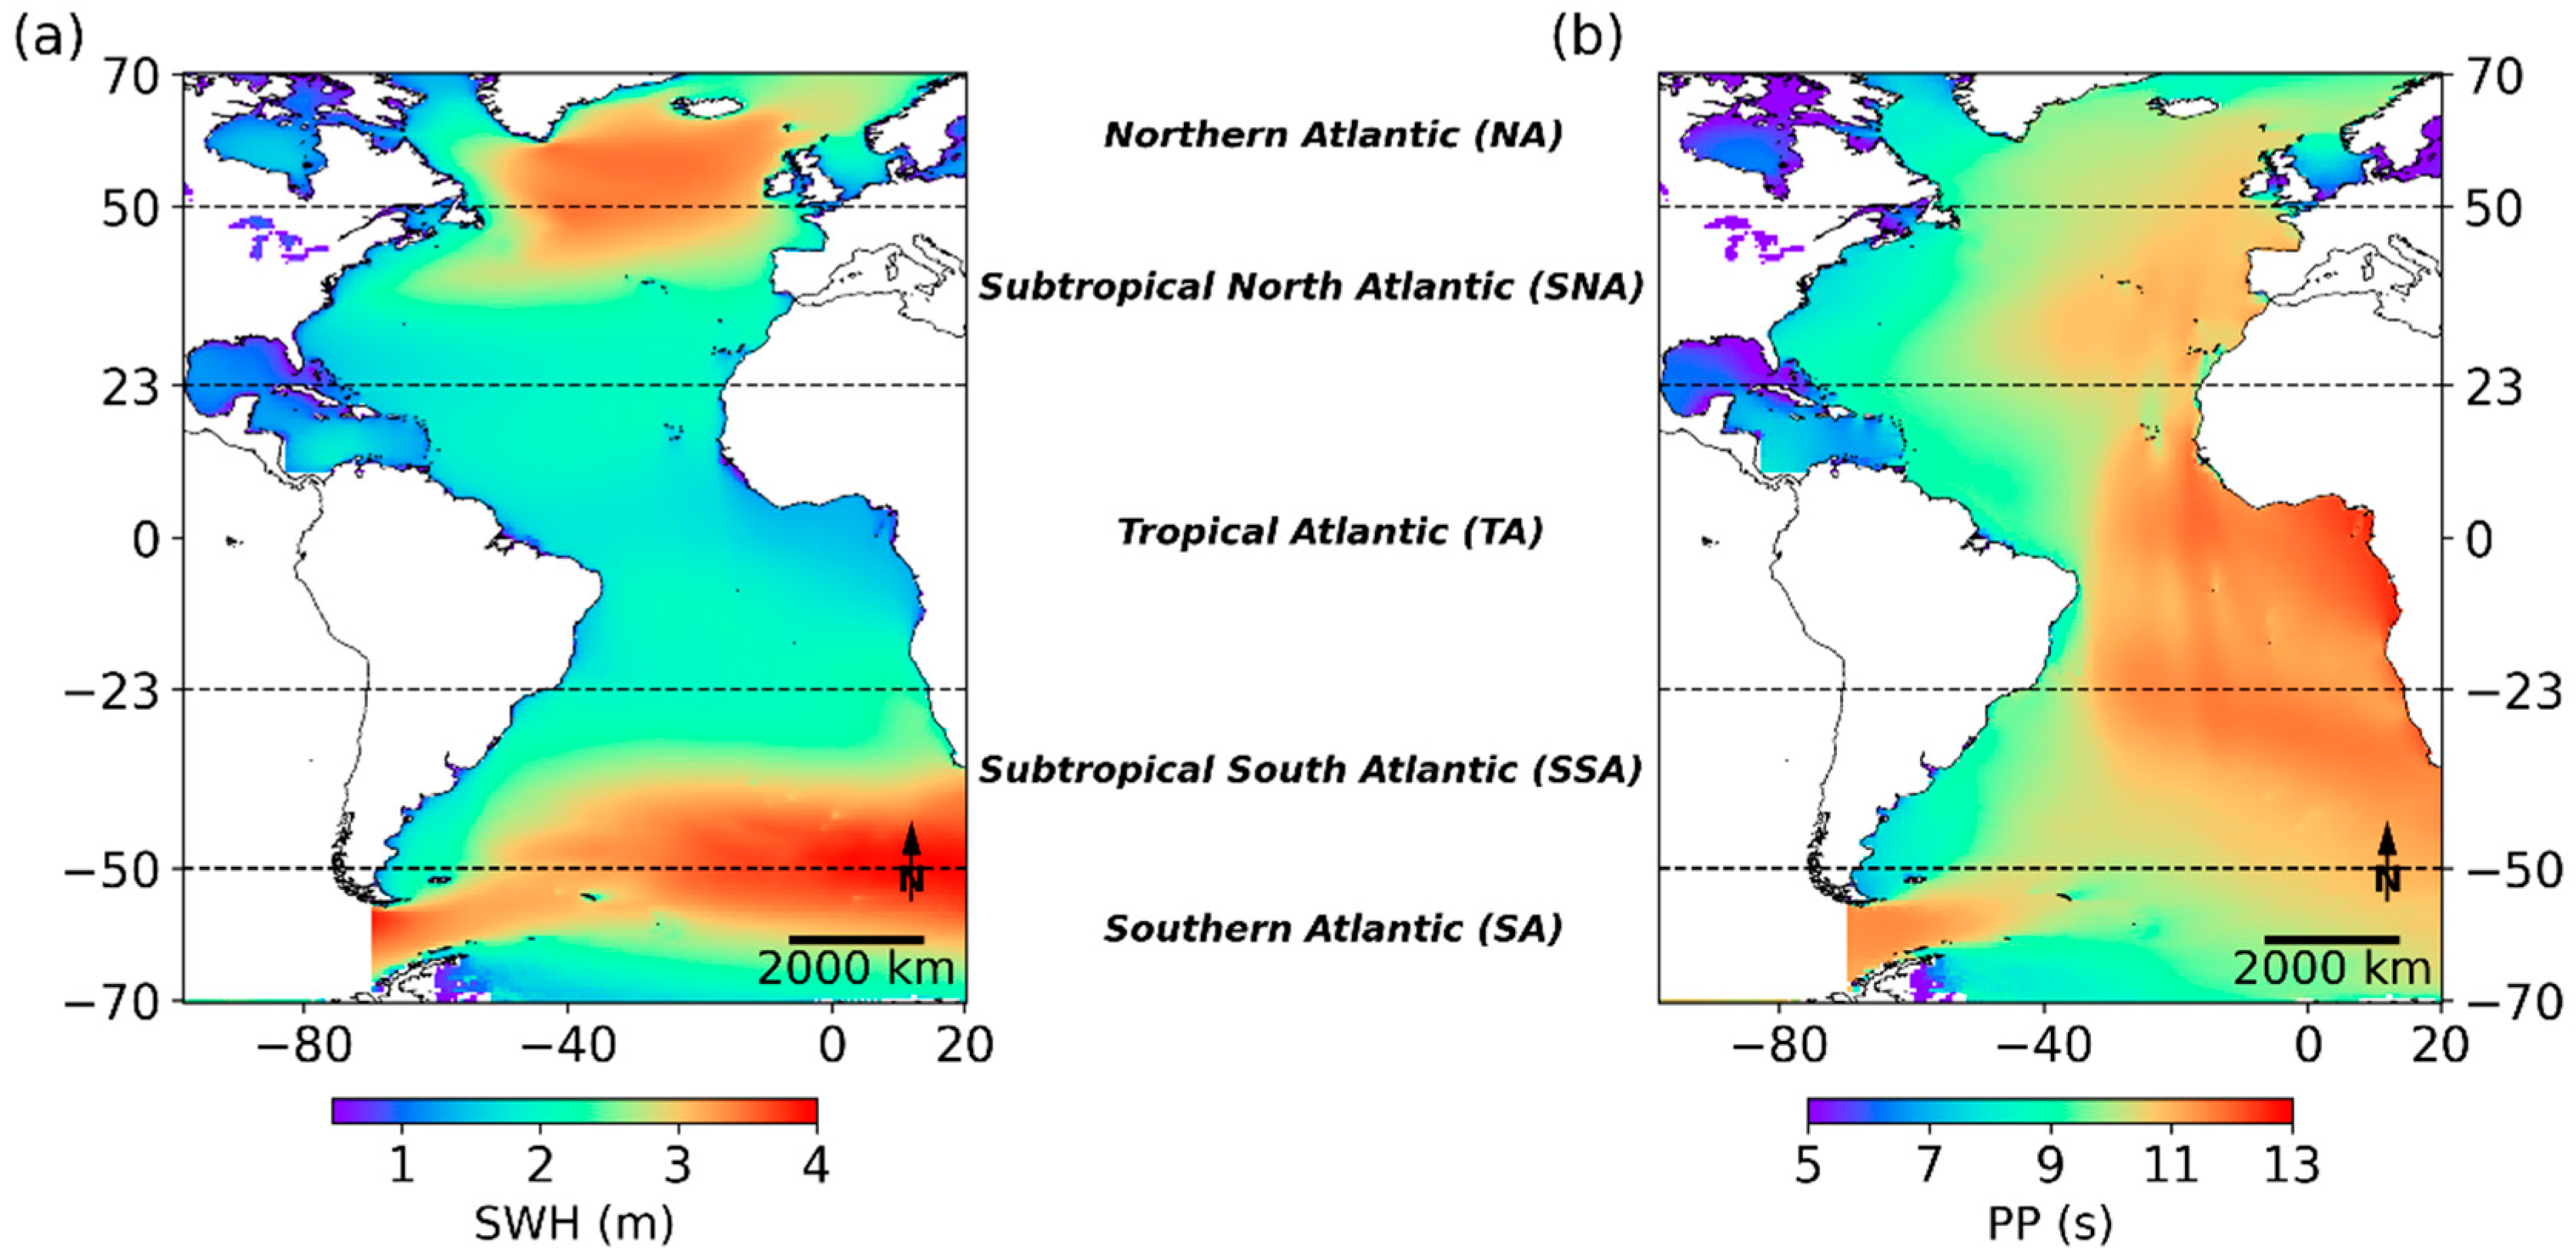
Figure 1. Map of the study area. (a) Climatology of significant wave height; (b) climatology of peak wave period.
Jmse 13 01536 g001
Figure 2. Monthly climatology for SWH and PP. (a) Significant wave height; (b) peak period.
Jmse 13 01536 g002
Figure 3. (a,b) Annual climatology of SWH and PP (solid lines) and their respective trend curves (dashed lines) for the five Atlantic sectors. (c,d) Interannual anomalies of SWH and PP for the five sectors of the Atlantic Ocean.
Jmse 13 01536 g003
Figure 4. Correlation of wave parameters with climate indices. (a) Significant wind-wave height in the NA sector vs. NAO; (b) mean wind-wave direction in the SNA sector vs. AO; (c) mean total swell direction in the TA sector vs. NAO; (d) mean wind-wave direction in the SSA sector vs. SOI; and (e) mean wind-wave direction in the SA sector vs. SAM. All indices are represented by the solid black line. The dashed gray line indicates the zero-reference level for both y-axes.
Jmse 13 01536 g004
Figure 5. Histograms and distribution curves: (a,c,e,g,i) Gumbel distributions for SWH; (b,d,f,h,j) normal distributions for PP in the five Atlantic sectors.
Jmse 13 01536 g005
Figure 6. Schematic representation of the trimodal wave regime in the Tropical Atlantic Ocean. (a) Northern Hemisphere winter; (b) Northern Hemisphere summer. Black arrows indicate swells originating from the Northern and Southern Hemispheres, as well as the local wind-sea regime near the equator.
Jmse 13 01536 g006
Figure 7. Composite anomaly maps of MDTS and MDWW during positive/negative phases of NAO, AO, TNA, and NAM in the TA sector: (a,c,e,g) positive phases; (b,d,f,h) negative phases.
Jmse 13 01536 g007
Table 1. Climatological means (1980–2023) for SWH, MWH, SWHWW, SWHS, PP, MWP, MPWW, MPS, MWD, MDWW, and MDTS for the Atlantic Ocean sectors: NA, SNA, TA, SSA, and SA.
NASNATASSASA
Significant Wave Height (m)2.342.161.772.762.80
Significant Wave Height of Wind Waves (m)1.300.960.651.261.46
Significant Wave Height of Swell (m)1.681.761.582.232.13
Peak Period (s)8.569.4610.3010.579.89
Mean Wave Period (s)7.227.838.078.778.33
Mean Period of Wind Waves (s)4.383.903.464.374.65
Mean Period of Swell (°)8.058.578.759.649.31
Mean Wave Direction (°)194.25191.29125.06213.86231.15
Mean Direction of Wind Waves (°)180.25161.84107.49201.74210.15
Mean Direction of Total Swell (°)192.36195.62130.09209.40232.61
Disclaimer/Publisher’s Note: The statements, opinions and data contained in all publications are solely those of the individual author(s) and contributor(s) and not of MDPI and/or the editor(s). MDPI and/or the editor(s) disclaim responsibility for any injury to people or property resulting from any ideas, methods, instructions or products referred to in the content.