Abstract
This study uses remote sensing data to assess susceptibility to hazards, which are then validated to model impact scenarios for land subsidence and coastal flooding in the Integrated Coastal Zone Management (ICZM) of Selangor, Malaysia, to support decision-making in urban planning and land management. Land subsidence and coastal floods affect a major proportion of the population in the ICZM, with subsidence being significant contributing factors, but information on the extent of susceptible areas, monitoring, and wide-area coverage is limited. Land subsidence distribution is demarcated using Interferometric Synthetic Aperture Radar (InSAR) time-series data (2015–2022), and integrated with coastal flood susceptibility derived from Analytic Hierarchy Process (AHP)-based weights to model impacts on land cover. Results indicate maximum subsidence rates of 46 mm/year (descending orbit) and 61 mm/year (ascending orbit); reflecting a gradual increase in subsidence trends with an average rate of 13 mm/year. In the worst-case scenario, within the ICZM area of 2262 km2, nearly 12% of the total built-up land cover with the highest population density is exposed to land subsidence, while exposure to coastal floods is relatively larger, covering nearly 34% of the built-up area. Almost 27% of the built-up area is exposed to the combined effects of both land subsidence and coastal floods, under present sea level conditions, with increasing risks of coastal floods over 2040, 2050 and 2100, due to both combinations. This research prioritizes areas for further study and provides a scientific foundation for resilience strategies aimed at ensuring sustainable coastal development within the ICZM.
1. Introduction
Vertical land motion (VLM) refers to the movement of land in either an upward or downward direction, driven by natural causes, human influence, or a combination of both. It is typically associated with glacial isostatic adjustment (GIA) rebound, regional tectonics, local conditions, and human actions [1,2,3]. Groundwater extraction, for example, has contributed to significant subsidence in both coastal and inland cities such as Jakarta, Dhaka, Bangkok, Venice, Miami, Peking, Mexico City, and Tehran.
The Intergovernmental Panel on Climate Change (IPCC) projects global sea level rise between 0.28 m and 0.98 m by the end of the 21st century, intensifying the threat to coastal regions worldwide [4]. Sea level in the coasts of Southeast Asia, with its dense population and concentrated economic activities, is projected to rise by approximately 0.3 m to 1 m by 2100 under different emission scenarios [5]. When combined with land subsidence, relative sea level rise can exacerbate coastal flooding, erosion, and groundwater salinization.
Conventional land subsidence monitoring methods include extensometers, Global Positioning System (GPS) and Global Navigation Satellite System (GNSS) networks, high-precision geometric leveling, well logs, and water-level observation wells. While these techniques provide valuable data, they tend to be labor-intensive, costly, and limited in spatial coverage. Moreover, they often generate data gaps and require extensive in situ measurements for accuracy. These challenges have motivated the adoption of geospatial remote sensing technologies such as Interferometric Synthetic Aperture Radar (InSAR), which offers wide-area coverage and has demonstrated strong agreement with conventional leveling data [6,7,8,9]. However, limitations associated with InSAR such as spatial decorrelation, tropospheric delays, and errors in Digital Elevation Models (DEMs), can compromise data accuracy. Time-series analysis methods, including SBAS-InSAR, have been developed to enhance data quality by reducing errors across multiple SAR images [10,11]. The SBAS method is particularly effective for subsidence mapping in less urbanized areas, making it ideal for suburban and rural settings like Selangor [12].
Despite the advances offered by InSAR and its variants such as SBAS-InSAR and Multidimensional SBAS-InSAR (MSBAS-InSAR), significant knowledge gaps remain. One critical gap is the limited accuracy of subsidence measurements in regions with complex topography, where terrain-induced decorrelation hinders precise monitoring [13]. The MSBAS-InSAR, which estimates both vertical and horizontal deformation, shows promise but remains challenged by its dependence on multiple SAR datasets and spatial coherence constraints. Additionally, integrating InSAR data with other geodetic sources such as Global Positioning System (GPS) can improve spatial resolution; however, fusion across satellite orbits and varying incidence angles still requires refinement to ensure robust three-dimensional deformation models [14,15].
Another pressing gap is the lack of long-term continuous monitoring, especially in areas where subsidence is driven by slow processes including groundwater extraction, mining, and urbanization. While short-term analyses provide initial insights, sustained multi-year datasets are essential to characterize trends and understand the interplay between natural and anthropogenic factors [16,17]. Complex interactions, such as those between seismic activity and human construction, further complicate subsidence dynamics and call for advanced multidimensional monitoring approaches [18].
Detailed investigations into external drivers such as groundwater depletion and earthquakes are urgently needed [19,20]. Case studies in the Bohai Bay region highlight challenges in long-term monitoring, where human activities exacerbate natural subsidence processes [21]. Similar challenges are discernible in other coastal regions such as Dhaka, Jakarta, and Bangkok. For effective prediction of subsidence impacts, integrating remote sensing with in situ measurements is essential. Multi-source data fusion, including Persistent Scatterer Interferometry (PSI), Light Detection and Ranging (LiDAR), and gravity surveys, can provide comprehensive ground deformation assessments, particularly in geologically complex and urbanized areas [22,23]. On the management side, the integration of these data with robust management strategies is critical for mitigating the impacts of subsidence on urban infrastructure.
Ongoing improvements in data integration, computational methods, and multi-temporal monitoring will play pivotal roles in enhancing subsidence forecasting and risk reduction efforts [24,25,26,27]. In regions where the combined effects of land subsidence and sea level rise pose increasing risks, such technological advancements are essential for supporting resilient urban planning, disaster preparedness, and sustainable coastal development [28,29].
The absolute subsidence rate in Selangor has been recorded at approximately 8 mm per year. In contrast, the rise in relative sea level in Peninsular Malaysia is 4.46 mm per year, suggesting that sea level changes could be more pronounced in Selangor, especially along the area designated for Integrated Coastal Zone Management (ICZM), which extends from the districts of Kuala Selangor in the north to Sepang in the south. Several strategic plans have been developed for the ICZM that seek to achieve sustainable management of coastal areas by balancing environmental, economic, social, and cultural interests within the limits set by natural dynamics [30]. The study area is increasingly vulnerable to subsidence and coastal flooding [31,32]. Its suburban and rural characteristics make it an ideal site for deploying SBAS-InSAR for subsidence mapping.
This study delineates subsidence trends in Selangor, particularly within the ICZM from 2015 to 2022, using Small Baseline Subset Interferometric Synthetic Aperture Radar (SBAS-InSAR) and assesses the effectiveness of SBAS-InSAR in detecting subsidence and associated impacts. The SBAS-InSAR results demarcate areas susceptible to subsidence, which are then combined with coastal flood susceptible zones to develop impact scenarios over several timeframes, a novel approach that enhances understanding of subsidence and its local impacts on coastal flooding due to sea level rise. Impact scenarios are developed to model consequences under the most adverse conditions. The intent is to prioritize areas for further investigation within the ICZM, and highlight the best available science to support local decision-making in urban planning and land management policies.
2. Study Area
The study area is in the western part of Peninsular Malaysia, within the ICZM of the state of Selangor, which represents an important economic hub in the country. The nation’s major seaport is within this area, with the international airport situated nearby. The study area stretches approximately 213 km, with an average width of nearly 11 km, covering 2262 km2 (Figure 1). There are four major districts, comprising Kuala Selangor in the north, followed by Klang, Kuala Langat, and Sepang districts towards the south. The highest population is in Klang (990,100), with Kuala Selangor (241,700), Sepang (247,200), and Kuala Langat (260,200) having comparable levels of inhabitants [33].
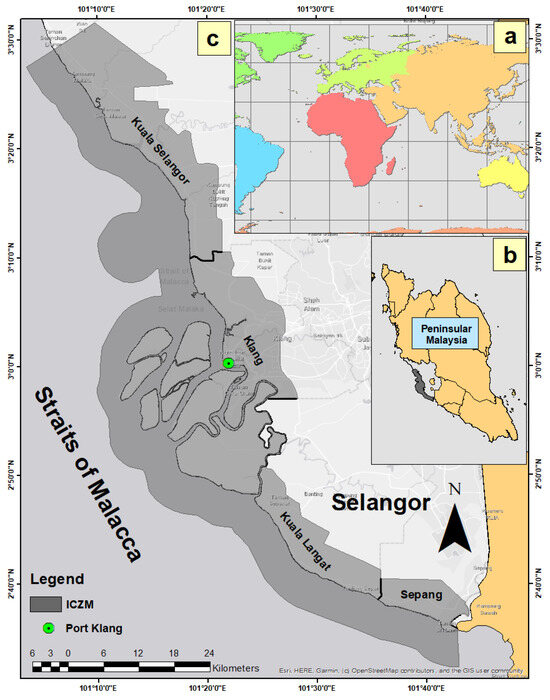
Figure 1.
Global map showing Malaysia’s location in Southeast Asia (a). Regional map highlighting the State of Selangor within Peninsular Malaysia (b). The western part of Selangor, designated as ICZM, includes sections of the districts of Kuala Selangor, Klang, Kuala Langat, and Sepang (c), highlighting their importance for environmental conservation and sustainable land use.
The climate in Selangor is tropical, classified as ‘Af’ under the Koppen climate classification, characterized by heavy precipitation and high levels of humidity, with two distinct monsoon seasons. The average rainfall is between 1800 to 2500 mm, with a mean annual temperature of 27 °C [34]. A significant proportion of the population is exposed to coastal climate hazards such as increasing sea level, floods, inundation, and erosion. In recent times, subsidence has proven to be a significant factor in exacerbating climate hazards, especially in developed coastal areas [35,36]. However, work on the extent of problematic areas is limited due to paucity of information.
The ICZM is primarily underlain by Quaternary marine sediments with sporadic occurrence of peatland [37]. Aquifers with varying permeability characteristics are in this zone, making the development of groundwater resources viable. This has led to an increase in groundwater abstraction, where 10.8 billion liters was extracted to meet industrial demands in 2008 [38]. Many areas show signs of a decrease in the groundwater table, sometimes up to 3 m due to these extractions [39]. In some areas, the impact extends beyond groundwater extractions sites. Subsidence around the vicinity of industrial areas in Klang district is at a much higher rate of 3.29 ± 0.13 mm/year [40]. The increasing impact of subsidence is not limited to groundwater extraction alone. Other activities associated with changing land use, for example from forests to built-up areas, also contribute to the problem.
Between 1991 and 2021, the developed areas in Selangor expanded from 707.32 km2 to 1974.95 km2, marking an increase of 24% [41]. Conversely, the forest cover diminished by about 14%, from 3805.57 km2 to 2662.41 km2. Significant changes were observed within forest land of the ICZM, which was converted primarily into built-up areas and cropland. The transition altered the peatland hydrology and soil stability, especially in the Sepang, Kuala Langat, and Kuala Selangor districts. The draining of peatlands for oil palm plantations and agriculture caused subsidence rates up to −7.5 mm/year between 2017 and 2019 [42]. The oxidation of peats and elevation change has heightened the flood risk. For instance, the Kuala Lumpur International Airport (KLIA), located in Sepang district, has encountered flooding due to its location on tropical peatland that degraded and led to further subsidence. In addition, the loss of natural wetlands that function as flood buffers further exacerbated flooding in the area and its surroundings.
3. Materials and Methods
This study used remote sensing and thematic datasets to analyze subsidence patterns and understand its causal factors, as well as delineate areas susceptible to land subsidence and coastal floods, which were then validated and used to develop impact scenarios for current and future periods (Figure 2). Remote sensing data include Sentinel-1 C-band collection (between 2015 to 2022), Global Surface Water (GSW) (1984–2021), Shuttle Radar Topography Mission (SRTM) (2000), and Landsat 8 (2013 to 2022) imagery. Thematic datasets comprise information obtained from field observations and historical records, primarily for validation purposes.
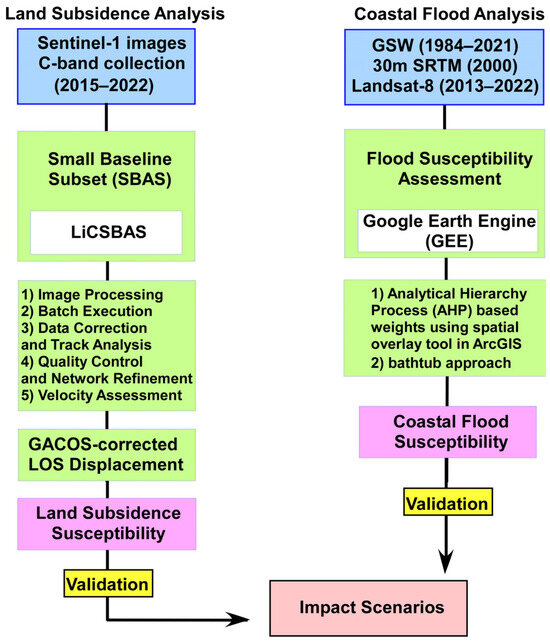
Figure 2.
The flowchart outlines the process for analyzing land subsidence using Sentinel-1 images with LiCSBAS, including image processing, data correction, and velocity assessment to develop GACOS-corrected LOS displacement. For coastal flooding analysis, data from Global Surface Water (GSW), Shutter Radar Topographic Mission (SRTM), and Landsat-8 are processed in Google Earth Engine (GEE). The AHP-based weights are processed in ArcGIS overlay tool and bathtub approach delineates inundation pattern. These processes formed susceptibility maps which were validated before the final impact scenarios are generated.
3.1. Land Subsidence Analysis
The analysis of land subsidence involved several processes. The main remote sending dataset was the Sentinel-1 C-Band Collection [43,44]. The raw images encompassing both ascending and descending products were processed using the open-source LiCSBAS tool to generate a seven-year (2015–2022) subsidence time series, with atmospheric corrections applied via GACOS (Table 1). These images were derived from both ascending and descending satellite passes within the same Integrated Coastal Zone Management (ICZM) area, allowing for comprehensive data coverage from different orbits. The rate of subsidence was then used to establish a baseline for local vertical land motion for the periods 2040, 2050 and 2100. The projections assume a constant rate of subsidence during this period, with no trend acceleration or deceleration. The linear extrapolation assumes that the rate of subsidence will remain consistent in the future, following the observed trend from the baseline period. The baseline was then used to estimate the net vertical land motion for the study area, in conjunction with the relative sea level rise using the IPCC projections for the same time slices under the low (SSP1-2.6) and high (SSP5-8.5) emission scenarios. Land subsidence susceptibility was demarcated based on the frequency of observed displacement.

Table 1.
InSAR information for the present study.
3.1.1. Image Processing
The Small Baseline Subset (SBAS) technique was applied using LiCSBAS, an open-source software developed by the COMET-LiCS group. This approach offers a cost-effective method to process Synthetic Aperture Radar (SAR) datasets without requiring extensive computational resources. More powerful computational power will lead to faster processing, especially for large datasets. The processing began by activating LiCSBAS within the Ubuntu 20.04 environment using the command conda activate licsbas [43].
A crucial step involved organizing the directory structure based on filenames downloaded from the COMET portal (https://comet.nerc.ac.uk/comet-lics-portal/, accessed on 7 September 2023). In Malaysia, interferogram generation is limited; however, the chosen frames still provided comprehensive coverage of the ICZM. Notably, frame IDs “070A_08762_131413” and “091D_08678_131314” were selected from the portal and added to the main directory configuration file, with careful attention to temporal coverage and spatial extent within each frame.
3.1.2. Batch Execution
Batch processing was executed through command-line scripts to automate the generation of displacement time series and deformation maps. The spatial footprint was set to approximately 60 km by 60 km to balance resolution with computational efficiency. Temporal coverage spanned seven years (2015–2022) to capture long-term deformation signals.
The entire processing typically required between two to three hours, influenced by the number of input products and the spatial extent of the selected frames. This step involved the generation of interferograms, phase unwrapping, and time-series inversion to estimate surface displacement.
From the initial 771 available images, only 182 products were selected for analysis after excluding 589 images due to low quality. This exclusion introduced temporal gaps and potential biases to the time series. Therefore, epochs with optimal data quality were prioritized for continuity, accuracy, and reliability of subsidence estimates. This limitation was considered when interpreting the results.
Outputs were saved within a Linux file system and later converted into GeoTIFF format for integration and visualization within Geographic Information System (GIS) software. This allowed further spatial analysis, mapping, and correlation with ancillary geographic data.
3.1.3. Data Correction and Track Analysis
In this study, SBAS-InSAR processing utilized data filtering to remove poor quality interferograms, parallel processing, baseline, and unwrapping quality control measures. Temporal inconsistencies were addressed by re-running the analysis with adjusted thresholds.
The SBAS processing included correction for atmospheric effects, particularly tropospheric delays, by applying Generic Atmospheric Correction Online Service (GACOS) products to refine the SBAS results. This correction improves phase stability and reduces error in deformation estimates, which is especially important for coastal and urban areas where atmospheric variability can be significant [45,46].
Analysis was conducted separately for ascending and descending satellite passes to exploit differences in satellite viewing geometry. These tracks differ in satellite heading direction, revisit intervals, and incidence angles. The combination of both tracks helps to resolve the true three-dimensional ground displacement by cross-validating deformation patterns and minimizing directional biases.
3.1.4. Quality Control and Network Refinement
Persistent Scatterer InSAR (PS-InSAR) methods rely on identifying stable reflectors (pixels) with high temporal coherence to ensure reliable displacement measurement [47,48]. In this study, pixels with temporal coherence values above 0.3 were selected, while pixels below this threshold were discarded to mitigate noise and decorrelation errors.
Due to short spatial and temporal baselines inherent in Sentinel-1 acquisitions, the Small Baseline network used for inversion was relatively compact. However, certain regions, particularly in the northern part of the study area, exhibited decorrelation likely caused by local environmental factors such as vegetation or land use changes.
To address these network gaps, Singular Value Decomposition (SVD) was applied during the inversion process [49,50]. SVD efficiently manages missing data by decomposing the network matrix and identifying zero-valued nodes where no reliable phase information is available. The zero values were used based on the assumption that the missing gaps are due to decorrelation or areas where no data are available. The approach could lead to inaccuracies, especially if the missing data correspond to areas with significant subsidence. However, the approach helps to stabilize the solution and maintain the integrity of the displacement time series in the absence of reliable datasets.
3.1.5. Velocity Assessment
This study conducted a comparative analysis of velocities derived from Line-of-Sight (LOS) projections to the vertical with decomposed vertical velocities calculated using both ascending and descending satellite passes [51,52]. The evaluation metrics used for this analysis include standard deviation, bias, correlation coefficient (R2), and Root Mean Square Error (RMSE). The performance of the SBAS technique before and after GACOS correction are compared using RMSE and the coefficient of determination (R2) to assess the impact of the GACOS refinement on the accuracy of subsidence estimation. The RMSE is a widely used measure to quantify the differences between values predicted by a model and the observed values from the environment being modeled. It is defined mathematically as
where represents the estimated velocities derived by projecting LOS to vertical, represents the reference measurement velocities derived from decomposed vertical velocity, and n denotes the total number of data points.
The correlation coefficient R2 measures the strength and direction of the linear relationship between two variables. It is calculated as follows:
where is the mean of the estimated velocities and is the mean of the reference velocities .
3.2. Coastal Flood Analysis
Flood susceptibility assessment for coastal floods used Google Earth Engine (GEE) comprising several key stages [53]. These include data collection, preprocessing, calculation of hazard indices, and integration of these indices to derive a comprehensive flood hazard score (https://code.earthengine.google.com/?scriptPath=users%2Fbatmanathannavakanesh%2Ffloodhazard_NDVI%3AFloodHazard, accessed on 9 May 2025). The region of interest (ROI) was delineated based on geographic and hydrological criteria pertinent to flood risk assessment. This study utilized multiple remote sensing datasets: the Global Surface Water (GSW) dataset from the European Commission’s Joint Research Centre (JRC), Shuttle Radar Topography Mission (SRTM) data from NASA, and Landsat 8 imagery from the United States Geological Survey (USGS).
The initial step involved extracting water occurrence data from the GSW dataset, which were then clipped to the ROI. Water bodies were identified by applying a threshold to the water occurrence values, considering values greater than 80 as water. Using the fast distance transform algorithm, the distance from these water bodies was calculated and reprojected to a suitable coordinate system. Elevation data from the SRTM were also clipped to the ROI and used to compute elevation hazard scores.
Subsequently, the topographic position index (TPI) was derived by subtracting the focal mean of the elevation data from the original elevation values, providing insights into the relative topographic features. To assess vegetation and wetness conditions, Landsat 8 imagery was processed, applying a cloud masking function to ensure accuracy. The normalized difference vegetation index (NDVI) and normalized difference water index (NDWI) were then computed from the Landsat 8 imagery.
Each of these variables, distance, elevation, TPI, NDVI, and NDWI, was classified into hazard scores ranging from 1 to 3, with higher scores indicating greater hazard levels (Table 2). These individual hazard scores were then integrated to produce a composite flood hazard score, which was visualized using a color palette and exported to ArcGIS for further analysis. The AHP weights for this study were derived using a pairwise comparison matrix created in Excel, based on literature-derived assumptions from existing coastal hazard assessment studies. Weights were then computed using the Eigenvalue method (Figure S1). The Analytical Hierarchy Process (AHP)-based weights were applied in ArcGIS environment using spatial overlay to assign weights to additional criteria for the final hazard score [54,55,56]. The areas below 0.5 m were enumerated using the bathtub approach, assuming that any area below this threshold is at risk of flooding in the event of sea level rise. The integration of diverse environmental factors and remote sensing data enabled a robust flood susceptibility assessment.
Table 2.
Hazard scores for the susceptibility parameters.
3.3. Method Validation
Thematic datasets from primary and secondary sources were used to validate results from remote sensing analyses and susceptibility assessment of land subsidence and coastal floods (Table 3). Field investigation was conducted to capture ground information such as profuse cracks in residential units, sloping floors, and uneven roads. Measurement tools such as measuring stick and clinometer compass were used. The evidence was used to validate the effectiveness of InSAR-based approaches [57,58]. Historical records such as land subsidence between 1990–2025 was another means of validation, to further improve confidence. Records of floods, inundation, and erosion events in coastal areas were used to assess the robustness of coastal flood demarcation, especially within areas that are highly susceptible. Secondary information on subsidence and coastal events in the study area was collated from media reports, government records, and scientific literature. Higher-accuracy validation data (e.g., Real Time Kinematic-Global Positioning System-RTK-GPS, leveling, tide gauge records) were not accessible for this research and, therefore, were not used in the validation process.
Table 3.
Information used to validate results in this study.
3.4. Modeling of Impact Scenarios
Impact scenarios are modeled based on the premise that elements such as land use, critical infrastructure, and vulnerable populations such as the poor and marginalized social groups are at a higher risk and would be needing additional support in times of crisis [59], which are in areas that have been delineated as susceptible, and will be exposed to the most unfavorable outcome due to a hazard at some point in the future. The underlying assumption is that no measures have been taken to protect the exposed elements from such impacts. This worst-case scenario of “no action” has been used in several situations where there is paucity of information for decision-making [60,61,62,63]. The approach is useful to identify actions that could be taken to avoid this situation or prepare for future adverse conditions depicted by IPCC emission scenarios (e.g., SSP1-2.6 and SSP5-8.5). The exposed elements modeled in this study were confined to land cover, specifically forest land, cropland, and built-up areas. Impact scenario modeling was conducted by integrating hazard susceptibility layers with land cover data using ArcGIS. The land cover information is from remote sensing and open-source databases. The land cover and susceptibility layers were superimposed using simple summation, where the values from each layer were added together without applying specific weights to delineate areas and land use categories that are exposed to the impacts of land subsidence and coastal floods in the worst-case scenario.
4. Results
4.1. GACOS-Corrected Vertical Land Motion
The maximum downward displacement rate in the study area between 2015 and 2022 was recorded at −46 mm/year for the descending orbit and −61 mm/year for the ascending orbit, highlighting significant vertical land movement over the years (Figure 3). The average vertical land motion rate has been 13.3 mm/year over the last 7 years. The distribution of Persistent Scatterers (PS) was most concentrated in the range of −10 to −20 mm/year, indicating areas where displacement was more stable and detectable. However, some regions within the ICZM boundary lacked data, primarily due to the unavailability of stable PS pixels, particularly along the ascending track.
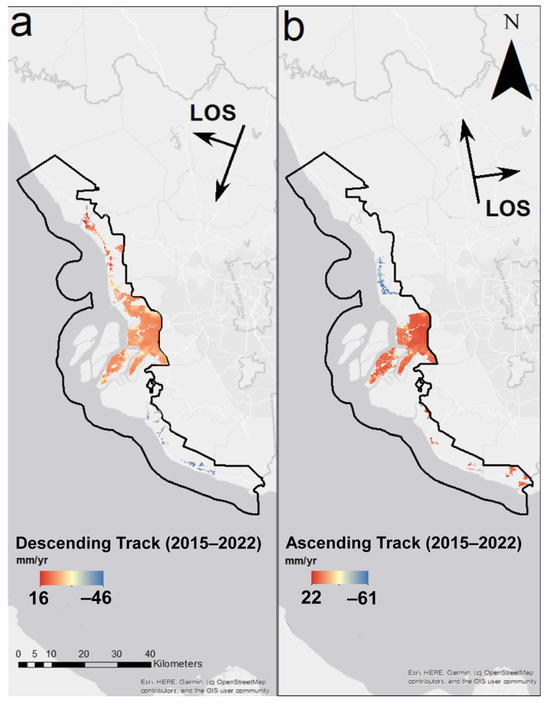
Figure 3.
The Line of Sight (LOS) observed along the descending track, showing a maximum subsidence rate of 46 mm/year (a). The LOS recorded along the ascending track, highlighting the maximum subsidence rate of 61 mm/year (b).
Field investigation conducted in August 2023 revealed obvious signs of subsidence, with total settlement measurements ranging from approximately 17 cm to 23 cm at specific locations. These included sloping floors, tilted roads, and numerous cracks in residential units. (Figure 4). InSAR processing revealed an average displacement rate of 11.5 mm/year, with the maximum displacement rate reaching 70.0 mm/year in the first quarter of 2022.
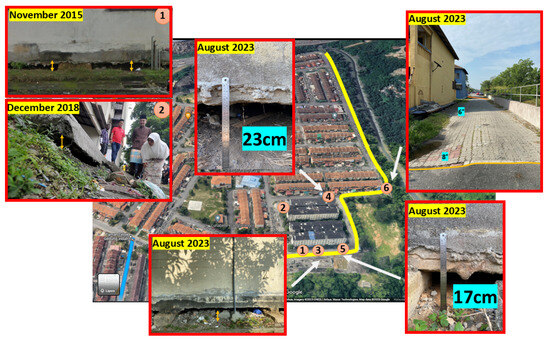
Figure 4.
Field observations and measurements showing subsidence rates ranging from 17 to 23 cm at points 3, 4, and 5, resulting from a single event within the Integrated Coastal Zone Management (ICZM). Points 1 and 2 were captured using Google Street View to provide visual evidence of land sinking in 2015 and 2018. Additionally, point 6 demonstrates road tilting at approximately 8 degrees, further indicating the impact of subsidence on infrastructure in the region.
The RMSE analysis showed a 7 mm difference in estimated difference between the SBAS before and after GACOS correction (Figure 5). This adjustment, which reduces tropospheric errors, further refines the dataset and increases the maximum rate to 77.0 mm/year. Despite the discrepancies between the InSAR data and field observations, the time-series data reveal a clear accelerating trend in vertical displacement from 2015 to 2022, suggesting that the subsidence rate has been increasing each year during this period. However, this trend warrants further analysis to quantify the acceleration and provide deeper insights into the underlying processes driving ground movement.
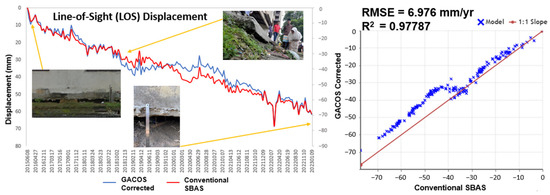
Figure 5.
The Line-of-Sight (LOS) time-series displacement data between SBAS before and after GACOS correction. The analysis includes RMSE to assess the accuracy and reliability of each method.
The absence of reliable data in certain regions due to unstable PS pixels indicates the need for improved satellite coverage or the use of alternative data sources to fill these gaps and enhance spatial accuracy. The field investigations confirmed the presence of subsidence in residential areas, highlighting the importance of continuous monitoring to assess the safety of buildings and infrastructure. The GACOS correction has reduced atmospheric interference, potentially improving the reliability of displacement estimates over the ICZM.
4.2. Future Vertical Land Motion
Over the past seven years, the subsidence rate in the ICZM has averaged 13.3 mm/year, with future projections indicating a subsidence of 0.226 m by 2024, 0.359 m by 2050, and 1.024 m by 2100. This baseline for local subsidence, when combined with IPCC projections for relative sea level rise for the years 2040, 2050, and 2100 under low (SSP1-2.6) and high (SSP5-8.5) emission scenarios, show increased net vertical land motion over the three time slices (Table 4). The worst case for this study is represented by the IPCC high-emission scenarios (SSP5-8.5).
Table 4.
Local land subsidence estimated from this study combined with the projected relative sea level rise from the IPCC for 2040, 2050, and 2100.
In 2040, local subsidence in the ICZM is estimated at 0.226 m. Relative sea level rises for the low- and high-emission scenarios are projected to range from 0.15 to 0.25 m and 0.25 to 0.35 m, respectively (Table 4). In the worst-case scenario, local subsidence is expected to contribute to higher relative sea level rise in the ICZM in 2040, to a maximum of 0.576 m. In 2050, local subsidence in the ICZM is estimated at 0.359 m. Relative sea level rises for the low- and high-emission scenarios are projected to range from 0.20 to 0.35 m and 0.30 to 0.45 m, respectively (Table 4). Local subsidence is expected to contribute to higher relative sea level rise in the ICZM, to a maximum of 0.809 m in the worst-case scenario for 2050. In 2100, local subsidence along the coast of ICZM is estimated at 1.024 m. During this period, sea level rises for the low- and high-emission scenarios are projected to range from 0.45 to 0.60, and 0.85 to 1.10 m, respectively. Local subsidence is expected to contribute to higher relative sea level rise in the ICZM, to a maximum of 2.124 m in the worst-case scenario for 2100.
Subsidence processes can exhibit non-linear behavior; nevertheless, a linear assumption was adopted due to the limitation of data and lack of significant fluctuations observed over the study period. This approach provides a baseline estimate, though it is acknowledged that future trends may vary due to external factors.
4.3. Areas Susceptible to Subsidence and Coastal Floods
The total area susceptible to land subsidence is estimated to cover approximately 1049 km2, representing 46% of the ICZM. Of this area, about 13% is classified as having low susceptibility, 80% with a medium level of susceptibility, and 7% with high susceptibility (Figure 6). This classification was validated by three subsidence events since 1990, with two occurring in high-susceptibility zones and one in a medium-susceptibility zone (Table S1). All the subsidence events occurred within areas classified as high and medium levels of susceptibility (Table 5).
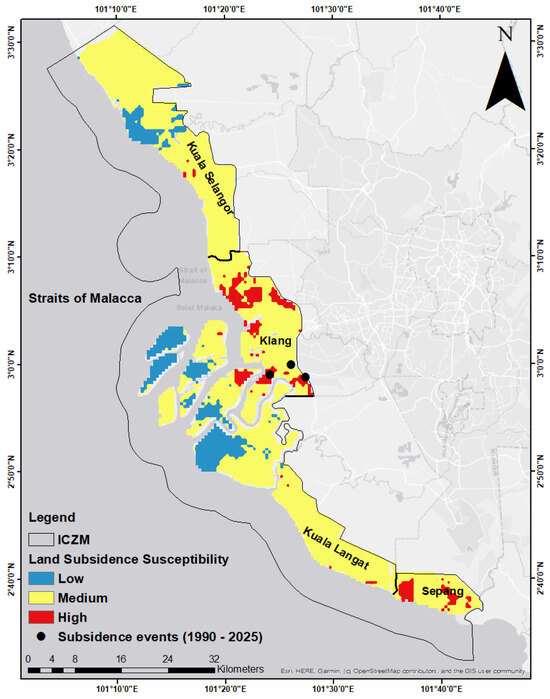
Figure 6.
Geographic interpretation of land subsidence in ICZM, showing areas of significant vertical displacement. Subsidence rates were calculated using GACOS-corrected SBAS data. Table 5 (below) summarizes the mean and maximum subsidence rates by district.
Table 5.
The average and maximum subsidence rates and standard deviation in four districts within the ICZM and its surroundings. Only three subsidence events have occurred in the ICZM while others have been observed in nearby sections of the district.
The total area susceptible to flooding spans approximately 1204 km2, representing 53% of the ICZM. About 48% of this area is categorized as low susceptibility, followed by 34% with medium susceptibility, and 18% as highly susceptible (Figure 6 and Figure 7). When compared with historical records (Table S1), 85% of coastal flood events between 2005 and 2025 occurred within high-susceptibility zones. During the same period, most of the coastal inundations (17 out of 22 events) and erosion events (3 out of 4) also occurred in the same zone of high susceptibility to flood. This constitutes 77% and 75% of reported coastal flood and erosion events, respectively. A significant portion of the reported incidents of floods, inundation, and erosion occur in areas classified as highly susceptible to coastal flooding in this analysis.
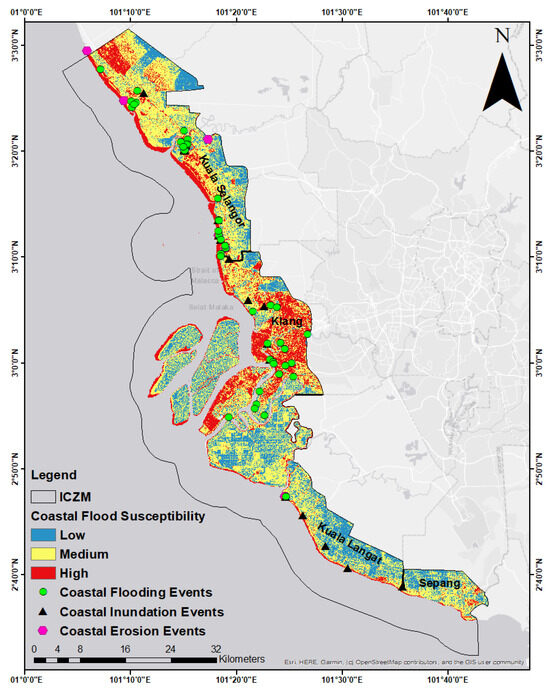
Figure 7.
The regions within the Integrated Coastal Zone Management (ICZM) that are particularly susceptible to coastal flooding. Historical events such as flooding, inundation, and erosion were used to validate the susceptibility layer.
The total area susceptible to the combined effects of both land subsidence and flooding spans approximately 1856 km2, representing 82% of the ICZM. About 34% of this area is categorized as having low susceptibility to both events, followed by 51% with medium susceptibility, and 15% with high susceptibility (Figure 6 and Figure 7). The majority of both types of events occur within the zones demarcated as highly susceptible to land subsidence and coastal flooding.
The findings underscore the need for prioritizing mitigation and adaptation strategies in the high-susceptibility zones within the ICZM. The validation using historical records of actual events of subsidence, flood, coastal inundation, and erosion incidents strengthens the need for frequent monitoring and updating of risk assessments identified in this study.
4.4. Land Cover Exposed to Subsidence and Coastal Floods
The land cover within the ICZM consists of 78% (1769 km2) forest land, 7% (166 km2) cropland, and 15% built-up areas (327 km2). The total area of low, medium, and high susceptibility to land subsidence is about 1049 km2. The largest land cover exposed to subsidence is forest land, consisting of 56% (592 km2) of the area, followed by built-up area comprising 29% (301 km2), and cropland, with 14.9% (155 km2). The distribution of land cover in the area highly susceptible to land subsidence consists of 41.7% (30 km2) forest land, 53.4% (38 km2) built-up area, and 4.9% (4 km2) cropland.
The total area with low, medium, and high susceptibility to coastal floods is about 1204 km2. The land cover within this area consists of 59% (713 km2) forest land, 27% (325 km2) built-up area, and 14% (165 km2) cropland. The distribution of land cover in the area highly susceptible to flood consists of 40% (85 km2) forest land, 51% (110 km2) built-up area, and 9% (20 km2) crops (Table 6).
Table 6.
Spatial extent of areas with low, medium, and high levels of susceptibility to subsidence, coastal floods, and the combined effect of subsidence and coastal flood, and the land cover therein.
The total area that is susceptible to both land subsidence and coastal floods (low, medium, and high susceptibility) is 1856 km2. In absolute terms, a total of 1106 km2 of forest land, 252 km2 of cropland, and 498 km2 of built-up land occurs within this zone of combined hazards. In the worst-case scenario, 270 km2 of built-up area, 112 km2 of forested areas, and 23 km2 of cropland are exposed to the combined effects of land subsidence and coastal floods.
It appears that within the ICZM, the area that is highly susceptible to land subsidence (72 km2) is relatively smaller compared to the area highly susceptible to flooding (215 km2). The area at risk of flooding within the ICZM is about three times more widespread (Figure 8).
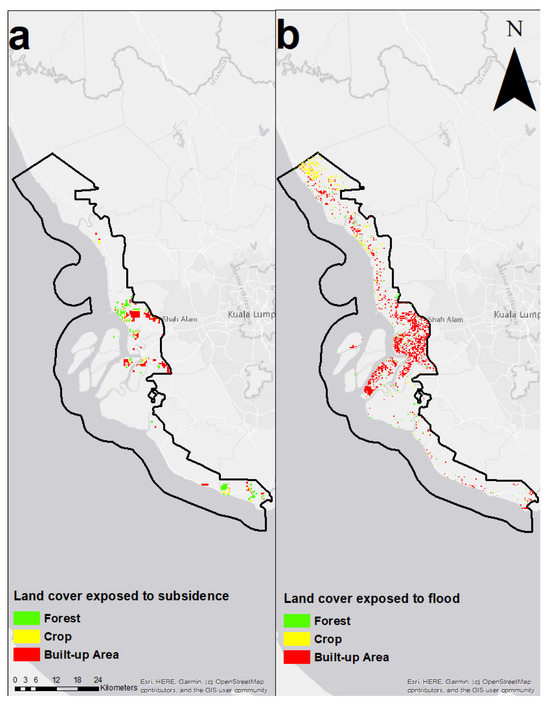
Figure 8.
The areas of forest land, cropland, and built-up land within the Integrated Coastal Zone Management (ICZM) that are exposed to high susceptibility to subsidence. This map shows how these different land cover types are impacted by land sinking, with varying degrees of exposure based on their location and susceptibility (a). The areas of forest land, cropland, and built-up land within the ICZM are exposed to high susceptibility to coastal floods. This map highlights the susceptibility of these land cover types to rising sea levels, storm surges, and flooding events (b).
Modeling of land cover exposed to land subsidence and coastal floods reveals significant variability in the spatial extent and potential impacts in the worst-case scenario, across different land cover types. The built-up areas are most susceptible to both subsidence and coastal flooding, which require attention for adaptation strategies to safeguard urban infrastructure. While forested areas and croplands are also exposed to these hazards, they are less vulnerable than built-up areas and it is essential to address the risks, as they play a major role in the region’s ecology and agricultural growth.
5. Discussion
5.1. Causal Factors of Subsidence
This study identifies several key factors contributing to land subsidence in the ICZM, which includes upheaval deformation, deep foundation failure, and groundwater extraction. Upheaval resulting from rapid land use changes and poor ground leveling has been observed in newly developed areas [64]. This is likely due to inadequate backfilling and compaction in areas with weak soils. Similarly, foundation failures in urban areas contribute significantly to subsidence [65,66,67]. This is compounded by erosion in water-prone areas, which exacerbates differential settlement [68,69]. Groundwater extraction is a major driver of subsidence and has been a contributing factor, particularly in ICZM, leading to land sinking as groundwater is drawn for industrial purposes.
5.2. Worst-Case Scenarios
5.2.1. Near Term Impact Scenarios
In discussing the potential impact of land subsidence and coastal floods in the near-time, priority is given to the built-up area within the ICZM, which has a far higher population density compared to forest land and cropland. With respect to land subsidence, in the worst-case scenario for the ICZM, it is projected that nearly 12% (38 km2) of the built-up area could be impacted. This covers areas such as the Klang district where subsidence levels of up to 3 m have been reported. The built-up areas exposed to land subsidence would experience damage to infrastructure and housing, and land deformation. If no action is taken, this could lead to economic losses and possible loss of life. The close association of land subsidence with urban development and anthropogenic activities such as groundwater extraction and construction loading should also be closely monitored. Detailed risk assessments prior to approval of further development should also be considered.
With respect to coastal floods, in the worst-case scenario, it is projected that nearly 34% (110 km2) of the built-up area in the ICZM could be impacted if alleviation actions are not taken. The occurrence of coastal flooding, associated with inundation and erosion in this area, which has already caused major damage, economic loss, and deaths, substantiates the findings [70]. The demarcation of this area is an important first step to taking targeted actions to prevent future disasters. For example, flood risk assessments should be made mandatory for urban planning in this area. In addition, early warning systems, flood awareness, preparedness, and resilience building programs should focus on communities living in these areas.
5.2.2. Long Term Impact Scenarios
The results of this study in the ICZM confirm previous work that the coastal zone of Peninsular Malaysia is subsiding [71]. Subsidence in combination with sea level rise could worsen coastal floods. The rate of local subsidence estimated in the ICZM is 13 mm/year. This is double the average subsidence rate of 5 mm/year in Penang Island. The combination of land subsidence and local sea level rise projection for the year 2100 under different emission scenarios is estimated to increase the extent of coastal inundation by up to 6% of the inundated area, submerging nearly 15% of Penang Island.
In the ICZM, nearly 27% (135 km2) of the built-up area in the ICZM is at risk to the combined effects of both land subsidence and coastal floods, under present sea level conditions. When combined with relative sea level projections from the IPCC under low (SSP1-2.6) and high (SSP5-8.5) emission scenarios, local subsidence in the ICZM is expected to aggravate coastal floods to varying degrees over time. In the worst-case scenario of high emissions, local land subsidence is expected to worsen the impacts of relative sea level rise through enlarged inundation along the coast of ICZM in 2040, 2050, and 2100.
5.3. Implications for Regional Land Use Planning
The findings indicate the urgent need to integrate subsidence and coastal flooding susceptibility information into regional land use planning. Built-up areas are most exposed to both hazards, necessitating targeted adaptation approach. As subsidence rates are projected to increase under high-emission scenarios, urban planning should emphasize flood defenses, resilient infrastructure, and water management systems. Industrial zones should practice groundwater management to avoid overextraction. Urban areas in the ICZM should also focus on strengthening foundations and incorporating measures to prevent differential settlement, particularly in regions with high subsidence risks. Furthermore, coastal protection measures, including the construction of flood barriers, retrofits and the restoration of natural coastal buffers like mangroves will be essential in reducing risks in the ICZM. Similar adaptations are implemented in cities like Jakarta [72]. This is useful guidance for country such as Malaysia in managing such hazards.
5.4. Limitations of the Study and Future Work
The InSAR-based deformation measurements provided in this study are relative, as the selection of a stable reference point or external datum was not explicitly defined. As a result, the derived displacements may contain offsets, which could affect the accuracy of the absolute subsidence rate. The limitations must be considered when interpreting long-term trends especially when comparing them to other geodetic or ground-based measurements. The absence of valid InSAR data within the ICZM also introduces potential uncertainty in subsidence assessment. These data gaps are not uniformly distributed but are concentrated in regions with thick vegetation where signal interference hinders data quality.
While the extrapolation of subsidence rates from the short-term InSAR time series (5–7 years) provides valuable insights, it introduces significant uncertainty due to the potential for long-term variability in subsidence rates. Given the increasing trend in subsidence rate between 2015 and 2022, it is important to recognize that a linear assumption using constant subsidence rate could underestimate the actual future subsidence. Projections over a 30-year period may be subject to errors arising from unaccounted changes in subsidence dynamics, leading to underestimation.
While the use of InSAR was significant to determine the extent of areas that are susceptible to hazards, which were validated through actual events of subsidence and floods, the uncertainty associated with the magnitude of subsidence could not be reported. This is primarily due to the absence of formal in situ geodetic validation using high-accuracy methods such as RTK-GPS or leveling surveys. In addition, the sparse datasets on observations made it meaningless to report on the precision of subsidence levels within each district; increasing the uncertainty associated with subsidence projection in conjunction with sea level rise. When the number of data points is too small, the resulting intervals become statistically unreliable [73]. Now that the target area for subsidence has been delineated, further work that includes such missing information, as well as long-term monitoring, is required to estimate and report on the uncertainties associated with subsidence projection.
The enlarged extent of areas susceptible to coastal flooding could not be determined in this study. The current method of delineating areas susceptible to coastal floods sets the boundary for inundation of low-lying land at 0.5 m above mean sea level. The accuracy of this boundary is heavily dependent on the quality and resolution of the Digital Elevation Model (DEM) used to represent the land surface. Even the smallest error in elevation could lead to significant changes in the demarcation of flood susceptible areas [74,75]. Now that the target areas have been delineated, future work could combine high-resolution DEMs with projected sea level rise, for example from IPCC scenarios [76,77]. Dynamic flood models could also be considered. These include hydrodynamic simulations, probabilistic flood risk modeling, or machine learning approaches that integrate climate, land use, and socio-economic data. Also, simple additive approaches may not fully capture the compound or synergistic effects of multiple hazards. Future studies may consider using multiplicative or conditional overlay techniques for more nuanced representation of hazard interactions and realistic assessments of risks.
The findings of this study suggest that measures to mitigate the impacts of land subsidence and coastal floods should be tailored to address the unique characteristics and risk profiles associated with each hazard. Further work is required to demark the exposed elements using verified land use data, as the present study is limited to land cover. The application of open access remote sensing data coupled with reliable land use information could offer a cost-effective means for supporting informed decision-making in land use planning. Such information is also useful to foster collaborative stakeholder engagement, to build resilience and ensure sustainable economic development in areas demarcated for priority action. In summary, delineating these hazard zones offers a means of prioritizing large tracts of coastal land for targeted interventions.
6. Conclusions
The time-series InSAR data reveal a clear increase in vertical displacement from 2015 to 2022, indicating an acceleration of subsidence in the Integrated Coastal Zone Management (ICZM). The occurrence of subsidence is supported by field data, demonstrating the effectiveness of SBAS-InSAR in detecting the extent of areas susceptible to subsidence. While coastal flood susceptibility covers a larger area than subsidence in the ICZM, the worst-case scenario suggests that nearly 12% (38 km2) of the built-up area that has the highest population density could face severe infrastructure and housing damage due to subsidence. In contrast, coastal flooding is projected to impact 34% (110 km2) of the built-up area, worsening existing challenges such as erosion. When combined, subsidence and flooding threaten 27% (135 km2) of built-up land under current sea level conditions, with risks escalating through 2040, 2050, and 2100 as local subsidence interacts with rising sea levels.
While this study provides insights into managing subsidence and flooding risks, it is important to acknowledge limitations in the projections, particularly the reliance on short-term data for long-term estimates. The assumption of linear subsidence rates may not capture potential non-linear shifts driven by land use changes, groundwater extraction, or policy interventions. Future research should integrate longer-term monitoring, higher-resolution data, and uncertainty analysis to enhance the precision of subsidence projections and develop more robust planning.
This study highlights the potential of remote sensing as a powerful tool for supporting informed decision-making in coastal management. By identifying priority areas for intervention, the research can support policy actions, including stricter building codes, zoning regulations, and groundwater management, to improve resilience in coastal regions. The framing employed in this study could be examined in other coastal mega-deltas and subsiding urban centers to address similar challenges.
Supplementary Materials
The following supporting information can be downloaded at: https://www.mdpi.com/article/10.3390/jmse13081539/s1, Table S1: The georeferenced locations of subsidence and coastal events in the ICZM area of Selangor, obtained from field visits and a variety of newspaper articles and reports. Figure S1: Pairwise comparison matrix for AHP weight derivation.
Author Contributions
Conceptualization, J.J.P. and N.M.; methodology, N.M.B., J.J.P. and A.A.S.; software, N.M.; validation, N.M.B. and J.J.P.; formal analysis, N.M.B. and A.A.S.; investigation, N.M.B. and L.C.S.; resources, J.J.P. and N.M.; data curation, L.C.S.; writing—original draft preparation, N.M.B. and A.A.S.; writing—review and editing, J.J.P., N.M.B., L.C.S. and N.M.; supervision, J.J.P., N.M. and A.A.S.; project administration, J.J.P. and N.M.; funding acquisition, J.J.P. and N.M. All authors have read and agreed to the published version of the manuscript.
Funding
This work was conducted with the aid of a grant from the International Development Research Centre (IDRC), Ottawa, Canada [Grant No: 109162-001], and Universiti Kebangsaan Malaysia [Project Code: XX-2019-011].
Data Availability Statement
InSAR data are available via COMET-LiCS Sentinel-1 InSAR portal (https://comet.nerc.ac.uk/comet-lics-portal/, accessed on 7 May 2025). The 30 m resolution Digital Elevation Model (DEM) can be downloaded from https://dwtkns.com/srtm30m/, accessed on 7 May 2025. Landsat data are freely available via https://earthexplorer.usgs.gov/, accessed on 7 May 2025. The datasets from this study are available upon request.
Acknowledgments
The authors would like to thank the Mineral and Geoscience Department of Malaysia (JMG) for their valuable contributions to this research. Additionally, we acknowledge the support from SEADPRI-UKM for providing data and expressing our gratitude to the interns and colleagues who assisted with data collection and analysis. The authors would also like to acknowledge COMET-LiCS Sentinel-1 InSAR portal for providing displacement time series. LiCSAR contains modified Copernicus Sentinel data [2017–2022] analysed by the Centre for the Observation and Modelling of Earthquakes, Volcanoes and Tectonics (COMET). LiCSAR uses JASMIN, the UK’s collaborative data analysis environment (http://jasmin.ac.uk, accessed on 7 May 2025).
Conflicts of Interest
The authors declare no conflicts of interest.
References
- Luu, Q.H.; Tkalich, P.; Tay, T.W. Sea level trend and variability around Peninsular Malaysia. Ocean Sci. 2015, 11, 617–628. [Google Scholar] [CrossRef]
- Din, A.H.M.; Zulkifli, N.A.; Hamden, M.H.; Aris, W.A.W. Sea level trend over Malaysian seas from multi-mission satellite altimetry and vertical land motion corrected tidal data. Adv. Space Res. 2019, 63, 3452–3472. [Google Scholar] [CrossRef]
- Hussain, M.A.; Chen, Z.; Shoaib, M.; Shah, S.U.; Khan, J.; Ying, Z. Sentinel-1A for monitoring land subsidence of coastal city of Pakistan using Persistent Scatterers In-SAR technique. Sci. Rep. 2022, 12, 5294. [Google Scholar] [CrossRef]
- IPCC. Contribution of Working Groups I, II and III to the Fifth Assessment Report of the Intergovernmental Panel on Climate Change. In Climate Change 2014: Synthesis Report; Core Writing Team, Pachauri, R.K., Meyer, L.A., Eds.; IPCC: Geneva, Switzerland, 2014; p. 151. [Google Scholar]
- IPCC. Contribution of Working Group I to the Sixth Assessment Report of the Intergovernmental Panel on Climate Change. In Climate Change 2021: The Physical Science Basis; Masson-Delmotte, V., Zhai, P., Pirani, A., Connors, S.L., Péan, C., Berger, S., Caud, N., Chen, Y., Goldfarb, L., Gomis, M.I., et al., Eds.; Cambridge University Press: Cambridge, UK; New York, NY, USA, 2021; in press. [Google Scholar] [CrossRef]
- Anderssohn, J.; Wetzel, H.U.; Walter, T.R.; Motagh, M.; Djamour, Y.; Kaufmann, H. Land subsidence pattern controlled by old alpine basement faults in the Kashmar Valley, Northeast Iran: Results from InSAR and levelling. Geophys. J. Int. 2008, 174, 287–294. [Google Scholar] [CrossRef]
- Chen, J.; Wu, J.C.; Zhang, L.N.; Zou, J.P.; Liu, G.X.; Zhang, R.; Yu, B. Deformation trend extraction based on multi-temporal InSAR in Shanghai. Remote Sens. 2013, 5, 1774–1786. [Google Scholar] [CrossRef]
- Luo, Q.L.; Perissin, D.; Lin, H.; Zhang, Y.Z.; Wang, W. Subsidence monitoring of Tianjin suburbs by TerraSAR-X persistent scatterers interferometry. IEEE J. Select. Top. Appl. Earth Observ. Remote Sens. 2014, 7, 1642–1650. [Google Scholar] [CrossRef]
- Zhang, J.Z.; Huang, H.J.; Bi, H.B. Land subsidence in the modern Yellow River Delta based on InSAR time series analysis. Nat. Hazards 2015, 75, 2385–2397. [Google Scholar] [CrossRef]
- Nico, G.; Tomé, R.; Catalao, J.; Miranda, P.M.A. On the use of the WRF model to mitigate tropospheric phase delay effects in SAR interferograms. IEEE Trans. Geosci. Remote Sens. 2011, 49, 4970–4976. [Google Scholar] [CrossRef]
- Mateus, P.; Nico, G.; Catalao, J. Uncertainty assessment of the estimated atmospheric delay obtained by a numerical weather model (NMW). IEEE Trans. Geosci. Remote Sens. 2015, 53, 6710–6717. [Google Scholar] [CrossRef]
- Berardino, P.; Fornaro, G.; Lanari, R.; Sansosti, E. A new algorithm for surface deformation monitoring based on small baseline differential SAR interferograms. IEEE Trans. Geosci. Remote Sens. 2002, 40, 2375–2383. [Google Scholar] [CrossRef]
- Yang, F.; An, Y.; Ren, C.; Xu, J.; Li, J.; Li, D.; Peng, Z. Monitoring and analysis of surface deformation in alpine valley areas based on multidimensional InSAR technology. Sci. Rep. 2023, 13, 12896. [Google Scholar] [CrossRef] [PubMed]
- Shan, X.J.; Qu, C.Y.; Guo, L.M.; Zhang, G.H.; Song, X.G.; Jiang, Y.; Zhang, G.F.; Wen, S.Y.; Wang, C.S.; Xu, X.B.; et al. The vertical coseismic deformation field of the Wenchuan earthquake based on the combination of GPS and InSAR. In Proceedings of the FRINGE’15: Advances in the Science and Applications of SAR Interferometry and Sentinel-1 InSAR Workshop, Frascati, Italy, 23–27 March 2015; ESA Publication SP-731. European Space Agency (ESA): Paris, France, 2015; p. 281. [Google Scholar] [CrossRef]
- Wempen, J.M. Application of DInSAR for short period monitoring of initial subsidence due to longwall mining in the mountain west United States. Int. J. Min. Sci. Technol. 2020, 30, 33–37. [Google Scholar] [CrossRef]
- Ullmann, T.; Büdel, C.; Baumhauer, R.; Padashi, M. Sentinel-1 SAR Data Revealing Fluvial Morphodynamics in Damghan (Iran): Amplitude and Coherence Change Detection. Int. J. Earth Sci. Geophys. 2016, 2, 7. [Google Scholar] [CrossRef] [PubMed]
- Cigna, F.; Esquivel Ramírez, R.; Tapete, D. Accuracy of Sentinel-1PSI and SBAS InSAR displacement velocities against GNSS and geodetic leveling monitoring data. Remote Sens. 2021, 13, 4800. [Google Scholar] [CrossRef]
- Monserrat, O.; Barra, A.; Reyes, C.; Tomas, R.; Navarro, J.; Galve, J.P.; Solari, L.; Sarro, R.; Azañon, J.M.; Luque, J.A.; et al. ADATools for Persistent Scatterer Interferometry based displacement maps analysis: An example in Granada Province (Spain). In Proceedings of the EGU General Assembly 2021, Online, 19–30 April 2021. [Google Scholar] [CrossRef]
- Tzampoglou, P.; Ilia, I.; Karalis, K.; Tsangaratos, P.; Zhao, X.; Chen, W. Selected Worldwide Cases of Land Subsidence Due to Groundwater Withdrawal. Water 2023, 15, 1094. [Google Scholar] [CrossRef]
- Dura, T.; Chilton, W.; Small, D.; Garner, A.J.; Hawkes, A.; Melgar, D.; Engelhart, S.E.; Staisch, L.M.; Witter, R.C.; Nelson, A.R.; et al. Increased flood exposure in the Pacific Northwest following earthquake-driven subsidence and sea-level rise. Proc. Natl. Acad. Sci. USA 2025, 122, e2424659122. [Google Scholar] [CrossRef]
- Lu, C.; Zhu, L.; Li, X.; Gong, H.; Du, D.; Wang, H.; Teatini, P. Land Subsidence Evolution and Simulation in the Western Coastal Area of Bohai Bay, China. J. Mar. Sci. Eng. 2022, 10, 1549. [Google Scholar] [CrossRef]
- Papoutsis, I.; Kontoes, C.; Alatza, S.; Apostolakis, A.; Loupasakis, C. InSAR Greece with Parallelized Persistent Scatterer Interferometry: A National Ground Motion Service for Big Copernicus Sentinel-1 Data. Remote Sens. 2020, 12, 3207. [Google Scholar] [CrossRef]
- Thomas, A. Mapping of Surface Deformation Associated with the 5.2 Magnitude Stilfontein Earthquake of 3 April 2017 Using Sentinel-1 Data. Arab. J. Geosci. 2019, 12, 1784. [Google Scholar]
- Li, S.; Xu, W.; Li, Z. Review of the SBAS InSAR Time-series algorithms, applications, and challenges. Geodesy Geodyn. 2022, 13, 114–126. [Google Scholar] [CrossRef]
- Liu, J.; Hu, J.; Li, Z.; Ma, Z.; Wu, L.; Jiang, W.; Feng, G.; Zhu, J. Complete three-dimensional coseismic displacements due to the 2021 Maduo earthquake in Qinghai Province, China from Sentinel-1 and ALOS-2 SAR images. Sci. China Earth Sci. 2022, 65, 687–697. [Google Scholar] [CrossRef]
- Festa, D.; Novellino, A.; Hussain, E.; Bateson, L.; Casagli, N.; Confuorto, P.; Del Soldato, M.; Raspini, F. Unsupervised detection of InSAR time series patterns based on PCA and K-means clustering. Int. J. Appl. Earth Obs. Geoinf. 2023, 118, 103276. [Google Scholar] [CrossRef]
- Daout, S.; Jolivet, R.; Lasserre, C.; Doin, M.-P.; Barbot, S.; Tapponnier, P.; Peltzer, G.; Socquet, A.; Sun, J. Along-strike variations of the partitioning of convergence across the Haiyuan fault system detected by InSAR. Geophys. J. Int. 2016, 205, 536–547. [Google Scholar] [CrossRef]
- Shirzaei, M.; Freymueller, J.; Törnqvist, T.E. Measuring, modelling and projecting coastal land subsidence. Nat. Rev. Earth Environ. 2021, 2, 40–58. [Google Scholar] [CrossRef]
- Gao, G.; San, L.H.; Zhu, Y. Flood Inundation Analysis in Penang Island (Malaysia) Based on InSAR Maps of Land Subsidence and Local Sea Level Scenarios. Water 2021, 13, 1518. [Google Scholar] [CrossRef]
- European Environment Agency. Integrated Coastal Zone Management-European Environment Agency. 2000. Available online: https://www.eea.europa.eu/help/glossary/eea-glossary/integrated-coastal-zone-management (accessed on 10 July 2025).
- Bagheri, M.; Hosseini, S.M.; Ataie-Ashtiani, B.; Sohani, Y.; Ebrahimian, H.; Morovat, F.; Ashrafi, S. Land subsidence: A global challenge. Sci. Total Environ. 2021, 778, 146193. [Google Scholar] [CrossRef]
- Li, P.; Wang, G.; Liang, C.; Wang, H.; Li, Z. InSAR-Derived Coastal Subsidence Reveals New Inundation Scenarios Over the Yellow River Delta. IEEE J. Select. Top. Appl. Earth Observ. Remote Sens. 2023, 16, 8431–8441. [Google Scholar] [CrossRef]
- Department of Statistics Malaysia. Key Findings: Population and Housing Census of Malaysia 2020; Department of Statistics Malaysia: Putrajaya, Malaysia, 2020.
- Daud, S.; Milow, P.; Zakaria, R.M. Analysis of Shoreline Change Trends and Adaptation of Selangor Coastline, Using Landsat Satellite Data. J. Indian Soc. Remote Sens. 2021, 49, 1869–1878. [Google Scholar] [CrossRef]
- Marshall, C.; Large, D.J.; Athab, A.; Evers, S.L.; Sowter, A.; Marsh, S.; Sjögersten, S. Monitoring tropical peat related settlement using ISBAS InSAR, Kuala Lumpur International Airport (KLIA). Eng. Geol. 2018, 244, 57–65. [Google Scholar] [CrossRef]
- Julzarika, A. Land Subsidence Dynamics in Malaysia Based on Time-Series Vertical Deformation Using Modified D-InSAR Sentinel-1. Plan. Malays. J. 2023, 21, 325–340. [Google Scholar] [CrossRef]
- Lembaga Urus Air Selangor (LUAS). Integrated Coastal Management (ICM) and Integrated Coastal Use Zoning Plan (ICUZP) Negeri Selangor 2022–2023. 2023. Available online: https://www.luas.gov.my/ (accessed on 6 May 2025).
- Bhd, R.C.S. Review of National Water Resources (2000–2050) and Formulation of National Water Resources Policy: Final Report: August 2011; Kementerian Sumber Asli Dan Alam Sekitar Malaysia: Kuala Lumpur, Malaysia, 2011; Volume 3.
- Mridha, G.C.; Hossain, M.M.; Uddin, M.S.; Masud, M.S. Study on availability of groundwater resources in Selangor state of Malaysia for an efficient planning and management of water resources. J. Water Clim. Change 2020, 11, 1050–1066. [Google Scholar] [CrossRef]
- Simons, W.; Naeije, M.; Ghazali, Z.; Rahman, W.D.; Cob, S.; Kadir, M.; Mustafar, A.; Din, A.H.; Efendi, J.; Noppradit, P. Relative sea level trends for the coastal areas of Peninsular and East Malaysia based on remote and in situ observations. Remote Sens. 2023, 15, 1113. [Google Scholar] [CrossRef]
- Baig, M.F.; Mustafa, M.R.U.; Baig, I.; Takaijudin, H.B.; Zeshan, M.T. Assessment of Land Use Land Cover Changes and Future Predictions Using CA-ANN Simulation for Selangor, Malaysia. Water 2022, 14, 402. [Google Scholar] [CrossRef]
- de la Barreda-Bautista, B.; Ledger, M.J.; Sjögersten, S.; Gee, D.; Sowter, A.; Cole, B.; Page, S.E.; Large, D.J.; Evans, C.D.; Tansey, K.J. Exploring Spatial Patterns of Tropical Peatland Subsidence in Selangor, Malaysia Using the APSIS-DInSAR Technique. Remote Sens. 2024, 16, 2249. [Google Scholar] [CrossRef]
- Morishita, Y.; Lazecky, M.; Wright, T.J.; Weiss, J.R.; Elliott, J.R.; Hooper, A. LiCSBAS: An Open-Source InSAR Time Series Analysis Package Integrated with the LiCSAR Automated Sentinel-1 InSAR Processor. Remote Sens. 2020, 12, 424. [Google Scholar] [CrossRef]
- Bateson, L.; Novellino, A.; Hussain, E.; Arnhardt, R.; Nguyen, H.K. Urban development induced subsidence in deltaic environments: A case study in Hanoi, Vietnam. Int. J. Appl. Earth Observ. Geoinf. 2023, 125, 103585. [Google Scholar] [CrossRef]
- Zhao, Y.; Zuo, X.; Li, Y.; Guo, S.; Bu, J.; Yang, Q. Evaluation of InSAR Tropospheric Delay Correction Methods in a Low-Latitude Alpine Canyon Region. Remote Sens. 2023, 15, 990. [Google Scholar] [CrossRef]
- Haghshenas Haghighi, M.; Motagh, M. Treating Tropospheric Phase Delay in Large-scale Sentinel-1 Stacks to Analyze Land Subsidence. PFG 2024, 92, 593–607. [Google Scholar] [CrossRef]
- Lu, C.-H.; Ni, C.-F.; Chang, C.-P.; Yen, J.-Y.; Chuang, R.Y. Coherence Difference Analysis of Sentinel-1 SAR Interferogram to Identify Earthquake-Induced Disasters in Urban Areas. Remote Sens. 2018, 10, 1318. [Google Scholar] [CrossRef]
- Teixeira, A.C.; Bakon, M.; Perissin, D.; Sousa, J.J. InSAR Analysis of Partially Coherent Targets in a Subsidence Deformation: A Case Study of Maceió. Remote Sens. 2024, 16, 3806. [Google Scholar] [CrossRef]
- Tao, Q.; Ding, L.; Hu, L.; Chen, Y.; Liu, T. The performance of LS and SVD methods for SBAS InSAR deformation model solutions. Int. J. Remote Sens. 2020, 41, 8547–8572. [Google Scholar] [CrossRef]
- Yu, Z.; Zhang, G.; Huang, G.; Cheng, C.; Zhang, Z.; Zhang, C. SSBAS-InSAR: A Spatially Constrained Small Baseline Subset InSAR Technique for Refined Time-Series Deformation Monitoring. Remote Sens. 2024, 16, 3515. [Google Scholar] [CrossRef]
- Ziwen, Z.; Liu, Y.; Li, F. Land subsidence monitoring based on InSAR and inversion of aquifer parameters. J. Wirel. Commun. Netw. 2019, 2019, 291. [Google Scholar] [CrossRef]
- Du, Q.; Chen, D.; Li, G.; Cao, Y.; Zhou, Y.; Chai, M.; Wang, F.; Qi, S.; Wu, G.; Gao, K. Preliminary Study on InSAR-Based Uplift or Subsidence Monitoring and Stability Evaluation of Ground Surface in the Permafrost Zone of the Qinghai–Tibet Engineering Corridor, China. Remote Sens. 2023, 15, 3728. [Google Scholar] [CrossRef]
- Gemitzi, A.; Kopsidas, O.; Stefani, F.; Polymeros, A.; Bellos, V. A Constantly Updated Flood Hazard Assessment Tool Using Satellite-Based High-Resolution Land Cover Dataset Within Google Earth Engine. Land 2024, 13, 1929. [Google Scholar] [CrossRef]
- Parsian, S.; Amani, M.; Moghimi, A.; Ghorbanian, A.; Mahdavi, S. Flood Hazard Mapping Using Fuzzy Logic, Analytical Hierarchy Process, and Multi-Source Geospatial Datasets. Remote Sens. 2021, 13, 4761. [Google Scholar] [CrossRef]
- Gacu, J.G.; Monjardin, C.E.F.; Senoro, D.B.; Tan, F.J. Flood Risk Assessment Using GIS-Based Analytical Hierarchy Process in the Municipality of Odiongan, Romblon, Philippines. Appl. Sci. 2022, 12, 9456. [Google Scholar] [CrossRef]
- Zhran, M.; Ghanem, K.; Tariq, A. Exploring a GIS-based analytic hierarchy process for spatial flood risk assessment in Egypt: A case study of the Damietta branch. Environ. Sci. Eur. 2024, 36, 184. [Google Scholar] [CrossRef]
- Yin, J.; Zhao, Q.; Yu, D.; Lin, N.; Kubanek, J.; Ma, G.; Liu, M.; Pepe, A. Long-term flood-hazard modeling for coastal areas using InSAR measurements and a hydrodynamic model: The case study of Lingang New City, Shanghai. J. Hydrol. 2019, 571, 593–604. [Google Scholar] [CrossRef]
- Navarro-Hernández, M.I.; Valdes-Abellan, J.; Tomás, R. Analysing the Impact of Land Subsidence on the Flooding Risk: Evaluation Through InSAR and Modelling. Water Resour. Manag. 2023, 37, 4363–4383. [Google Scholar] [CrossRef]
- Vernaccini, M.; Poljansek, L. INFORM Index for Risk Management: Concept and Methodology Version 2017; Publications Office of the European Union: Luxembourg, 2017; Available online: https://drmkc.jrc.ec.europa.eu/inform-index/Portals/0/InfoRM/INFORM%20Concept%20and%20Methodology%20Version%202017%20Pdf%20FINAL.pdf (accessed on 11 July 2025).
- Affandi, E.; Ng, T.F.; Pereira, J.J.; Ahmad, F.; Banks, V.J. Revalidation Technique on Landslide Susceptibility Modelling: An Approach to Local Level Disaster Risk Management in Kuala Lumpur, Malaysia. Appl. Sci. 2023, 13, 768. [Google Scholar] [CrossRef]
- Raihan, A.; Pereira, J.J.; Begum, R.A.; Rasiah, R. The economic impact of water supply disruption from the Selangor River, Malaysia. Blue-Green Syst. 2023, 5, 102–120. [Google Scholar] [CrossRef]
- Yahaya, N.S.; Pereira, J.J.; Taha, M.R. Role of Local Level Stakeholders in Adapting to Emerging Natech Risks Due to Climate Change in the Selangor River Basin, Malaysia. 2024; preprint. [Google Scholar] [CrossRef]
- Yahaya, N.S.; Pereira, J.J.; Taha, M.R.; Yaacob, W.Z.W. Delineating potential sites for Natech due to climate change in the Selangor River Basin, Malaysia. Environ. Res. Commun. 2025, 7, 015006. [Google Scholar] [CrossRef]
- Russian, O.; Dawood, M.; Schuman, P.; Kelly, D. Case Study on the Collapse Potential of a Wharf Supported by Severely Deteriorated Steel Piles under Gravitational Loads. J. Perform. Constr. Facil. 2018, 32, 4018075. [Google Scholar] [CrossRef]
- Tang, Y.-Q.; Cui, Z.-D.; Wang, J.-X.; Lu, C.; Yan, X.-X. Model test study of land subsidence caused by high-rise building group in Shanghai. Bull. Eng. Geol. Environ. 2008, 67, 173–179. [Google Scholar] [CrossRef]
- Srivastava, A.; Goyal, C.; Jain, A. Review of Causes of Foundation Failures and Their Possible Preventive and Remedial Measures. In Proceedings of the 4th KKU–International Engineering Conference, (KKU-IENC2012), Khon Kaen, Thailand, 10–11 May 2012. [Google Scholar]
- Shen, Y.; Yin, J.; Zhu, D.-S.; Kumah, D.; Guo, W.; Hudu, A.A. Performance of a deep foundation pit supported by suspended piles in soil and rock strata: A case study. Arab. J. Geosci. 2021, 14, 2211. [Google Scholar] [CrossRef]
- Burbidge, M.C.; Burland, J.; Wilson, E.J. Settlement of foundations on sand and gravel. Ice Proc. 1985, 78, 1325–1381. [Google Scholar]
- Melville, B.W.; Coleman, N.L. Bridge Scour; FDOT Office Central Office: Tallahassee, FL, USA, 2000.
- Ahmed, M.F.; Halder, B.; Juneng, L.; Farooque, A.A.; Yaseen, Z.M. Remote sensing-based shoreline change investigation in Klang Coast and Langkawi Island towards sustainable coastal management. Geomat. Nat. Hazards Risk 2025, 16, 2493226. [Google Scholar] [CrossRef]
- Pfeffer, J.; Allemand, P. The key role of vertical land motions in coastal sea level variations: A global synthesis of multisatellite altimetry, tide gauge data and GPS measurements. Earth Planet. Sci. Lett. 2016, 439, 39–47. [Google Scholar] [CrossRef]
- Varrani, A.; Nones, M. Vulnerability, impacts and assessment of climate change on Jakarta and Venice. Int. J. River Basin Manag. 2017, 16, 439–447. [Google Scholar] [CrossRef]
- Harari, G.; Herbst, S. Confidence interval calculation for small numbers of observations or no observations at all. Harefuah 2014, 153, 289–291, 304, 303. [Google Scholar] [PubMed]
- Kulp, S.; Strauss, B.H. Global DEM Errors Underpredict Coastal Vulnerability to Sea Level Rise and Flooding. Front. Earth Sci. 2016, 4, 36. [Google Scholar] [CrossRef]
- Gesch, D.B. Best Practices for Elevation-Based Assessments of Sea-Level Rise and Coastal Flooding Exposure. Front. Earth Sci. 2018, 6, 230. [Google Scholar] [CrossRef]
- Hooijer, A.; Vernimmen, R. Global LiDAR land elevation data reveal greatest sea-level rise vulnerability in the tropics. Nat. Commun. 2021, 12, 3592. [Google Scholar] [CrossRef] [PubMed]
- Dusseau, D.; Zobel, Z.; Schwalm, C.R. DiluviumDEM: Enhanced accuracy in global coastal digital elevation models. Remote Sens. Environ. 2023, 298, 113812. [Google Scholar] [CrossRef]


Disclaimer/Publisher’s Note: The statements, opinions and data contained in all publications are solely those of the individual author(s) and contributor(s) and not of MDPI and/or the editor(s). MDPI and/or the editor(s) disclaim responsibility for any injury to people or property resulting from any ideas, methods, instructions or products referred to in the content. |
© 2025 by the authors. Licensee MDPI, Basel, Switzerland. This article is an open access article distributed under the terms and conditions of the Creative Commons Attribution (CC BY) license (https://creativecommons.org/licenses/by/4.0/).