Abstract
Battery-powered automatic guided vehicles (B-AGVs) serve as crucial horizontal transportation equipment in terminals and significantly impact the terminal transportation efficiency. Imbalanced B-AGV availability during terminal peak and off-peak periods is driven by dynamic vessel arrivals. We propose a flexible dual-threshold charging (FDTC) strategy synchronized with vessel dynamics. Unlike the static threshold charging (STC) strategy, FDTC dynamically adjusts its charging thresholds based on terminal workload intensity. And we develop a collaborative B-AGV scheduling and routing optimization model incorporating FDTC. A tailored Dijkstra-Partition neighborhood search (Dijkstra-Pns) algorithm is designed to resolve the problem in alignment with practical scenarios. Compared to the STC strategy, FDTC strategy significantly reduces the maximum B-AGV running time and decreases conflict waiting delays and charging times by 25.04% and 24.41%, respectively. Moreover, FDTC slashes quay crane (QC) waiting time by 40.78%, substantially boosting overall terminal operational efficiency.
1. Introduction
The increasing throughput of container terminals intensifies demands for operational efficiency [1], where automated guided vehicles (AGVs) critically influence overall performance as key horizontal transport equipment [2]. AGVs can be categorized into diesel-powered AGVs (D-AGVs) and B-AGVs based on the driving energy type. Compared to D-AGVs, B-AGVs offer lower maintenance, reduced energy costs, and environmental advantages [3], yet their extended energy replenishment time creates challenges for terminal operators in optimal charging decisions. Crucially, the timing of charging decisions directly impacts the quantity of available B-AGVs. Simultaneously, dynamic vessel arrivals cause container handling fluctuations, creating peak and off-peak processing periods. Consequently, an imbalance occurs, with a surplus of B-AGVs during off-peak hours and a shortage during peak hours because the quantity of B-AGVs at the terminal is generally fixed and cannot flexibly adapt to variations in operational volume. To synchronize available B-AGVs with terminal workload dynamics, we propose a flexible dual-threshold charging (FDTC) strategy to optimize B-AGV scheduling and routing, which improves the efficiency of terminal operations.
Compared to the constant charging threshold of STC strategy, FDTC strategy employs adjustable thresholds. Specifically, the STC strategy requires the B-AGV to start charging when the remaining current reaches a fixed threshold and complete charging when the specified energy replenishment level is reached [4]. In contrast, the FDTC strategy uses diverse charging thresholds to conduct charging tasks according to terminal workload, which causes variations in B-AGV operational and charging durations across different periods. Moreover, FDTC leverages off-peak charging capacity to extend operational continuity during peak hours, synchronizing available B-AGVs with terminal workload dynamics. Due to the nonlinear charging behavior of B-AGVs [5,6], applying the FDTC strategy helps curtail inefficient charging time. Optimizing the efficient interval of battery charging during peak hours and shifting inefficient charging to off-peak periods can effectively enhance the operating time of B-AGVs. Thus, how to formulate an FDTC strategy that incorporates nonlinear charging characteristics to enhance the B-AGV operational efficiency is the focus of this study.
The FDTC strategy directly influences B-AGV operational planning, which includes task scheduling and route planning, by determining charging decisions and available B-AGV quantities. Task scheduling must concurrently address both transportation and charging demands. As the FDTC strategy dynamically adjusts the charging threshold based on the container arrival scenario, it necessitates modifications to task endpoints. These endpoint alterations require route re-planning and may cause potential conflicts with other B-AGVs at specific nodes. Furthermore, fluctuations in the quantity of available B-AGVs significantly impact the plan. An excess of B-AGVs can increase congestion and waiting times within constrained operational environments [7]. Because the scale of B-AGV scheduling can vary, the fluctuations in charging thresholds present new challenges to the stability of scheduling methods. Hence, integrating the FDTC strategy with enhanced Automated Container Terminal (ACT) operational planning is essential for improving efficiency.
Considering dynamic vessel arrivals, this paper integrates battery charging nonlinear characteristics into the FDTC strategy to synchronize the available B-AGVs with fluctuations in terminal workload. And we solve the collaborative optimization of B-AGV scheduling and route under FDTC strategy. Key contributions include:
- (1)
- The FDTC strategy is proposed to adapt to the transition between peak and off-peak of dynamic arriving vessels.
- (2)
- A collaborative optimization model of B-AGV scheduling and route planning is established under the FDTC strategy.
- (3)
- A rule algorithm based on Dijkstra-Pns is designed to solve the problem in combination with the actual scenario.
The remainder of this study is organized as follows. Section 2 discusses the literature review. Section 3 describes the problem in greater detail. Section 4 presents the relevant mathematical optimization model under FDTC strategy. Section 5 proposes the Dijkstra-Pns algorithm to solve the model. Section 6 provides experimental proof of the model and algorithm. Finally, Section 7 asserts the conclusions.
2. Literature Review
Most existing studies on the charging of B-AGVs in automated terminals focus on static threshold charging strategies without considering the impact of battery charging constraints on the terminal operational efficiency [8]. Some researchers investigated the setting of charging thresholds [9,10] where thresholds were established to satisfy the minimum return-to-charging-station and transportation requirements. Singh et al. [11] proposed a fixed charging threshold to address the scheduling problem of large B-AGV fleets. Subsequently, some researchers adopted dynamic charging thresholds. For example, several studies have introduced machine-learning-enabled dynamic thresholds that adapt to real-time transportation demand [12,13]. Digital twin or machine-learning methods can support AGV scheduling decisions by predicting and monitoring AGV faults, maintenance, and charging during a specific time period [10,12,14], which optimized the scheduling plan for the current time period. Although these flexible approaches accommodate short-term transportation demand surges, they inherently create “missed charging time” that requires compensatory charging during subsequent operations. Some studies accounted for this “missed charging time” by suggesting to shift the B-AGV charging process to off-peak hours [15,16]. However, this approach primarily focused on reducing the energy procurement costs by transferring charging to a low-power consumption period instead of accounting for vessel arrival peaks. To address this “missed charging time” problem, this paper proposes an FDTC strategy that dynamically schedules charging tasks based on vessel arrivals and battery nonlinearity. The FDTC allows for a slight reduction in efficiency during certain periods to improve overall efficiency across multiple periods, maintaining sufficient charging during peak operations while prioritizing off-peak charging where feasible.
The B-AGV charging strategy directly affects the formulation of the operation plan, including task scheduling and route planning. Some researchers focused on the task scheduling of B-AGVs and primarily addressed decisions related to allocating transportation tasks to B-AGVs, responding to charging requests, and sequencing tasks among different requests [11]. Yu et al. [17] established a scheduling optimization model for the railway–water intermodal container automation terminal. Maurizio et al. [18] developed an exact heuristic solution of the multi-objective scheduling problem of AGV under battery constraints. These studies do not consider the congestion and waiting time of B-AGVs in the limited road space. Consequently, some scholars shifted their focus to conflict-free route planning for B-AGVs [19]. Some researchers examined the route planning of B-AGVs in conjunction with coordination facilities and proposed coordinated planning strategies based on the needs, energy consumption, and priorities of multiple components such as field bridges, quay cranes (QCs), and B-AGVs [20,21,22,23]. Others focused on innovative route planning strategies for B-AGVs and suggested novel approaches such as two-way routes and integrated fleets [24,25]. Meanwhile, some studies collaboratively analyzed both task scheduling and route planning, where two-stage stochastic programming models were often used [26,27]. While such phased approaches enhance the solving efficiency, they tend to treat task scheduling and route planning as separate processes, where route planning only occurs based on the premise of task scheduling. In reality, task scheduling and route planning often affect each other. This unidirectional approach fails to capture the bidirectional interaction between task scheduling and route planning, particularly the feedback effects of path conflicts on scheduling decisions. This paper proposes a collaborative optimization model for task scheduling and route planning of B-AGVs under the dual influence of path conflict and FDTC strategy. And the Dijkstra-PNS algorithm, a parallel decision-making method for task scheduling and route planning, is presented to solve the problem in a short period of time.
Table 1 summarizes a comprehensive review of the literature published related to B-AGV charging strategies, task scheduling, and route planning. The existing literature primarily focuses on the charging strategy and operation plan of B-AGVs in static environments. However, these studies generally did not consider the dynamic arrival of vessels and the impact of fluctuations in the number of available B-AGVs on the operational planning. Consequently, this paper proposes the collaborative optimization problem of the B-AGV charging strategy, based on nonlinear charging characteristics, with the dynamic arrival of ships. An integer programming is formulated to optimize the task scheduling, route planning, and corresponding charging strategies, which significantly enhances the terminal operational efficiency.

Table 1.
Summary of related literature.
3. Problem Description
This paper studies the B-AGV task scheduling and route planning problems during the unloading process of imported containers under FDTC strategy. As shown in Figure 1, when the vessel arrives at the terminal, berths are dynamically assigned by the vessel size via the First-Come First-Served principle. Each vessel is assigned QCs based on its size and the number of containers that it carries. Then, B-AGVs transport import containers from QCs to various buffer areas in yards via one-way driving routes. And yard cranes (YCs) are responsible for transferring the containers from the buffer area to the yard. After delivery, B-AGVs either return to QCs for new tasks or initiate charging based on the FDTC strategy.
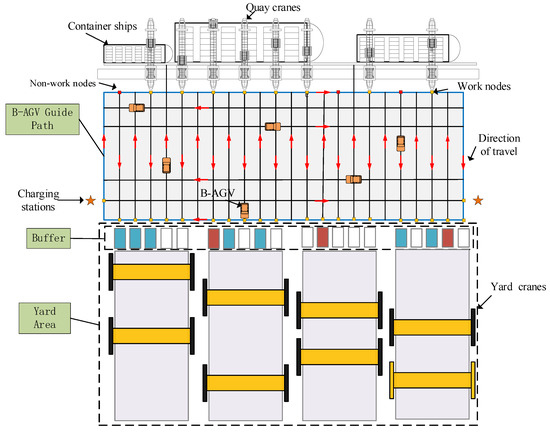
Figure 1.
Schematic diagram of the terminal layout.
During the unloading process of import containers, B-AGV task scheduling includes allocating and sequencing import container tasks, as well as determining charging start times and durations. Route planning defines specific transport paths for each container transport task, including intersection nodes and traversal order. Figure 2 and Figure 3 show the task scheduling and route planning processes. The B-AGV operational area is structured with a one-way route system and incorporates multiple parallel and perpendicular travel paths.
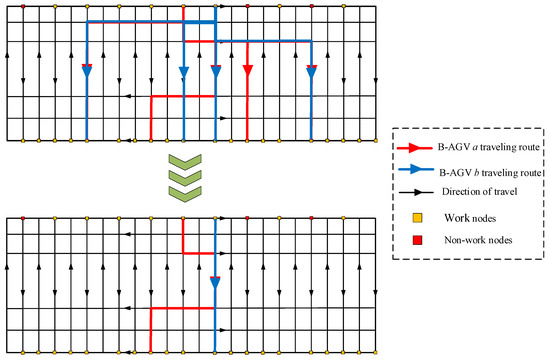
Figure 2.
B-AGV a and b task scheduling and route planning.

Figure 3.
B-AGV node conflict handling.
As shown in Figure 2, upon vessel berthing, import containers are transferred from QCs to B-AGVs. The B-AGV with minimal combined travel and wait time is assigned the transport task. Via comparative analysis of yard configurations, the optimal buffer area and transport path are determined. After defining initial routes and destinations, node conflicts are detected. The first B-AGV arriving at a conflicted node has priority, whereas later arrivals must either wait or reroute based on the waiting time and additional travel time required (Figure 3). After a B-AGV has completed the unloading task, the B-AGV proceeds to charging stations or returns to QCs, depending on whether the remaining battery falls below the charging threshold.
In summary, this paper discusses terminal operation peaks and off-peaks caused by varying vessel workload. Simultaneously, this paper develops an FDTC strategy that regulates B-AGV availability and charging decisions through state-based transitions and battery charging nonlinearity. The paper aims to minimize the maximum completion time of B-AGVs by concurrently optimizing task scheduling and route planning, thereby improving transportation efficiency. This paper addresses the following key decisions: (1) identifying peak and off-peak periods from container task volume and scheduling B-AGV charging timing and duration; (2) allocating transportation tasks to B-AGVs, responding to charging requests, and defining routes.
4. Mathematical Model
This study proposes the FDTC strategy, which adapts to the changes in the terminal peak and off-peak periods. The FDTC strategy is incorporated into the mathematical model as a charging constraint that influences the scheduling and route planning of B-AGVs. Specifically, under the constraints imposed by the FDTC strategy, the collaborative optimization model of B-AGV task scheduling and route planning is established to minimize the maximum running time of B-AGVs.
4.1. Flexible Dual-Threshold Charging (FDTC) Strategy
The terminal productivity [28], defined as the container throughput per QC operational period, determines whether the terminal is in a peak or off-peak state. If the productivity exceeds threshold value , the terminal is in peak state. Otherwise, it is off-peak. After each vessel has completed operation, the current and next terminal status are updated. By integrating the nonlinear charging behavior of B-AGV batteries [5] and predefined power parameters [29], we propose four terminal state transition scenarios and corresponding charging strategies:
Off-peak to off-peak (OPOP): During sustained off-peak state, B-AGV charging initiates below threshold and ceases at full charge.
Off-peak to peak (OPP): When the state transitions from off-peak to peak, B-AGV charging initiates if the battery level is below threshold and terminates upon reaching full capacity.
Peak to off-peak (POP): When the state transitions from peak to off-peak, B-AGV charging initiates if the battery level is below threshold and terminates upon reaching .
Peak to peak (PP): When the state transitions from peak to peak, B-AGV charging initiates if the battery level is below threshold of the optimal remaining power charging range, and the charging is terminated if the power reaches of the upper limit of the optimal remaining power charging range.
According to the current terminal production efficiency and the next period of the terminal production efficiency, we determine the charging threshold and charging time of the battery in the current period. Formula (1) indicates the change in charging threshold according to the terminal productivity. Formula (2) represents the constraint time of the battery under different strategies.
Figure 4 illustrates the variation in charging duration across different threshold combinations. When (, ) lie within the optimal charging range (State-of Charge ∈ [0, 0.7]), the required time for a particular ( − ) interval is 60% shorter than in other regions.
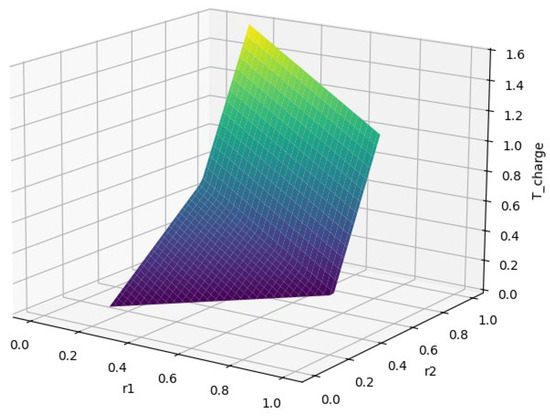
Figure 4.
Schematic diagram of charging formula.
This selective threshold combination adheres to three physical constraints:
- (1)
- Safety margin: > 0.15 (minimum State-of-Charge for station return)
- (2)
- Threshold ordering: > (strict inequality)
- (3)
- Efficiency bound: ≤ 0.7 (upper limit of fast-charging zone).
4.2. Model Assumption and Notation Definition
- (1)
- Only the unloading process of imported containers is considered.
- (2)
- Each B-AGV handles each container once time
- (3)
- The number of charging stations is sufficient.
- (4)
- The operational efficiency of the YC and QC is constant.
- (5)
- The movement of the YC and QC is not considered.
| Sets | |
| I | Set of import containers, i, |
| Set of import containers for vessel b, | |
| Set of containers that buffer h has completed at the current moment t,η | |
| Set of containers that QC q has completed at the current moment t, Ψ | |
| Set of containers that B-AGV a has completed at the current moment t, | |
| Set of B-AGVs, | |
| B | Set of vessel types, b |
| Q | Set of QC, |
| S | Set of charging stations, s |
| H | Set of yard buffers, h. |
| N | Set of path nodes, n,m |
| Set of virtual nodes, O,D | |
| Threshold set for the charging strategy, | |
| Parameter | |
| The distance between node n and m | |
| Time taken for B-AGV a to reach QC q to load the container i | |
| Time taken for B-AGV a to reach buffer h to complete the unloading of container i | |
| Time taken for B-AGV a to reach QC q through the charging station s to load the container i | |
| Waiting time for B-AGV a on the QC q to load the container i | |
| Waiting time for B-AGV a in the buffer h to complete the the unloading of container i | |
| Waiting time for B-AGV a on the QC q through the charging station s to load the container i | |
| B-AGV charging time at the charging station | |
| The moment when B-AGV a completed all the tasks | |
| The moment when B-AGV a arrives at the QC q to load the container i | |
| The moment when B-AGV a arrives at the buffer h to complete the unloading of container i | |
| The moment when B-AGV a arrives at the QC q through the charging station s to load the container i | |
| Operating time for the container from the vessel to the QC platform | |
| Operating time for the container from the QC platform to the B-AGV | |
| Operating time for the container from the buffer area to the yard | |
| Operating time for the container from the B-AGV to the buffer area | |
| Terminal productivity of period p | |
| Loading status of B-AGV, = 1 refers to container load and = 2 refers to empty load | |
| The moment when B-AGV a arrives at node n in status | |
| Time taken for the B-AGV to pass through the node in status | |
| Speed of B-AGV in status | |
| Waiting time for B-AGV a to complete the task of container i at node n in status | |
| Traveling time generated by changing the travel path during the execution task of container i. | |
| Remaining power for B-AGV a when completing the container i | |
| Threshold for charging demand generated by B-AGV | |
| Threshold for B-AGV to end charging | |
| Charging rate of high-speed charging | |
| Charging rate of low-speed charging | |
| Energy consumption coefficient per unit distance traveled without container loaded | |
| Energy consumption coefficient per unit distance traveled with container loaded | |
| Intermediate variables | |
| Equals to 1 if the QC q is assigned to the vessel b to unload the container i, 0 otherwise. | |
| Equals to1 if the B-AGV travels from node n to node m considering path conflict when performing the container task i, 0 otherwise. | |
| Equals to 1 if the B-AGV travels from node n to node m without considering path conflict when performing the container task i, 0 otherwise. | |
| Equals to 1 if the container i is traveled from node n to buffer h, 0 otherwise. | |
| Equals to 1 if the container i is traveled from buffer h to node n, 0 otherwise. | |
| Equals to 1 if the container i is traveled from node n to QC q, 0 otherwise. | |
| Equals to 1 if the container i is traveled from QC q to node n, 0 otherwise. | |
| Equals to 1 if the container i is traveled from node n to the charging station s, 0 otherwise. | |
| Equals to 1 if the container i is traveled from charging station s to node n, 0 otherwise. | |
| Equals to 1 if the B-AGV a arrives at the QC q from the virtual node O for loading the container i to yard buffer h, 0 otherwise. | |
| Equals to 1 if the B-AGV a unloading the container i from QC q to yard buffer h arrives at virtual node D, 0 otherwise. | |
| Decision variables | |
| Equals to 1 if the container i is operated by B-AGV a from the QC q to the buffer h, 0 otherwise. | |
| Equals to 1 if the container i is operated by B-AGV a from buffer h to the QC q, 0 otherwise. | |
| Equals to1 if the container i is operated by B-AGV a from the buffer h to the QC q through the charging station s, 0 otherwise. |
4.3. Model Formulation
To enhance the clarity of the model description, this study categorizes the operational process of B-AGVs into three sequential phases. Since B-AGVs carrying loads are prohibited from charging, the process is structured as follows:
Phase I: Movement from the quay crane (QC) to the yard buffer area. This phase includes the operational part within the yard buffer area. The symbol represents the running time of Phase I, and the calculation process is shown in Appendix A.1.
Phase II: Return from the yard buffer area to the QC for the next task. This phase includes the operational part within the QC. The symbol represents the running time of Phase II, and the calculation process is shown in Appendix A.2.
Phase III: Detour via the charging station before returning to the QC (for empty B-AGVs only) for the next task. This phase includes the charging process at the charging station and the operational parts within QC. The symbol represents the running time of Phase III, and the calculation process is shown in Appendix A.3.
Considering the operation process, a collaborative optimization model for B-AGV scheduling and route planning that incorporates the FDTC strategy is developed to minimize the maximum B-AGV running time. The objective function is shown as Formula (3). And the running time, including the time of the three phases mentioned above, is shown as Formula (4).
Formula (4) decomposes the total running time into three phase-specific components, which is corresponding to the three phases mentioned above.
The above B-AGV operation process is subject to task assignment constraints, decision continuous constraints, battery charging constraints, route continuity constraints, and route conflict constraints.
- (a)
- Task assignment constraints are shown as follows:
- (b)
- Decision continuous constraints are shown as follows:
- (c)
- Battery charging constraints are shown as follows:
- (d)
- Route continuity constraints are shown as follows:
- (e)
- Route conflict constraints are shown as follows:
- (f)
- Decision variables are shown as follows:
Notes: Formulas (5)–(7) indicate that the imported containers complete unloading operation. Formula (8) indicates that each task is assigned to each QC B-AGV and yard buffer. Formulas (9) and (10) indicate upon achieving task completion at a particular node, the B-AGV is necessitated to depart through the same node. Formula (11) indicates the start with a virtual node. Formula (12) indicates the end with a virtual node. Formula (13) indicates that the remaining charge updates the constraint. Formulas (14)–(16) determine whether the remaining battery level of the B-AGV requires charging. Formulas (17)–(19) indicate the flow balance from QC q to buffer h. Formulas (20)–(22) indicate the flow balance from buffer h to QC q. Formulas (23) and (24) indicate the flow balance of charging station. Formula (25) indicates the balance of inflow and outflow for each node in the road network. Formula (26) indicates the time constraint for reaching each node. Formula (27) indicates the waiting time of B-AGV at the conflict node. Formula (28) indicates the additional time required to switch routes after a conflict occurs. Formulas (29)–(31) define the range of decision variables.
4.4. Model Solution
In this section, the results of the numerical experiment are presented to evaluate the accuracy of the proposed model. For this performance evaluation, the developed mathematical model is coded through PyCharm Community Edition 2023.2.1 and solved using GUROBI 11.0.3 solver. The processor has four physical cores and eight logical processors and can use up to eight threads. The solution is executed in a terminal operation scenario, where a QC unloads containers, two buffer areas receive them, and one charging station is responsible for charging the B-AGVs.
As shown in Table 2, the Gurobi solver yields solutions consistent with empirical operational data. However, the Gurobi solver exhibits the following limitations:

Table 2.
Results of Gurobi solver.
- (1)
- The Gurobi solver has relatively large memory requirements and a slow computation speed, which limits its ability to solve large-scale cases with complex road network configurations. When the number of containers requiring unloading reaches 15, the Gurobi solver fails to produce a solution due to excessively long computation time.
- (2)
- The results indicate that when the number of unloaded containers cannot be evenly distributed among the B-AGVs or when excessively many B-AGVs are available for assignment, the solution time substantially increases. Except when containers are evenly distributable in Case 1, solution times for evenly distributable containers in other cases are significantly shorter than for non-distributable scenarios. Comparing Case 3 and Case 2, when the number of B-AGVs is 2, the required solution time paradoxically decreases despite an increase in the number of containers needing unloading.
However, due to the small scale of the cases, the container volume does not capture the fluctuations between peak and off-peak periods. Consequently, the advantages of the FDTC strategy are not fully realized in this static setting. Additionally, considering the limitations of Gurobi in solving large-scale cases, this paper proposes the Dijkstra-Pns algorithm to solve dynamic, large-scale container unloading scenarios.
5. Dijkstra-Pns Algorithm
In this section, the Dijkstra-Partition neighborhood search (Dijkstra-Pns) algorithm is designed to obtain a near-optimal solution for the proposed B-AGV scheduling and routing optimization problem.
5.1. Theory of the Dijkstra-Pns Algorithm
The Dijkstra-Pns algorithm is a rule algorithm that combines Dijkstra and Partition neighborhood search. Dijkstra’s algorithm is a path-finding algorithm, which demonstrates strong optimization performance in the scenario of a fixed road network at the terminal. This paper divides potential solutions into multiple regions by Partition neighborhood search algorithm. And then local optima within each region are identified by Dijkstra’s algorithm. Finally, the global optimum is determined from these local solutions. By minimizing unnecessary comparisons between candidate paths, this approach significantly accelerates computation. Each candidate solution in this framework is derived from Dijkstra-based decision paths. To optimize the process, the Dijkstra-Pns algorithm minimizes repeated calculations for the same starting and ending points. The flowchart of the algorithm is shown in Figure 5.
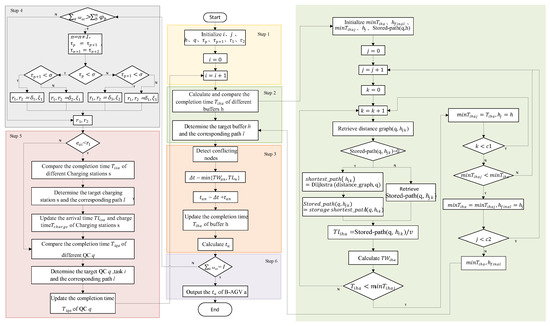
Figure 5.
The flowchart of the Dijkstra-Pns algorithm.
Figure 5 illustrates the single B-AGV scheduling process. As shown in Figure 5, Dijkstra’s algorithm is utilized to efficiently compute the shortest path from the QC to the yard for the B-AGV. By incorporating the operational process and relevant parameters of the B-AGV, the algorithm calculates the traveling time and waiting time and combines them to determine the total running time required to reach the target location.
Meanwhile, the partitioned neighborhood search method divides the entire area into blocks, selects the optimal objective within each block, and then identifies the global optimal objective among these local optima. This approach significantly reduces the number of iterations, speeds up the solution process, and ensures high-quality results.
To enhance computational efficiency, the initial path generated by the Dijkstra algorithm is stored, eliminating the need for repeated calls to Dijkstra when the same situation arises. The Dijkstra-Pns algorithm combines the strengths of both Dijkstra’s algorithm and the partitioned neighborhood search to achieve efficient and accurate task scheduling and route planning.
5.2. Steps of Dijkstra-Pns Algorithm
Based on the flowchart of the Dijkstra-Pns algorithm, the detailed steps are shown as follows.
Step 1: Initialize the parameters.
Input the initial parameters, including the set I, , Q, H, S, , and N. And input the terminal productivity and . Go to Step 2.
Step 2: Calculate the initial route l for B-AGV a to perform task i, which is the same as Phase I.
First, B-AGV a is initially randomly assigned to QC q for task i. Then, the shortest route from the QC q to each yard buffer h of different yard blocks is generated by Dijkstra’s algorithm. Meanwhile, calculate the time required to complete Phase I. And the buffer h with shortest duration is the optimal buffer h and initial route l. Go to Step 3.
The regional target and route search pseudocode for Step 2 is shown in Algorithm 1 below.
| Algorithm 1 Regional Target and Route Search: |
| 1: = M 2: = null 3: stored_path(q,h) = 0 4: for set in {, , , }: 5: min = M 6: = null 7: for in : 8: distance_graph = retrieve distance graph () 9: if stored_path(q, ) = 0 10: shortest_path(q, ) = Dijkstra(distance_graph, q) // constraint (19)–(25) 11: stored_path(q, ) = shortest_path(q, ) 12: else 13: shortest_path(q, ) = retrieve stored_path(q, ) 14: = shortest_path (q, )/v 15: satisfies constraint (A3) 16: = + // constraint (A1)–(A4) 17: if < min: 18: min = 19: = h 20: end for 21: if min < min: 22: min = min 23: = 24: end for 25: Determine = 1 |
Step 3: Calculate the completion time of B-AGV in Phase I.
After the initial route is determined, the time for B-AGV a to arrive at each node in the initial route is generated . Check for conflicting nodes. If conflict nodes exist, generate waiting time and the selection of the secondary route to generate the additional time , update . Choose the shortest method to generate the final route l and completion time . Go to Step 4.
Step 4: Update the charging threshold.
When , update the number of vessels operating, terminal productivity in the current state and terminal productivity in the next state, and the upper and lower limits of the charging threshold . Go to Step 5.
Step 5: Make the decision for B-AGV a to proceed with the next task (Phase II or Phase III).
When , B-AGV a will continue to the next task (Phase II). The shortest route for B-AGV a to reach QC q is determined by Dijkstra’s algorithm. Then, calculate the time required to complete Phase I. And the QC q with shortest duration is the optimal QC q and route l. Thus, the next transportation task is determined.
When , B-AGV a perform the charging task (Phase III). A nearby charging station and optimal route are determined by Dijkstra. Same as Phase II, generate the total time for B-AGV to move from the charging station to QC. Go to Step 6.
Step 6: Judge whether the transportation task is completed.
Calculate the time of B-AGV a to complete the task. When < I, proceed to Step 4, otherwise, output the running time of the B-AGV.
5.3. Case Study
In order to verify the effectiveness and accuracy of the algorithm, the same cases in Section 4.4. are solved by the Dijkstra-Pns algorithm. And the results are compared with those obtained by the Gurobi solver. The results are in Table 3.

Table 3.
Cases result from Gurobi and Dijkstra-Pns.
As shown in Table 3, the following conclusions are obtained:
- (1)
- For the same number of containers, the larger the number of B-AGVs, the shorter the time. This is mainly due to the increased number of B-AGVs operating simultaneously.
- (2)
- For the same number of B-AGV, the larger the number of containers, the longer the time. Because the increase in the number of containers has affected the operation time.
- (3)
- The Gap between Gurobi solver and Dijkstra-Pns algorithm is smaller, which the maximum running time of B-AGVs can be accurately solved. The error is mainly due to the accumulation of random numbers.
6. Numerical Experiments
In this section, the numerical examples are developed to verify the accuracy of the model and the effectiveness of the algorithm. The model framework of solving numerical experiments includes two integrated components: (1) a ship generation module that simulates dynamic vessel arrivals through Poisson distribution while automatically allocating berths and quay cranes according to configurable rules, generating the necessary input data; and (2) the scheduling module employs the enhanced Dijkstra-Pns algorithm to coordinately optimize both B-AGV task scheduling and route planning, efficiently accomplishing container unloading operations from QCs to buffer areas.
6.1. Experimental Settings
The actual operating conditions of Qingdao Qianwan port are used as parameters, and the system configuration in the experiments is consistent with Figure 1. The distances between different positions in the port, the layout of the port, the operation time, the energy consumption, and movement speed of the equipment are obtained from Qingdao Qianwan port [24,25]. Moreover, the charging station is located on both sides of the yard. And the charging efficiency interval and charging rate are set according to the existing literature [30]. The STC strategy has a charging range of 0.3~1 [4]. Table 4 shows the values of the parameters are provided.

Table 4.
Parameter setting.
In Table 4, terminal productivity σ is the median value determined by the simulated vessel data. In the actual scenario, the appropriate value should be selected based on the vessel arrival scenario. In order to describe the scenario, we referred to the literature to analyze the arrival of vessels [4].
First, the vessels are generated
The types of vessels, defined as k, are divided into three categories according to their sizes: small, medium, and large. Table 5 summarizes the vessel size–volume distribution characteristics.

Table 5.
Vessel-type dimensions.
The average annual arrival rate of these vessels is determined based on the percentage of vessels and the proposed expected annual throughput. Define the average volume of type k as , and the proportion of vessels is . Define μ as the global annual arrival rate of the vessel, Then
Define as the corresponding annual average arrival rate of the k-type vessel. Then, .
Then, calculate the distribution of arrival time for k-type vessels
In the simulation model, we assumed that the vessel arrival events were independent and that the vessel arrival interval [31] obeyed the Poisson distribution. The negative exponential probability distribution of the arrival time for k-type vessels [32] can be calculated as follows:
Finally, allocated the different number of QC to arrived vessels
When the vessel arrives at the berth, the terminal allocates a certain number of QC based on the size of vessel and the quantity of the containers. Table 6 shows the specific arrangements [4]. As shown in Table 5, ships of different sizes have different container loading settings. Where no valid size–container combination exists of ship size type and container number, the corresponding table is “-“.

Table 6.
Number of allocated QC for vessels.
From Table 6, we can obtain the allocated number of QC according to the size of vessel and quantity of containers. For example, if the vessel is a small vessel and the quantity of containers is less than 1000 TEUs, the number of assigned QC is 2. The allocation method is similar in other scenarios.
6.2. Solution of Numerical Experiments
This work focuses on import containers that arrive at the terminal in a specified time window as the research subject. The simulation was conducted using PyCharm Community Edition 2023.2.1; the computer specifications included a CPU operating at 2.20 GHz and 64 GB of memory. In order to verify the effectiveness of the FDTC strategy, the FDTC strategy is compared with the STC strategy.
6.2.1. Comparison of Threshold Setting
This paper simulates 10 vessels that arrived at the terminal for unloading operations and unloaded 20,889 containers. Figure 6 depicts the number of containers (peak and off-peak) of a terminal vessel as a function of the operational period.
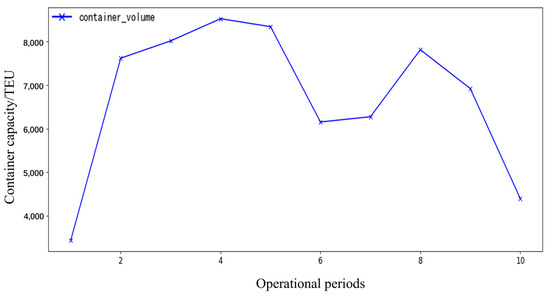
Figure 6.
The number of containers for different operational periods.
The abscissa represents the operational periods of the terminal. When the QCs complete the unloading task of the current operating vessel and start to unload the next vessel, the operation periods of the horizontal axis are progressive. The ordinate represents the container that needs to be unloaded in the corresponding period.
Figure 6 defines operational periods by active unloading vessel combinations. The container operation volume is not equal to the number of containers unloaded by the vessel but is equal to the total number of containers that must be unloaded by the operating vessel. For example, if vessels A, B, and C are simultaneously unloaded, then the container operation volume of Period 1 is the total number of containers that must be unloaded by vessels A, B, and C. When C completes the unloading first, the unloading vessels will become A, B, and D, and the container operation volume of Period 2 will become the sum of the unloading containers required by the three. The number of containers that vessels A and B must unload will not decrease due to the operations in Period 1.
In this study, five FDTC strategies are defined by varying the charging time intervals for B-AGVs during peak and off-peak hours. Table 7 presents the specific charging threshold settings for different FDTC strategies. The principle of setting is to enlarge or shrink the difference between single charging time of B-AGV during peak hours and off-peak hours. All strategies follow the principle of long charging time during off-peak hours and short charging time during peak hours. Figure 7 shows the difference in maximum running time of B-AGV between five FDTC strategies and the STC strategy. Based on this comparison, the optimal FDTC strategy is identified.

Table 7.
Flexible dual threshold setting.
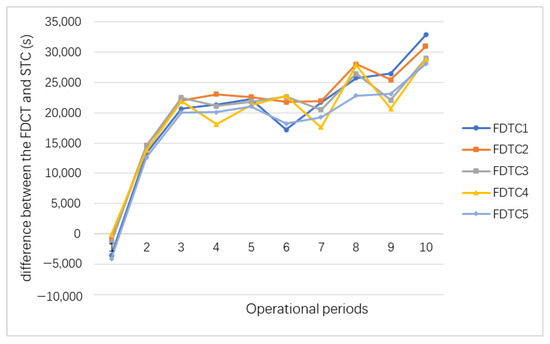
Figure 7.
The time of optimization of different FDTC strategies compared to STC.
From Figure 7, the conclusions outlined below can be deduced.
- (1)
- The difference between the FDTC and STC strategies exhibits an overall cumulative trend, albeit with fluctuations. This indicates that the FDTC strategy is generally superior to the STC strategy, yet at certain stages, the STC strategy proves more effective. The specific reasons for the fluctuations will be explained in detail in the following case analysis.
- (2)
- In the FDTC 1 strategy, the difference between peak and off-peak charging time settings of B-AGV is the median among the five strategies, which shows the best effect and saves over 9 h.
6.2.2. Results of Numerical Experiments
Table 8 shows the results of the examples under FDTC1. The container operation volume is the total number of containers that must be unloaded by the vessel operating at the berth. The number of containers that must be unloaded by each vessel is constant and will not be reduced by the number of operations completed in the previous period. Table 9 shows the total results of under the FDTC strategy and the STC strategy.

Table 8.
Comparison results under the FDTC strategy and STC strategy.

Table 9.
Total results under the FDTC strategy and the STC strategy.
- (1)
- Table 9 shows that the running time has been reduced from 69.37 h to 60.25 h, a decrease of 13% comparing STC and FDTC. On average, the running time required for each B-AGV to complete a single container unloading task decreases from 7.97 to 6.92 min, with a reduction rate of 13.17%.
- (2)
- Using the characteristics of nonlinear charging, the charging time in the task cycle decreases from 21.34 h to 16.13 h, i.e., a decrease of 24.41%.
- (3)
- By adjusting the quantity of B-AGVs during peak and off-peak periods, we reduce the conflict congestion of B-AGVs in the yard, QCs, and routes. The conflict congestion delay decreases from 10.10 h to 7.57 h, i.e., a decrease of 25.04%.
- (4)
- Starting from the overall operation of the terminal, increasing the quantity of B-AGVs during peak hours helps reduce the waiting time of QCs for B-AGVs. The average waiting time of each QC decreases from 18.07 to 10.70, i.e., a 40.78% decrease of 7.37 h.
To clearly illustrate the relation vessel between peak and off-peak operating periods with operation time, we will add the ordinate axis of Figure 6 to each image in Figure 8, Figure 9, Figure 10 and Figure 11.
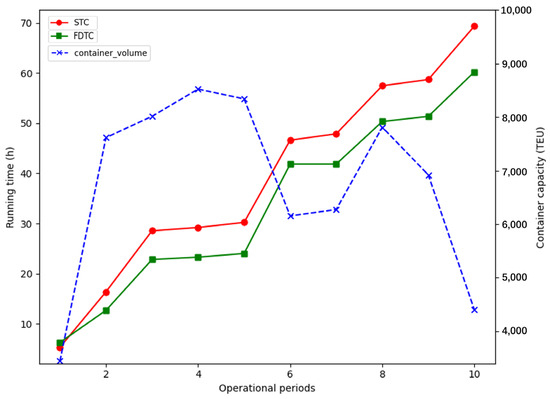
Figure 8.
Number of operating containers and running time of B-AGVs.
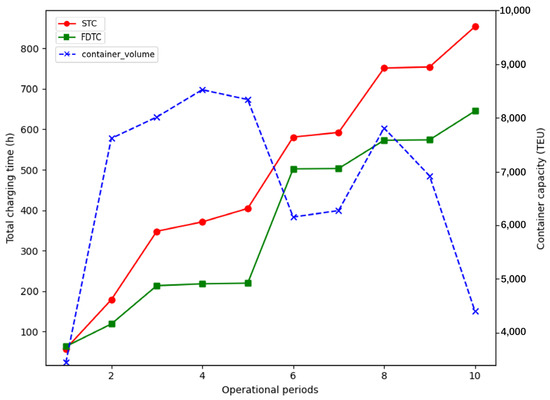
Figure 9.
Number of operating containers and total charging time of all B-AGVs.
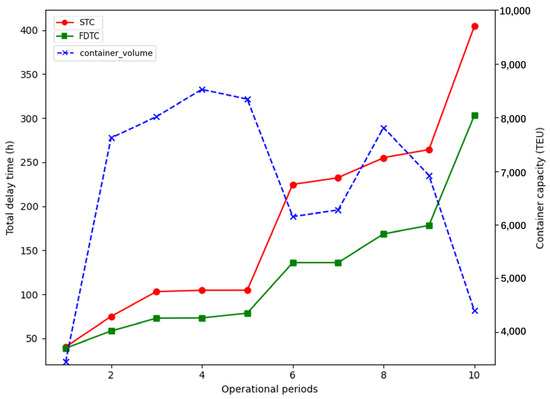
Figure 10.
Number of operating containers and total delay time of all B-AGVs.
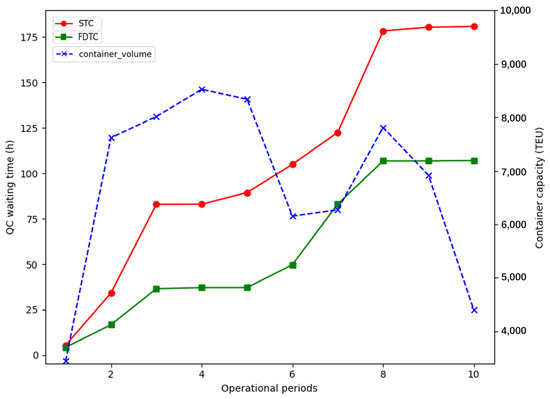
Figure 11.
Number of operating containers and QC waiting time.
This paper analyzes the numerical changes of each state of the total running time of a B-AGV, as shown in Figure 8, to show the changes of each indicator in the entire operation process in more detail.
Figure 8 depicts the relation between the maximum B-AGV running time and the operating period under static and flexible strategies. The ordinate is the maximum running time of the B-AGVand container capacity.
From Figure 8, the following conclusions are obtained.
(1) The running times of FDTC and STC strategies maintain similar trends, but a significant divergence emerges in Period 2. The transition from Period 1 to Period 2 belongs to OPP. The reasons for the discrepancy from Period 2 are as follows.
First, in the scenario of fewer operating containers, fewer available B-AGVs can help reduce the occurrence of conflict congestion. In Period 1, the charging time of B-AGVs increases, and the number of available B-AGVs decreases. In the scenario of small container operation, there are fewer nodes for QC operation. Under the FDTC strategy, fewer B-AGVs can satisfy the transportation needs of the QC operation node and not be prone to waiting conflicts and delays at the QC node. Due to the decrease in delay time, although the charging time of the FDTC strategy significantly increases (as shown in Table 8), the running time of B-AGV under the FDTC strategy is only 1.01 h longer than that under the STC strategy.
Second, increasing B-AGV charging times during the off-peak period helps reduce the running time during peak period. Based on the increase in charging time in Period 1, the charging time in Period 2 decreases, the operation time of the B-AGV extends, and the total time required to unload the container decreases.
(2) As shown in Figure 6, the gap between FDTC strategy and STC strategy does not constantly increase and even narrows in Period 6 because Periods 5–6 belong to the POP. The POP strategy is used to extend the operation time during peak hours, and the missing charging time must be supplemented in the off-peak period, which decreases the gap between FDTC and STC. Extending the operation time of B-AGVs during peak hours to reduce the waiting behavior of the QC cannot be reflected in the total running time of B-AGV, which will be discussed in detail in the following QC waiting time.
6.2.3. Analysis of Numerical Experiments
To further analyze the difference in B-AGV running time caused by FDTC and STC, this paper analyzes the two components comprising the B-AGV running time: the charging time of B-AGV and the delay time of B-AGV. Meanwhile, this work analyzes the numerical changes in various periods of the total QC operation time, highlighting the performance of the FDTC strategy during peak periods.
Figure 9 shows the total charging time of all B-AGVs as a function of the container quantity status of the terminal operating vessel (terminal operation peak and off-peak), respectively. The ordinate is the cumulative charging time of all B-AGVs and container capacity in the current period.
(1) The total delay time of the B-AGV follows the same trend as the running time. In Period 1, FDTC is not better and even worse than STC, but the advantage of FDTC becomes obvious from Period 2.
In Period 1, the charging time of B-AGV running under the FDTC strategy is longer compared with the STC strategy. Periods 1 and 2 belong to the OPP. In Period 1, the B-AGVs increase charging times to satisfy the transportation demand during peak hours. The charging time of the FDTC strategy is 5.79 h longer than that of the STC strategy.
The FDTC strategy outperforms the STC strategy in terms of performance due to its higher charging efficiency during peak hours. Periods 2, 3, and 4 belong to the PP. The charging threshold is set in the efficient charging interval, which results in less charging time required for the same amount of electricity. Under the FDTC strategy, the increase in charging time during peak hours significantly slows.
(2) The charging time missed during peak hours is supplemented during off-peak periods. By the end of period 4, the residual power of B-AGVs under the FDTC strategy is lower overall than that under the STC strategy. Periods 5 and 6 constitute the POP phase. In Period 5, the lower and upper limits of the charging threshold decrease, which enabled the B-AGVs to maintain low power levels and delay charging operations. Consequently, the gap in residual power further increases and must be compensated during period 6, which sharply increases the total charging time, as shown in Period 6.
Figure 10 shows the total charging time and total delay time of all B-AGVs as a function of the container quantity status of the terminal operating vessel (terminal operation peak and off-peak), respectively. The ordinate is the time of conflict delay for all B-AGVs and container capacity in the current period.
Compared with the STC strategy, the growth in delay time of B-AGVs will be significantly reduced after peak hours under the FDTC strategy. In Period 6, the number of available B-AGVs is reduced by compensating for the missing charging time under the FDTC strategy. The number of available B-AGVs under the FDTC strategy decreased as the number of containers that need to be unloaded decreases. This relationship is conducive to reducing conflicts and waiting delays based on satisfying transportation.
Figure 11 shows the change in waiting time for the QC with the number of containers (terminal operation peak and off-peak) of the vessel operating at each period. The ordinate is the waiting time for the QC.
Compared with the waiting time of the QC under the STC strategy, the waiting time of the QC under the FDTC strategy changes more gradually. The significant gap between FDTC and STC is from the conversion of periods 2–3 and 7–8. Periods 2–3 belong to the PP. Periods 7–8 belong to the OPP. The FDTC strategy reduces the quantity of B-AGVs in the off-peak period and increases the quantity of B-AGVs during peak hours. During peak hours, the quantity of QCs increases, and the quantity of available B-AGVs also increases, which decreases the waiting caused by the insufficient quantity of B-AGVs.
6.3. Comparison of Numerical Experiments
To verify the stability of the model, multiple groups of comparative experiments are performed, and Table 10 shows the results.

Table 10.
Comparison of multiple sets of static and flexible policies.
Table 10 depicts five cases. Compared with the STC strategy, the FDTC strategy effectively reduces the running time, charging time, and delay time of the task cycle.
Due to the limited number of charging opportunities for B-AGVs, larger container operations result in more charging cycles, which amplifies the impact of the FDTC strategy in reducing running time, as observed in Case 1 and Case 3. In Case 1, the number of containers at the terminal increases by 6937 TEUs compared to Case 3. As a result, Case 1 saves 9.12 h, whereas Case 3 saves 4.9 h. Extended task cycles amplify the strategy’s efficacy of adopting the FDTC strategy.
The effectiveness of the flexible strategy may be influenced by the change in container operation volumes during peak and off-peak periods, particularly the difference in the number of active QCs. As shown in Cases 4 and 5, the number of unloaded containers significantly decreases by 2032 TEU. However, the FDTC strategy proves less effective in terms of average delay time and average QC waiting time. In Case 4, the average delay time is 11.56 h; in Case 5, it is 15.25 h. The average QC waiting time in these cases is 6.07 and 6.35 h, respectively. This efficacy reduction stems from the decrease in the number of QCs. According to the QC distribution rules, when the container volume decreases, the number of operational QCs also decreases, which results in a 0.6 h increase in average delay time under the STC strategy. For the flexible strategy, the vessel scale is reduced, and the number of QCs in operation is less differentiated from off-peak hours. As a result, the available resources that can be dispatched and utilized diminish, which reduces the effectiveness of the “peak shaving and valley filling” approach.
7. Conclusions
Addressing dynamic vessel arrivals, this paper develops a Flexible Dynamic Threshold Charging (FDTC) strategy that leverages battery charging nonlinearity to maintain B-AGV availability aligned with unloading workload fluctuations. An integer programming model is formulated to optimize both task scheduling and route planning simultaneously. And the Dijkstra-Pns algorithm is designed considering the actual operational environment.
The results show that the FDTC strategy effectively reduces the total operational cycle time, primarily by reducing delay and charging times. It minimizes the conflict and waiting times of B-AGVs at QC and route nodes, particularly when there are fewer QCs available. Additionally, by extending the charging time during off-peak hours, the strategy enhances the running time during peak hours, thereby meeting the transportation demand. The FDTC strategy, when combined with the nonlinear charging characteristics of the battery, allocates more charging time during off-peak periods, improving the utilization efficiency of B-AGVs. However, the effectiveness of the FDTC strategy is influenced by the difference in container operation volumes between peak and off-peak periods and the number of QCs available.
As future work, a more precise threshold setting for each off-peak and peak FDTC strategy could be developed, taking into account variations in the number of QCs and container operations across different time periods. This adjustment may lead to even more optimized results. Moreover, comparative evaluation of machine-learning-based methods for AGV task assignment or energy optimization is also a promising future research direction.
Author Contributions
Conceptualization, W.G. and H.H.; methodology, W.G. and H.H.; software, W.G. and H.H.; validation, H.H.; formal analysis, W.G. and M.S.; investigation, W.G. and H.H.; resources, M.S.; data curation, H.H., J.L. and X.Y.; writing—original draft preparation, H.H.; writing—review and editing, W.G. and M.S.; visualization, H.H.; project administration, W.G. and M.S.; funding acquisition, W.G. All authors have read and agreed to the published version of the manuscript.
Funding
This study was funded by the Shanghai Sailing Program (23YF1416500).
Data Availability Statement
The data will be made available on reasonable request.
Conflicts of Interest
The authors declare no conflicts of interest.
Abbreviations
The following abbreviations are used in this manuscript:
| ACT | Automated Container Terminal |
| B-AGV | Battery-powered automatic guided vehicle |
| D-AGV | Diesel-powered automatic guided vehicle |
| QC | Quay crane |
| YC | Yard crane |
| FDTC | Flexible dual-threshold charging |
| STC | Static threshold charging |
| Dijkstra-Pns | Dijkstra-Partition neighborhood search |
Appendix A
Appendix A.1
Phase I: Running time of a B-AGV from the QC to the yard buffer area
The running time of B-AGV from a QC to a buffer consists of two parts: time to reach a buffer and waiting time at that buffer. Generate two types of task completion times: time with path conflicts and time without path conflicts.
Formula (A1) indicates that without considering the route conflict, B-AGV a goes to buffer h for unloading the task i and must complete the three parts of operation: driving, unloading, and waiting. Formula (A2) indicates the arrival time of B-AGV a to buffer h for unloading task i, considering the route conflict. Equation (A3) indicates the waiting time required in buffer h for unloading task i onto the buffer, including queuing waiting time and operational waiting time, considering route conflicts. Formula (A4) indicates the time required to complete Phase I of task i, considering the route conflict.
Appendix A.2
Phase II: Running time of a B-AGV from the yard buffer area to the QC
The running time of B-AGV from a buffer to a QC consists of two parts: time to reach a QC and waiting time at that QC. Generate two types of task completion times: time with path conflicts and time without path conflicts.
Formula (A5) indicates that without considering the route conflict, B-AGV a goes to QC q for undertake task i and must complete three parts of the operation: driving, waiting, and loading operations. Formula (A6) indicates the arrival time of B-AGV a to QC q for undertake task i, considering the path conflict. Equation (A7) indicates the waiting time required in QC q for loading task i onto the B-AGV a, including queuing waiting time and operational waiting time, considering route conflicts. Formula (A8) indicates the time required to complete Phase II of task I, considering the route conflict.
Appendix A.3
Phase III: Running time of a B-AGV from a yard buffer return to the QC via the charging station
The running time of B-AGV from a buffer through a charging station to a QC consists of three parts: charging time at a charging station, time to reach a buffer, and waiting time at that buffer. Generate two types of task completion times: time with path conflicts and time without path conflicts.
Formula (A9) indicates that without considering the route conflict, a B-AGV goes to QC q after charging to undertake the four parts of the time required for task i: driving, waiting, loading, and charging. Formula (A10) indicates the arrival time of B-AGV a to QC q after charging to undertake task i, considering the route conflict. Formula (A11) indicates the waiting time required at QC q for B-AGV a to unload task i after charging, including queuing waiting time and operational waiting time, considering route conflicts. Formula (A12) indicates the time required to complete Phase III of task i, considering path conflict.
References
- Wang, P.; Mo, M.; Zhang, Z.; Qin, W.; Huang, H.; Zou, Y. A new container trans-marshalling problem in perpendicular layout automated container terminals. Comput. Ind. Eng. 2025, 207, 104181. [Google Scholar] [CrossRef]
- Chen, X.; Meng, Q.; Lin, X.; Guan, H. Conflict-free routing and flowpath design for automated guided vehicles in container terminals. Transp. Res. Part E Logist. Transp. Rev. 2025, 200, 104181. [Google Scholar] [CrossRef]
- Yang, X.; Hu, H.; Jin, J. Battery-powered automated guided vehicles scheduling problem in automated container terminals for minimizing energy consumption. Ocean Coast. Manag. 2023, 246, 106873. [Google Scholar] [CrossRef]
- Ma, N.; Zhou, C.; Stephen, A. Simulation model and performance evaluation of battery-powered AGV systems in automated container terminals. Simul. Model. Pract. Theory 2021, 106, 102146. [Google Scholar] [CrossRef]
- Zhou, C.; Zhu, S.; Bell, M.G.H.; Lee, L.H.; Chew, E.P. Emerging technology and management research in the container terminals: Trends and the COVID-19 pandemic impacts. Ocean Coast. Manag. 2022, 230, 106318. [Google Scholar] [CrossRef] [PubMed]
- Song, X.; Chen, N.; Zhao, M.; Wu, Q.; Liao, Q.; Ye, J. Novel AGV resilient scheduling for automated container terminals considering charging strategy. Ocean Coast. Manag. 2024, 250, 107014. [Google Scholar] [CrossRef]
- Niu, Y.; Yu, F.; Yao, H.; Yang, Y. Multi-equipment coordinated scheduling strategy of U-shaped automated container terminal considering energy consumption. Comput. Ind. Eng. 2022, 174, 108804. [Google Scholar] [CrossRef]
- McHaney, R. Modelling battery constraints in discrete event automated guided vehicle simulations. Int. J. Prod. Res. 2007, 33, 3023–3040. [Google Scholar] [CrossRef]
- Wang, W.; Zhao, J. Partial linear recharging strategy for the electric fleet size and mix. Eur. J. Oper. Res. 2022, 308, 929–948. [Google Scholar] [CrossRef]
- Singh, N.; Akcay, A.; Dang, Q.-V.; Martagan, T.; Adan, I. Dispatching AGVs with battery constraints using deep reinforcement learning. Comput. Ind. Eng. 2024, 187, 109678. [Google Scholar] [CrossRef]
- Singh, N.; Dang, Q.-V.; Akcay, A.; Adan, I.; Martagan, T. A matheuristic for AGV scheduling with battery constraints. Eur. J. Oper. Res. 2022, 298, 855–873. [Google Scholar] [CrossRef]
- Li, Y.; Li, L.; Liu, R.; Pan, E. A reinforcement learning hybrid genetic algorithm for charge scheduling optimization in battery swapping stations at automated container terminals. Comput. Ind. Eng. 2025, 207, 111285. [Google Scholar] [CrossRef]
- Xing, Z.; Liu, H.; Wang, T.; Lin, Y.; Peng, C.E.; Choon, T.K.; Haobin, L. AGV charging scheduling with capacitated charging stations at automated ports. Transp. Res. Part E: Logist. Transp. Rev. 2025, 197, 104080. [Google Scholar] [CrossRef]
- Gao, Y.; Chang, D.; Chen, C.-H.; Sha, M. A digital twin-based decision support approach for AGV scheduling. Eng. Appl. Artif. Intell. 2024, 130, 107687. [Google Scholar] [CrossRef]
- Schmidt, J.; Meyer-Barlag, C.; Eisel, M.; Kolbe, L.M.; Appelrath, H.-J. Using battery-electric AGVs in container terminals—Assessing the potential and optimizing the economic viability. Res. Transp. Bus. Manag. 2015, 17, 99–111. [Google Scholar] [CrossRef]
- De Ryck, M.; Versteyhe, M.; Shariatmadar, K. Resource management in decentralized industrial Automated Guided Vehicle systems. J. Manuf. Syst. 2020, 54, 204–214. [Google Scholar] [CrossRef]
- Yu, M.; Liu, X.; Xu, Z.; He, L.; Li, W.; Zhou, Y. Automated rail-water intermodal transport container terminal handling equipment cooperative scheduling based on bidirectional hybrid flow-shop scheduling problem. Comput. Ind. Eng. 2023, 186, 109696. [Google Scholar] [CrossRef]
- Maurizio, B.; Andrea, M.; Adriano, M.; Teresa, M.; Claudio, S. Exact and heuristic solution approaches for the multi-objective. Transp. Res. Procedia 2024, 78, 369–376. [Google Scholar] [CrossRef]
- Zhou, X.; Zhu, J. An Improved Bounded Conflict-Based Search for Multi-AGV Pathfinding in Automated Container Terminals. Comput. Model. Eng. Sci. 2024, 139, 046363. [Google Scholar] [CrossRef]
- Zhong, M.; Yang, Y.; Dessouky, Y.; Postolache, O. Multi-AGV scheduling for conflict-free path planning in automated container terminals. Comput. Ind. Eng. 2020, 142, 106371. [Google Scholar] [CrossRef]
- Zhuang, Z.; Zhang, Z.; Teng, H.; Qin, W.; Fang, H. Optimization for integrated scheduling of intelligent handling equipment with bidirectional flows and limited buffers at automated container terminals. Comput. Oper. Res. 2022, 145, 105863. [Google Scholar] [CrossRef]
- Zhang, X.; Li, H.; Sheu, J.-B. Integrated scheduling optimization of AGV and double yard cranes. Transp. Res. Part B 2024, 179, 102871. [Google Scholar] [CrossRef]
- Hu, Y.; Wang, M.; Min, R.; Liu, J.; Lukinykh, V.F.; Tang, S.; Zhao, D. Coordinated scheduling optimization of quay cranes and AGVs in automated container terminals. Comput. Oper. Res. 2025, 182, 107147. [Google Scholar] [CrossRef]
- Wang, Z.; Zeng, Q. A branch-and-bound approach for AGV dispatching and routing problems in automated container terminals. Comput. Ind. Eng. 2022, 166, 107968. [Google Scholar] [CrossRef]
- Zhang, Z.; Chen, J.; Guo, Q. Application of Automated Guided Vehicles in Smart Automated Warehouse Systems: A Survey. Comput. Model. Eng. Sci. 2022, 134, 1529–1563. [Google Scholar] [CrossRef]
- Hu, Y.; Dong, L.; Xu, L. Multi-AGV dispatching and routing problem based on a three-stage decomposition method. Math. Biosci. Eng. 2020, 17, 5150–5172. [Google Scholar] [CrossRef]
- Ji, S.; Luan, D.; Chen, Z.; Guo, D. Integrated scheduling in automated container terminals considering AGV conflict-free routing. Transp. Lett. 2020, 13, 501–513. [Google Scholar] [CrossRef]
- Bell, M.G.H.; Wang, Z.; Cheung, K.-F.; Zhu, S. A system dynamics analysis of the trans-Pacific trade lane during the pandemic. Transp. Res. Part A Policy Pract. 2023, 176, 103802. [Google Scholar] [CrossRef]
- Kawakami, T.; Takata, S. Battery Life Cycle Management for Automatic Guided Vehicle Systems. In Design for Innovative Value Towards a Sustainable Society; Springer: Dordrecht, The Netherlands, 2012; pp. 403–408. [Google Scholar]
- Shi, J.; Tian, M.; Han, S.; Wu, T.-Y.; Tang, Y. Electric vehicle battery remaining charging time estimation considering charging accuracy and charging profile prediction. J. Energy Storage 2022, 49, 104132. [Google Scholar] [CrossRef]
- Murakami, K. Time-space network model and MILP formulation of the conflict-free routing problem of a capacitated AGV system. Comput. Ind. Eng. 2020, 141, 106270. [Google Scholar] [CrossRef]
- Peng, Y.; Li, X.; Wang, W.; Wei, Z.; Bing, X.; Song, X. A method for determining the allocation strategy of on-shore power supply from a green container terminal perspective. Ocean Coast. Manag. 2019, 167, 158–175. [Google Scholar] [CrossRef]
Disclaimer/Publisher’s Note: The statements, opinions and data contained in all publications are solely those of the individual author(s) and contributor(s) and not of MDPI and/or the editor(s). MDPI and/or the editor(s) disclaim responsibility for any injury to people or property resulting from any ideas, methods, instructions or products referred to in the content. |
© 2025 by the authors. Licensee MDPI, Basel, Switzerland. This article is an open access article distributed under the terms and conditions of the Creative Commons Attribution (CC BY) license (https://creativecommons.org/licenses/by/4.0/).