3.3. Boundary and Load Conditions
To ensure a realistic simulation of the structural response under impact, appropriate boundary constraints and loading conditions were carefully defined in alignment with typical collision scenarios involving tugboats. The boundary conditions were established to replicate the fixed support characteristics of the hull girder, particularly in the longitudinal and transverse directions near the engine room and deck structure, thereby restricting excessive rigid body motion and ensuring localized deformation.
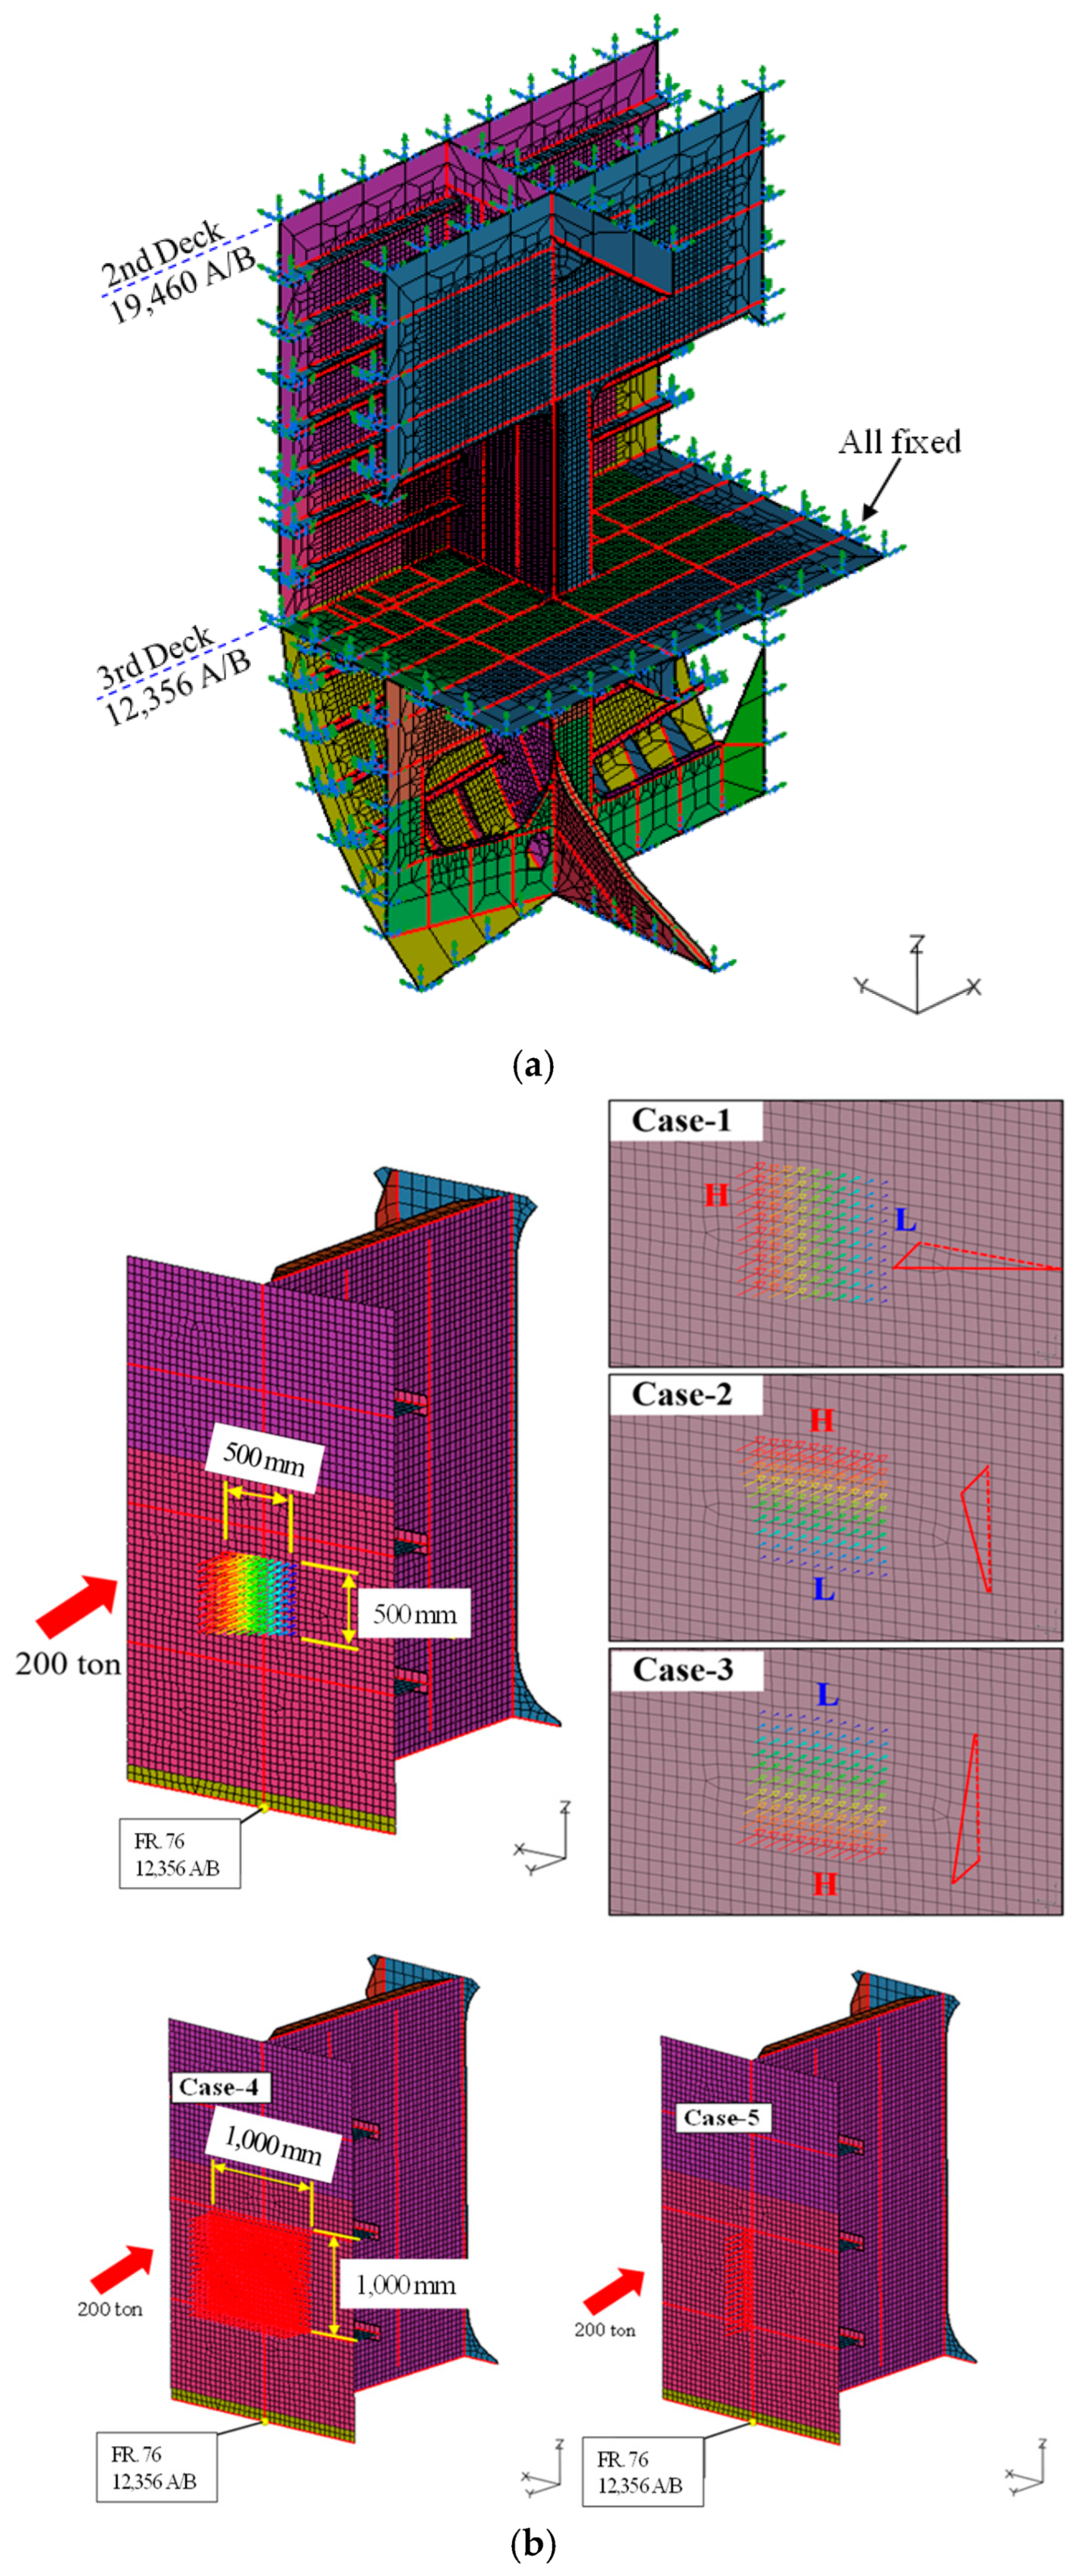
As illustrated in
Figure 9, the boundary condition (
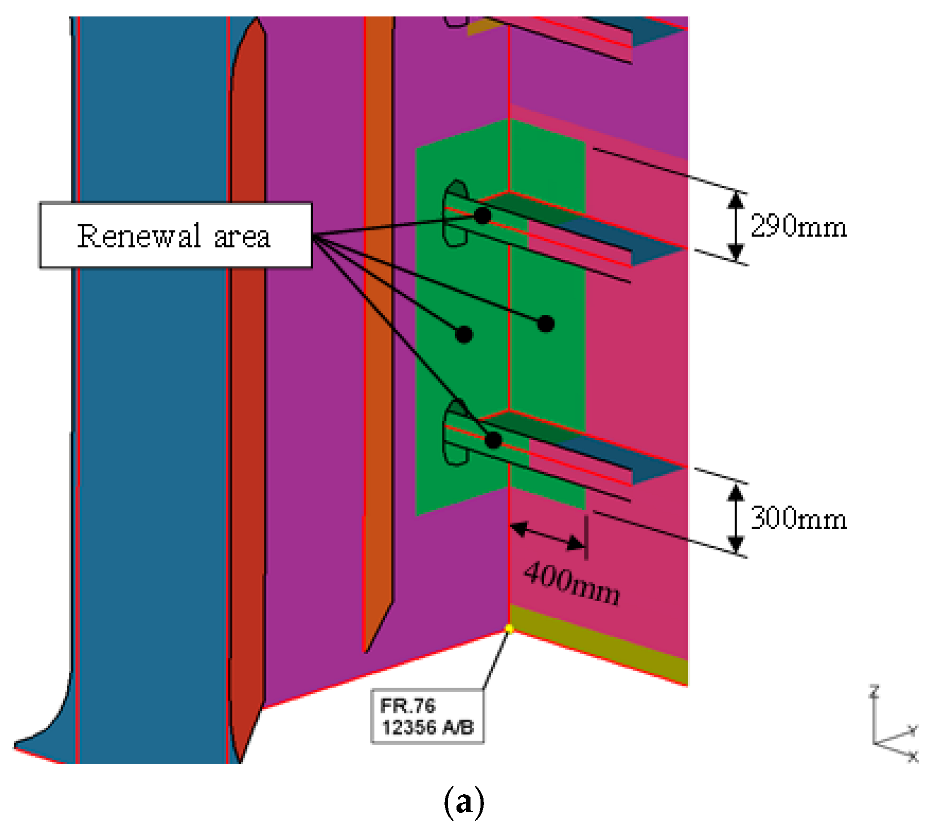
Figure 9a) was applied to simulate the structural continuity of the hull. Key nodal points along the upper deck and inner longitudinal bulkheads were constrained in all translational degrees of freedom, representing structural fixity at the boundaries of the modeled region. This approach reflects the structural restraint typically provided by adjacent hull structures and ensures accurate representation of load transfer paths during impact events. The applied load condition (
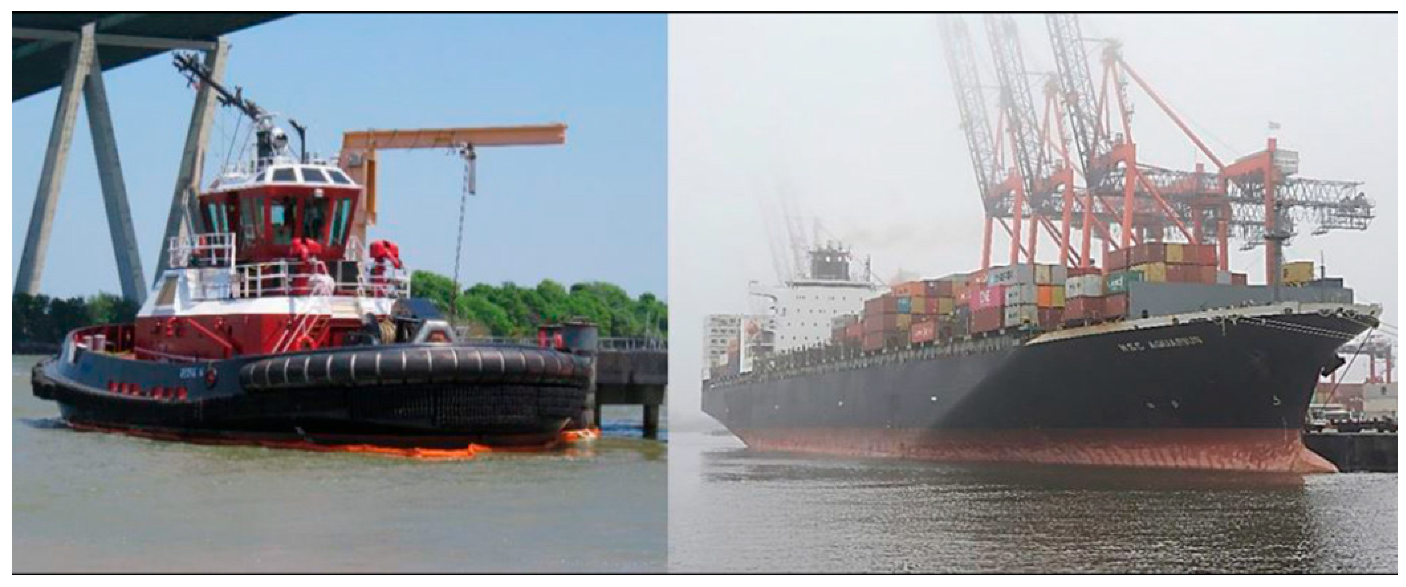
Figure 9b) was developed to reflect the concentrated force exerted by the bow of a tugboat during a stern collision. The five loading scenarios considered in this study were formulated based on representative contact geometries, force directions, and eccentricities typically encountered in tugboat-assisted berthing and maneuvering operations. While statistical databases such as those from the National Transportation Safety Board (NTSB) and classification societies (e.g., Lloyd’s Register, DNV) do not always provide quantitative distributions of contact angles or localized force vectors for tugboat collisions, several recurring patterns have been documented in accident investigations, safety audits, and ship-operator reports. Specifically, tug-induced damage to the aft hull—particularly around stern frames and steering gear housing—is known to result from angular push-offs, misaligned berthing thrusts, and delayed reverse maneuvers in congested harbor settings. The five cases analyzed in this study were selected to represent a broad yet practical envelope of loading conditions, encompassing variations in vertical vs. horizontal load components, contact positions (frame-centered vs. eccentric), and directional asymmetry. This ensures coverage of both worst-case and commonly observed collision configurations, even in the absence of formally codified frequency statistics. The loading magnitudes and application zones reflect engineering judgment informed by prior collision analyses, pilot maneuvering practices, and known vulnerabilities in hull-girder interaction during low-speed impacts.
Thus, although the case selection was not directly extracted from a probabilistic distribution, it was deliberately constructed to balance analytical coverage, physical realism, and relevance to practical forensic diagnosis. Future extensions of this framework may include data-driven scenario generation once a sufficiently granular statistical collision dataset becomes available.
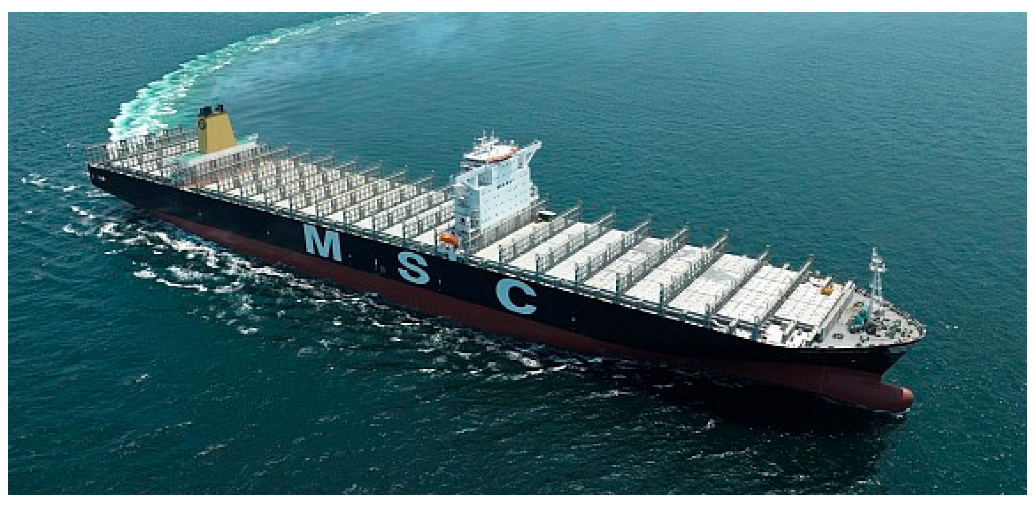
Recognizing that the typical contact area between the tug’s bow and the container ship’s stern structure spans approximately 500 mm, the impact load was distributed over this region to simulate realistic pressure application. The total impact force was conservatively set to 200 tons, representing a plausible upper limit based on vessel displacement and impact velocity. Building on the original three impact cases, two additional loading cases (Case-4 and Case-5) were introduced, bringing the total to five scenarios. These new cases were implemented to further investigate the influence of collision magnitude and impact pattern variability on structural deformation and residual strain distribution. Each load case maintains a total impact force of 200 tons, decomposed into different combinations of horizontal, vertical, and oblique components to replicate diverse contact angles and eccentricities typical of real-world tugboat interactions. This comprehensive load modeling enhances the robustness of the forensic analysis by enabling a parametric evaluation of structural sensitivity to impact orientation, and supports more accurate correlation with observed damage patterns.
3.4. Actual Measurement at Damaged Area
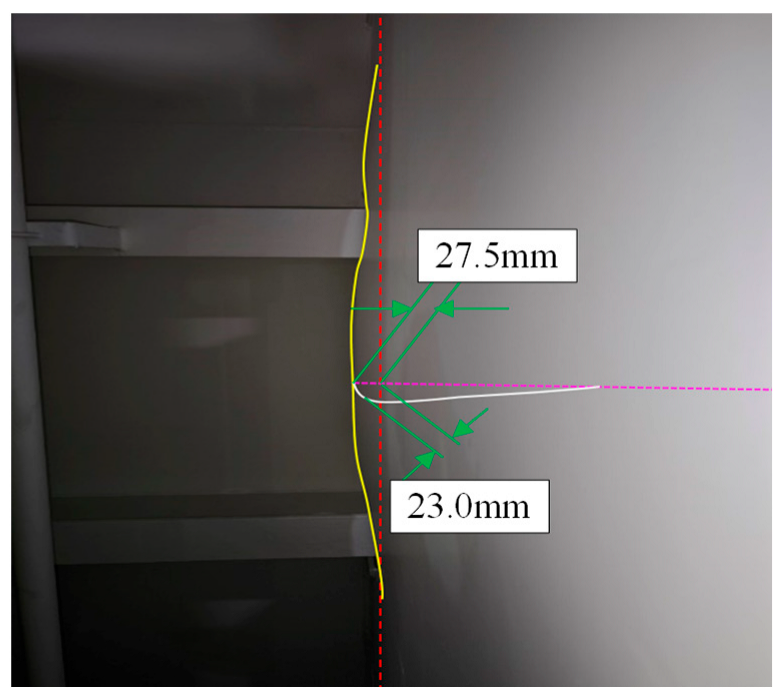
A critical aspect of validating the numerical simulation and assessing structural integrity involves comparing the computed deformation outcomes with actual measurements from the damaged vessel. Field inspection teams conducted detailed dimensional assessments of the deformed region, focusing on quantifying plastic strain, dent depth, and geometric distortion in the stern structure. These measurements provide empirical benchmarks essential for calibrating the finite element analysis and understanding the extent of structural degradation following the impact event.
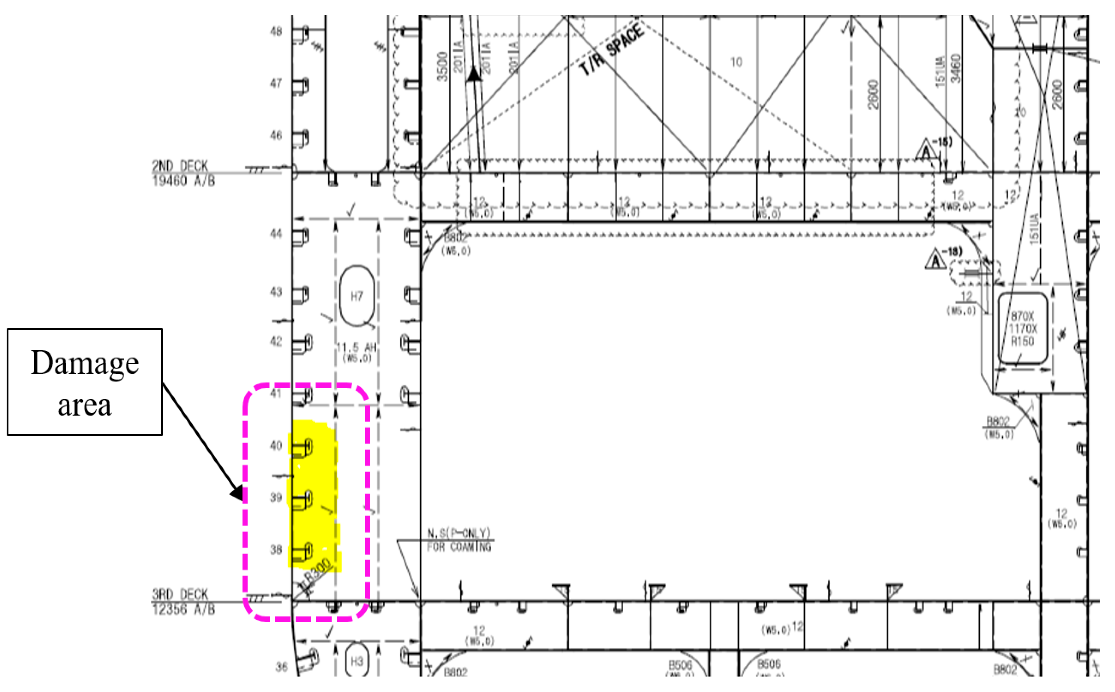
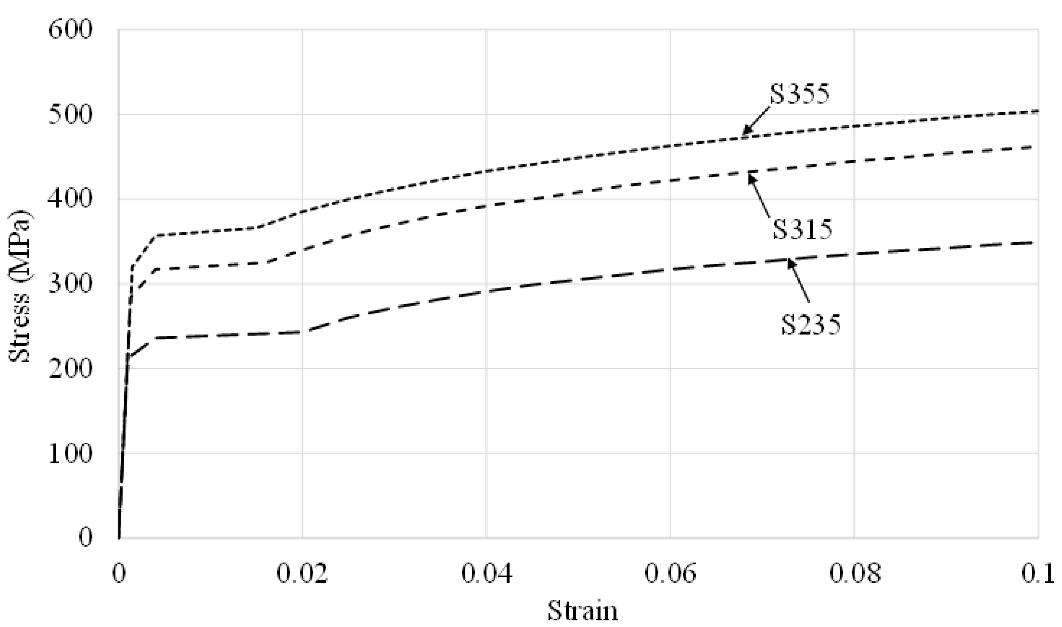
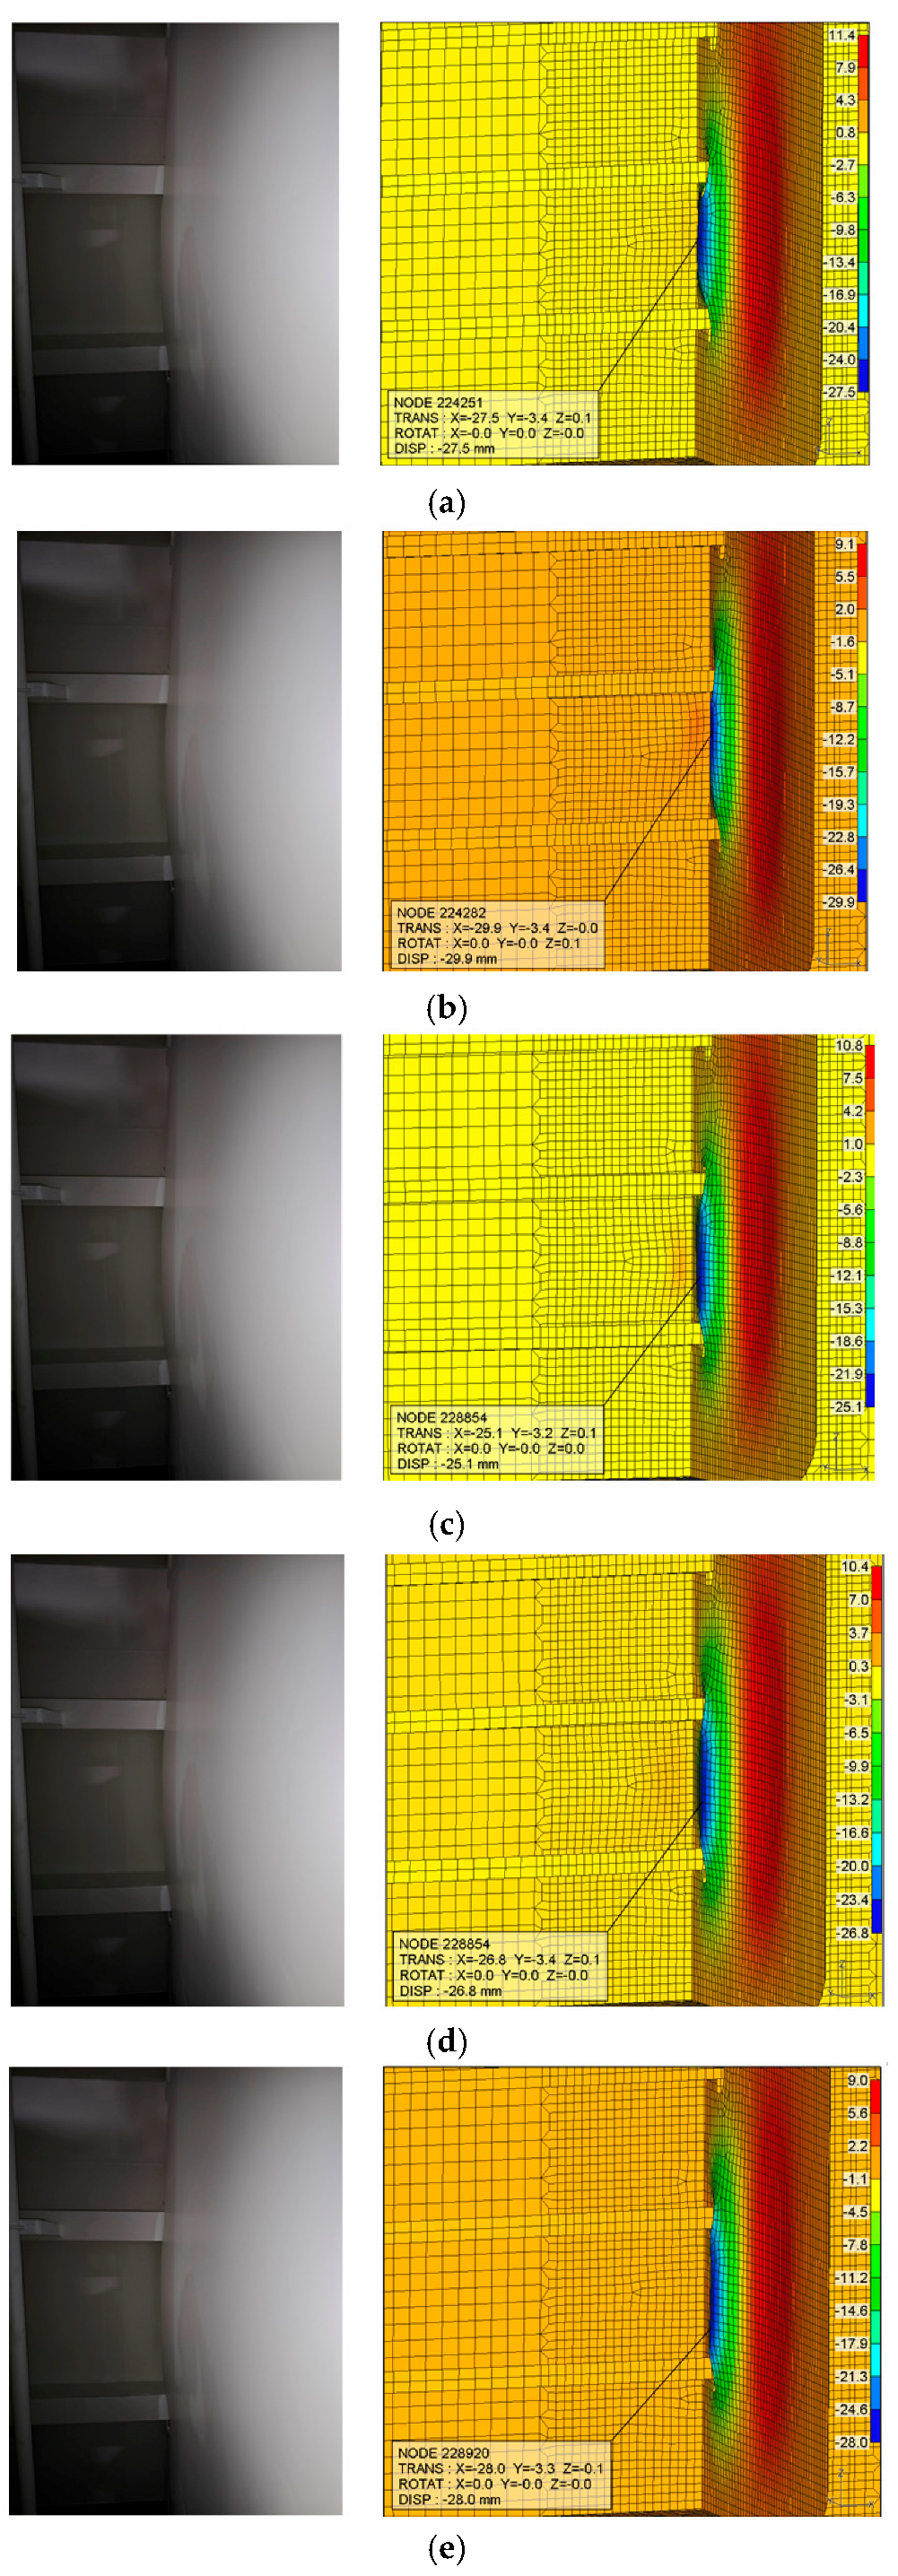
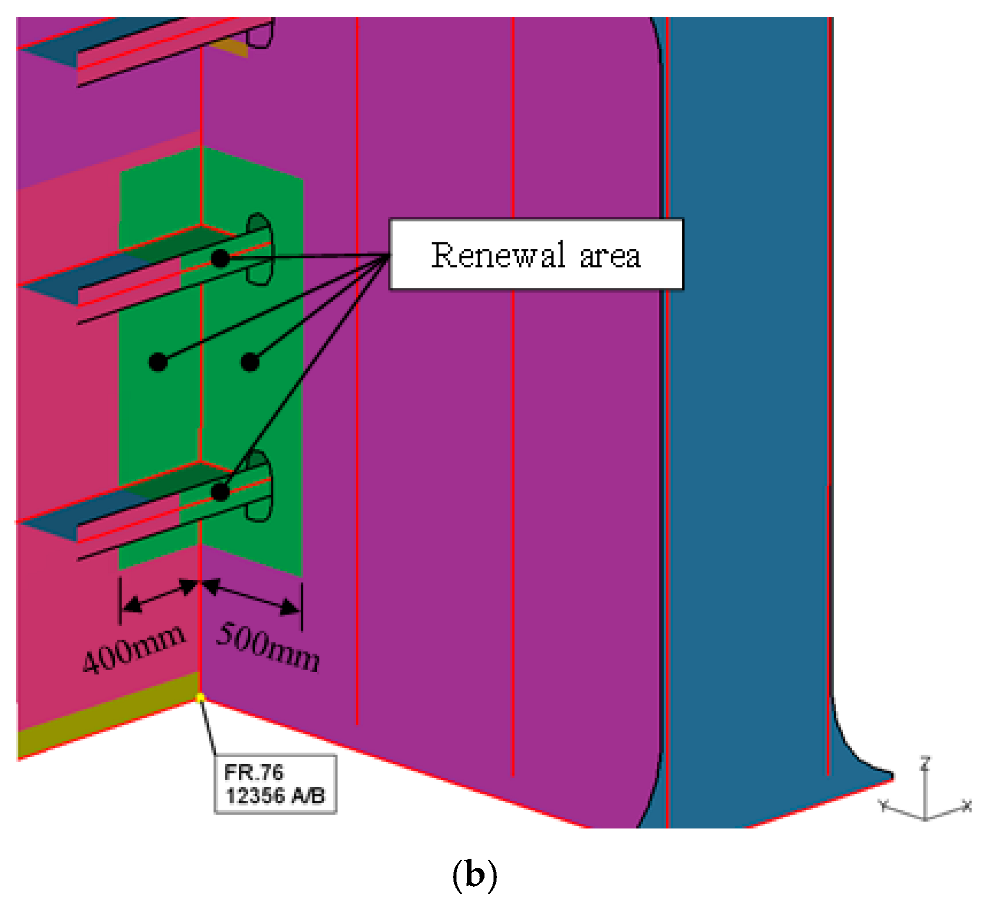
Figure 10 presents the plastic deformation profile measured in the critical area of the aft-end structure, which includes the most severely affected web plate and surrounding shell plating near Frame 76. The data reflects the localized plastic indentation observed after the collision, with displacement magnitudes and surface deflection patterns captured by onboard maintenance personnel using calibrated measuring tools. The affected area aligns closely with the expected contact zone of a tugboat bow, consistent with the assumed impact footprint of approximately 500 mm. This empirical measurement serves as a foundation for back-analyzing the impact event, allowing inference of likely collision force directions, energy magnitudes, and damage initiation points. In this study, the measured deformations are not only used to verify the numerical model but also play a pivotal role in evaluating the residual structural capacity of the affected region. By correlating the plastic strain fields and deformation profiles from FEA with real-world measurements, the methodology enables the identification of critical zones requiring immediate repair versus areas suitable for deferred maintenance. Furthermore, this comparison facilitates predictive diagnostics regarding the timing and scope of structural rehabilitation. Zones exhibiting plastic strain values exceeding material threshold limits (e.g., >0.2% for S355 steel) are flagged as candidates for structural reinforcement or replacement [
20]. In this context, the study establishes a decision-support framework for prioritizing repairs, grounded in both simulation results and field-verified deformation data.
The present analysis adopts a deterministic framework, focusing on field-calibrated nonlinear finite element simulations that replicate observed damage profiles under a defined set of loading scenarios and material assumptions. This approach is consistent with the forensic diagnosis objective of the study, where the goal is to infer the most plausible collision condition that led to a specific, physically observed damage pattern rather than to predict a probabilistic envelope of outcomes. Key parameters such as load magnitude, contact area, and material properties were selected conservatively based on engineering judgment, classification society guidelines (e.g., DNVGL-CG-0127 [
19]), and known performance ranges of AH36/S355 steel. For instance, the collision load was assumed at 200 tons, which is above the mean operational pushing force of typical harbor tugboats (~150 tons), ensuring that the model would capture worst-case plastic deformation without underestimating structural demand. Similarly, the contact area and position were varied across five scenarios to represent a practical range of realistic impact conditions.
While a formal sensitivity or uncertainty analysis such as stochastic simulations or parameter perturbation studies was not conducted in this work, it is acknowledged that such approaches are valuable, particularly in design-stage safety assessments or risk-based evaluations. In contrast, the current study deals with a post-incident diagnostic application, where the emphasis is on matching a specific residual deformation outcome with a small number of probable causes. As such, introducing probabilistic variability in input parameters could obscure rather than clarify the link between cause and effect.
Nonetheless, the simulation framework is fully compatible with future uncertainty quantification extensions, such as Monte Carlo sampling, global sensitivity analysis, or probabilistic material models. These additions are planned for future work, especially in applications involving multiple incident datasets, damage accumulation forecasting, or digital twin integration for real-time diagnostics.
3.5. Nonlinear Plastic Analysis and Correlation with Actual Damage
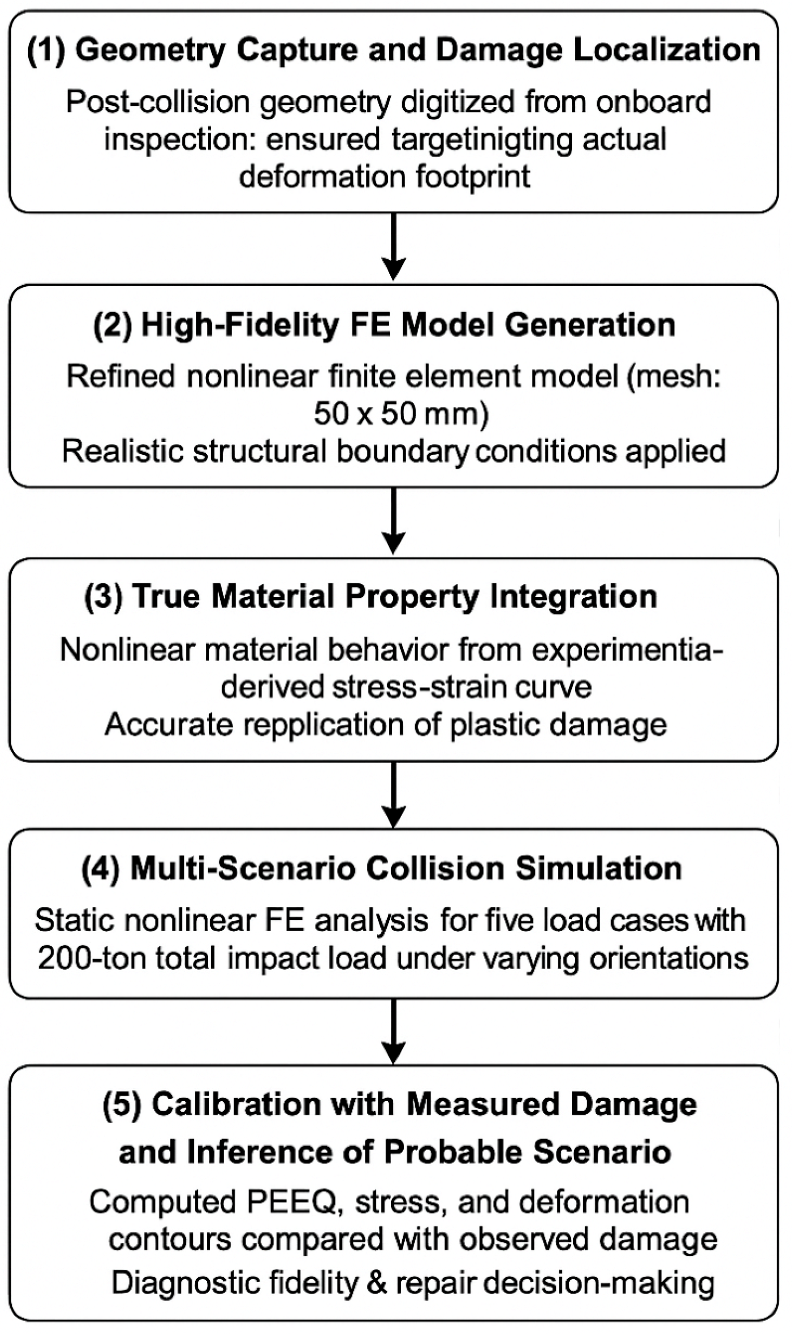
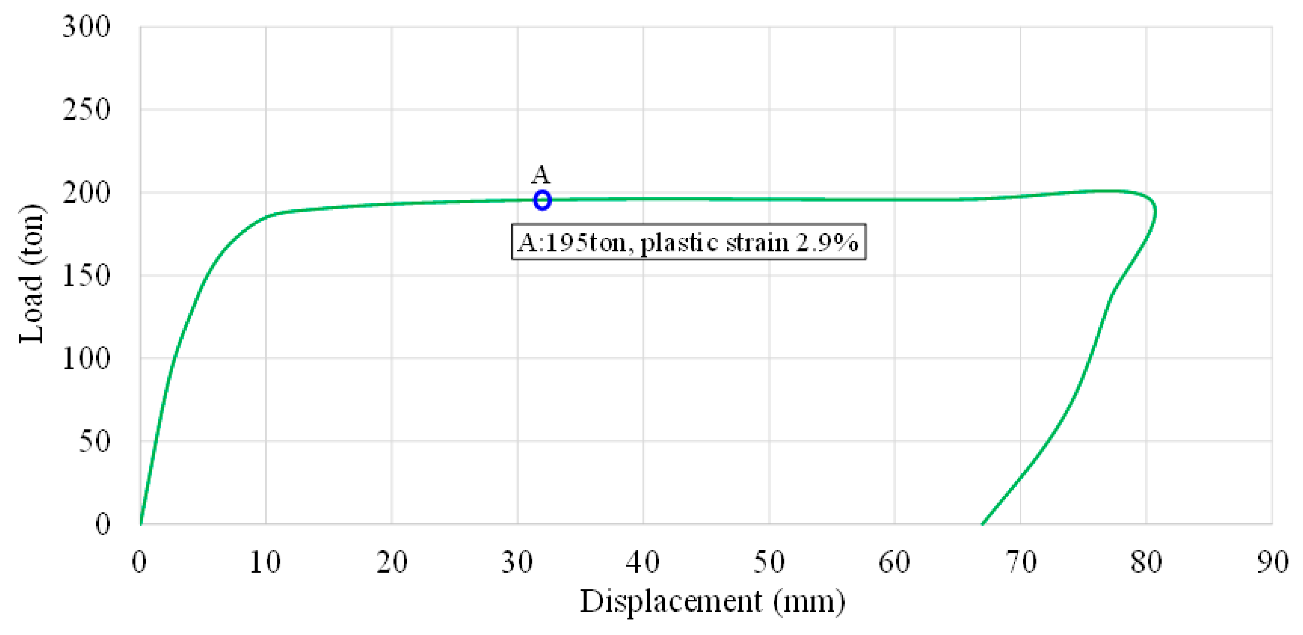
To accurately reproduce the complex deformation behavior observed in the damaged stern structure, a nonlinear plastic finite element analysis was conducted. Unlike linear analysis which assumes small deformations and purely elastic material response nonlinear analysis incorporates both material nonlinearity (plastic yielding and strain hardening) and geometric nonlinearity (large deformations and changes in stiffness during loading). This level of complexity is essential to capture the actual behavior of marine structures subjected to concentrated impact loads, such as those resulting from tugboat collisions. Given the localized nature of the plastic damage observed in field measurements, a time-independent static nonlinear analysis was selected. The model simulates the application of impact loads up to a total force of 200 tons, followed by immediate unloading to represent the real-world condition in which the tugboat makes brief contact before disengaging. This loading-unloading sequence enables the identification of permanent deformation zones and residual stresses that remain in the structure after the external force is removed. The analysis focuses particularly on Point A, a location identified as exhibiting the most significant plastic deformation during inspection, thus serving as a critical benchmark for correlating simulation outcomes with actual damage.
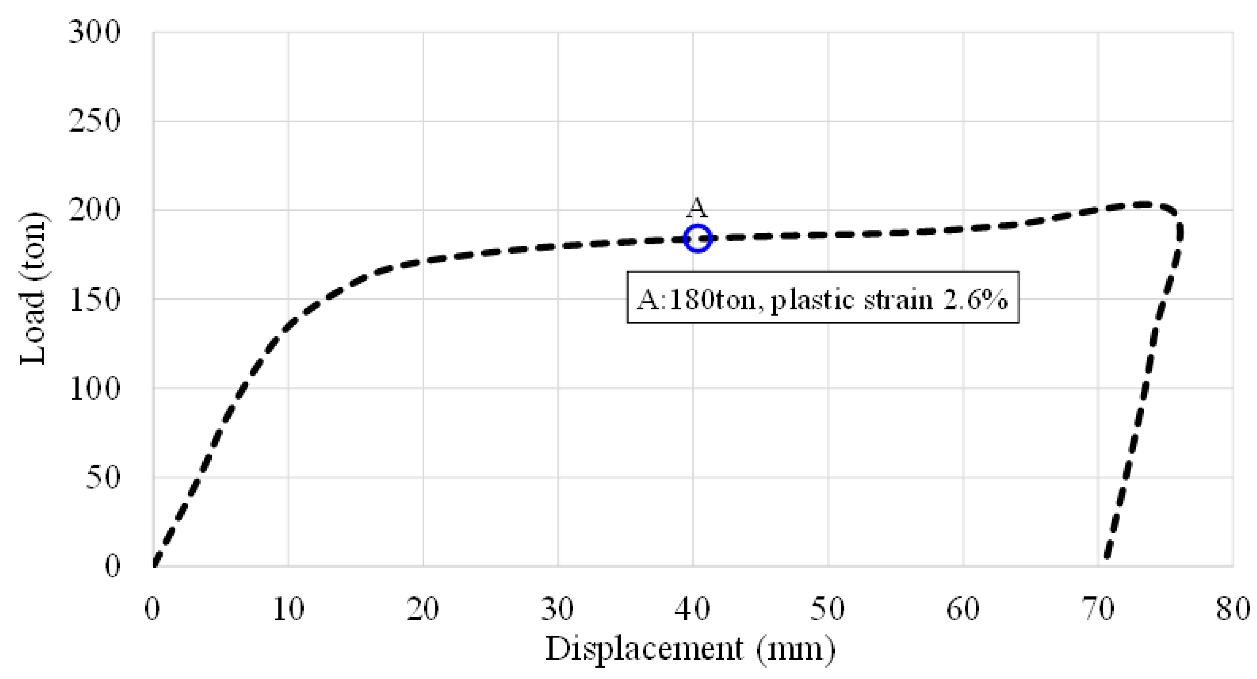
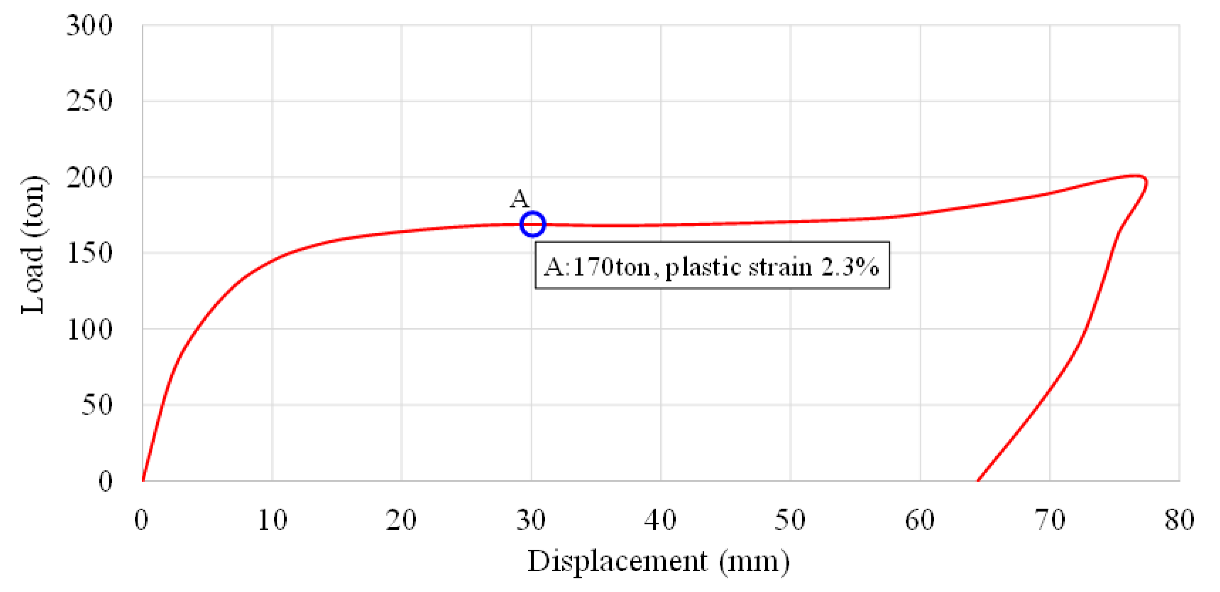
Figure 11 shows the load–displacement response curve obtained from the nonlinear analysis under Case-1 loading conditions. As the applied load increases, the structure initially responds elastically with a linear increase in displacement. Beyond a threshold, the curve exhibits noticeable nonlinear behavior, indicating the onset of plastic deformation. When the load reaches the maximum value of 200 tons, a sharp transition is observed as the external force is instantly removed. The sudden unloading results in a permanent offset in displacement, which quantifies the residual deformation remaining in the structure. This behavior reflects the irreversible material damage consistent with field observations.
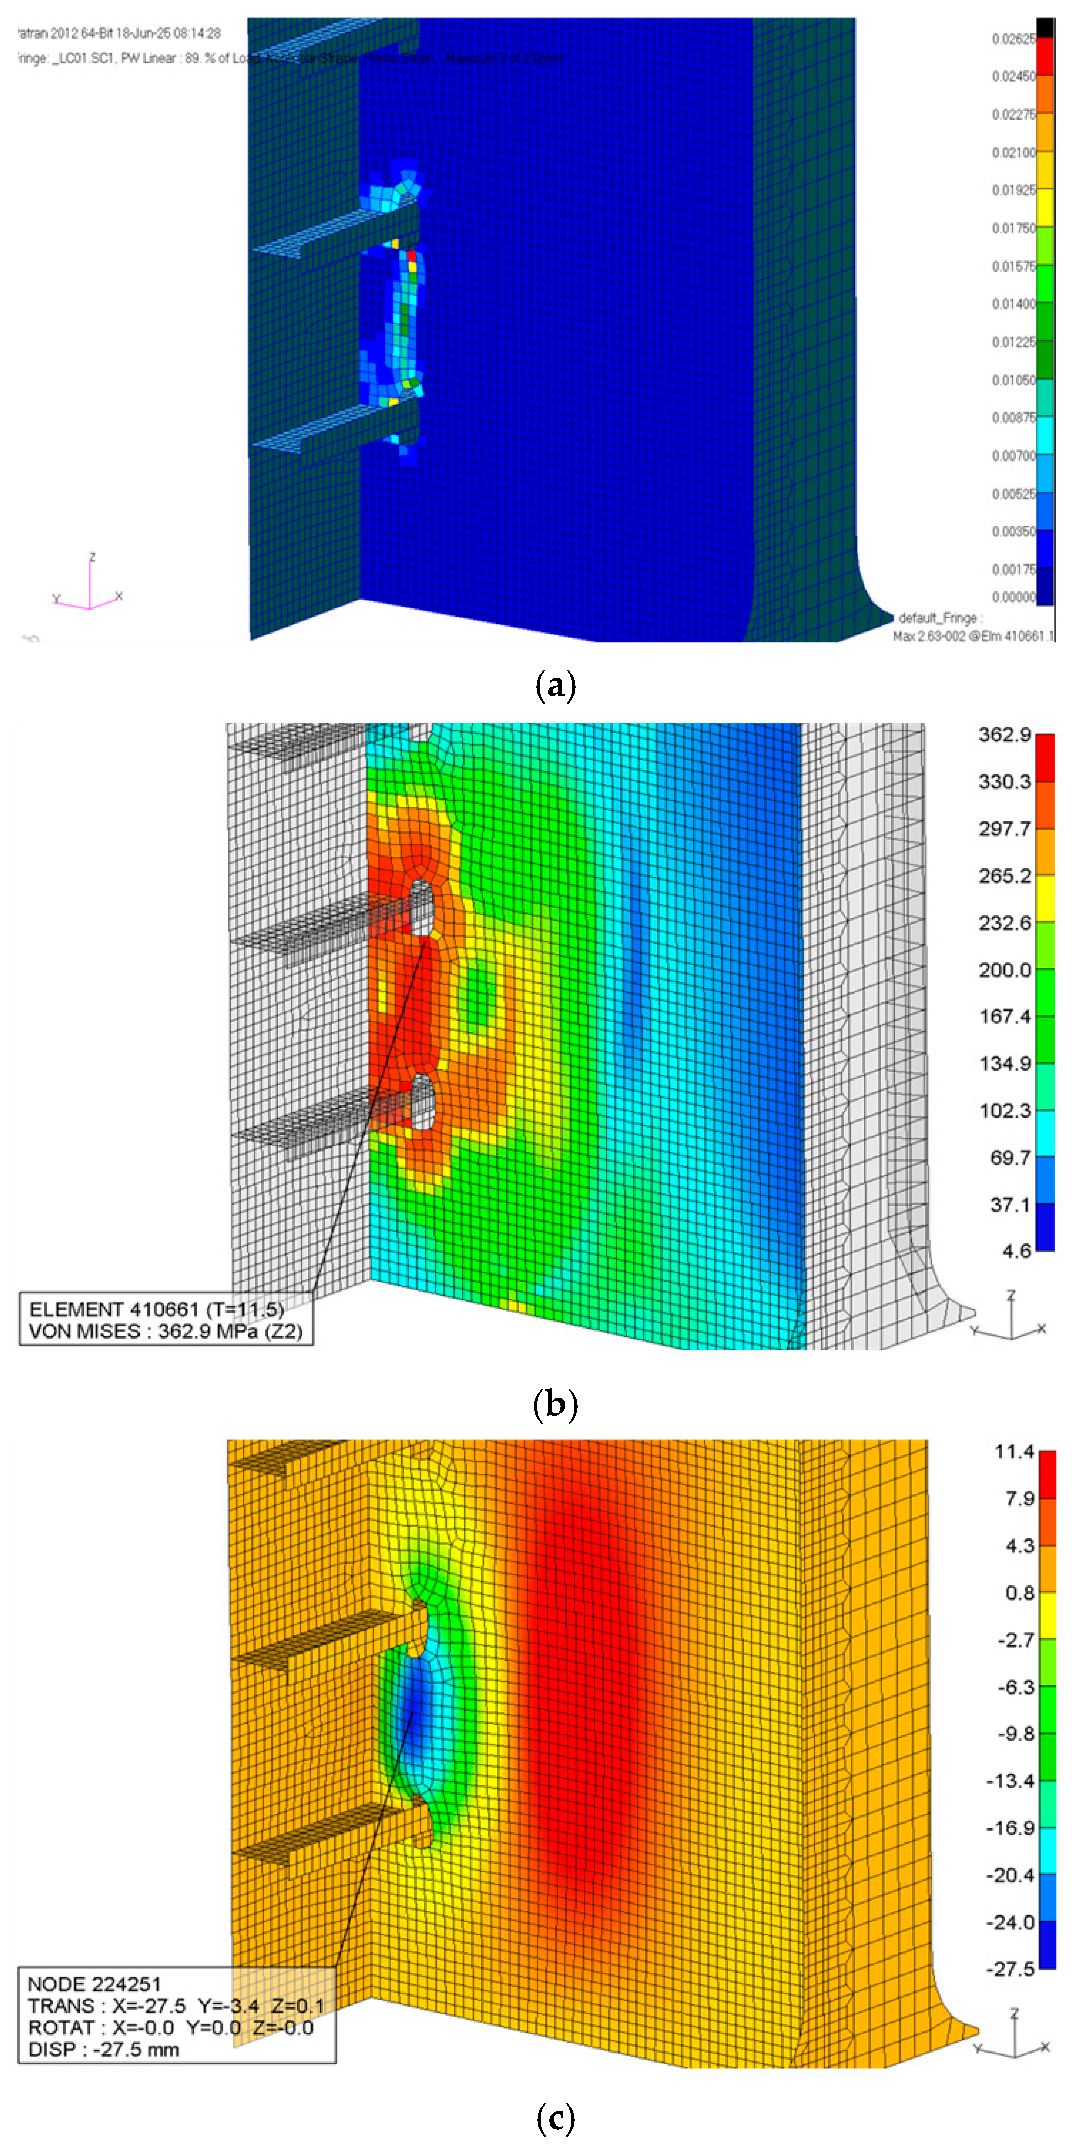
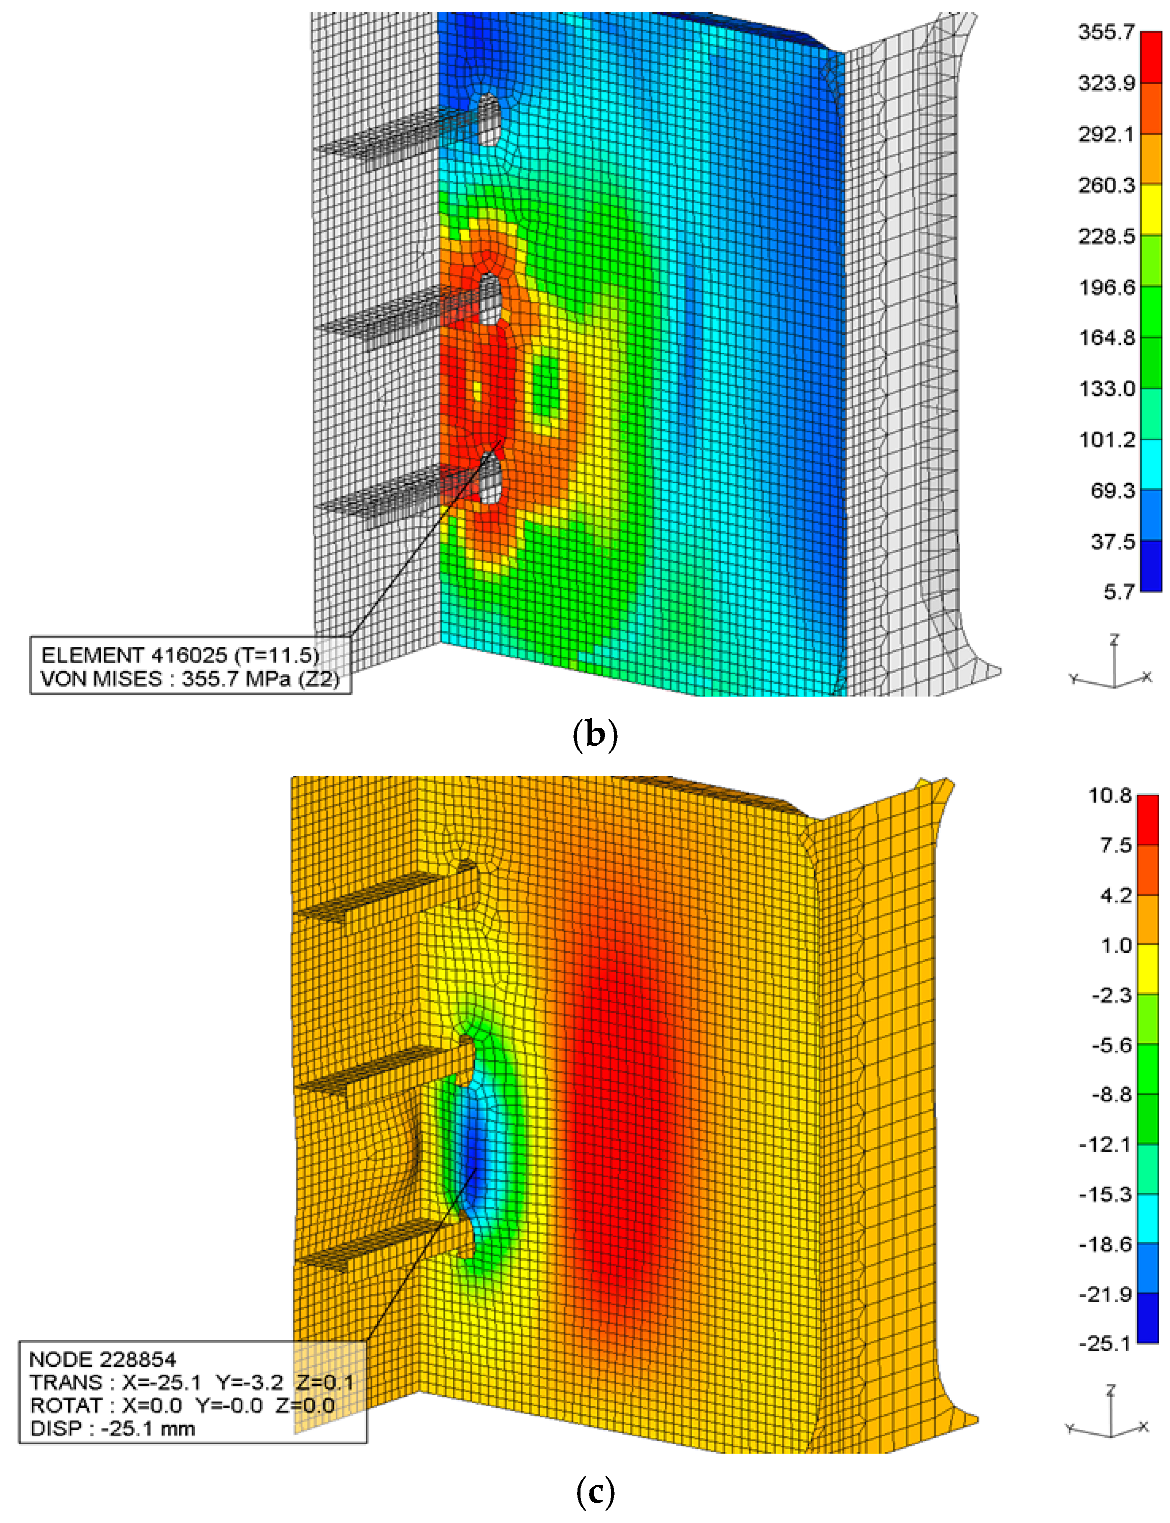
Figure 12a illustrates the distribution of equivalent plastic strain at Point A. The results confirm that localized plastic deformation has occurred, with strain values exceeding the 0.2% yield threshold of carbon steel. This validates the hypothesis that the applied loading scenario is sufficient to induce permanent deformation in the observed region. The plastic strain contour reveals a concentrated zone of high strain near structural discontinuities, including stiffener intersections and weld seams, where stress intensification naturally occurs.
Figure 12b presents the von-Mises stress distribution, highlighting the areas where the equivalent stress approaches or exceeds the material yield strength. The maximum stress at Point A closely aligns with the plastic strain field, further supporting the structural vulnerability of this region under eccentric impact. The stress contours exhibit gradient transitions from high-stress zones near the contact area to relatively unloaded regions, demonstrating realistic load transfer through the surrounding structural framework.
Figure 12c depicts the deformed shape of the structure against tugboat collision. The visualization shows a permanent indentation consistent with the dent depth measured in the field, affirming the fidelity of the nonlinear model. The deformation is concentrated around the transverse web and shell plating adjacent to Point A, capturing both global bending and local panel distortion. This confirms the model’s capability to replicate the actual failure mode, bridging the gap between numerical prediction and physical damage.
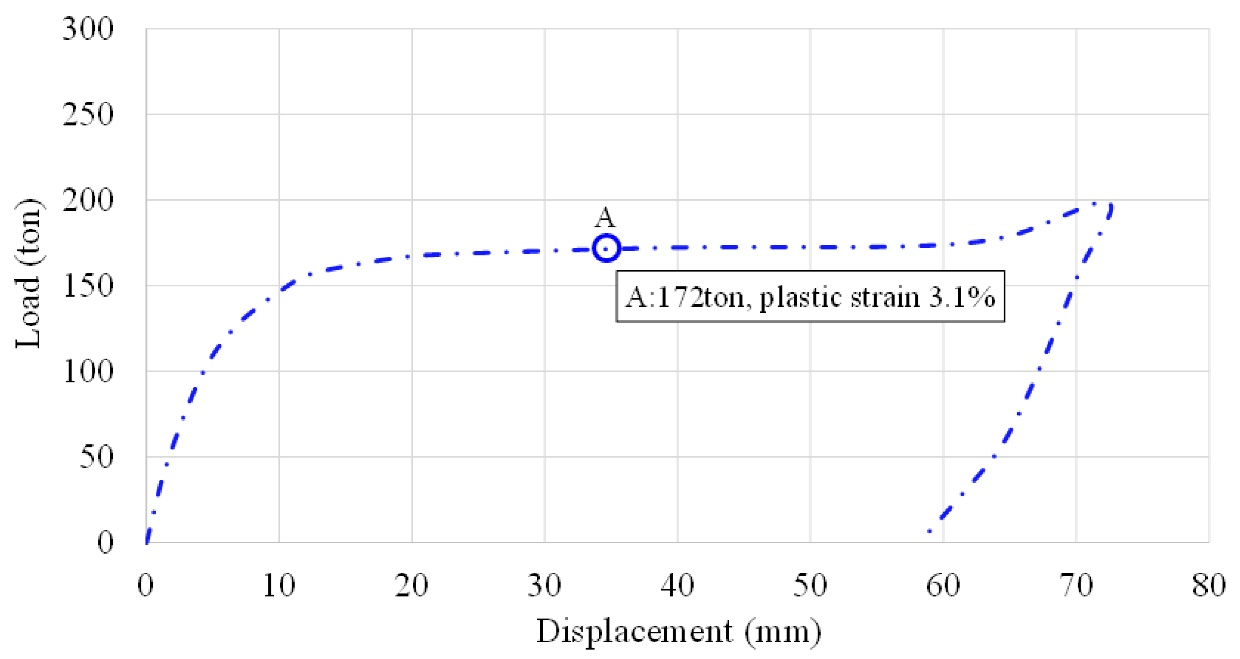
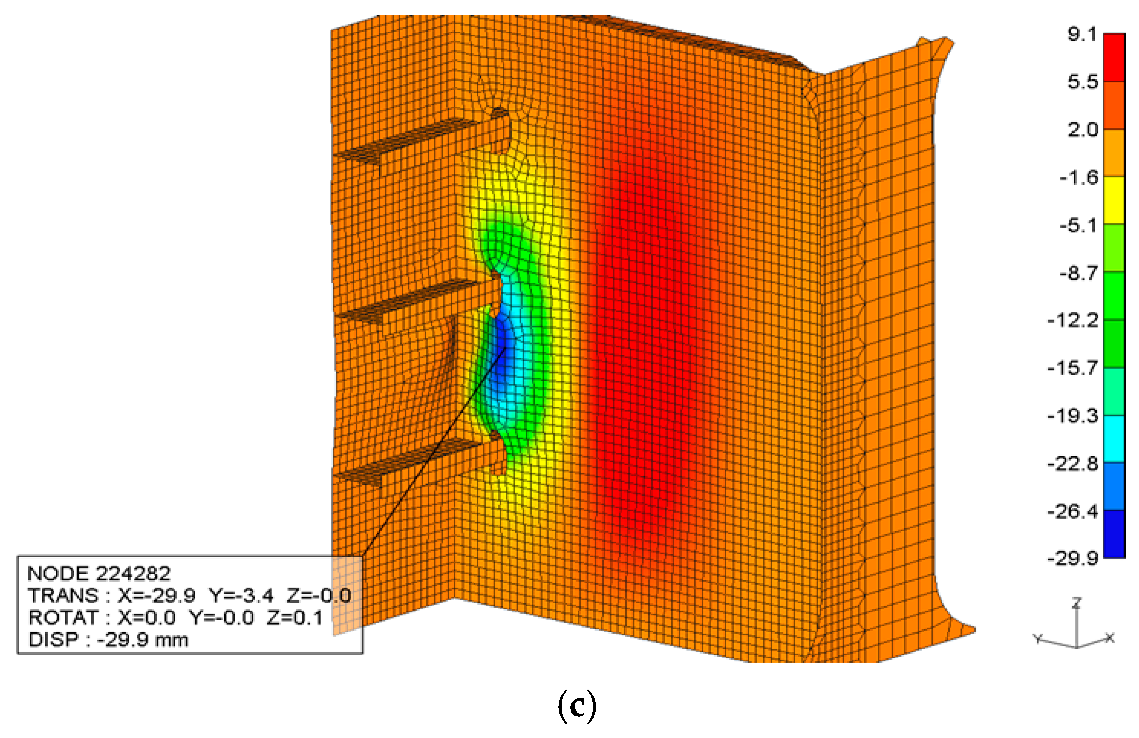
Figure 13 shows the load–displacement response under Case-2, which involves a slightly altered load distribution reflecting a more vertically biased contact from the tugboat. The initial linear segment indicates elastic behavior, followed by a gradual transition into the plastic region as the structural stiffness reduces due to localized yielding. Compared to Case-1, the curve demonstrates a marginally greater permanent deformation, suggesting that this particular load orientation results in more severe strain localization, especially near structural discontinuities in
Figure 14. After reaching the peak load of 200 tons, the system unloads, revealing the magnitude of irreversible displacement retained in the structure.
Figure 15 presents the load–displacement behavior for Case-3, which simulates an obliquely distributed load combining horizontal and vertical components with a more eccentric application. The overall structural response is less stiff, and the permanent deformation is slightly reduced compared to Case-2, implying less critical engagement of high-strain regions (see
Figure 16). Nonetheless, the unloading response still confirms permanent denting consistent with the range of real-world plastic deformations.
In Case-4 (see
Figure 17), the total impact force of 200 tons is distributed uniformly over a 1-m-wide contact area, as opposed to the localized 500 mm patch used in prior cases. This setup simulates a blunt, wide contact event, such as a tugboat pushing with a fender array or deformable bow. The structural response maintains a gradual nonlinear transition, with lower peak displacement than in Case-2. The smoother slope and reduced residual offset indicate less-intense local deformation, consistent with pressure diffusion across the wider application area.
The maximum equivalent plastic strain (
Figure 18) is observed at approximately 1.0–1.2%, barely above the renewal threshold used in this study. The strain is more widely dispersed than in Case-2, indicating lower strain localization. This suggests the structure absorbed the impact energy more efficiently due to the reduced contact pressure per unit area. Stress distribution shows moderate values (up to 300 MPa), remaining largely below AH36’s yield strength (355 MPa) in most regions as shown
Figure 18b. This implies a less critical loading condition with a reduced likelihood of microstructural damage outside the immediate vicinity of Point A. The resulting indentation is shallow and spread out, reflecting the blunt nature of the contact as shown
Figure 18c. Compared to the sharp dents observed in Case-2, this outcome aligns with expected behavior from a broader pressure field, where peak stress is mitigated by a larger load-bearing area. Case-4 highlights the structural resilience under distributed load conditions. Although permanent deformation still occurs, the stress and strain levels remain closer to the elastic-plastic boundary, supporting potential for partial repair or deferred action under class society guidelines.
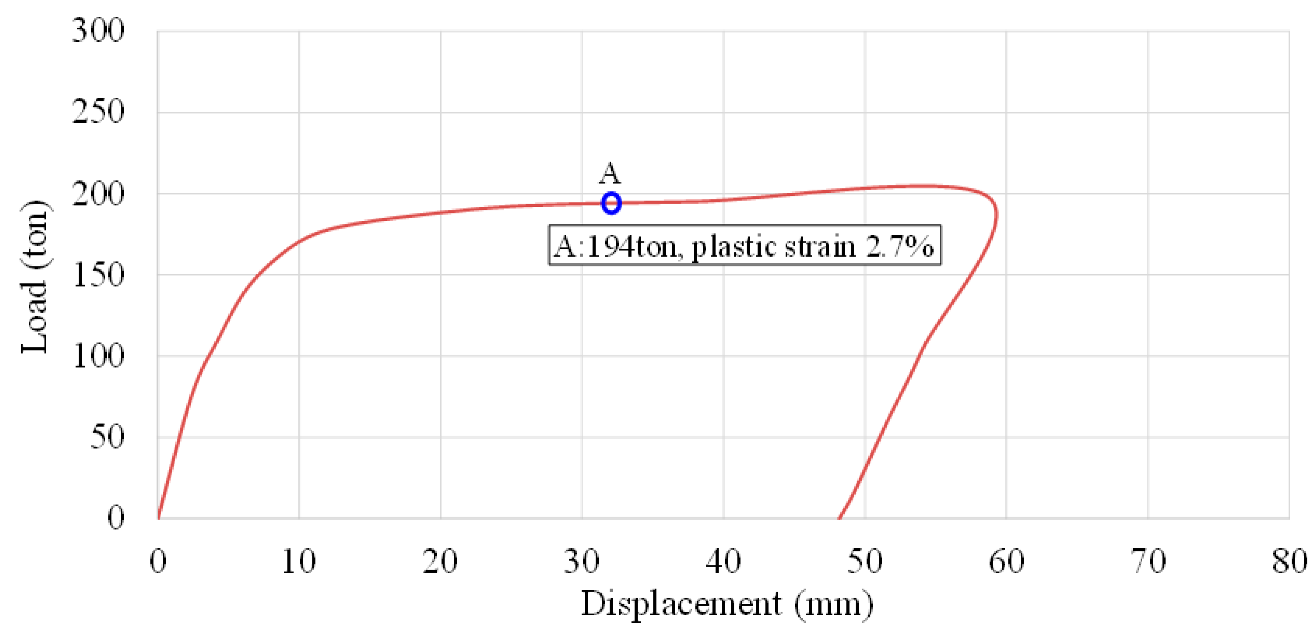
Figure 19 presents the load–displacement response of the stern structure under Case-5, in which a 200-ton force is applied internally to the web plate of Frame 76 via wire tension simulating a localized overload scenario rather than an external impact. The curve exhibits a relatively steep initial elastic slope, indicating high local stiffness at the onset due to the direct engagement of internal structural members without preliminary deformation of the outer shell. However, upon reaching the material’s elastic limit, the curve abruptly transitions into the plastic regime, where the stiffness significantly decreases, reflecting the onset of localized yielding in the web and adjacent frame junctions. The total displacement reaches approximately 45~50 mm, with a noticeable residual deformation even after the full load is released. This indicates a permanent internal distortion in the structure, which does not recover elastically confirming that yielding is concentrated and irreversible. This behavior is consistent with localized plastic collapse near internal stiffener-web intersections and is further supported by the elevated plastic equivalent strain (PEEQ) and von-Mises stress distributions shown in
Figure 20b.
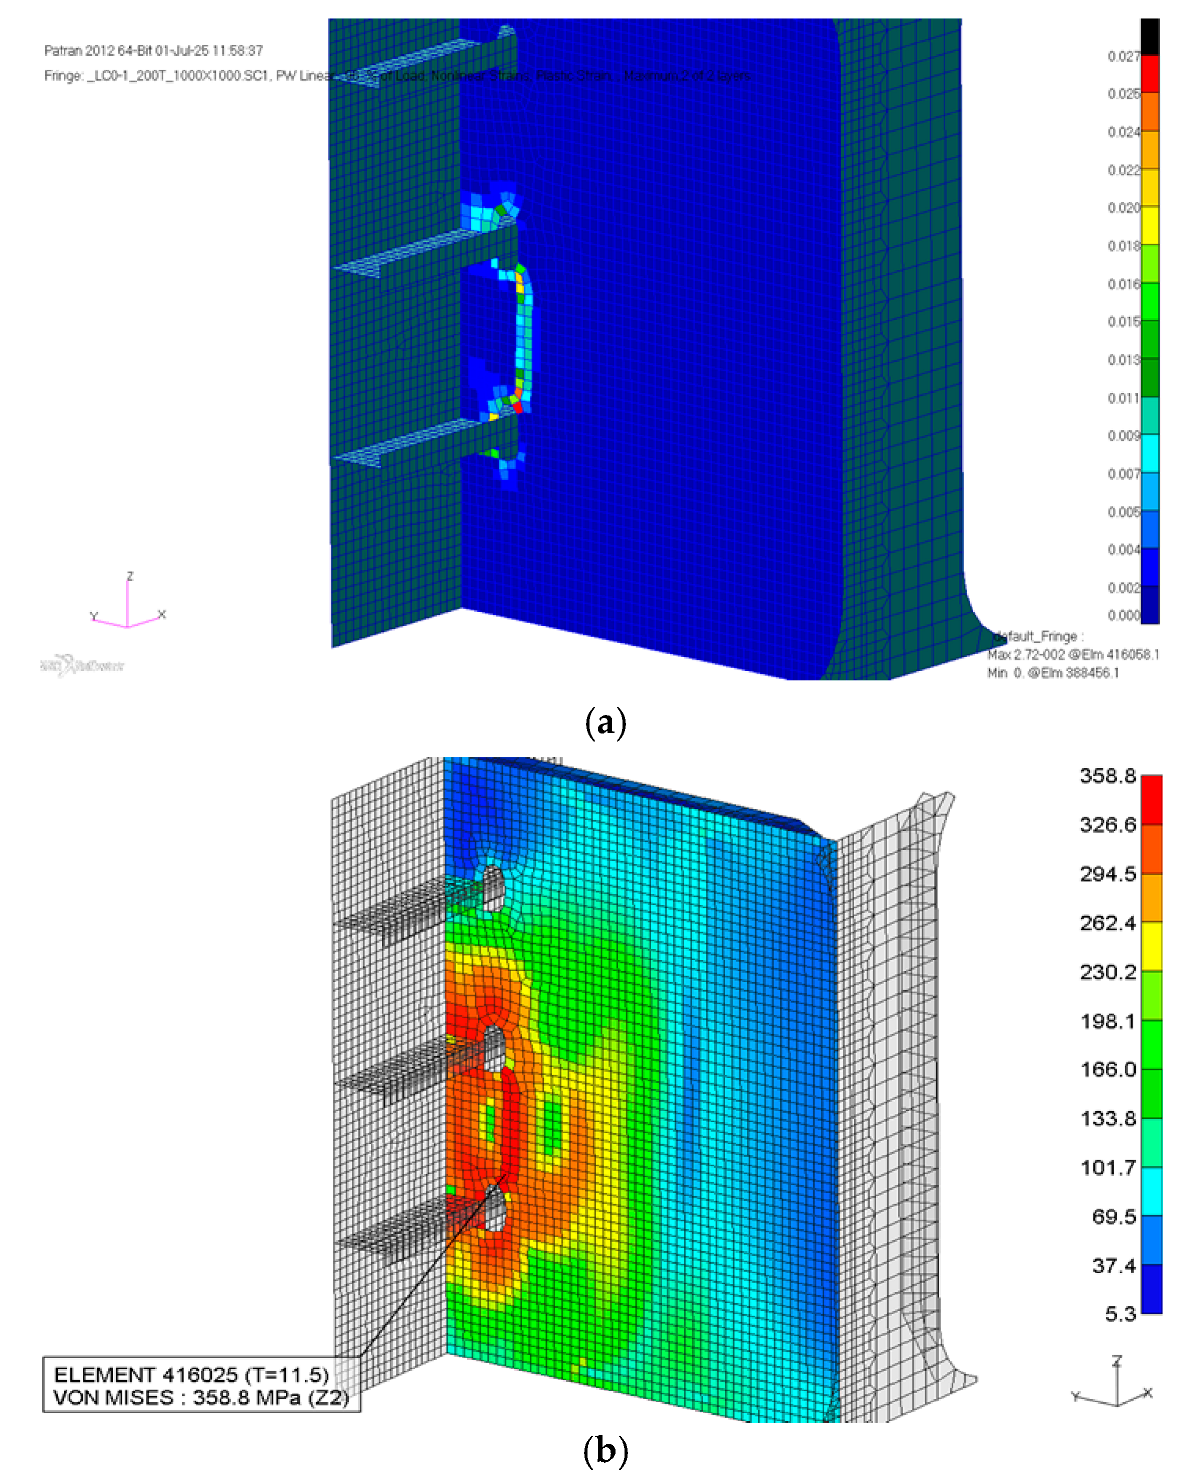
Compared to the displacement behavior of other cases (e.g., Case-2 and Case-4), the Case-5 curve shows a sharper post-yield drop in stiffness, implying that the load is not sufficiently distributed, and thus leads to stress concentration in a confined region. Unlike the gradual flattening of the curve in Case-4 due to distributed pressure over a wider contact area, the concentrated internal load in Case-5 generates a brittle-like load drop, making the system prone to sudden structural instability under continued force. This type of load–displacement curve behavior reflects a high-risk condition for structural integrity especially in regions not originally designed for primary load transfer underscoring the importance of proper load path design and internal reinforcement against unintended internal loading, such as wire tension or rigging-induced stress. In Case-5, the load is no longer applied externally. Instead, the 200 ton force is simulated as a tension force transmitted through wire ropes directly to the internal web plate of Frame 76. This scenario reflects damage modes that may arise during internal lifting, towing, or lashing operations, or even structural misalignment during dry dock procedures. The initial response is relatively stiff due to the internal application point bypassing outer shell deformation. However, once yielding initiates, the structure experiences rapid strain accumulation, with a more pronounced residual offset than in Case-4, suggesting higher local plasticity. The peak load at Point A reaches 1.6–1.8%, indicating severe plastic strain localization concentrated within the web plate as shown
Figure 20a.
Unlike Case-4, this internal loading leads to direct material overload, matching the damage patterns observed in misaligned or unintentional lifting forces. Stress levels exceed yield strength locally, with maximum von-Mises stress surpassing 370 MPa, as indicated in
Figure 20b. The stress map is tightly clustered, and critical stress zones are confined to internal framing, especially near the web-stiffener junctions consistent with structural vulnerabilities in internal panel zones. The deformation profile reveals severe inward distortion of the web plate, with minimal influence on the surrounding outer shell as shown
Figure 20c. The overall dent profile aligns with internal loading failure, characterized by panel bulging or tension collapse within internal framing elements.
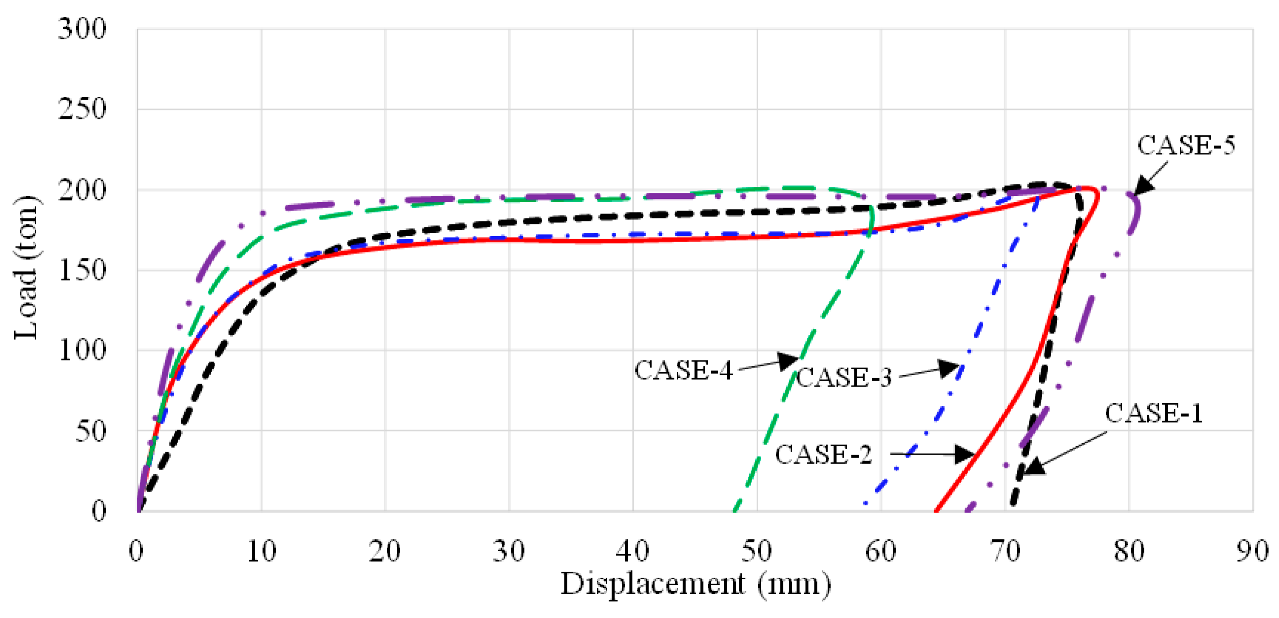
Figure 21 presents a consolidated view of the load–displacement responses derived from nonlinear finite element analyses across five distinct impact scenarios. While each case was subjected to an identical peak impact force of 200 tons, the resulting displacement behaviors reveal clear divergences in structural response owing to variations in load orientation, application method, and contact area. This comparison offers critical insights into the nonlinear sensitivity of the stern structure and helps to identify which load condition most accurately replicates the actual damage recorded during field inspections.
The curve for Case-1 exhibits a typical nonlinear response, with initial elastic stiffness followed by a noticeable transition into the plastic regime. Although permanent deformation occurs, the residual displacement is moderate relative to the other cases. This behavior suggests that a purely horizontal impact, while structurally significant, lacks the depth of strain localization necessary to reproduce the sharp denting observed in actual damage. Among all five cases, Case-2 produces the steepest drop-off in stiffness post-yield, followed by the largest residual displacement. This indicates a high degree of localized plastic deformation, corroborated by previous plastic strain contours and field measurements. The pronounced residual displacement aligns well with the measured indentation depth at Frame 76 (see
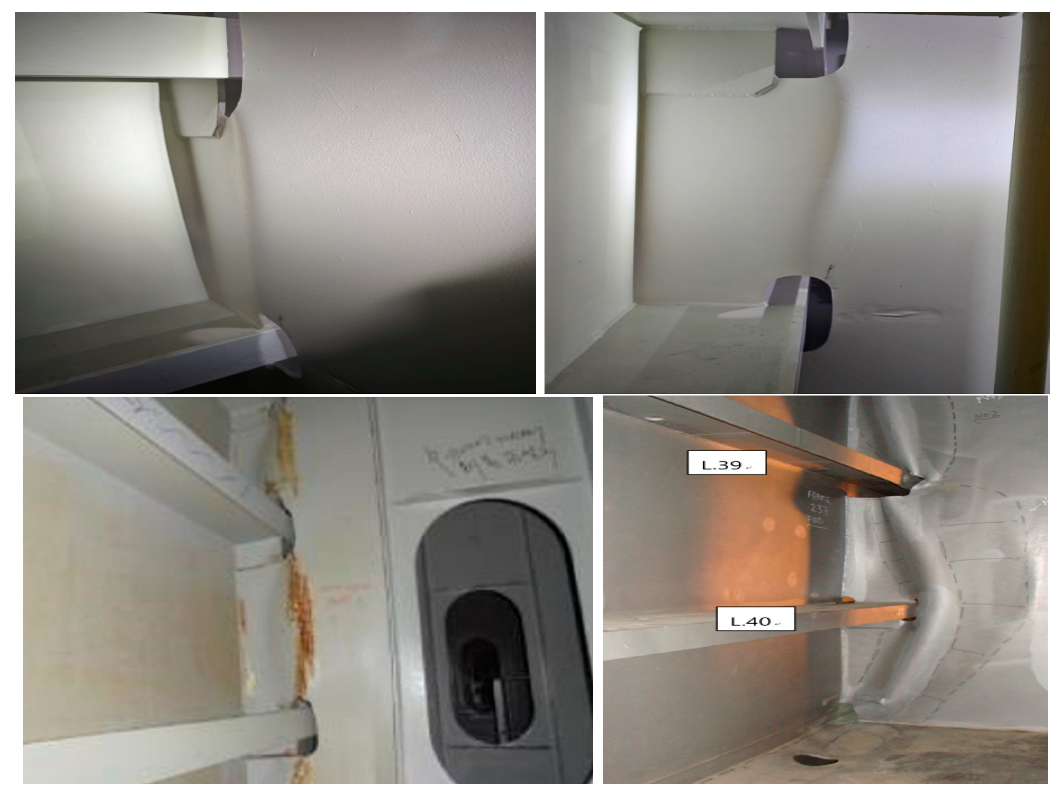
Figure 9), suggesting that vertical loading at an eccentric location is the most probable real-world collision scenario. The curve’s distinctive shape, with a sharp knee followed by a wide plateau, further reflects the onset of structural collapse in a localized zone, consistent with internal buckling and plate deformation observed in the field. Case-3 represents a hybrid loading condition combining horizontal and vertical components. The load–displacement curve follows an intermediate path between Cases 1 and 2. It shows moderate yielding behavior with a wider but shallower plastic region. Although it exhibits permanent deformation, the overall shape of the curve suggests partial stress dispersion, resulting in a deformation mode that does not fully capture the damage intensity observed at Point A. This indicates that oblique loading may have contributed to the impact, but not as the dominant mechanism. In Case-4, the impact is applied uniformly over a 1-m-wide region, simulating a blunt, fender-style contact. The curve reveals higher initial stiffness and smaller plastic deformation, resulting in the lowest residual displacement among all cases. The structure absorbs the load over a wider area, which leads to reduced local stress and strain intensities. This response implies that although the structure undergoes some plasticity, the damage profile is more distributed and less severe, inconsistent with the sharply localized dent observed in the actual damage site. As such, Case-4 is ruled out as the probable collision scenario. Case-5 presents a unique structural response. Despite bypassing outer shell deformation and acting directly on the internal web plate, the load–displacement curve reveals a relatively rapid onset of yielding and notable residual deformation. However, the nature of this deformation is concentrated deep within internal framing, not on the outer hull surface. This diverges from the observed damage pattern in
Figure 9, which includes outer shell denting and stiffener buckling, and therefore suggests that Case-5 may represent an internal overloading scenario unrelated to the actual tugboat collision.
The comparative behavior of the load–displacement curves in
Figure 21 underscores the critical role of load directionality and application method in determining the structural failure mode. Despite a constant magnitude of 200 tons across all cases, the deformation intensity and residual displacement vary significantly due to: Stress trajectory through the frame-web-shell system, Local stiffness discontinuities, Energy concentration or dissipation patterns. The residual displacement observed in Case-2 aligns most closely with the field-measured plastic deformation at Point A, while also producing a plastic strain field consistent with high-resolution FEA predictions. This correlation confirms that the actual damage scenario likely involved a vertically dominant, eccentric impact, such as a bow-up contact by a tugboat during berthing.
To comprehensively evaluate the nonlinear response characteristics of the stern structure under varying collision scenarios, a comparative analysis of load–displacement behavior was performed for all five cases.
Figure 22 illustrates the load–displacement curves extracted from each finite element analysis, providing a collective visualization of the structural performance under constant total load (200 tons) but differing in terms of contact location, orientation, and load distribution.
In Case-1, where the impact force is applied horizontally at the center of the stern panel, the load–displacement curve follows a moderate yielding trend. The structure exhibits a clear transition from elastic to plastic behavior, with a residual deformation indicative of partial energy absorption. However, the deformation depth and residual displacement are limited, suggesting that a horizontally centered load is not sufficient to reproduce the actual damage observed in the field. Case-2, characterized by a vertically dominant eccentric load, presents the most significant post-yield deformation. The curve demonstrates a pronounced loss of stiffness after reaching the yield point, followed by the highest residual displacement among all cases. This behavior is consistent with the high plastic strain and sharply localized dent formation identified at Point A in field measurements. The strain concentration and deformation morphology observed in this case support the hypothesis that a vertically biased impact from a tugboat likely caused the real-world structural damage.
Case-3 introduces an oblique load combining vertical and horizontal components. The load–displacement response lies between those of Cases 1 and 2. Although plastic deformation occurs, the residual displacement is moderate, and the structural response appears more dispersed. This suggests that while oblique contact can induce damage, its effects are less concentrated and do not fully replicate the sharp dent profile documented in the field. Case-4 examines a scenario where the same 200 ton load is uniformly distributed over a 1-m-wide area. The structural response shows the highest initial stiffness and the lowest residual displacement. Due to the wide contact area, stress and strain are diffused over a broader region, resulting in a more distributed deformation. Consequently, Case-4 does not capture the localized severity of damage observed at Point A, and it is considered an unlikely match for the actual incident. Case-5 differs fundamentally from the previous scenarios in that the 200-ton load is introduced internally via wire tension on the Frame 76 web plate. The load–displacement curve in this case shows a sudden yielding with localized deformation focused within the internal structure. Although the residual displacement is notable, the nature of the damage confined to internal framing does not align with the outer shell denting pattern seen in
Figure 22. This implies that Case-5 may represent an internal overloading event, rather than an external collision-induced failure. From the comparative analysis, it is evident that despite the equal magnitude of applied force, the structural response is highly dependent on the mode and location of load application. Among the five cases, Case-2 demonstrates the closest correlation with the actual damage pattern in terms of plastic strain magnitude, deformation shape, and residual displacement. This confirms that a vertically eccentric external impact is the most plausible scenario for the damage observed in the field.
Table 3 presents a comparative analysis of the five collision scenarios simulated in the study, focusing on key parameters such as colliding location, load area, applied load, and resulting plastic strain at Point A. This point was selected as the critical reference location because it corresponds to the actual measured plastic deformation of 27.5 mm observed in the field. The table highlights that Case-2, characterized by an eccentric vertical impact, produced the highest plastic strain (3.1%) at Point A under a load of 172 tons, closely matching the field-measured deformation profile. In contrast, Case-1 and Case-3, which involved equal and eccentric horizontal impacts, respectively, resulted in lower plastic strains (2.6% and 2.3%) despite similar load magnitudes. Case-4, with a wider load distribution area, showed a moderate plastic strain of 2.7%, while Case-5, simulating internal wire tension, exhibited 2.9% strain. These results demonstrate that the load orientation and distribution significantly influence the localized plastic deformation, with vertically eccentric impacts (Case-2) being the most probable cause of the observed damage due to their alignment with the field data. The table thus serves as a quantitative foundation for identifying the collision scenario that best explains the actual structural damage.
