Abstract
This study investigates the effect of Hull Vane® on the total resistance and propulsion performance of a patrol vessel using computational fluid dynamics (CFD). Utilizing SHIPFLOW software, multiple simulations were conducted to evaluate how Hull Vane® position and angle of attack influence hydrodynamic performance. A patrol vessel hull form the MAXSURF’s library was selected to investigate resistance and propulsive performance. Nine (9) configurations (named Cases A to I) of the Hull Vane® were examined based on variations in longitudinal position and angle of attack. A grid independence study was conducted to determine the optimal mesh configuration. Validation was performed using the Holtrop–Mennen power prediction method and MAXSURF. According to this study, results indicate that Hull Vane® configurations significantly reduce total resistance and delivered power at higher vessel speeds, with the best improvement in resistance occurring in Case C and in propulsion power in Case B. Propulsive efficiency was maximized in Case E. Furthermore, the study also demonstrates the potential of Hull Vane® as a practical retrofit for enhancing naval vessel performance and reducing energy consumption.
1. Introduction
Reducing resistance on naval vessels is essential for improving fuel efficiency and lowering environmental impact. One method that is gaining popularity is the use of appendages such as the Hull Vane® from Hull Vane BV, Netherlands, a fixed hydrofoil installed below the stern [1,2,3]. This appendage alters flow patterns to reduce drag and improve propulsion efficiency.
The maritime industry is increasingly adopting CFD as a cost-effective alternative to traditional towing tank tests [3,4,5,6]. This study leverages CFD simulations to analyze Hull Vane® performance. It uses SHIPFLOW software to assess various configurations for a patrol vessel. The main objective is to identify optimal Hull Vane® arrangements that minimize total resistance and effective power requirements.
Hull Vane® generates forward thrust while correcting stern trim, reducing wave resistance. Prior studies showed up to 32% resistance reduction, particularly at higher speeds [3,7]. Positioning and foil angle are critical parameters, as studies have shown that incorrect placement can degrade performance [7]. One of the potential challenges of Hull Vane® is proper installation. This requires precise calculations and expertise to avoid performance issues. Additionally, retrofitting existing vessels can be complex and costly, as it may require structural modifications to accommodate the appendage.
A study by Uithof et al. (2014) involved the CFD computation of a 42 m motor yacht ‘Alive’, which results in a maximum of 23% total resistance reduction ratio at Fn = 0.44 with a positive curve gradient beyond this Fn value [8]. In the same study, the total resistance difference ratio is positive below Fn = 0.225. This case study also shows the comparison between the engine brake power of the hull form absent and fitted with Hull Vane® at the same speed; the power and its curve’s gradient for the hull form fitted with Hull Vane® is generally lower across all tested speeds, with an increasingly larger gap between the two curves at higher speeds.
Uithof et al. (2016) further investigated the effect of Hull Vane® on two 167 m vessels: container ship ‘Rinborg’ and RoPax vessel ‘Norbank’ [9]. The CFD computation of RoPax vessel ‘Norbank’ reported a 10.1% total resistance reduction at 20 knots in a flat-water condition. There is also a 4.46% reduction in added resistance due to waves, which contributed to the overall decrease of the total resistance.
The subsequent case study discussed by Avala (2017) discussed the effect of Hull Vane® on the total resistance reduction of two vessels: 167 m container vessel ‘Rijnborg’ and 42 m motor yacht ‘Alive’ [10]. Both of these case studies conducted validation using towing tank model tests to confirm the results obtained through CFD optimisation. In the case study involving the 167 m container vessel proposed by Avala (2017) and Uithof et al. (2016), it is found that for CFD calculations, resistance reductions of 4.7% and 8.4% are obtained for model scale at Froude Number (Fn) 0.22 and 0.27, respectively [10,11]. Given the validation, a resistance reduction of 10.1% and 15.5% for full-scale computations is achieved. For the same two Fn, the propulsion performance gain is 3.3% and 10.2%, respectively.
Next, Uithof et al. (2017) investigated the effect of Hull Vane® fitted on a 50 m patrol vessel from the AMECRC series #13 with a round-bilged fast displacement hull [10]. The investigation was carried out using CFD simulation software at speeds between 8.6 and 34.4 knots. In the majority of the speed range, the simulation results show a 32.4% resistance reduction. Bouckaert et al. (2016) investigated the effect of Hull Vane® fitted on a Holland Class 108 m Oceangoing Patrol Vessel of the Royal Netherlands Navy. This investigation heavily relies on CFD software simulation [11].
Hannan et al. (2018) discussed the effect of Hull Vane® fitted to a patrol vessel using CFD software [12]. The discussion shows a reduction from 1.569% to 2.736% for wave-making resistance at 30 knots. In addition, the overall total resistance is reduced for all tested speeds, with the percentage reduction increasing at higher speeds. From the previous studies regarding the effect of Hull Vane®, a common trend is that the total resistance reduction is larger at higher speeds. The wave-making resistance coefficient is largely contributing to the overall reduction.
Furthermore, an investigation of the effectiveness of a stern foil on a patrol boat by experiment and simulation was performed by Budiyanto et al. (2020) [13]. On the transom of the ship model, a stern foil was installed parallel to the keel direction (3° to the x-axis). In response to this position, a force with an x-axis angle was created. However, these studies have some limitations. For example, the study by Uithof et al. (2014) only tested the Hull Vane® at specific speeds and may not account for its performance under different conditions [9]. Additionally, the study by Budiyanto et al. (2020) only tested the stern foil on a specific ship model and may not be applicable to other types of vessels [13].
Subsequently, a study from Soma and Vijayakumar (2023) performed a numerical investigation on the effect of hull vane on a high-speed displacement vessel [14]. At a 1:35 scale, the researchers investigated the effects of retrofitting a hull vane to a high-speed displacement vessel in X and Z directions. The placement of the hull vane is critical as it directly affects the vessel’s hydrodynamic efficiency and performance. Proper positioning can improve lift and reduce drag, optimizing fuel efficiency and increasing speed. Conversely, incorrect placement may result in suboptimal performance, diminishing the potential benefits of the hull vane and impacting the vessel’s overall effectiveness.
In response to the rapid evolution in hydrodynamic research, particularly concerning novel energy-saving devices, several recent advancements are discussed in this section. Over the past few years, significant strides have been made in understanding the complex flow interactions, optimization techniques, and performance prediction of innovative appendages such as the Hull Vane®. Specifically, we have now included contemporary studies that address all these advancements [14,15]. These additions aim to provide a more comprehensive and up-to-date overview of the current state-of-the-art Hull Vane® research, ensuring that our study is contextualized within the latest developments and addresses the most pertinent challenges and opportunities in the field.
This study builds on these foundations using Hannan et al. (2018)’s patrol vessel hull from [12], applying tested foil profiles (NACA4412) across several longitudinal positions and angles of attack, validated against Holtrop–Mennen’s resistance predictions. The variation in longitudinal positions can significantly impact study outcomes by influencing the flow dynamics and pressure distribution around the hull. Different positions can alter the lift and drag forces experienced by the vessel, potentially leading to variations in resistance reduction and overall performance. Therefore, precise determination of these positions is crucial for optimizing the foil’s effectiveness and achieving desired performance improvements across various vessel types.
2. Principle of Hull Vane® on Resistance and Propulsion Aspects
Hull Vane® is a foil that functions like a hydrofoil; however, its main principle is not to lift the vessel, but rather to generate a forward-oriented lift force and reduce the stern wave [10]. Figure 1 illustrates how Hull Vane® acts as an energy-saving device through a forward-oriented lift force. By reducing the vessel’s resistance, fuel consumption and emissions are reduced. Furthermore, Hull Vane® improves the vessel’s seakeeping by dampening pitch and heave motions, enhancing comfort and safety.
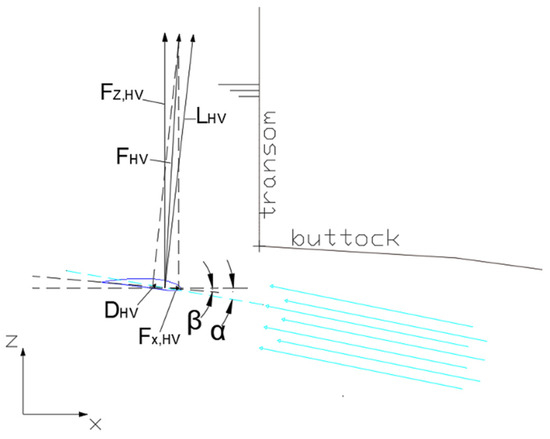
Figure 1.
Hull Vane® produces forward thrust force under the stern. The blue lines with arrows in the Figure indicate induced water flow into the leading edge of the Hull Vane.
The parameters α and β are defined as the Hull Vane® inflow angle and Hull Vane® angle, respectively. These angles are characterized by the angular distance 4 between the chord lines and the inflow angle or fixed x-axis relative to the keel. Given a trim angle (θ), the thrust force generated by the foil can be calculated using the following:
FX,HV = sin(α + β + θ) ∗ LHV − cos(α + β + θ) ∗ DHV,
Lift force generated by the Hull Vane® is denoted by LHV, which acts perpendicular to the water flow direction. Subsequently, the drag force of the Hull Vane® is identified by DHV and is parallel to the flow direction. These vectors can also be described by the force components at the x and y-axis of the Hull Vane®:
whereby lift and drag forces can be estimated using their respective coefficients:
FHV = LHV + DHV = FX,HV + FZ,HV,
LHV = CL ∗ 1/2 ρV2A,
DHV = CD ∗ 1/2 ρV2A,
In cases where there is a reduction in total resistance and an improvement in propulsive efficiency, the x-component of the lift vector is greater than the drag vector of the same component. Lift generated by the Hull Vane® causes the hull to lift aft, decreasing the wet surface area, resulting in reduced frictional resistance. Another feature of Hull Vane® as an energy-saving device is the ability to correct vessel trim. Trim correction, more specifically, its reduction affects the total resistance reduction at higher speeds since the force in z-direction proves to have a large influence on the vessel’s overall trim and hence, its total resistance [7,10,11]. Referring to Figure 1, the force on the z-axis can be estimated using:
FZ,HV = cos(α + β + θ) ∗ LHV + sin(α + β + θ) ∗ DHV,
Using Equation (5), the trim reduction due to Hull Vane® can be derived using the following equation:
Trim changes affect the Hull Vane® inflow angle, so with a trim reduction, hull performance can be improved. Hull Vane® reduces vessel wave formation, especially towards the stern area. This is due to the creation of a low-pressure region on the top surface of the Hull Vane®. The interaction between this low-pressure region and the transom wave results in a significantly lower wave profile [10]. This effect can be seen in Figure 2. This reduction in wave formation leads to a decrease in wave-making resistance.
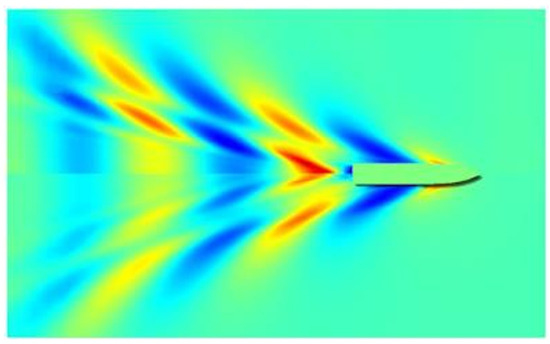
Figure 2.
Wave pattern of a 55 m supply vessel at 20 knots, which is reproduced from [10]. (Blue portrays a wave through, red potrays a wave crest).
Uithof et al. (2016) investigated the wave pattern formation with and without the Hull Vane [11]. The comparison made by Uithof et al. (2016) can be found in [11], which demonstrates that the inclusion of Hull Vane significantly reduces the wave pattern. Figure 3 is reproduced for comparison purposes from [11].

Figure 3.
Comparison between wave formation with and without Hull Vane®.
2.1. Hull Vane® Positioning
Avala (2017) experimented with the position of the Hull Vane® between varying distances of its x-axis relative to the reference point for AMECRC series #13 [8]. At 0 m, −1 m, and −2 m x-axis, increased resistance/weight was observed at more positive x-axis positions. This indicates that total resistance reduction is higher at negative x-axis positions.
Hannan et al. (2018) investigated the position of Hull Vane® on a patrol vessel with eight case studies regarding the size and distance of the foil [12]. The case studies conducted simulations on the foil position from −0.5 m to −1.5 m with varying widths. For all tested speeds, the Hull Vane® with −1.2 m x-axis direction and 0.16 m width yielded the biggest reduction in total resistance compared to the bare hull. Given that this study shares the same hull form as Hannan et al. (2018), a similar result may be obtained from this study [12].
2.2. Validation with Holtrop–Mennen Power Prediction Method
Holtrop and Mennen (1982) developed a statistical method used to determine the total resistance and the required propulsive power at the initial design stage of a ship [16]. Prediction methods focused on improving the power prediction of slender naval ships with low L/B ratios. The applicability of this method is limited to an L/B ratio of 3.9 to 15 and a prismatic coefficient (Cp) of 0.55 and 0.85. This method is applied since there is no experimental data on this hull form available using the towing tank and the few data that are available from previous investigations are obtained by Holtrop–Mennen power prediction method.
The total resistance equation proposed by Holtrop and Mennen (1982) is subdivided into several components [16]:
Rtotal = RF (1 + k1) + RAPP + RW + RB + RTR + RA
Where:
- RF is the frictional resistance according to the ITTC-1957 friction formula
- 1 + k1 is the form factor describing the viscous resistance
- RAPP is the resistance of appendages
- RW is the wave-making and wave-breaking resistance
- RB is the additional pressure resistance induced by the bulbous bow
- RTR is the additional pressure resistance induced by the transom
- RA is the model ship correlation resistance
A pair of expansions of this equation has been formulated by Molland et al. (2011) [17] for the RW component of Equation (7). Holtrop and Mennen (1982) stated that the value for total resistance held true for Fn below 0.40, for increased values of Fn [16,17]. In this investigation, the prediction method proposed by Holtrop and Mennen (1982) and its revisions is used only for resistance validation of the hull form; hence, the propulsion prediction is ignored [16].
The selection of the Holtrop–Mennen method for the preliminary resistance prediction of the patrol vessel hull form was carefully considered based on the vessel’s key geometric characteristics, falling within the method’s recommended applicability ranges. Specifically, the hull’s slenderness ratio (L/B) and prismatic coefficient (Cp) are consistent with the typical range of ship types for which the Holtrop–Mennen method has demonstrated reasonable accuracy.
This empirical method, developed from regression analysis of extensive model test data, is widely recognized for its utility in the initial design stages of conventional hull forms. While acknowledging that empirical methods inherently carry limitations regarding their universality, the alignment of the patrol vessel’s main dimensions and coefficients with the database underpinning the Holtrop–Mennen method provides a sound basis for its application in this comparative study. It serves as a valuable benchmark for evaluating the CFD results, particularly in the absence of direct experimental data for this specific hull.
3. Numerical Set-Up
3.1. Model and CFD Software
A patrol vessel hull from MAXSURF’s library, identical to Hannan et al. (2018), was used [12]. The model was imported into SHIPFLOW via IGES format after preparation in MAXSURF Modeler. Simulations employed the RANS-based solver in SHIPFLOW using VOF free surface treatment. The patrol vessel possesses a low block coefficient (Cb) along with a relatively high waterplane coefficient (Cwp) that forms a slender hull. Referring to Table 1, the relevant ratios for this hull are 5.98 for L/B and 3.155 for B/T, whilst having a prismatic coefficient (Cp) of 0.638. These ratios ensure that the requirements needed for the Holtrop–Mennen power prediction method are met for this hull form.

Table 1.
Hydrostatics of hull form at DWL at full scale.
The hull form also possesses a transom at the stern and is equipped with a skeg that extends throughout the midship to the afterbody. This is illustrated in Figure 4a–c. As a result of Hannan et al.’s (2018) [12] research, the vessel’s maximum speed is set at 30 knots.

Figure 4.
(a) Body plan of the patrol vessel, (b) profile plan of the patrol vessel, (c) half-breadth plan of the patrol vessel; the body plan of this patrol boat is readily available in the open-source library.
SHIPFLOW software can import an IGES file format to be used as an offset file for CFD simulation. It is necessary to convert the model of the hull from its existing .msd MAXSURF model file format to what SHIPFLOW requires. Due to the nature of the SHIPFLOW calculation, especially during wave flow generation, the patrol vessel model must be bare hull, and its appendages retrofitted using SHIPFLOW commands.
3.2. Configuration Settings and Convergence Study
Through the use of a volume of fluid (VOF) configuration, the simulation is conducted in a three-dimensional setting with SHIPFLOW. This option allows the simulation to generate the shape and position of the flow, while also capturing the interaction between water and air. SHIPFLOW can also solve resistance and propulsion simulation using fluid mechanics numerical methods through three solvers: XPAN, XBOUND, and XCHAP; and through two generators: XMESH and XGRID.
XPAN refers to the solver for potential flows around three-dimensional bodies based on the two-dimensional panel generator XMESH. XPAN is particularly useful for simulations involving flows with or without a free surface, ship flows with a transom stern, and ship flows with varying sinkage or trim. One significant reason to include XPAN in the configuration is the ability for XMESH to handle appendages. This will enable it to calculate lift and induced drag, as well as relevant pressure contours on the hull at wave profiles that include the appendages. The results of XPAN are compiled in a database file id_XPDB, which is used by XBOUND, XGRID, and XCHAP.
With XBOUND, boundary layer theory calculations are solved using momentum integral equations along streamline traces of potential flow. This solver is also capable of computing from laminar to turbulent boundary layer transition for simple cases, at smooth 18 or specific surface roughness. The result of XBOUND is compiled in a database file ID_XBDB, which is used by XCHAP.
XCHAP refers to the solver for Reynolds-averaged Navier–Stokes (RANS) equations. A zonal or global approach to resistance and propulsion calculation can be used with this solver, which uses the three-dimensional grid provided by XGRID. The main function of this solver is the computation of viscous resistance, wake flow, and propeller/hull interaction whilst handling overlapping grids. This is particularly pronounced at the after-body region where appendages are fitted. However, one drawback of applying XGRID in the RANS equation is its inability to calculate viscous computation for appendages. Therefore, results from XPAN and XBOUND are applied instead. Omitting XPAN and XBOUND causes XCHAP resistance and propulsion calculations to be lower than actual.
XFLOW commands are used to define the general properties, conditions, and parameters of the hull form in the simulation. The command ‘all’ instructs the program to run all three solvers, whereas ‘hull’, ‘fsflow’, and ‘coarse’ commands describe a single hull that includes a free surface for potential flow calculation, of which its mesh density (XMDENS) is pre-determined. Under XCHAP commands, ‘maxit’ is the instruction for the number of iterations and ‘xgref’ instructs the grids from XGRID to auto-refine for optimal computation time. The maximum iteration was defined based on a few simulations, where it was defined based on the standard deviation of the last iteration and the percentage difference of the last iteration.
Multiple mesh configurations were tested. 3.2 million cell counts were determined for balancing accuracy and computational efficiency. Multiple simulation series must be carried out under different parametric grid conditions to determine the optimal grid cell number. This will result in accurate results per validation in the shortest computation time possible.
In the grid independence study (GIS), the XGRID command is modified to control the grid cell distribution. The commands ‘etamax’ and ‘zetamax’ adjust the number of planes in the circumferential and radial directions, respectively. The commands ‘nu’, ‘nf’, ‘nm’, ‘na’, and ‘nw’ adjust the number of planes (clusters) in the longitudinal direction, whereas ‘xend’, ‘xapd’, ‘xapu’, ‘xfpd’, ‘xfpu’, and ‘xstart’ determine the position of the flow stream as illustrated in Figure 5. These seven commands are changed for every subsequent simulation to increase grid cells (Refer to Appendix A.5).
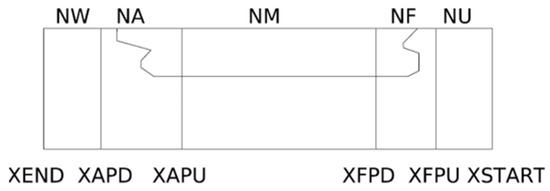
Figure 5.
Graphical representation of the longitudinal distribution and its command acronym in SHIPFLOW software (version 6.5.09).
3.3. Retrofitting the Appendages
After determining the optimal grid cell configuration during GIS, the bare hull is retrofitted with appendages relevant to the resistance and propulsion calculation. The appendages are fitted to the bare hull using XFLOW commands, which describe the appendage shape and position. The appendage fitting model configuration used (refer to Appendix A.2) resulted in the 3D view as illustrated in Figure 6 and Figure 7. In appendage modelling, the skeg is omitted since its effect is negligible and only lengthens the computation time.
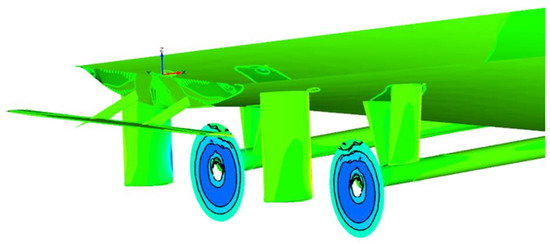
Figure 6.
Three-dimensional view of appendages fitted to the hull. The green color represents the hull and the appendages i.e., brackets and rudders, and blue rings representing the propeller plane.
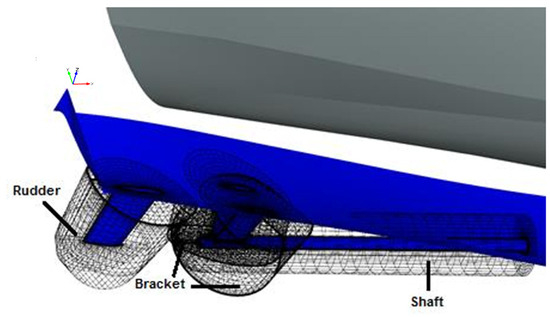
Figure 7.
Mesh visualization of overlap between hull surface and appendage meshes.
One consideration to be taken when fitting the appendages to the hull is to ensure that the mesh for the appendages overlaps with the hull form. This is carried out to avoid leakage when running the simulation, resulting in SHIPFLOW terminating the simulation prematurely. An image visualization of the overlap is shown in Figure 7 and Figure 8.
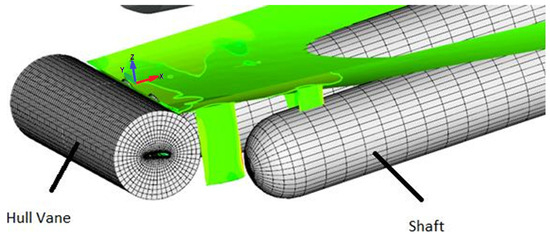
Figure 8.
Mesh visualization of Hull Vane® and shaft.
The arrangement and dimensions of the required appendages to be fitted on the bare hull are calculated within SHIPFLOW using various commands. Figure 9 and Figure 10a,b illustrate the arrangement and dimensions needed to model the appendages as shown in Figure 6. In SHIPFLOW it is not necessary to model the appendages on the port side of the ship, as the simulation will automatically mirror both sides of the ship. Modelling both the port and starboard sides of the ship will not only lengthen computation time but also risk an inaccurate result due to possible asymmetry.
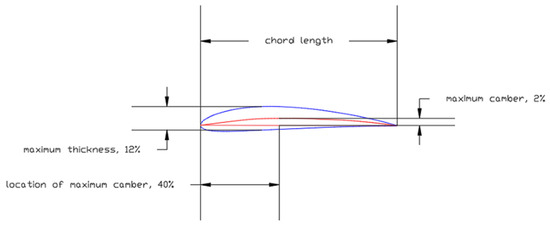
Figure 9.
NACA4412 foil profile. (The top red line indicates the mean line and bottom red line indicates the nose-tail line).
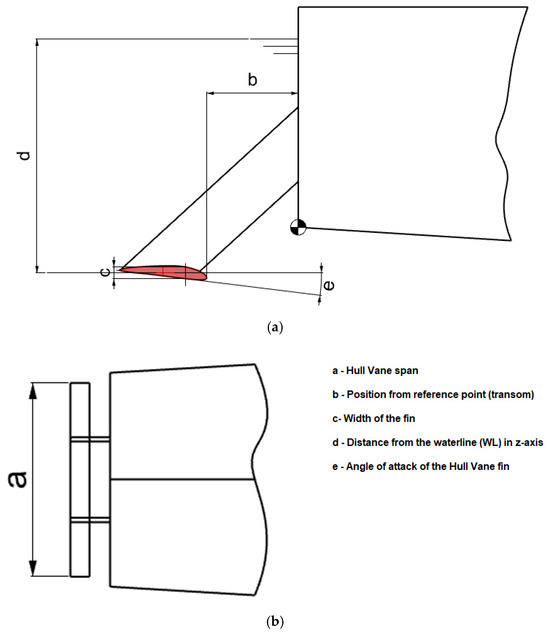
Figure 10.
(a) Side view of Hull Vane® dimensions; (b) top view of Hull Vane® dimensions.
3.4. Hull Vane® Configurations
In accordance with the investigation by Hannan et al. (2018), the Hull Vane® profile adopted is from the National Advisory Committee for Aeronautics (NACA) 4-digit series foil, whose given acronym is NACA4412 [13,16]. Each digit in the 4-digit code represents four distinct parameters describing the foil; the first digit represents the maximum camber in percent chord; the second digit indicates the location of the maximum camber along the chord line from the leading edge in tenths of chord 23; and the last two digits give the optimum thickness in percent chord. Figure 9 shows NACA4412’s profile.
In this experiment, the Hull Vane® was used in a similar manner as in the investigation by Hannan et al. (2018) [12], are listed in Table 2. Though in three cases, the maximum thickness is slightly different from the NACA4412 profile.

Table 2.
Dimension of adopted Hull Vane® profile is adopted from [12].
Nine Hull Vane® arrangements (Cases A–I) were defined, varying in longitudinal position (−1.5 m to −2.0 m from transom) and angle of attack (5–10°). The foil used was NACA4412, 1.25 m span, 0.12 m width. Moreover, this experiment examines how Hull Vane® affects the overall resistance of the patrol vessel at different shapes and longitudinal positions from the reference point. The case studies explore the effect of Hull Vane® on two variables: position from the reference point and angle of attack.
3.5. Nine Configurations of Cases
This experiment also explores the effect of Hull Vane® on the overall resistance of the patrol vessel at different shapes and longitudinal positions from the reference point. The case studies explore the effect of Hull Vane® on two variables: position from the reference point and angle of attack. Table 3 shows its dimensions.

Table 3.
Dimension of the Hull Vane® case studies.
3.6. Resistance and Self-Propulsion Performing Test
In this investigation, two separate runs are performed for each case study and the hull form without Hull Vane®. This is because both resistance and self-propulsion tests are required to obtain the complete results needed for this investigation. For each case study, five different ship speeds are tested for both resistance and self-propulsion, resulting in ten runs for each case study. For every simulation, there is a convergence criterion that can be set using appropriate commands that instruct SHIPFLOW to stop iterating the calculations, thus ending the simulation.
However, due to the default criteria being small, it is likely that the simulation will iterate indefinitely because the results obtained will not sufficiently converge. To overcome this problem, two possible solutions are available. The first is to manually lower the convergence criterion. The other solution is limiting the iteration of the calculations until the result converges to its possible minimum.
In this investigation, the latter solution is chosen for every run since it is difficult to predict the minimum point of possible convergence achieved by SHIPFLOW for each run, thus increasing the possible uncertainties. This iteration command can be seen in Appendix A.1, denoted by ‘maxit’. Another necessary command for the simulation is ‘onefill’. This command instructs SHIPFLOW to seal all leaks on the hull due to the appendage fitting. By summoning this command, it will prevent the simulation from detecting leaks, thus preventing sudden simulation abortions. In the self-propulsion test, all case studies share the same arrangement and propeller, MP2208, as in Appendix A.3. This propeller is a model used in lifting-line theory.
4. Results
4.1. Hull Form Validation Results
The total resistance obtained for validation from three different computer programs is shown in Figure 11 below.
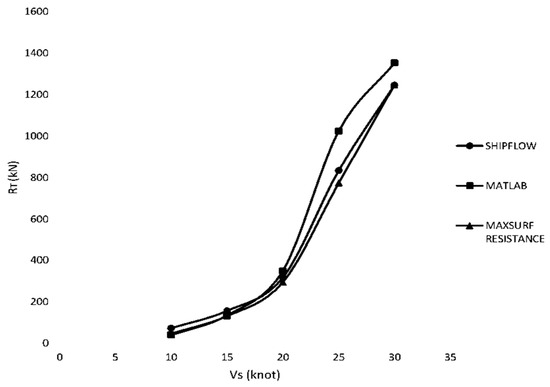
Figure 11.
RT vs. VS graph for three different computer programs.
Figure 11 shows that the results for RT are relatively similar up to 20 knots. However, the deviation between the curve for MATLAB (version R2024b) and the other programs widens until 30 knots. This deviation seems to stem from the expanded equation for RW beyond Fn of 0.40 as mentioned by Molland et al. (2011) in the MATLAB script [17]. The differences between the MATLAB curve and the others are as large as 251 kN at 25 knots. An interesting note to consider is the curvature of the results beyond 20 knots, whereby the MAXSURF 30 Resistance gradient is constant, suggesting linear extrapolation used by the program’s script. The curves for SHIPFLOW and MATLAB exhibit a point beyond 20 knots where the gradient of the curve is bigger than average at the instance of 25 knots, indicating the presence of humps due to the interference of wave systems.
Further analysis of the differences between resistance components can be made by referring to Table 4, Table 5 and Table 6, particularly in the comparison between RW values. At 20 knots, the RW for SHIPFLOW and MATLAB is 106.1 kN and 214.23 kN, respectively, giving a difference of 108.13 kN. Interestingly, at 30 knots, where there is no hump, the difference between the RW values is 106.12 kN, whereas at 25 knots, it is 189.52 kN. A hump caused by wave systems is further reinforced by this trend.

Table 4.
Validation results for SHIPFLOW.

Table 5.
Validation results for MATLAB using Holtrop–Mennen power prediction method.

Table 6.
Validation results for MAXSURF Resistance.
Similarly, the values of RF for both SHIPFLOW and MATLAB results show an increasing divergence between the two results at higher speeds, with the MATLAB script producing a greater value than the SHIPFLOW computation. However, the differences between them are not significant. Another component that may play a small role in the deviation from the RT curves is correlation resistance, RA. This increases at higher speeds. This is critical since the correlation effect is not fully understood during extrapolation.
4.2. Grid Independence Study Results
The process of GIS is to determine the plane distribution configuration that yields an accurate result at the shortest computation time. The plane distribution is represented by the no. of cells produced during the simulation, which are then plotted against their respective result. The graphs for GIS are shown in Figure 11.
In Figure 12, the circle represents the optimum cell number for this investigation, where the plane distribution configuration is used for all subsequent experiments. This value is determined by drawing a line that intercepts most of the oscillating part of the curve (refer to Appendix A.4 for a comprehensive result for Figure 12).
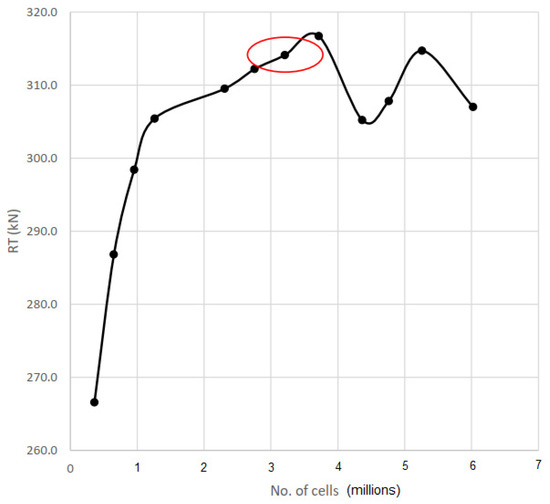
Figure 12.
RT vs. no. of cells graph. The circle represents the optimum cell numbers used in the CFD simulation which was at 3.2 millions cells.
Referring to Appendix A.4, the values of ‘etamax’ and ‘zetamax’ play a significant role in the computation time of the simulation. Therefore, it is favorable that these values are low whilst maintaining the number of cells. Due to the limitations of the computers used to run the simulations, achieving cell numbers beyond 6 million is difficult since large cell numbers tend to result in SHIPFLOW crashing. Large cell 32 numbers may also result in computation time, which does not justify CFD usage, given the technical specification of the computers used.
Figure 13 yields a fascinating result, whereby the deviations of the CT curves are caused by the offset of the respective CF value. This may be because of form factors.
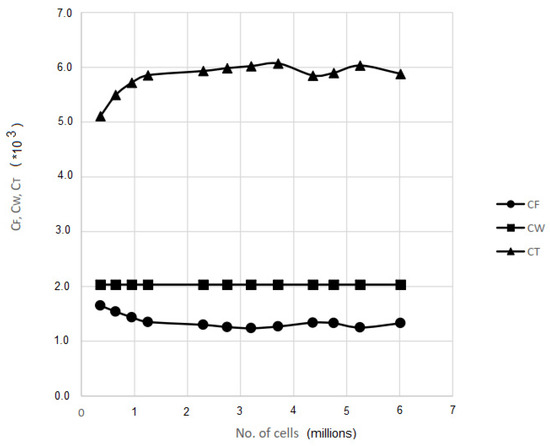
Figure 13.
CF, CW, CT vs. no. of cells graph.
The value of CW remains constant throughout all simulations since the ship speed is constant at 20 knots. This may be due to the command ‘fsflow’, which generates the fluid in a 2D plane, thus limiting wave-making computations (see Appendix A.1).
4.3. Resistance Test Result
The percentage changes of total resistance obtained in ten case studies compared to the hull form without Hull Vane® are shown in Figure 14 below.
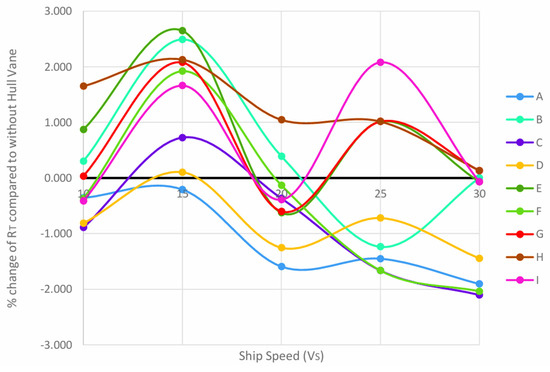
Figure 14.
Percentage change of RT in all case studies compared to without Hull Vane® for all speeds.
The general shape of the curves, as illustrated in Figure 14, shows an oscillating curve whereby the percentage increase is high at 15 and 20 knots. Though this is an exception for case B at 25 knots, since the percentage decrease is the opposite of the general trend. The percentage decrease is more apparent at higher speeds, particularly at 20 knots, as only cases B and H yield negative results. For case A, the simulation runs across all tested speeds resulted in a percentage decrease compared to the hull without Hull Vane®. However, the percentage decrease may not be as significant at 25 and 30 knots. For case studies 34 with a 10° angle of attack (cases A, B, and C), there is a positive improvement in speed beyond 25 knots.
The greatest resistance reduction in all simulation runs is case C for 30 knots. This yielded a −2.104% reduction compared to the hull without the hydrofoil. Case H is the only arrangement in which simulation runs do not result in a percentage decrease in total resistance for all case studies.
The chart in Figure 15 illustrates the percentage change of total resistance for nine case studies compared to the simulation run without Hull Vane® at 10 knots. The chart shows that at low speeds, most case studies yield a decrease in total resistance, albeit at a low percentage. However, it must be noted that in cases B, E, G, and I, the total resistance increases compared to the use of foil.
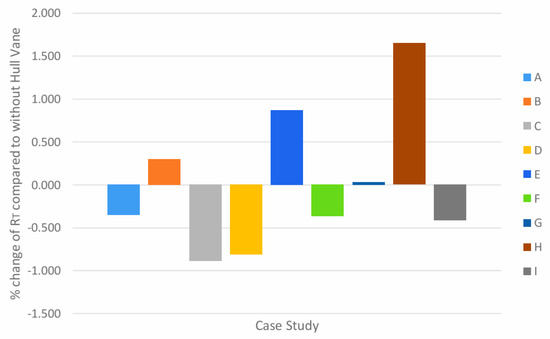
Figure 15.
Percentage change of RT in all case studies compared to without Hull Vane® at 10 knots.
The common factor between cases B, E, and H that yields the most significant increase is the position of the Hull Vane® from the reference point at −1.75 m of x-axis; this indicates that at 10 knots, there is no lift force generated by the Hull Vane® due to an unfavorable wave system and interference. For cases C, F, and I, where Hull Vane® is −2 m from the reference point, the total resistance shows a reduction throughout all cases. By comparing the raw data of Figure 15, the case study that yields the greatest reduction is case C at −0.892% whereas the greatest increase in total resistance comes from case H at 1.650%.
In Figure 16, all cases except case A resulted in an increase in total resistance compared to the simulation run without Hull Vane®. The overall trend indicates that at 15 knots, there is no lift generated by the foil, but rather, more drag force is created. Given that the percentage increase varies between cases, the interaction between the foil and the wave system may cause interference that results in a hump at 20 knots. For cases A and D, the 36 percent change is negligible, indicating that Hull Vane® is minimal when the foil position is −1.5 m from the reference point at an angle of attack beyond 5°.
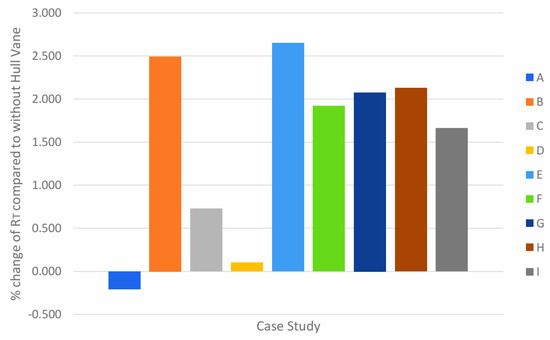
Figure 16.
Percentage change of RT in all case studies compared to without Hull Vane® at 15 knots.
Despite the minimal effect, only case A yielded a positive result; thus, this arrangement is the most suitable for ship speed at 15 knots. The percentage change for case A is −0.208%, whereas the result that yielded the greatest increase in total resistance is case E at 2.648%.
The bar chart in Figure 17 shows a more favorable result across all case studies. Only two cases give a percentage increase of total resistance, which are cases B and H. Interestingly, the result for case E yielded a reduction despite all these three cases sharing the same longitudinal position of the Hull Vane® from the reference point at −1.75 m. This indicates that at 20 knots, having the angle of attack at 7° resulted in a lift force generation by the foil. This may occur due to a favorable wave system generated between the interaction of the foil and its hull. 37 The chart also shows that cases A, C, and G resulted in the most significant total resistance reduction compared to cases that share the same angle of attack; therefore, an arrangement where the Hull Vane® is −1.5 m from the reference point is the most suitable at 20 knots.
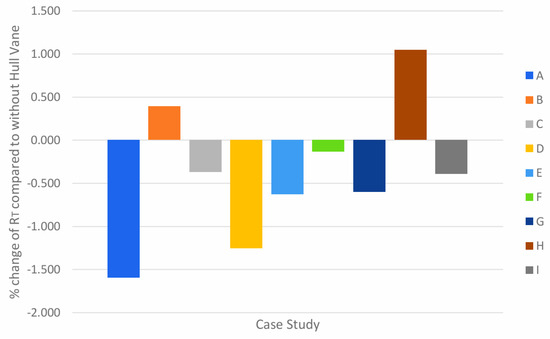
Figure 17.
Percentage change of RT in all case studies compared to without Hull Vane® at 20 knots.
The greatest reduction in total resistance comes from case A, which yielded a −1.594% decrease. Case H resulted in the greatest increase at 1.045% compared to the results without Hull Vane®.
Next, multiples illustrated in Figure 18, there is a great disparity between the total resistance increase and reduction throughout all cases. The cases with an angle of attack of 5° all resulted in an increase of resistance, thus indicating that the angle is not large enough for the foil to generate a lift force that is greater than the drag force created. However, case E exhibits an increase in total resistance despite cases D and F showing a reduction.
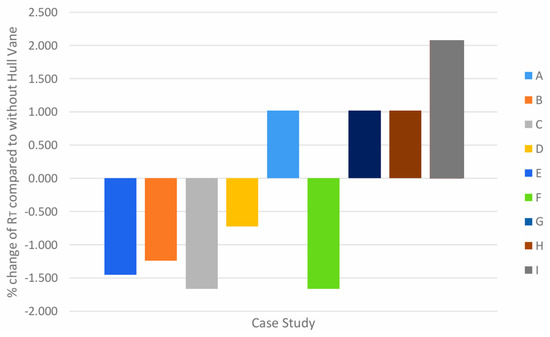
Figure 18.
Percentage change of RT in all case studies compared to without Hull Vane® at 25 knots.
This may be because the humps are greater than 38 in this arrangement at 25 knots. This is supported by the smaller percentage reduction at case B compared to cases A and C. Hence, there may be constructive wave interference when the position of Hull Vane® is at −1.75 m from the reference point, though the angle of attack of 10° for case B is large enough to generate a significant lift force.
From Figure 19, the most significant total resistance reduction is shared by both cases C and F at −1.664%, while similar values may arise from rounded values of the total resistance coefficient for both of these cases. The case that yielded the most significant increase in case I at 2.080%.
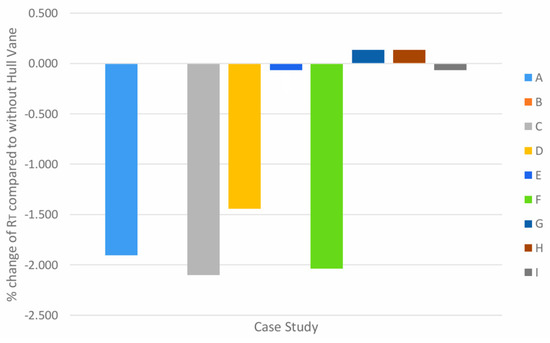
Figure 19.
Percentage change of RT in all case studies compared to without Hull Vane® at 30 knots.
The effect of Hull Vane® is most positive at 30 knots in comparison to all other speeds tested. This is shown in Figure 19, where all cases with a total resistance increase result in a small percentage increase. The disparity between the resistance 39 increase and the reduction is greater compared to Figure 18. Cases C and F have a resistance reduction beyond 2% whereas the reduction for case A is nearing 2%. The general trend at 30 knots shows that cases with a Hull Vane® longitudinal position at −2 m from the reference point yield the most positive result compared to cases with a similar angle of attack.
This indicates the importance of the longitudinal arrangement of the foil in the generation of lift force and in the interference of favourable wave systems. In cases where the result yields a resistance increase, the percentage increase is no more than 0.15%. Another interesting result is in case C, where the arrangement resulted in no change in total resistance. The largest total resistance reduction is −2.104% for case C, whereas the largest increase is 0.131% for both cases G and H. Overall, the general trend of RT across all speeds and case studies shows that the effect of Hull Vane® is more positive at higher speeds, with case study A exhibiting resistance reductions across all tested speeds.
4.4. Self-Propulsion Test Result
4.4.1. Delivered Power
The delivered power (PD) obtained in ten case studies, including the hull form without Hull Vane®, is compiled in the graph shown in Figure 19 below. Delivered power refers to the power supplied to the propeller to move the ship at a given ship speed. It is a function of effective power (PE) and the effect of flow conditions around the propeller and propeller efficiency itself. The value of PD is also a ratio of thrust power by propeller (PT) over propulsive efficiency behind the hull (ηB), which in turn is a function of open water efficiency (ηO) and relative rotative efficiency (ηR).
Referring to Figure 20, it shows an oscillating curve of the percentage change, which is consistent with the RT change from Figure 14. Again, by comparing the results in Figure 14, the percentage decrease is more significant at speeds beyond 20 knots. This shows a directly proportional relationship between PD and RT. Case A exhibits positive results beyond 20 knots. This is the only arrangement that produces the highest percentage reduction at all tested speeds.
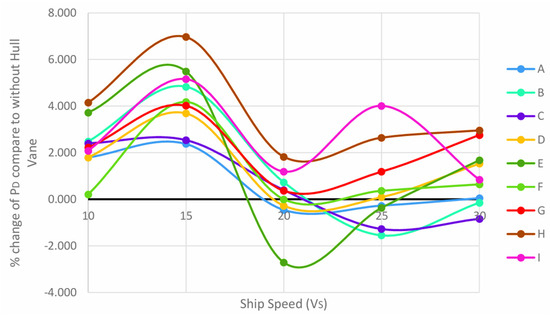
Figure 20.
Percentage change of PD in all case studies compared to without Hull Vane® at all speeds.
For an arrangement with a 10° angle of attack, the results beyond 25 knots show an improvement. This trend is consistent with Figure 14. Another interesting point from the curves is the lack of any positive 41 improvement across all tested speeds. This is for cases G, H, and I, all three having an angle of attack of 5°. The greatest percentage reduction in PD is for case E at 20 knots, which results in a −2.711% reduction. However, it is exaggerated when compared to the other cases at similar speeds. This large difference may be the result of the simulation converging too early, which tends to produce exaggerated results.
From Figure 21, the bar chart illustrates the percentage increase of PD on all case studies. The general trend across all case studies is that the percentage increase is larger when the position of Hull Vane® is −1.75 m from the reference point, as in cases B, E, and H, when compared to case studies of a similar angle of attack. This indicates that in this arrangement, it resulted in a low open water efficiency, given that the relative rotation efficiency remains constant.
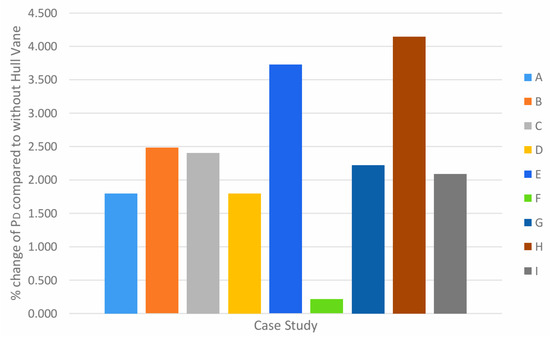
Figure 21.
Percentage change of PD in all case studies compared to without Hull Vane® at 10 knots.
The percentage increase in case F is, however, significantly smaller than the 42 others. This result may arise due to early convergence on SHIPFLOW, which gives an inaccurate result. Overall, at 10 knots, it is not recommended to fit a Hull Vane® as delivered power will increase despite different arrangements. Through the chart from Figure 20, the smallest percentage increase is from case F at a rate of 0.211%, whereas the largest percentage increase is 4.147% from case H.
The result obtained at 15 knots is shown in Figure 22. At 15 knots all case studies exhibited an increase in PD, as in Figure 21. The percentage increase is, however, more significant than 10 knots, with the lowest increase reaching beyond 2%. Case studies A, D, and G resulted in the lowest percentage increase compared to case studies that share the same angle of attack. Cases B, E, and H share the same longitudinal position at −1.75 m from the reference point. This arrangement of Hull Vane® caused the greatest increase of 43 in PD in comparison to all cases with the same angle of attack. Hull Vane® is not suitable for fitting at a ship speed of 15 knots at all tested arrangements. Looking at the results data for Figure 22, case study A yields the smallest percentage increase at 2.377% whilst case study H results in a 6.967% increase in PD.
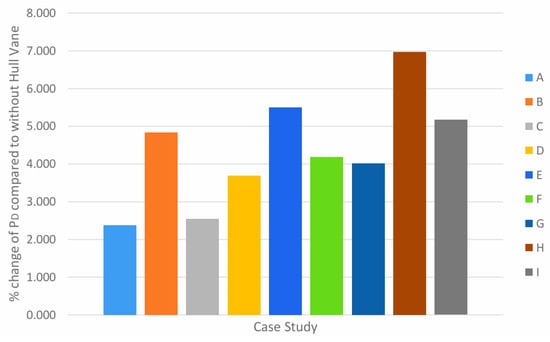
Figure 22.
Percentage change of PD in all case studies compared to without Hull Vane® at 15 knots.
For 20 knots, there exist case studies that yield a percentage decrease in PD as illustrated in Figure 23. Cases A, D, and E yielded positive results, with case study E exhibiting an exaggerated percentage decrease given that it does not fit the general trend. Cases B and H showed the largest percentage increase when compared to case studies with similar angles of attack. This may occur due to early convergence on SHIPFLOW, which resulted in an overestimation of the parameters obtained in the propulsion test. The arrangement of Hull Vane® in case study F results in no percentage 44 change in PD. Despite the results from case study E, there still exists a foil arrangement that will decrease PD. The most significant percentage decrease from the chart in Figure 22 is case study E with a −2.711% decrease. However, this value may be due to the SHIPFLOW configuration constraints used for this case. The largest increase in PD is from case study H with a 1.828% increase.
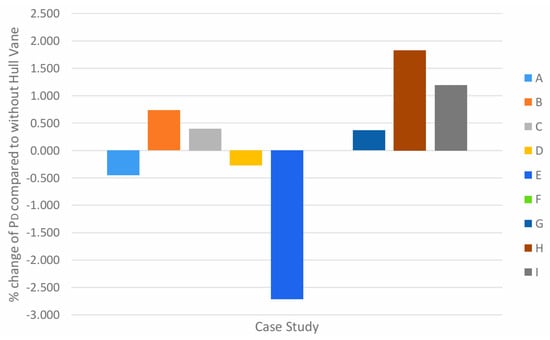
Figure 23.
Percentage change of PD in all case studies compared to without Hull Vane® at 20 knots.
The percentage change shown in Figure 24 illustrates that at an angle of attack of 5°, the percentage increase of PD is much more significant than at higher angles of attack, such as in the cases of G, H, and I. At a 10° angle, the value of PD will decrease regardless of the longitudinal position of Hull Vane® from the reference point. Accordingly, at 25 knots, open water efficiency is high at 10°. Case E also exhibited a decrease in PD, albeit at a lower 45 percent. The optimal Hull Vane® arrangement at this speed must have an angle of attack of 10°. By comparing the results data from Figure 24, the biggest percentage reduction in power comes from case B. This is with a −1.551% reduction compared to a 4.015% percentage increase in case I.
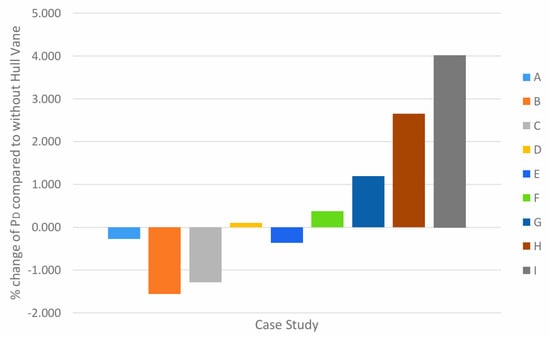
Figure 24.
Percentage change of PD in all case studies compared to without Hull Vane® at 25 knots.
By analysing Figure 25, it is shown that case studies B and C yielded positive results for ship speed at 30 knots. By considering the result from Figure 24, it can be concluded that the open water efficiency may be higher at higher speeds, resulting in greater propulsive efficiency behind the hull. The general trend across all case studies shows that when the longitudinal position of the Hull Vane® is at −2 m from the reference point, its effect on PD is the most positive compared to case studies with similar angle of attack, as in cases C, F and I. 46 The largest percentage reduction of PD at 30 knots is from case C where the value is −0.838% whereas the largest percentage increase is from case H, giving a 2.959% increase in PD. Overall, the Hull Vane®’s 10° angle of attack is the most effective arrangement when considering its percentage reduction. The most ideal longitudinal position of the foil from the reference point depends on the ship’s speed.
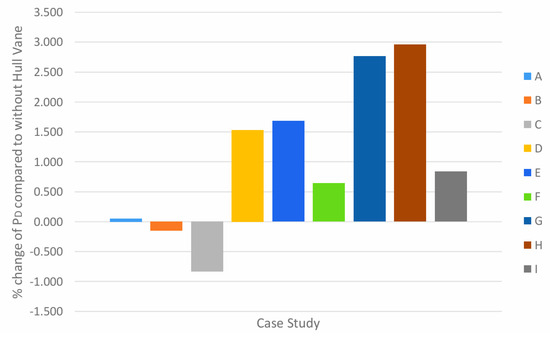
Figure 25.
Percentage of PD in all case studies compared to without Hull Vane® at 30 knots.
4.4.2. Propulsive Efficiency
The propulsive efficiency (ηD) of a ship is a function of both hull efficiency (ηH) and propulsive efficiency at the back of the hull, in which ηH is a ratio of thrust deduction coefficient (t) and wake fraction coefficient (w). Therefore, ηD is heavily dependent on resistance values through t and the propeller itself through w.
Given that the value of ηR and ηH remains relatively constant for the same hull form and propeller, the only variable that may vary is ηO.
From the graph illustrated in Figure 26, the general shape of the curves is still oscillating, and is consistent with Figure 14 and Figure 20. The percentage increase of the propulsive efficiency is more apparent at higher speeds, particularly at 25 knots and beyond. Cases E and I show noticeable, exaggerated results at 20 knots and 25 knots. The simulation may have converged too early, resulting in larger results than expected. Should these values be omitted, the greatest efficiency increase is from case C at 25 knots with a 1.136% increase. It is pertinent to note that for case B, there is a positive improvement in the propulsive efficiency at 15 knots and beyond. This is the arrangement that resulted in the most improvement across all tested speeds.
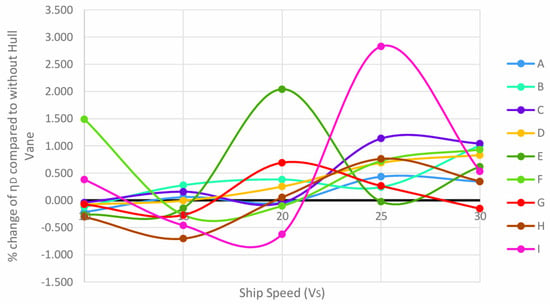
Figure 26.
Percentage change of ηD in all case studies compared to without Hull Vane® at all speeds.
The results in Figure 27 show that only two cases, F and I, resulted in a percentage increase in propulsive efficiency. Given that the exaggerated result obtained in Case F corresponds to the percentage change in PD, this value may have resulted from early convergence from SHIPFLOW. Nevertheless, this fact shows the proportional relationship between delivered power and engine efficiency. Despite the circumstances of case F, the result for case I does not indicate any exaggeration due to SHIPFLOW. However, there is a percentage increase in its PD, which indicates the increase is coming from low open water efficiency. The percentage decrease in efficiency across all cases is very low. Comparing the result data of Figure 27 shows that the largest improvement in propulsive efficiency is a 1.489% increase at case F. If this result is disregarded, the largest improvement is instead a 0.383% increase in case I. The biggest reduction in propulsive efficiency at 10 knots is case H at −0.304%.
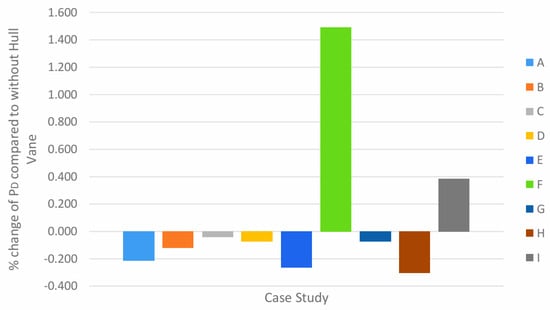
Figure 27.
Percentage change of ηD in all case studies compared to without Hull Vane® at 10 knots.
At 15 knots, the results show that for cases A, B, and C, where the angle of attack is 10°, the propulsive efficiency shows an increase. This is illustrated in Figure 28. However, despite the increase, the corresponding PD all showed an increase in percentage change. The low open water efficiency across all case studies may explain this. The most significant improvement in propulsion came from case B, where the percentage increase was 0.278%. In contrast, the largest percentage drop of 0.704% belongs to case H.
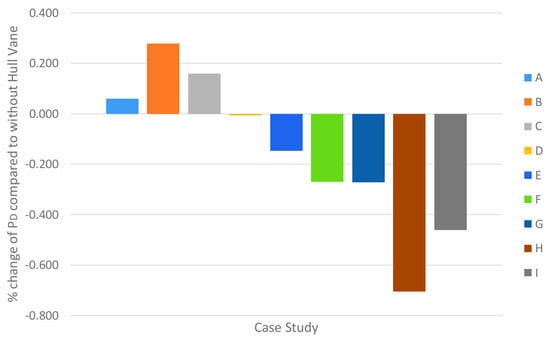
Figure 28.
Percentage change of ηD in all case studies compared to without Hull Vane® at 15 knots.
The result at 20 knots is shown in Figure 29, and the trend across all case studies shows that when the longitudinal position of the Hull Vane® is −2 m from the reference point, it will result in a decrease in propulsive efficiency. This value may have resulted from early convergence of the SHIPFLOW simulation, because E’s percentage increase corresponds to its PD from Figure 23. The arrangement of both the longitudinal position and angle of attack of the Hull Vane® influences the percentage increase in propulsive efficiency as shown in cases B, D and G. Comparing the result data of Figure 28 shows that the largest improvement in efficiency comes from case E with 2.045% increase, though the next largest improvement is 0.693% at case G should the previous result be disregarded. The arrangement with the most negative result is case I, which decreases by −0.622%.
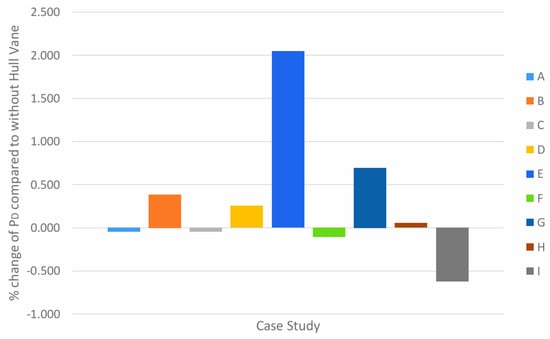
Figure 29.
Percentage change of ηD in all case studies compared to without Hull Vane® at 20 knots.
The percentage change in propulsive efficiency increases across all case studies except for case E at 25 knots. This can be seen in the bar chart in Figure 30. Despite only case E exhibiting a decrease, it is minimal compared to the percentage increase disparity. The calculated result from case I, however, corresponds to the highest percentage increase of PD at 25 knots. This shows that the open water efficiency for case I is significantly lower than the other cases. The general trend across all case studies shows that a longitudinal position of Hull Vane® at 2 m resulted in the highest improvement in propulsive efficiency. This is when compared to cases with a similar angle of attack. The biggest improvement in propulsive efficiency comes from case I at 2.830%. In contrast, the only result with a percentage decrease of 690 is case E with a 0.024% change.
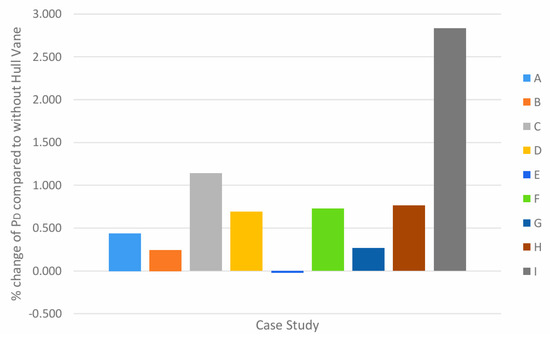
Figure 30.
Percentage change of ηD in all case studies compared to without Hull Vane® at 25 knots.
The percentage change in propulsive efficiency shows the largest improvement at 30 knots, as illustrated in Figure 31. The only decrease in propulsive efficiency is in case G. The largest improvement in cases B and C corresponds to the decrease in their corresponding PD. Case C yields the largest improvement in propelling efficiency at 1.045%, while case G yields the only decrease at −0.154%.
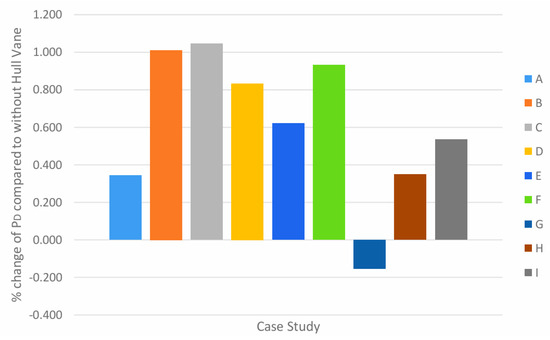
Figure 31.
Percentage change of ηD in all case studies compared to without Hull Vane® at 30 knots.
To ensure a robust and statistically sound interpretation of the results, error estimates and validation thresholds have been incorporated into the analysis of our computational predictions. While direct experimental data for this specific hull form were unavailable for a one-to-one comparison, the accuracy of our CFD simulations is assessed against established benchmarks and industry best practices.
Specifically, for quantities such as resistance, the acceptable deviation from validated empirical methods (e.g., Holtrop–Mennen) or published experimental data for similar hull forms is typically within a range. This threshold accounts for inherent uncertainties in both computational methodologies (e.g., turbulence models, mesh resolution) and empirical formulations. Differences observed within this defined range are in good agreement, indicating that the computational model adequately captures the underlying physics for the given parameter. Conversely, deviations exceeding these thresholds would necessitate further investigation into the modeling assumptions or numerical setup.
Furthermore, wherever applicable, the root mean square error (RMSE) or mean absolute percentage error (MAPE) has been calculated to quantify the spread of our predictions relative to reference data, providing a statistical measure of model performance. This systematic approach allows us to judge whether observed differences are statistically significant or fall within an acceptable margin of uncertainty, thereby strengthening the validity and reliability of our conclusions.
5. Limitations and Recommendations
Acknowledging the inherent limitations, the present study’s validation primarily relies on the Holtrop–Mennen method due to the unavailability of empirical towing tank data for the specific hull form investigated. While this computational approach provides valuable preliminary insights, it inherently possesses certain simplifications and assumptions that might not fully capture the complex hydrodynamic phenomena.
Therefore, we emphasize the critical need for experimental validation through towing tank tests in future works to rigorously assess and enhance the accuracy of the resistance predictions. Such experimental data would not only provide a robust benchmark for computational models but also significantly bolster the credibility and applicability of the findings for practical ship design and performance evaluation.
While the grid independence study confirms overall convergence at approximately 3.2 million cells for the primary hull form, we acknowledge that the mesh density in critical appendage regions (e.g., rudder, skeg, propellers, if applicable) was not specifically investigated for its independent sensitivity. These areas are known to experience complex flow phenomena, including high-velocity gradients and flow separation, which are highly susceptible to mesh resolution. Consequently, the accuracy of local flow predictions around these appendages, and their integrated effect on overall resistance and propulsion characteristics, may be influenced by the current mesh density. This represents a limitation of the current study, necessitating more focused investigation.
To further enhance the fidelity and robustness of the computational predictions, future work should include a dedicated, localized mesh sensitivity study focused specifically on the appendage regions. This would involve systematically refining the mesh in these critical areas while maintaining the established global mesh density to quantify the impact of local mesh resolution on key performance parameters. Such a targeted investigation would ensure that the complex flow physics around the appendages are accurately captured, thereby providing a more comprehensive and reliable assessment of the vessel’s hydrodynamic performance.
While the volume of fluid (VOF) method was employed to capture the free surface dynamics in our CFD simulations, and the resulting wave profile demonstrates qualitative agreement with expected wave patterns generated by similar hull forms at comparable Froude numbers, we acknowledge that a formal quantitative verification of the simulated wave profile was not performed due to the absence of corresponding experimental data. The visual consistency observed provides a preliminary indication of reasonable free surface capture; however, this qualitative assessment is not a substitute for rigorous experimental validation. Accurately predicting the wave elevation and breaking phenomena is crucial for precise resistance predictions, particularly for wave-making resistance, and for understanding ship motions and slamming events. Therefore, this represents a limitation in the comprehensive validation of our free-surface capturing methodology.
To further strengthen the robustness of future CFD studies involving free surface flows, it is highly recommended to conduct quantitative validation of the simulated wave profile against experimental measurements. This would involve comparing computational results of wave elevations (e.g., wave cuts along the hull or across the wake) with data obtained from towing tank tests, preferably using techniques such as laser-sheet imaging or wave probes. Such a direct comparison would not only provide a rigorous verification of the VOF method’s capability in capturing complex wave phenomena but also enhance the overall confidence in the accuracy of the resistance predictions and other related hydrodynamic quantities.
The observed trend of potentially exaggerated reductions in resistance at higher speeds warrants further scrutiny to ensure the robustness and generalizability of the present CFD predictions. While this study utilized the SHIPFLOW CFD solver for all simulations, a comprehensive cross-validation with alternative CFD solvers would significantly strengthen the credibility of these findings. Different solvers often employ varying numerical schemes, turbulence models, and meshing strategies, which can collectively influence the accuracy of predictions, especially in complex flow regimes or at extreme operating conditions. Although performing such multi-solver validation was beyond the scope and resources of the current investigation, we strongly recommend this as a crucial step for future research. This would not only help to confirm the reliability of the current results but also provide valuable insights into the sensitivity of the predictions to the choice of computational tools and methodologies.
6. Conclusions
Some case studies exhibited an exaggerated improvement in the investigated resistance and propulsion parameters. However, the value may have resulted from the constraints of the SHIPFLOW configuration. The general trend for both resistance and self-propulsion tests across all case studies shows that the positive effect of Hull Vane® is more significant at higher speeds, especially when the angle of attack is arranged at 10°. Compared to other angles of attack, cases with an angle of attack of 5° produce the fewest improvements.
The arrangement that produces the most amount of improvement across all tested speeds is case A, whereby there are only four instances that do not result in a positive improvement. Case C is the most effective arrangement when measuring the most significant percentage reduction of RT at 20 knots and beyond. This arrangement also yielded the largest percentage reduction of −2.104% at 30 knots. In terms of PD improvements, case B produced the greatest reduction at 1.551% since the significant reduction from case E may have stemmed from a systematic error. For ηD, the arrangement that resulted in the greatest improvement is case C at a 1.136% increase. Case H is considered the worst arrangement since there are only three instances where it resulted in an improvement: for ηD at 20 knots and above.
In future investigations relating to this work, it is recommended that the SHIPFLOW configuration commands the flow simulation in a 3D plane using the ‘vof’ command instead of ‘fsflow’ to further investigate the changes in wave-making resistance coefficient. The effect of the vertical arrangement of the Hull Vane® is also absent in this investigation. This can be carried out if it were not due to time constraints. A wider range of ship speeds may need to be tested, especially between the intervals of the speed investigated, to identify more wave characteristics. SHIPFLOW also possesses a constraint whereby it cannot run XCHAP, hence the RANS equation to calculate the change of trim at the bow and stern of the hull form. This feature depends on future updates to the SHIPFLOW software itself. An alternative solution is to use different CFD computation programs.
One problem encountered in the simulation run was the early convergence of self-propulsion simulations in certain case studies, causing large uncertainties. Modifications to the configuration must be made in the future to avoid this in the future. In terms of the limitations of the equipment, the computers used in this investigation should be upgraded to obtain sufficient processing power. This will increase the number of cells that the computers can handle without crashing.
While the present study demonstrates promising potential for significant resistance reduction and efficiency gains through the application of a Hull Vane® to the patrol vessel hull form, it is crucial to acknowledge the practical complexities associated with its real-world implementation. The conclusions regarding retrofit potential must be tempered by a consideration of the inherent structural modifications required for integrating such a device. These modifications could entail substantial engineering design, fabrication, and installation costs, as well as potential impacts on the vessel’s structural integrity, stability, and internal arrangements. Furthermore, the economic viability of a retrofit solution would depend heavily on a detailed cost–benefit analysis, factoring in not only the fuel savings but also the capital expenditure, operational downtime, and the vessel’s remaining service life. Therefore, while hydrodynamically beneficial, the practical realization of these gains for existing vessels necessitates a comprehensive assessment of these economic and structural challenges.
Author Contributions
Conceptualization, Y.A.A.; methodology, I.M.K. and N.A.O.; software, I.M.K. and N.A.O.; validation, M.I.S.b.A.R.; formal analysis, M.I.S.b.A.R.; investigation, M.I.S.b.A.R.; resources, I.M.K. and Y.A.A.; writing—original draft, M.I.S.b.A.R.; writing—review and editing, M.I.S.b.A.R., I.M.K. and N.A.O.; supervision, I.M.K. All authors have read and agreed to the published version of the manuscript.
Funding
This research received no external funding.
Data Availability Statement
The raw data supporting the conclusions of this article will be made available by the authors on request.
Acknowledgments
The author thanks Iwan Mustaffa Kamal for his guidance, as well as the Malaysian Institute of Marine Engineering Technolgy of Universiti Kuala Lumpur for access to lab facilities and SHIPFLOW software (version 6.5.09).
Conflicts of Interest
The authors declare no conflicts of interest.
Abbreviations
The following abbreviations are used in this manuscript:
| 2D | 2-Dimensional |
| 3D | 3-Dimensional |
| AMECRC | Australian Maritime Engineering Cooperative Research Centre |
| CFD | Computational Fluid Dynamics |
| GIS | Grid Independence Study |
| IGES | Initial Graphics Exchange Specification |
| MIMET | Marine Institute of Marine Engineering Technology |
| NACA | National Advisory Committee for Aeronautics |
| RANS | Reynolds Averaged Navier Stokes |
| UniKL | Universiti Kuala Lumpur |
| VOF | Volume of Fluid |
Appendix A
Appendix A.1
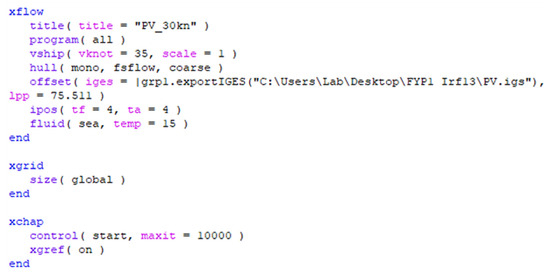
Figure A1.
Standard model configuration.
Appendix A.2
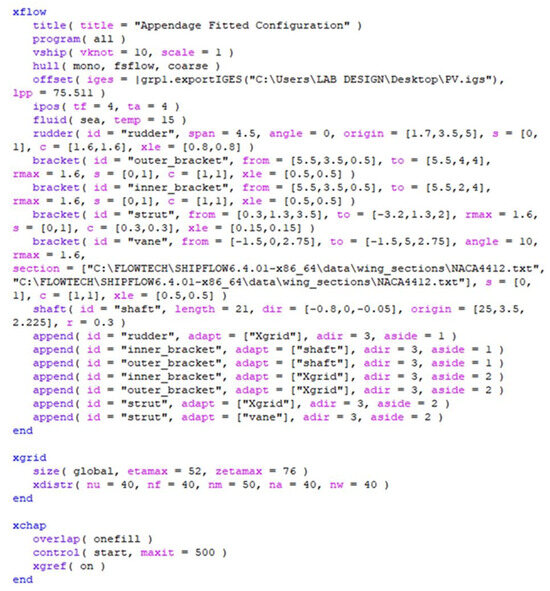
Figure A2.
Appendage fitted model configuration.
Appendix A.3
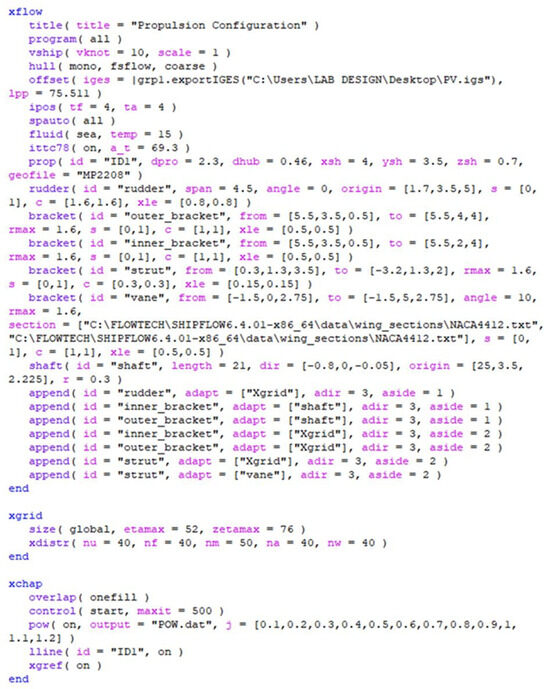
Figure A3.
Self-propulsion configuration.
Appendix A.4

Figure A4.
Plane distribution configuration and its results. The green row indicates the chosen setting of grid distribution of the computation domain.
Appendix A.5

Table A1.
List of commands.
Table A1.
List of commands.
| Command/Parameter | Description | Effect on Simulation |
|---|---|---|
| Solver Type | Specifies the fluid flow solver’s approach. | Determines the underlying mathematical model (e.g., pressure-based, density-based). |
| Turbulence Model | Defines the model for turbulent flow physics. | Influences the accuracy of turbulent flow prediction (e.g., k-epsilon, k-omega SST, LES). |
| Time Step (Transient) | Size of the time increment per iteration for unsteady simulations. | Crucial for transient stability and accuracy; too large can lead to divergence or inaccurate time marching. |
| Volume of Fluid (VOF) Model | Activates the multiphase flow model for tracking immiscible fluid interfaces. | Enables tracking of the interface between fluids like air and water, crucial for wave profile prediction. |
| Mesh Sizing (Global) | Overall average cell size applied to the computational domain. | Controls the total cell count and general resolution of the simulation domain. |
| Boundary Condition: Inlet | Defines flow properties at the computational domain’s entrance. | Sets flow velocity, pressure, turbulence intensity, and phase fractions at the domain entry. |
| Convergence Criteria | Conditions that determine when the iterative solution is considered converged. | Defines the precision of the solution; typically based on residuals falling below a predefined threshold. |
| Number of Iterations/Time Steps | Maximum iterations allowed per time step or total number of time steps. | Prevents excessive computation time if convergence is slow, or defines the total simulation duration. |
| XPAN | Solver using potential theory (panel) method. | |
| XCHAP | Solver using Reynolds averaged Navier–Stokes equation method. | |
| XBOUND | Solver using boundary layer method. | |
| XMESH | Mesh generator for potential theory method. | |
| XGRID | Grid generator for Reynolds averaged Navier–Stokes equation method. | |
| XMDENS | Mesh density control. | |
| maxit | Maximum iteration. | |
| xgref | Refinement command for grid. | |
| etamax | Number of plane radially. | |
| zetamax | Number of plane circumferentially. | |
| na | Number of plane at aft section. | |
| nw | Number of plane at wake section. | |
| xend | Position of end of domain relative to shop length. | |
| xapd | Position of aft perpendicular relative to one ship length. | |
| xapu | Position of aft perpendicular relative to one ship length at upstream. |
References
- Çelik, C.; Danışman, D.; Kaklis, P.; Khan, S. An Investigation Into the Effect of the Hull Vane on the Ship Resistance in OpenFOAM; CRC Press: Boca Raton, FL, USA, 2019. [Google Scholar]
- Goutham, S.; Vijayakumar, R. Effect of Hull Vane on Wave Making Resistance of High-Speed Displacement Vessel. In Proceedings of the International Naval Engineering Conference (INEC), Edinburgh, Scotland, 19 July 2022. [Google Scholar]
- Kiryanto; Budiarto, U.; Firdhaus, A. Analysis of the effect of hull vane on ship resistance using CFD methods. In IOP Conference Series: Earth and Environmental Science; IOP Publishing Ltd: Bristol, UK, 2021. [Google Scholar] [CrossRef]
- Shi, A.; Wu, M.; Yang, B.; Wang, X.; Wang, Z. Resistance calculation and motions simulation for free surface ship based on CFD. Procedia Eng. 2012, 31, 68–74. [Google Scholar] [CrossRef]
- Nuruddin, H.; Kamal, I.M.; Mansor, M.N.; Hafid, N.M. Investigation on the effect of bulbous bow shape to the wave-making resistance of an ultra large container carrier (ULCC). ARPN J. Eng. Appl. Sci. 2017, 12, 1254–1259. [Google Scholar]
- Kamal, I.M.; Othman, N.A.; Riza, A.N.F.M.; Ahmed, Y.A.; Hannan, M.A.; Kamil, S.; Muslim, M.; Nuruddin, H. Investigation on the Effect of the Bulbous Bow Shape to the Resistance Components and Wave Profiles of Small Ships. In Advanced Maritime Technologies and Applications. Advanced Structured Materials; Springer: Cham, Switzerland, 2022; pp. 157–184. [Google Scholar] [CrossRef]
- Uithof, K.; Hagemeister, N.; Bouckaert, B.; Van Oossanen, P.G.; Moerke, N. A Systematic Comparison of the Influence of the Hull Vane®, Inter-Ceptors, Trim Wedges, and Ballasting on the Performace of the 50m Amecrc Series #13 Patrol Vessel. Advanced Technologies in Naval Design, Construction, & Operation, Warship 15–16 June 2016. Available online: https://www.hullvane.com/wp-content/uploads/2017/01/Kasper-Uithof-et-al-A-systematic-comparison-between-trim-correction-methods.pdf (accessed on 27 July 2025).
- Avala, V.K. CFD Analysis of Resistance Characteristics of High-Speed Displacement Hull Forms Fitted with Hull Vane®. Master’s Thesis, Florida Institute of Technology, Melbourne, FL, USA, 2017. Available online: https://repository.fit.edu/etd (accessed on 27 July 2025).
- Uithof, K.; Van Oossanen, P.; Moerke, N.; Van Oossanen, P.G.; Zaaijer, K.S. AN UPDATE ON THE DEVELOPMENT OF THE HULL VANE ®. In Proceedings of the 9th International Conference on High-Performance Marine Vehicles (HIPER), Athens, Greece, 3–5 December 2014. [Google Scholar]
- Uithof, K.; Bouckaert, B.; Van Oossanen, P.G.; Moerke, N. Design & Operation of Ferries & Ro-Pax Vessels. 2016. Available online: https://www.hullvane.com/wp-content/uploads/2017/02/Paper-RINA-Ferries-RoPax-Conference1.pdf (accessed on 27 July 2025).
- Bouckaert, B.; Uithof, K.; Moerke, N.; van Oossanen, P.G. Hull Vane® on 108m Holland-Class OPVs: Effects on Fuel Consumption and Seakeeping. Available online: https://www.hullvane.com/wp-content/uploads/2017/01/MAST-2016-Paper-Hull-Vane-on-108-m-Holland-Class-OPV-effects-on-fuel-consumption-and-seakeeping-1.pdf (accessed on 27 July 2025).
- Hannan, M.A.; Adnan, A.Y.; Xiao, B. Effects of Hull Vanes on Resistance and Seakeeping Performance of Naval Vessels. Available online: https://www.mahannan.com/post/hull-vane-naval-vessel (accessed on 14 June 2025).
- Budiyanto, M.A.; Syahrudin, M.F.; Murdianto, M.A. Investigation of the effectiveness of a stern foil on a patrol boat by experiment and simulation. Cogent. Eng. 2020, 7, 1716925. [Google Scholar] [CrossRef]
- Soma, G.C.; Vijayakumar, R. Numerical investigation on the effect of hull vane for a high-speed displacement vessel. Ships Offshore Struct. 2023, 19, 1–14. [Google Scholar] [CrossRef]
- Zhou, X.; Yang, H.; Xu, L.; Yang, C.; Xu, W.; Qiu, Z. Experimental Investigation on Hydrodynamic Characteristics of a Large-Scale Slender Body in Oblique Motion. J. Mar. Sci. Eng. 2024, 13, 83. [Google Scholar] [CrossRef]
- Holtrop, J.; Mennen, G.G.J. An Approximate Power Prediction Method. Int. Shipbuild. Prog. 1982, 29, 166–170. [Google Scholar] [CrossRef]
- Hudson, D.A.; Molland, A.F.; Turnock, S.R. Ship Resistance and Propulsion: Practical Estimation of Propulsive Power; Cambridge University Press: Cambridge, UK, 2011. [Google Scholar]
Disclaimer/Publisher’s Note: The statements, opinions and data contained in all publications are solely those of the individual author(s) and contributor(s) and not of MDPI and/or the editor(s). MDPI and/or the editor(s) disclaim responsibility for any injury to people or property resulting from any ideas, methods, instructions or products referred to in the content. |
© 2025 by the authors. Licensee MDPI, Basel, Switzerland. This article is an open access article distributed under the terms and conditions of the Creative Commons Attribution (CC BY) license (https://creativecommons.org/licenses/by/4.0/).