Abstract
In the design of small-scale test models for hull structures, the directional dimensional analysis method is commonly employed. However, conventional dimensional analysis based on elasticity theory may be insufficient to capture the nonlinear behaviors of structural materials under dynamic loading, which restricts its applicability in ultimate strength tests for small-scale hull structure models. This paper presents a scaling method grounded in the theory of finite similitude. Based on the finite similitude theory, this paper deduces similarity scaling criteria applicable to the static and dynamic responses of box girders and designs a series of trial models of box girders. The scaling criteria are verified and analyzed through numerical tests conducted under static and dynamic loads. On the basis of the numerical test results of dynamic responses, the dynamic response similarity criteria considering the similarity relationship of material constitutive parameters are modified and verified. By applying the static response scaling criteria in this paper to select appropriate materials, the prediction deviation of the box girder trial models under static loads is less than 2%. With the modified dynamic response scaling criteria proposed in this paper, the prediction deviations of each trial model under dynamic loads are less than 2% and 7%. A comprehensive analysis of material parameters was conducted to examine their impact on the nonlinear similarities observed in the processes. To validate the ultimate strength and nonlinear response scaling criterion based on the finite similitude approach, numerical experiments were performed to assess the ultimate strength and dynamic buckling response characteristics of the box girder across various scaling ratios and material parameters. The analysis demonstrated that the ultimate strength scaling criterion and the nonlinear response scaling criterion derived from the finite similitude approach effectively captured material nonlinearity. The results from the small-scale model provided accurate predictions of the ultimate strength of the full-scale model.
1. Introduction
The experimental method faithfully captures the response characteristics of the research objects, serving as a valuable tool to validate the reliability of the proposed theoretical and numerical simulations. However, full-scale model tests can be extremely costly in terms of both the time and human resources for some complicated structures, e.g., ship structures. Alternatively, small-scale model tests have emerged as a practical and effective research approach. Until now, numerous experimental studies for predicting the loading capacities of ship structures under different loading conditions have been conducted. Sugimura [1] and Dow [2] conducted small-scale steel model tests for the ultimate strength analysis of the warship structure. Dowling [3] and Recking [4] carried out a series of small-scale box girder model tests focusing on pure bending moments. Ostapenko [5] explored bending-shear-torsion combined load effects on multiple box girder models. Xu [6] performed a collapse test on a simplified hull beam model. An analytical method based on the experimental results was then proposed, which could be used to rapidly predict the ultimate strengths of the box girders. Sun [7] experimentally and numerically investigated the torsional ultimate strengths of ship structures with large openings. Yang [8] conducted ultimate strength experiments of an inland waterway ship. Liu [9,10] also conducted an ultimate strength test on a surface line catamaran and a high-speed trimaran. Yuan [11] proposed a similar criterion for predicting the ultimate compressive strengths of the stiffened plates under compression loads. In the field of research on similar scaling of thin-walled structures under dynamic loads, Li [12] proposed the scaling laws for the impact and support reaction force profiles of reinforced concrete (RC) beams from model to prototype. The low-velocity impact responses of geometrically similar beams at four scales were discussed under different impact conditions. Based on the numerical time–history curves, the dynamic scale factors of the characteristics on the impact force and reaction force profiles were summarized. However, this method failed to address the scale effect. Huang [13] derived a significant input dimensionless number—loading intensity—for elastic–plastic thin plates under step loading pressure based on the principle of energy equivalence and dimensional analysis. This dimensionless number can predict the ratio of plasticity to elasticity, and the author verified these new dimensionless numbers using finite element data. However, the current dimensional analysis does not cover effects such as strain rate. Cheng [14] derived a velocity–stress–mass (VSG) method based on the Johnson–Cook equation (VSG-JC method) to determine the relationship between full-scale structures (prototypes) and their scaled-down models. The proposed method was verified through theoretical solutions and numerical solutions for impacted beams and plates, respectively. However, this method cannot accurately consider the role of strain rate in dynamic responses. Wang [15,16] improved the H-method to establish a relationship between scaled models made of different materials and the prototype while ensuring the same initial velocity of the projectile. Based on the particularity of the target plate penetration problem, the similarity distortion caused by differences in fracture toughness among different materials was considered, and fracture parameters were effectively incorporated into the similarity law. The response distortion between the prototype and scaled models was compensated for by changing the plate thickness scaling factor. Using the improved H-method, deviations caused by different materials and geometric scales were corrected. However, the scaling criteria lacked a theoretical basis and only achieved similarity in state parameters between models. Ma [17,18] proposed a scale-model design method for box girders based on dimensional analysis theory, which considers the similarity of buckling collapse modes and ultimate bending moments (including hogging and sagging conditions) and has been verified numerically. However, no material replacement scaling criteria were proposed, and the scaling criteria lacked a theoretical basis, merely achieving similarity in state parameters between models.
The above-mentioned studies were mainly based on dimensional analyses, which were, to a great extent, predicated upon the experience of users in terms of selecting suitable physical quantities to formulate similarity criteria, thereby being deficient in theoretical underpinnings. Furthermore, the scaling effects of the plate thickness to the model materials were neglected. It should be noted that the use of identical materials for both the full-scale and small-scale models was always restricted [19]. Previous investigations have revealed notable differences in the true stress–strain relations of steel sheets with thicknesses of 0.25 mm and 1 mm [19]. In addition, practical factors such as the manufacturing constraints, costs, and experimental limitations could necessitate the use of entirely different materials in small-scale experiments [20]. Consequently, it was imperative for the scaling theories to accommodate diverse material properties including but not limited to density, initial yielding stress, hardening behavior, and strain rate sensitivity.
In recent years, a new similarity method named the finite similitude method has been proposed in the academic community. This method establishes the transport equations for two spaces by scaling or expanding the space where the full-scale model is located. Although the scaling or expansion of space is impossible to achieve in actual situations, it is theoretically feasible and can be realized using control volumes and transport equations, which are used to represent the physical processes of interest. Davey [21], based on the finite similitude theory, constructed a scaling criterion that captures all scale dependencies in the field of impact mechanics for steel tube structures under impact loads. This criterion was validated through experiments and numerical analyses, with the scaled model achieving an error of approximately 3% in predicting the peak load. Sadeghi [22] proposed a non-geometric scaling framework for failure analysis under high-strain-rate loading processes based on the finite similitude theory. This framework enables simultaneous scaling of both size and material. The method was validated through numerical tests involving circular plate perforation and Taylor rod impact on a rigid wall, where the prediction errors of residual velocity during the perforation process were all less than 7%. Davey [23] put forward a scaling method based on the finite similitude theory that can capture all scale dependencies in the field of fracture mechanics, addressing the scale effects in dimensional analysis. The author verified this method through analytical fracture models and numerical fracture models. Davey [24] proposed scaling criteria applied to metal-forming processes based on the finite similitude theory and identified the limiting factor of how to select appropriate trial model materials when using this method. Davey [25] presented a method for isotropic scaling in thermomechanical processes based on the finite similitude theory and verified its applicability in thermomechanical processes through analytical and numerical analysis methods. Raul [26] proposed an isotropic scaling method in biomechanics based on the finite similitude theory. Comparative analyses of simulations and experiments on scaled models of different materials were conducted for cylinders and femurs, with the prediction errors of surface strain for the scaled models of cylinders and femurs being less than 10% and 5%, respectively. Darvizeh [27] proposed a new modeling method for analyzing shock-wave-like behaviors during high-speed compression of porous materials based on integral transport equations. The transport equations were proven to easily adapt to discontinuities in physical fields, and they can derive governing differential equations whose derivatives reflect the motion of the transport control volume. This research laid the foundation for the proposal of the finite similitude theory. Sadeghi [28] put forward scaling criteria for air blast and impact responses based on the finite similitude theory and conducted numerical tests on test plates under air blast and axial impact tests on circular tubes under gas gun loads. By modifying the explosive amount of the trial model, small-sized test plates made of the same or different materials could predict the response of full-sized plates with high accuracy. For predicting the shortening amount of full-sized steel tubes using small-sized steel trial models, the error was less than 5%, while using copper trial models of the same size to predict the shortening amount of steel tubes, the error was less than 15%. Zhang [29] established scaling criteria considering the similarity relationships of the Johnson–Cook constitutive relation and damage criterion based on the finite similitude theory and validated these criteria through impact and explosion loading tests. Ochoa [30] proposed a material substitution scaling method in the field of biomechanics based on the finite similitude theory and conducted experimental validation of bone mechanics using 3D printing materials, with the average percentage prediction errors of the scaled models being 3.1% and 4.8%. Davey [31] established new governing differential equations for fracture mechanics based on the finite similitude theory. By integrating these equations, information from two scaled fracture experiments can be correlated. The results of the numerical and experimental studies conducted showed that for propagating cracks, the deviation in crack paths in the scaled experiments was less than 1%. Al-Tamimi A [32] developed a new scaling method based on the finite similitude theory. This method can capture the rate-dependent plastic behavior of impacted structures. Numerical results were obtained using the Abaqus finite element software, in which the Johnson–Cook constitutive equation was adopted to consider the effects of rate and hardening on the initial yield stress. For scaled test models made of different materials and designed based on the zeroth-order finite similitude theory, both the pure mechanical behavior and thermo-mechanical behavior of the impacted core honeycomb structure can be predicted with high accuracy. Unlike the dimensional analysis method, the finite similitude theory takes into account the scale effects that exist during the scaling process of the prototype. It can effectively address the problem of material nonlinear similitude, and moreover, this method does not rely on the engineering experience of the users, making it relatively convenient to use. Although scholars have applied the finite similitude theory to conduct scaling design for simple models such as cylinders and plates and derived similarity criteria for material substitution, no attempt has been made in academic circles to introduce the finite similitude theory into the scaling design of relatively complex hull structures like box girders. The aim of such an endeavor would be to improve the prediction accuracy and applicability of small-scale models, yet this work remains unexplored to date.
This study proposes the similarity design method for box girder structures in or on real ships based on the finite similitude theory. Grounded in the concept of governing internal mechanisms of physical systems through the expansion or contraction of scaling spaces, it was expected that the use of identical material could be achieved between the prototype and the small-scale models, thus leading to improvement of the experimental precision. The effectiveness of the proposed criteria was further verified by the comprehensive numerical analyses. When designing the trial model of a box girder under static loads, by selecting appropriate materials in accordance with the static response scaling criteria proposed in this paper, the prediction deviation of the trial model is less than 2%. When designing the trial model of a box girder under dynamic loads, with the application of the modified dynamic response scaling criteria in this paper, the prediction deviations of each trial model are less than 2% and 7%.
The main symbols used in this paper and their meanings are presented in Table 1.

Table 1.
Table of symbol meanings.
2. Finite Similitude Theory
The finite similitude approach primarily involves aligning physical quantities in two spaces, with one of the spaces scaled or extended proportionally. Essentially, it represents a form of proportional scaling or expansion applied to the space containing the full-scale model. As shown in Figure 1, the physical space refers to the real space, and the trial space is the corresponding scaled space. When an object in the physical space moves from an initial point to another point over a period of time, all physical quantities during this movement can be mapped to the trial space [21]. The similarity relationship between the two spaces regarding all physical quantities in the movement process is established through the finite similitude theory. The physical space contains the full-scale model, while the trial space contains the trial model, that is, the small-scale model.
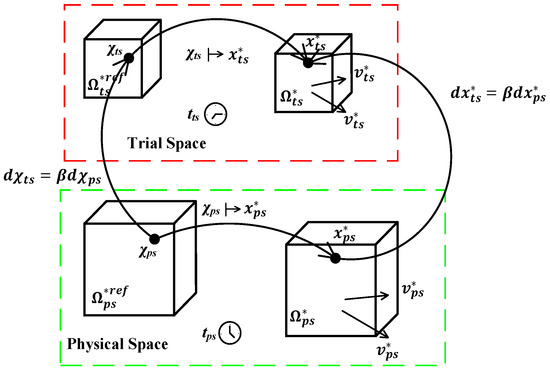
Figure 1.
Mappings between the physical and trial spaces in the finite similitude theory.
2.1. Transport Equations
The general conservation law for the physical quantity ψ on the control volume Ωps controlling the motion, with ψ being the physical quantity per unit mass, is [21,22,23,24]:
where ρ is the density of the model material, ψ is physical quantity, J·n is a flux, b is a source term, v is the velocity, and Γ is the boundary for Ω.
The derivative characterizes Ωps as a control volume transmitted by velocity [21,22,23,24]. Similarly, transport equations in trial space are given by:
where the subscripts ps and ts denote the full-scale model and the trial model, respectively, and the following equation is the same.
2.2. Derivation of Similar Equations
According to the literature [21,22,23,24,25], the transport equations in the physical space can be matched to the trial space, and identities such as the continuity equation, the mass conservation equation, and the motion equation can be substituted. It is established that the full-scale model and the trial model, based on finite similitude theory, satisfy conditions related to mass, momentum, yield strength, and displacement.
where αρ is the density scale factor, β is the geometrical scale factor, h is the time scale factor, σy is the yield stress of the model material, and u is the displacement.
By incorporating the box girder model with the equation mentioned above, it ensures that the geometrical aspects between the full-scale model and the trial model are satisfied.
From Equation (5), the yield stress between the full-scale model and the trial model satisfies
Under the condition that the trial model and the full-scale model meet the failure mode and the ultimate bearing capacity are similar, the stresses at the corresponding points on the profile of the trial model and the full-scale model are satisfied as follows:
where is the average stress along the normal direction of a micro-element in the profile, and its expression is as follows:
where is the area of a micro-element on the profile, and is the load applied to the micro-element along the profile normal to the axial pressure.
By combining Equations (7), (8), and (10), the similarity relationship of forces between the full-scale model and the trial model can be obtained:
The relationship between the displacement between the trial model and the full-scale model can be obtained by Equation (6) as
For the box girder model, the moment M and the force F and force arm L satisfy
Substituting Equations (7) and (11) into Equation (13), it can be deduced that the relationship between the moments in the trial space and the physical space satisfies the following Equation:
It is known that the circular angle degree θ (radian system), the arc length l, and the radius R satisfy
The above equation corresponds to the displacement of the model in the case of this section, and the radius R is the geometric dimension of the model, and satisfies
Substitution of the above equation into Equation (15) can be derived from the trial space and the physical space in the rotation angle (circular angle):
2.3. Scaling of the Constitutive Equations
In the nonlinear response process of the box girder, the constitutive equation plays a very important role, so it needs to be scaled by finite similitude theory. In the box girder nonlinear response process, the Cowper–Symonds constitutive equation [29] is defined in physical space as
where is dynamic yield stress; is initial yield stress; is strain rate; and Dps and qps are coefficients determined through experimental methods, which satisfy , , , , [21].
2.4. Practical Constraints
Box girder nonlinear response processes at high loading rates are usually described by intrinsic constitutive equations, such as Cowper–Symonds, where the dynamic yield stress is a function of the strain rate [31,32,33,34,35]. Here, the scaling parameters considered in this paper apply to the Cowper–Symonds constitutive relationship. The strain rate () is the response of the structure satisfying the relation [31,32,33,34,35], introduced as a velocity modifying factor to match other studies and derived as [31,32,33,34,35]. This relationship does not satisfy the imprecise similarity, but a weaker result can be obtained within a specified range of possible variations [31,32,33,34,35]. First consider a typical structural impact and a range of strain rates for metallic structures. It is assumed that the strain rate varies in a range from 0 to . For the box girder nonlinear response process considered in this paper, is set to 10/s. In this calculation, the range of strain rates determined is fixed to reasonably fit the box nonlinear response calculations under the considered dynamic loads and also to demonstrate the practicality of the method. The expression can be replaced by a weaker version of the equation , where
which always satisfies the above equation in the case of the prescribed γ-factor.
Consider the following ratio:
The above equation is not necessarily equal to γ under arbitrary loadings and in the absence of finite similitude.
The velocity modifying factor βv can be set to satisfy the equation . Furthermore, since inertia plays a key role in the dynamic process [31,32,33,34,35], a degree of freedom must be used to fix the density. Substituting into , together with the constant equation , the velocity scaling modifying factor βv can be written as:
Figure 2 shows the result of the condition , where the areas between and surfaces are equal and opposite. The four curves shown in Figure 2a,b are related to two material diagrams (Q235 steel and S235 steel in the case of Figure 2a and Q235 steel and 20 steel in the case of Figure 2b) and two projections of these curves. The effectiveness of the method is revealed in the case studies in Section 6.
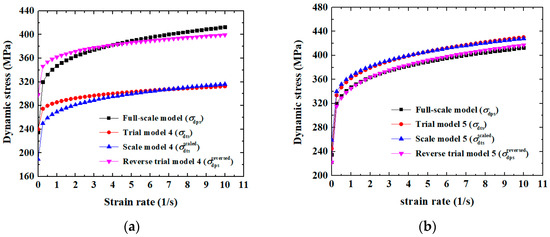
Figure 2.
Illustration of the inexact similarity of the intrinsic constitutive equations when satisfying and . (a) Full-scale model of trial model 4. (b) Full-scale model of trial model 5.
3. Similarity Criteria for the Box Girder Based on Finite Similitude Theory
In Section 2, the basic theory of finite similitude is introduced. For the problem of similarity scaling design of ship structures such as box girders, it is necessary to combine their geometric and material properties and propose the similarity scaling criteria under static and dynamic loads, as shown in Section 3. The specific forms of loads and numerical analysis are presented in Section 4 and Section 5.
3.1. Scaling Criteria for Static Ultimate Strength of Box Girders
The ultimate strength reduction criterion of box girders based on the finite similitude approach can be obtained through Section 2 as follows:
where the subscript ps represents the physical space, including the prediction results of the box girder full-scale model and the trial model; ts represents the trial space, including the trial models of the box girder; l in Π1 represents all geometric parameters of the box girder; β in Π1, Π2, Π3, and Π4 is the geometric scale factor; ρ in Π2 is the model material density; αρ in Π2, Π3, and Π4 is the density scale factor; σy in Π3 is the yield stress of the material; h in Π3 and Π4 is the time scale factor; M in Π4 is the bending moment; and θ in Π5 is the angle.
According to the above limit strength reduction criterion of box girders based on the finite similitude approach, the design steps of similar box girder models under quasi-static loads are:
- (1)
- Determine the geometric dimensions lps, material properties (density ρps, material yield stress σyps), and boundary conditions of the full-scale model of the box girder;
- (2)
- Determine the geometric scale factor β, material properties (density ρts, material yield stress σyts), and boundary conditions of the box girder trial model;
- (3)
- The geometric dimensions lts and density scale factor αρ of the trial model are determined by similarity criteria Π1 and Π2, respectively;
- (4)
- The time scale factor h is calculated by the similarity criterion Π3;
- (5)
- The bending moment M and the corresponding rotation angle θ of the full-scale model and the trial model of the box girder are obtained through experimental or finite element calculation, and the predicted bending moment Mps and angle θps relative to the full-scale model are calculated using the similarity criteria Π4 and Π5.
The specific flow chart of the design method of the trial model of box girder under a quasi-static load is shown in Figure 3.
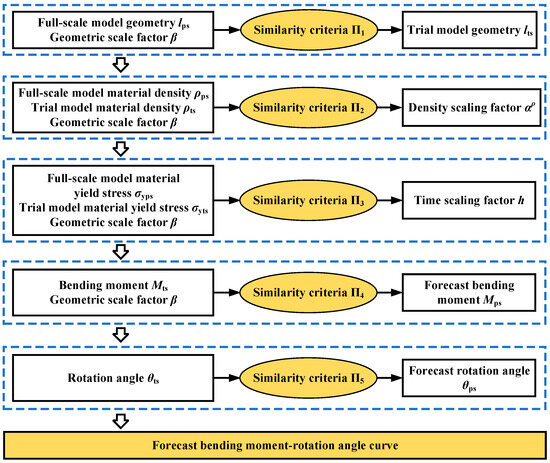
Figure 3.
Flow chart of box girder trial model design method under quasi-static load.
3.2. Scaling Criteria for Dynamic Responses of Box Girders
Compared with the ultimate strength analysis under static loads, the problem of dynamic response analysis of box girders under dynamic loads is characterized by the change of loads in the first place. Secondly, it is necessary to consider whether the yield strength related to the time scale factor (Equation (5)) needs to be replaced with the dynamic yield strength. Therefore, the situation where the yield strength is not replaced is analyzed first. The dynamic load form is shown in Section 5.1, and on the basis of the nonlinear response scaling criterion of a box girder based on the finite similitude approach under dynamic load, the nonlinear response scaling criterion of a box girder under dynamic load can be obtained as follows:
where t in Π4 is the load action time.
According to the above nonlinear response scaling criterion of a box girder based on the finite similitude approach, the design steps of the box girder similarity model under dynamic load are:
- (1)
- Determine the geometric dimensions lps, material properties (density ρps, material yield stress σyps), initial conditions (initial peak bending moment Mdps, bending moment action time history Tdps), and boundary conditions of the full-scale model of the box girder;
- (2)
- Determine the geometric scale factor (β), material properties (density ρts, material yield stress σyts), initial conditions (initial peak load Mdts, load action time history Tdts), and boundary conditions of the box girder trial model;
- (3)
- The geometric dimensions (lts) and density scale factor (αρ) of the trial model are determined using similarity criteria Π1 and Π2, respectively;
- (4)
- The time scale factor h is calculated by the similarity criterion Π3;
- (5)
- Obtain the displacement angle (θ) and its temporal evolution (time history, t) for both the full-scale and trial models of the box girder through experimental or finite element calculations, and calculate the predicted displacement angle (θps) and the change in the angle over time relative to the full-scale model using similarity criteria Π4 and Π5.
Refer to Figure 4 for the specific flow chart illustrating the design method of the box girder trial model under dynamic load.
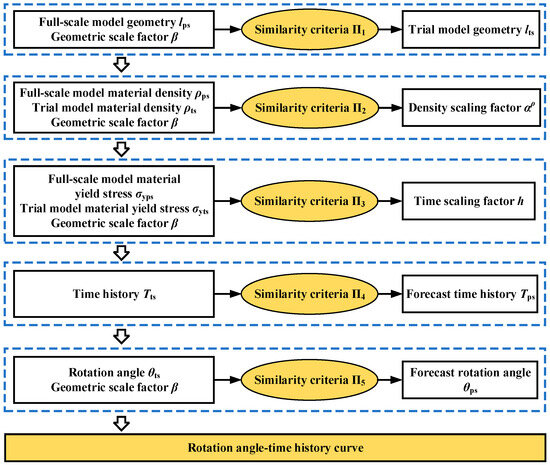
Figure 4.
Flow chart of the design method of the box girder under dynamic load.
3.3. Correction of the Nonlinear Response Scaling Criterion of Box Girder
Based on Section 3.2, considering the role of the dynamic yield strength in the scaling process, substitute the dynamic yield strength into Equation (5) and apply this method as a correction method in this paper. After considering the constitutive relationship in Section 2.4 and the correction method, the scaling criterion of the nonlinear response of the modified box girder is shown in the following equation:
where in Π3 is the dynamic average yield stress of the material, and βv in Π3 and Π4 is the velocity scale factor.
According to the above modified nonlinear response scaling criterion of the box girder under dynamic load, the similar design steps of the box girder under dynamic load are:
- (1)
- Determine the geometric dimensions lps, material properties (density ρps, constitutive relationship, such as the C-S equation), initial conditions (initial peak bending moment load Mdps, initial load action time history Tdps), and boundary conditions of the full-scale model of the box girder;
- (2)
- Determine the geometric scale factor β, the material properties (density ρts, constitutive relationship C-S equation), and boundary conditions of the box girder trial model;
- (3)
- The geometric dimensions lts and density scale factor αρ of the trial model are determined by similarity criteria Π1 and Π2, respectively;
- (4)
- Determine the average dynamic stress between the full-scale model of the box girder and the materials of each trial model, calculate the velocity ratio βv using the similarity criterion Π3, and further obtain the time scale factor h through the similarity criterion Π4;
- (5)
- Calculate the time history Tts and initial peak bending moment load Mdts of the box girder trial model by combining the scale factors Π5 and Π6, respectively;
- (6)
- The displacement angle θ of the full-scale model of the box girder and the trial model are obtained by experiment or finite element calculation, and the predicted displacement angle θps and displacement-time change history relative to the full-scale model are calculated using the similarity criteria Π5 and Π7.
Figure 5 illustrates the specific flow chart of the design method for the trial model of the box girder under modified dynamic load.
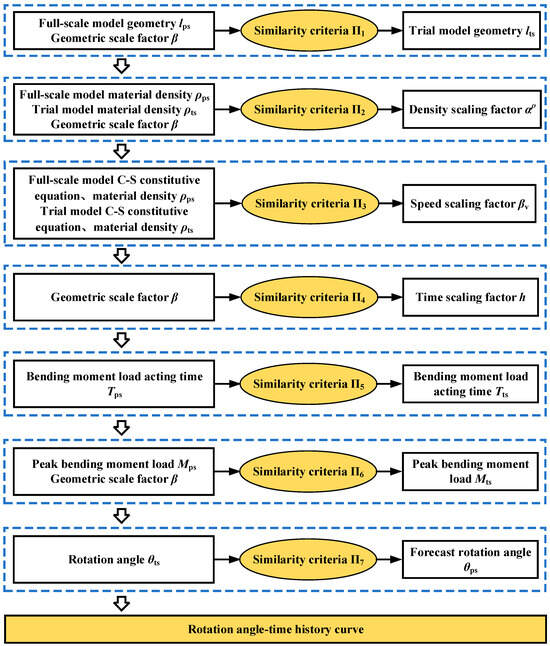
Figure 5.
Flow chart of the design method of the box girder trial model under modified dynamic load.
4. Numerical Analyses
4.1. Finite Element (FE) Model of Box Girder Specimen
Refer to Figure 6 for a schematic diagram illustrating the box girder profile. The structural form on each side of the box girder is uniform, featuring two longitudinal reinforcements distributed in the width direction. Additionally, the width of the stiffened plate is three times the width of the plate lattice b. The geometric parameters of the series box girder are presented in Table 2, where a represents the length of the plate lattice, b is the width of the plate grid, t is the thickness of the stiffened plate, hs is the height of the stiffener, ts is the thickness of the stiffener, hw is the height of the beam, and tw is the thickness of the beam. The above geometric parameters are in millimeters (mm). The specific material parameters of the finite element model of the box girder are also shown in Table 2, in which the full-scale model and trial model 1 use Q235 steel, the trial model 2 uses Q345 steel, the trial model 3 adopts aluminum, the trial model 4 adopts S235 steel, and the trial model 5 adopts 20 steel.
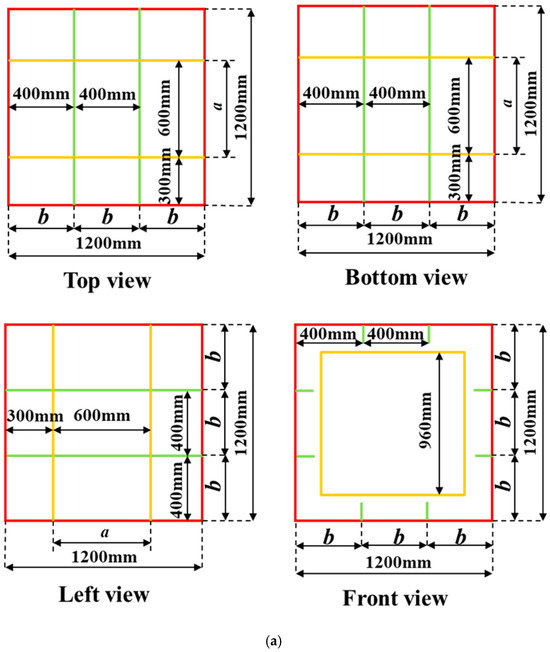
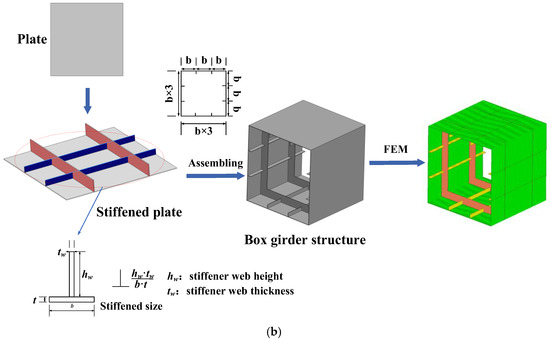
Figure 6.
Box girder structure design. (a) Geometric dimensions of the box girder structure. (b) Assembly of box-shaped beam structure.
Table 2.
Geometric and material parameters of each box girder model.
4.2. Boundary and Loading Conditions
4.2.1. Static Load Setting
The settings of loads and boundary conditions for the finite element model of the box girder are shown in Figure 7 and Table 3. By adjusting the settings of the reference points of the box girder twice, the buckling mode, static ultimate bending moment, and dynamic buckling mode of the box girder are solved. Among them, when calculating the dynamic buckling mode of the box girder, both the experimental model and the full-scale model adopt the first-order buckling mode as the initial deformation mode.
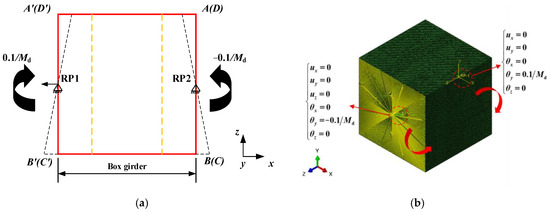
Figure 7.
Settings of boundary conditions and loads. (a) Settings of bending moment loads. (b) Settings of boundary conditions.
Table 3.
Boundary conditions settings of the box girders in FEM simulation.
4.2.2. Dynamic Load Setting
According to the literature [40], the slamming moment is simplified to a triangular load, and by changing the load amplitude and action time as different input loads, the first-order vibration period of each box girder model is adopted as the initial load action time T0, and the quasi-static limit bending moment M0 (obtained from Section 5.1) for each box girder model is employed as the initial load action peak, as shown in Figure 8 below.
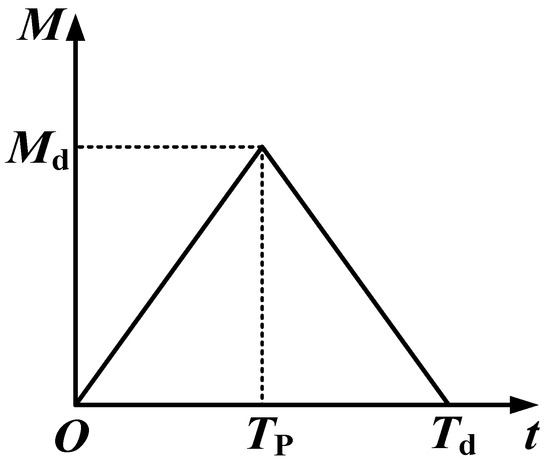
Figure 8.
Simplified slamming load schematic.
Table 4 presents the use of the quasi-static ultimate strength of the box girder, as calculated in Section 5.1, as the initial bending moment peak. The first-order vibration period is employed as the initial dynamic load action time. In the table, M0 represents the initial bending moment peak, and T0 is the initial dynamic load action time.
Table 4.
Initial bending moment peak/initial dynamic load action time.
4.3. Design Results of Small-Scale Box Girder Model
4.3.1. Detailed Information
The scale factor between the full-scale model of the box girder and the trial model calculated by the ultimate strength reduction criterion of the box girder from Equation (25) is shown in Table 5.
Table 5.
Scaling factors.
The constitutive coefficients of the Cowper–Symonds material for the materials in this paper are shown in Table 6.
Table 6.
Material constitutive relationship coefficients.
4.3.2. Modified Scaling Factors
Table 7 displays the scale factors obtained through the correction of Equation (27), representing the corrected time scale factor.
Table 7.
Modified scale factor.
The corrected time scale factor is substituted into Equation (27), and the adjusted initial load peak and initial dynamic load action time are presented in Table 8, where the bending moment unit is N·mm and the load action time unit is s.
Table 8.
Modification of initial load peak/initial dynamic load action time.
The dynamic load form is consistent with Section 4.2.2, and we employ the modified initial load peak and initial dynamic load action time.
4.4. Mesh Convergence Analysis
Ensuring the appropriate mesh size is crucial for result accuracy. Mesh convergence is verified through the mesh sensitivity analysis of the original box girder model, and three grid sizes are considered: 9 mm, 12 mm, and 15 mm. Figure 9 illustrates the angle–moment curves of the original box girder model for various mesh sizes. It is evident that as the grid is refined, the calculation results tend to converge. To improve the calculation efficiency, the grid size used in this paper is 12 mm, corresponding to a grid size of 6 mm for the trial model.
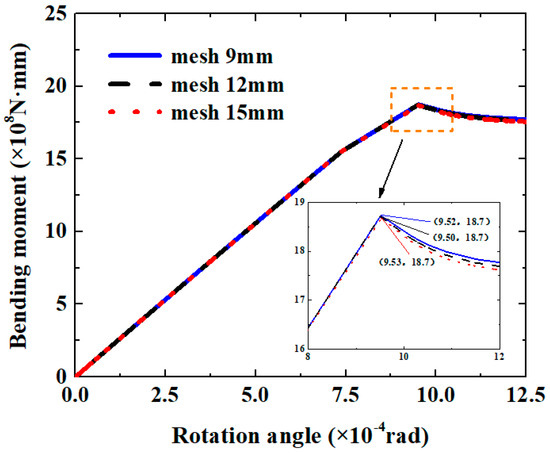
Figure 9.
Comparison of bending moment–angle curves of box girders under different grid sizes.
5. Similarity Validation of Quasi-Static Cases
5.1. Ultimate Strength
Table 9 presents the ultimate load and corresponding rotation angle of each box girder model under a longitudinal bending moment load, where Mtsmax is the limit load in the trial space and Mpsmax is the limit load of each model in the physical space, the unit is N·mm, θts is the angle of the box girder model in the trial space when subjected to Mtsmax, θps is the angle of the box girder model in the physical space when subjected to Mpsmax, and the unit is rad. Figure 10 displays the angle and moment curve pairs of the full-scale model alongside the prediction results for each trial model.
Table 9.
Quasi-static ultimate strength of the full-scale model of the box girder and the series of trial models.
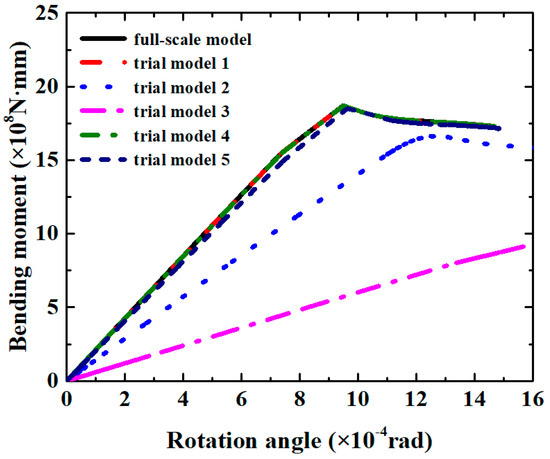
Figure 10.
Comparison of the rotation angle–bending moment curve of the full-scale model and the prediction results of each trial model.
By comparing the results in Table 2 and Table 9, as well as examining Figure 10, it can be seen that Trial model 1, made of the same material as the box girder model, and the ultimate bending moment load, rotation angle, and bending moment load–displacement angle curves derived in reverse are consistent with the full-scale model. Under static loads, the prediction deviation of the ultimate bending moment for Box Girder Trial model 2 is 11.11%, while the corresponding prediction deviation of the angular displacement reaches 31.55%. For Box Girder Trial model 3 under static loads, the prediction deviation of the ultimate bending moment is 25.57%, and the corresponding prediction deviation of the angular displacement is as high as 203.30%. All trial models are consistent in geometric dimensions but differ in material property scales. Since static loads are applied, the influence of the constitutive equation can be neglected. The static responses of each trial model, i.e., bending moment and angular displacement, are mainly related to material parameters such as density, Poisson’s ratio, elastic modulus, and static yield strength. It can be observed that except for Trial model 3, the static ultimate bending moment and angular displacement of Trial model 2 are greater than those of Trial model 5, followed by Trial model 4, and then Trial model 1. Combined with the comparison rules of various material parameters, this is closely related to the static yield strength and elastic modulus of each model. Except for Trial model 3, the elastic moduli of the other trial models are basically consistent, and the magnitude order of the static ultimate bending moment and angular displacement of each model is consistent with that of their static yield strength. However, Trial model 3 has a relatively high static yield strength but a relatively small static ultimate bending moment and a relatively large angular displacement. The analysis suggests that this is because the elastic modulus of aluminum is smaller than that of other trial models, making the structure relatively weak, thus resulting in a smaller static ultimate bending moment. In addition, due to the excessively small elastic modulus of aluminum, Trial model 3 is relatively "softer" than other models, so even under a relatively small bending moment, its angular displacement is still large.
Therefore, it can be seen that both static yield strength and elastic modulus jointly affect the static ultimate bending moment and angular displacement of the box girder. When the static ultimate bending moment of each trial model is predicted according to the scaling criteria, the prediction result of Trial model 2, which originally has a larger actual result, is instead smaller. This indicates that the static response similarity scaling criteria proposed in this paper establish the similarity relationship of responses between the full-scale model and the trial models by constructing the similarity relationship of geometry and material parameters between them. As can be seen from Table 2, although the static yield strength and elastic modulus differ among Trial models 1–4, the closer the ratio of static yield strength to elastic modulus (σy/E) is to that of the full-scale model, the higher the prediction accuracy of the box girder trial models designed using the static response scaling criteria proposed in this paper.
5.2. Buckling Failure Mode
The arc length method in the finite element analysis software ABAQUS 6.14 was utilized to analyze and calculate the quasi-static ultimate strength of both the full-scale box girder model and the trial models in the series. Figure 11 below illustrates the buckling failure mode of each box girder model under a pure bending load.
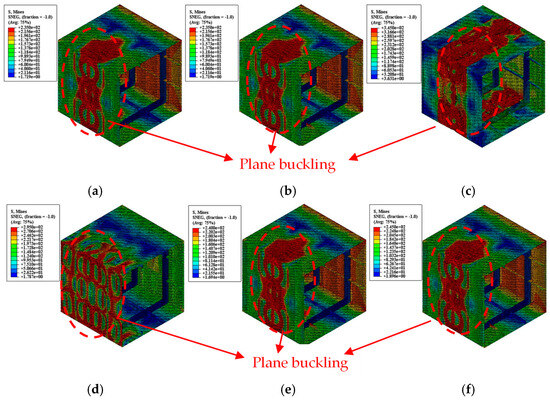
Figure 11.
Quasi-static buckling failure mode of the full-scale model of the box girder and the series trial model. (a) Full-scale model, (b) trial model 1, (c) trial model 2, (d) trial model 3, (e) trial model 4, and (f) trial model 5.
By comparing the failure modes of the original box girder model and the series of trial models in Figure 11, it can be seen that the failure modes of trial models 1, 4, and 5, which closely match the ratio σy/E of the yield strength to elastic modulus of the original box girder model material, have high similarity with the full-scale model, and the σy/E of other box girder trial model materials significantly differs from that of the full-scale model, so the similarity is poor. When applying the ultimate strength reduction criterion of the box girder from Section 3.1 in experimental or numerical simulations, the trial model material is chosen to have a σy/E ratio similar to that of the full-scale model. The solution process is then carried out accordingly.
6. Similarity Validation of Dynamic Cases
In order to further verify the reliability of the box girder nonlinear response scaling criterion, the dynamic response analysis of the original box girder model and the series trial models was carried out by using the finite element software ABAQUS. Trial models 1, 4, and 5, along with the full-scale model of the box girder, demonstrate high accuracy in predicting static response characteristics and were taken as the research objects. The similar characteristics of the dynamic buckling critical load and failure mode of the full-scale box girder model and the series of trial models under varying load durations were investigated and elucidated.
6.1. Dynamic Critical Buckling Load
Since the buckling path of the plate frame structure may demonstrate varying characteristics under different load durations, the critical dynamic buckling load of the box girder was determined by integrating both the traditional B-R criterion and the modified B-R criterion. Table 10 displays the dimensionless dynamic buckling critical loads of the full-scale box girder model and trial models 1, 4, and 5 under various dynamic load durations, and angle–time curves corresponding to the critical load moments of dynamic buckling for each model are presented in Figure 12.
Table 10.
Dimensionless dynamic buckling critical loads of each model under different dynamic load times.
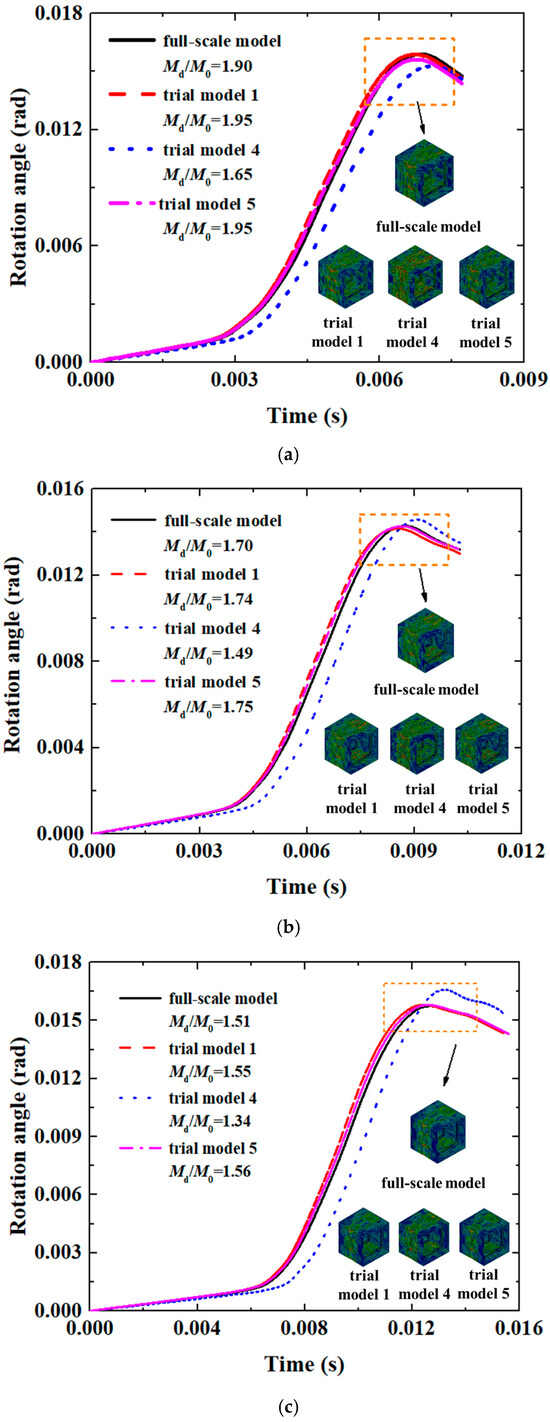
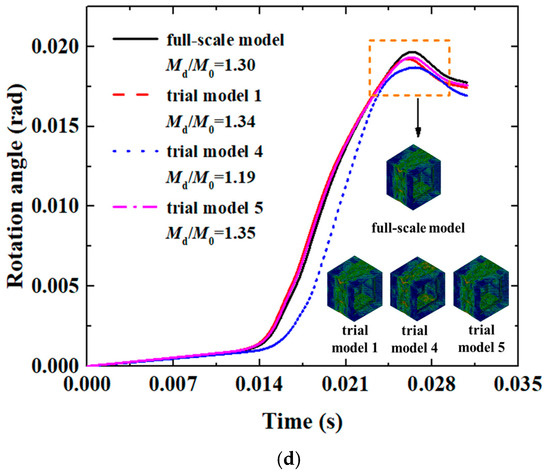
Figure 12.
Angle–time curve of the critical load moment of dynamic buckling in each box girder model. (a) Td = T0; (b) Td = 1.33 T0; (c) Td = 2 T0; (d) Td = 4T0.
It can be seen from Table 10 and Figure 12 that the trial models 1 and 5 have similar dimensionless dynamic buckling critical loads at different load times, and the angle–time curves corresponding to the dynamic buckling critical load time also have a high degree of agreement. It can be seen from the combined Equation (18) that the trial models 1 and 5 have good prediction accuracy for the dynamic response characteristics of the full-scale model. Since the constitutive relationship of the material is considered within the displayed kinetic algorithm, combined with Table 6, it can be found that the reason for the low prediction accuracy of trial model 6 for the full-scale model is the omission of differences in constitutive relationship coefficients between the model materials, so it is necessary to revise the nonlinear response scaling criterion of the box girder based on the finite similitude approach under dynamic load.
Table 10 presents the dimensionless dynamic buckling load, and Figure 13 illustrates the corresponding dimensionless dynamic buckling critical load–dimensionless load action time curve. By observing Table 10 and Figure 13, it can be seen that (1) with longer load action times, the critical dynamic buckling load of each box girder model decreases, and the deformation during buckling failure increases. The variation trend of dimensionless dynamic buckling critical load–dimensionless load action time curves of each model of box girder is close, and the coefficient of agreement between box girder trial models 1 and 5 and the original box girder model is high, which verifies the reliability of the nonlinear response scaling criterion of the box girder based on the limited similarity method, while box girder trial model 4 does not consider the difference in constitutive relationship in the calculation process, resulting in a large error. (2) Although Trial model 1 is an ideal scaled-down model of the prototype, and its response should maintain an ideal similarity relationship with the full-scale model under ideal conditions, the actual calculation results show that this is not the case. This is because although the ideal scaled-down model is scaled in terms of dimensions, material parameters such as wave velocity cannot be scaled. In addition, nonlinear effects such as boundary conditions cannot be reflected in the scaling process, so there are still errors in the response of the ideal scaled-down model. Moreover, the errors indicate that the prediction results of the ideal scaled-down model are all larger than the actual values. This is due to the fact that the material density remains unchanged during the scaling process; the mass is reduced in proportion to the cube of the scaling factor, while the stiffness is reduced in proportion to the square of the scaling factor. As a result, the mass decreases at a slower rate than the stiffness, leading to a reduction in the natural frequency. With the decrease in the natural frequency, the model is more likely to enter a resonant state, and the response is naturally amplified. (3) As the loading time increases (i.e., the loading rate decreases), the prediction accuracy of Trial model 1 tends to decrease. It can be seen that the predicted critical buckling load of Trial model 1 differs from that of the prototype by approximately 0.04 under all working conditions, but both values become smaller, resulting in an increase in the prediction deviation. The overall prediction accuracy of Trial model 5 under each working condition is similar to that of Trial model 1, which is related to the fact that the material parameters of Trial model 5 itself are close to those of Trial model 1. In contrast, the prediction accuracy of Trial model 4 is much lower. It can be seen that although the prediction accuracy of Trial model 4 is good under static loads, under dynamic loads, if the influence of the material constitutive equation during the scaling process is not considered, it will greatly affect the prediction accuracy of the trial model. Therefore, the dynamic response analysis of Trial models 1, 4, and 5 is re-conducted using the modified dynamic response similarity criteria.
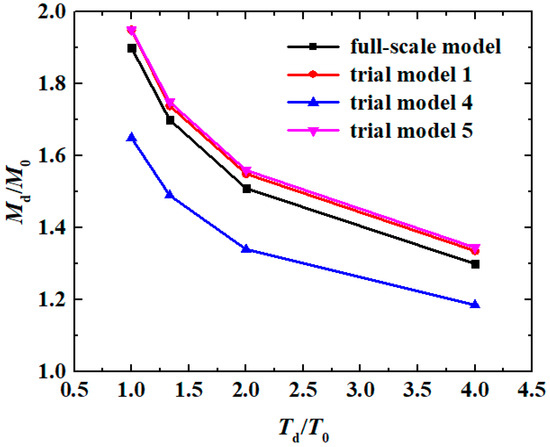
Figure 13.
Dimensionless dynamic buckling critical load peak–dimensionless load action time curve.
6.2. Correction of Dynamic Critical Buckling Load
The modified initial load peak, initial dynamic load action time, and the dynamic buckling critical loads for the full-scale box girder model and trial models 1, 4, and 5 under various corrected dynamic load action times are presented in Table 8 and Table 11, and the angle–time curves corresponding to the critical load moments of dynamic buckling of each model are shown in Figure 14.
Table 11.
Dimensionless dynamic buckling critical loads of each model under different modified dynamic load times.
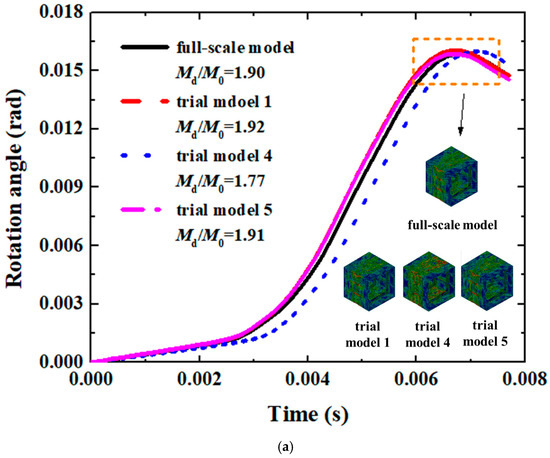
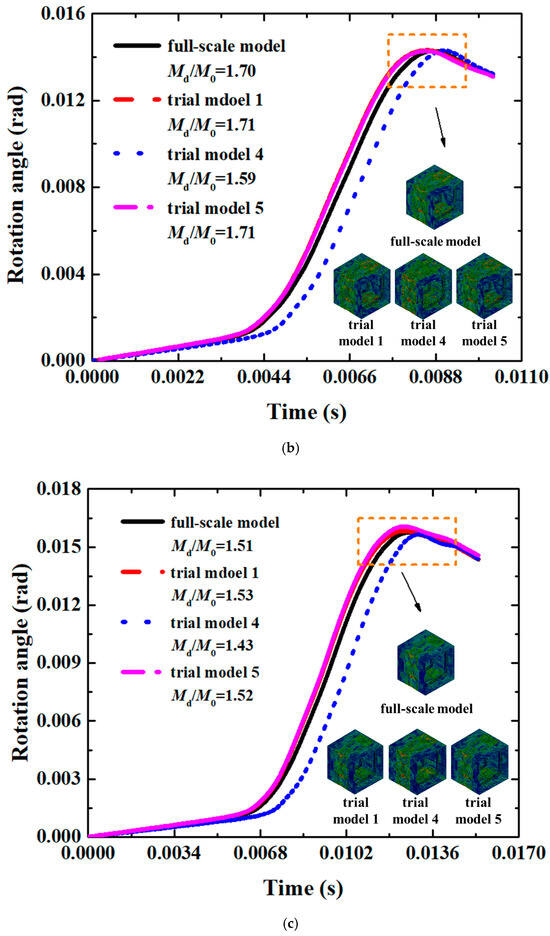
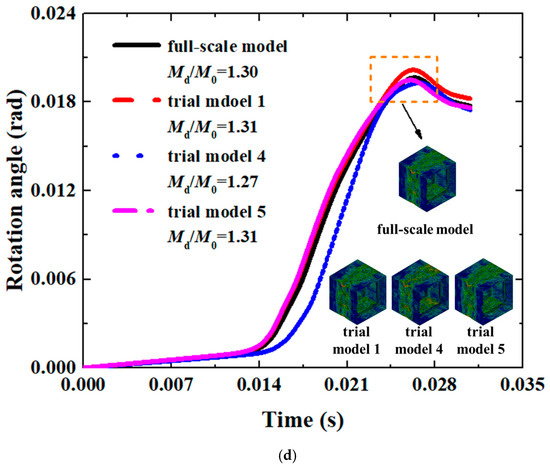
Figure 14.
The angle–time curve of the critical load moment of the dynamic buckling correction is corrected by each box girder model. (a) Td =T0mod; (b) Td =1.33T0mod; (c) Td =2T0mod; (d) Td =4T0mod.
By comparing the prediction accuracy of each model in Table 10 with that in Table 11, it can be observed that the prediction accuracy of all Trial models has been significantly improved after the correction using the proposed method. Specifically, the range of prediction deviations for Trial model 1 under various working conditions has decreased from −2.35% to −3.08% to −0.59% to −1.32%; for Trial model 4, it has dropped from 8.46% to 13.16% to 2.31% to 6.84%; and for Trial model 5, it has been reduced from −2.63% to −3.85% to −0.53% to −0.77%.
It is evident that when the similarity relationships of parameters in the constitutive equation are taken into account during the design process of small-scale models under dynamic loads, the prediction accuracy of the similarity criteria is significantly enhanced. Additionally, for Trial model 4, the prediction accuracy improves as the loading time increases, indicating that the modified criteria perform better in predicting under low loading rate conditions than under high loading rate conditions. In contrast, due to the relative proximity of their material parameters to those of the prototype, both Trial model 1 and Trial model 5 exhibit good prediction accuracy under different loading rate conditions.
The corresponding dimensionless dynamic buckling critical load–dimensionless load action time curve is shown in Figure 15. By observing Table 11 and Figure 15, it can be seen that (1) correcting the initial load peak and the initial dynamic load action time has almost no effect on the buckling path of each box girder model, as it mainly changes the critical load of dynamic buckling; (2) compared with the revised trial model, the prediction accuracy of the dynamic buckling critical load for the full-scale model is improved; and (3) the reliability of the nonlinear response scaling criterion of the box girder based on the finite similitude method is verified.
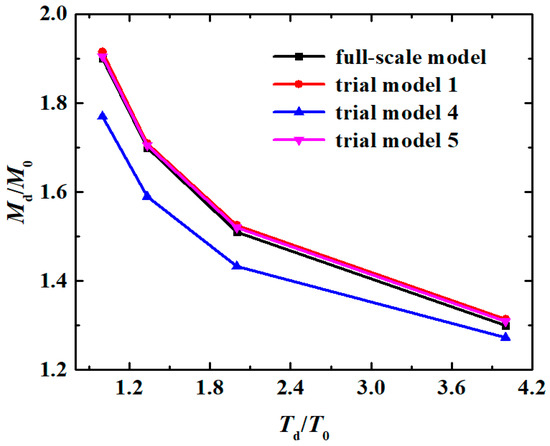
Figure 15.
Dimensionless dynamic buckling critical load peak–dimensionless load action time curve.
7. Conclusions
In this paper, the full-scale model and series trial model of a box girder designed based on the ultimate strength and dynamic response scaling criteria using finite similitude theory are taken as the research objects. The quasi-static ultimate strength research and the dynamic response characteristics of the simplified slamming bending moment are studied using the nonlinear finite element software ABAQUS. The ultimate load and load–displacement curves of the series box girder trial model under static and dynamic loads are compared and analyzed.
The analysis results indicate that finite similitude theory can be applied to the similar design of hull structures. The ultimate strength reduction criterion of box girders based on finite similitude theory under quasi-static load has high reliability, and the key point is to select the appropriate test material. Under certain initial deformation conditions, when the σy/E of the box girder trial model material is similar to the full-scale model material, the box girder trial model obtained based on the ultimate strength reduction criterion of the box girder proposed in this paper has a high degree of similarity with the full-scale model in buckling failure mode, and the ultimate bending moment load and displacement angle of the box girder full-scale model can be accurately predicted by the results of the box girder trial model.
The simulation results show that although the change trend of the dimensionless dynamic buckling critical load peak–dimensionless loading time curve of the full-scale model and the dimensionless dynamic buckling critical load curve of each trial model are similar, the curve agreement is average, indicating that the trial model designed by the dynamic response scaling criterion of the box girder based on the finite similitude theory still has a certain error in the prediction of the dimensionless dynamic buckling critical load of the full-scale model under the corresponding dimensionless load duration. Due to the lack of consideration for the similarity of constitutive equations, the direct application of the nonlinear response scaling criterion of the box girder under dynamic load may result in relatively large errors. Therefore, it is necessary to appropriately modify the criterion to enhance its forecasting accuracy. In addition, the correction criterion has no significant effect on the post-buckling path of the box girder model.
Author Contributions
Conceptualization, C.X. and X.K.; methodology, Z.W.; software, C.X.; validation, H.Z., C.Z. and W.W.; formal analysis, C.X.; data curation, C.X.; writing—original draft preparation, C.X.; writing—review and editing, Z.W.; visualization, X.K.; supervision, W.W. All authors have read and agreed to the published version of the manuscript.
Funding
This research was funded by National Natural Science Foundation of China, grant number 52171318.
Data Availability Statement
The research data supporting the findings of this article are available from the corresponding author upon reasonable request.
Conflicts of Interest
The authors declare no conflict of interest.
References
- Sugimura, T.; Nozaki, M.; Suzuki, T. Destructive experiment of ship hull model under longitudinal bending. J. Zosen Kiokai 2009, 1966, 209–220. [Google Scholar] [CrossRef]
- Dow, R.S. Testing and Analysis of a 1/3-Scale Welded Steel Frigate Model. In Proceedings of the International Conference on Advances in Marine Structures-2, Dunfermline, UK, 21–24 May 1991. [Google Scholar]
- Dowling, P.J. The effect of shear lag on the ultimate strength of box girders. In Proceedings of the International Congress on Steel Plated Structures, London, UK, 20–21 July 1976; pp. 108–147. [Google Scholar]
- Reckling, K.A. Behaviour of box girders under bending and shear. In Proceedings of the 7th International Ship and Offshore Structures Congress (ISSC), Paris, France, 20–24 August 1979. [Google Scholar]
- Ostapenko, A. Strength of Ship Hull Girders under Moment, Shear and Torque. In Proceedings of the SSC-SNAME Symposium on Extreme Loads Response, Arlington, TX, USA, 19–20 October 1981; pp. 149–166. [Google Scholar]
- Xu, X.D.; Cui, W.C.; Leng, J.X. Experimental and theoretical study on the ultimate bearing capacity of box girder. Ship Mech. 2000, 5, 36–43. [Google Scholar]
- Sun, H.H.; Soares, C.G. An experimental study of ultimate torsional strength of a ship-type hull girder with a large deck opening. Mar. Struct. 2003, 16, 51–67. [Google Scholar] [CrossRef]
- Yang, P. Research on Ultimate Strength and Damage Residual Strength of Hull Structure. Ph.D. Thesis, Wuhan University of Technology, Wuhan, China, 2005. [Google Scholar]
- Liu, B. Research on the Ultimate Strength of Small Waterplane Area Catamaran. Master’s Thesis, Wuhan University of Technology, Wuhan, China, 2009. [Google Scholar]
- Liu, W.Q. Research on the Ultimate Strength of High-Speed Trimaran. Master’s Thesis, Wuhan University of Technology, Wuhan, China, 2011. [Google Scholar]
- Yuan, T. Nonlinear Similarity Criterion and Experimental Study on Ultimate Strength of Axially Compressed Stiffened Plate. Master’s Thesis, Wuhan University of Technology, Wuhan, China, 2019. [Google Scholar]
- Li, J.; Zhang, R.; Jin, L.; Lan, D.; Du, X. Scaling laws of low-velocity impact response for RC beams: Impact force and reaction force. Int. J. Impact Eng. 2024, 186, 104887. [Google Scholar] [CrossRef]
- Huang, X.; Feng, Y.; Wang, M.; Qiu, X. The dominating dimensionless numbers of an elastic-plastic thin plate under dynamic loading. J. Mech. Phys. Solids 2024, 186, 105593. [Google Scholar] [CrossRef]
- Cheng, Y.Q.; Liu, K.; Wang, Z.L. Scaling behaviour of corrugated sandwich panels under impact load. J. Sandw. Struct. Mater. 2023, 25, 846–865. [Google Scholar] [CrossRef]
- Wang, Y.; Yao, X.; Wang, Z.; Yang, N. Compensation model for truncated ogive projectiles penetrating ship stiffened plates made from different materials. Ocean Eng. 2023, 286, 115604. [Google Scholar] [CrossRef]
- Wang, Y.; Wang, Z.; Yao, X.; Yang, N. Material similarity law of blunt projectiles penetrating scaled steel target plates. Int. J. Impact Eng. 2023, 178, 104603. [Google Scholar] [CrossRef]
- Ma, H.; Kawamura, Y.; Okada, T.; Wang, D.; Hayakawa, G. An improved scaled model design method for box girders under hogging moment considering the ultimate bending moment and collapse modes. Mar. Struct. 2024, 98, 103660. [Google Scholar] [CrossRef]
- Ma, H.; Zhang, L.; Okada, T.; Kawamura, Y.; Wang, D.; Sun, S.; Liu, N.; Li, C. Experimental and numerical study on a universal distorted model design strategy for the box girder with the double bottom under the bending moment considering the ultimate strength and buckling collapse modes, Part 1: Scaling strategy. Ocean Eng. 2025, 338, 121878. [Google Scholar] [CrossRef]
- Oshiro, R.E.; Calle, M.A.; Mazzariol, L.M.; Alves, M. Experimental Study of Collision in Scaled Naval Structures. Int. J. Impact Eng. 2017, 110, 149–161. [Google Scholar] [CrossRef]
- Mazzariol, L.M.; Oshiro, R.E.; Alves, M. A Method to Represent Impacted Structures Using Scaled Models Made of Different Materials. Int. J. Impact Eng. 2016, 90, 81–94. [Google Scholar] [CrossRef]
- Davey, K.; Sadeghi, H.; Darvizeh, R.; Golbaf, A.; Darvizeh, A. A Finite Similitude Approach to Scaled Impact Mechanics. Int. J. Impact Eng. 2020, 148, 103744. [Google Scholar] [CrossRef]
- Sadeghi, H.; Davey, K.; Darvizeh, R.; Darvizeh, A. Scaled Models for Failure under Impact Loading. Int. J. Impact Eng. 2019, 129, 36–56. [Google Scholar] [CrossRef]
- Davey, K.; Darvizeh, R.; Zhang, J. Finite Similitude in Fracture Mechanics. Eng. Fract. Mech. 2021, 245, 107573. [Google Scholar] [CrossRef]
- Davey, K.; Darvizeh, R.; Al-Tamimi, A. Scaled metal forming experiments: A transport equation approach. Int. J. Solids Struct. 2017, 125, 184–205. [Google Scholar] [CrossRef]
- Davey, K.; Darvizeh, R.; Al-Tamimi, A. Finite Similitude in Metal Forming. In Proceedings of the 12th International Conference on Numerical Methods in Industrial Forming Processes, Troyes, France, 4–7 July 2016; Volume 80, p. 01005. [Google Scholar]
- Raul, O.C.; Teresa, A.R.; Keith, D. Scaling in biomechanical experimentation: A finite similitude approach. J. R. Soc. Interface 2018, 15, 20180254. [Google Scholar] [CrossRef]
- Darvizeh, R.; Davey, K. A transport approach for analysis of shock waves in cellular materials. Int. J. Impact Eng. 2015, 82, 59–73. [Google Scholar] [CrossRef]
- Sadeghi, H.; Davey, K.; Darvizeh, R.; Rajabiehfard, R.; Darvizeh, A. An Investigation into Finite Similitude for High-Rate Loading Processes: Advantages in Comparison to Dimensional Analysis and its Practical Implementation. Int. J. Impact Eng. 2020, 140, 103554. [Google Scholar] [CrossRef]
- Zhang, J.; Davey, K.; Darvizeh, R.; Sadeghi, H. A two-experiment approach to physical modelling: Damage and failure under high-rate loading. Thin-Walled Struct. 2022, 179, 109589. [Google Scholar] [CrossRef]
- Ochoa-Cabrero, R.; Alonso-Rasgado, T.; Davey, K. A Two-Experiment Approach to Scaling in Biomechanics. J. Biomech. Eng. 2022, 144, 081004. [Google Scholar] [CrossRef]
- Davey, K.; Zhang, J.; Darvizeh, R. Fracture mechanics: A two-experiment theory. Eng. Fract. Mech. 2022, 271, 108618. [Google Scholar] [CrossRef]
- Al-Tamimi, A. Scaling of bi-material sandwich panels subjected to impact loadings. Proc. Inst. Mech. Eng. Part C J. Mech. Eng. Sci. 2023, 237, 5443–5459. [Google Scholar] [CrossRef]
- Davey, K.; Darvizeh, R.; Akhigbe-Midu, O.; Sadeghi, H. Scaled cohesive zone models for fatigue crack propagation. Int. J. Solids Struct. 2022, 256, 111956. [Google Scholar] [CrossRef]
- Davey, K.; Sadeghi, H.; Darvizeh, R. The theory of scaled electromagnetism. Proc. R. Soc. A 2022, 478, 20210950. [Google Scholar] [CrossRef]
- Davey, K.; Darvizeh, R.; Atar, M. A first order finite similitude approach to scaled aseismic structures. Eng. Struct. 2021, 231, 111739. [Google Scholar] [CrossRef]
- Xie, R.Z.; Zhong, W.Z.; Huang, X.C. Model Experiment and Numerical Simulation of Drop Impact of Packaging Composite Structure. In Proceedings of the 11th National Academic Conference on Impact Dynamics, Xian, China, 14–17 August 2013. [Google Scholar]
- Yang, X.; Ma, J.; Sun, Y.; Yang, J. An Internally Nested Circular-Elliptical Tube System for Energy Absorption. Thin-Walled Struct. 2019, 139, 281–293. [Google Scholar] [CrossRef]
- Karagiozova, D.; Alves, M.; Jones, N. Inertia Effects in Axisymetrically Deformed Cylindrical Shells under Axial Impact. Int. J. Impact Eng. 2000, 24, 1083–1115. [Google Scholar] [CrossRef]
- Krzysztof, W. TB11 Test for Short W-Beam Road Barrier. In Proceedings of the 11th European LS-DYNA Conference, Salzburg, Austria, 9–11 May 2017. [Google Scholar]
- Tsuda, T.; Ohnishi, Y.; Ohtagaki, R.; Cho, K.; Fujimoto, T. Three-Point Bending Crack Propagation Analysis of Beam Subjected to Eccentric Impact Loading by X-FEM. In Proceedings of the 10th European LS-DYNA Conference, Wurzburg, Germany, 15–17 September 2015. [Google Scholar]
Disclaimer/Publisher’s Note: The statements, opinions and data contained in all publications are solely those of the individual author(s) and contributor(s) and not of MDPI and/or the editor(s). MDPI and/or the editor(s) disclaim responsibility for any injury to people or property resulting from any ideas, methods, instructions or products referred to in the content. |
© 2025 by the authors. Licensee MDPI, Basel, Switzerland. This article is an open access article distributed under the terms and conditions of the Creative Commons Attribution (CC BY) license (https://creativecommons.org/licenses/by/4.0/).