1. Research Background
As a key area of international energy consumption and one of the main sources of carbon emissions, the transportation industry exhibits significant differences in the environmental efficiency of different transportation modes. According to data from the World Bank, shipping accounts for approximately 3% of global greenhouse gas emissions and 15% of other air pollutants annually [
1]. Against this backdrop, liquefied natural gas (LNG), as a clean energy source that is conducive to carbon reduction, has attracted considerable attention due to its large-scale application in the energy sector. In 2021, the Clydebank Declaration on Green Shipping Corridors officially proposed the concept of “green shipping corridors” at the international level, namely “zero emission routes”. Among them, nine corridors in the container and ferry sub-markets are considering using natural gas as fuel [
2]. According to data from the General Administration of Customs of the People’s Republic of China [
3], in 2023, China’s LNG import volume reached 71.32 million tons (approximately 9.84 billion cubic meters), making China the world’s largest importer of LNG. With the growth in LNG imports, China has also accelerated the construction of clean energy infrastructure. China’s first offshore international LNG bunkering center was officially established in 2020 at Yantian Port in Shenzhen, Guangdong Province [
4].
However, LNG presents certain hazards, such as flammability, explosiveness, low temperature, and asphyxiation risks [
5]. One of the most common accidents is the ignition and explosion resulting from the mixture of natural gas and air when exposed to an ignition source. LNG has a rapid flame propagation speed, and its combustion rate is significantly high, approximately twice that of gasoline. The flame temperature is high and the radiative heat is intense, leading to the potential for large-scale fires. Moreover, LNG fires are prone to re-ignition and re-explosion, making them difficult to extinguish. After release, liquefied natural gas forms a white vapor cloud due to the heat transfer between the ground and air. Natural gas is lighter than air, so it spreads rapidly in the air. After encountering a fire source, the flame spreads to areas where oxygen can reach. The burning vapor prevents the further formation of vapor clouds and then forms stable combustion. When the mixing ratio of natural gas and air is within the range of 5 vol% to 15 vol%, an explosion occurs. Therefore, it is necessary to study and explore the scenarios and consequences of LNG leakage risks. On 2 November 2020, a fire occurred during the construction of the Phase II project involving simultaneous loading of lean and rich LNG at the Tieshan Port (Linhai) Industrial Area in Beihai City, Guangxi Zhuang Autonomous Region [
6]. The direct cause of the accident was the opening of an isolation valve, which caused LNG to spray from a cut pipe. The resulting LNG vapor and air mixture ignited upon encountering a potential ignition source. The accident resulted in 7 fatalities, 2 serious injuries, and direct economic losses amounting to RMB 20.293 million.
In accordance with the requirements of the “Guidelines for Liquefied Natural Gas Fuel Refueling Operations” [
7] regarding quantitative risk assessment in refueling operations, simulation quantitative analysis should be carried out on the consequences of leakage accidents during the bunkering process of LNG bunkering ships. The main component of LNG is methane (molecular formula CH
4), which is odorless, colorless, non-corrosive, and non-toxic. It is a product of natural gas liquefied at a certain pressure through deep freezing, with a volume of about 1/590 of the volume of natural gas under standard conditions (101.325 kPa, 0 °C). It is suitable for long-distance transportation and large-scale storage. The natural gas generated at room temperature after LNG gasification has a lower density than air and is prone to dispersion after leakage. When conducting risk analysis of the consequences of LNG release, models can be used to assess the risk of the event, and release consequences can also be analyzed through on-site or wind tunnel experiments, theoretical research, and numerical simulation. Since the late 1960s, some research institutions in the United States have conducted on-site experiments on LNG release and dispersion. Famous and representative on-site experiments include the Falcon experiment [
8], Coyote experiment [
9], Maplin Sands experiment [
10,
11], Burro experiment [
12], Avocet series experiment, Capistran experiment, and Gadila Jettision experiment [
13]. The measured data obtained from the above experiments provide strong support for the subsequent study of the consequences of LNG leaks, fires, and other accidents, as well as for the construction of mathematical models, such as the Burro series experiments commonly used by scholars for model validation [
14,
15]. However, due to the large amount of manpower and funds required for field experiments, few scholars have carried out large-scale field experiments in recent years, in addition to studying the application of chemical materials in LNG accident scenarios, such as the inhibitory effect of high expansion foam on the concentration of LNG leakage gas [
16]. More scholars and research institutes are conducting theoretical research on the risk analysis and dispersion models of LNG release.
In the late 1970s, supported by a series of theories and experiments, researchers summarized and proposed many empirical computational models. Hu [
17] considered five factors, including frequency and severity during navigation and accident characteristics, and proposed a new model based on relative risk assessment. Luketa Hannlin [
10] described explosion, pool boiling, and rapid phase transition phenomena, discussed prediction models for dispersion and hazardous distance, and demonstrated that parameters such as LNG release, dispersion and evaporation, and pool fires have a significant impact on hazardous distance. Hissong [
18] considered the temporal variation of LNG spillage and evaporation when mixed with water, analyzed these processes using material and energy balance methods, and concluded that the degree of harm caused by LNG release into water is closely related to the size of the liquid pool formed. They also estimated the heat transfer results by accounting for turbulence. Lehr W’s study [
19] compared the possible similarities and differences between accidents involving accidental release, dispersion, and fires caused by different hydrocarbon fuels, including LNG, from ships. The study also included quantitative estimation of characteristic parameters such as spreading speed, duration, maximum floating oil size, combustion speed, smoke, and thermal radiation. Sun [
20] proposed a new model based on the Gaussian plume model using the virtual source method and fluid settling theory, and discussed the effects of release direction, release aperture, and tunnel cross-section on concentration distribution. The authors of [
21] proposed a Dynamic Risk Assessment Model for the Domino Effect in Urban LNG Stations (DRADL), which uses a set of physical processes and effect models to simulate event processes. Nubli [
22] considered the structural integrity and damage caused by collisions of the target ship and used CFD methods to discuss the gas diffusion characteristics of LNG refueling ships and the influence of low-temperature flow on the structure of refueling ships. Luan [
23] proposed a multiphase CFD model combined with an evaporation model to simulate the complete overtopping process (including LNG overtopping, LNG dispersion, LNG evaporation, and vapor dispersion) and analyzed the effects of embankment structure on wind field, overtopping rate, LNG dispersion, and LNG vapor cloud dispersion. Xie [
24] developed a numerical model of a release jet and conducted theoretical analysis on a series of release situations at different heights of tank openings and under varying internal pressures and external temperatures. The study explored the horizontal stretching of the release vapor cloud on the ground and its impact on the high-pressure steam jet near LNG storage tanks. These theoretical methods have laid a solid foundation for numerical simulation and software simulation. Other empirical computational models include Gaussian model [
20], FEM3 model [
25], Slab model [
26], UDM, BM model, etc. At the beginning of the 21st century, with the rapid development of the computer industry, research institutions and scholars in various countries have developed various numerical models specifically for simulating release, dispersion, and combustion. After continuous improvement and development, simulation has become a new hotspot in the field of LNG shipping safety research [
27].
Scholars have established a simulation model for LNG release accidents to estimate the leakage, dispersion, and evaporation rates in open water areas, while identifying hazardous areas based on thermal radiation levels [
28]. It has also been determined that other materials, such as LPG and gasoline, with the same confidence level as LNG, have the same effects on fuel release, dispersion, vaporization, and pool fires. Consequently, the same basic equations and principles are applicable. Additionally, a comprehensive model was constructed to predict the dynamic leakage of LNG and product oil tankers [
29]. By specifying the characteristics of the pool and establishing variables such as pool fire, pool fire area, duration, and heat release rate, it has been determined that the number and speed of leaks depend on the size and location of the rupture, ultimately reaching a static equilibrium state. Compared to other petroleum products, LNG has a larger leak volume, larger pool fire area, higher combustion heat rate, and faster combustion speed. Another scholar [
30] used a two-phase, multi-species model to simulate the dispersion process of LNG vapor clouds and comprehensively considered three common water phase change treatment methods to explore the influence of water vapor phase transition on LNG vapor cloud dilution under different relative humidity conditions. These methods include ignoring water phase changes, considering water phase changes using the Lee model, and considering water phase changes using the Sun model to explore the role of water vapor phase transition in LNG vapor cloud dilution. Wesierski [
31] used a combination of experimental and numerical simulation methods to study the propagation characteristics of natural gas vapor clouds leaked from LNG transport tankers for 2–4 min. Bozzolasco [
32] used simulation software to simulate the risk consequences of release at LNG receiving stations and determined the impact level based on gas cloud concentration and thermal radiation.
The most commonly used software for simulating LNG leaks currently includes professional accident consequence analysis software PHAST 8.7 [
33,
34], computational fluid dynamics (CFD) software Fluent [
35,
36,
37,
38], and FLACS [
39,
40,
41]. FLACS is CFD software specifically designed for gas explosions, fires, and smoke diffusion. Based on turbulent combustion models and gas dynamics equations, it is suitable for simulating explosions and fires after combustible gas leaks. It can be used to compare different operating and environmental conditions, leak hole diameter, leak rate, wind speed, and wind direction factors; study the characteristics of fuel leak dispersion; and determine the range of safe zones [
39,
40,
41]. Fluent is based on CFD and simulates complex fluid flow, heat transfer, and chemical reactions by solving Navier–Stokes equations and other conservation equations, such as energy, mass, and momentum. It can simulate the dispersion characteristics of a vapor cloud under different environmental conditions (such as wind speed, wind angle, temperature, cofferdam height, leakage amount) [
35,
37,
38], assess its combustion and explosion hazards to ships, personnel, and equipment [
36], and propose hazard mitigation measures and safety design optimization schemes, such as sensitivity analysis of heat expansion (HEX) foam height and quantitative assessment of ship lift accidents [
37].
PHAST uses the Unified Dispersion Model (UDM) to model jets and dense, buoyant, and passive dispersion, including droplet rainout and re-evaporation. It combines simplified equations of fluid dynamics, thermodynamics, and chemical reactions that are suitable for simulating large-scale leaks, dispersion, fires, and explosions. The research conducted using PHAST mainly focuses on simulating LNG release, dispersion, and vapor cloud formation [
33,
34], analyzing the effects of different environmental conditions (such as wind speed, wind direction, and terrain) on the dispersion range and concentration of LNG vapor clouds [
33,
42], and evaluating the potential risks of fire and explosion [
31,
40]. PHAST is currently the most comprehensive software for process industry hazard analysis and quantitative risk assessment [
33]. Its computational model has been validated by DNV GL Spadeadam [
43], the world’s largest fire and explosion laboratory, and has been recognized by the State Administration of Work Safety in China. PHAST is based on empirical models and simplified physical equations, with fast calculation speed, a user-friendly interface, and high cost-effectiveness. In contrast, Fluent focuses on high-precision CFD simulations, which require high computational resources and are time-consuming; FLACS focuses on explosion and fire simulation and is suitable for complex geometric environments. The speed, comprehensiveness, and ease of use of PHAST make it an ideal tool for LNG hazard consequence analysis, particularly suitable for rapid risk assessment in large-scale scenarios. The comparison of the three hazard analysis tools is shown in
Table 1.
According to the guidelines [
7] published by the China Classification Society, when conducting quantitative risk analysis on LNG, the scope and degree of disaster impact should be calculated based on vapor cloud dispersion, thermal radiation, and explosion shock waves. Existing studies on LNG release and dispersion mostly consider the effects of environmental factors (such as wind speed and direction, atmospheric stability, etc.), tank properties (volume, pressure, etc.), and tank release aperture. Recent studies have highlighted the significance of safety zones and ventilation strategies in the applications of alternative fuels, e.g., ship-to-ship LNG bunkering [
44] and hydrogen-fueled ships [
45]. There is relatively little research on hose release during bunkering operations [
46]. However, during the process of LNG bunkering, release may occur at different heights and in different directions at the hose or hose connection due to differences in safety devices and the size configuration of the receiving vessel, or there may be different transfer flow rates. The impact of these important operational parameters on the vapor dispersion of LNG release has not been thoroughly studied.
This study aims to provide a reference for safe LNG bunkering operations, analyze the consequences of hose release during LNG bunkering operations, and examine how operational parameters affect the dispersion and impact range of LNG vapor clouds in the event of an accidental release during LNG bunkering operations at Yantian Port in Shenzhen. This study selected the transfer flow rate, release height, and release direction as parameters in the simulation section to investigate the influence of these parameters on the LNG release range. The research focuses on the following three main sub-topics: (i) transfer flow rate, (ii) release height, and (iii) release direction. These factors are examined through PHAST simulation using real-world meteorological data. This study offers a novel contribution by focusing on dynamic operational variables such as transfer flow rate, release height, and direction under both daytime and nighttime conditions, which are not extensively covered in the literature. In addition, this study uses PHAST to simulate realistic STS scenarios using real-world meteorological data and generates quantitative safety thresholds. The findings complement existing studies and enhance the understanding of their application to risk-based operational decision-making.
3. Results and Discussion of PHAST Simulation
This section presents the comprehensive simulation results obtained through PHAST modeling, systematically examining LNG dispersion characteristics based on three critical operational parameters. The analysis focuses on both horizontal dispersion patterns (depicted through 25,000 ppm vapor cloud footprints) and vertical dispersion profiles for each scenario. The study reveals how the transfer flow rate, release height, and release direction distinctly influence vapor cloud behavior. The dual-perspective approach not only quantifies hazard zones but also provides three-dimensional insight into dispersion mechanics, enabling practical safety recommendations for bunkering operations.
3.1. Transfer Flow Rate
When the transfer flow rates are 500 m
3/h, 1000 m
3/h, 1500 m
3/h, and 2000 m
3/h, and the concentration reaches 25,000 ppm, the dispersion distance and width are as shown in
Figure 2. As shown in
Figure 2, with the increase in the transfer flow rate, the distance and width of vapor cloud dispersion significantly increase, but the variation pattern of the vapor cloud also varies under different weather conditions.
Table 4 shows the dispersion distance and footprint for different transfer flow rates.
At night, methane forms clouds in the upwind direction. With the increase in the transfer flow rate, the width of the vapor cloud in the upwind direction gradually decreases. The low wind speed (2 m/s) at night and stable atmospheric conditions (Class E stability) significantly inhibit turbulent mixing, which limits the dispersion ability of vapor clouds in the upwind direction. With the increase in the transfer flow rate, the initial momentum and volume of the vapor cloud increase, but its dispersion energy is more distributed in the downwind direction through lateral expansion, while the dispersion in the upwind direction is directly blocked by the incoming wind, resulting in the gradual reduction in the width of the vapor cloud in the upwind direction.
In the downwind direction, when the transfer flow rate is 500 m3/h, the dispersion width of the vapor cloud in the daytime and at night shows little difference. However, when the transfer flow rate increases to 1000 m3/h, the downstream dispersion distance of the vapor cloud in the daytime increases significantly, and the cloud footprint increases from 33,870 m2 to 128,903 m2, an increase of about 2.8 times. When the transfer flow rate is lower than 1500 m3/h, the dispersion distance of the vapor cloud in the daytime is smaller than that at night, but when the transfer flow rate is 2000 m3/h, the dispersion distance of the vapor cloud in the daytime is larger than that at night.
At night, when the transfer flow rate increases from 500 m3/h to 1000 m3/h, the maximum downwind distance also increases from 530.36 m to 1610.13 m, and the cloud footprint increases from 54,719 m2 to 458,254 m2, with an increase of about 7.4 times. However, when the transfer flow rate increases to 1500 m3/h and 2000 m3/h, the maximum downwind distance decreases to 1493.49 m and 1416.16 m; the cloud footprint is 654,081 m2 and 666,580 m2. With the flow rate increasing from 1500 to 2000 m3/h, the footprint increases by only about 0.02 times. This is because when the transfer flow rate is large, the initial momentum of the steam is high, but because the downwind dispersion at night is limited, the dispersion energy of the steam spreads more in the horizontal direction, rather than continuing downwind.
In the daytime, when the transfer flow rate increases, the dispersion distance and range of the vapor cloud increase significantly. At night, with the increase in the transfer flow rate, the dispersion range of the initial vapor cloud also increases significantly. When the transfer flow rate increases to a certain value, the distance of vapor cloud dispersion along the wind does not increase, or even decrease, but the width of the vapor cloud increases.
When the transfer flow rates are 500 m
3/h, 1000 m
3/h, 1500 m
3/h, and 2000 m
3/h, and the concentration reaches 25,000 ppm, the dispersion distance and heights are as shown in
Figure 3. It can be seen from
Figure 3 that with an increase in the transfer flow rate, the maximum downwind cloud height first increases, then decreases, and then increases again, and the change amplitude is small when the rate is large.
Table 5 shows the heights of vapor cloud with different transfer flow rates.
When the transfer flow rate is 500 m3/h, the vapor cloud at night rises to a higher level for the second time, and the maximum height of the second rise is 8.35 m. With the increase in the transfer flow rate, the dispersion height of the vapor cloud does not change significantly.
3.2. Release Height
When the release height is 5 m, 10 m, 15 m, and 20 m, respectively, the dispersion distance and width of the vapor cloud with a concentration of 25,000 ppm are as shown in
Figure 4. It can be seen from
Figure 4 that, with an increase in release height, the dispersion distance of the vapor cloud in the downwind direction increases, and the dispersion distance in the upwind direction decreases; that is, the higher the release height, the more vulnerable the cloud movement direction is to the wind direction.
Table 6 shows the dispersion distance and footprint for different release heights.
The change in release height significantly affects the initial dispersion characteristics of gas clouds. At night, the lower release height makes it easier for the gas to approach the water surface at the initial stage of release and is affected by the surface roughness and boundary layer turbulence. In this case, the vapor cloud disperses wider in the upwind direction because the turbulence near the water surface is more complex, resulting in the enhancement of the horizontal dispersion ability of the gas [
53]. However, with an increase in release height, the distance between the gas release point and the water surface increases, and the vertical dispersion at the initial stage is more significant. A lower release height allows the vapor cloud to come into contact with the water surface faster. At a higher release height, the vapor cloud has more space to mix with the air, and after the temperature rises, it spreads further downwind, so the dispersion distance in the downwind direction gradually increases.
At the same release height, the downwind dispersion distance of release at night is greater than that of release during daytime. At night, when the release height is 5 m, the maximum downwind distance is 577.88 m, and the cloud footprint is 90,023 m
2. When the height is 10 m, 15 m, and 20 m, respectively, the maximum downwind distance is 765.14 m, 1058.34 m and 1423.96 m, and the cloud footprint is 136,824 m
2, 249,146 m
2 and 468,881 m
2. The cloud footprint at night shows a significant increase trend. However, with the increase in release height during the day, the maximum downwind distance of the vapor cloud increases slowly, and the width does not increase significantly. That is, the vapor cloud generated by the release at night spreads wider and farther in the downwind direction. The dispersion degree of the release vapor cloud at night is more vulnerable to the increase in release height because during the daytime, the higher release height provides a longer time for the gas to be driven by the wind speed, and the horizontal transmission capacity is stronger. This enhancement of horizontal dispersion is closely related to the weakening of the dilution effect of the gas cloud in the vertical direction. Due to the strong vertical turbulence, the vapor cloud with a higher height release forms a thinner concentration distribution, limiting the range of horizontal dispersion [
54].
The release height also directly affects the width change of the vapor cloud. At the lower release height, the concentration of the gas cloud near the ground increases significantly, leading to a more significant dispersion of the cloud width in the upwind direction. On the contrary, at a higher release height, the dilution rate of gas in the higher air layer is accelerated, and the dispersion width in the upwind direction is smaller [
55]. This can explain why at a height of 20 m, although the dispersion distance in the downwind direction is the largest, the cloud width in the upwind direction is still significantly reduced.
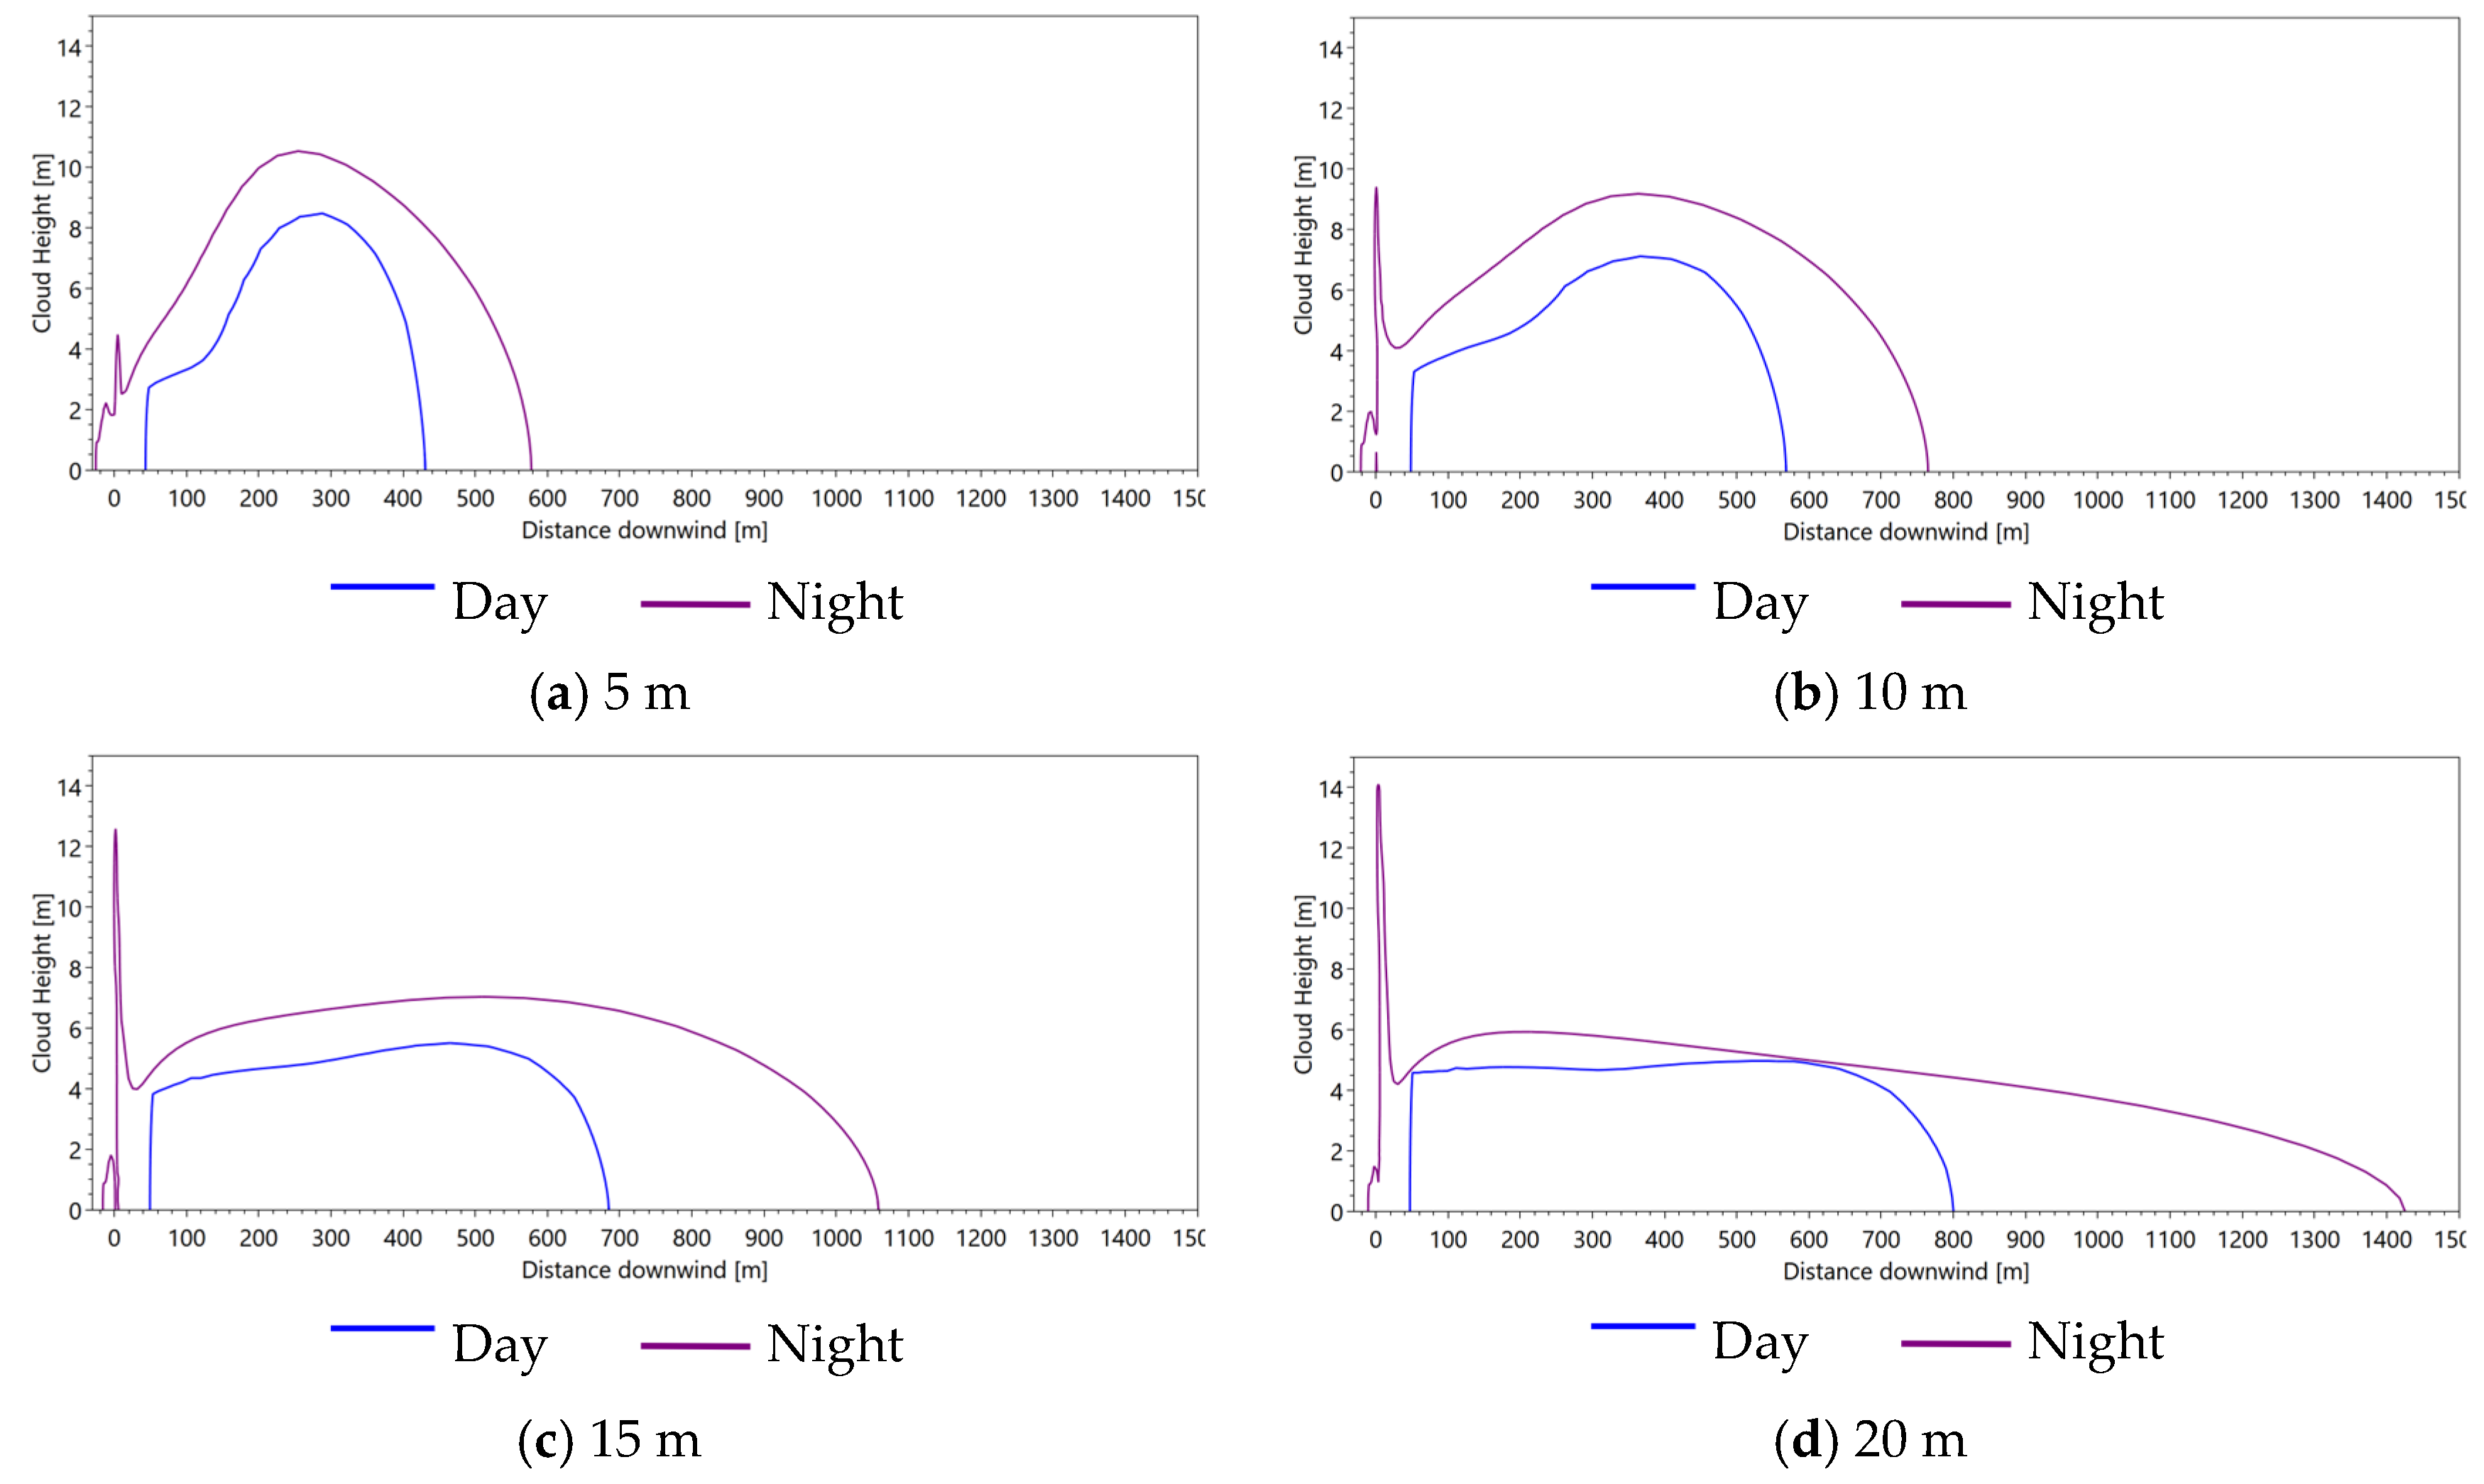
When the release heights are 5 m, 10 m, 15 m, and 20 m, and the concentration reaches 25,000 ppm, the dispersion distance and heights are as shown in
Figure 5.
It can be seen from
Figure 5 that with an increase in release height, the height of the vapor cloud near the release point increases. This is because the higher the release point is, the less chance the vapor cloud has to contact the water surface at the initial stage, and it is more likely to be affected by turbulence and wind speed, leading to upward dispersion.
Table 7 shows the heights of vapor clouds with different release heights.
The dispersion height of the vapor cloud with release at night is higher than that in the daytime. The lower temperature at night and the lack of solar radiation cause the vapor cloud to form a more obvious temperature gradient in the vertical direction. The daytime vapor cloud starts to appear from about 50 m, mainly because the meteorological conditions in the daytime (high wind speed, unstable gas layer, strong solar radiation) promote rapid horizontal dispersion and turbulent mixing of vapor. These conditions make the vapor rapidly to dilute and disperse near the release point, preventing the formation of an obvious vapor cloud, but an obvious vapor cloud begins to form about 50 m downwind.
When the release height is 5 m, the maximum cloud height occurs during the second cloud rise, both during the day and at night. This is because at the initial stage of low altitude release, the vapor cloud is mainly affected by gravity and diffuses downward, and after forming a stable gas cloud layer within a certain range, it rises again after being far away from the release point due to horizontal transportation and turbulence. There is a certain difference in cloud height between day and night. The maximum cloud height during the day is 8.48 m, and the maximum cloud height at night is 10.54 m. This indicates that low wind speeds and an unstable atmosphere at night are more conducive to the vertical uplift of vapor clouds, and the turbulent effect is more significant at higher wind speeds during the day, resulting in a more uniform distribution of cloud height [
56].
When the release height is 10 m, 15 m, and 20 m, the vapor cloud with release at night reaches the maximum height near the release point and the maximum height at the far release point in the daytime. This shows that at a higher release height, the vapor cloud is more vulnerable to wind speed. As the release height increases, the cloud height near the release point increases. This is because an increase in release height directly increases the potential height of the initial release of the gas cloud and enhances the ability of vertical dispersion. In addition, the higher the release height, the more the gas disperses in the higher air layers at the initial stage, reducing the degree of interaction with the water surface is reduced and resulting in a higher maximum cloud height [
57,
58]. With an increase in the release height, the height of the cloud secondary rise decreases, and the decrease is more significant at night. This is because clouds are already close to the stable or inversion layer in the atmosphere when released and are more likely to accumulate below the stable or inversion layer after the first lift, with limited space for the second lift.
The release height is a critical factor governing LNG dispersion behavior, where higher elevations promote downwind transport and vertical uplift, while lower heights enhance upwind spreading and ground-level accumulation. Nighttime conditions further amplify these effects due to reduced atmospheric mixing.
3.3. Release Direction
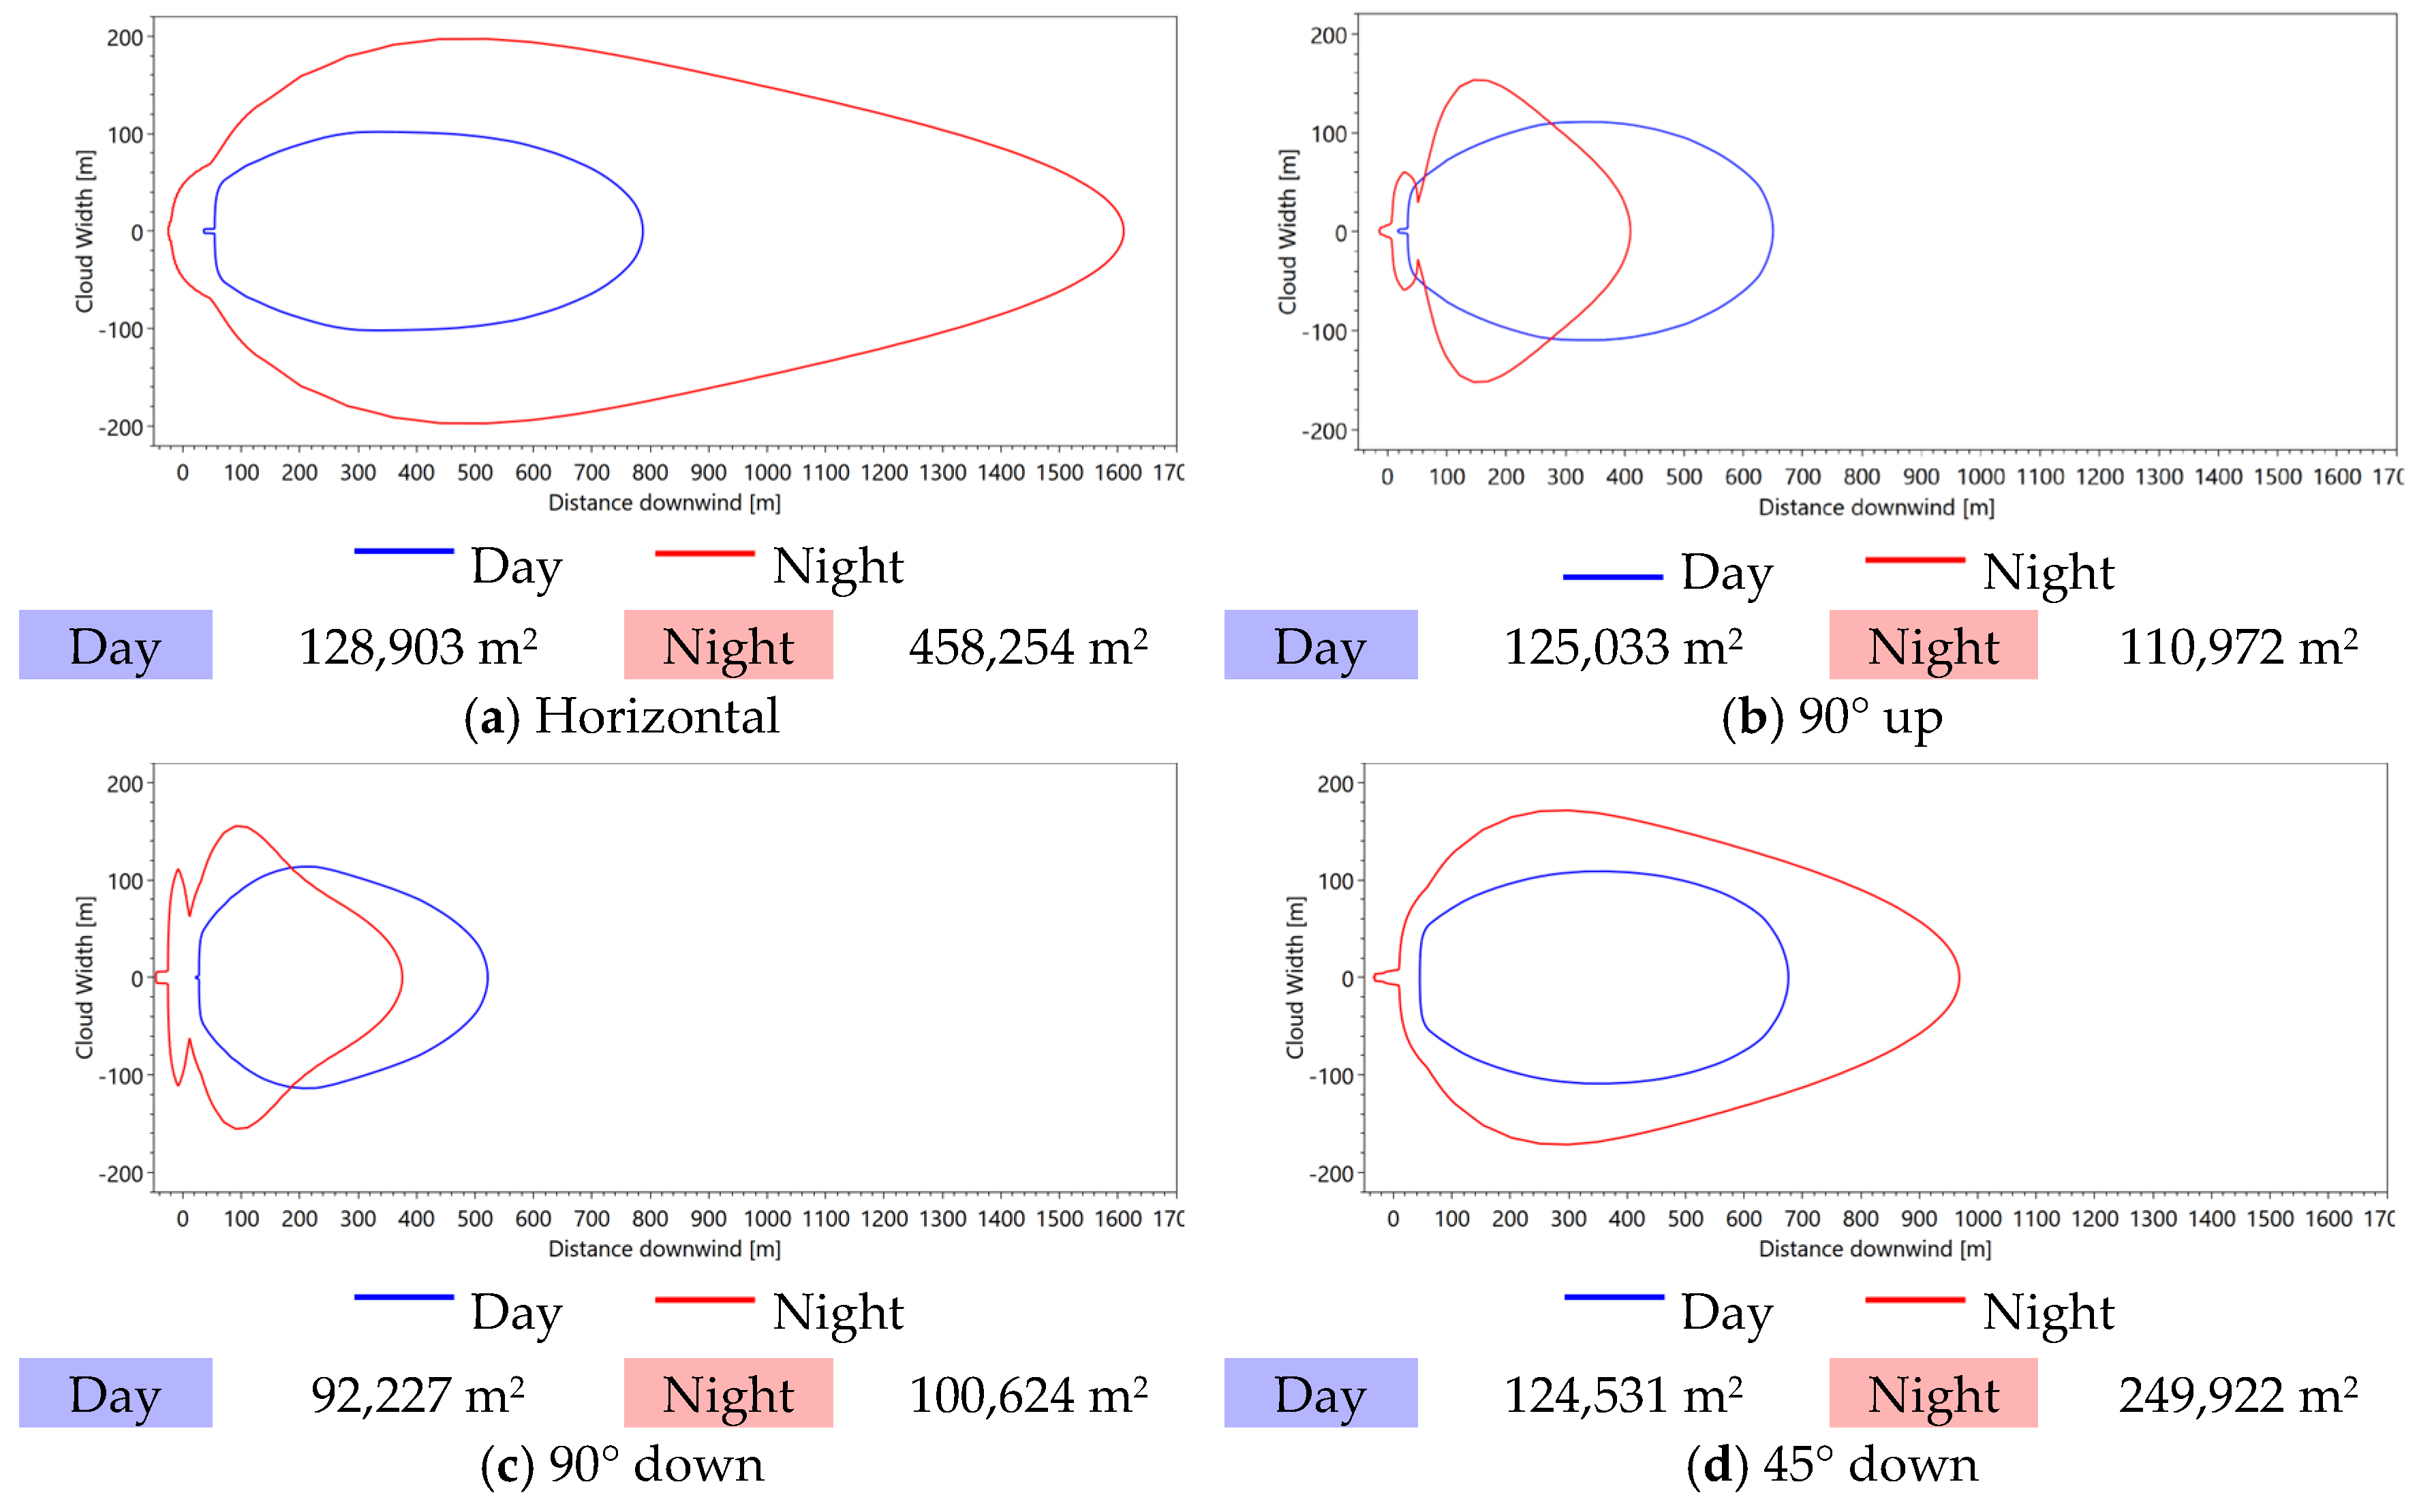
When the release direction is horizontal, 90° up, 90° down, and 45° down, respectively, the dispersion distance and width of the vapor cloud with a concentration of 25,000 ppm are as shown in
Figure 6. It can be seen from
Figure 6 that the release direction significantly affects the dispersion characteristics of the vapor cloud. When the release direction is vertical, the dispersion distance of the vapor cloud is short and the cloud footprint at night is small. The dispersion distance of the release vapor cloud in the horizontal direction is longer than that of the release vapor cloud in the 45° down direction, but the cloud width in the daytime is smaller. This phenomenon is closely related to the influence of the release direction on the initial momentum distribution of the gas cloud.
Table 8 shows the dispersion distance and footprint for different release directions.
When the release direction is 90° up, the initial momentum of the gas is concentrated in the vertical direction, prompting the methane to be rapidly pushed to a higher air layer and mixed with the ambient air. In the daytime, methane is rapidly pushed to the atmosphere at a high altitude to form clouds in contact with air and water vapor. It then disperses along the downwind direction under the effect of wind, with the maximum downwind distance reaching 656.33 m. Under stable atmospheric conditions at night, turbulence in the vertical direction is weaker. The cloud formed above the release point of methane diffuses dispersion, and the distance along the downwind is 413.16 m, which is 37% shorter than the dispersion distance in the daytime.
When the release direction is 90° down, the cloud dispersion in the initial stage is closer to the ground. As the gas cloud is close to the water surface, the cloud dispersion distance along the wind is smaller than in other directions due to the influence of gravity and water surface roughness. The maximum downwind distance during the day is 521.72 m, and the maximum downwind distance at night is 375.79 m. However, when 90° down release occurs, the dispersion distance of the cloud in the upwind direction is larger than that in other directions.
When the release direction is horizontal, the initial momentum of the gas is consistent with the wind speed direction, which significantly increases the horizontal dispersion distance of the vapor cloud. Compared with the 45° down release vapor cloud, the downwind dispersion distance of the horizontal release vapor cloud is longer. The cloud footprint at night increased from 249,922 m2 to 458,254 m2, nearly doubling in size. The cloud footprint in the daytime is similar, but the cloud width in the daytime is small. Because in the horizontal release, the initial phase of the gas cloud is mainly driven by wind speed, its dispersion shape is narrower and more concentrated, and the proportion of dispersion in the vertical direction is lower.
When the release direction is 45° down, the dispersion behavior of the vapor cloud is between horizontal and 90° down release. Since the vapor cloud has part of the vertical momentum, its dispersion distance is slightly shorter than the dispersion distance of the horizontal release cloud, but the cloud width is slightly larger. This indicates that the angle of the release direction directly affects the initial dispersion path of the gas cloud and further affects its dispersion range and shape.
When the release direction is horizontal, 90° up, 90° down, and 45° down, the dispersion distance and height of the vapor cloud with a concentration of 25,000 ppm are as shown in
Figure 7. It can be seen from
Figure 7 that the release direction has no significant effect on the dispersion height of the cloud.
Table 9 shows the heights of vapor clouds with different release directions.
At night, the vapor cloud reaches its maximum height near the release point. The maximum height of the release vapor cloud in the horizontal direction is 15.3 m. The maximum height of the release vapor cloud in the 90° up direction is 14.16 m. The maximum height of the release vapor cloud in the 90° down direction is 13.34 m. The maximum height of the release vapor cloud in the 45° down direction is 13.51 m. That is, the release of the transfer hose in different directions has little impact on the dispersion height of the vapor cloud under different meteorological conditions. However, the change in horizontal dispersion distance is consistent with the previous discussion. When the initial momentum of gas is consistent with the direction of wind speed, the horizontal dispersion distance of the vapor cloud increases significantly. It should also be noted that wind direction, wind speed, and atmospheric temperature are meteorological parameters that can significantly influence vapor cloud behavior. Wind direction determines the primary axis of cloud propagation. Higher wind speeds (e.g., daytime conditions) enhance horizontal transport but reduce cloud persistence due to increased turbulent mixing. Conversely, lower nighttime wind speeds allow for more concentrated and prolonged vapor accumulation. Atmospheric temperature gradients between cryogenic LNG (−162 °C) and ambient air further modulate dispersion through buoyancy effects, with warmer daytime temperatures promoting vertical uplift. These interactions highlight the importance of integrating real-time meteorological data into operational risk assessments.
4. Conclusions
This study simulates a series of scenarios of release during LNG filling operation and studies the influence of different key operational parameters on dispersion of an LNG vapor cloud. Simulating both daytime and nighttime conditions allows for the identification of various dispersion scenarios, with nighttime typically representing the higher-risk condition due to more stable atmospheric layers and limited vertical mixing. Using the unique weather and meteorological parameters in Shenzhen, Guangdong, China, the vapor cloud footprints of LNG release in the daytime and at night are compared.
The key findings are as follows:
Transfer flow rate:
Lower transfer flow rates reduce LNG leakage and rainout, improving safety.
Flow rates that are too low, however, increase bunkering time and reduce efficiency.
At night, increasing the flow rate beyond 1500 m3/h results in little change in the cloud footprint.
During the night, a flow rate of approximately 1500 m3/h should only be used when necessary, and strict monitoring is required.
Preferably, adopt a flow rate of 1000–1500 m3/h during the day to optimize risk control.
If conditions allow, using multiple low-flow hoses (e.g., three at 500 m3/h) is safer than using a single high-flow hose.
Release height:
Increasing the release height from 5 to 20 m significantly enlarges the cloud footprint, particularly by 1.5 times during the day and 5.2 times at night.
The inlet and outlet manifolds should be kept as close to 10 m as possible.
At a 20 m release height, the nighttime footprint is 3.5 times larger than the daytime footprint.
If the manifold height cannot be adjusted, bunkering should be done during the daytime, when upwind vapor dispersion is less likely.
Where feasible, ships should take in ballast water during bunkering to lower the intake manifold height.
LNG bunkering vessels should be equipped with low-level outlet manifolds to limit vapor dispersion.
Release direction:
Guiding LNG release vertically (90° downward) can reduce vapor cloud dispersion. If feasible, vertical release should be used, especially at night. This is to limit the dispersion area of the vapor cloud.
If the release direction cannot be controlled, filling should be done during the daytime.
When bunkering, the direction of release should not be the same as the wind direction.
The bunkering direction should align with the wind to avoid lateral dispersion. Alternatively, airflow can be managed using ventilation or protective systems.
When adding facilities, avoid forming confined spaces, as serious vapor cloud explosion may occur when LNG releases.
At night, use ventilation to guide the release downward; a 45° downward release reduces the footprint by 45% compared to a horizontal release.
This study reveals the influence mechanism of three operational parameters on LNG dispersion on seawater surface and quantifies the effect of limiting dispersion that can be achieved by parameter optimization. By identifying how each parameter influences the size and shape of the vapor cloud under varying conditions, this study provides a quantitative basis for assessing dispersion-related risk and prioritizing higher-risk scenarios for additional controls. The results show that the reasonable control of flow rate, height, and direction can effectively regulate the distance and range of LNG dispersion. These insights provide an important basis for safety design and operational procedure formulation of LNG fuel filling operations and offer practical guidance to enhance safety and environmental performance.
Additionally, the recommended safety measures have economic and operational implications. For instance, limiting the flow rate can increase bunkering time, which potentially means reduced daily throughput and higher operating costs and delays. However, this can be mitigated by using multiple low-flow hoses to maintain overall throughput. Adjusting bunkering direction or installing ventilation systems may involve additional upfront setup costs and time; however, these measures can prevent costly incidents, thereby reducing insurance risks and enhancing compliance. Therefore, these measures are practical and feasible from an operator’s perspective and can contribute to better risk management and help ensure operational continuity.
For future study directions, it is recommended to explore the following aspects: Firstly, conduct on-site tests on the actual release of LNG to verify the simulation results and enhance the credibility of the study conclusions. Secondly, expand the simulation scenarios and study the release patterns of LNG under different environmental conditions and storage states. Once again, breaking through the assumption of static LNG pools in the existing study, delve into the dispersion characteristics of underwater LNG and its movement mechanism with water flow. In addition, as this study focuses on vapor cloud dispersion resulting from LNG hose releases during STS bunkering operations, heat radiation effects were not considered. Future work should extend the simulation to include thermal radiation impacts for a more comprehensive risk assessment. Nighttime dispersion is likely further influenced by atmospheric stability and reduced thermal turbulence, which may suppress vertical mixing and prolong gas cloud persistence. Future work should incorporate detailed meteorological modeling (e.g., wind shear effects) to quantify these interactions. Beyond the proposed operational control measures, future work should also explore engineering solutions that aim to prevent or contain LNG leaks at the source, e.g., concentric double-tube transfer hoses, which can serve to contain leakages from inner hose. Advanced materials should be explored to minimize failure risks. Together with operational strategies, a more robust and comprehensive approach to LNG bunkering safety can be ensured. Finally, the influence of obstacles such as ship superstructure on LNG near-field dispersion can be systematically studied by using computational fluid dynamics.


