Article

Comparative Study of Local Stress Approaches for Fatigue Strength Assessment of Longitudinal Web Connections

1
Department of Naval Architecture and Ocean Engineering, Pusan National University, Busan 46241, Republic of Korea
2
CAE Research Department, Korea Shipbuilding & Offshore Engineering, Seongnam 13553, Republic of Korea
*
Author to whom correspondence should be addressed.
J. Mar. Sci. Eng. 2025, 13(8), 1491; https://doi.org/10.3390/jmse13081491
Submission received: 12 July 2025 / Revised: 29 July 2025 / Accepted: 31 July 2025 / Published: 1 August 2025
(This article belongs to the Section Ocean Engineering)

Abstract

Ship structures are subjected to cyclic loading from waves and currents during operation, which can lead to fatigue failure, particularly at locations with structural discontinuities such as welds. Although various fatigue assessment methods have been developed, there is a lack of experimental data and comparative studies for actual ship structure details. This study addresses this limitation by evaluating the fatigue strength of longi-web connections in hull structures using local stress approaches, including hot spot stress, effective notch stress, notch stress intensity factor, and structural stress methods. Finite element analyses were conducted, and the predicted fatigue lives and failure locations were compared with experimental results. Although there are some differences between each method, all methods are valid and reasonable for predicting the primary failure locations and evaluating fatigue life. These findings provide a basis for considering suitable fatigue assessment methods for welded ship structures with respect to joint geometry and failure mechanisms.

1. Introduction

In terms of economy and efficiency, welding is used as the main bonding method for ship structures. When fatigue load is applied, the welded structure has a possibility of fatigue failure, which is an important cause of structural failure. Recent studies have focused on the fatigue strength of welded joints used in ship structures, especially in critical areas such as longitudinal stiffeners. The structural discontinuity caused by cut-outs in the connection between longitudinal stiffeners and web frames has been identified as a critical fatigue hot spot in container vessels. Campillo et al. investigated the fatigue behavior of various cut-out designs under cyclic loading using finite element models. They highlight the influence of radius of curvature, stiffener spacing, and flange arrangement on fatigue damage and stress concentration. These findings can be applied to optimize structural details for improved fatigue performance in stress concentrated regions [1]. Ahola et al. examined as-welded, post-weld treated, and repaired conditions using both small-scale and large-scale specimens, revealing that HFMI and repair welding can significantly enhance fatigue performance compared to untreated joints. Numerical finite element analysis was used to validate experimental findings and assess stress concentration effects. They emphasize the role of weld geometry in fatigue life improvement [2]. Parunov et al. conducted finite element analyses to evaluate stress concentration factors at side shell longitudinal and web frame connections [3]. They compared calculated SCFs with those prescribed by classification societies, highlighting significant deviations that could affect fatigue assessment. Their work illustrates the importance of detail modeling and correction procedures for accurate fatigue assessment of ship structures. Fajri et al. proposed a fatigue assessment procedure based on finite element analysis to evaluate the fatigue behavior of various ship structural details under different loading conditions. Their study involves benchmarking study and mesh sensitivity effect, highlighting the importance of geometry, material selection, and mean stress correction in fatigue life prediction [4].
One of the factors that deteriorates the fatigue life of the welded part is the structural discontinuity caused by welds. Therefore, various fatigue strength evaluation methods have been studied to analyze the fatigue strength of the weld toe, including local stress approaches such as hot spot stress. Fricke investigated the fatigue strength of laser-welded thin-plate ship structures using both nominal stress and hot spot stress approaches [5]. This study demonstrates that the nominal stress approach tends to underestimate fatigue damage due to its limited consideration of geometric effects, whereas the hot spot stress method resulted in improved accuracy. Braun et al. employed local stress approaches such as structural stress and effective notch stress approaches to interpret experimental results where conventional nominal stress method is insufficient [6]. Kodvanj et al. examined the fatigue behavior of small-scale steel specimens degraded by realistic corrosion [7]. Using photogrammetry and high-resolution 3D finite element analysis, they quantified the relationship between corrosion induced surface irregularities and SCFs. Their findings showed that FE based SCFs correlated well with experimental results, although variability remained due to irregular pit geometries, reinforcing the need for local stress-based methods in corroded conditions.
The fatigue critical location in welded joint may differ depending on the degree of penetration. In the case of full penetration condition, fatigue failure generally occurs at the weld toe. However, for partial penetration conditions, fatigue cracks initiate at the weld root [8]. Therefore, the fatigue life analysis of the weld root as well as the weld toe is also essential in evaluating the structural safety. Fricke reviewed fatigue and fracture behavior in welded ship structures [9]. He emphasizes the significance of weld root failure in partial penetration joints. This study explains the role of local features such as incomplete fusion, root geometry, and weld defects in crack initiation and propagation. Dong et al. further expanded on this by reviewing recent developments in fatigue assessment of welded joints in ship and offshore structures, focusing on roots failures and associated modeling techniques [10]. They emphasize the need for improved root assessment method by incorporating parameters such as weld penetration depth, residual stress, and stress concentration.
Despite the extensive studies on fatigue assessment of welded joints in ship structures, most previous studies have focused on simplified geometries. There is a lack of experimental fatigue data for actual ship details such as the longitudinal stiffener-to-web frame connections. Moreover, few studies have quantitatively compared these local stress approaches based on experimental results. This study addresses these limitations by conducting a comparative analysis of several local stress approaches applied to longi-web connections.
In this study, the fatigue life of longi-web connections of the hull is predicted based on the local stress approach such as hot spot stress, effective notch stress, notch stress intensity factor and structural stress. And based on the existing experimental data, each fatigue life evaluation method was compared. The advantages and the shortcomings of each method are evaluated and discussed.

2. Local Stress Approach

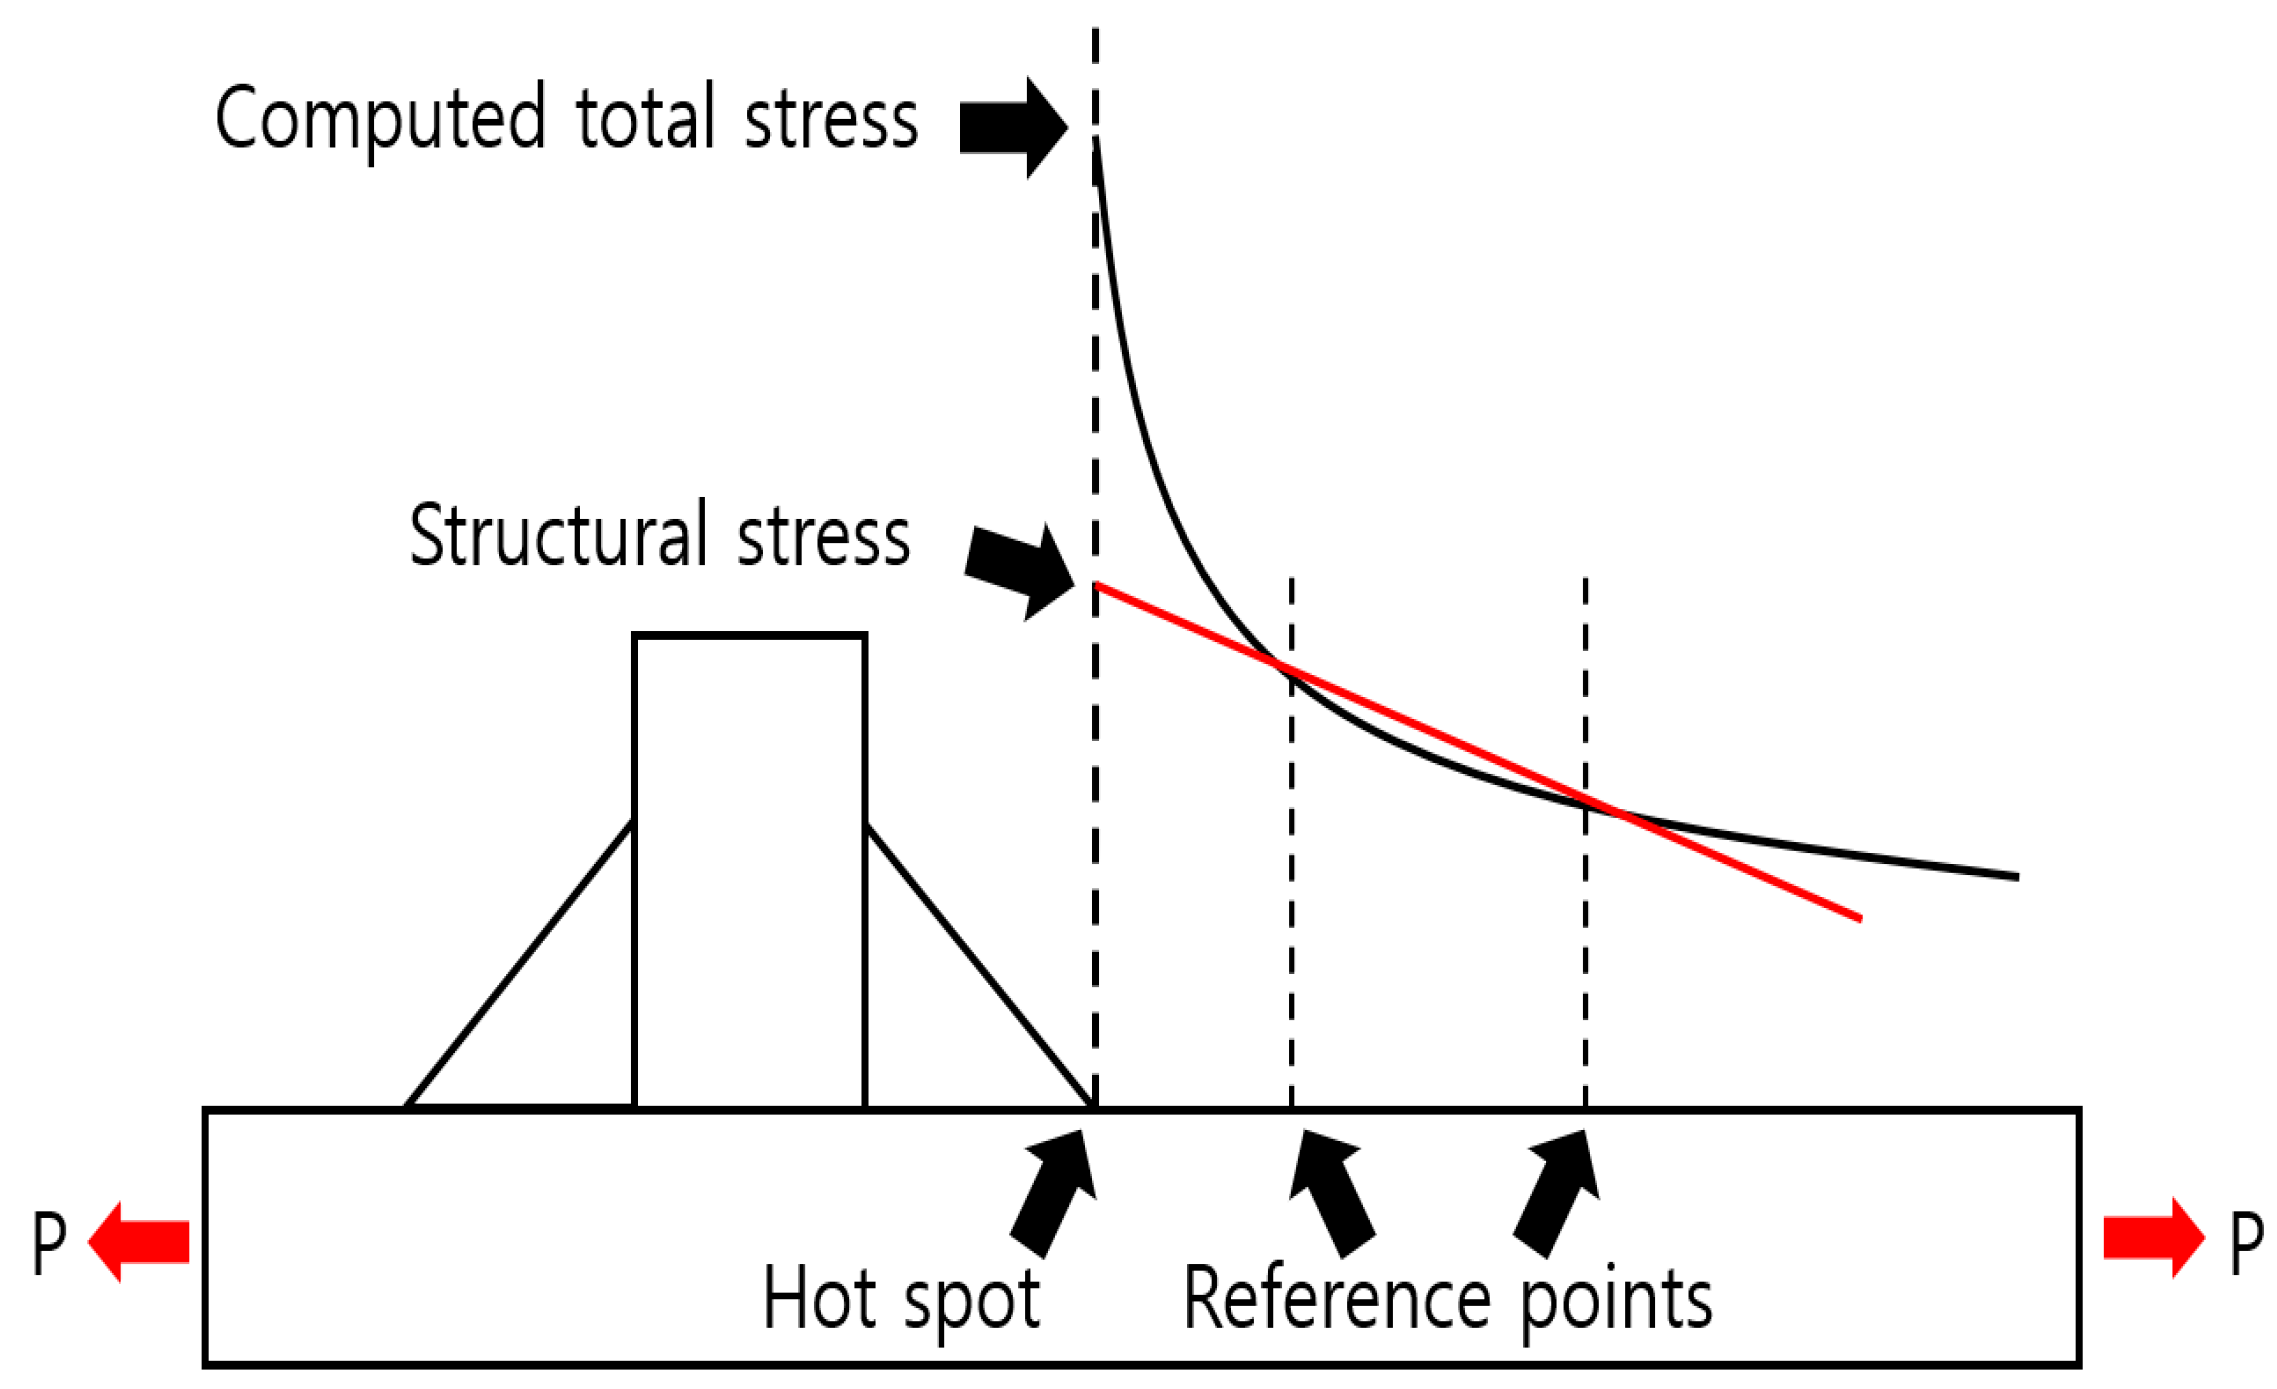
2.1. Hot Spot Stress Approach

The International Institute of Welding (IIW) provides guidelines for hot spot stress approach [11]. This method has been widely adopted by major classification societies for evaluating welded joints, particularly to assess local stresses at weld toes. This method estimates stresses at the structural discontinuity by extrapolating surface stress values measured at certain distances from the weld toe. There are a few different stress extrapolation techniques used as commonly recommended procedure for calculating hot spot stresses in welded structures. Figure 1 illustrates the schematic diagram of hot spot stress. Hot spot stress is categorized into two types—Type (a) and Type (b), as shown in Figure 2 [12]. Type (a) hot spot refers to weld toes on the surface of a plate, while Type (b) hot spots refer to those located at the plate edge. Hot spot stresses are calculated using either Equations (1) or (2) [11].
σ h s = 1.67 · σ 0.4 t 0.67 · σ 1.0 t
σ h s = 3 · σ 4 mm 3 · σ 8 mm + σ 12 mm
The fatigue life is assessed based on the hot spot stress calculated using Equations (1) and (2), in conjunction with the FAT class defined by the IIW Recommendations according to the structural geometry. In Equations (1) and (2), t represents the plate thickness.

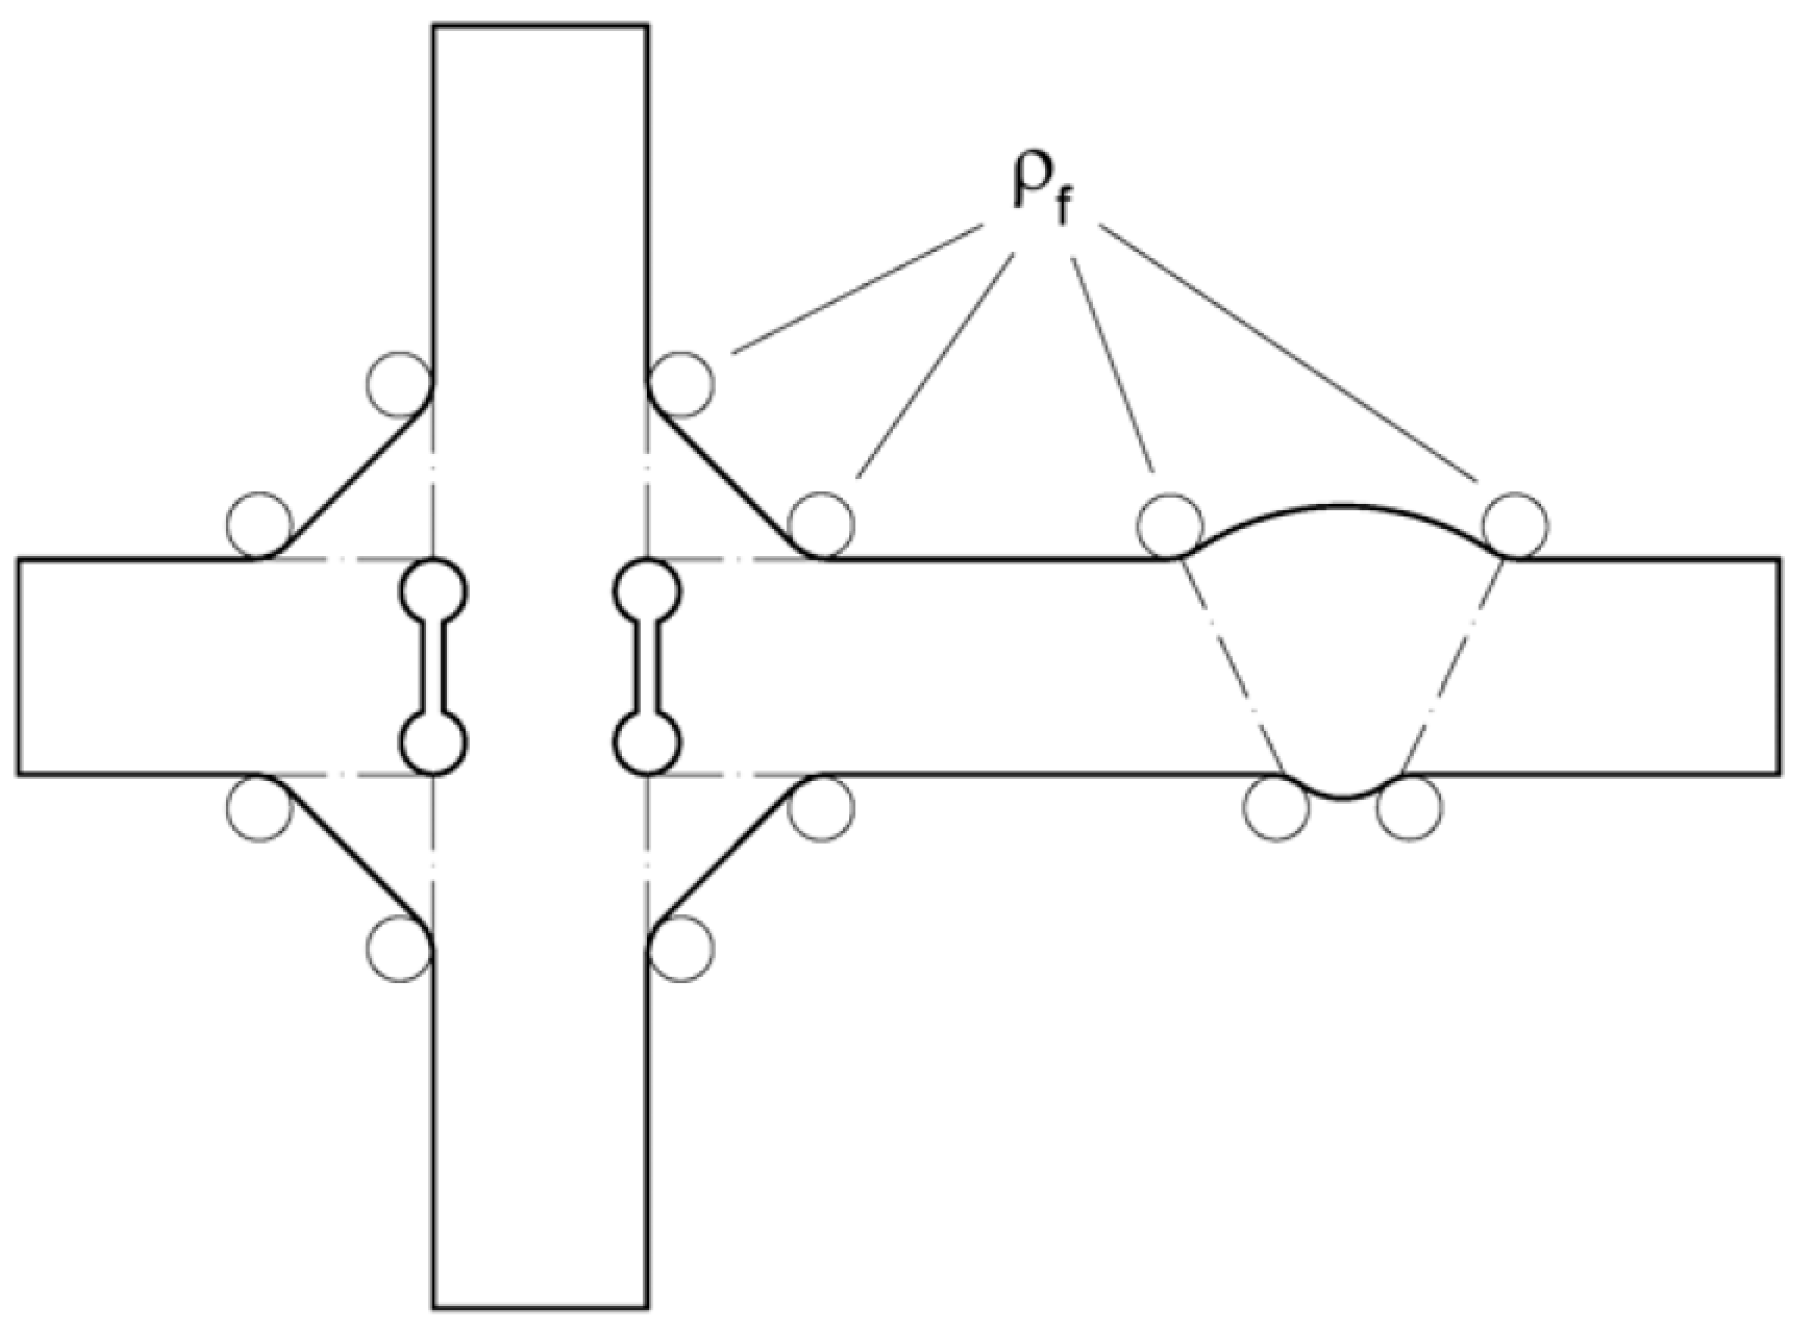
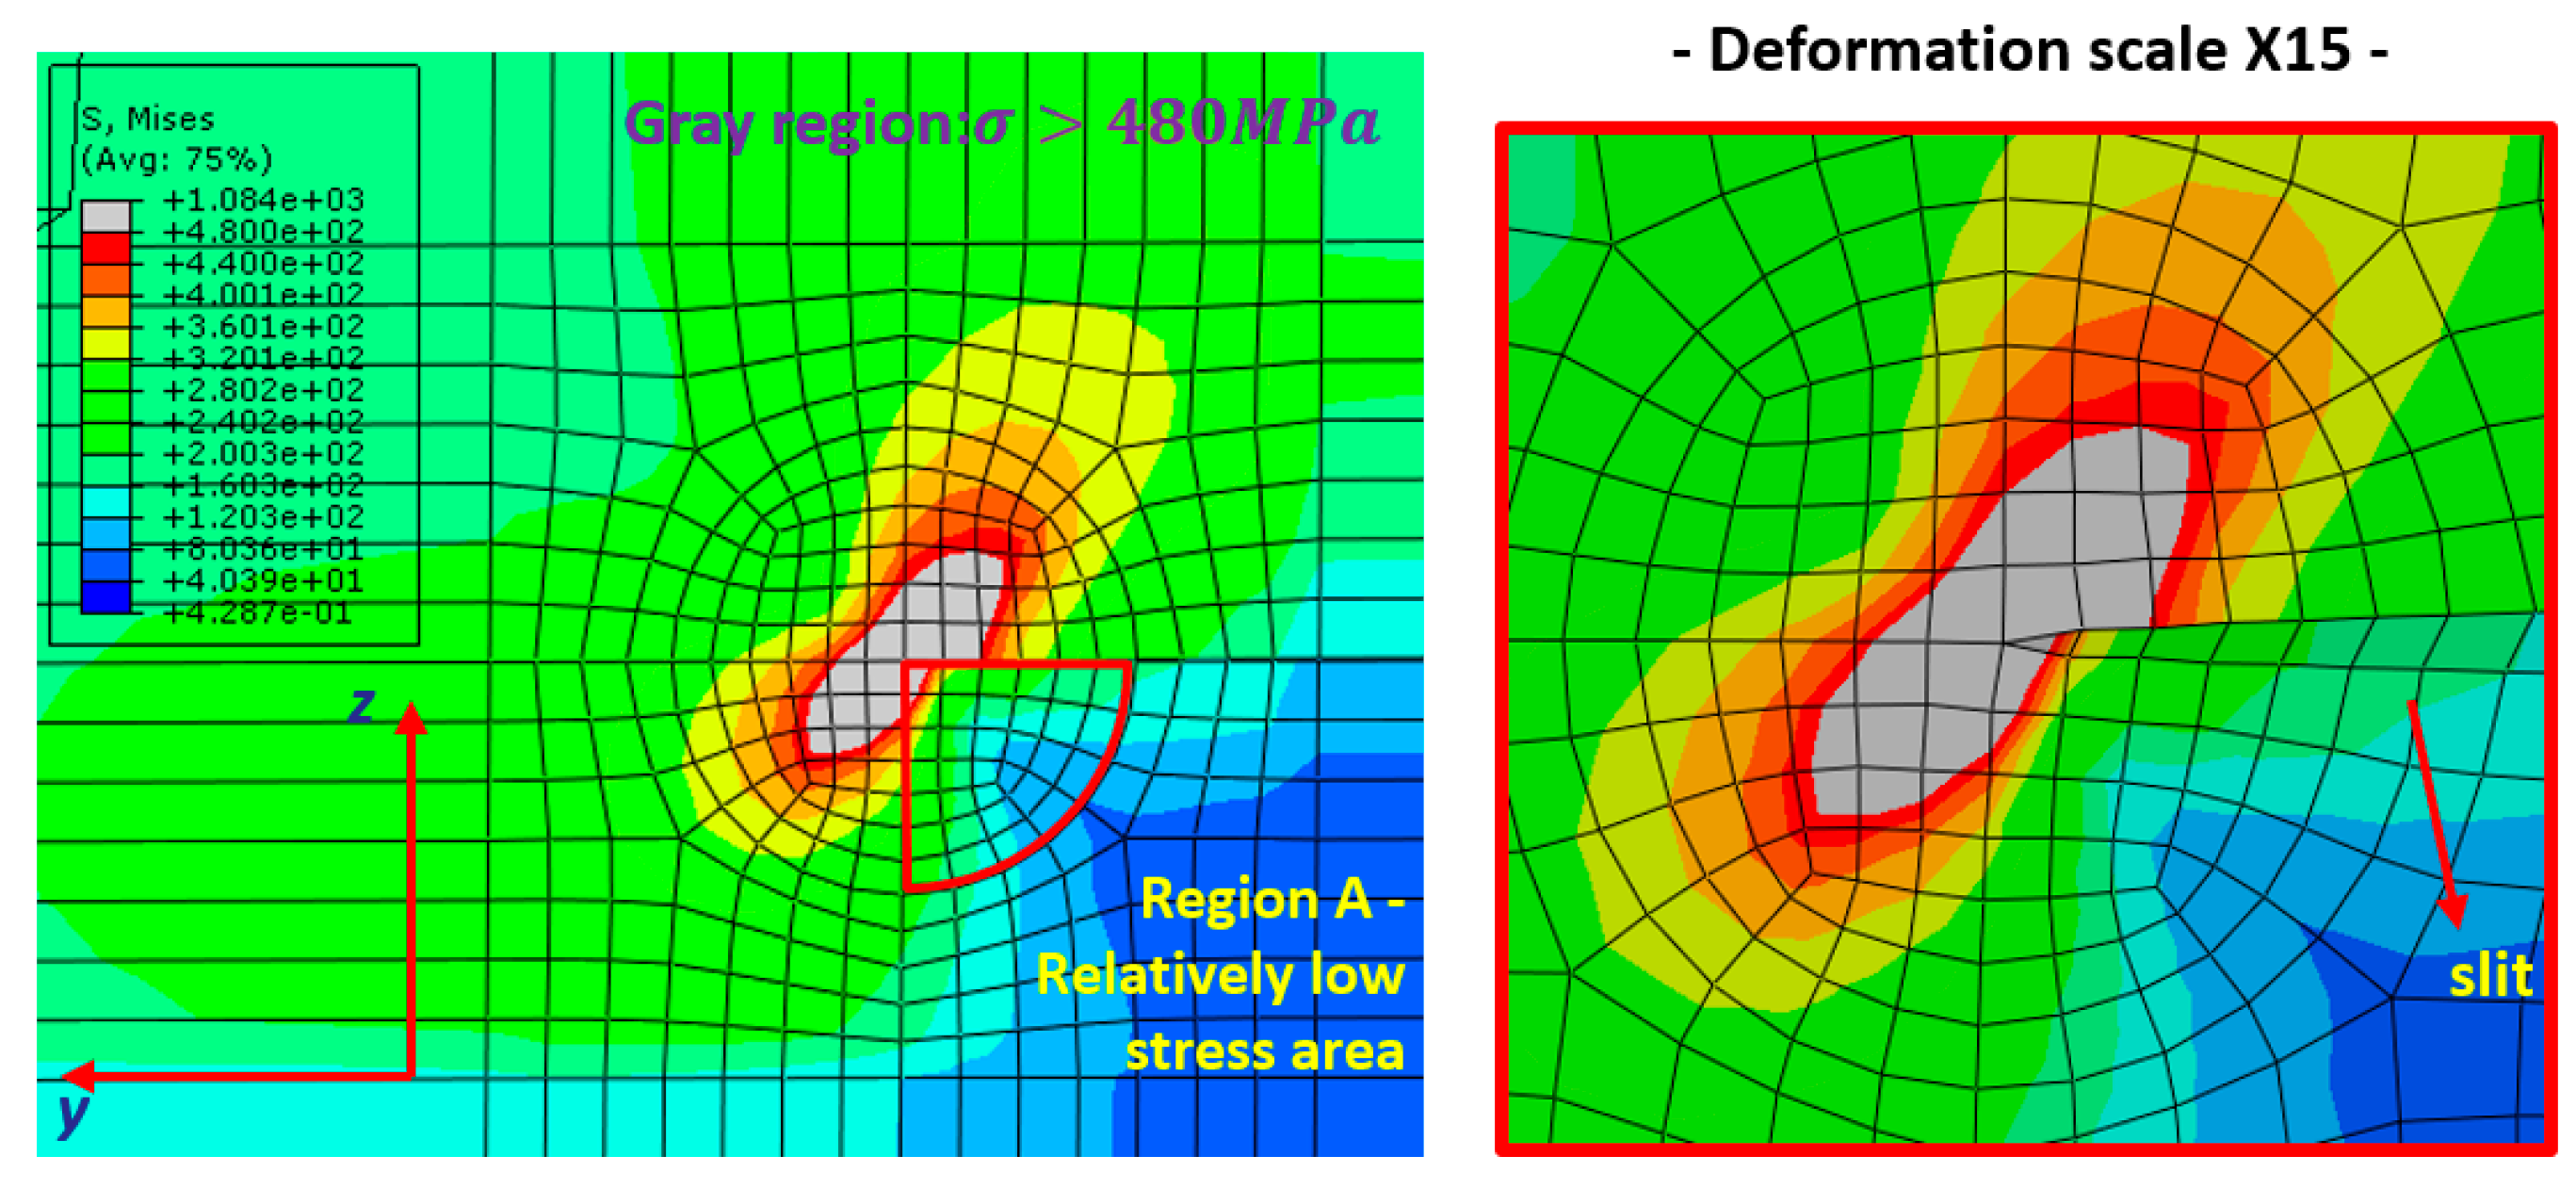
2.2. Effective Notch Stress Approach

The effective notch stress approach evaluates fatigue life based on stresses obtained from finite element analysis by introducing a fictitious notch a potential fatigue failure location. A schematic illustration of the effective notch stress approach is shown in Figure 3. For the fictitious notch, the following Equation (3) is proposed [12].
ρ f = ρ + s · ρ *
In Equation (3), ρ denotes the actual notch radius, s is a factor for stress multiaxiality and strength criterion, and ρ * represents a substitute micro-structural length. According to the IIW Recommendations, s is set to 2.5 and ρ * to 0.4 mm, while ρ is assumed to be 0 mm to obtain conservative results, resulting in a final fictitious notch radius of 1 mm [12].
Finite element analysis is conducted by introducing 1 mm-radius notches at the weld root and toe, and the maximum principal stress obtained is compared against the FAT 225 curve. For thin plates with a thickness of 5 mm or less, the fictitious notch radius is reduced to 0.05 mm, and the fatigue life is evaluated using the FAT 630 curve [12].

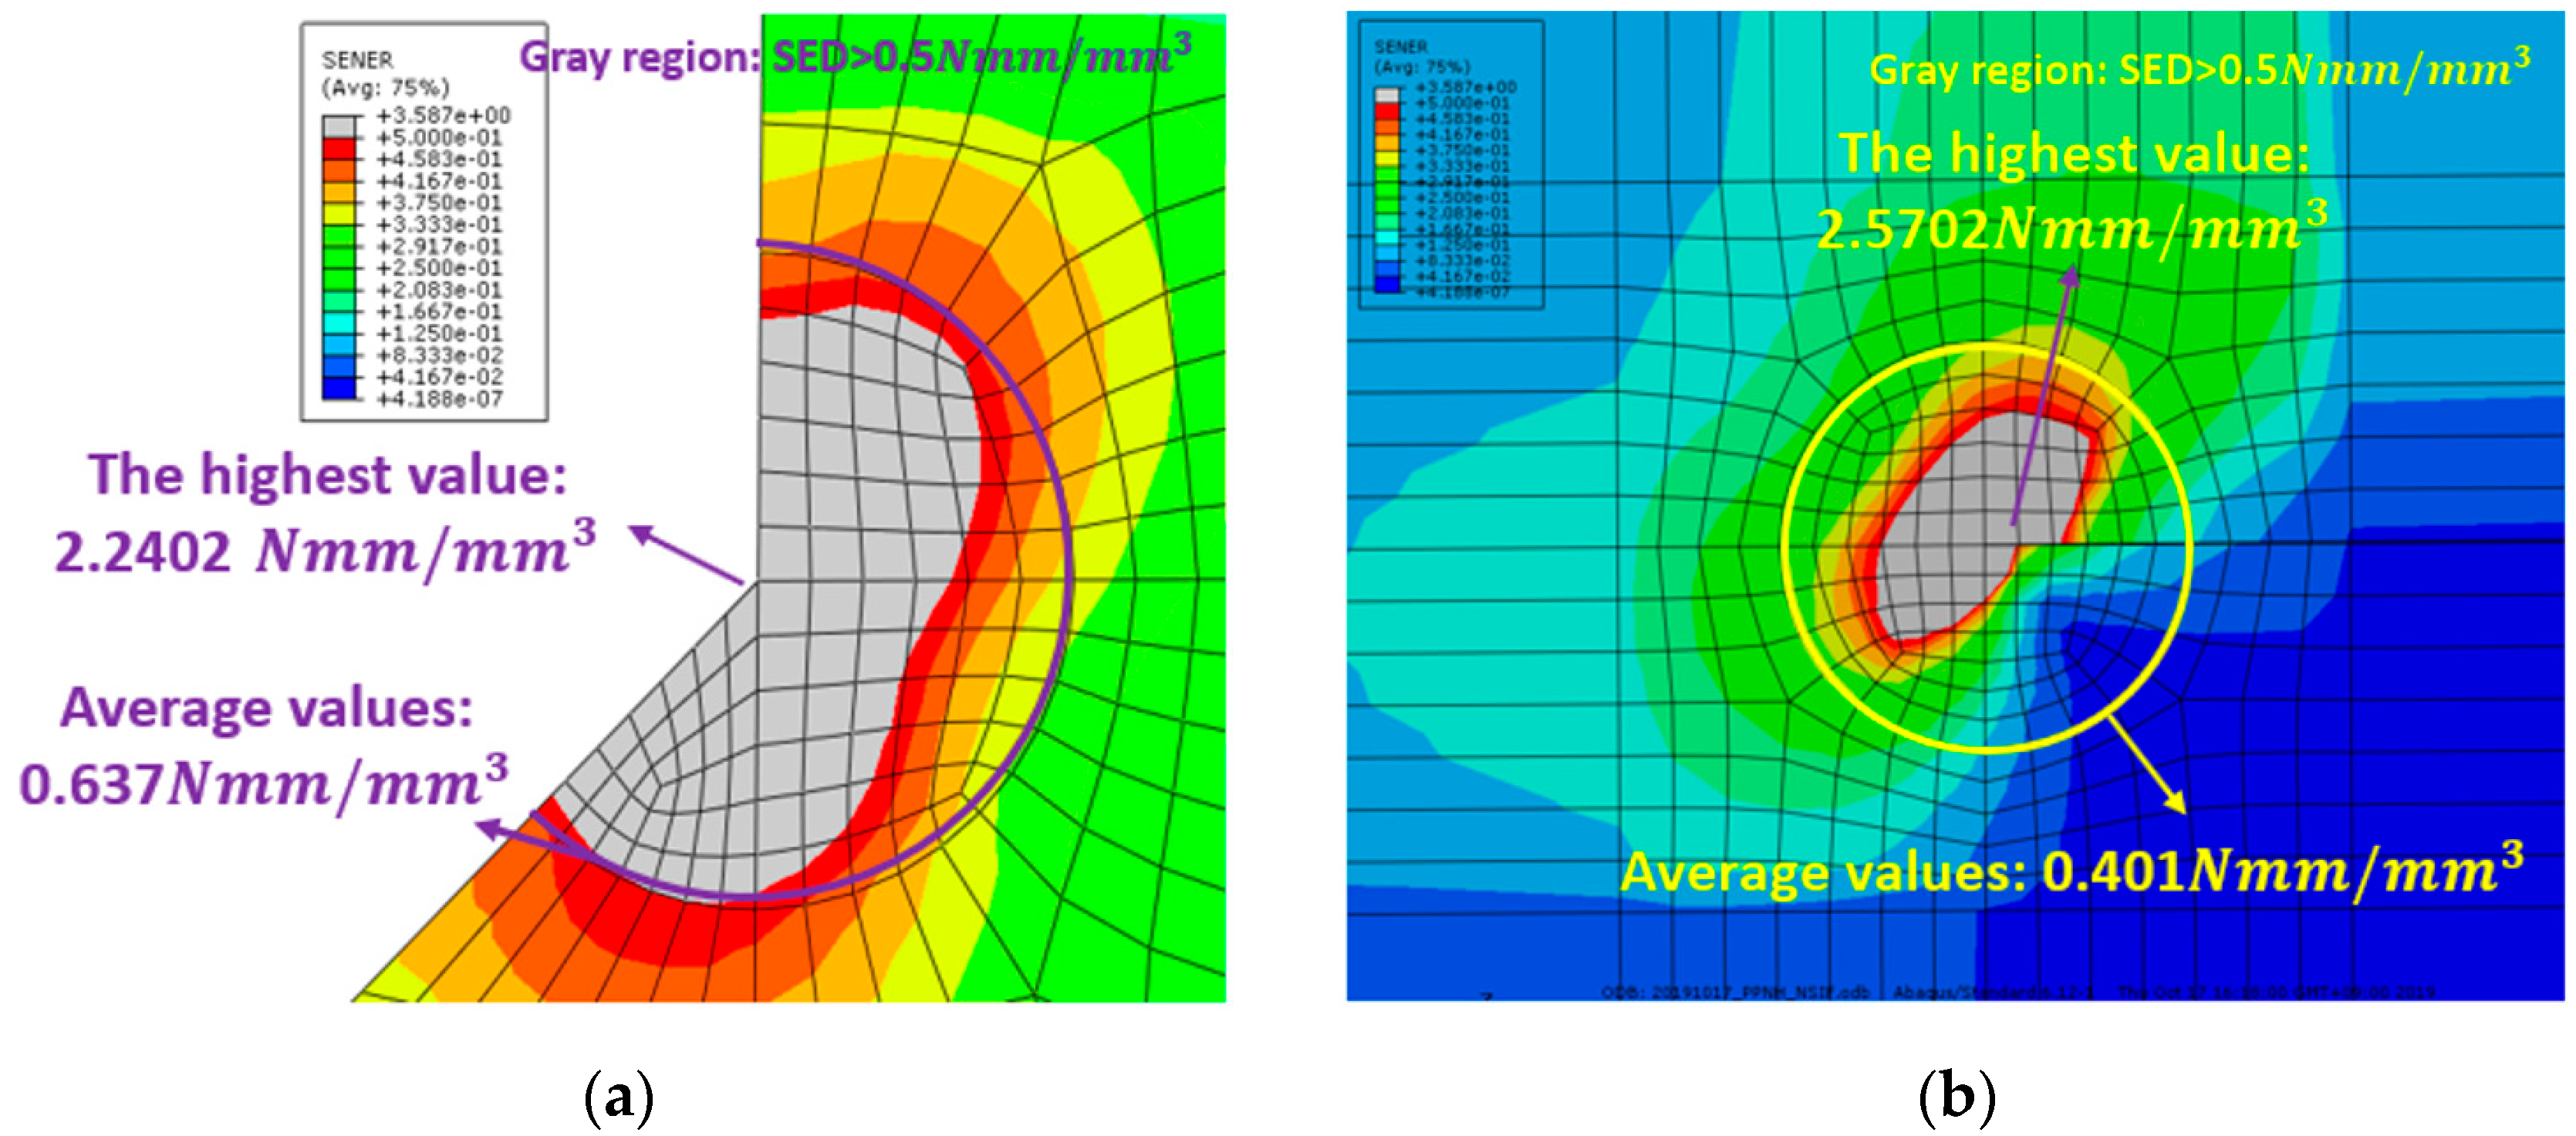
2.3. Notch Stress Intensity Factor Approach

The notch stress intensity factor approach predicts fatigue behavior based on the relationship between the strain energy density and the stress intensity factor. Lazzarin et al. investigated a method for evaluating fatigue life using this relationship, as expressed in Equation (4) [13].
W = e 1 E K 1 R 0 1 λ 1 2 + e 2 E K 2 R 0 1 λ 2 2
In Equation (4), W is the strain energy density, K1 and K2 are the mode I and mode II stress intensity factors, e1 and e2 are parameters depending on the notch opening angle, E is the elastic modulus, λ1 and λ2 are eigenvalues for each mode, and R0 is the radius. As shown in Figure 4, a refined mesh is generated within a radius of 0.28 mm to calculate the mean strain energy density over the evaluation area.
Based on fatigue test data for various steel grades, Lazzarin et al. proposed a method for predicting fatigue life using the strain energy density approach [13]. Furthermore, Fischer et al. built upon Lazzarin’s work and proposed a method in which the strain energy density is converted into an equivalent stress, as described in Equation (5), to evaluate fatigue life using an S–N curve [14].
σ e q = 2 E W
where E refers to the elastic modulus under plane strain conditions.

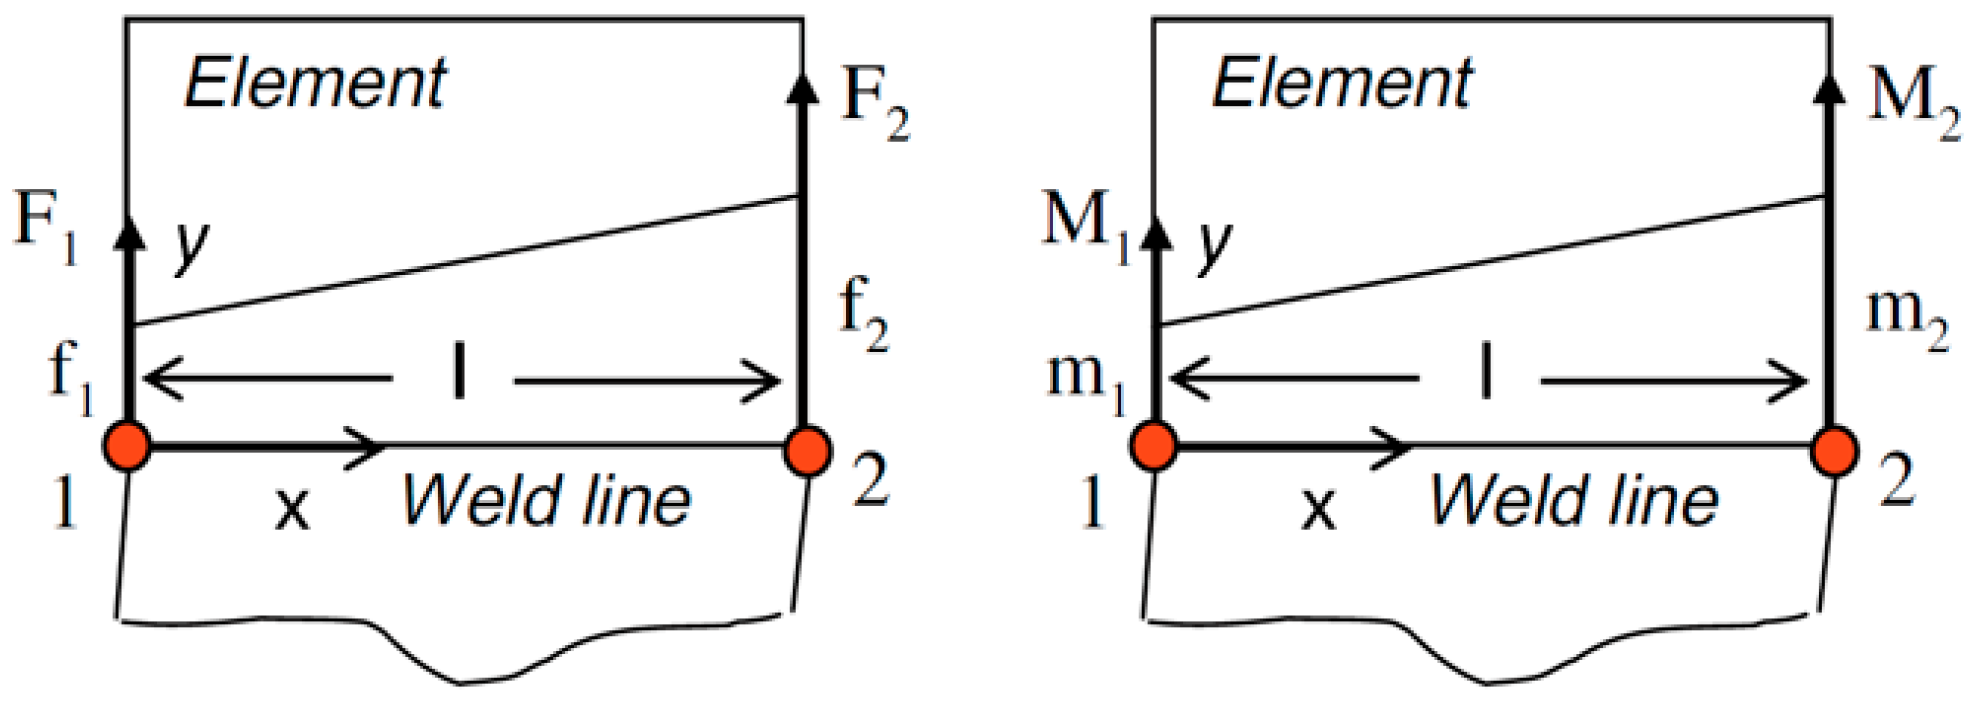
2.4. Structural Stress Approach

To develop a fatigue strength assessment method that is insensitive to the mesh size used in finite element analysis, Dong proposed the structural stress approach [15]. Once the nodal forces ( F y 1 ,   F y 2 ) in the y direction and nodal moments ( M x 1 ,   M x 2 ) with respect to the x axis are obtained as shown in Figure 5, the corresponding line forces ( f y 1 ,   f y 2 ) and line moments ( m x 1 ,   m x 2 ) can be calculated using Equations (6) and (7).
f y 1 = 2 l 2 F y 1 F y 2 ,   f y 2 = 2 l 2 F y 2 F y 1
m x 1 = 2 l 2 M x 1 M x 2 ,   m x 2 = 2 l 2 M x 2 M x 1
where l is the element size. The structural stress can be calculated using line force and line moment, as expressed in Equation (8).
σ s = σ m + σ b = f y t + 6 m x t 2
where σ s is the structural stress, σ m and σ b are the membrane and bending stresses, respectively. The equivalent structural stress parameter can be defined by normalizing the structural stress with two variables, expressed in terms of t and r in Equation (9).
σ e q = σ s t ( 2 m ) / 2 m I r 1 / m
Here, m is the constant value of 3.6 derived from the two-stage crack growth model and I ( r ) is the dimensionless function expressed as the bending stress ratio, r . The calculated equivalent structural stress is compared with the master S-N curve to evaluate the fatigue life.

3. Longi-Web Connection
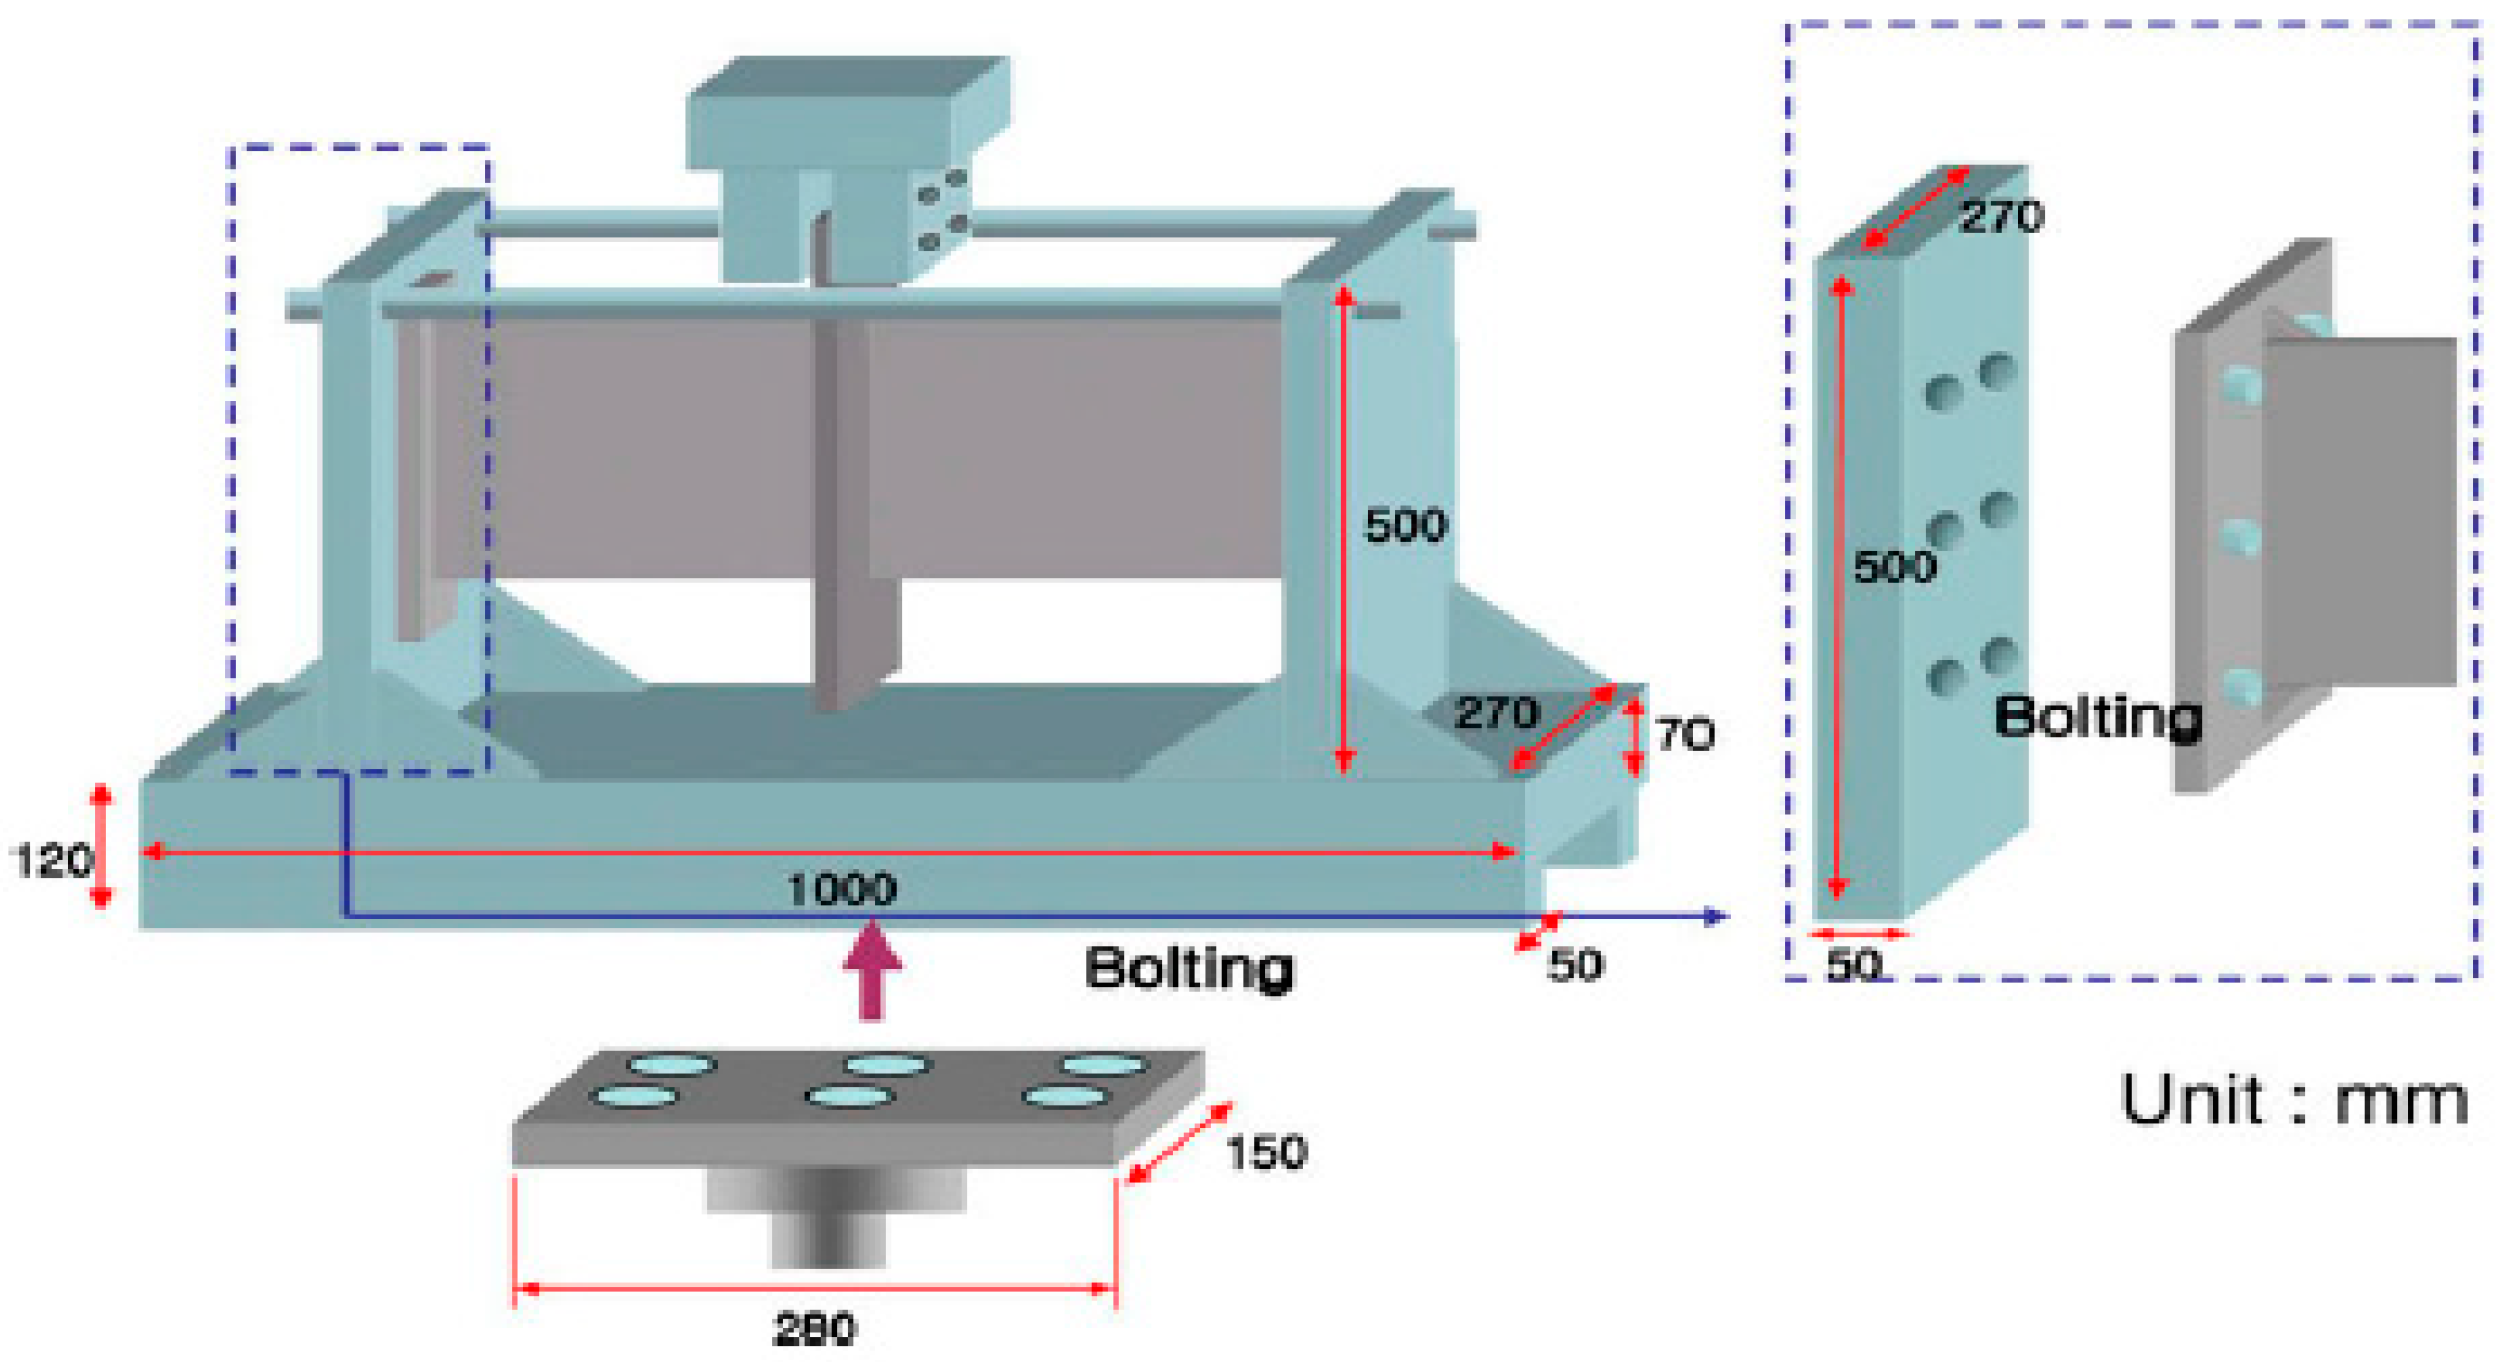
3.1. Experiments

In this study, the fatigue life of longi-web connection in the hull structure is evaluated. Figure 6 illustrates a typical longi-web connection in a hull structure. To verify the validity of fatigue life estimated by each local stress approach, it is essential to conduct fatigue test. Kim et al. conducted fatigue tests using specimens that simulated the geometry of longi-web connection in the hull structure. An overview of the specimen and the jig is shown in Figure 7 [16,17].
The experiment was conducted by fixing the symmetric specimen from both sides and applying a cyclic load to the central flat plate. Figure 8 shows the actual test specimen. The flat plate to which the load is directly applied is referred to as a jig plate, and the plates on both sides are referred to as wing plates.
In this study, to distinguish the fracture location, the toe region on the jig plate is referred to as the jig toe, and the toe region on the wing plate is referred to as the wing toe. Keyholes are introduced to prevent fatigue failure at the weld toe. To evaluate their influence, the specimens were categorized based on the presence or absence of a keyhole. In addition to toe failure, root failure was also considered by adjusting the weld penetration depth. Two weld conditions were adopted: full penetration, which induces toe failure, and partial penetration, which induces root failure. A total of four models are considered in this study, as shown in Table 1.
Figure 9 presents the fatigue test results. A total of 19 specimens were tested, and it was observed that the fatigue life was lower in the partial penetration condition compared to the full penetration condition. In addition, depending on the degree of penetration, most fatigue failures in the partial penetration specimens occurred at the weld root, whereas weld toe failures were observed in the full penetration specimens.

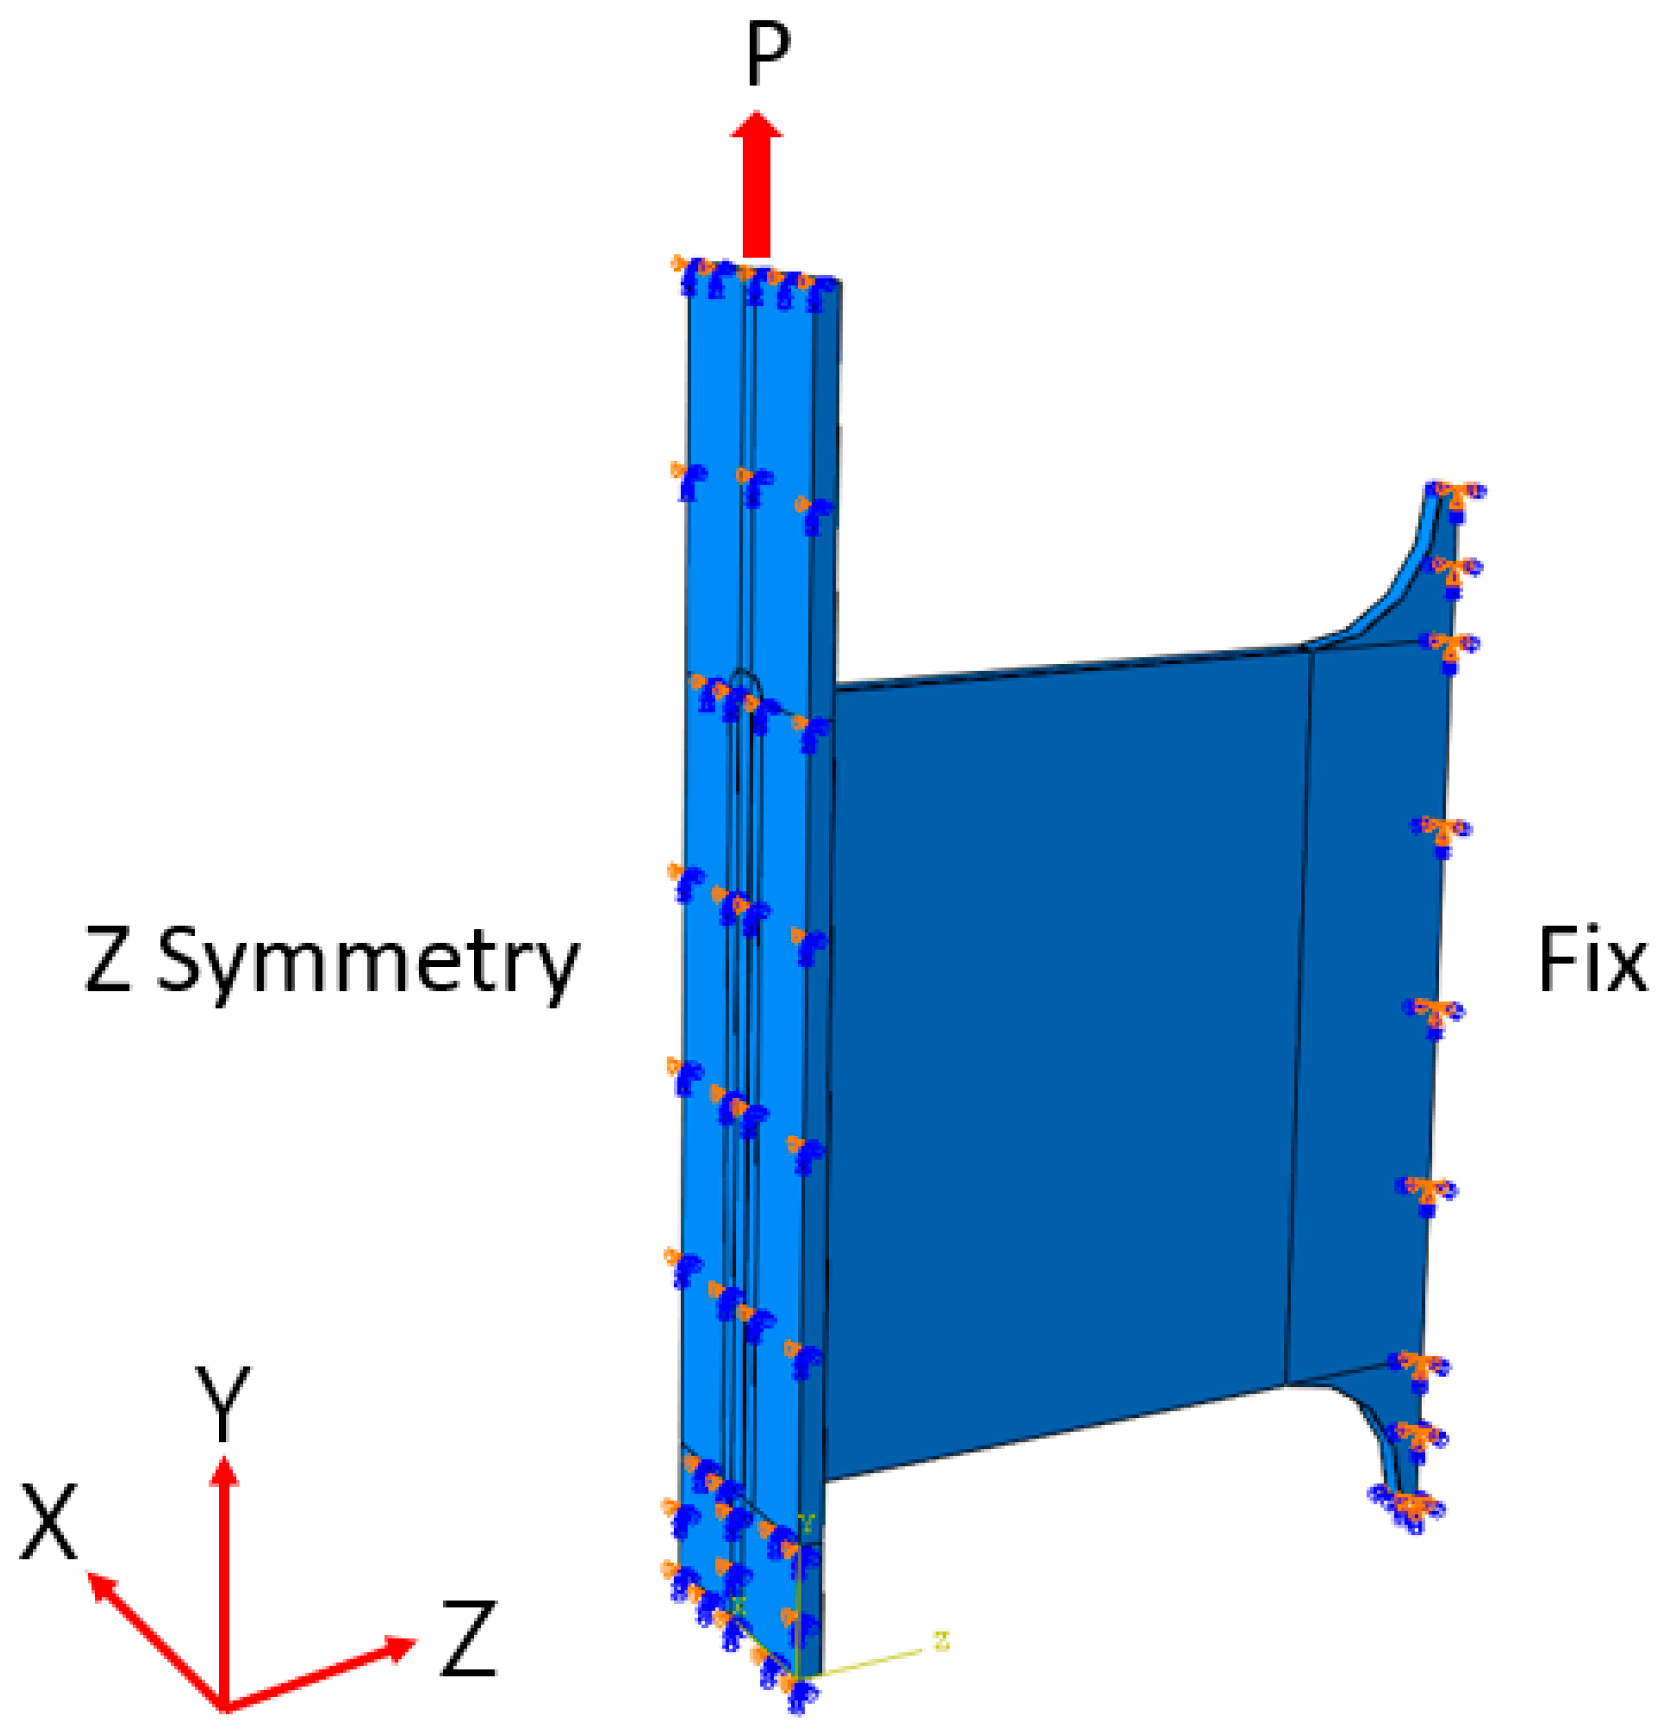
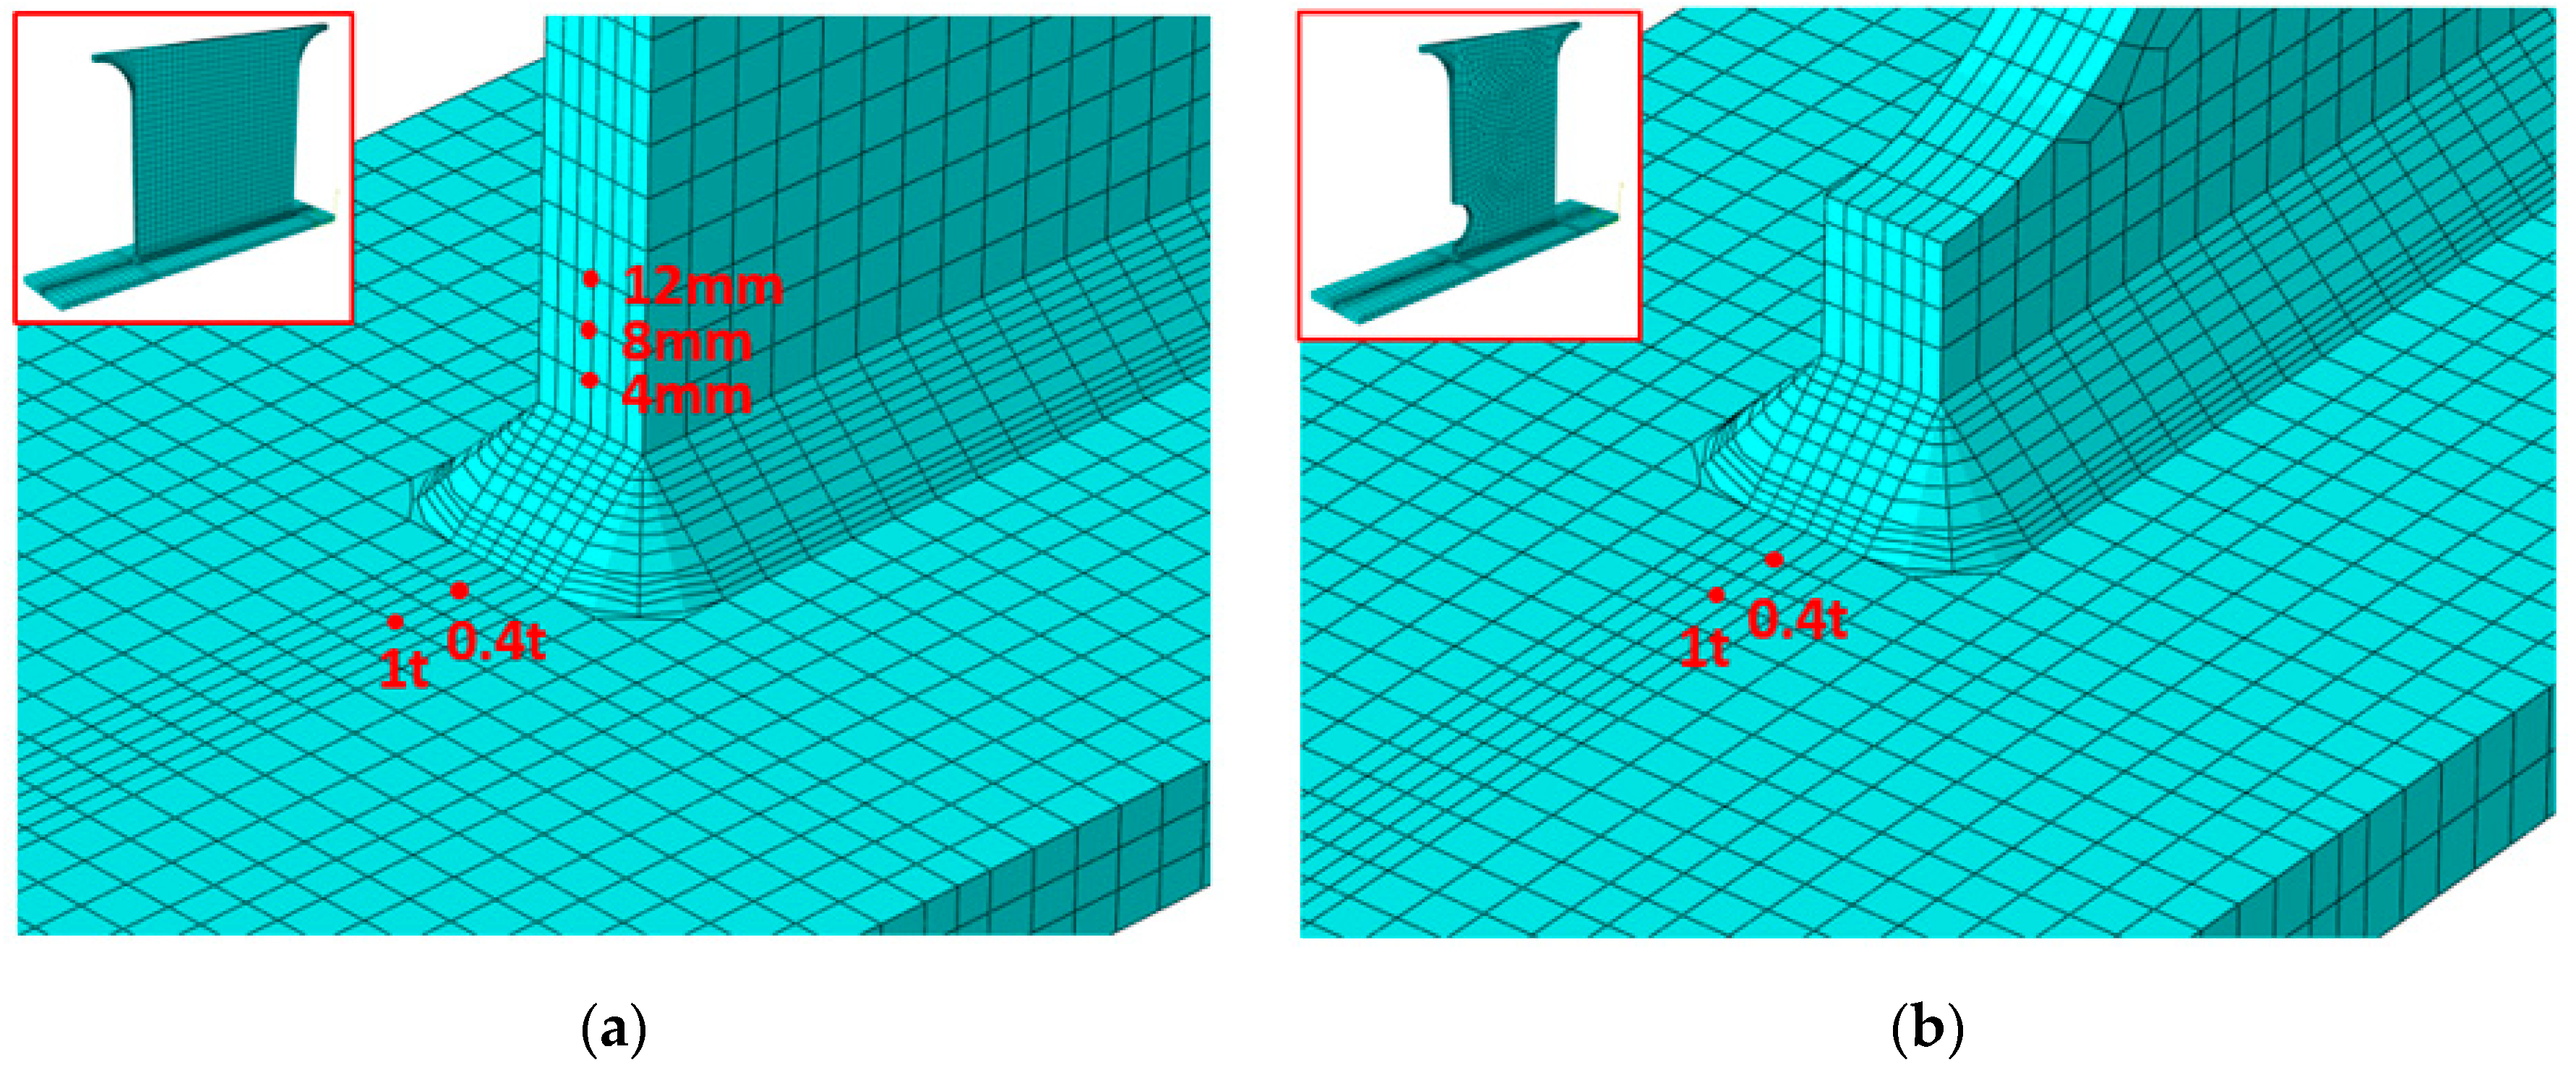
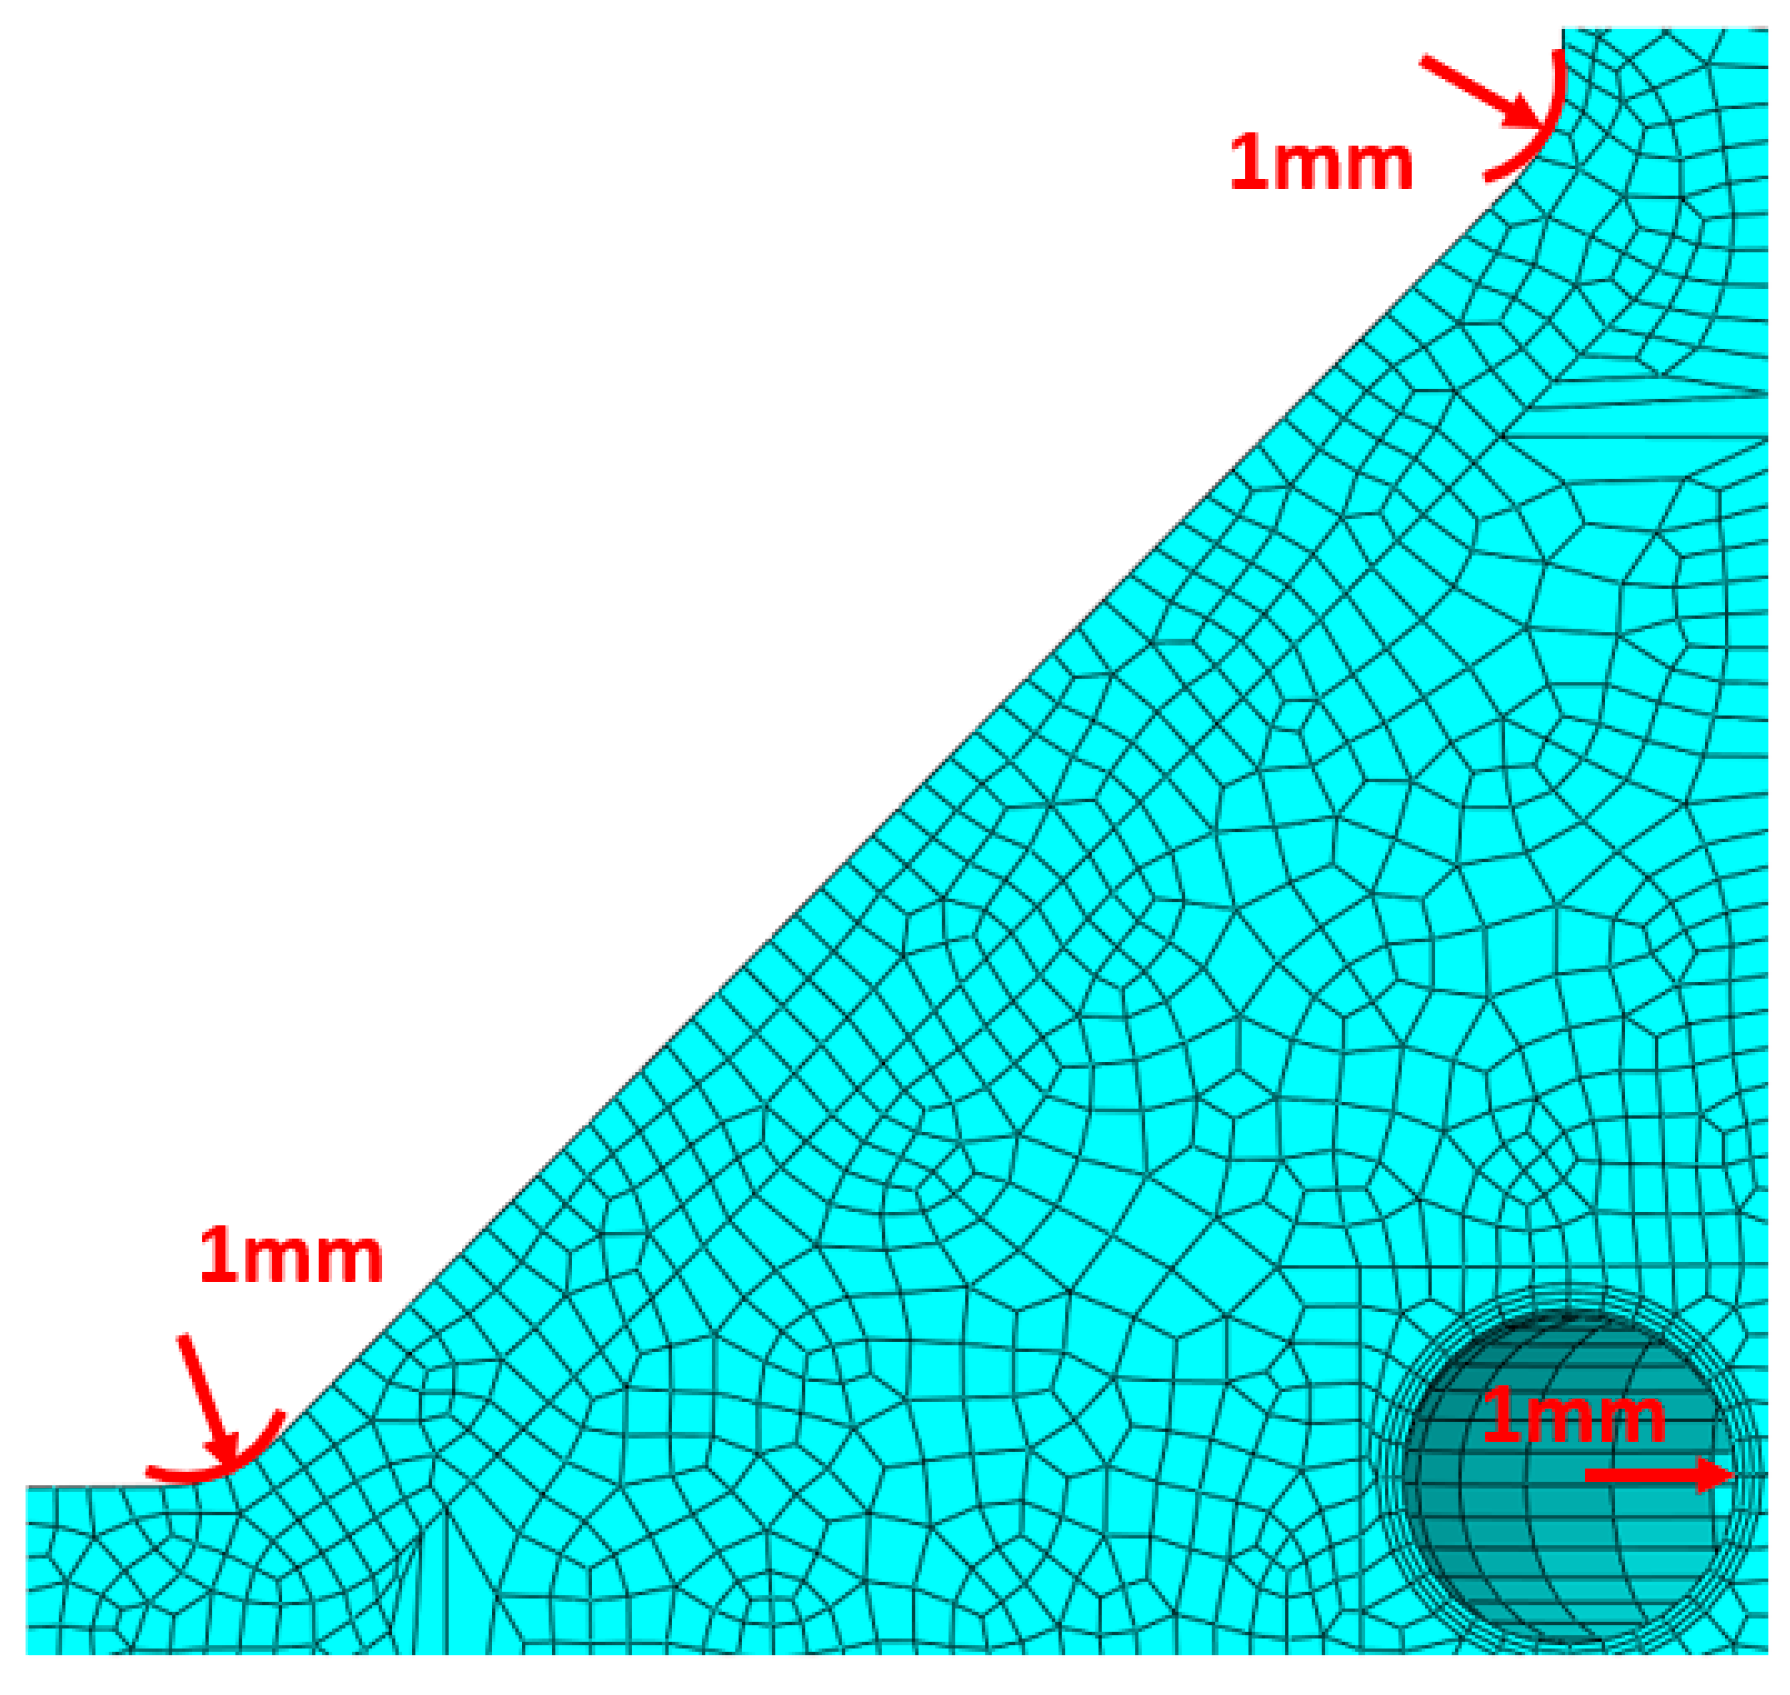
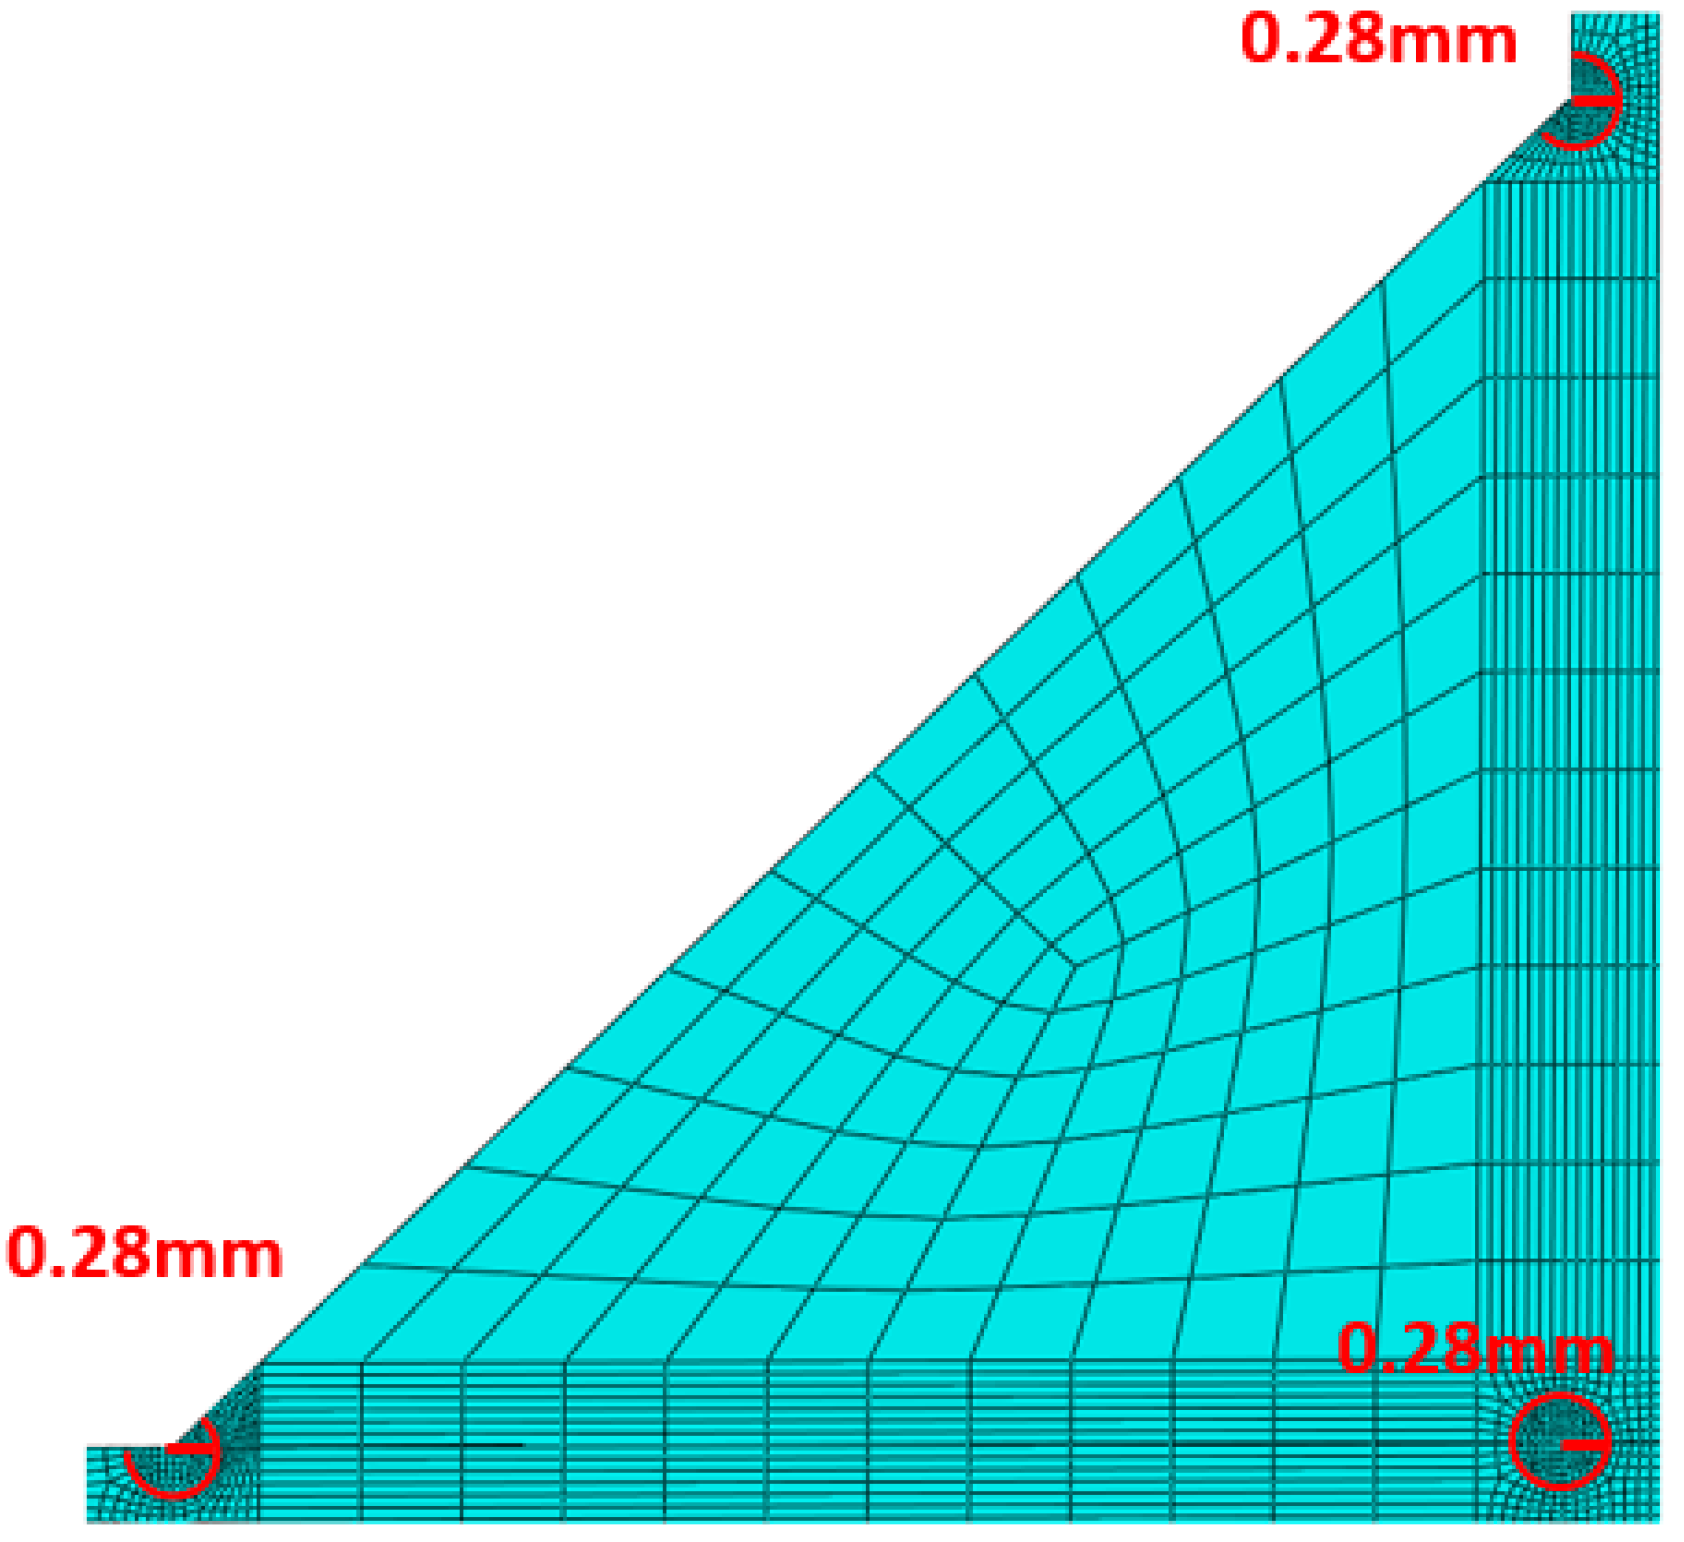
3.2. Finite Element Model

A commercial software, ABAQUS 6.12, was used to generate the finite element models, and finite element analysis was performed to apply each local stress approach. The finite element constituting the model is 8-node 3D stress elements with reduced integration (C3D8R). This element type is commonly used for three-dimensional finite element analysis. It provides a balance between computational efficiency and accuracy for three-dimensional solid mechanic problems. To ensure consistency with the experimental setup, the FE model was developed based on the geometry and conditions used in the fatigue tests. The boundary conditions were applied identically to all models, as shown in Figure 10, and symmetry conditions were employed to reduce the computational cost.

4. Results

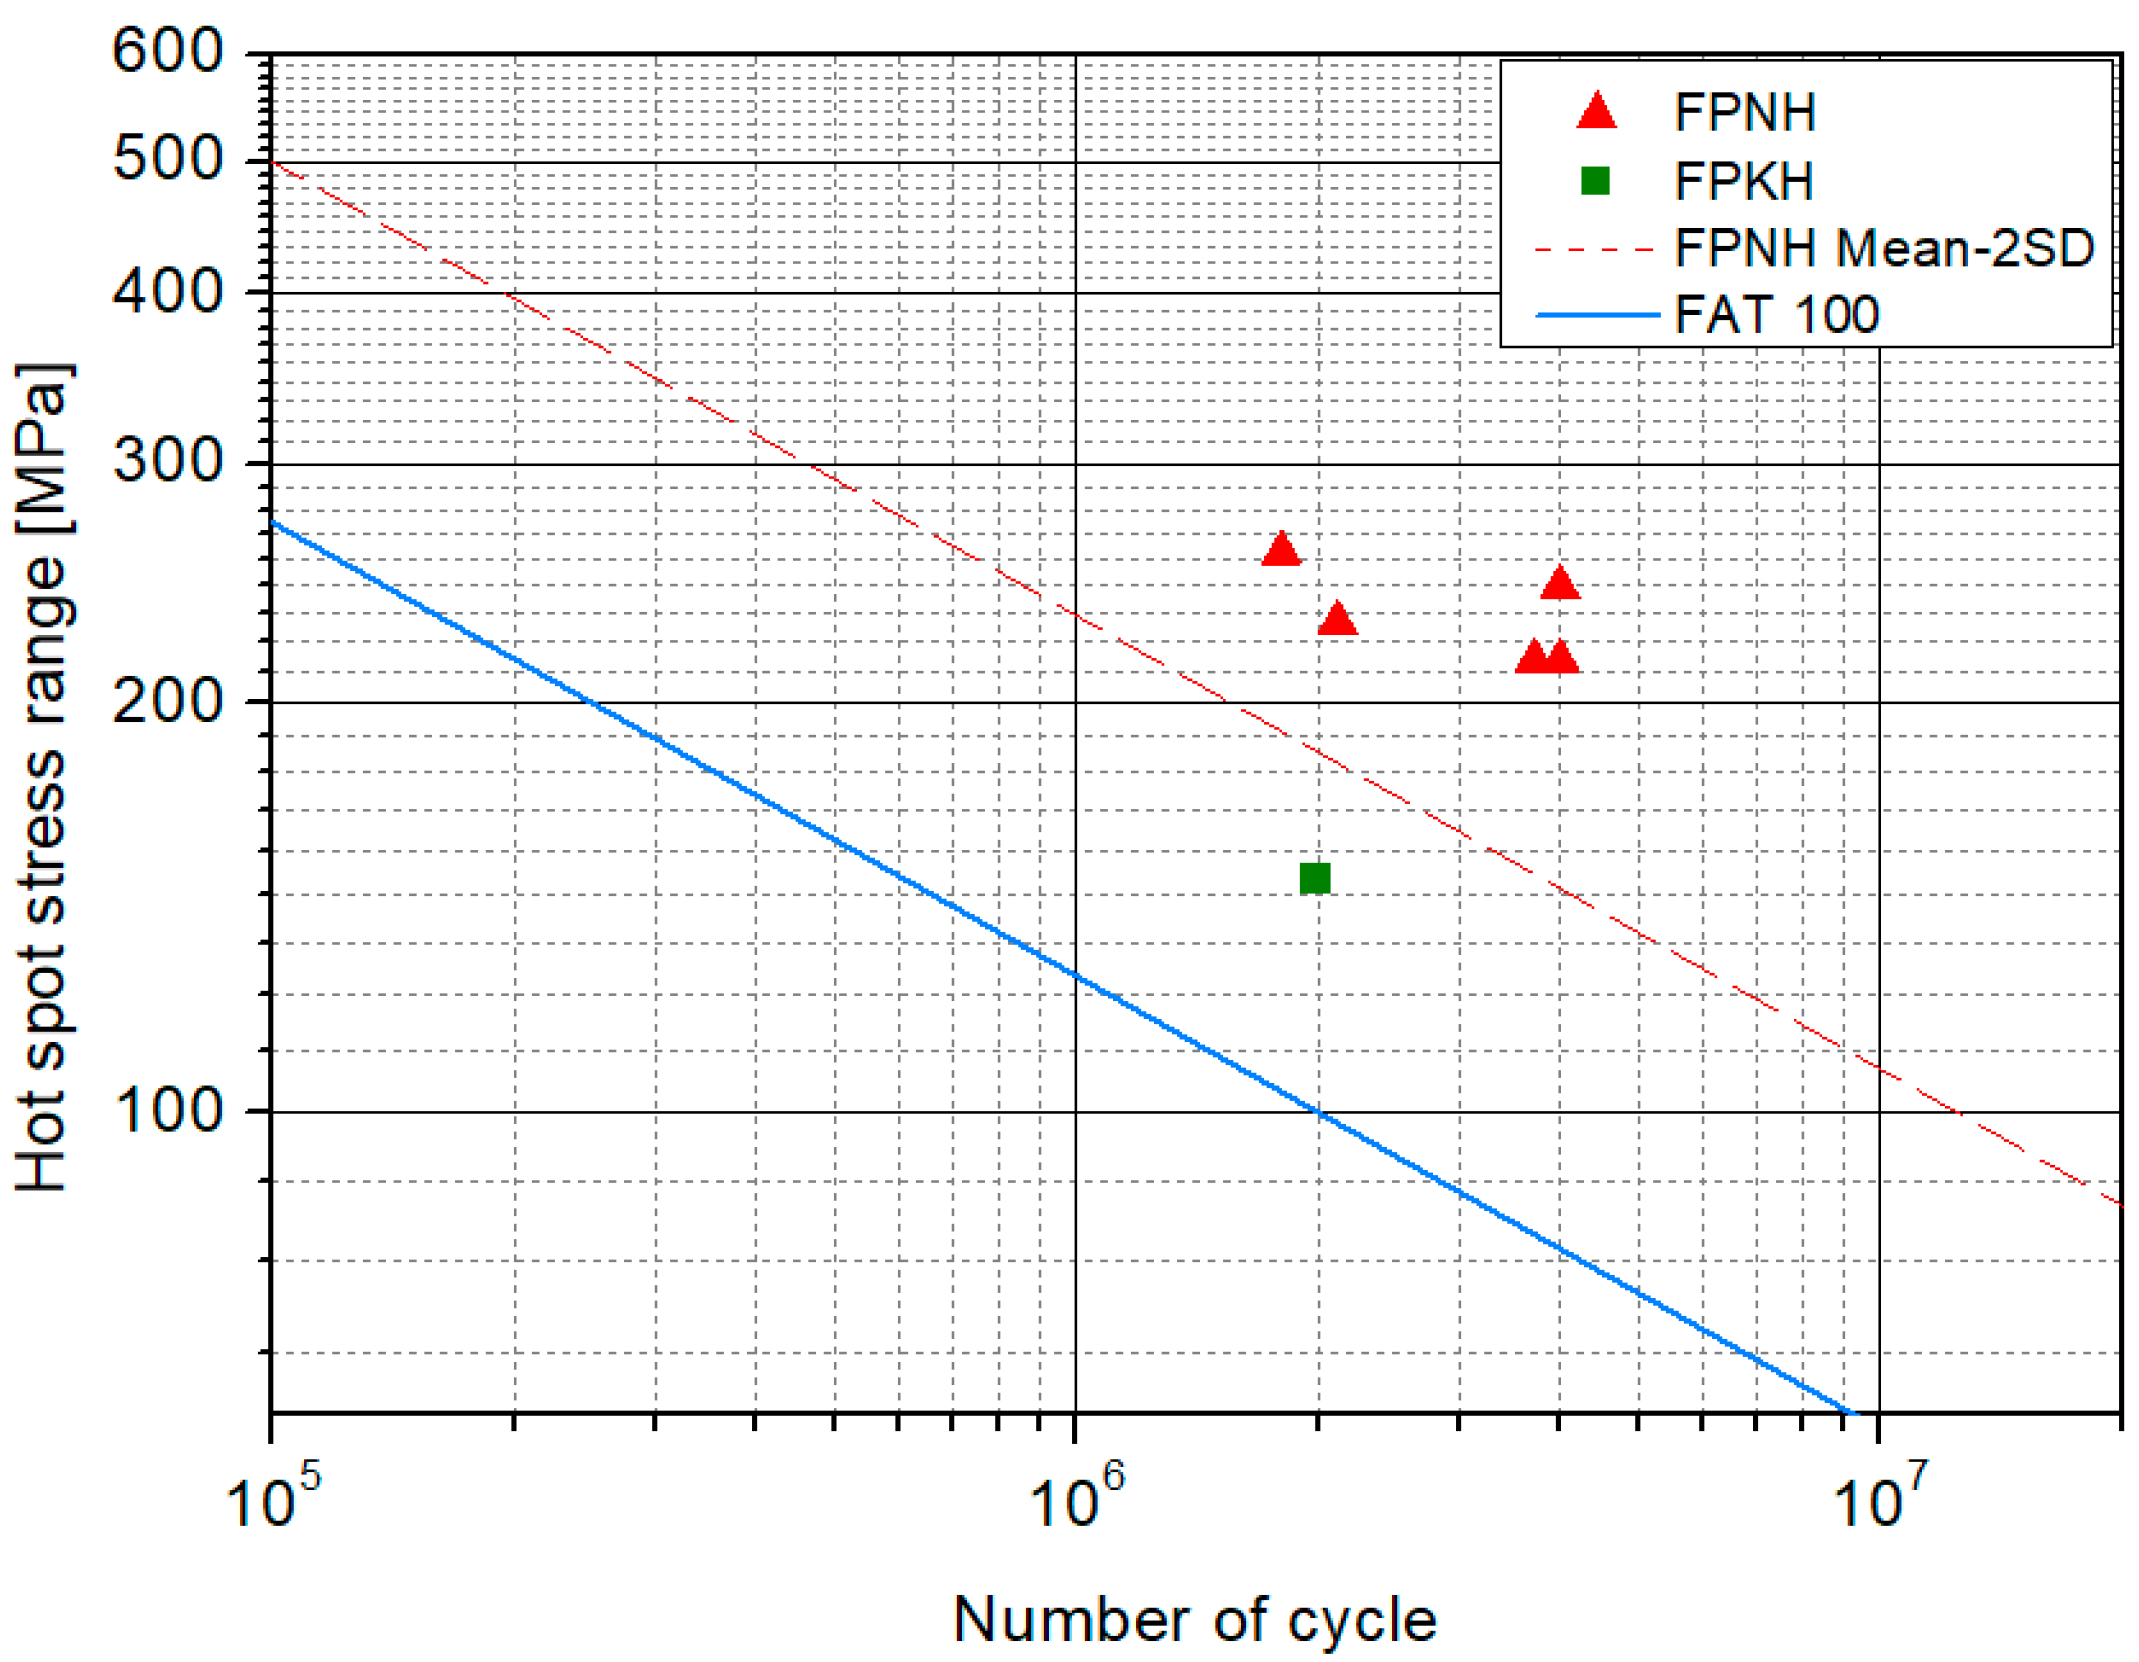
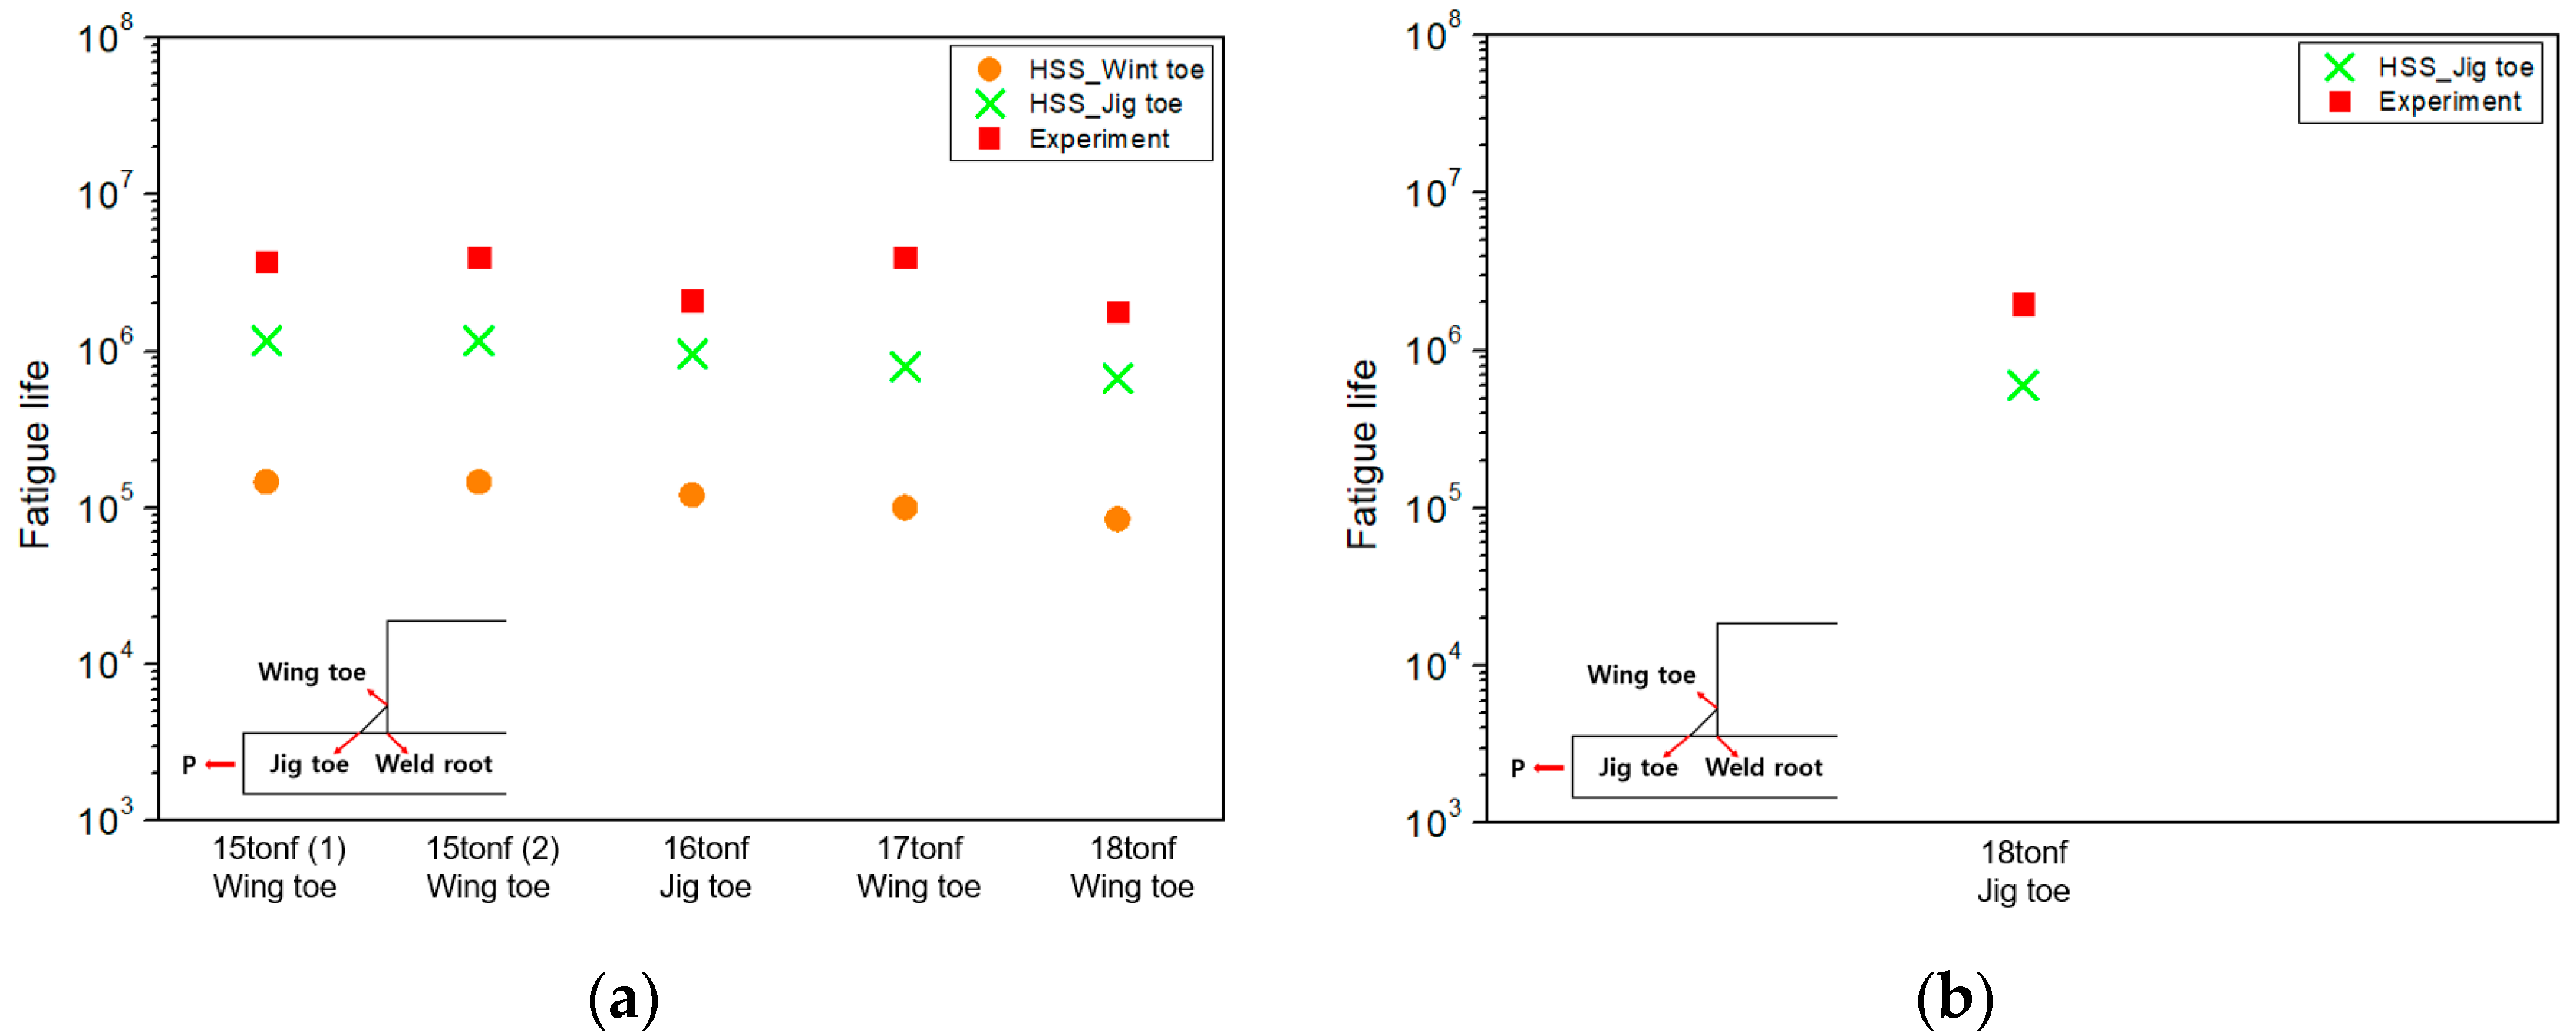
4.1. Hot Spot Stress Results

For the hot spot stress approach, the model shown in Figure 11 was used. Since the jig toe corresponds to a Type (a) hot spot, the hot spot stress was calculated using the nodal stresses at distances of 0.4 t and 1 t. In contrast, the wing toe corresponds to a Type (b) hot spot. Therefore, the stresses at nodes located 4 mm, 8 mm, and 12 mm away were used for the hots pot stress evaluation. The element size near the hot spot region followed the IIW Recommendations, corresponding to 0.4 t × t for Type (a) hot spot and 4   mm × 4   mm for Type (b) hot spot.
IIW Recommendation provides reference FAT curves depending on the geometry of the structures for hot spot stress approach. For the longi-web connection in this study, FAT 100 curve is used. The hot spot stress and the corresponding experimental results are shown in Figure 12. Since the hot spot stress approach evaluates fatigue strength based on surface stresses, it is not suitable for assessing the fatigue performance at the weld root. Therefore, the evaluation is limited to the weld toe region. As the FPNH and FPKH results lie above the FAT 100 curve, it can be concluded that the experimental results indicate a longer fatigue life compared to those predicted by the hot spot stress approach.
Figure 13 compares the predicted fatigue life based on the hot spot stress approach for FPNH and FPKH with the experimental results. The x-axis indicates the applied load conditions and the fracture location from the fatigue tests, while the y-axis represents the fatigue life. The number in parentheses denotes the test number under each load condition. In the case of FPNH, the fatigue life of the wing toe is the lowest, which corresponds to the location where failure predominantly occurred during the fatigue tests. Similarly, at the jig toe in FPKH, the predicted fatigue life is less than the experimental result.

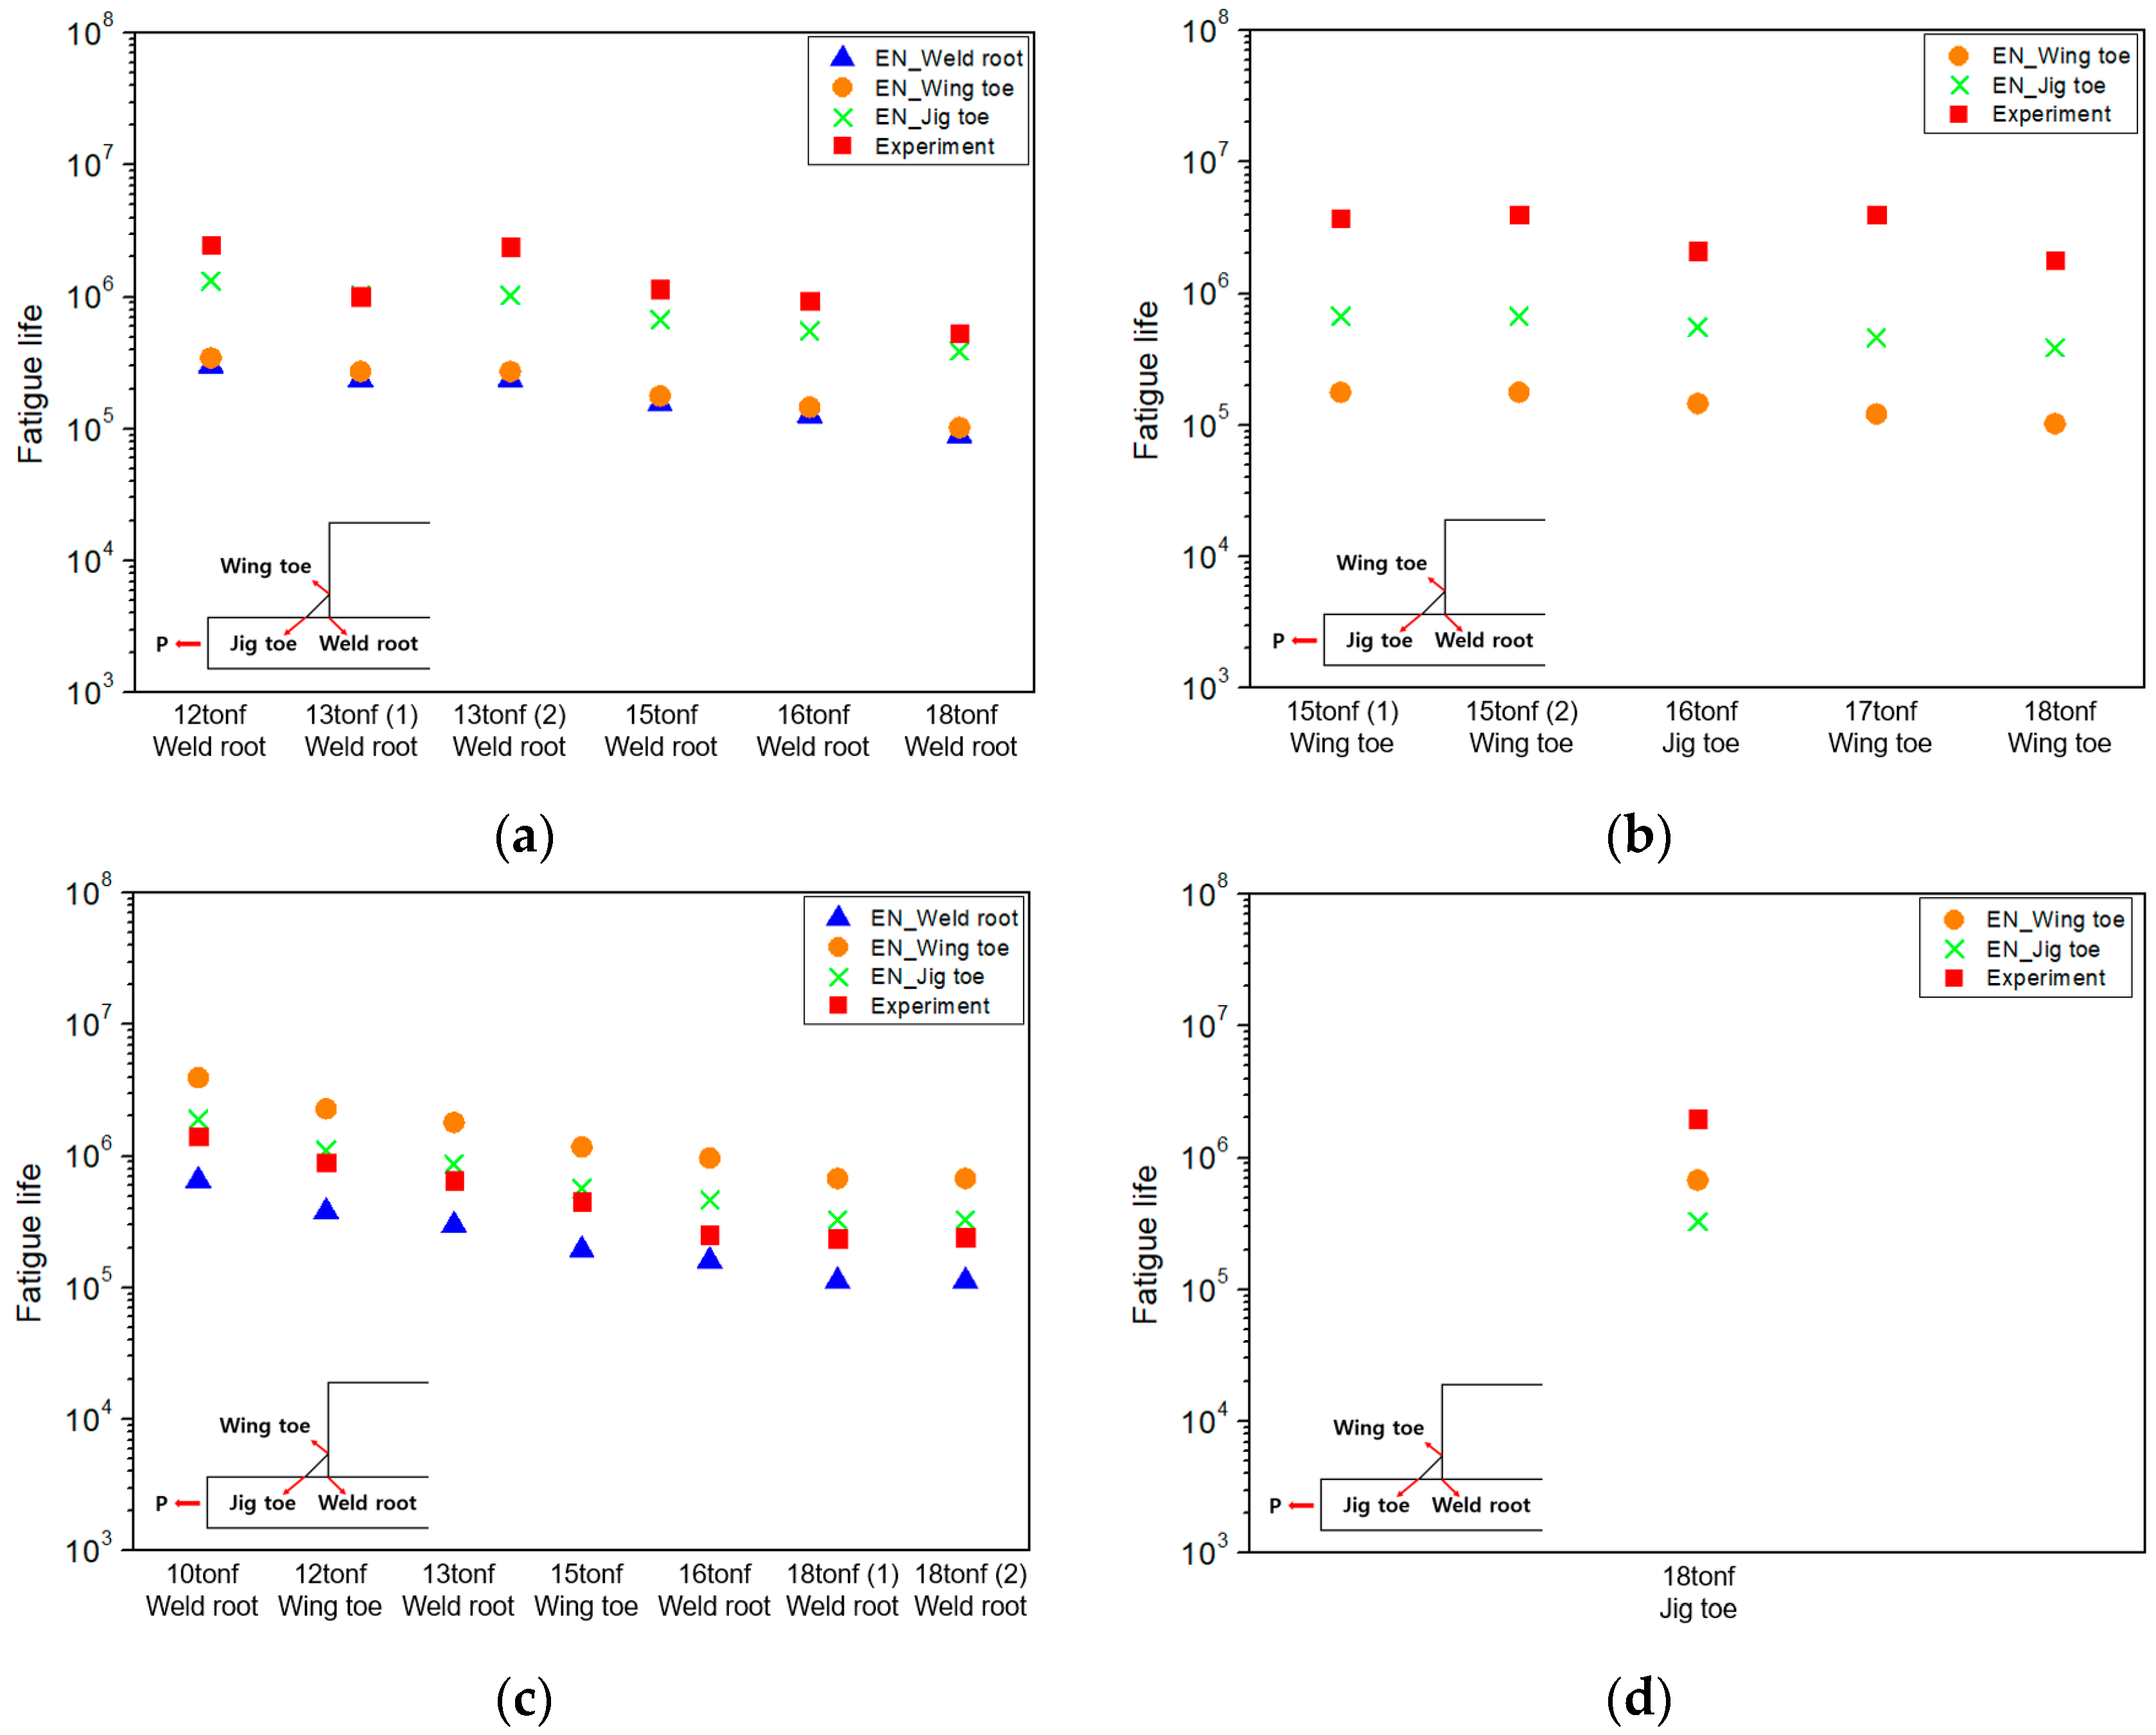
4.2. Effective Notch Stress Results

For the effective notch stress approach, a notch with a radius of 1 mm is introduced as shown in Figure 14. This enables the evaluation of stress concentrations at both the weld toe and weld root. The minimum mesh size near the notch is about 0.2 mm. The results obtained from the effective notch stress approach are compared with FAT 225, according to the IIW Recommendations, as shown in Figure 15. Figure 16 shows the predicted fatigue life at each location. In each case, the predicted failure location corresponds to the primary failure location observed in the experiment.

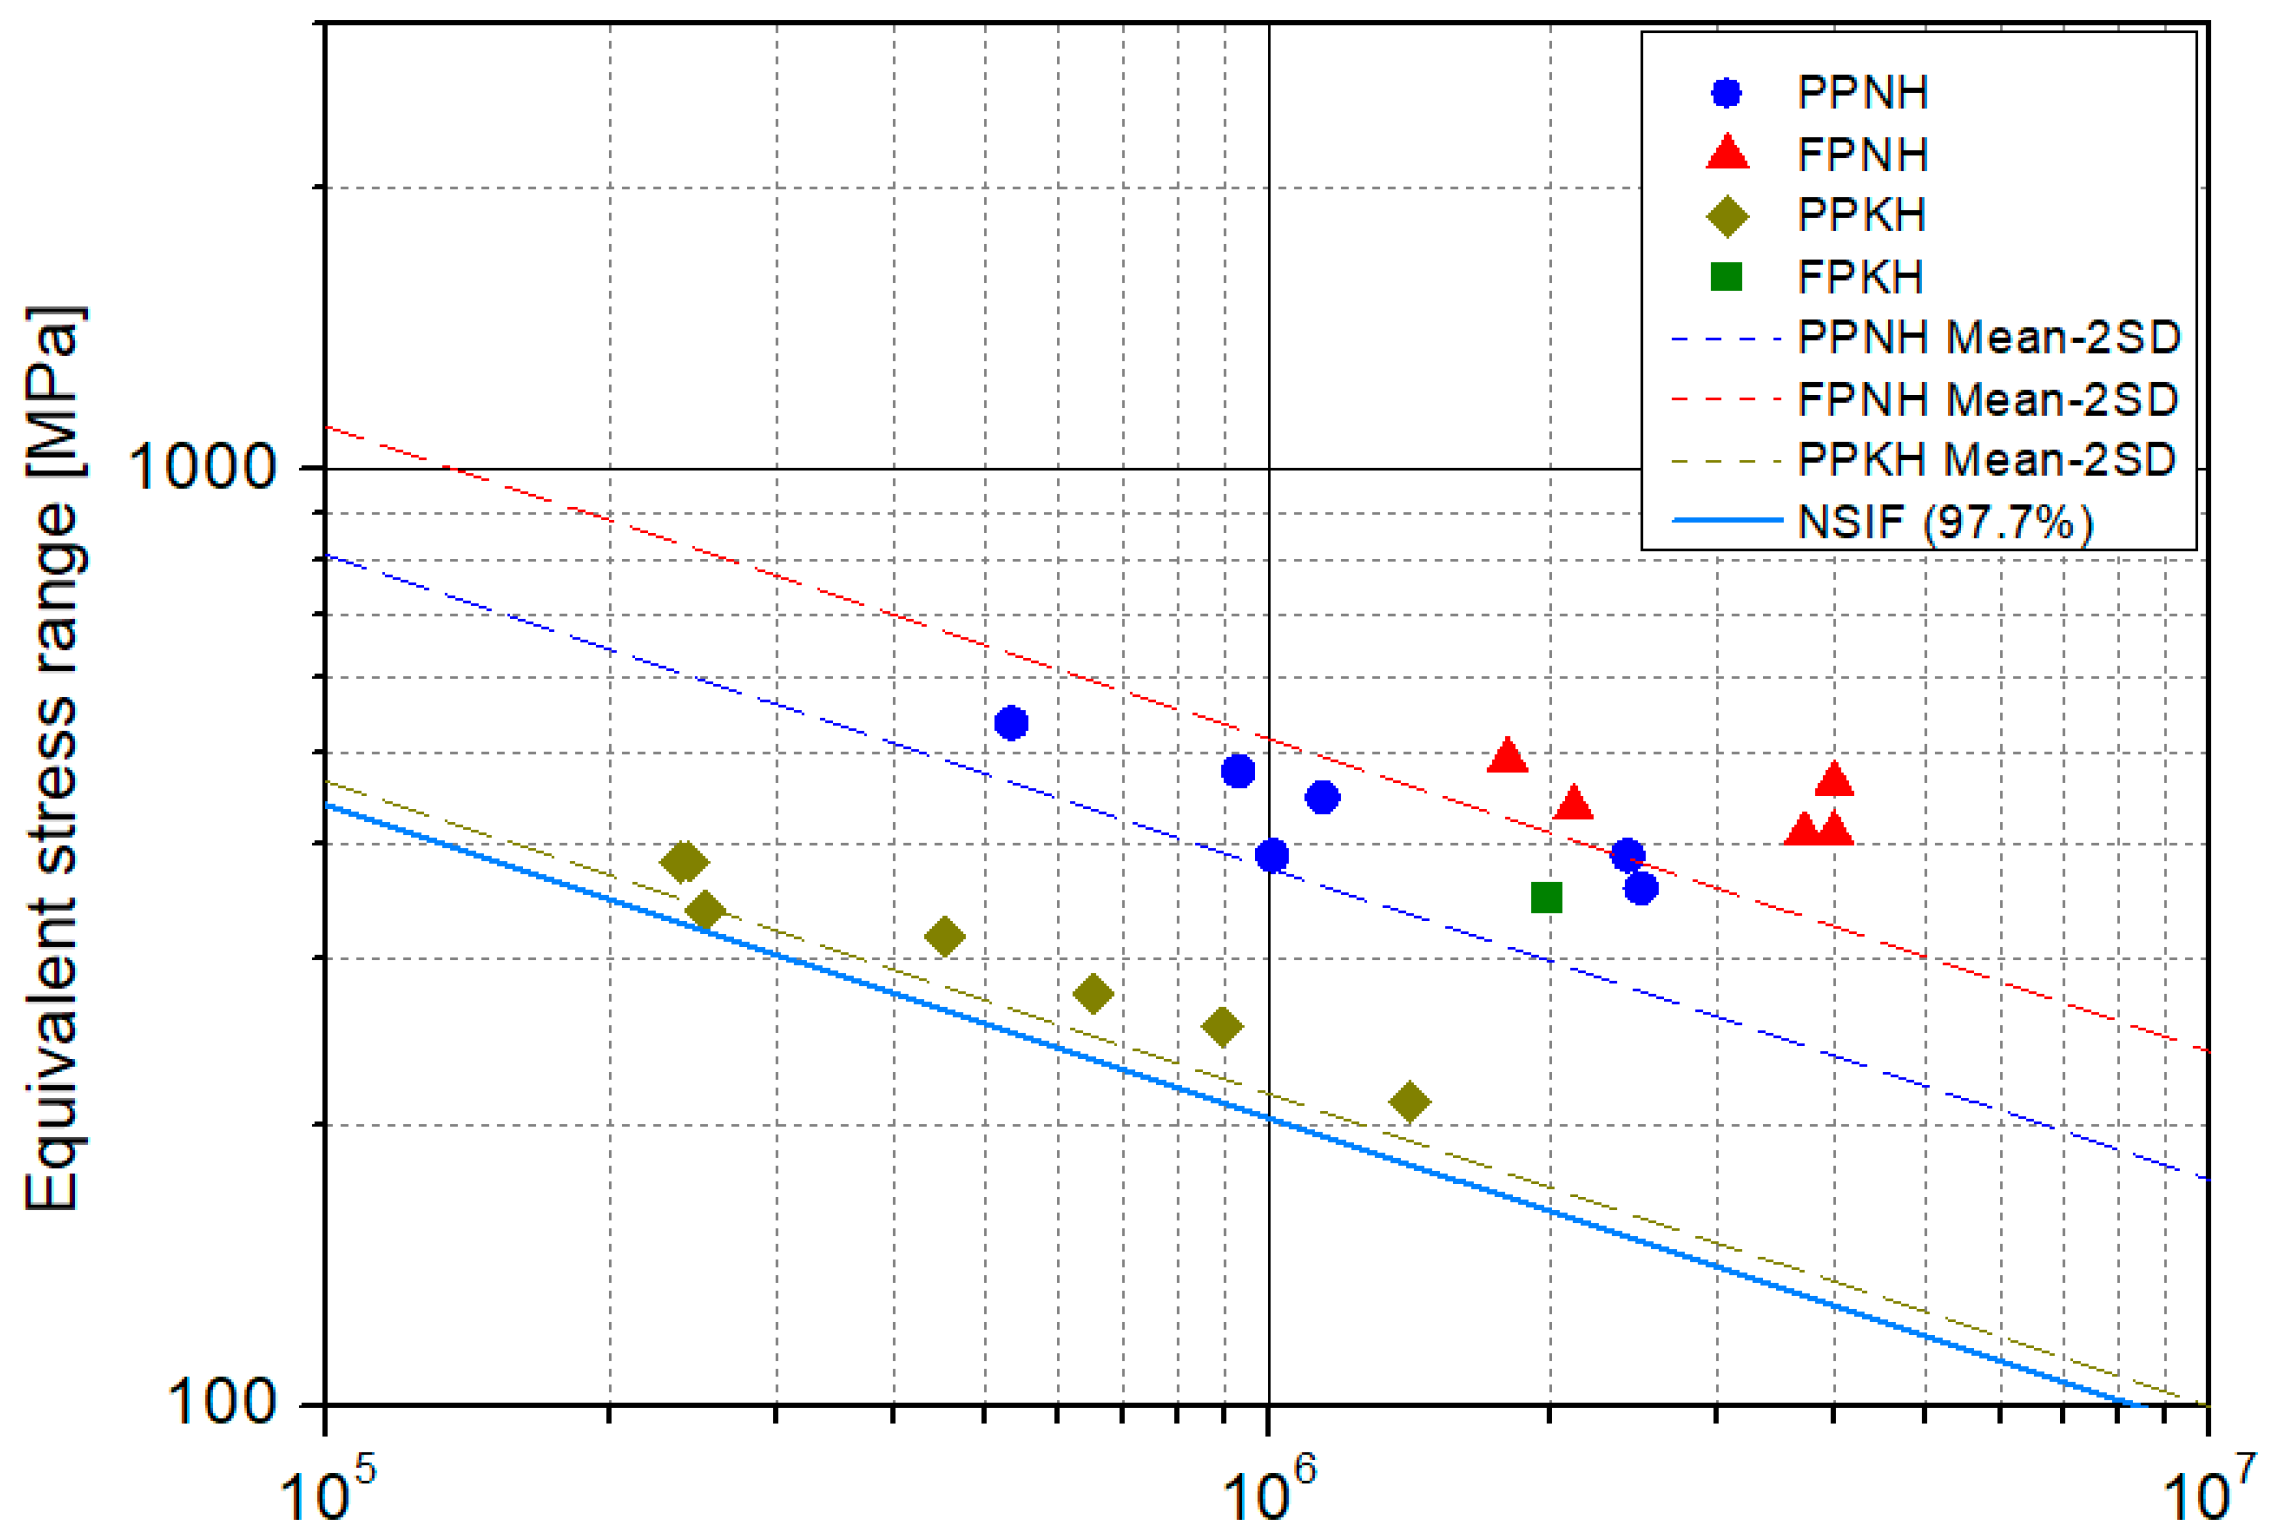
4.3. Notch Stress Intensity Factor Results

In the notch stress intensity factor approach, the fatigue life is evaluated using the average strain energy density within a radius of 0.28 mm. The FE model used for the analysis is shown in Figure 17. Mesh refinement is essential for obtaining reliable results. Therefore, the minimum mesh size within the radius is about 0.05 mm. The obtained strain energy density can be converted into equivalent stress using Equation (5). The evaluation results based on the notch stress intensity factor is presented in Figure 18. A line with a slope of 3 and a fatigue strength of 162 MPa at 2 × 10 6 cycles is defined as the reference curve for fatigue evaluation.
In all four cases, the analysis results lie above the reference curve, indicating that the fatigue life is underestimated compared to the experimental results. Figure 19 presents the failure location and predicted fatigue life based on the notch stress intensity factor approach. This method accurately predicted the primary failure locations for the PPKH, FPNH, and FPKH models, as observed in the experiments; however, for the PPNH model, the main failure location was predicted at the wing toe instead of the root.

4.4. Structural Stress Results

Kim et al. used a shell model to analyze the structural stresses at predicted failure locations for each case. In this study, the stress concentration factor is determined based on the structural stresses and nominal stresses obtained from a previous study, and it is used to calculate the structural stress and equivalent structural stress corresponding to the applied load. Figure 20 presents the S–N curve showing the equivalent structural stress and the experimental results.
In all conditions, the analysis results lie above the design S–N curve. In addition, compared to other local stress approaches, the structural stress method showed the most linear S–N data trend regardless of the structural geometry or weld penetration. Figure 21 presents the predicted fatigue life at each location based on the structural stress approach. It can be observed that the predicted failure locations correspond to the primary failure locations observed in the experiments.

5. Discussion

The validity of each method is verified through two procedures. First, the predicted fatigue life of the structure is compared with the experimentally measured fatigue life. Figure 22 presents the predicted and experimental fatigue life at an applied load of 18 tonf, which was common to all four specimen models. In addition, Table 2 summarizes the dimensionless values obtained by dividing the predicted fatigue life by the experimental result.
The degree of conservatism in fatigue life prediction varied across the cases. For example, in the notch stress intensity factor method, the PPNH, FPNH, and FPKH models yielded the most conservative results, whereas the PPKH model predicted the longest fatigue life. In the structural stress approach, the PPKH model showed the lowest fatigue life, while the FPNH model resulted in the most non-conservative evaluation.
Overall, since all evaluated fatigue life is underestimated compared to the experimental results, it can be considered that all methods provide reasonable fatigue assessments of the structure, at least from the perspective of fatigue life.
Next, the failure locations of the structure are compared between the local stress approach and experimental results. Table 3 presents the predicted failure locations and the actual failure location observed in the experimental results. In the hot spot stress approach, effective notch stress approach, and structural stress approach, the predicted failure locations coincided with the actual primary failure location under all cases. However, in the notch stress intensity factor approach, the PPNH model predicted failure at the wing toe instead of the weld root.
This result is attributable to the inherent characteristics of the notch stress intensity factor approach. Other local stress approaches use specific values obtained from finite element analysis. However, the notch stress intensity factor approach uses the average strain energy density within a defined area. Figure 23 shows the strain energy density at the wing toe and weld root of the PPNH model under a load of 18 tonf. The maximum strain energy density is 14% higher at the weld root than at the wing toe. However, the average strain energy density is 59% higher at the wing toe than at the weld root. Figure 24 shows the Von-Mises stress distribution at the weld root of the PPNH model under a load of 18 tonf. A slit inserted between the jig plate and the wing plate is used to consider the partial penetration effect. In the figure, although the load is applied in the y-direction, compressive stress in the same direction occurs in the lower-right region of the defined area due to the influence of the slit. As a result, the tensile and compressive stresses offset each other, leading to a significant reduction in the strain energy density. Due to this effect, the average strain energy density at the weld root becomes lower than that at the wing toe.
In the case of the PPKH model, the notch stress intensity factor approach predicts the failure location more effectively than the other methods. Figure 25 presents the fatigue life at each location of the PPKH model, as calculated using the effective notch stress approach, the notch stress intensity factor approach, and the structural stress approach. In all three methods, the predicted failure location coincides with the primary failure location observed in the experiment, both being at the weld root. However, under the loading conditions of 12 tonf and 15 tonf, failure also occurred at the wing toe. Nevertheless, both the effective notch stress approach and the structural stress approach predict higher fatigue life at the wing toe compared to the experimental results, indicating a failure to accurately predict the failure location. On the other hand, the notch stress intensity factor approach predicts the fatigue life at the wing toe to be very close to the experimental results. Therefore, in the case of the PPKH model, the notch stress intensity factor approach proved to be more effective.

6. Conclusions

In this study, we evaluated the fatigue characteristics of longi-web connections in the hull structure. Finite element analyses were performed using various local stress approaches, and fatigue life results were obtained for each method. Based on the results from this study, the following conclusions can be drawn:
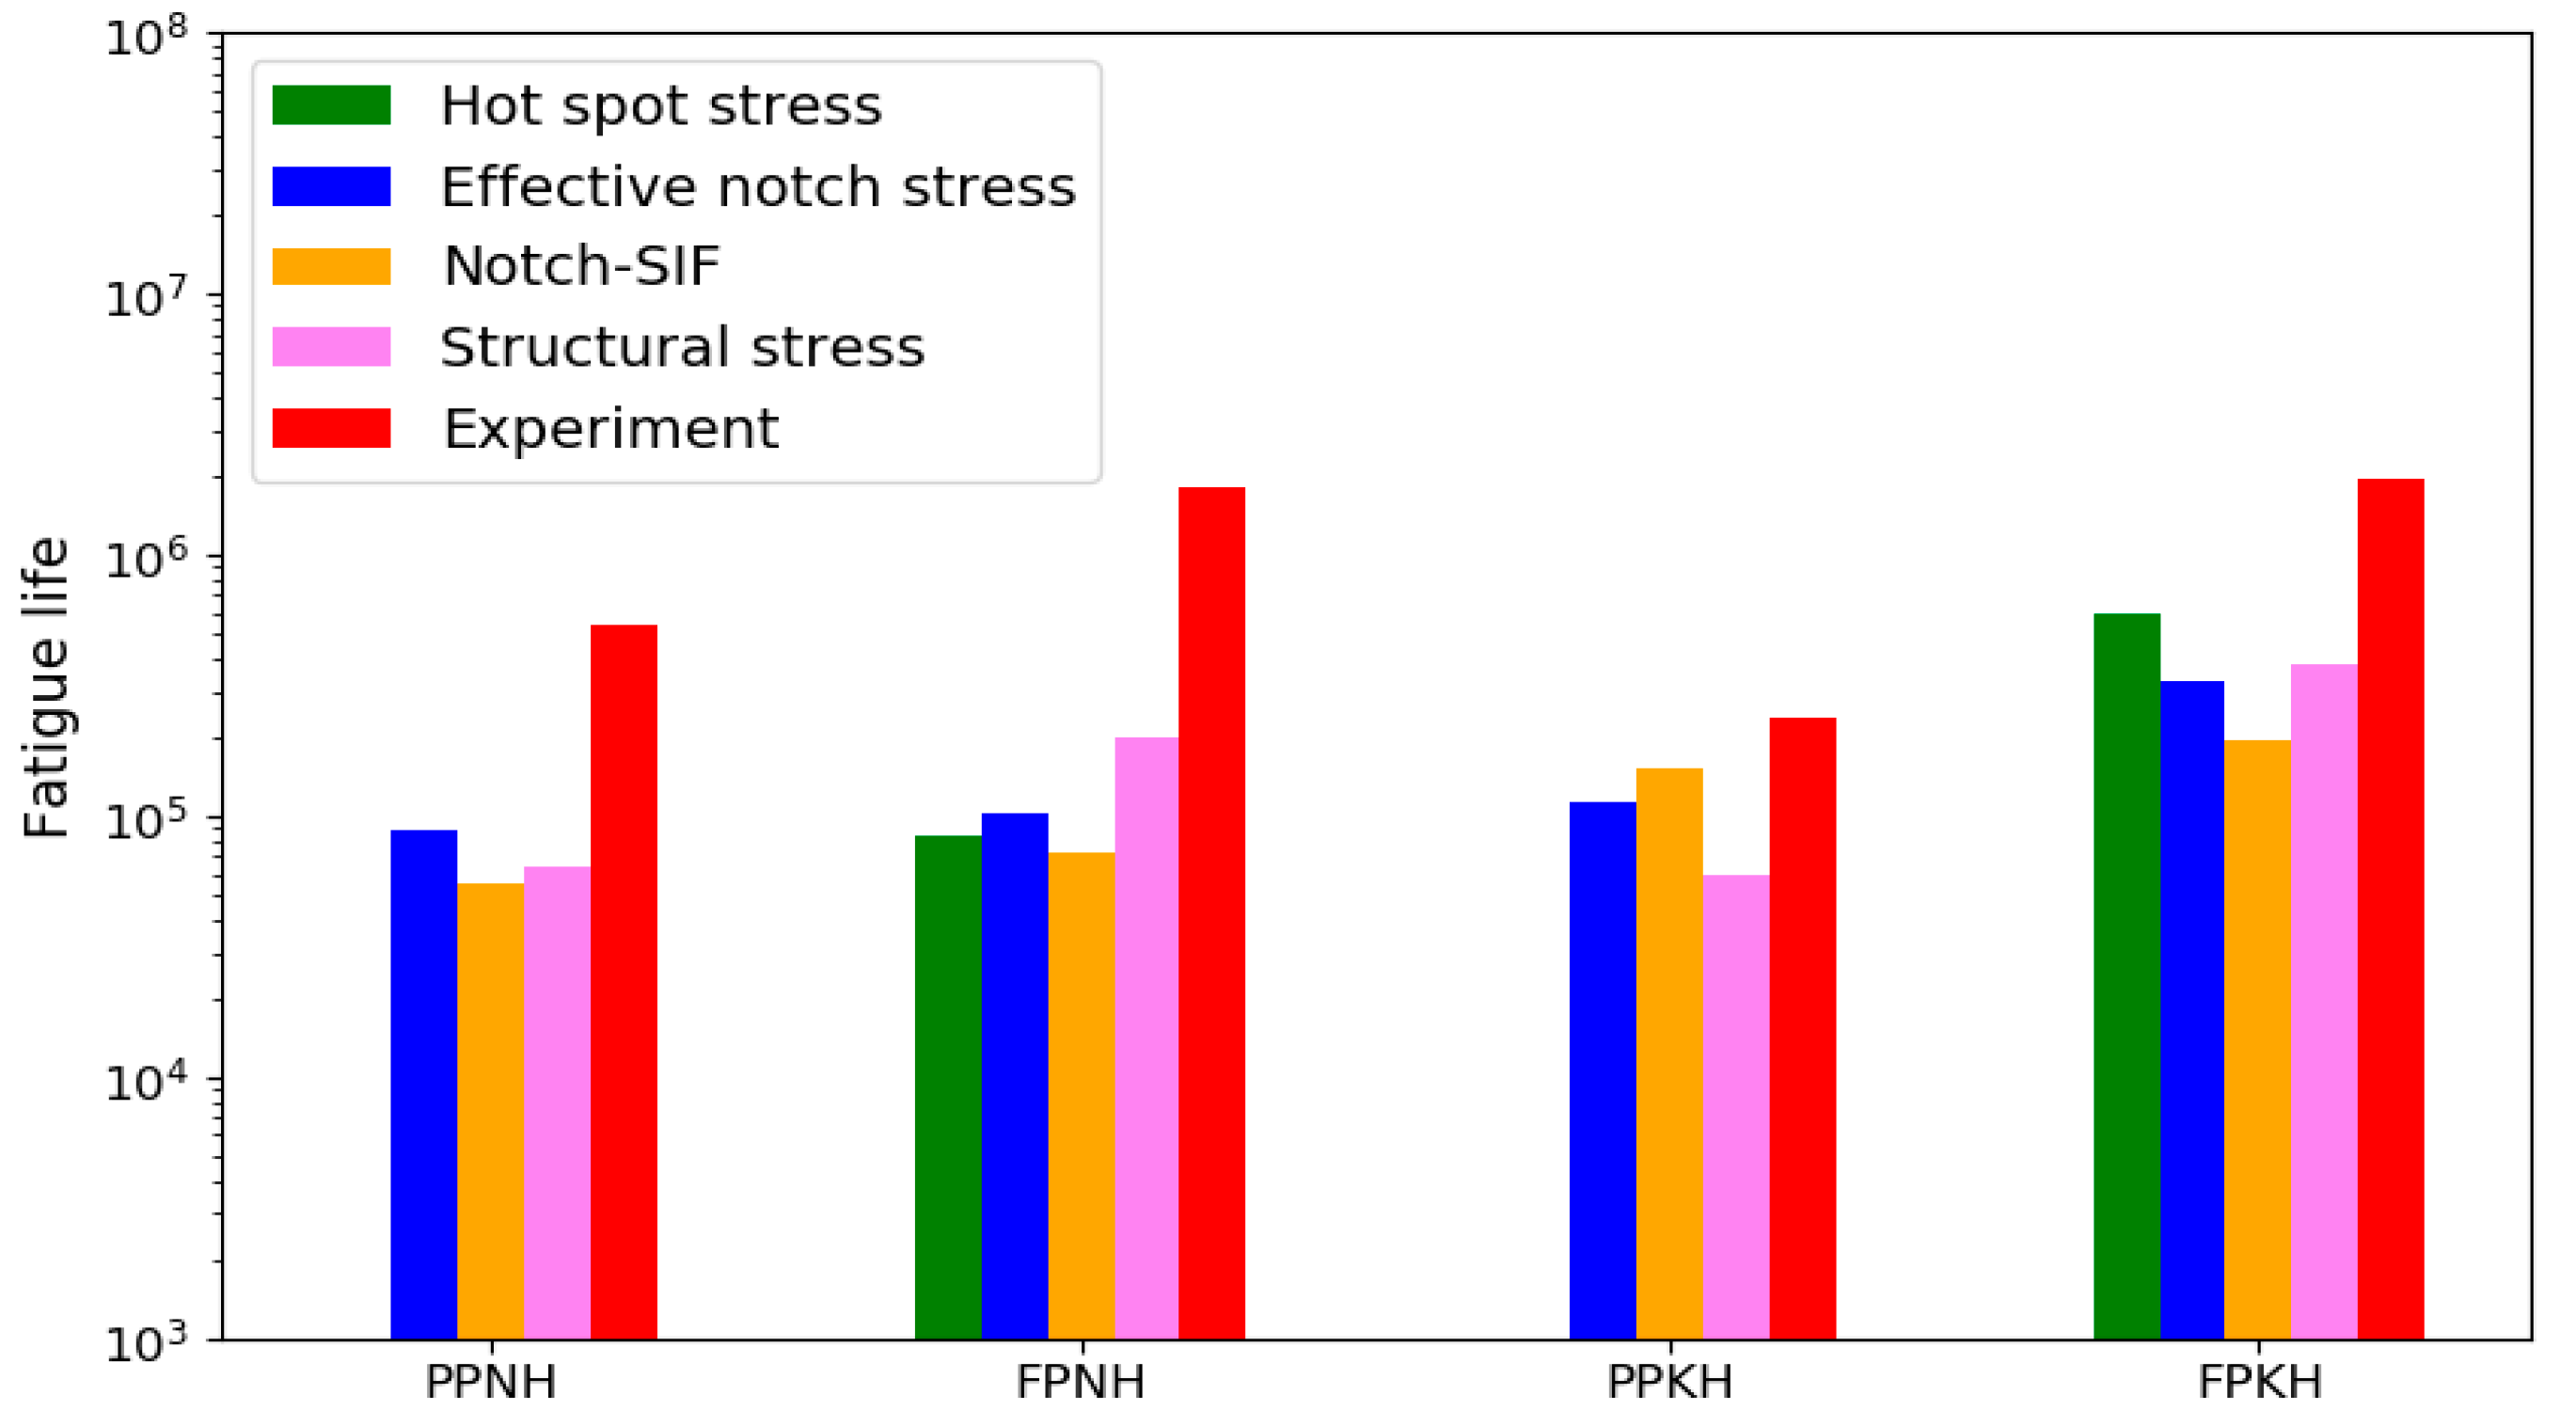
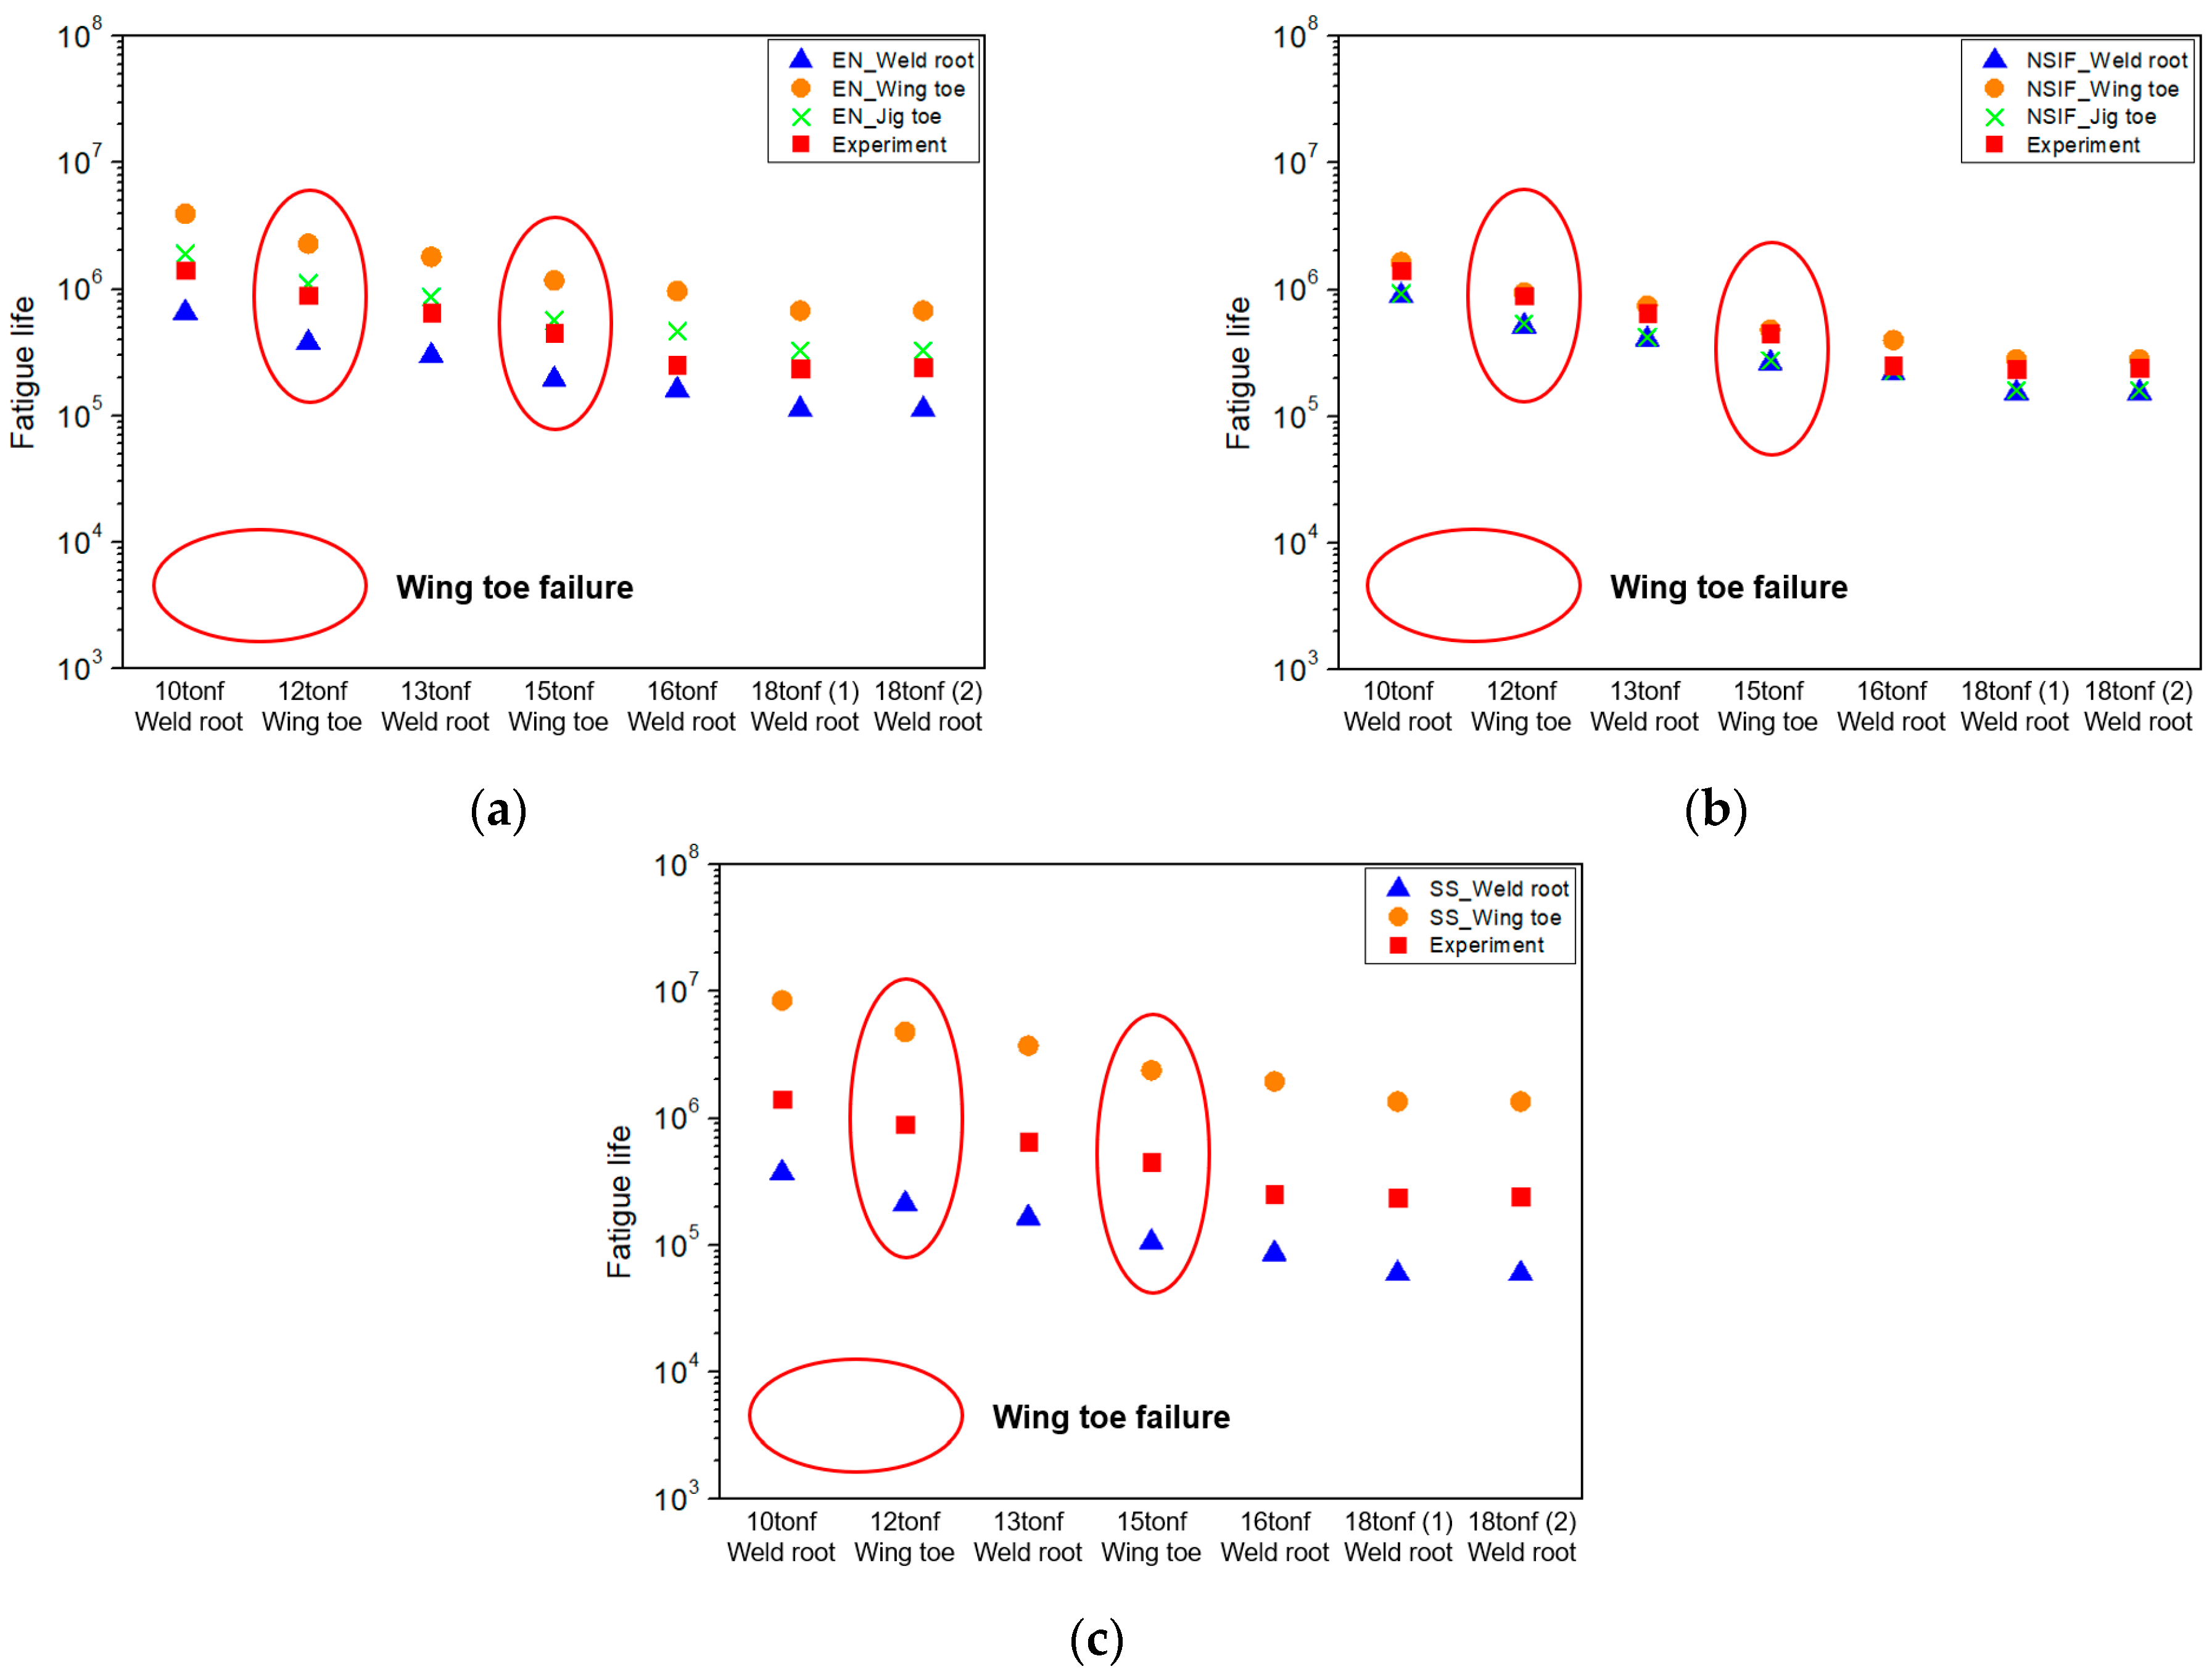
  • In all cases, the predicted fatigue life was lower than the experimental results. This indicates that local stress approaches provide a conservative result.
  • The hot spot stress approach offers the advantage of relatively simple application and is suitable for estimating fatigue at weld toes. However, it has the limitation that it cannot be used to assess the fatigue strength of the weld root, which is critical for structural integrity but cannot be visually inspected. This limitation highlights the need for further studies focusing on root-side fatigue evaluation.
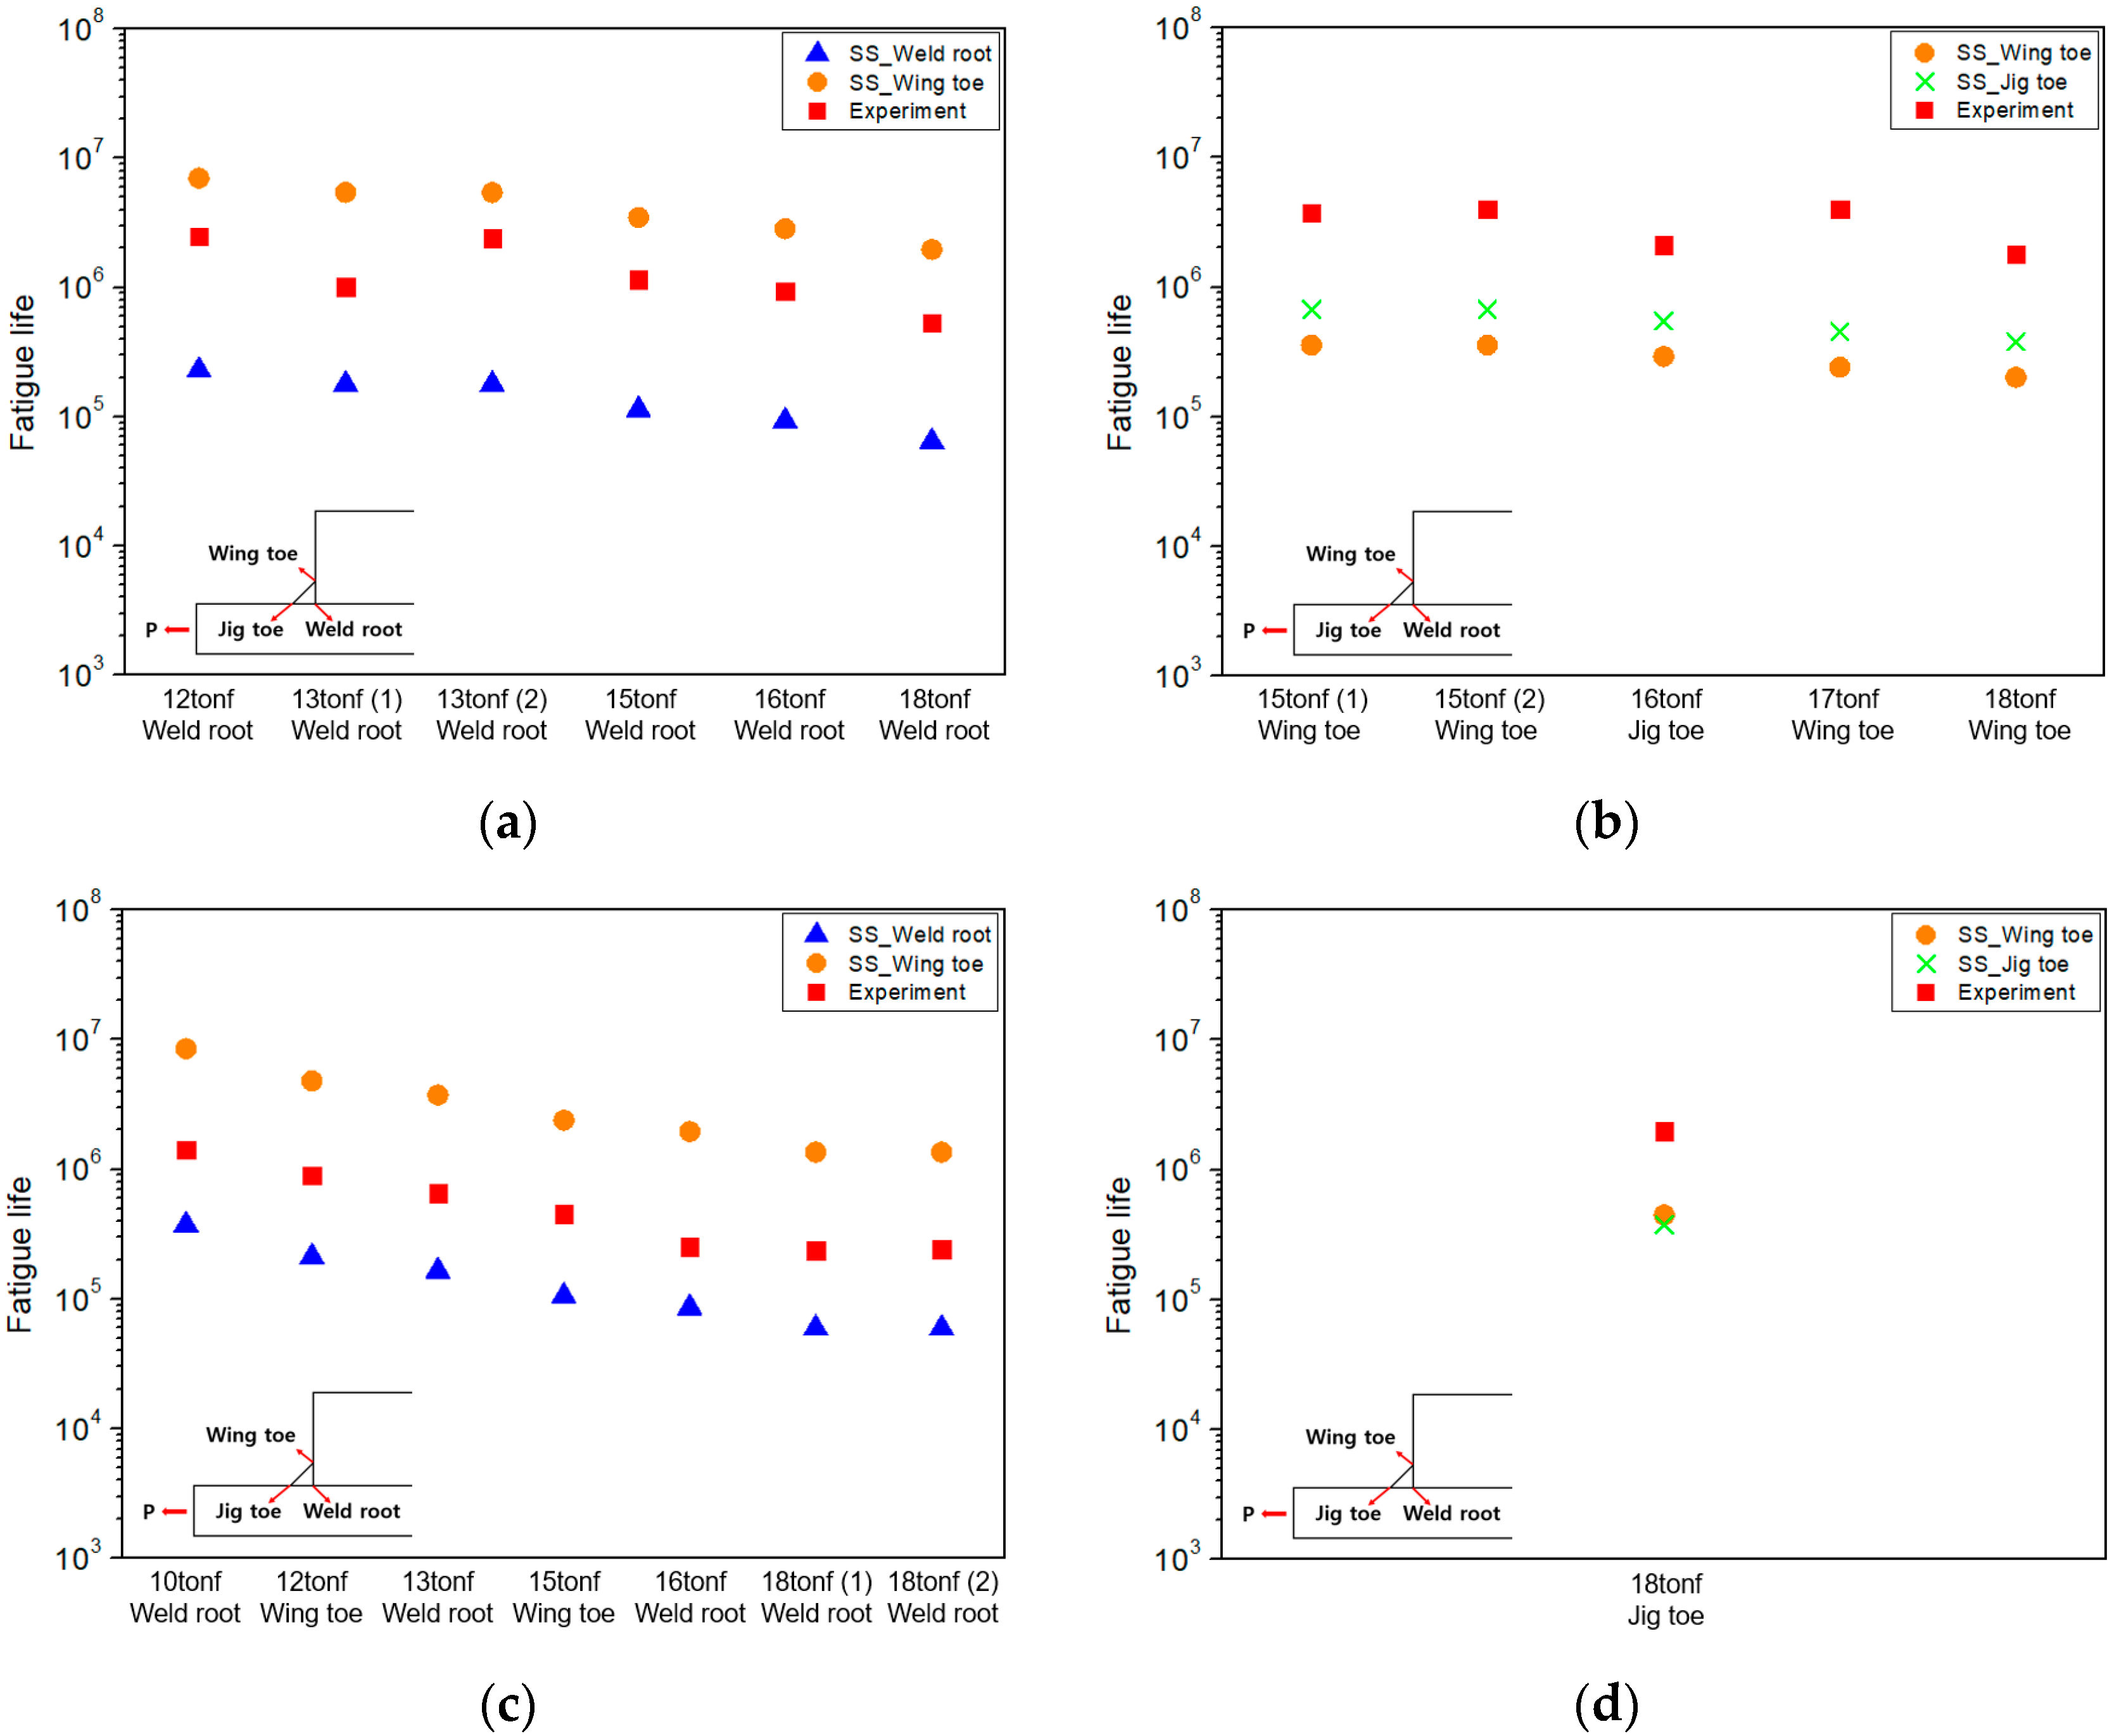
  • The effective notch stress approach and the structural stress approach accurately predicted the primary failure locations observed in the experiments. However, in the PPKH model, failure also occurred at the wing toe under certain conditions. Nevertheless, the predicted fatigue life at that wing toe were all longer than the experimental results, and thus failure at the wing toe could not be predicted.
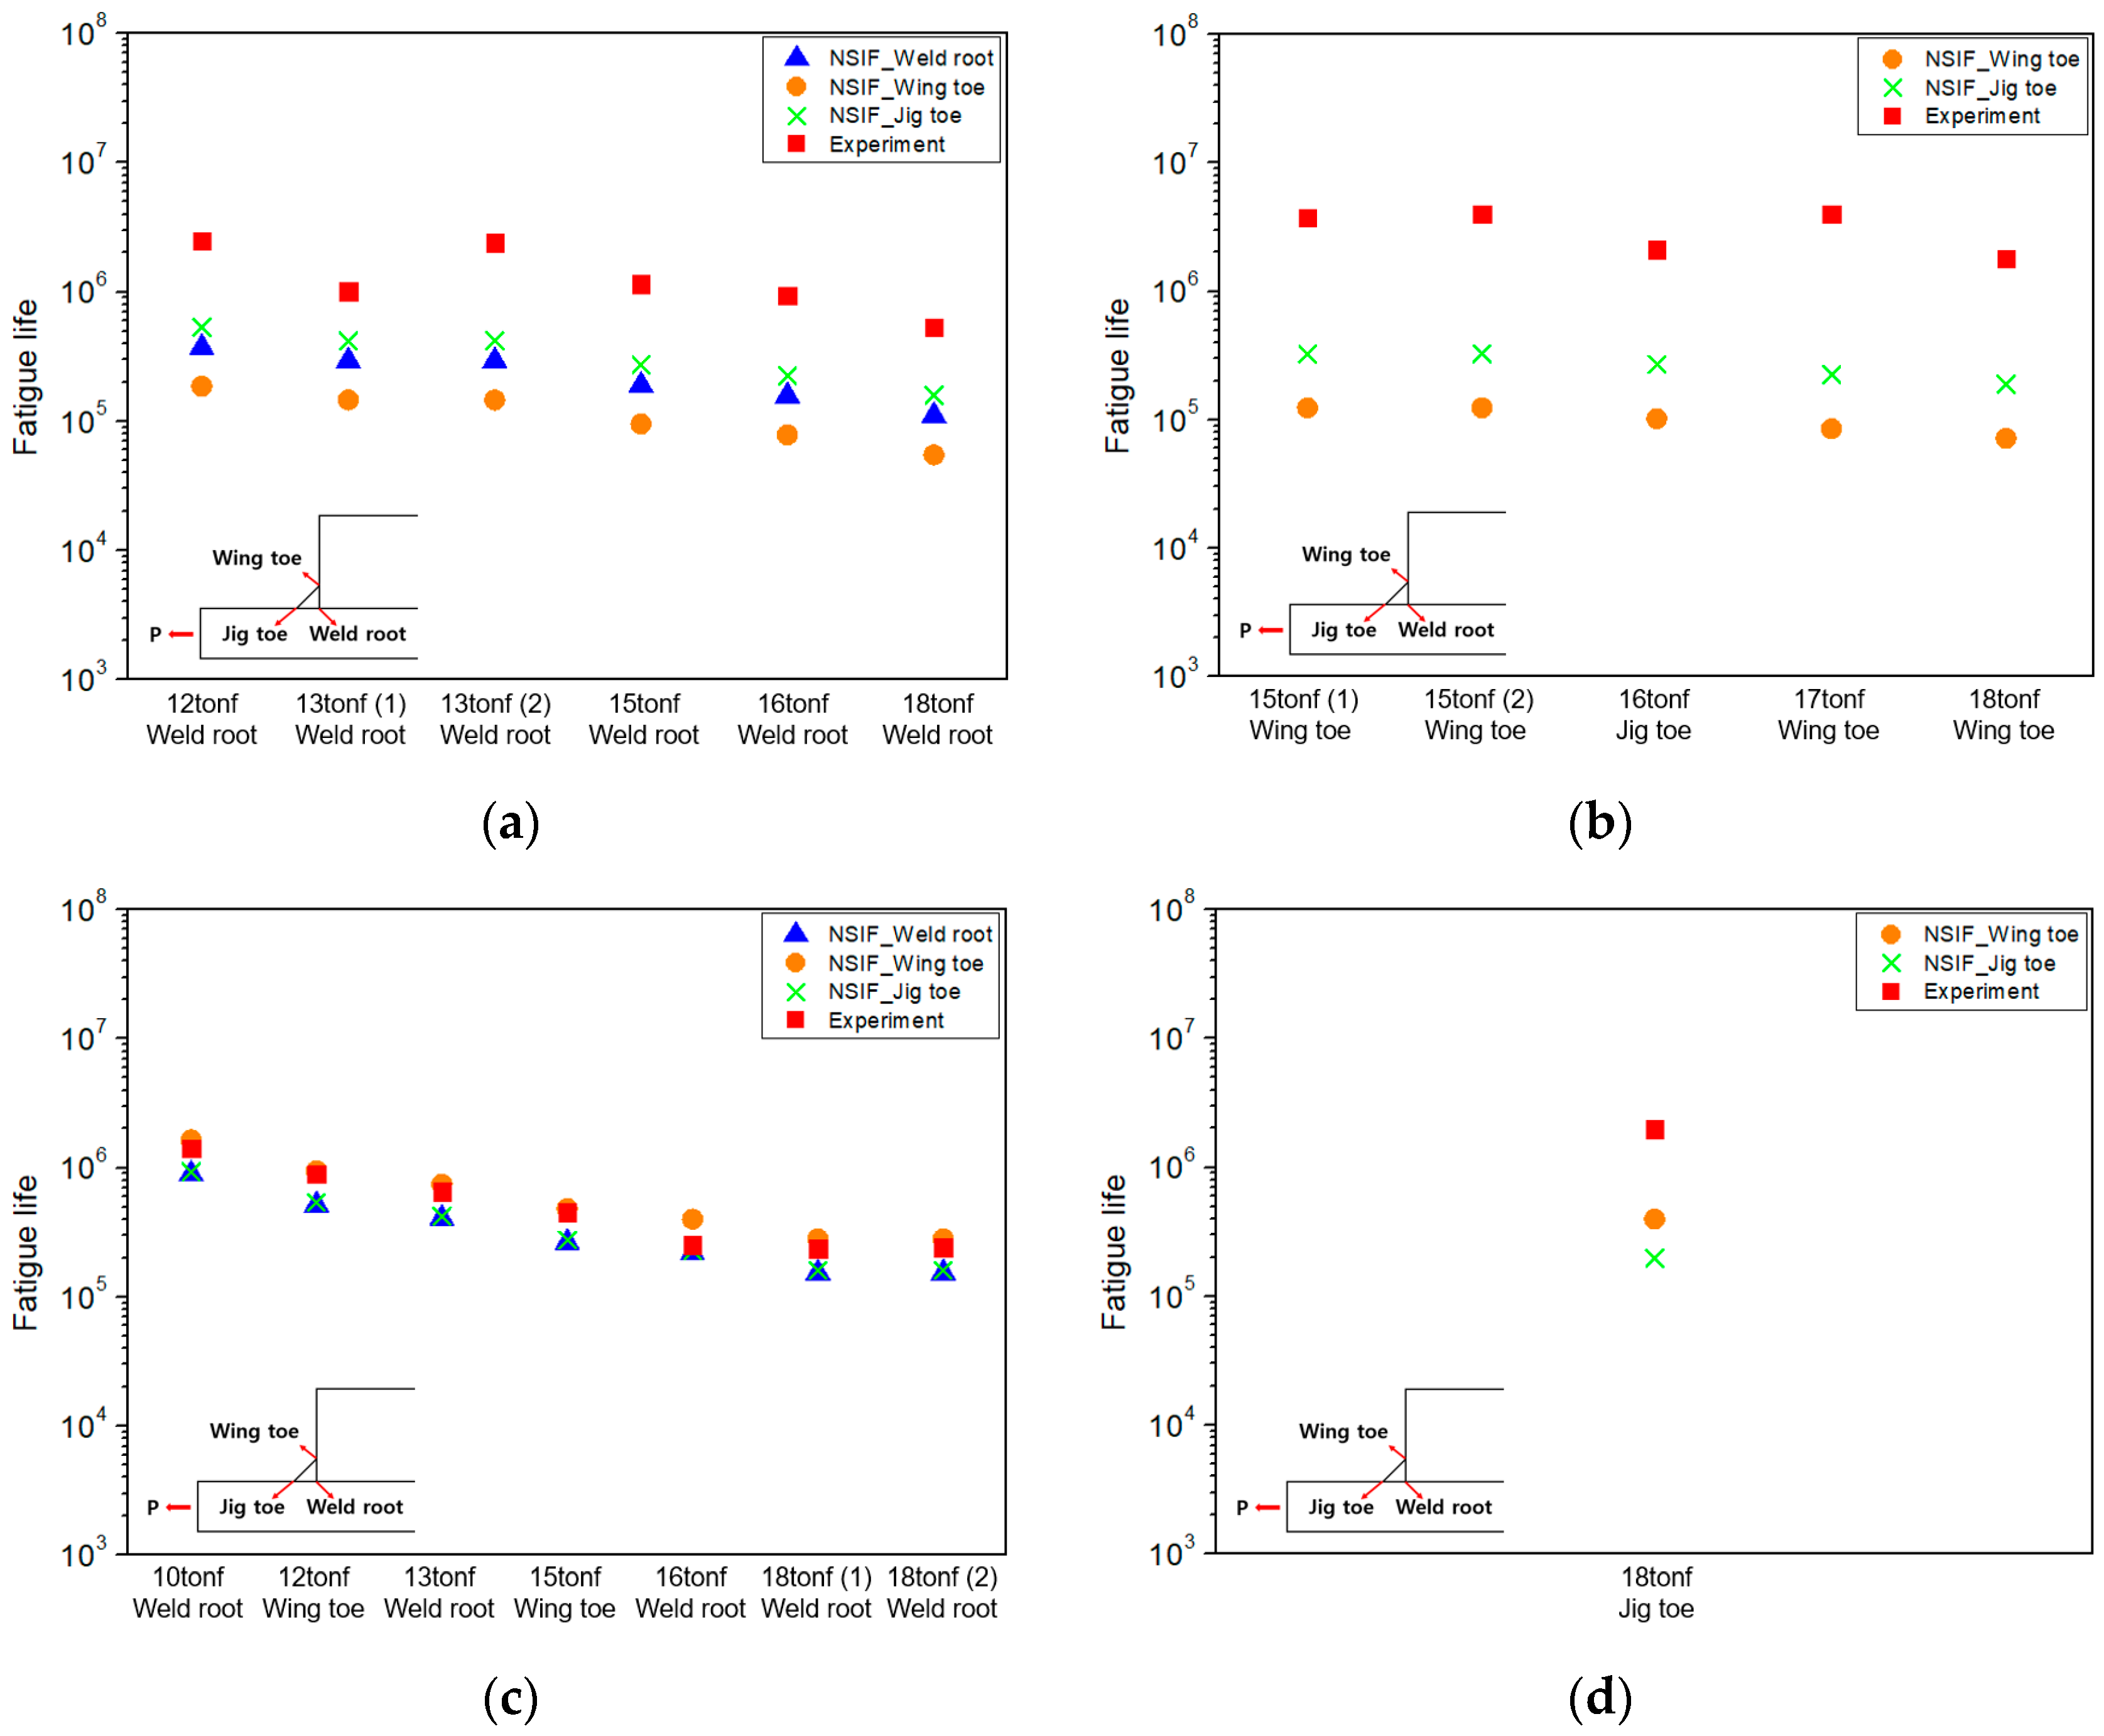
  • Among the methods, only the notch stress intensity factor approach was able to predict failure at the wing toe in the PPKH model. The predicted fatigue life at this location was close to the experimental results, suggesting that this method is more suitable for assessing complex weld details despite potentially higher computational effort.
  • Although the notch stress intensity factor approach demonstrates the highest predictive accuracy for the PPKH model, fatigue assessment requires a balance between accuracy, computational efficiency, and practical applicability. In cases where fatigue failure occurs exclusively at the weld toe, such as full penetration conditions, the hot spot stress approach offers an efficient and practical solution. However, when fatigue failure can occur at both the weld toe and weld root, such as partial penetration conditions, the effective notch stress approach provides the most balanced selection. Although it did not capture the exceptional wing toe failure observed in the PPKH model, it successfully predicted the primary failure locations and showed good agreement with the experimental fatigue life, making it a reliable and efficient method for fatigue assessment.

Author Contributions

Conceptualization, J.S.L. and M.H.K.; methodology, J.H.K. and J.S.L.; validation, J.H.K. and J.S.L.; formal analysis, J.S.L.; investigation, J.H.K.; data curation, J.S.L.; writing—original draft preparation, J.H.K. and J.S.L.; writing—review and editing, J.H.K. and M.H.K.; visualization, J.H.K. and J.S.L.; supervision, M.H.K.; project administration, M.H.K. All authors have read and agreed to the published version of the manuscript.

Funding

This research received no external funding.

Data Availability Statement

The data presented in this study is available on request from the corresponding author.

Acknowledgments

This work was supported by Korean Government (MOTIE) through Korea Evaluation Institute of Industrial Technology (KEIT) grant (No. RS-2023-00247726), which was managed by the GCRC-SOP (Global Core Research Center for Ships and Offshore Plants).

Conflicts of Interest

The authors declare that they have no known competing financial interests or relationships that could have appeared to influence the work reported in this paper.

References

  1. Silva, C.A.; Suarez, B.J.C.; Herreros, S.M.A. Effect of local cut-out on fatigue strength assessment in ship structures. Int. J. Naval Arch. Ocean Eng. 2023, 15, 100508. [Google Scholar] [CrossRef]
  2. Ahola, A.; Lipiainen, K.; Lindroos, J.; Koskimaki, M.; Laukia, K.; Bjork, T. On the Fatigue Strength of Welded High-Strength Steel Joints in the As-Welded, Post-Weld-Treated and Repaired Conditions in a Typical Ship Structural Detail. J. Mar. Sci. Eng. 2023, 11, 644. [Google Scholar] [CrossRef]
  3. Parunov, J.; Corak, M.; Gilja, I. Calculated and prescribed stress concentration factors of ship side longitudinal connections. Eng. Struct. 2013, 52, 629–641. [Google Scholar] [CrossRef]
  4. Fajri, A.; Prabowo, A.R.; Muhayat, N. Assessment of ship structure under fatigue loading: FE benchmarking and extended performance analysis. Curved Later. Struct. 2022, 9, 163–186. [Google Scholar] [CrossRef]
  5. Fricek, W.; Remes, H.; Feltz, O.; Lillemae, I.; Tchuindjang, D.; Reinert, T.; Nevierov, A.; Sishermann, W.; Brinkmann, M.; Kontkanen, T.; et al. Fatigue strength of laser-welded thin-plate ship structures based on nominal and structural hot-spot stress approach. Ships Offshore Struct. 2015, 10, 39–44. [Google Scholar]
  6. Braun, M.; Milakovic, A.S.; Renken, F.; Fricke, W.; Ehlers, S. Application of local approaches to the assessment of fatigue test results obtained for welded joints at sub-zero temperatures. Int. J. Fatigue 2020, 138, 105672. [Google Scholar] [CrossRef]
  7. Kodvanj, J.; Garbatov, Y.; Guedes, S.C.; Parunov, J. Numerical Analysis of Stress Concentration in Non-uniformly Corroded Small-Scale Specimens. J. Mar. Sci. Appl. 2020, 20, 1–9. [Google Scholar] [CrossRef]
  8. Fricke, W. IIW guideline for the assessment of weld root fatigue. Weld. World 2013, 57, 753–791. [Google Scholar] [CrossRef]
  9. Fricke, W. Fatigue and Fracture of Ship Structures. In Encyclopedia of Maritime and Offshore Engineering; John Wiley & Sons, Ltd.: Hoboken, NJ, USA, 2017. [Google Scholar]
  10. Dong, Y.; Garbatov, Y.; Guedes, S.C. Recent Developments in Fatigue Assessment of Ships and Offshores Structures. J. Mar. Sci. Appl. 2022, 21, 3–25. [Google Scholar] [CrossRef]
  11. Niemi, E.; Fricke, W.; Maddox, J.S. The Structural Hot-Spot Stress Approach to Fatigue. In Structural Hot-Spot Stress Approach to Fatigue Analysis of Welded Components, 2nd ed.; IIW International Institute of Welding, ZI Paris Nord II; Springer Nature Singapore Pte Ltd.: Singapore, 2018; pp. 5–12. [Google Scholar]
  12. Hobbacher, A. Fatigue actions. In Recommendations for Fatigue Design of Welded Joints and Components; International Institute of Welding: Paris, France, 2008. [Google Scholar]
  13. Lazzarin, P.; Berto, F.; Gomez, F.J.; Zappalorto, M. Some advantages derived from the use of the strain energy density over a control volume in fatigue strength assessments of welded joints. Int. J. Fatigue 2007, 30, 1345–1357. [Google Scholar] [CrossRef]
  14. Fischer, C.; Feltz, O.; Fricke, W.; Lazzarin, P. Application of the notch stress intensity and crack propagation approaches to weld toe and root fatigue. Weld. World 2011, 55, 30–39. [Google Scholar] [CrossRef]
  15. Dong, P. A structural stress definition and numerical implementation for fatigue analysis of welded joints. Int. J. Fatigue 2001, 23, 865–876. [Google Scholar] [CrossRef]
  16. Kim, M.H.; Kim, S.M.; Kim, Y.N.; Kim, S.G.; Lee, K.E.; Kim, G.R. A comparative study for the fatigue assessment of a ship structure by use of hot spot stress and structural stress approaches. Ocean Eng. 2009, 36, 1067–1072. [Google Scholar] [CrossRef]
  17. Kim, M.H.; Kang, S.W.; Kim, J.H.; Kim, K.S.; Kang, J.K.; Heo, J.H. An experimental study on the fatigue strength assessment of longi-web connections in ship structures using structural stress. Int. J. Fatigue 2010, 32, 318–329. [Google Scholar] [CrossRef]
Figure 1. Schematic of hot spot stress approach. Adapted from [11] with permission from IIW/2018.
Jmse 13 01491 g001
Figure 2. Type of hot spot stress. Adapted from [11] with permission from IIW/2018.
Jmse 13 01491 g002
Figure 3. Schematic of effective notch stress approach. Adapted from [12] with permission from IIW/2008.
Jmse 13 01491 g003
Figure 4. Schematic of notch stress intensity factor approach [13].
Jmse 13 01491 g004
Figure 5. Line force and line moment from nodal forces and nodal moments. Reproduced from [16] with permission from Kim/2009.
Jmse 13 01491 g005
Figure 6. Longi-web connection in hull structure. Reproduced from [17] with permission from Kim/2010.
Jmse 13 01491 g006
Figure 7. Schematic of test jig and specimen. Reproduced from [17] with permission from Kim/2010.
Jmse 13 01491 g007
Figure 8. Schematic of test models. Reproduced from [17] with permission from Kim/2010.
Jmse 13 01491 g008
Figure 9. Fatigue test results.
Jmse 13 01491 g009
Figure 10. Boundary conditions of finite element analysis.
Jmse 13 01491 g010
Figure 11. FE models for hot spot stress: (a) NH model for hot spot stress; (b) KH model for hot spot stress.
Jmse 13 01491 g011
Figure 12. S-N curves using the hot spot stress approach.
Jmse 13 01491 g012
Figure 13. Estimated fatigue life of each location by hot spot stress: (a) FPNH; (b) FPKH.
Jmse 13 01491 g013
Figure 14. FE model for effective notch stress approach.
Jmse 13 01491 g014
Figure 15. S-N curve by effective notch stress approach.
Jmse 13 01491 g015
Figure 16. Estimated fatigue life of each location by effective notch stress: (a) PPNH; (b) FPNH; (c) PPKH; (d) FPKH.
Jmse 13 01491 g016
Figure 17. FE model for notch stress intensity factor approach.
Jmse 13 01491 g017
Figure 18. S-N curve using the notch stress intensity factor approach.
Jmse 13 01491 g018
Figure 19. Estimated fatigue life of each location by notch stress intensity factor: (a) PPNH; (b) FPNH; (c) PPKH; (d) FPKH.
Jmse 13 01491 g019
Figure 20. S-N curve by structural stress approach.
Jmse 13 01491 g020
Figure 21. Estimated fatigue life of each location by structural stress: (a) PPNH; (b) FPNH; (c) PPKH; (d) FPKH.
Jmse 13 01491 g021
Figure 22. Comparison of local stress approach results and experimental data under a load of 18 tonf.
Jmse 13 01491 g022
Figure 23. Strain energy density results under a load of 18 tonf: (a) wing toe; (b) weld root.
Jmse 13 01491 g023
Figure 24. Von-mises stress distribution of weld root in PPNH model.
Jmse 13 01491 g024
Figure 25. Estimated fatigue life of each location in PPKH model: (a) effective notch stress approach; (b) notch stress intensity factor; (c) structural stress approach.
Jmse 13 01491 g025
Table 1. Classification of test specimens.
PenetrationKeyholeExpected Failure
Location
PPNH (Partial Penetration without Keyhole)PartialWeld root
FPNH (Full Penetration without Keyhole)FullWing toe
PPKH (Partial Penetration with Keyhole)PartialWeld root
FPKH (Full Penetration with Keyhole)FullJig toe
Table 2. The ratio between estimated fatigue life by local stress approaches and fatigue test results under a load of 18 tonf.
Hot Spot StressEffective Notch StressStructural StressNotch-SIF
PPNH-0.1670.1200.103
FPNH0.0470.0570.1120.040
PPKH-0.470.250.65
FPKH0.310.1660.1920.099
Table 3. Main failure locations by fatigue test and predicted failure locations for each model.
Main Failure Location
by Experiment
Estimated Failure Location
Hot Spot StressEffective Notch StressStructural StressNotch-SIF
PPNHWeld root-Weld rootWing toeWeld root
FPNHWing toeWing toeWing toeWing toeWing toe
PPKHWeld root-Weld rootWeld rootWeld root
FPKHJig toeJig toeJig toeJig toeJig toe
Disclaimer/Publisher’s Note: The statements, opinions and data contained in all publications are solely those of the individual author(s) and contributor(s) and not of MDPI and/or the editor(s). MDPI and/or the editor(s) disclaim responsibility for any injury to people or property resulting from any ideas, methods, instructions or products referred to in the content.

