1. Introduction
Underwater object detection serves as a key technology in marine exploration and resource development, with extensive applications in marine archeology, seafloor mapping, maritime search and rescue, marine resource exploration, and national defense and security. Unlike terrestrial environments, optical equipment in underwater environments suffer from limited detection range and poor imaging quality due to light scattering and absorption. Sonar systems, however, possess strong underwater penetration capabilities and can effectively overcome these limitations, making them one of the primary methods for underwater target detection [
1]. By transmitting acoustic waves and receiving echoes to form images, sonar systems can acquire stable and reliable target information under complex aquatic conditions.
Acoustic imaging systems primarily include multibeam sonar, synthetic aperture sonar, and side-scan sonar [
2]. Multibeam sonar is commonly used for seafloor topographic mapping but offers relatively low spatial resolution [
3]. Synthetic aperture sonar provides high resolution, yet its system complexity and high cost present limitations. In contrast, side-scan sonar has emerged as a significant instrument for underwater target detection, owing to its simple system structure, convenient operation, moderate cost, and wide coverage. Side-scan sonar systems generate grayscale images reflecting seafloor topography and target characteristics by transmitting fan-shaped acoustic waves to both sides of the seafloor and receiving echo signals, providing intuitive visual information for target detection. Furthermore, side-scan sonar systems are easily deployable and suitable for various platforms, such as autonomous underwater vehicles and unmanned surface vehicles, further enhancing their flexibility and practicality in diverse applications. Consequently, studies on autonomous target detection utilizing side-scan sonar images have received extensive attention in recent years.
Early target detection in side-scan sonar images mainly depended on manual feature extraction and expert interpretation [
4]. Such methods typically involve three steps. First, regions of interest (ROIs) are derived from side-scan sonar images; subsequently, the ROIs undergo segmentation processing and feature extraction; finally, classifiers are employed for target classification and identification [
5]. However, this approach demands extremely high professional expertise and experience from interpreters, and is characterized by low efficiency and high subjectivity, making it difficult to meet the requirements for large-scale sonar data processing. Moreover, when unmanned platforms such as unmanned underwater vehicles serve as sonar carriers, manual target identification becomes impractical.
In recent years, deep learning techniques have made substantial advancements in the domain of image processing, spurring researchers to employ deep learning methods for sonar image target detection [
6,
7]. Steiniger noted in his review that even a small CNN with only four layers can outperform traditional methods in extracting features from sonar images, confirming the superiority of deep learning methods [
8].
Target detection approaches based on deep learning are primarily classified into two categories: two-stage detection methods and single-stage detection methods. In two-stage detection approaches, candidate regions are initially produced via a Region Proposal Network (RPN), after which the potential regions undergo classification and bounding box regression. Two-stage detection methods primarily include R-CNN [
9], Faster R-CNN [
10], and others. These methods achieve high detection accuracy, yet are plagued by high computational complexity and subpar real-time performance. Single-stage detection methods include SSD [
11], YOLO [
12], and others. These methods directly predict target categories and positions, eliminating the candidate region generation step, and offer advantages of high computational efficiency and fast inference speed. Early single-stage algorithms had certain limitations in small target detection. Nevertheless, the latest single-stage algorithms match or even surpass two-stage methods in both detection speed and accuracy [
13].
However, the characteristics of side-scan sonar images differ significantly from those of optical images, presenting three core technical challenges in target recognition, which constitute the main problems to be addressed in this study. First, there is the difficulty in feature extraction caused by image quality limitations. Side-scan sonar images are generally plagued by severe noise interference, low contrast, and blurred boundaries, making it difficult for traditional feature extraction methods to obtain effective target features. Second, there is the recognition complexity arising from target diversity and variations in observation angles. Underwater targets are diverse in type, with significant differences in geometric shapes and sizes, and their features vary considerably with observation angles, resulting in distinct acoustic characteristics of the same target under different angles. Finally, there is the high false detection rate induced by complex seafloor environments. The seafloor environment has complex topography and geomorphology, and the acoustic features of natural objects and artificial targets are similar, which easily leads to confusion. Existing methods lack effective mechanisms to improve the discriminative ability for difficult samples.
To address the three core issues mentioned above, this paper proposes an improved model based on the YOLOv11 architecture (ESL-YOLO), which is specifically designed for the characteristics of side-scan sonar images. The model seeks to enhance the precision and robustness of underwater target recognition from the following three aspects:
To tackle the problems of blurred boundaries and difficult feature extraction, an Edge Fusion Module (EFM) is designed and embedded into the C3k2 structure. By selecting key features highly correlated with targets from multi-scale edge information, the recognition capability for targets with blurred boundaries is enhanced.
To address target diversity and the difficulty in detecting small targets, a Self-Calibrated Dual Attention (SCDA) module is introduced in the network neck, integrating shallow detail information and deep semantic information through cross-layer feature fusion strategies to strengthen the model’s detection capability for small targets and complex-shaped targets.
To resolve the high false detection rate in complex environments, a Location Quality Estimator (LQE) is deployed in the detection head, utilizing statistical characteristics of bounding box distributions to quantify localization confidence, improving the model’s discriminative ability for difficult samples and effectively reducing false detection and missed detection rates.
Through detailed comparative experiments and ablation studies on public datasets, the proposed method demonstrates significant performance advantages over mainstream target detection algorithms.
2. Related Work
Currently, deep learning methods have been extensively employed in underwater target detection tasks utilizing sonar images, yielding notable outcomes. However, the core challenges mentioned earlier such as blurred image boundaries, target diversity, and complex seafloor environments continue to restrict the practicality of algorithms [
14,
15]. Existing studies mainly explore solutions from three aspects: optimization of feature extraction, multi-scale fusion, and improvement in localization accuracy.
To address the issues of blurred boundaries and difficult feature extraction in side-scan sonar images, multiple studies have focused on improving feature fusion mechanisms and attention design. Zhang et al. [
16] introduced the Compact Inverted Block (CIB) module into YOLOv8 to optimize the C2f structure, integrating large-kernel depthwise convolutions, which effectively expand the model’s receptive field, and incorporating a Partial Self-Attention (PSA) module at the backbone network’s tail to boost model efficiency. Experimental results showed a 2.76% improvement in accuracy. Wen et al. [
17] modified the YOLOv7 model by integrating Swin-Transformer to achieve dynamic attention and global modeling, utilizing the Convolutional Block Attention Module (CBAM) to strengthen feature representation, while introducing feature scaling factors to resolve the unpredictability of geometric attributes in sonar target features. Chen et al. [
18] introduced a dual attention mechanism based on YOLOv7, and Jiao et al. [
19] designed the Context Guided Block (CGB) module and integrated it into the YOLOv8n network to enhance the network’s capability for learning and representing image features. Lu et al. [
20] proposed the AquaYOLO model, substituting conventional convolutional layers with residual blocks in the backbone architecture to boost the model’s feature extraction prowess. Yu et al. [
21] integrated Transformer modules with YOLOv5 to obtain TR-YOLOv5, utilizing attention mechanisms to balance the accuracy and efficiency requirements of underwater target recognition. Zheng et al. [
22] proposed a framework based on ScEMA-YOLOv8, introducing the EMA attention mechanism and SPPFCSPC pooling module, effectively addressing issues caused by partial target blurring and feature information loss. Wang et al. [
23] designed the YOLO-SONAR model, integrating the Competitive Coordinate Attention Mechanism (CCAM) and Spatial Group Enhancement Attention Mechanism (SGEAM) to effectively capture semantic and spatial characteristics, while developing the Context Feature Extraction Module (CFEM) to enhance feature representation of small target regions through the integration multi-scale contextual cues. Yang et al. [
24] introduced SS-YOLO, which substitutes the complex convolutions in the C2f module with a Partial Convolution (PConv) and Pointwise Convolution (PWConv) combination. It integrates the Adaptive Scale Space Fusion (ASSF) module and an enhanced Multi-Head Self-Attention (MHSA) mechanism, achieving 92.4% mAP@0.5. However, single feature enhancement in either the spatial or channel dimension is the focus of most of these methods. With specialized processing for edge information lacking, it is difficult for them to effectively cope with the multi-scale variation characteristics of target boundaries in sonar images.
To tackle the hurdles of challenging small target detection and intense noise interference in side-scan sonar images, researchers primarily enhance detection performance by improving feature pyramid networks and strengthening small-scale feature representation. Ma et al. [
25] designed the BES-YOLO network, integrating the EMA mechanism into the YOLOv8 framework, while introducing a Bidirectional Feature Pyramid Network (BiFPN) and Shape_IoU loss function, which increased mAP@0.5 by 5.3% compared to the baseline YOLOv8n model. Li et al. [
26] proposed the YOLO-GE algorithm, which mitigates the impact of low image resolution through the incorporation of an image enhancement module, adds high-resolution feature layers to improve small target detection performance, and incorporates the GEBlock to capture long-range contextual information while suppressing noise in low-level feature layers. Zhang et al. [
27] added dedicated detection layers for small target detection, integrated two attention mechanisms, and reorganized network features based on the BiFPN structure. Zou et al. [
28] proposed the YOLOv11-SDC network, replacing the original SPPF module in YOLOv11 with a new Sparse Feature (SF) module and integrating Dilated Reparam Blocks (DRBs) to expand the model’s receptive domain, while adding a Content-Guided Attention Fusion (CGAF) module to allocate feature map weights, achieving 82.5% mAP@0.5. By introducing the Dynamic Selection Aggregation Module (DSAM) and Context-Aware Feature Selection (CAFS) into the neck network, Lu et al. [
20] achieved superior accuracy and robustness on the standard underwater sonar datasets UATD and Marine Debris, outperforming baseline models. Cui et al. [
29] proposed the SOCA-YOLO detection framework, performing image enhancement through the SwinIR super-resolution reconstruction network, combining the SPDConv module and CBAM attention mechanism to optimize small target feature extraction. On the Cylinder2 dataset, this method achieved improvements of 2.3% and 6.5% compared to YOLO11 and YOLOv9, respectively. Li et al. [
1] combined spatial pyramid pooling with online dataset preprocessing to optimize the YOLOv3 model, improving the network’s resource utilization efficiency and achieving improvements in evaluation metrics including mAP, Precision, and Recall. Although these methods have improved the performance of small target detection to a certain extent, the integration of shallow detail information and deep semantic information is often insufficient during cross-layer feature fusion, especially when dealing with targets of complex shapes.
To address the issue of high false detection rates caused by complex seafloor environments, existing studies primarily improve localization accuracy and discriminative ability by optimizing loss functions and refining regression strategies. Fu et al. [
30] put forward the AGD-YOLO model, which adopted MPDIoU as the loss function for bounding box regression. This model took into account overlapping areas, distances between center points, and discrepancies in width and height, thereby boosting both the efficiency and precision of bounding box regression, with its mAP@0.5:0.95 increasing by 2.6% compared to the second-ranked algorithm. Ma et al. [
25] introduced the Shape_IoU loss function, enhancing localization accuracy by considering target shape characteristics. Cao et al. [
31] proposed the MAL-YOLO algorithm, employing lightweight feature extraction modules with depthwise separable convolution and EMA modules, combined with asymptotic feature pyramid networks to improve multi-scale feature fusion and representation capabilities while using the MPDIoU loss function. Lu et al. [
32] replaced the traditional CIoU loss with the ShapeIou_NWD loss function in an improved YOLOv7, enabling the model to acquire a greater amount of feature information throughout the training phase and achieving 85.7% detection accuracy. Zheng et al. [
33] replaced the CIoU loss used in YOLOv8 with Efficient IoU loss, separating the influence factors of aspect ratios between predicted and ground truth boxes. Sun et al. [
34] introduced the WIoUv1 loss function based on a dual-layer attention mechanism in CCW-YOLOv5, effectively addressing the problem of excessive geometric metric penalties caused by inferior-quality training instances within forward-looking sonar images by constructing an attention mechanism based on distance measurement, significantly improving bounding box localization accuracy. Gu et al. [
35] combined the DETR architecture with Neural Architecture Search (NAS) mechanisms, introducing a content–position decoupled query initialization strategy and a hybrid loss function for multi-task optimization, significantly enhancing robustness in low-resolution and high-noise scenarios. However, these methods primarily focus on the geometric overlap of bounding boxes and fail to adequately consider the uncertainty in predicted box quality, lacking effective localization confidence assessment mechanisms and often deficient in targeted quality evaluation strategies when handling hard samples.
Based on the literature analysis above, it can be observed that existing research still exhibits gaps in key technical aspects, including specialized processing of edge information, adaptive feature fusion, and localization evaluation based on statistical characteristics of bounding box. To address these problems, the study puts forward the ESL-YOLO architecture, which forms a unified solution for target detection in side-scan sonar images through the collaborative design of three core modules.
3. Method
3.1. YOLOv11 Algorithm
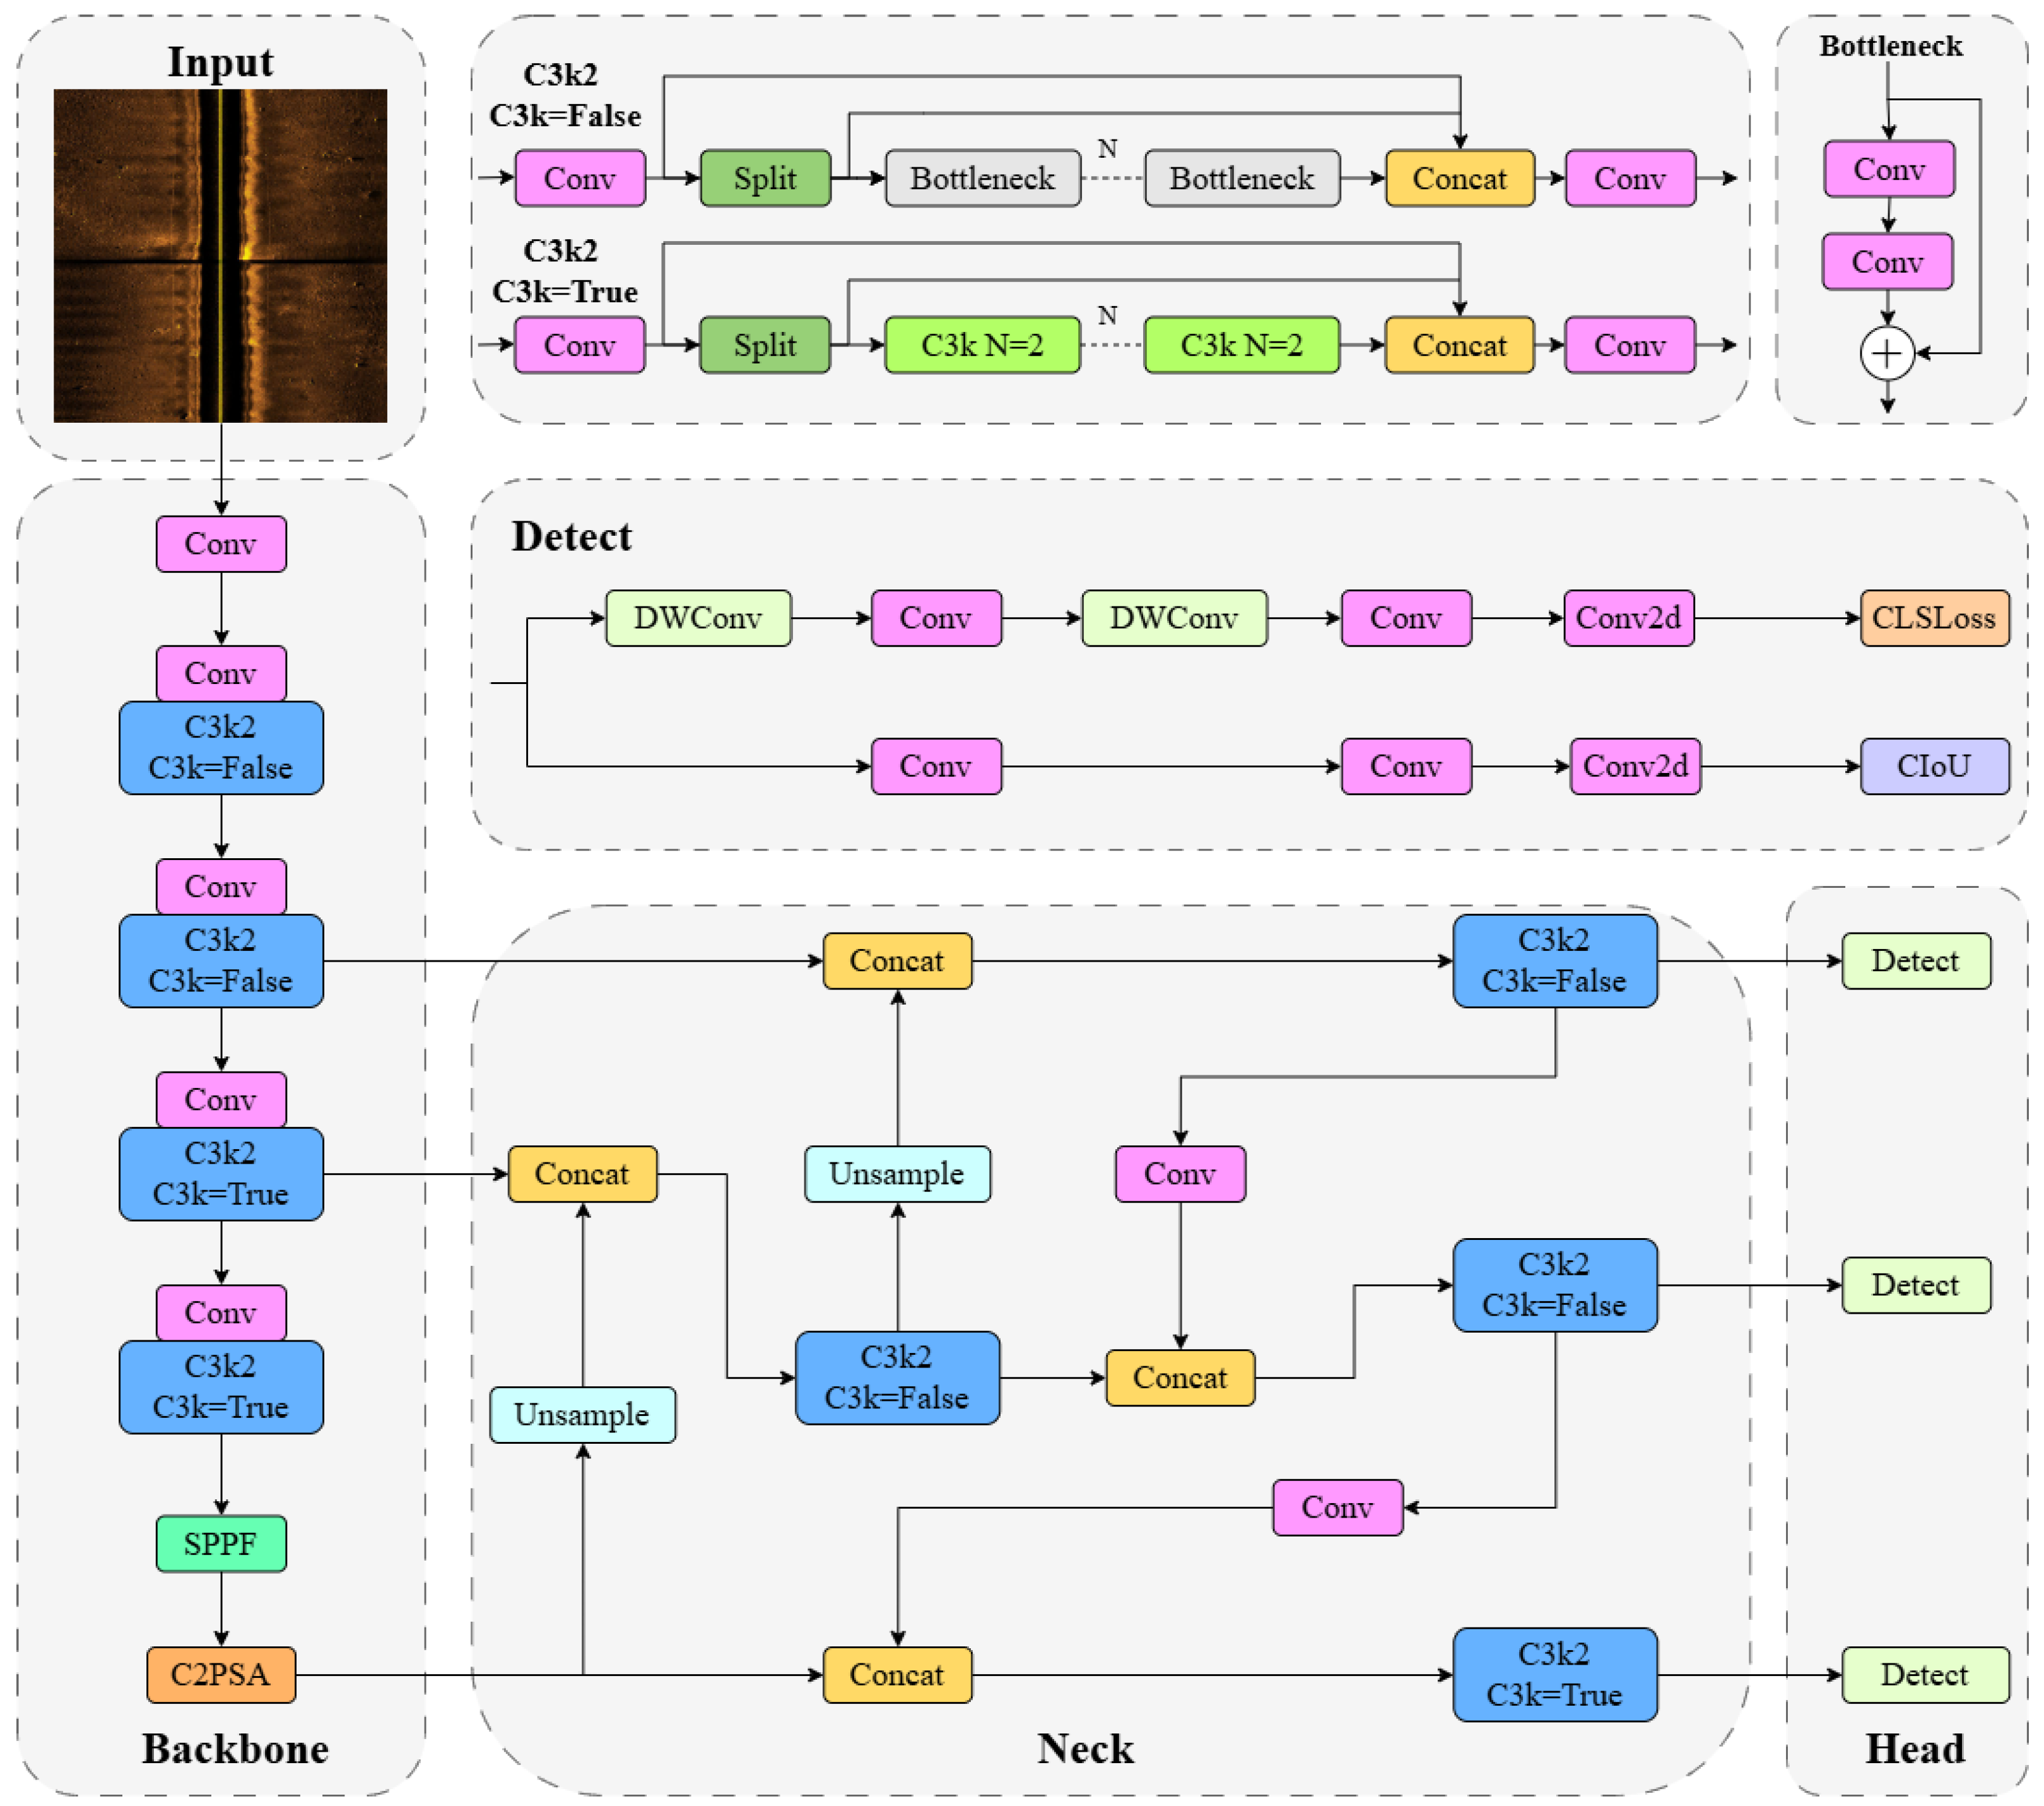
As a single-stage object detection algorithm released by Ultralytics in 2024, YOLOv11 adopts the classic three-stage architecture of Backbone–Neck–Head [
36]. The backbone network undertakes feature extraction, the neck network achieves multi-scale feature fusion, and the detection head accomplishes the ultimate object positioning and categorization.
Compared with the previous generation of detection models, YOLOv11 introduces the C2PSA module combined with a multi-head self-attention mechanism, which enhances the model’s ability to represent features in complex scenarios. It also proposes the C3k2 module to replace the traditional C2f structure. Through configurable multi-scale convolution kernels and channel splitting strategies, it enlarges the receptive field and enhances the efficiency of feature extraction. However, YOLOv11 still has room for improvement in sonar image processing: it lacks a specialized mechanism for edge information processing, the adaptability of its feature fusion strategy is insufficient, and its localization quality assessment lacks effective statistical characteristic analysis. Based on these technical characteristics and limitations, this paper conducts targeted improvements based on the YOLOv11 architecture. The overall framework of YOLOv11 is shown in
Figure 1.
3.2. Proposed ESL-YOLO Algorithm
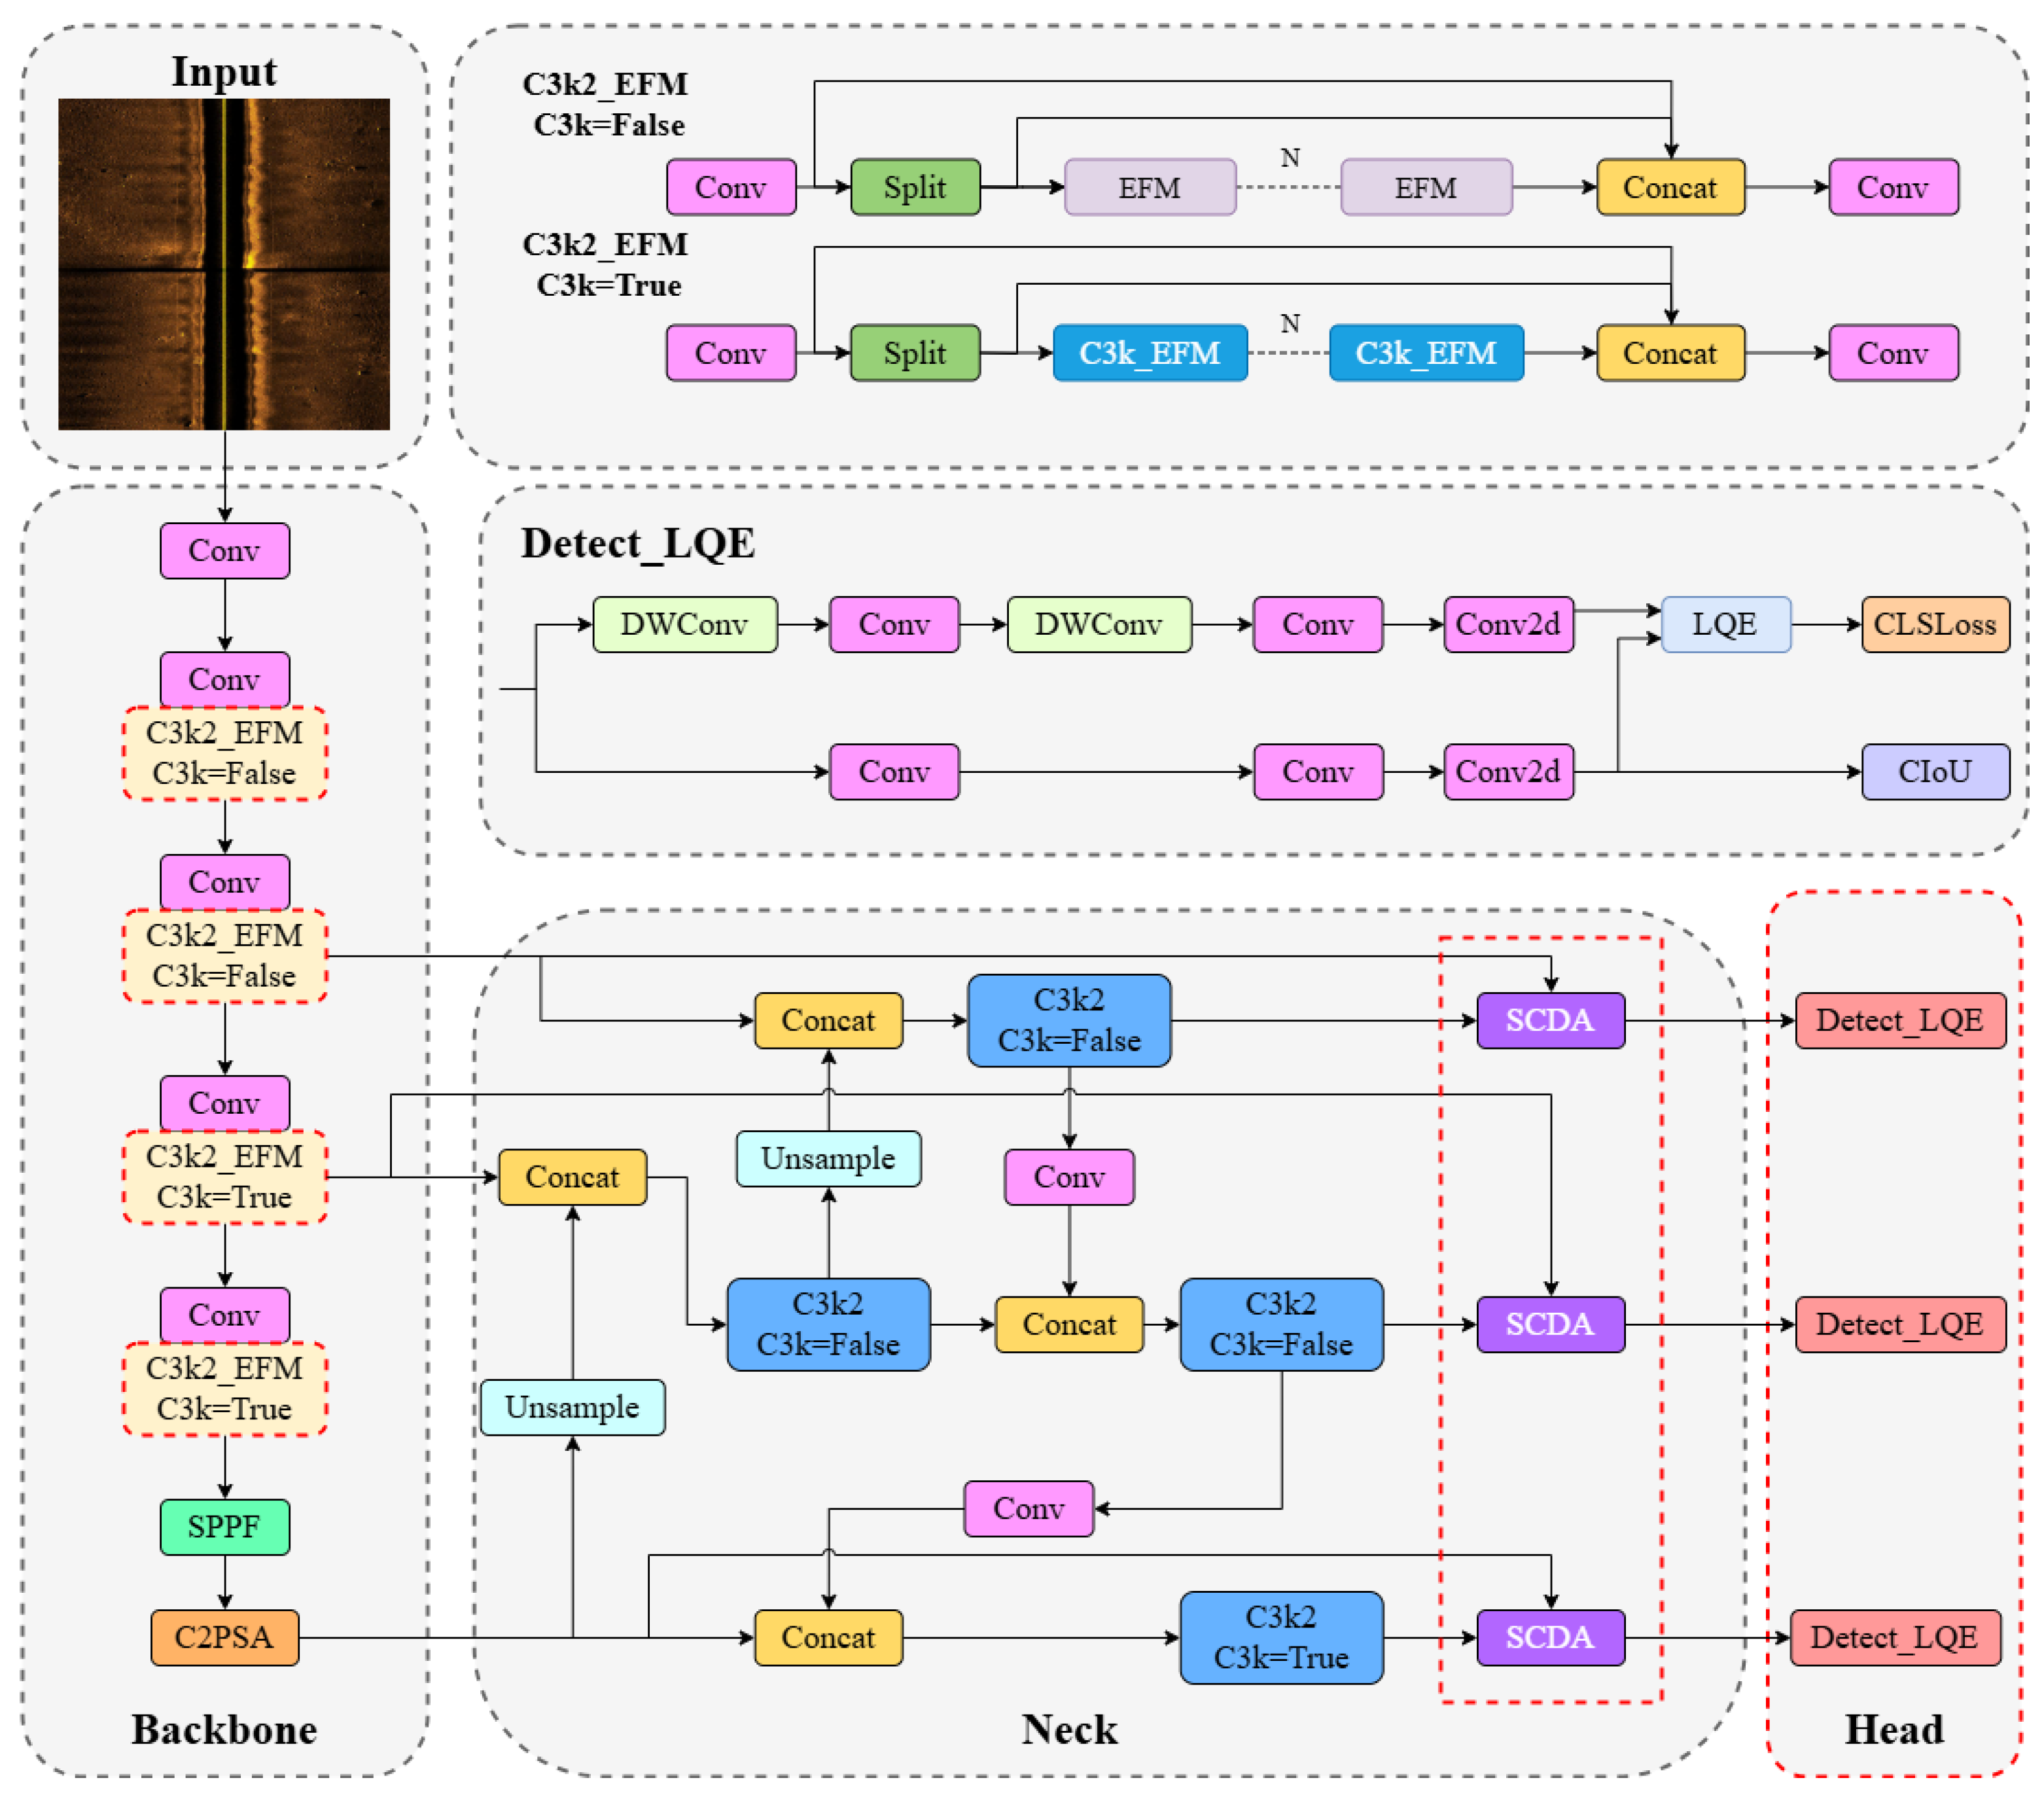
The proposed ESL-YOLO algorithm model improvements retain the characteristics of relatively low parameter count and computational cost inherent in YOLOv11, while markedly improving the model’s accuracy in recognizing small targets, as shown in
Figure 2. To begin with, the C3k2 modules within the YOLOv11 backbone were substituted with newly developed C3k2-EFM modules. This substitution strengthens the model’s ability to extract features and its effectiveness in capturing edge details. Furthermore, the neck structure was optimized through the integration of the SCDA module. By linking shallow detail data and deep semantic information from images, this module enriches the detail and structural content within feature representations. It particularly boosts detection performance for small targets as well as those with complex shapes. Finally, we incorporated a localization quality assessment mechanism in the detection head, which quantitatively evaluates localization quality by fully utilizing the statistical characteristics of bounding box distributions, enhancing the model’s capability to distinguish hard samples and effectively reduce false positives and false negatives.
3.3. C3k2 Improvement
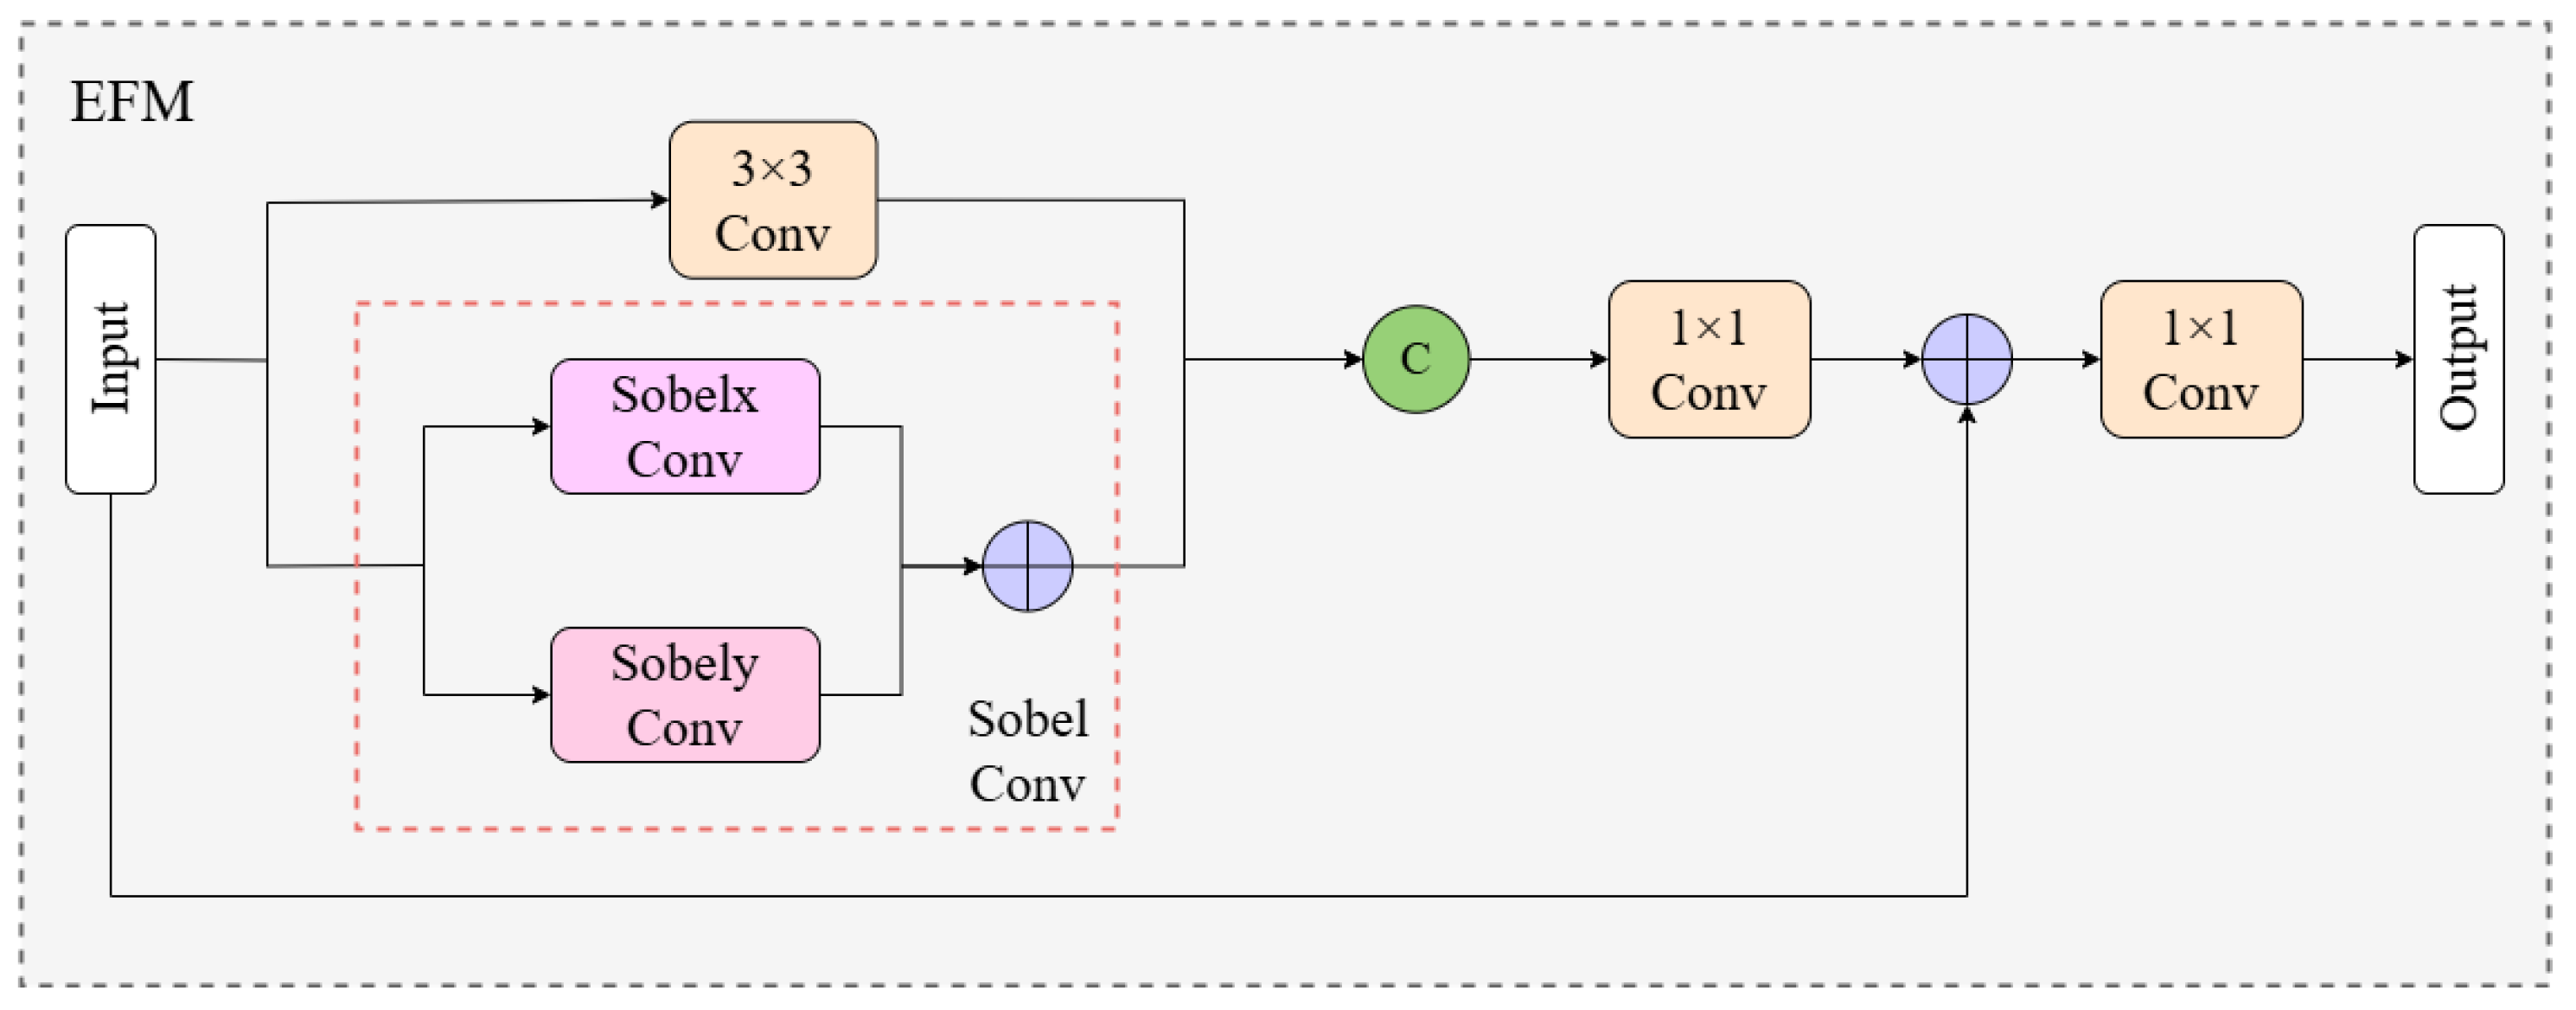
Blurred target boundaries in side-scan sonar images represent a key technical bottleneck restricting detection accuracy. Traditional convolutions used in current algorithms lack sensitivity to weak edge signals unique to underwater acoustic imaging, making it necessary to specifically enhance target edge features. Therefore, in this section, we introduce the designed Edge Fusion Module (EFM). By organically combining the classic Sobel edge detection operator with a deep learning architecture, it achieves specialized extraction and fusion of edge information.
The Sobel operator, as a classical edge detection algorithm, has gained recognition for its extensive use in the domain of image processing. This operator computes gradients of pixel intensities to effectively emphasize edge features in images. Traditional Sobel operators employ two 3 × 3 convolution kernels to calculate image gradients in horizontal and vertical directions, respectively, making this method particularly suitable for detecting targets with distinct boundaries. The horizontal and vertical gradient operators are defined as
and
, respectively, with their mathematical formulations given as follows:
This study integrates Sobel convolution kernels as fixed filters into three-dimensional depthwise separable convolution, creating the Sobel Convolution (Sobel Conv) module. This design reduces parameter training load while significantly enhancing edge information responsiveness. For an input image
I characterized by dimensions
, the application of the Sobel operator to each channel
C proceeds as follows:
In these formulations, and denote the resulting pixel intensities within the convolved feature map, while corresponds to either the original input image or the feature map generated by the preceding layer. The terms and represent the respective convolution kernels for horizontal and vertical edge detection, with P and Q indicating the kernel dimensions. The spatial coordinates specify the particular location within the output feature map.
For comprehensive edge detection, the Sobel convolution method integrates both horizontal and vertical gradient components. The resultant gradient magnitude, which captures complete edge information, is calculated as follows:
Based on Sobel Conv, we designed the Edge Fusion Module (EFM), as illustrated in
Figure 3. This module adopts a dual-branch parallel processing architecture to enhance edge information. Specifically, input features simultaneously enter two parallel branches: the Sobel Conv branch and the traditional convolution branch. The Sobel Conv branch utilizes Sobel operators to extract gradient information in horizontal and vertical directions, effectively capturing edge details in images; the traditional convolution branch extracts local spatial features through 3 × 3 convolution. The results from both branches are joined together along the channel dimension, forming rich feature representations containing edge information and texture features. Subsequently, the concatenated feature maps undergo channel dimension reduction through a 1 × 1 convolution layer, compressing the doubled channel count back to the original dimension while retaining diverse information and preventing excessive parameter increase. The processed features are incorporated into the original input through residual connections. This not only retains the original feature information but also facilitates effective gradient propagation, mitigating the issue of gradient vanishing in deep networks. Finally, another 1 × 1 convolution adjusts the output channel count to generate output features.
C3k2_EFM inherits the core design philosophy of C3k2, adopting a Cross Stage Partial architecture to reduce computational redundancy and improve feature reuse efficiency. The basic architecture of this module can be described as follows: input features first undergo channel expansion through 1 × 1 convolution, then are divided along the channel dimension to form two parallel feature processing paths. One path directly transmits features to maintain original information, while the other path undergoes feature enhancement through core processing modules. Finally, both paths are re-fused along the channel dimension and adjusted to the target output dimension through 1 × 1 convolution. When parameter C3k is set to False, C3k2_EFM adopts a basic enhancement strategy, directly replacing Bottleneck modules in the original C3k2 architecture with EFM modules. Under this configuration, the feature processing path consists of n serially connected EFM modules, with each EFM module independently performing edge information enhancement on input features. When parameter C3k is set to True, the system adopts a deep enhancement strategy, replacing C3k modules in the original C3k2 with C3k_EFM modules. The C3k_EFM modules internally contain multiple sequentially connected EFM modules, achieving multi-level progressive enhancement of edge information.
Through the above design, the EFM module enhances the capability of detecting edge information in side-scan sonar images. The specialized edge detection mechanism enables the model to extract and enhance edge features. The dual-branch architecture realizes the effective integration of edge features and spatial features, strengthening the ability to represent features of targets with blurred boundaries. Moreover, the configurable C3k2_EFM can adjust the level of edge information processing according to the complexity of the detection task, providing adaptive capability for different sonar image qualities.
3.4. Neck Improvement
The neck structure in YOLOv11 undertakes the task of integrating and strengthening multi-scale features derived from the backbone network, in turn boosting the model’s ability to detect targets across different scales. However, traditional feature fusion methods frequently encounter challenges in effectively differentiating artifact features produced by sediment coverage or acoustic wave diffraction. This issue is particularly pronounced when handling small targets in regions with low signal-to-noise ratios, where the hierarchical relationships among multi-scale features are vulnerable to high-frequency noise interference. Consequently, target contour information tends to diminish gradually during transmission through the feature pyramid. This phenomenon directly leads to increased miss detection rates for weak reflection targets and complex terrain regions, severely constraining detection accuracy in underwater scenarios.
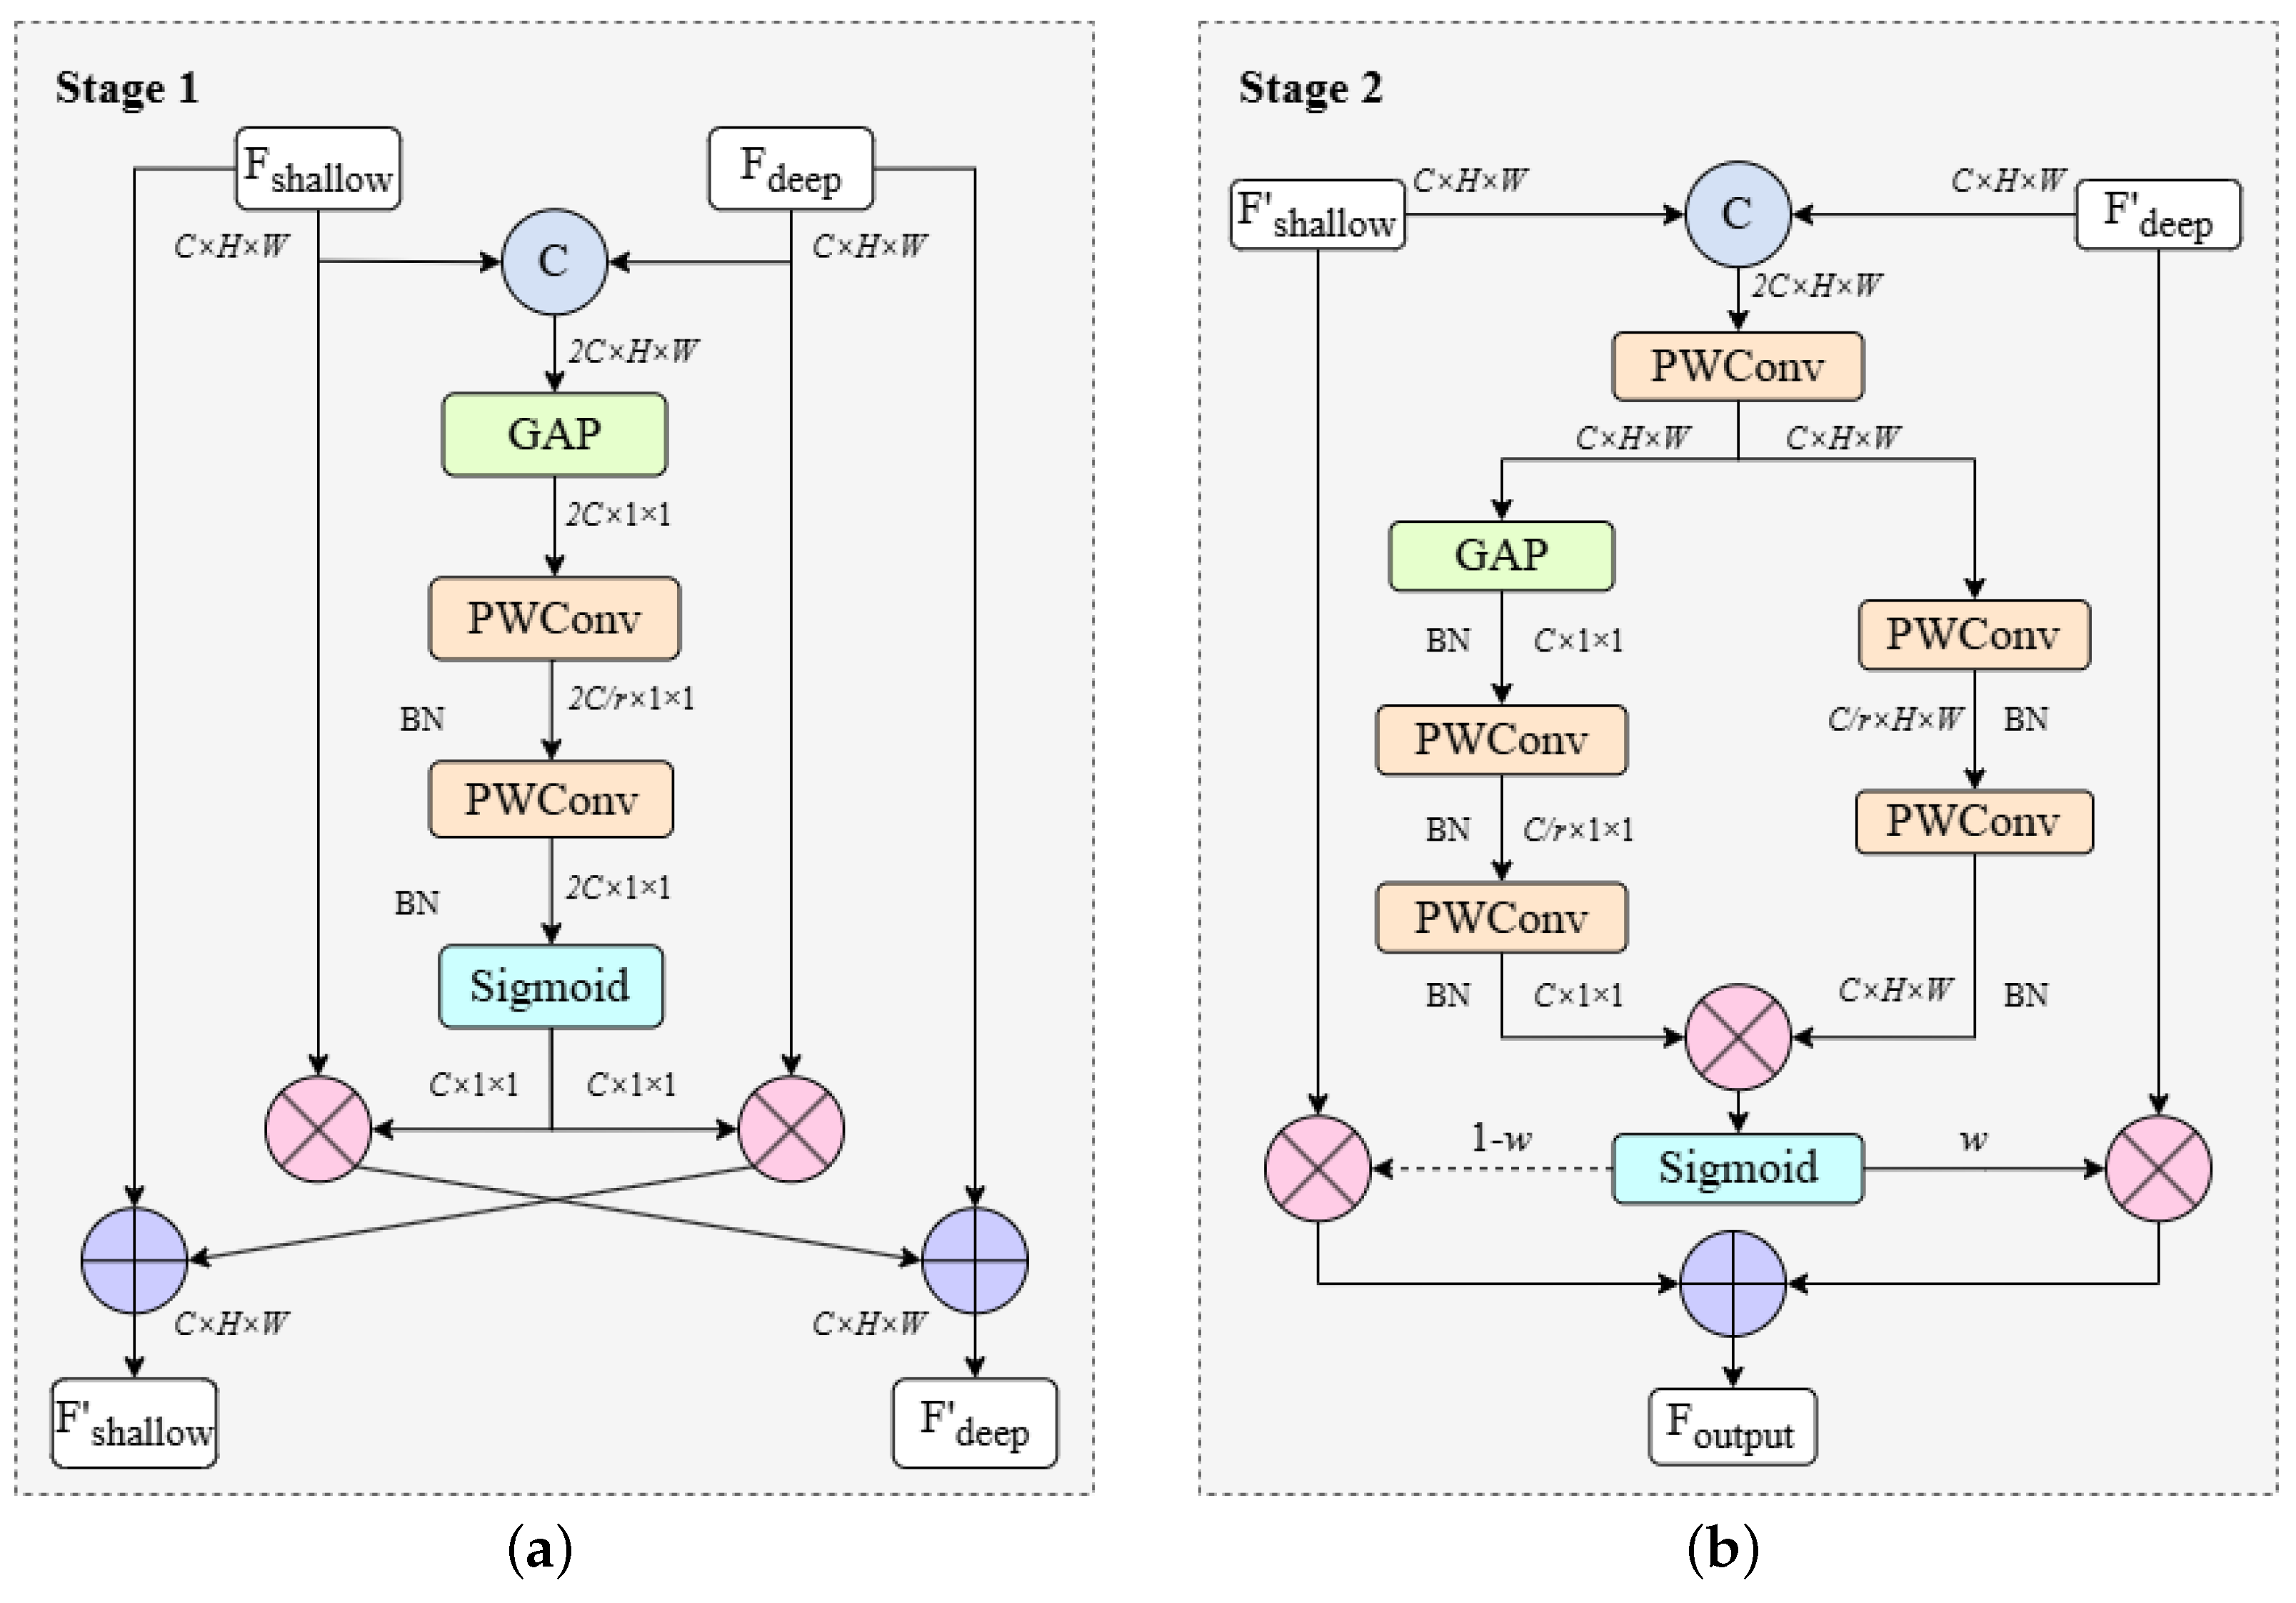
To address the aforementioned issues, we designed the Self-Calibrated Dual Attention (SCDA) module specifically optimized for side-scan sonar target detection grounded in the core concepts of the Shallow Detail Fusion Module [
37], and integrated it into the Neck section of YOLOv11. SCDA adopts a two-stage cascade architecture to achieve efficient feature fusion. The first stage focuses on feature cross-calibration, with the main task of enabling shallow and deep features to mutually learn and achieve bidirectional enhancement; the second stage implements multi-scale fusion by processing features through parallel channel attention and spatial attention paths, and refined fusion of enhanced features to generate final outputs. The complete architecture is shown in
Figure 4.
At the feature calibration level, the SCDA module inherits the original channel-level recalibration mechanism while innovatively introducing a shallow–deep layer feature cross-complementary strategy. By constructing bidirectional feature interaction channels, features from different hierarchical levels can mutually learn and enhance each other, thus boosting the completeness and robustness of feature representations.
The specific implementation process begins with feature dimension unification. The concatenation of shallow features from the backbone network and deep features processed by the feature pyramid along the channel dimension can be expressed as follows:
where
represents the channel concatenation operation. Based on the concatenated features, global average pooling (GAP) is applied to derive channel-level global context, which is formulated as follows:
To maintain the lightweight characteristics of the model, we employ PWConv as a local channel context aggregator. This design solely leverages pointwise channel interactions at each spatial position, constructing channel dependencies through two cascaded PWConv layers and Sigmoid activation function to form a channel attention mechanism. Using the global context from Equation (
7), the attention weights
A are computed through the following formula:
Finally, the generated attention weights from Equation (
8) are applied to perform cross-weighting on original features, achieving bidirectional enhancement of shallow and deep features. This process can be mathematically represented as follows:
where ⊕ represents element-wise summation and ⊗ represents element-wise multiplication. This cross-calibration mechanism achieves bidirectional complementary enhancement: shallow features gain semantic understanding through deep features while preserving spatial details, and deep features recover spatial precision through shallow features while maintaining semantic richness. This mutual learning overcomes traditional unidirectional limitations and establishes a foundation for subsequent fusion.
Considering the strong directionality and non-uniform noise characteristics of side-scan sonar images, the second stage adopts multi-scale parallel processing with content-aware adaptive weighting. Unlike fixed weight allocation, this strategy dynamically adjusts fusion parameters based on target reflection intensity, significantly improving weak target detection performance.
The implementation process begins with feature preprocessing and path separation, where we connect input features and separate them into dual-path processing. This operation can be formulated as follows:
Subsequently, parallel attention computation is performed on the separated features from Equation (
10). The channel attention computation is expressed as follows:
Simultaneously, the spatial attention computation follows the following mathematical expression:
Building upon the dual-path attention results from Equations (
11) and (
12), the attention interaction fusion stage computes the final weights through the following formula:
Finally, utilizing the complementary characteristics of shallow and deep features, the adaptive fusion weights from Equation (
13) are applied to generate the final output. This process can be mathematically represented as follows:
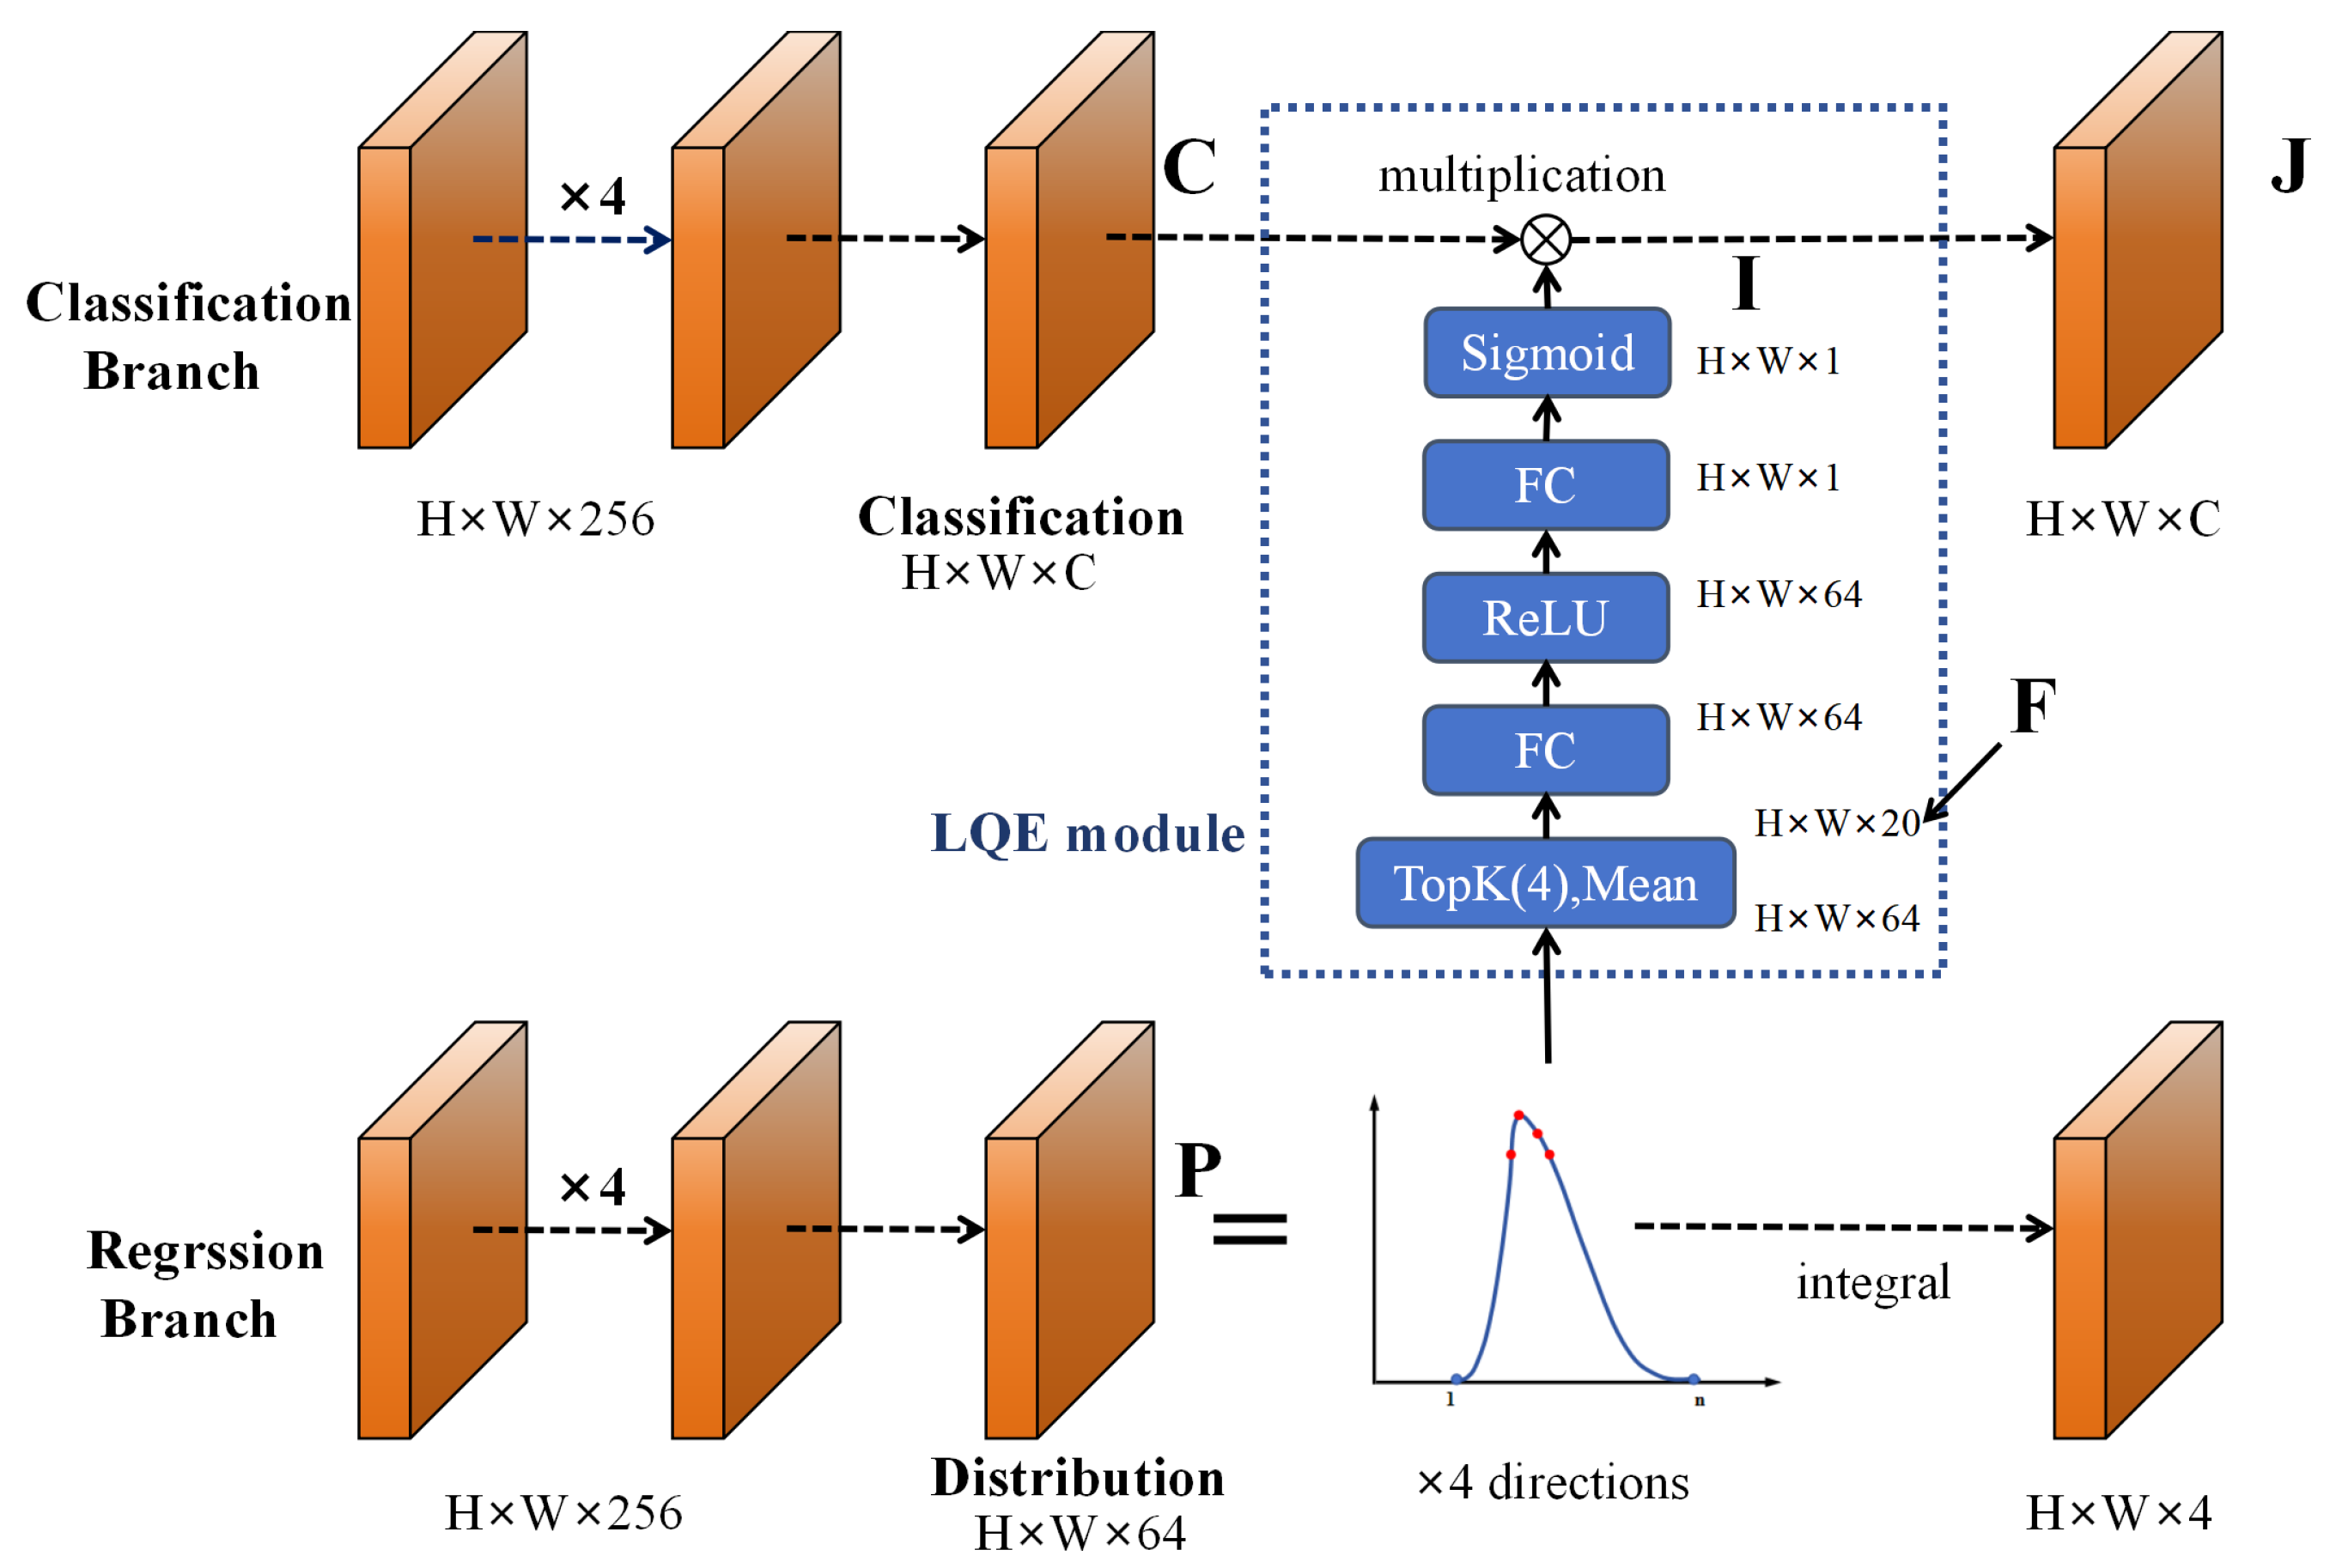
3.5. Head Improvement
In existing YOLO-series algorithms, the detection head serves as the core component for object detection, responsible for conducting multi-scale target detection on features extracted by the backbone network. Traditional detection heads typically process classification and regression tasks separately, with classification confidence serving as the sorting criterion during the Non-Maximum Suppression (NMS) process. However, there exists inconsistency between classification confidence and localization quality, specifically manifested as detection boxes with high classification confidence potentially having significant localization deviations, while accurately localized detection boxes may possess relatively low classification confidence. This inconsistency is particularly pronounced in complex and variable seafloor environments, becoming an important bottleneck constraining further improvement in detection performance.
To address this issue, we took inspiration from the theory put forward by Li et al. in the GFL series work [
38,
39]: when distributions exhibit sharp shapes, it indicates that the model has high confidence in target position predictions, with correspondingly higher localization quality; conversely, when distributions are relatively flat, it reflects greater prediction uncertainty and relatively lower localization quality. Inspired by this, we designed and implemented the Location Quality Estimator (LQE), deeply integrating it into the detection head architecture of YOLOv11, enabling direct utilization of statistical characteristics of bounding box distributions to accurately assess localization quality, as shown in
Figure 5.
In the specific implementation, we adopt general distribution to represent the relative offsets of the four boundaries of target boxes. Let the left, right, top, and bottom boundaries of the target box be
, then the discrete probability distribution vectors for the four boundaries are represented as follows:
where
. Based on the core assumption that distribution shape reflects localization quality, we extract the top-k highest probability values and their mean from each boundary distribution as statistical features reflecting distribution shape. This extraction process is formulated as follows:
where statistical features
, and
represents the joint operation of computing top-k values and their mean. The top-k values reflect peak concentration while the mean provides overall distributional characteristics. In practical application scenarios of side-scan sonar images, when target boundary localization quality is high, such as for clear seafloor target contours, probability distributions will form distinct sharp peaks near true positions, with large and relatively concentrated top-k values. Conversely, when localization quality is poor, such as for blurred shadow regions or areas affected by noise interference, distributions exhibit relatively flat morphology, with corresponding small and dispersed top-k values.
Given statistical features
as input, we predict the final IoU quality estimation through a lightweight subnetwork
. This subnetwork adopts a minimalist design, containing only two fully connected layers (FC) to avoid introducing excessive computational overhead. Therefore, the Intersection over Union (IoU) quality estimation for target boxes is calculated as follows:
where
represents the ReLU function,
,
, p is the hidden layer dimension, and k is the Top-k parameter, with p = 64 and k = 4 set in experiments. To ensure stability during early training, we initialize the output layer weights
to zero, making the initial quality estimation 0.5. This initialization strategy both avoids potential gradient explosion issues that might emerge in early training and ensures the model has neutral quality estimation during early training, gradually learning effective quality assessment capabilities as training progresses.
Finally, we construct a joint representation by utilizing information from the classification branch
C and the regression quality score from Equation (
17). This joint mechanism can be represented as follows:
where
represents the classification confidence vector for a total of m categories, and
represents the predicted IoU quality score. Through this joint representation mechanism, the final detection score can simultaneously reflect both classification confidence and localization quality, providing more reliable and accurate results for side-scan sonar image detection missions.
4. Experiments
4.1. Experimental Setup and Dataset
The experimental platform adopts Ubuntu 20.04 as the operating system, featuring an Intel® Core™ i9-13900k with a main frequency of 5.8 GHz, 96 GB system memory, Nvidia GeForce RTX 4090 graphics card with 24 GB video memory. The PyTorch deep learning framework version used is 2.2.2+cu121, with Python version 3.10.14. The learning rate is configured as 0.01 to guarantee stable model convergence and prevent instability caused by excessive step sizes. The optimizer used is Stochastic Gradient Descent (SGD), with the batch size set to 32 and image size set to 640 × 640. To avoid overfitting, we conducted preliminary experiments and found that the loss function stabilized after 600 epochs on the side-scan sonar dataset used in this paper; therefore, we set epochs to 600. The network does not use pre-trained model weights, and all experiments are trained and validated using consistent hyperparameters.
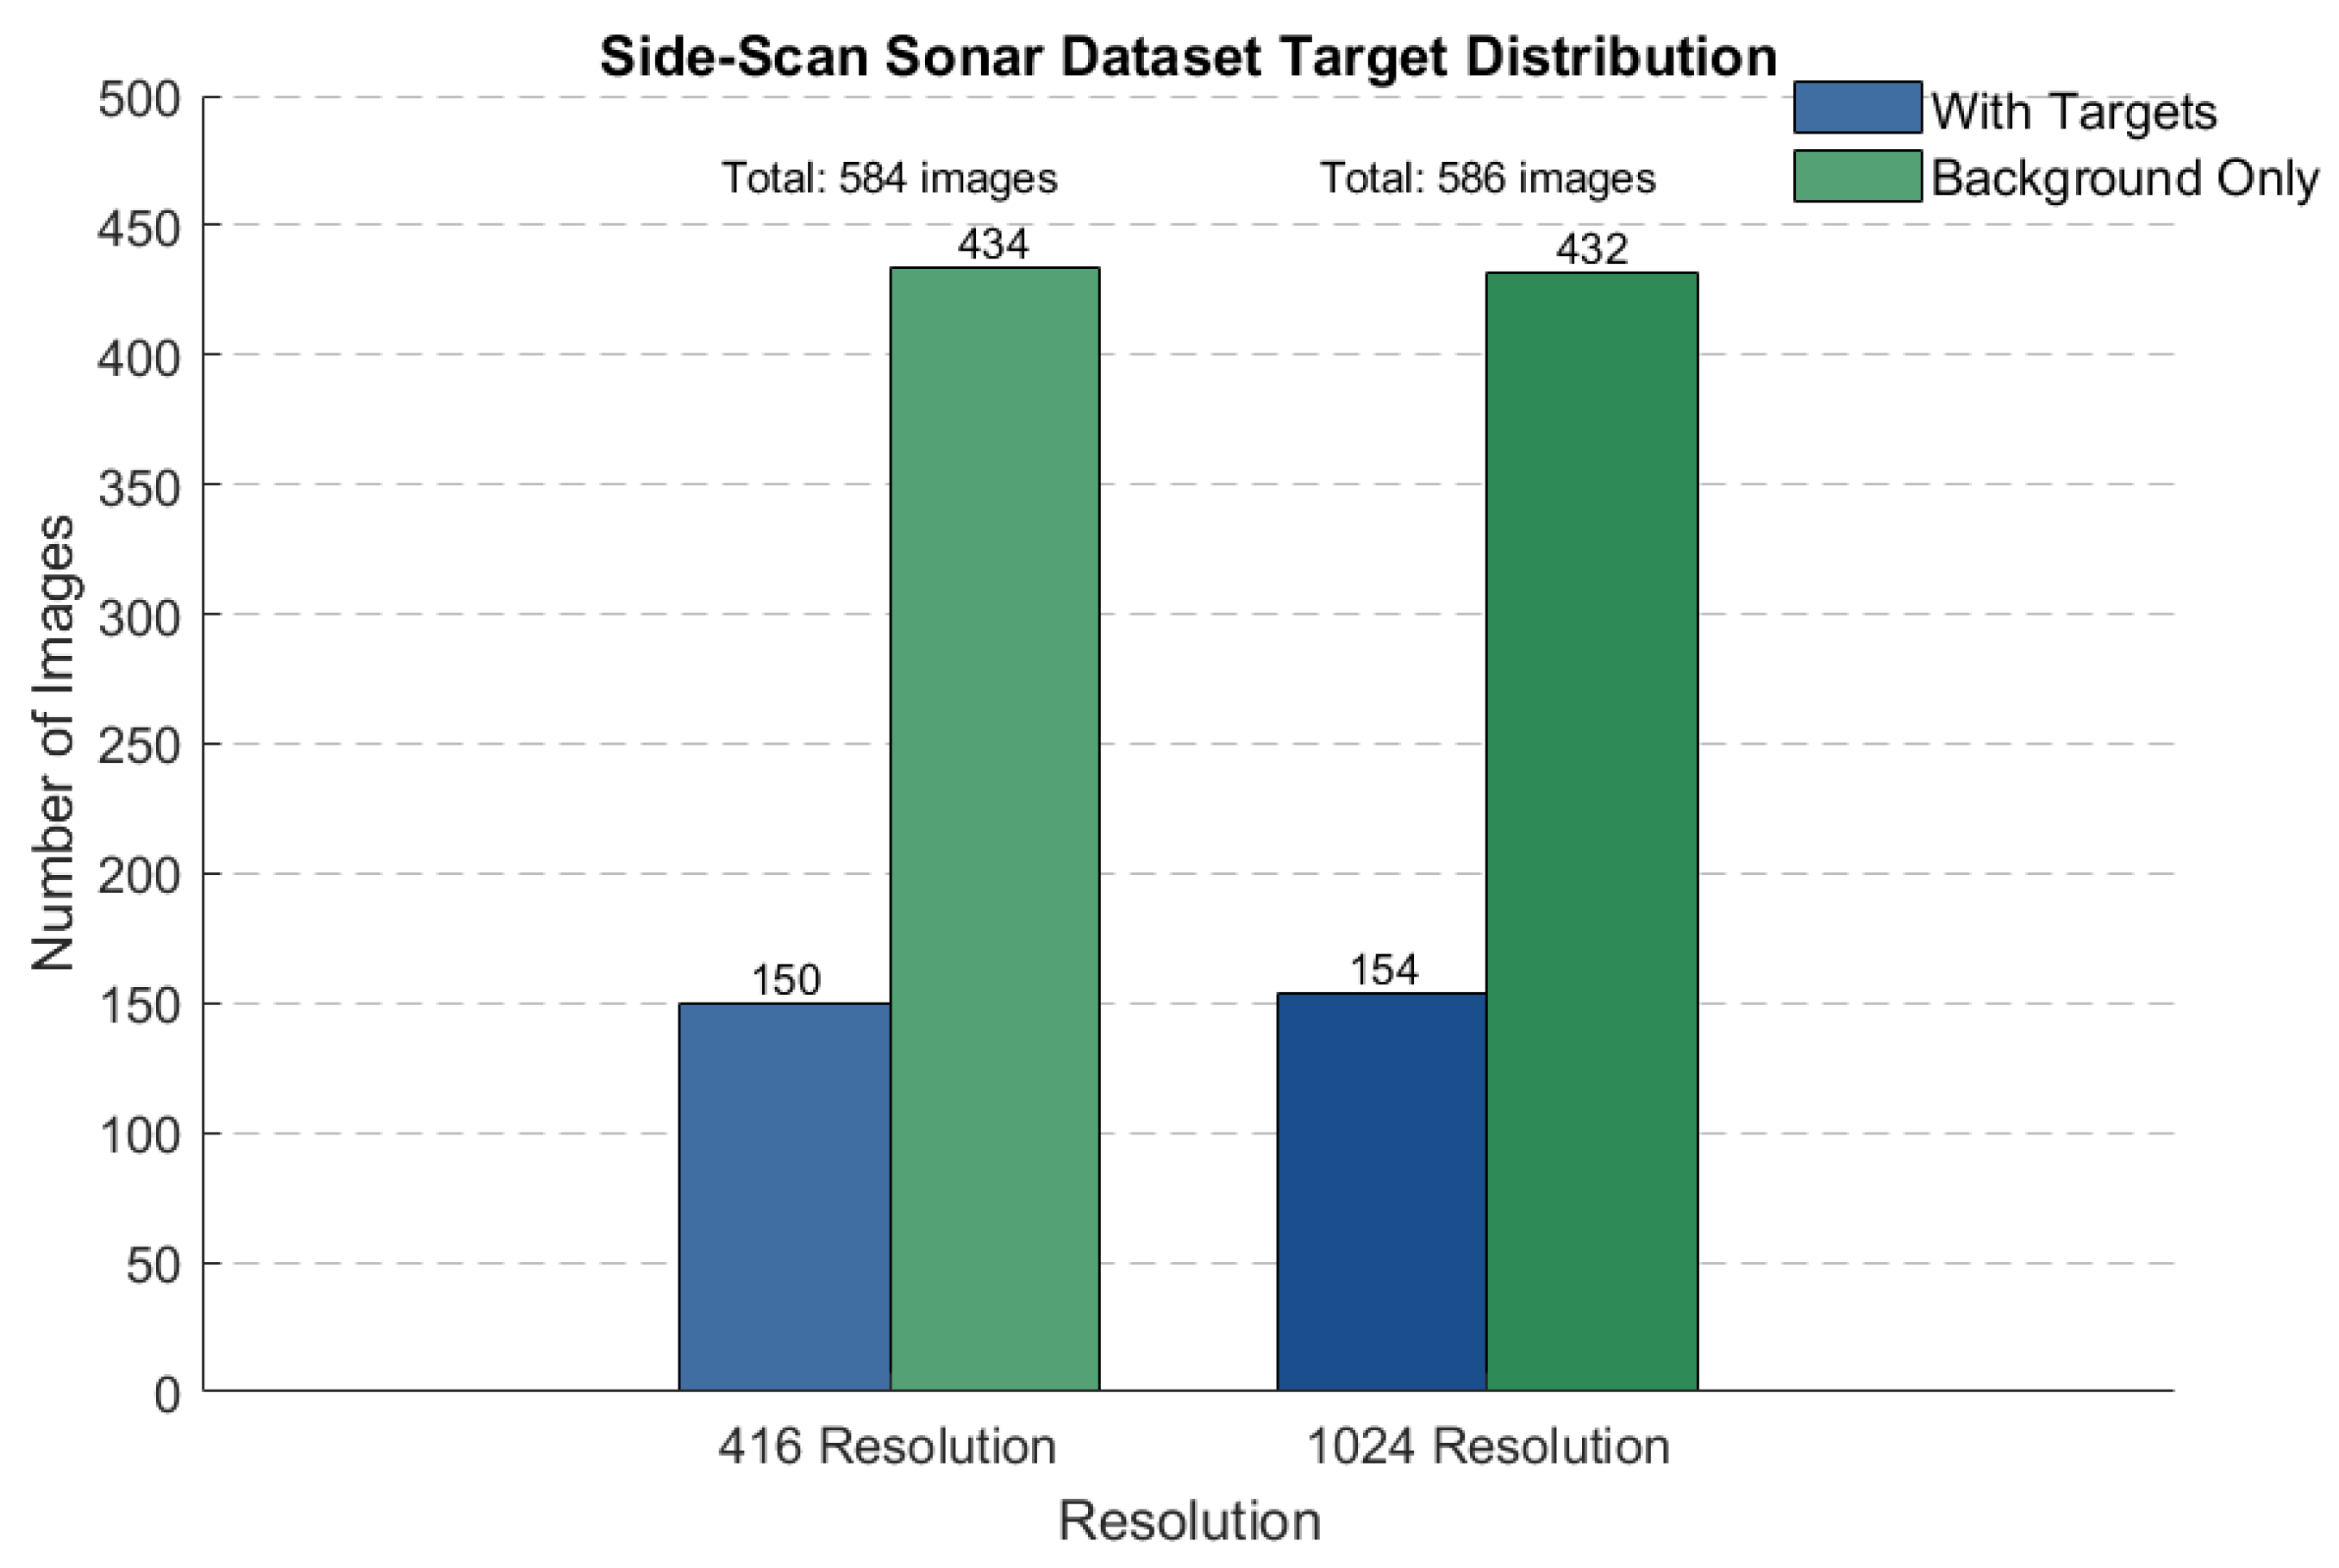
This paper uses the SIMD dataset to validate the improved algorithm [
40]. The dataset contains 1170 real side-scan sonar images captured between 2010 and 2021 using the Teledyne Marine Gavia autonomous underwater vehicle, with annotations for two types of targets: Non-Mine-like Bottom Objects (NOMBOs) and Mine-Like Contacts (MILCOs). Since the dataset was collected using 900–1800 kHz marine acoustic dual-frequency side-scan sonar, it contains images with two different pixel resolutions: 416 × 416 and 1024 × 1024. The specific distribution is shown in
Figure 6.
To ensure the robustness of the evaluation framework, we randomly divided the dataset using a 7:2:1 ratio for training, validation, and testing, respectively, resulting in 819 training images, 233 validation images, and 119 test images. To improve the diversity and robustness of training data, we implemented data augmentation strategies on the training set. These mainly include geometric transformations (affine, perspective, and elastic deformation), random cropping that maintains target integrity, horizontal and vertical flipping, and noise enhancement simulating sonar environments (Gaussian noise and ISO noise). During the data augmentation process, we attempted one enhancement operation for each original training image. However, since some complex transformations might cause target bounding boxes to exceed boundaries or undergo excessive deformation, the enhancement process employed exception handling mechanisms to ensure data quality. Ultimately, the original 819 training images were expanded to 1453 images after enhancement. This selective enhancement process ensures a balance between training data quality and diversity, providing the model with richer and more realistic training samples. The validation and test sets remained unprocessed to ensure unbiased evaluation of model performance.
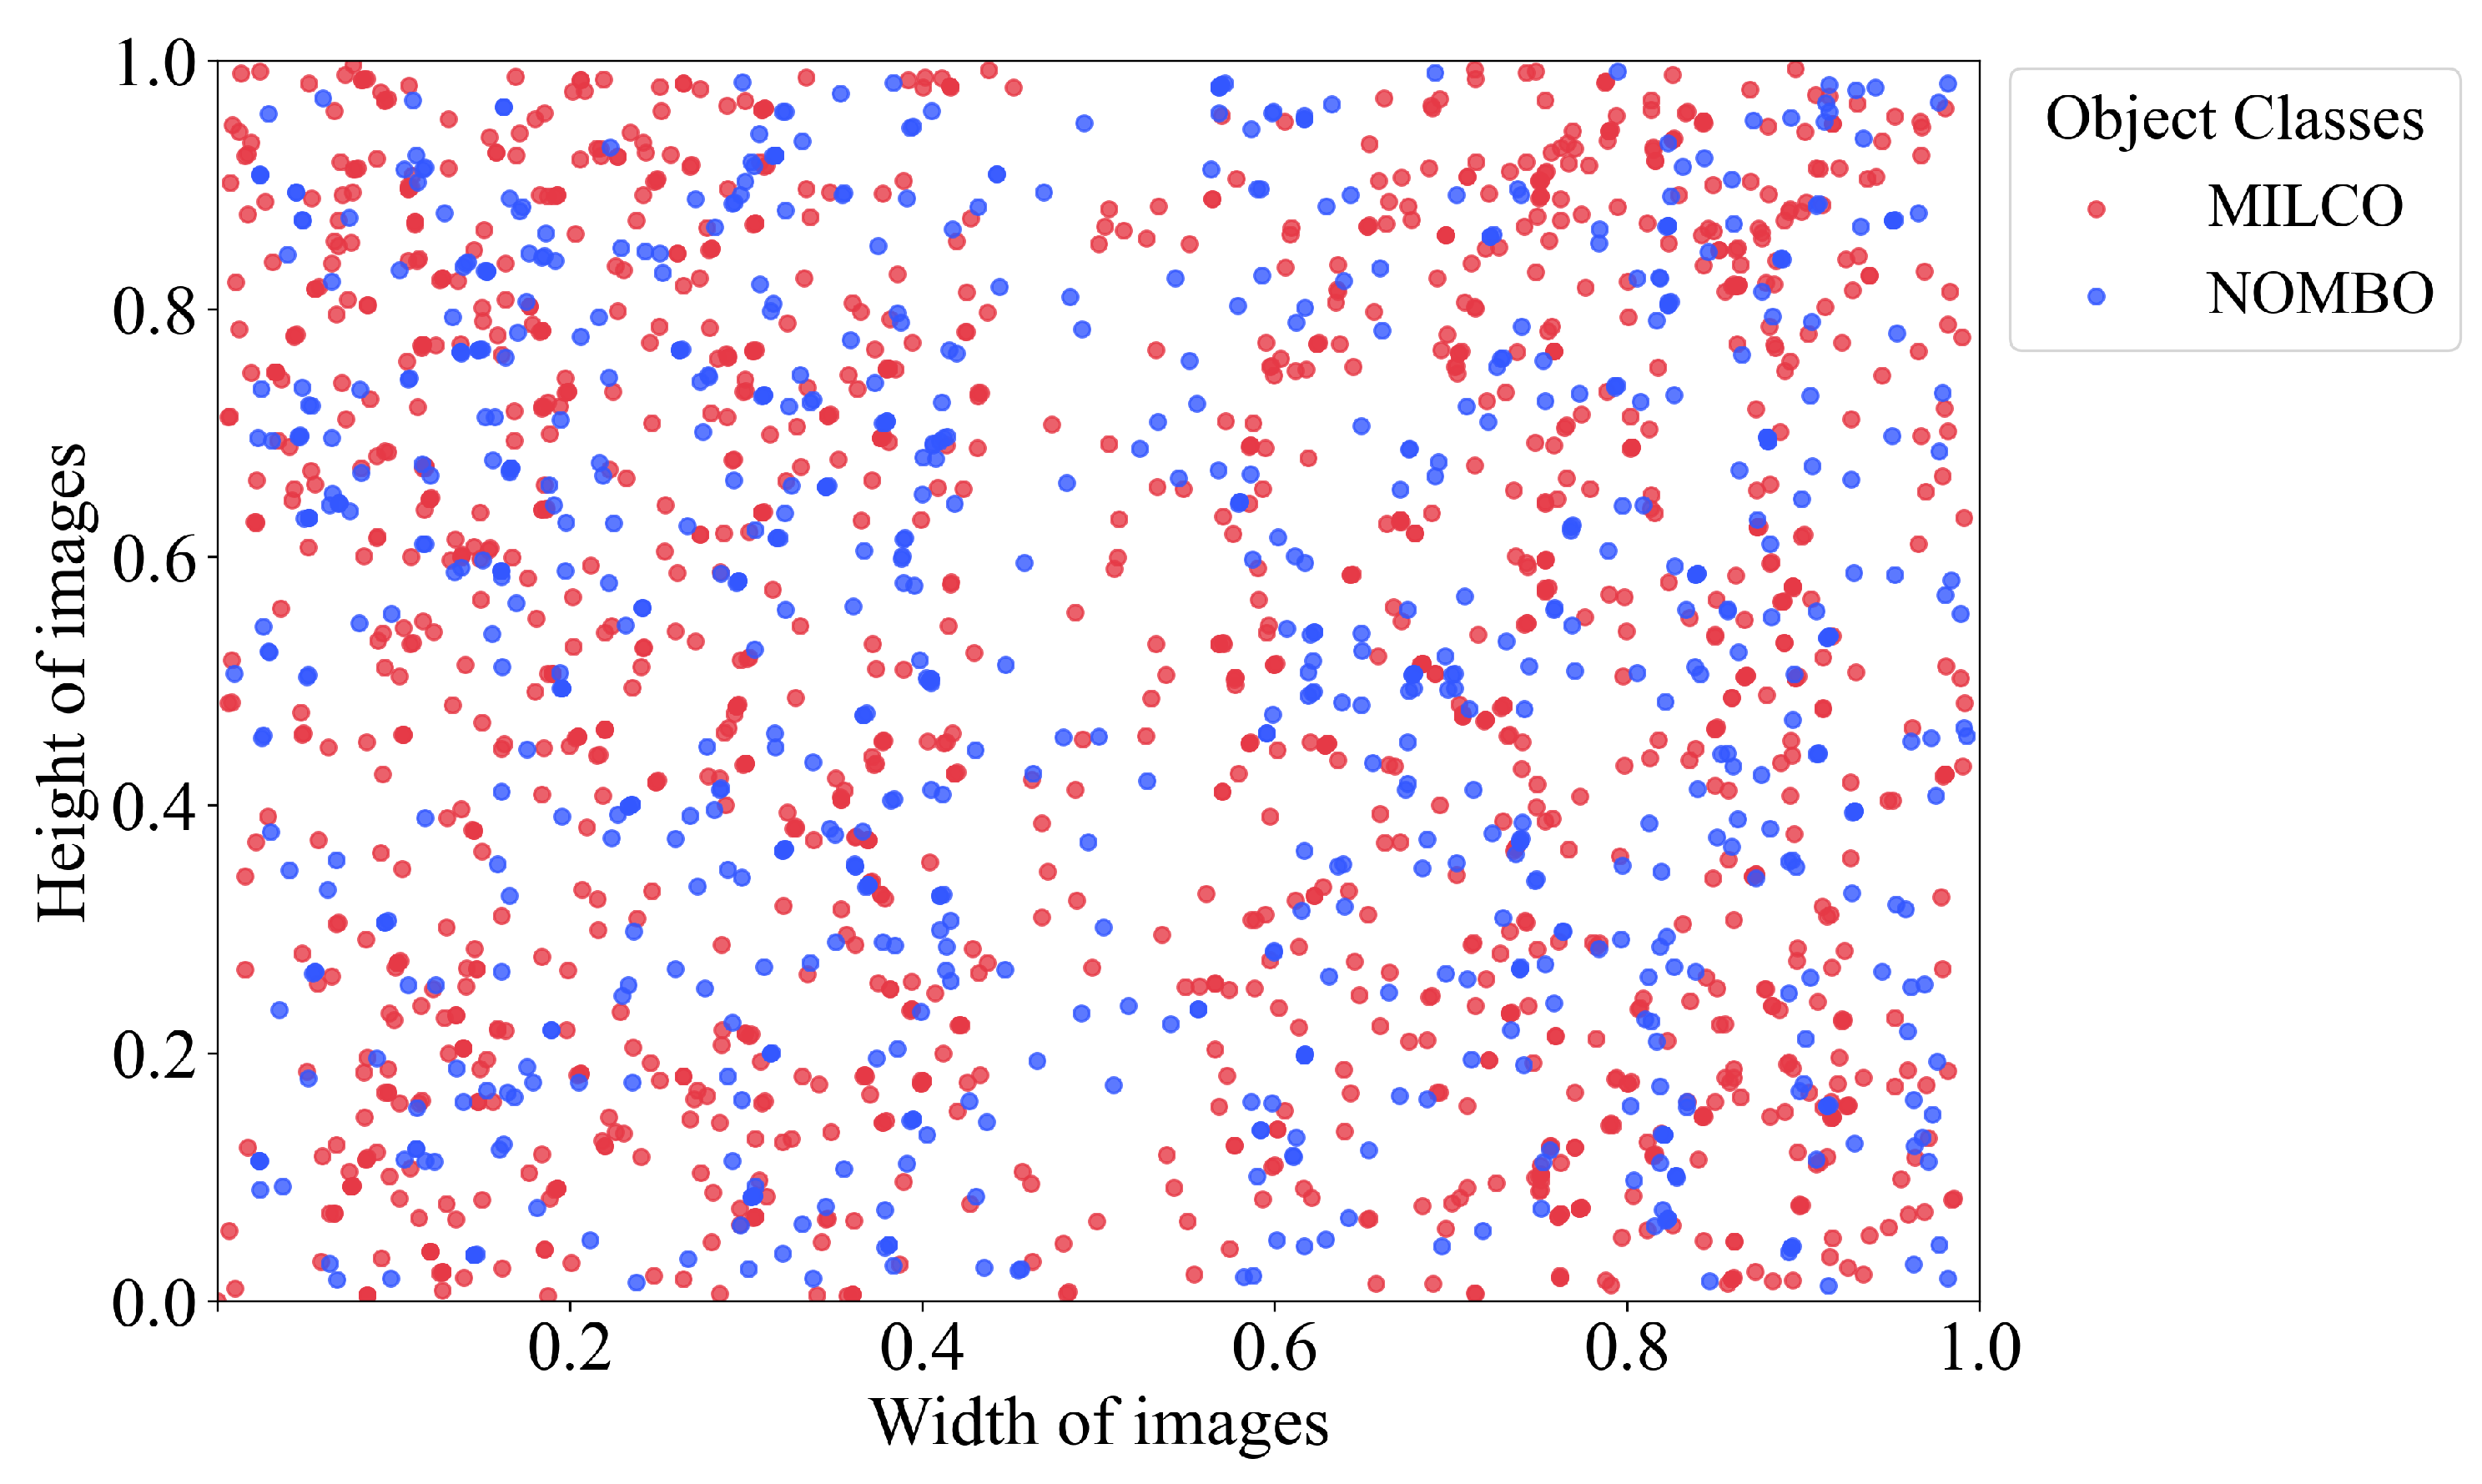
To more effectively analyze the characteristics of targets, we computed the positional distribution of targets in images and the aspect ratios of targets relative to images, where colors are used to distinguish between the two target types. The specific statistical data is shown in
Figure 7. From this, we can observe that targets in images exhibit a distinct distribution pattern of dense concentrations on both sides and sparse distribution in the center. This occurs because side-scan sonar emits acoustic waves to both sides, creating a detection blind zone in the central region, while targets have a higher probability of appearing in areas farther from the sonar platform. Unlike optical images, each side-scan sonar image typically contains only a few targets, with a limited average number of targets per image, and these targets account for a very small percentage of the whole image, appearing as small point-like or small block-like features. These distribution characteristics and target features provide certain guidance for target detection algorithm design.
4.2. Evaluation Metrics
In small object detection tasks, false positives and false negatives are particularly notable problems. Therefore, mAP@0.5 and mAP@0.5:0.95 are typically adopted as the primary evaluation criteria. mAP integrates both precision and recall of the model, making it widely recognized as a comprehensive performance indicator.
(1) Mean Average Precision (mAP): mAP@0.5 donates the average detection accuracy across all classes when the IoU threshold is set to 0.5; mAP@0.5:0.95 computes the average precision across varying IoU thresholds ranging from 0.5 to 0.95. Higher mAP values signify superior model performance. The formula for the mAP is as follows:
where
donates the average precision for the
i-th class, and
n is the number of categories in the dataset.
(2) Precision is defined as the proportion of correctly detected targets among all detection results. This metric is calculated through the following mathematical expression:
where
represents the number of correctly detected targets (true positives), and
represents the number of incorrectly detected targets(false positives).
(3) Recall represents the proportion of actual targets that the model can detect among all ground truth targets. The computation formula is expressed as follows:
where
represents the number of targets that actually exist but are not detected by the model (false negatives).
(4) F1 score is the harmonic average of the precision rate and the recall rate. The value range is 0 to 1, and the closer to 1 indicates the better performance of the model. This score is calculated by the following formula:
4.3. Results and Discussion
4.3.1. Analysis of the Training Process
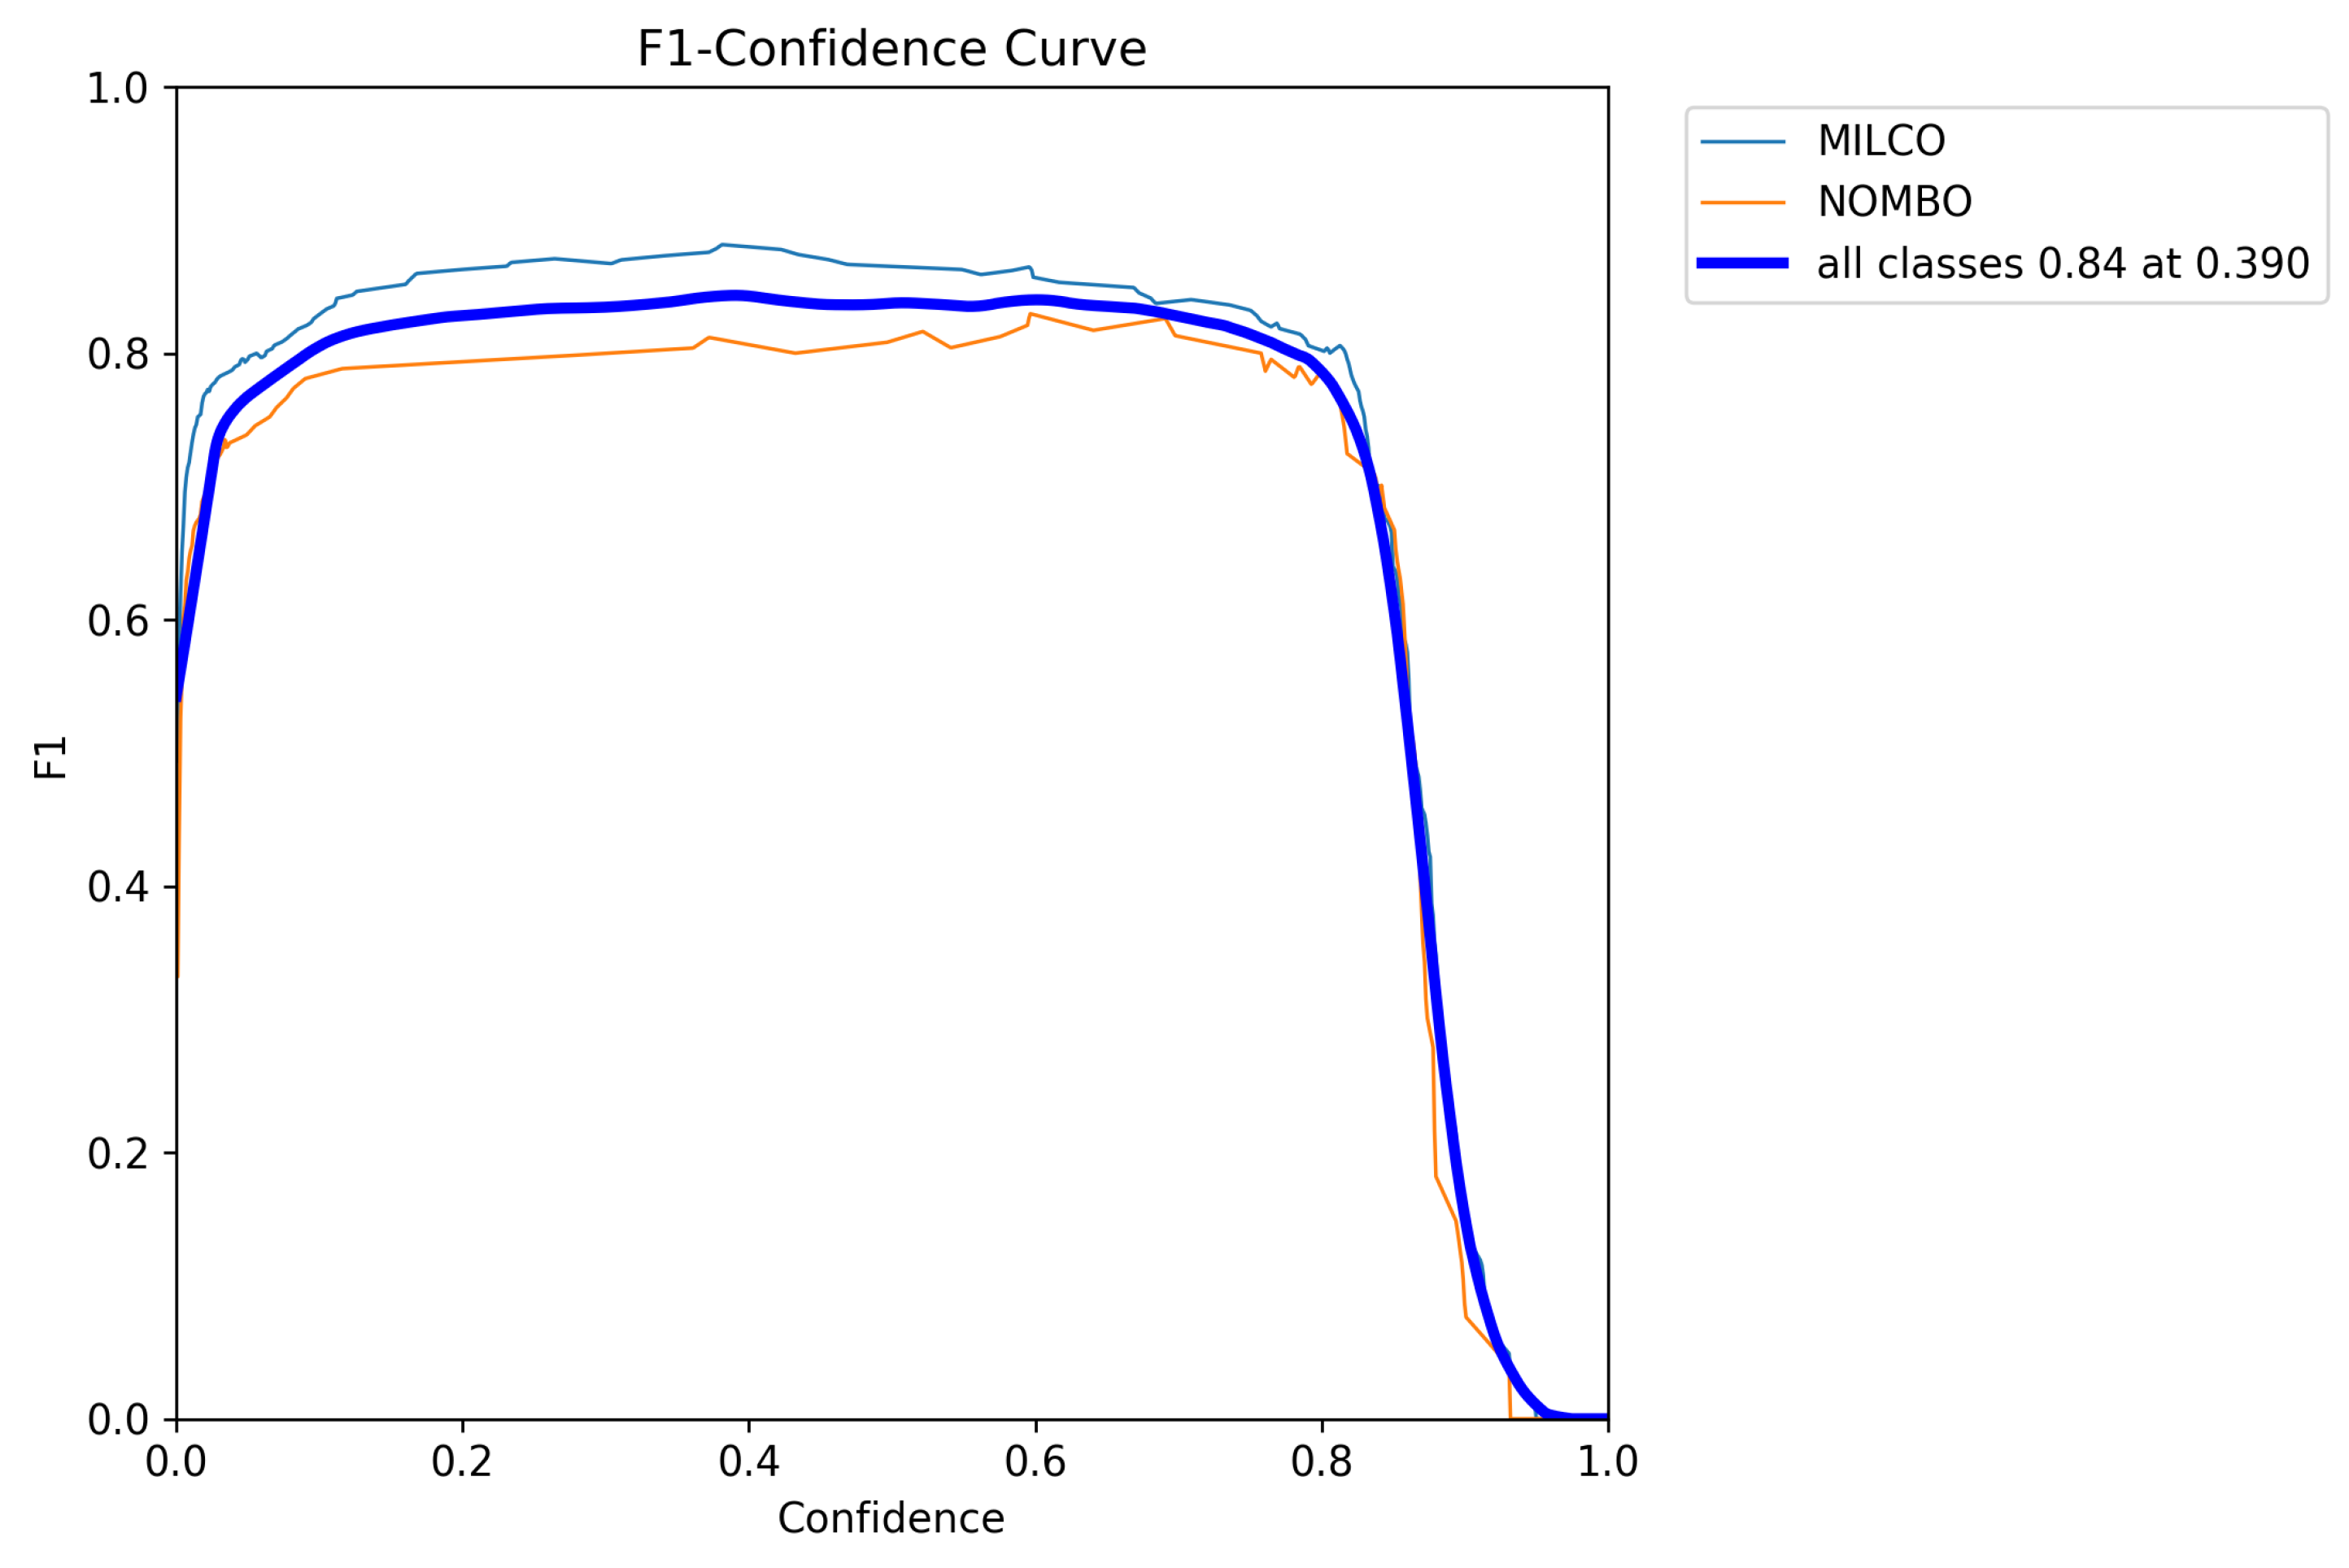
The F1-Confidence curve is an important tool for assessing the performance stability of object detection models. It illustrates the changes in the F1 score of a model across different confidence thresholds. An ideal F1-Confidence curve should exhibit the following characteristics: a relatively stable high F1 score within the lower confidence interval, a gradual increase to a peak with rising confidence, and a smooth decline in the high confidence interval. The smoothness of the curve reflects the stability of the model’s training, while the height of the peak and the width of the stable interval indicate the overall performance and robustness of the model.
In this experiment, the F1-Confidence curve on the SIMD dataset demonstrated favorable performance characteristics. As observed in
Figure 8, the model maintained an F1 score above 0.8 within the confidence range of 0.1 to 0.7, achieving an optimal F1 score of 0.84 at a confidence level of 0.390. The overall performance curve presents a smooth trend without any abnormal fluctuations or irregular jumps, indicating that the training process converged stably without overfitting. This result validates the effectiveness of the adopted training strategy and parameter settings, confirming that the model possesses good generalization ability and detection accuracy.
4.3.2. Comparative Experiments
To comprehensively assess the performance of the ESL-YOLO algorithm in side-scan sonar image object detection tasks, this paper conducts comprehensive comparisons with various mainstream object detection algorithms on the SIMD validation set, including the two-stage detector Faster R-CNN, the single-stage detector SSD, Transformer-based RT-DETR-r18 and Swin-YOLO, as well as various versions of the YOLO series. Additionally, a comparison is made with the YOLOv11-SDC algorithm [
28], which is specifically optimized for side-scan sonar object detection. This algorithm is an improved version of YOLOv11 tailored to adapt to the task of small object detection in side-scan sonar images.
Table 1 presents experimental results for each model on the SIMD validation set, encompassing detection accuracy and computational efficiency metrics under identical hardware conditions. ESL-YOLO outperforms all baseline models across detection accuracy metrics with precision of 87.67%, recall of 75.63%, mAP@0.5 of 84.65%, and mAP@0.5:0.95 of 58.38%, surpassing all baseline models. With 10.62M parameters, 22.2 GFLOPs, and 201.49 FPS, ESL-YOLO requires only 1.21M additional parameters and 0.9 GFLOPs compared to YOLOv11s, demonstrating excellent precision–efficiency balance.
As a classic two-stage detection algorithm, Faster R-CNN achieves high precision of 79.05% but limited recall of 68.37% with mAP@0.5 of 72.06%. Its substantial computational requirements of 136.5M parameters, 368.2 GFLOPs, and 53.4 FPS pose deployment challenges in resource-constrained environments. SSD exhibits lower computational demands with 25.1M parameters, 31.5 GFLOPs, and 178.6 FPS but insufficient detection accuracy of 66.14% mAP@0.5.
Models based on the Transformer architecture performed poorly in this experiment. RT-DETR-r18 achieved mAP@0.5 of only 40.51%. Although its parameter count is relatively small at 19.9M, its GFLOPs reach 56.9, resulting in detection performance far inferior to that of YOLO-series models. Swin-YOLO achieved mAP@0.5 of 65.61% but has a high parameter count of 33.6M, showing no significant advantages in either precision or efficiency.
YOLO-series models exhibit significant performance variations. YOLOv7-tiny demonstrates the fastest inference speed and lowest computational overhead but inadequate detection performance with 66.49% mAP@0.5, indicating excessive model compression compromises performance on side-scan sonar images. Models with moderate complexity achieve better balance. YOLOv5s attains 71.76% mAP@0.5 and 239.46 FPS with 7.02M parameters and 15.8 GFLOPs. YOLOv8s achieves higher detection accuracy with 74.48% mAP@0.5 and 73.34% recall while maintaining 255.24 FPS, demonstrating favorable scalability. YOLOv9s and YOLOv10s excel in parameter efficiency, achieving 73.4% and 71.23% mAP@0.5 with 7.17M and 8.03M parameters, respectively. YOLOv11-SDC, optimized for side-scan sonar, reaches 81.14% precision, exceeding YOLOv11s by 1.24% and effectively reducing false detections while maintaining 146.74 FPS for real-time requirements.
It is noteworthy that iterative updates of model versions do not always lead to performance improvements. Compared with YOLOv5s, YOLOv11s achieves significant precision improvement with a similar parameter count, with mAP@0.5 increasing from 71.76% to 73.84% and precision reaching 79.9%, indicating the effectiveness of architectural optimization. However, YOLOv12s performs poorly, with its mAP@0.5 dropping to 71.43%, even lower than the earlier YOLOv5s, which may reflect adaptability issues of the new architecture in specific application scenarios.
ESL-YOLO achieves substantial improvements while maintaining comparable parameters and GFLOPs to YOLOv11s. ESL-YOLO surpasses YOLOv11s with precision increased from 79.9% to 87.67%, recall from 71.3% to 75.63%, mAP@0.5 from 73.84% to 84.65%, and mAP@0.5:0.95 from 49.14% to 58.38%. ESL-YOLO’s inference speed decreases approximately 17% to 201.49 FPS, representing computational cost for enhanced accuracy while satisfying real-time detection requirements. Compared to Faster R-CNN and Swin-YOLO with 368.2 and 84.4 GFLOPs, respectively, ESL-YOLO attains higher detection accuracy with substantially reduced computational costs, providing practical deployment value in resource-constrained scenarios.
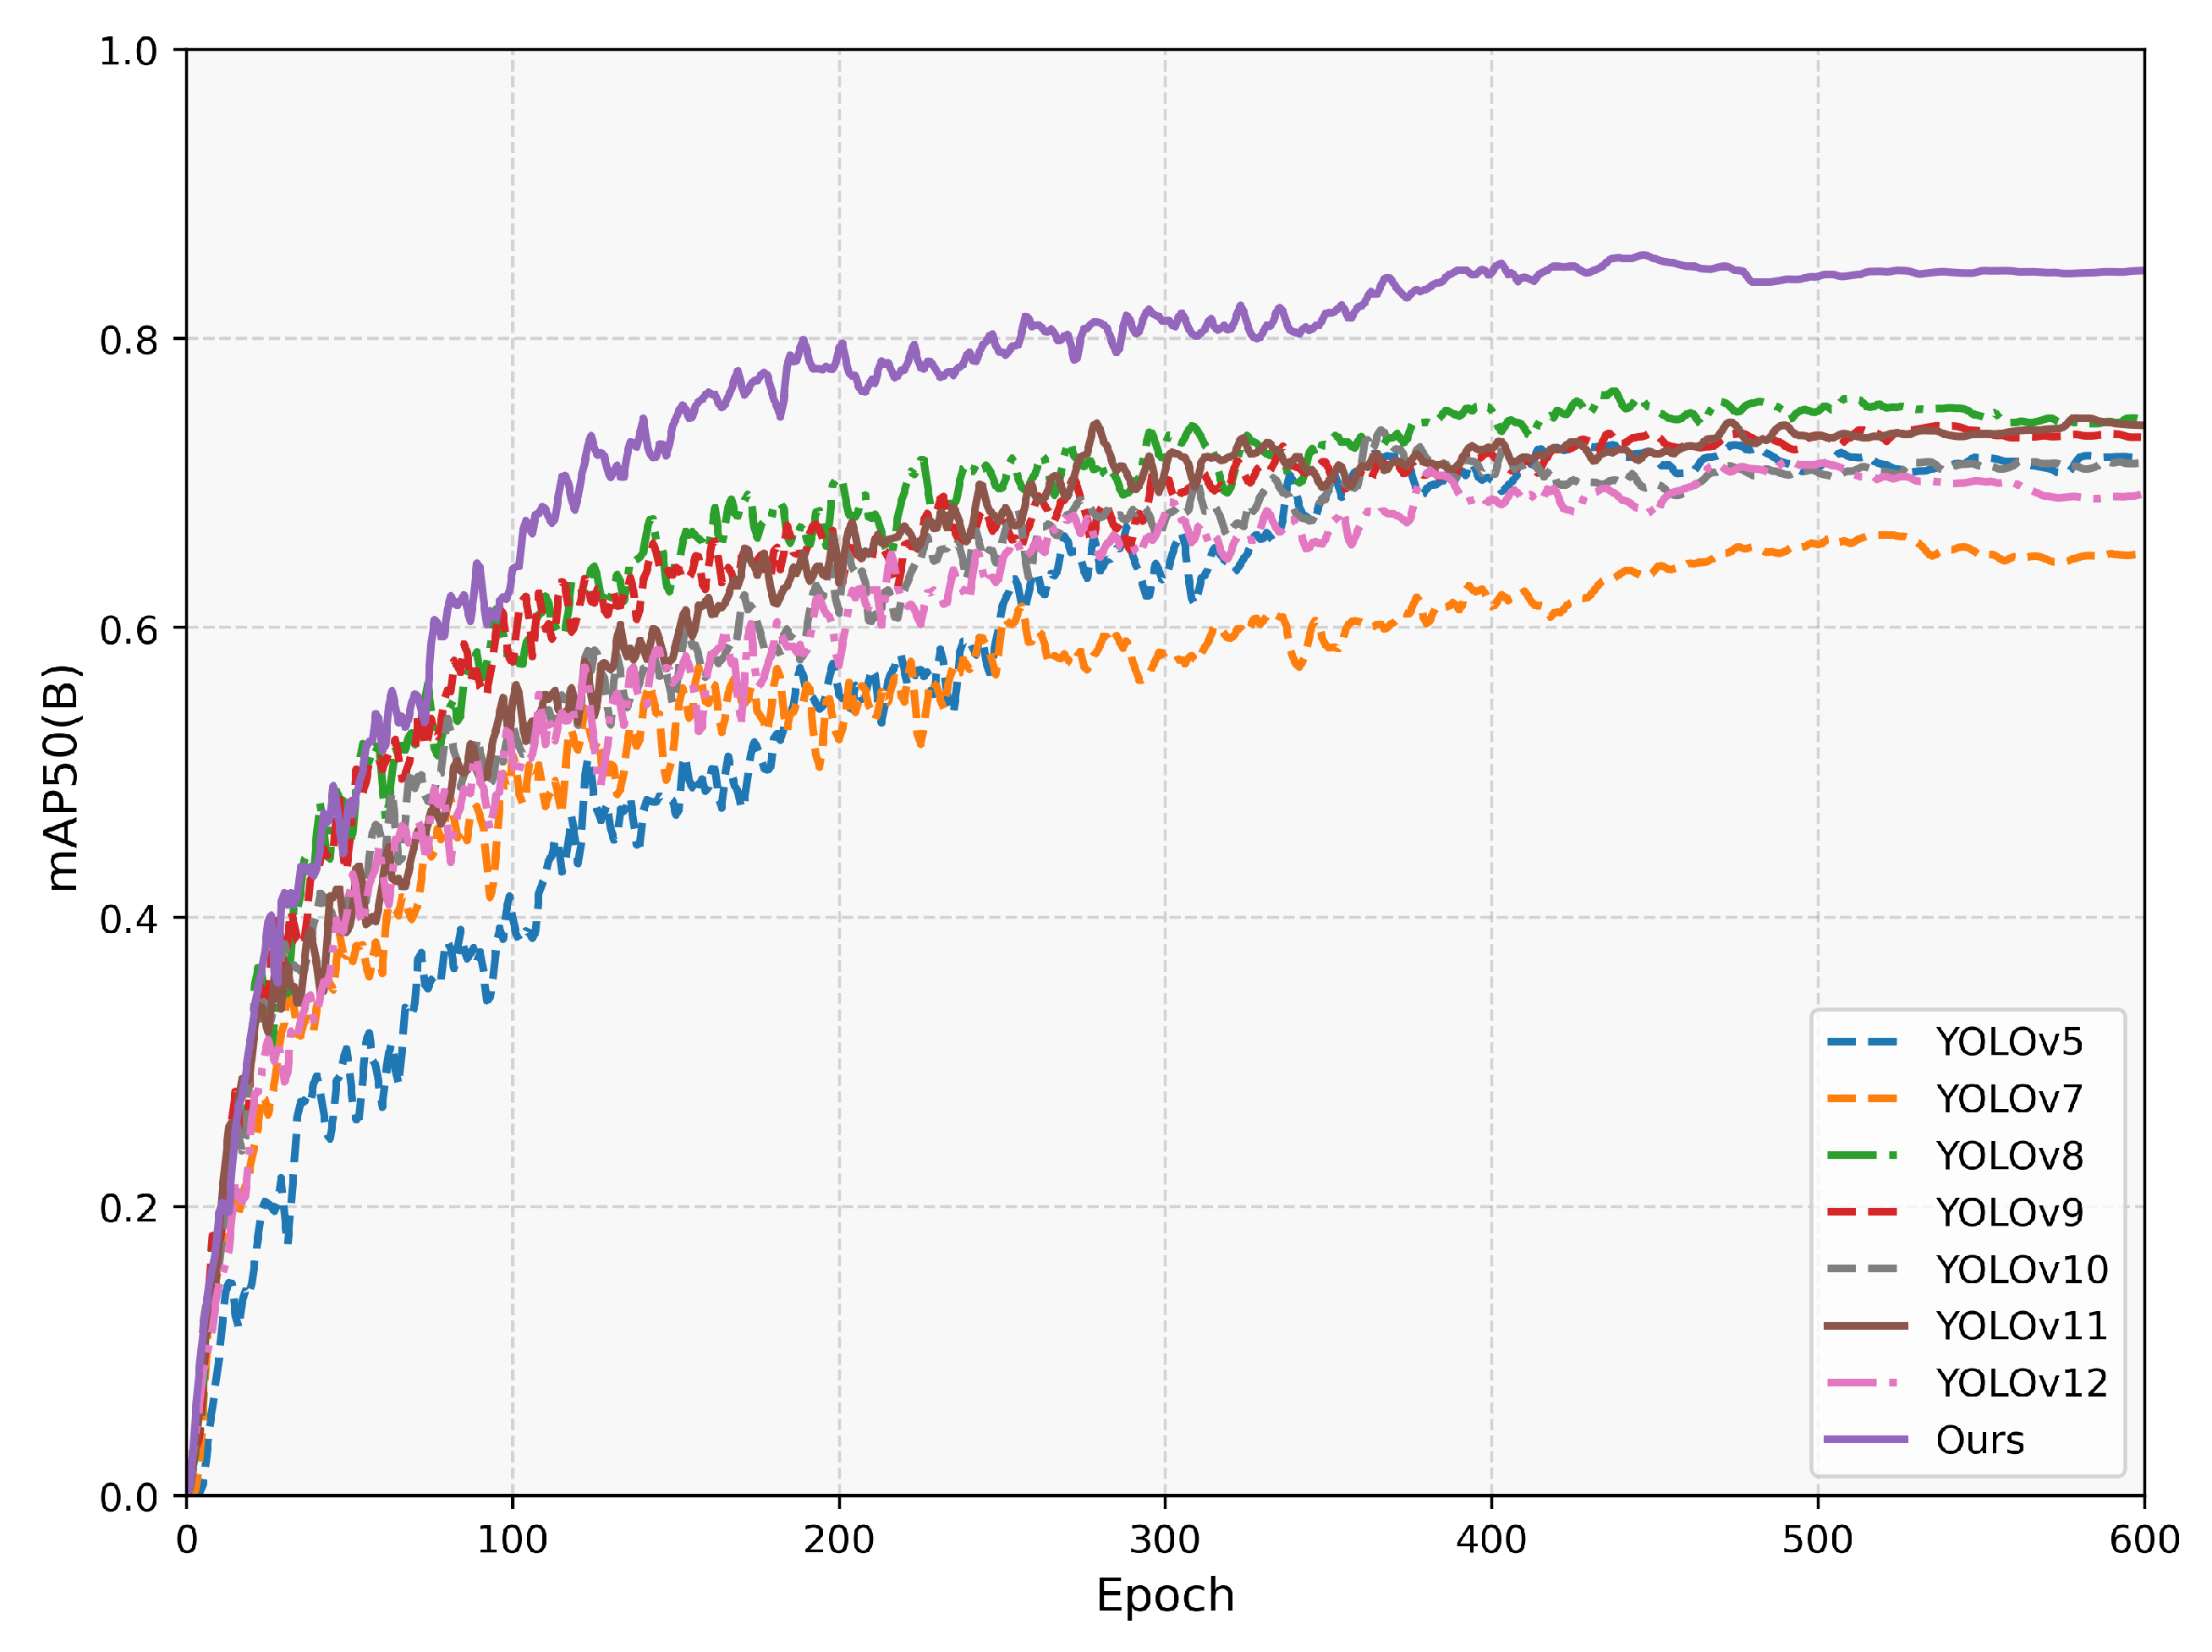
Figure 9 demonstrates ESL-YOLO’s performance advantages over other YOLO-series models through mAP@50 curves.
4.3.3. Ablation Experiments
The ablation experiment results are shown in
Table 2. This study comprehensively evaluated the contributions of three key improvement modules to overall performance. Method A refers to integrating the EFM module into the C3k2 structure, Method B refers to introducing the SCDA mechanism in the neck network, and Method C refers to the detection head improvements. The experimental results indicate that each improvement module exerted a positive influence on detection performance.
From the ablation experiment results, we can observe that each individual improvement had a positive effect on the results. In comparison to the baseline, integrating the EFM module alone raised the model’s recall by 1.27%, with mAP@0.5:0.95 improving from 49.14% to 49.23%. Although precision decreased from 79.9% to 76.50%, this trade-off reflects that the EFM module successfully enhanced the model’s capacity to identify targets with blurred boundaries in sonar images, improving the perception of targets in complex backgrounds by increasing detection sensitivity. Method B improved model precision from 79.9% to 81.48%, while mAP@0.5 and mAP@0.5:0.95 increased to 76.87% and 49.53%. These findings fully confirm the effectiveness of the SCDA module in integrating shallow detail information with deep semantic information, demonstrating that this module improved the model’s detection capability for small targets and targets with intricate shapes by enriching detail and structural information in feature representations. When Method C was applied alone, mAP@0.5 increased by 1.57% relative to baseline, and mAP@0.5:0.95 increased by 1.74% relative to baseline. These results indicate that LQE effectively improved target positioning accuracy through the bounding box quality assessment mechanism, enhancing the model’s robustness under different IoU thresholds.
To deeply understand the synergistic mechanisms between modules, this paper further analyzed the performance of dual-module combinations. The combination of EFM and SCDA maintained high recall while increasing precision to 81.71%, with mAP@0.5 reaching 76.53%, validating the effective synergy between edge-aware enhancement and multi-scale feature fusion strategies. The combination of EFM and LQE performed particularly well, with mAP@0.5 reaching 78.82%, a 4.98% improvement over baseline, indicating that edge information enhancement and location quality assessment formed strong complementary effects in side-scan sonar object detection tasks. The integration of SCDA and LQE achieved excellent precision performance of 86.37%, with mAP@0.5 increasing to 81.18%, further confirming the synergistic advantages of multi-scale feature fusion and quality assessment mechanisms.
The final ESL-YOLO model demonstrated the best performance in side-scan sonar image object detection tasks, with precision reaching 87.67%, and a 7.77% improvement over baseline, reducing false positives in underwater environments; recall increased to 75.63%, a 4.33% improvement, effectively reducing target omissions in complex sonar images; mAP@0.5 achieved excellent performance of 84.65%, a 10.81% improvement over baseline, and mAP@0.5:0.95 reached 58.38%, a 9.24% improvement over baseline. To more intuitively illustrate the performance advantages of the improved algorithm,
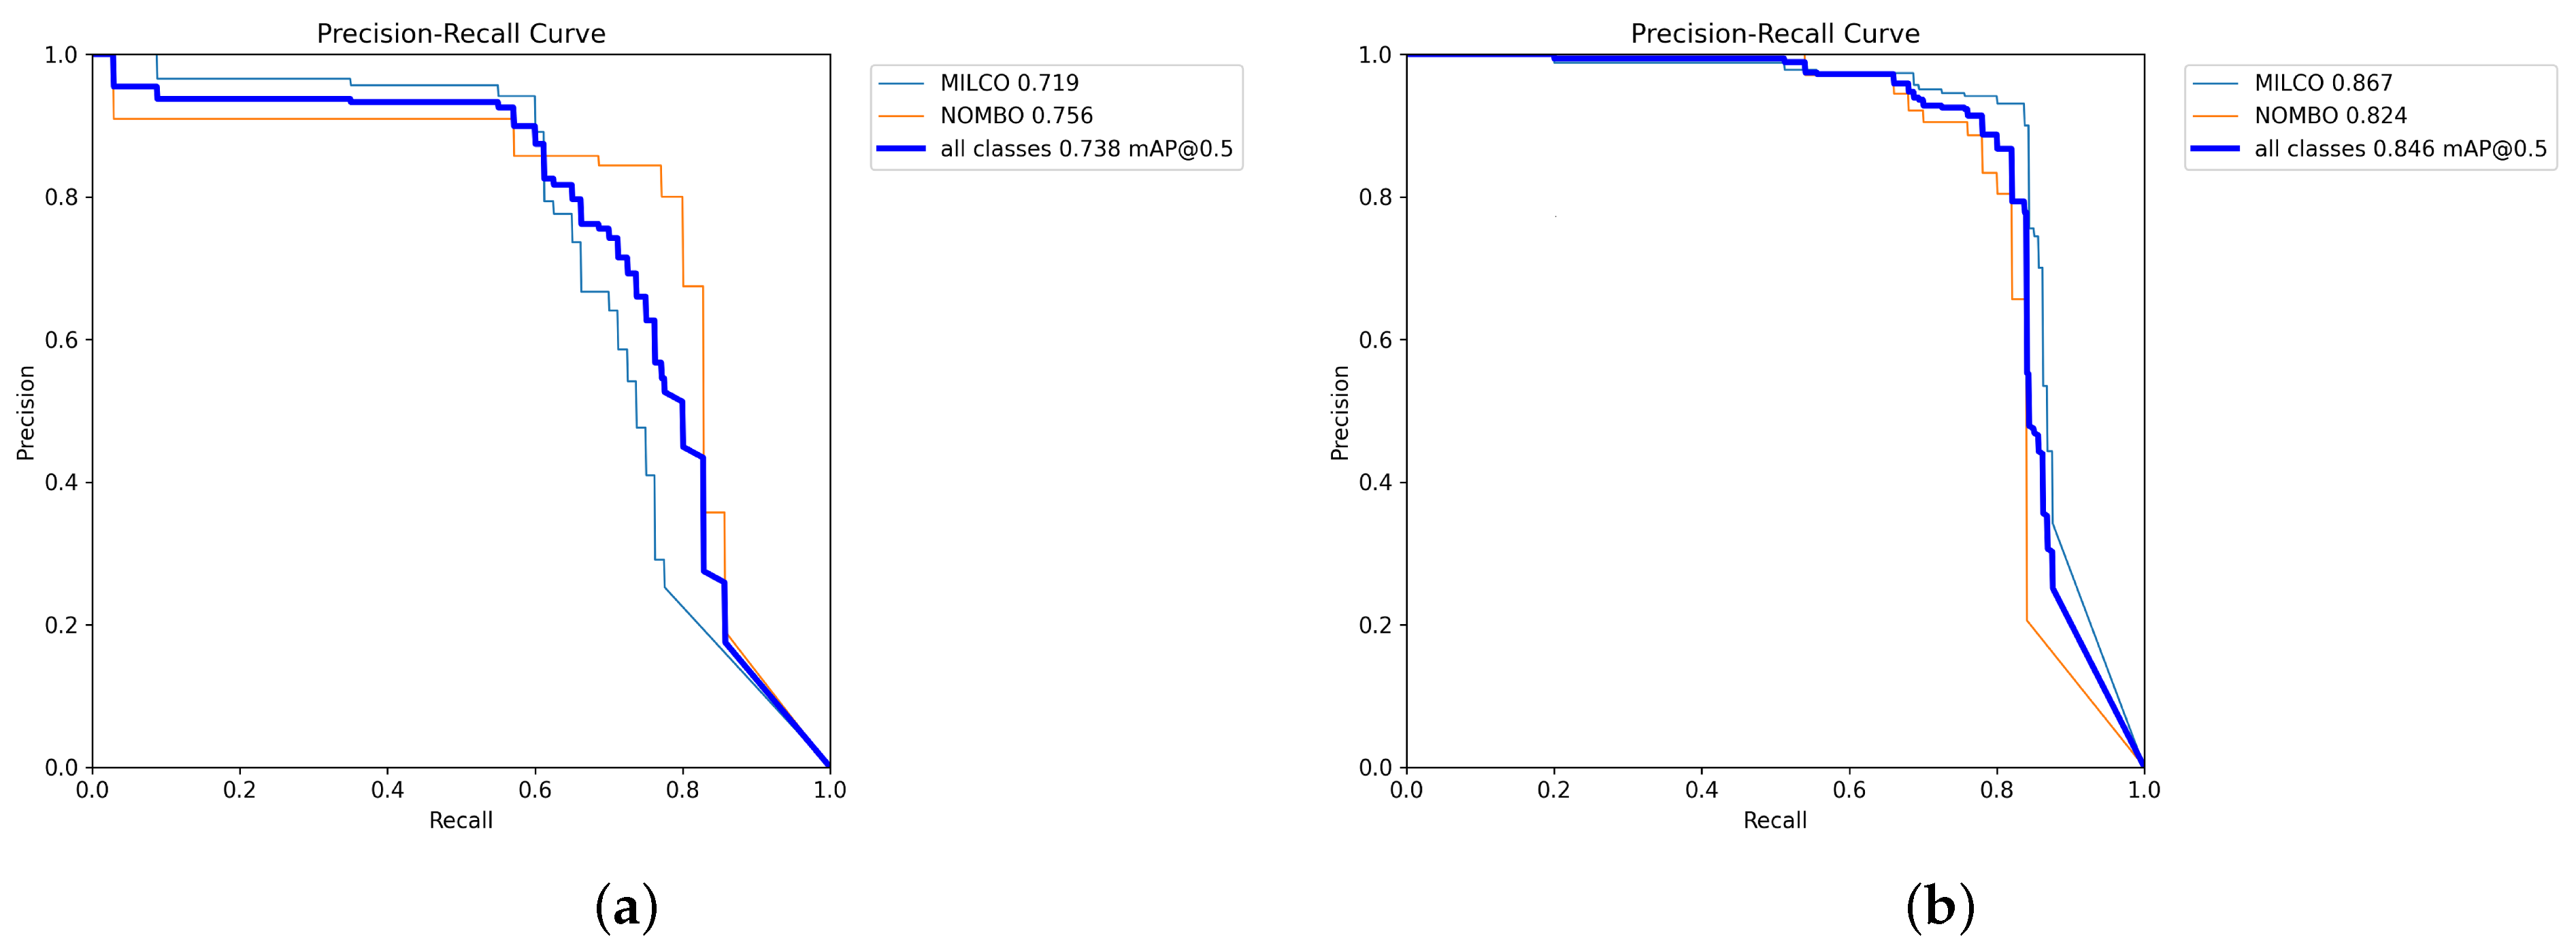
Figure 10 shows the comparison of precision–recall (P-R) curves between baseline YOLOv11s and ESL-YOLO. The P-R curve comprehensively reflects the model’s detection performance trade-offs at varying confidence thresholds, with the area under the curve directly corresponding to the average precision value. As seen from the figure, it can be observed that the P-R curve of ESL-YOLO lies above the baseline model throughout the entire recall range, indicating that the proposed three improvement modules not only enhanced overall detection performance but also achieved better target coverage while maintaining high precision, which is of great significance for practical applications such as seabed target searching.
The above results fully demonstrate the effective technical complementarity of the three improvement modules, forming an integrated detection framework that significantly improved the model’s comprehensive performance in side-scan sonar image object detection tasks.
4.3.4. Visualization and Comparison of Detection Results
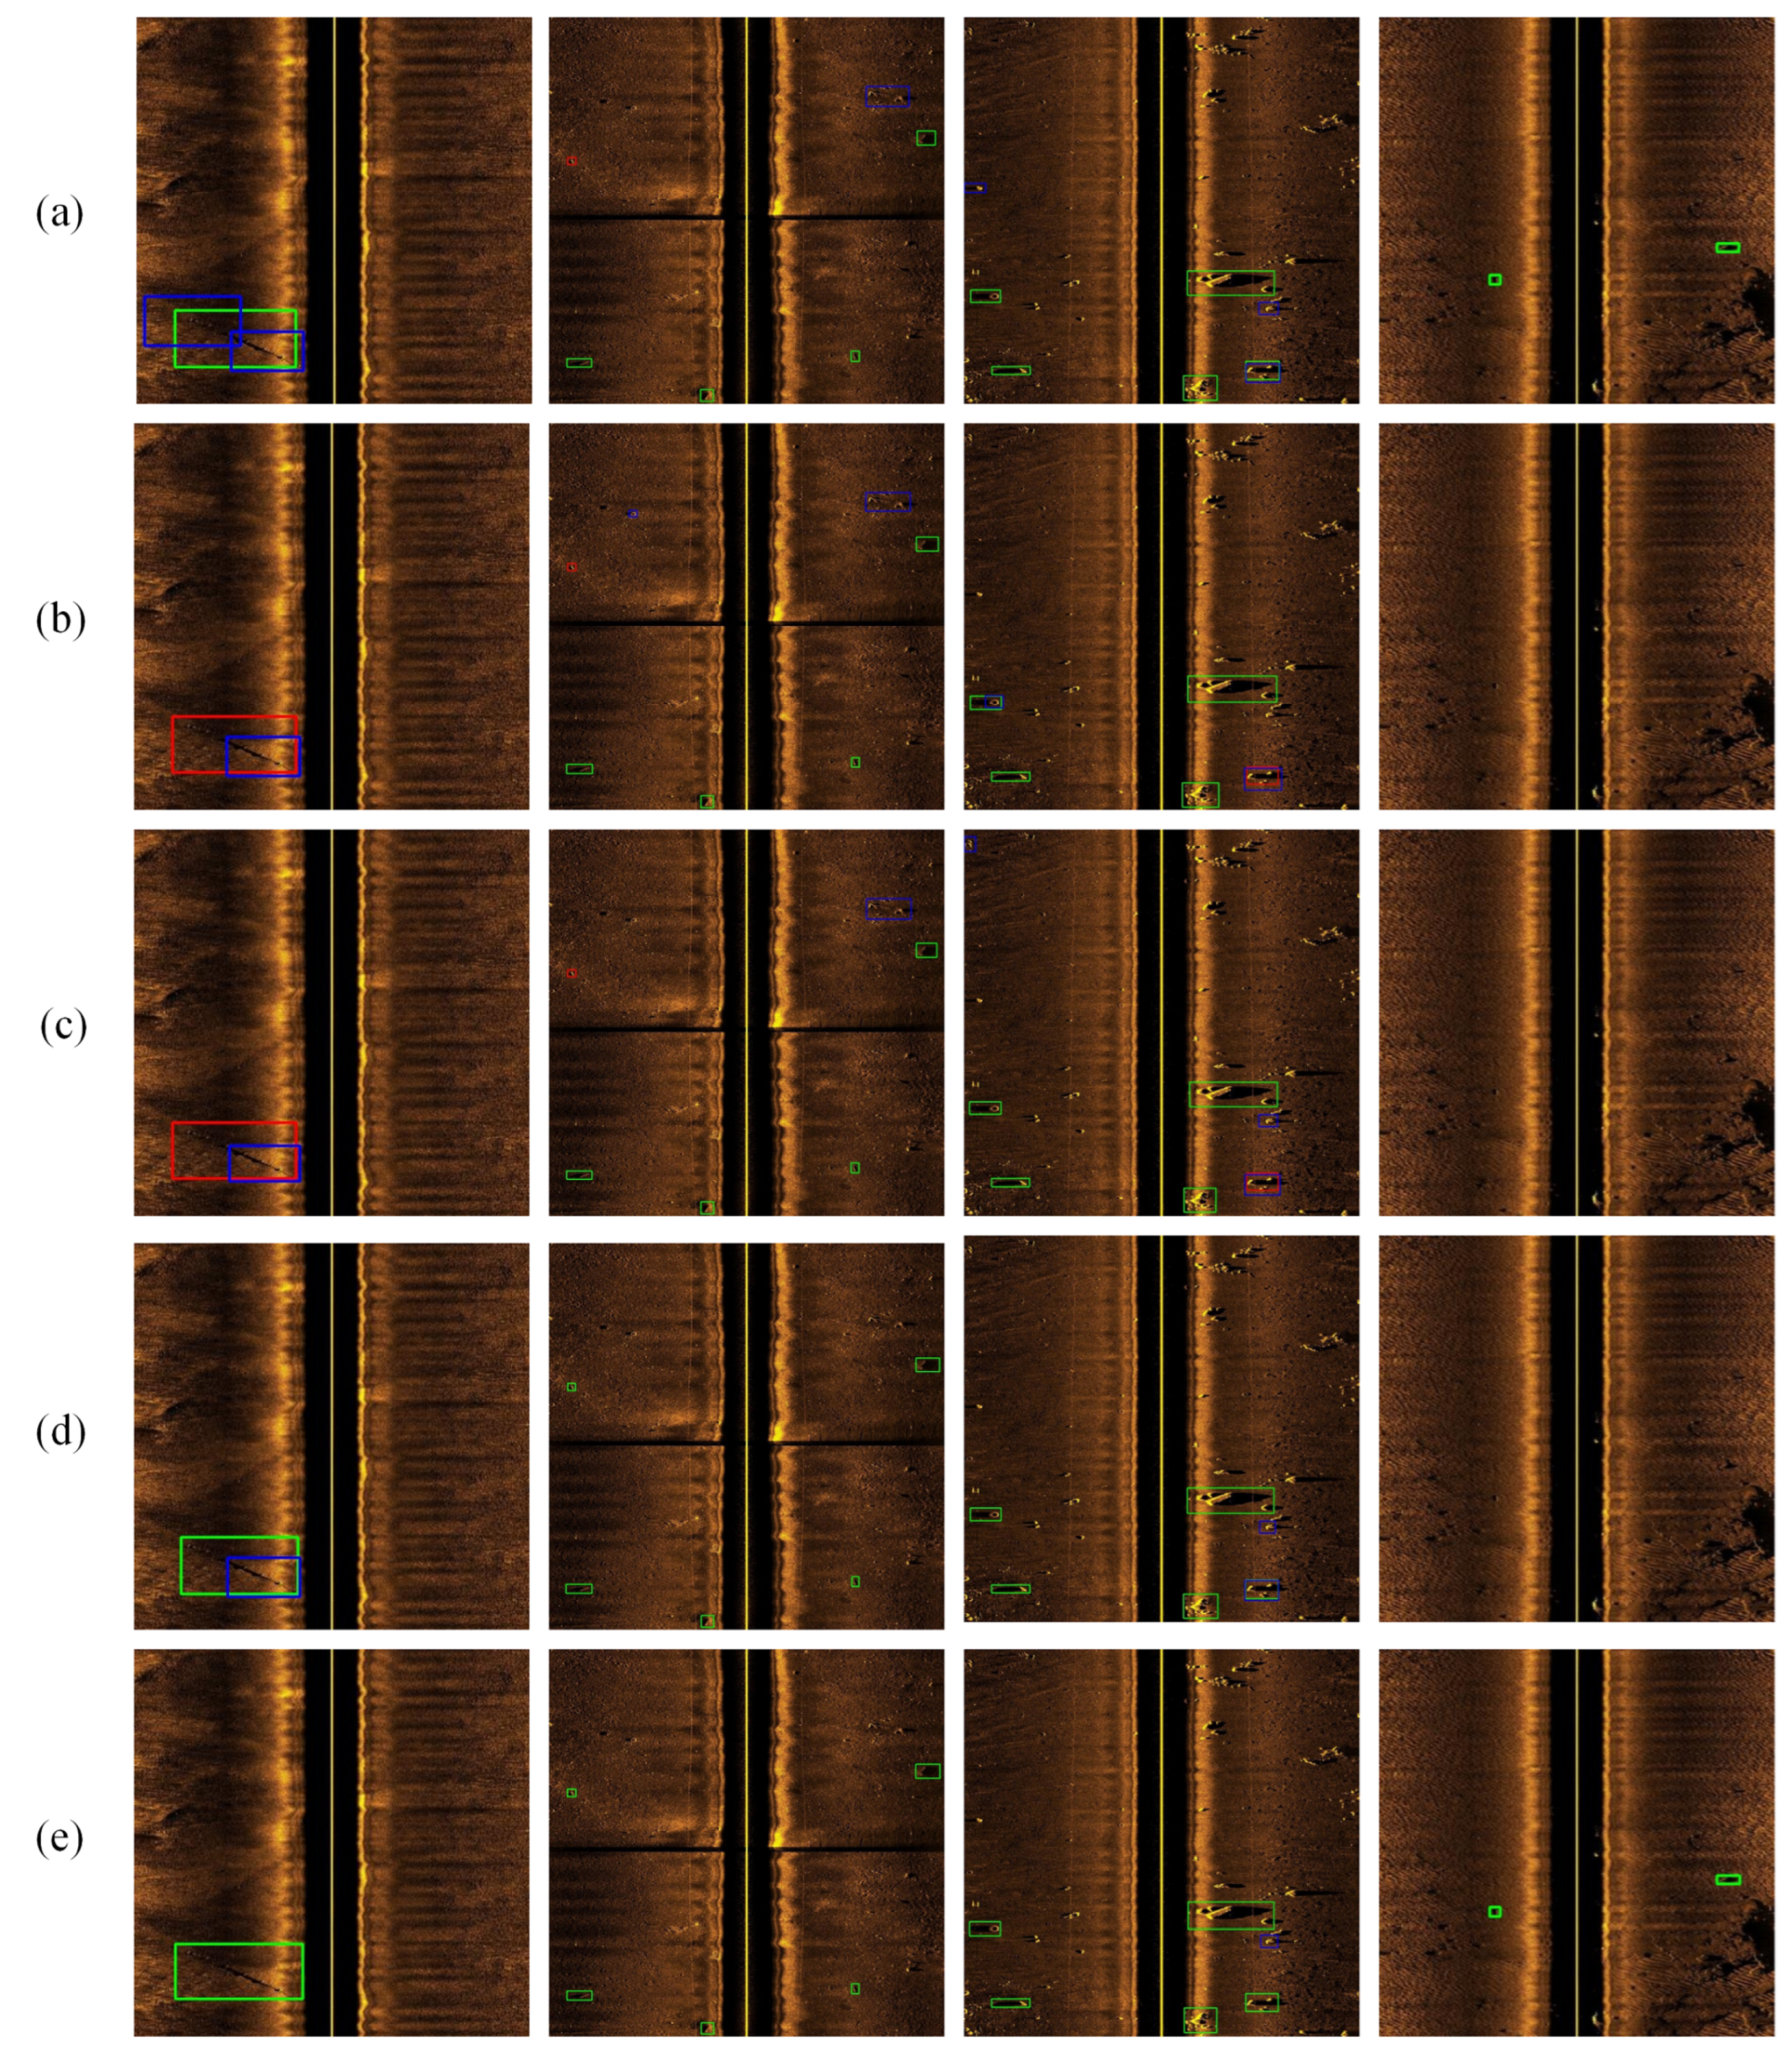
To further verify the effectiveness of the ESL-YOLO model, we conducted a visual comparison of detection performance between Faster R-CNN and YOLO-series models on the test set. In the visualization results, green boxes represent correctly detected targets, red boxes indicate missed detections, and blue boxes denote false detections. The detection outcomes are presented in
Figure 11.
As shown in
Figure 11, Faster R-CNN demonstrates good noise adaptation capability and performs relatively well in correct detection count. However, it exhibits over-detection phenomena by incorrectly decomposing single large-scale targets into multiple independent small targets. The one-stage detectors YOLOv5s and YOLOv8s achieve only partial detection of large-scale targets while showing high rates of omissions and false detections of small targets. YOLOv11s, serving as the baseline model, achieves a lower missed detection rate after architectural optimization, but suffers from compromised completeness in large target detection and still exhibits small target missed detection issues in noisy sonar images with low contrast.
In contrast, ESL-YOLO achieves the best performance in side-scan image target detection tasks, with only one instance of small target misidentification. The visualization results demonstrate that for small target detection, the algorithm can accurately identify micro-scale targets even under adverse conditions commonly present in side-scan sonar imaging, including severe background reverberation interference, seafloor scattering noise, and low signal-to-noise ratios, while maintaining false detection rates at extremely low levels. For large target detection, due to the effective integration of multi-scale information through the SCDA cross-layer feature fusion strategy and precise control of bounding box prediction by the LQE location quality evaluation mechanism, the algorithm eliminates the problem of detecting only partial target regions, achieving consistent high-precision detection from small to large targets.
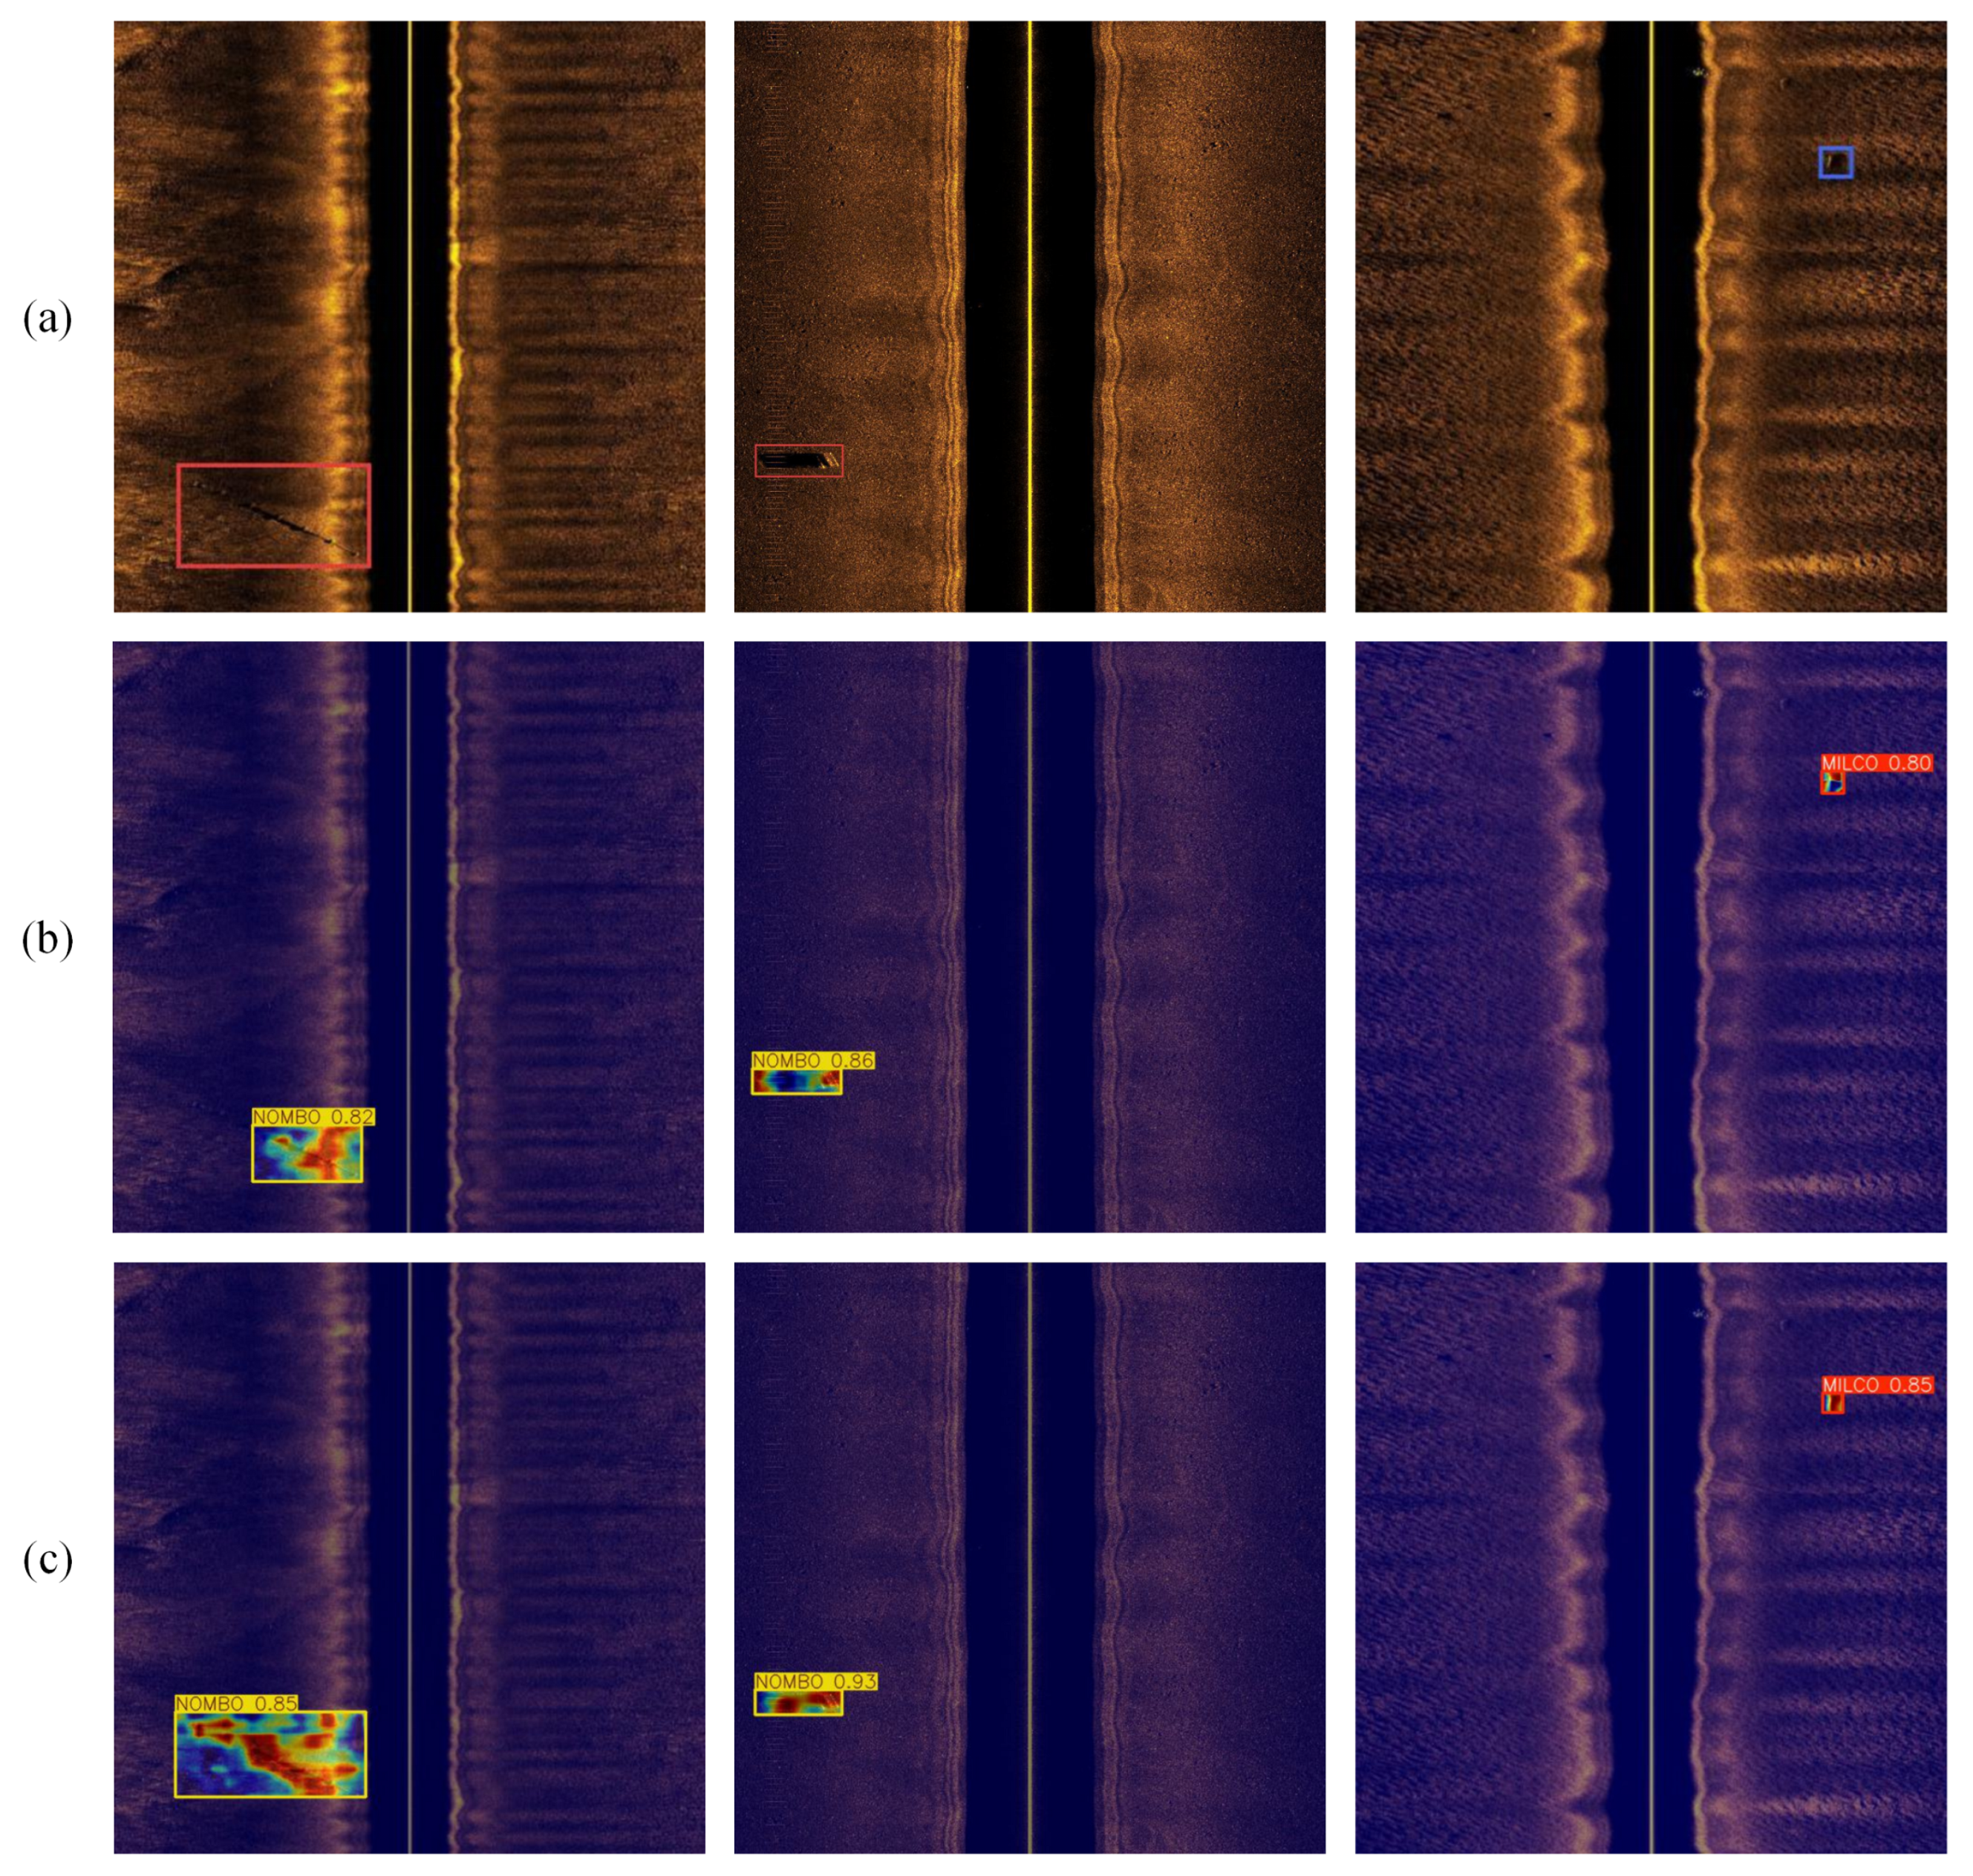
To better illustrate the feature extraction capacity of the improved model for underwater targets, we employed the GradCAM++ algorithm [
41] to present results visually through heatmaps and conduct a comparison between ESL-YOLO and YOLOv11s. The visualization results are shown in
Figure 12. In the heatmaps, color intensity represents attention levels, with brighter colors indicating higher attention and greater probability of object presence. This visualization not only confirms if the model accurately centers on object regions but also uncovers potential zones prone to detection errors. ESL-YOLO clearly highlights important target features more effectively with higher confidence, achieving optimal detection performance.
4.3.5. Generalization Validation Experiments
To verify the generalization capability of ESL-YOLO, comparative experiments were carried out in this research using two additional sonar image datasets to evaluate the algorithm’s detection performance across varying data distributions and target types.
The two validation datasets possess distinct data characteristics and application scenarios. The Consumer Class Side Scanning Sonar Dataset for Human Detection (SSHD), constructed by Aaltonen et al. [
42], comprises 695 consumer-grade side-scan sonar images, including 331 underwater human body images and 364 background or other target images. This dataset was collected using side-scan sonar in nearshore shallow water areas of Finland, with an image resolution of 100 × 70 pixels, primarily designed for human detection in underwater rescue scenarios. The Sonar Common Target Detection Dataset (SCTD) contains 357 high-resolution sonar images, encompassing 266 shipwrecks, 57 aircrafts, and 34 human targets, exhibiting an imbalanced target category distribution of 8:2:1, which presents relatively high detection difficulty [
43].
Both datasets were divided into training, validation, and test sets following a 7:1:2 proportion to ensure experimental consistency and comparability. The performance comparison between ESL-YOLO and YOLOv11s on the two validation datasets is presented in
Table 3. On the SSHD dataset, ESL-YOLO demonstrates exceptional performance. It achieves a precision of 96.98%, a recall of 97.16%, and an mAP@0.5 of 98.78%. These values represent improvements of 1.75%, 6.48%, and 4.06%, respectively, compared to YOLOv11s, which showcases its powerful detection capabilities in low-resolution human detection tasks. On the SCTD dataset, ESL-YOLO achieves a precision of 95.2%, an improvement of 4.59% over YOLOv11s; mAP@0.5 of 78.25%, an improvement of 8.29 percentage points; and mAP@0.5:0.95 of 53.17%, an improvement of 5.82%, maintaining stable performance advantages in multi-class imbalanced detection tasks.
The experimental results demonstrate that consistent performance advantages are maintained by ESL-YOLO across sonar image detection tasks with different data distributions, resolutions, and target types. This confirms the validity and generalizability of the proposed improvement strategies. Particularly, the near-perfect detection performance achieved on the low-resolution SSHD dataset and the significant improvements observed on the complex multi-class SCTD dataset further confirm the practical value of ESL-YOLO in diverse marine environment target detection scenarios.
5. Conclusions
To address the shortcomings of existing object detection methods in processing low-resolution side-scan sonar images featuring targets with blurred boundaries and complex shapes, this study proposes the ESL-YOLO high-precision detection framework specifically tailored for side-scan sonar image analysis. Based on YOLOv11, the framework introduces three innovations: First, it integrates the Edge Feature Module (EFM) into the C3k2 module, fusing edge and spatial features through a dual-branch architecture to significantly enhance the ability to recognize targets with blurred boundaries. Second, in the neck network, it employs feature cross-correction and multi-scale channel attention fusion mechanisms to achieve adaptive integration of shallow detail features and deep semantic features, improving the detection performance for small targets and those with complex morphologies. Finally, it incorporates a position quality estimator in the detection head, which effectively reduces false positives and false negatives by optimizing the consistency between classification and localization.
Experiments on the SIMD dataset demonstrate that ESL-YOLO outperforms various mainstream detection algorithms, achieving a precision of 87.67%, a recall of 75.63%, and an mAP@0.5 of 84.65%. Ablation studies show that each module and their combinations can improve detection performance, while visualization comparisons intuitively reveal the robustness of the improved algorithm in underwater target detection scenarios. Generalization experiments on other sonar datasets further validate the effectiveness of the proposed improvements across different data distributions and target types.
The proposed ESL-YOLO framework exhibits great potential in enhancing the automated analysis capabilities of sonar images in marine environments. However, the current research still has limitations that require further exploration. A notable shortcoming is the lack of actual deployment evaluation on embedded systems and unmanned underwater platforms. Future research will focus on developing lightweight model architectures to improve computational efficiency and reduce resource requirements in real-time underwater detection scenarios.


