Article

Force Element Analysis of Vortex-Induced Vibration Mechanism of Three Side-by-Side Cylinders at Low Reynolds Number

by
Su-Xiang Guo
1,
Meng-Tian Song
1,*,
Jie-Chao Lei
2,
Hai-Long Xu
3 and
Chien-Cheng Chang
4,*
1
College of Mechanical and Marine Engineering, Beibu Gulf University, Qinzhou 535011, China
2
Faculty of Civil Engineering and Mechanics, Kunming University of Science and Technology, Kunming 650500, China
3
School of Mechanical and Electronic Engineering, Pingxiang University, Pingxiang 337055, China
4
Institute of Applied Mechanics, College of Engineering, National Taiwan University, Taipei 10764, Taiwan
*
Authors to whom correspondence should be addressed.
J. Mar. Sci. Eng. 2025, 13(8), 1446; https://doi.org/10.3390/jmse13081446
Submission received: 18 June 2025 / Revised: 25 July 2025 / Accepted: 28 July 2025 / Published: 29 July 2025
(This article belongs to the Section Ocean Engineering)

Abstract

This study employs a force element analysis to investigate vortex-induced vibrations (VIV) of three side-by-side circular cylinders at Reynolds number Re = 100, mass ratio m* = 10, spacing ratios S/D = 3–6, and reduced velocities Ur = 2–14. The lift and drag forces are decomposed into three physical components: volume vorticity force, surface vorticity force, and surface acceleration force. The present work systematically examines varying S/D and Ur effects on vibration amplitudes, frequencies, phase relationships, and transitions between distinct vortex-shedding patterns. By quantitative force decomposition, underlying physical mechanisms governing VIV in the triple-cylinder system are elucidated, including vortex dynamics, inter-cylinder interference, and flow structures. Results indicate that when S/D < 4, cylinders exhibit “multi-frequency” vibration responses. When S/D > 4, the “lock-in” region broadens, and the wake structure approaches the patterns of an isolated single cylinder; in addition, the trajectories of cylinders become more regularized. The forces acting on the central cylinder present characteristics of stochastic synchronization, significantly different from those observed in two-cylinder systems. The results can advance the understanding of complex interactions between hydrodynamic and structural dynamic forces under different geometric parameters that govern VIV response characteristics of marine structures.

1. Introduction

Vortex-Induced Vibration (VIV) is a critical research topic focused within the fluid-structure interaction (FSI) domain, particularly for bluff-body engineering structures such as bridge cables, heat exchanger tube bundles, and especially marine risers [1,2,3]. VIV significantly impacts structural stability, fatigue life, and overall performance. Engineering applications often involve multiple cylinders arranged in various configurations: tandem, side-by-side, and staggered arrangements [1]. The side-by-side configuration, as a typical multi-cylinder arrangement, exhibits VIV characteristics governed by complex interactions of vortex-shedding modes, flow interference effects, and geometric parameters. A thorough investigation of this configuration is essential for understanding and controlling VIV behaviors in such structures.
Research on the VIV of two side-by-side cylinders has garnered considerable attention in recent years. Zhao [2] numerically studied VIV of two rigidly coupled cylinders at low Reynolds numbers Re across various spacing ratios, finding that for S/D ≥ 4.0 (where S is the center distance of adjacent cylinders, and D is the diameter of the cylinder), the response closely resembled that of an isolated single cylinder. Bao et al. [3] numerically studied the forced in-phase vibration of two cylinders at Re = 100 and S/D = 1.2–4.0 and observed three “non-lock-in” and two “lock-in” flow response modes. Chen et al. [4] identified six distinct wake patterns for VIV of two cylinders. They also discovered asymmetric in-line vibration within the reduced velocity range 4.0 < Ur < 4.4 (Ur = U/fnD, where U is the free-stream velocity and fn is the natural frequency), which remained unchanged with increasing or decreasing Ur.
Regarding the three side-by-side configuration, Zhang and Zhou [5] experimentally studied the turbulent near-wakes behind three cylinders with both equal and unequal spacing and analyzed pressure distribution, drag/lift forces, dominant frequencies, and vortex formation mechanisms. Subsequently, Zhou [6] conducted further experiments on the flow behind three cylinders at S/D = 1.5, analyzed the formation of wide and narrow wakes, and discussed the flow topology (vortex patterns) around cylinders in detail. Kang [7] performed numerical simulations at Re = 100 and S/D = 1.2–5.0 and identified five distinct regimes of flow modes: single bluff body, deflected, flip-flopping, in-phase, and phase-modulated. Force coefficients and shedding frequencies were found to be strongly dependent on S/D, with flow parameters similar to a two-cylinder system. UI Islam et al. [8] systematically investigated the flow past three side-by-side square cylinders with different spacing and analyzed wake structure, time histories of drag/lift coefficients, and vortex-shedding frequencies. Gao et al. [9] employed Particle Image Velocimetry (PIV) to study the effect of cylinder inclination angle on the wake characteristics behind two and three side-by-side inclined cylinders, identifying pure deflected gap flow, non-deflected gap flow, and trigger-type gap flow patterns. Sooraj et al. [10] used PIV to study the flow around three cylinders, where S/D ranged from 1.5 to 4.0 and Re = 90–560, reporting five distinct flow modes: asymmetric biased flow, bi-stable biased flow, equally biased flow, equally unbiased flow, and synchronized equal flow. More et al. [11] studied the flow field over three side-by-side square cylinders in a low-speed wind tunnel. Ali et al. [12] numerically investigated the flow past three co-rotating side-by-side cylinders via 2D simulations at Re = 100, dimensionless rotation rates α = 0–8, S/D = 1.5, 2, and 4. They found that vortex shedding behind the three cylinders was successively suppressed as the rotation rate increased.
In summary, prior research on three side-by-side cylinders has primarily focused on describing flow states and wake patterns. Less attention has been paid to characterizing the VIV response (amplitude, frequency, and phase) and the complex hydrodynamic interactions between cylinders in such configurations. Recently, our group employed the Multi-Body Force Element Analysis to explore the hydrodynamic mechanisms and complex interactions in VIV of two side-by-side cylinders, yielding unique insights [13,14]. Force Element Analysis (FEA) [15] decomposes hydrodynamic forces into volume vorticity force, surface vorticity force, and surface acceleration force through the introduction of auxiliary potential functions along each cylinder surface direction, fundamentally derived from the vorticity forces within the flow field. This enables the examination of individual fluid element contributions to the force on each body. Over the years, FEA has been successfully applied and extended to solve problems involving compressible flow [16], multi-body interactions [13,14], and shear flow [17]. Coupled with structural dynamics models, FEA can effectively simulate the overall VIV process as well.
This study aims to systematically elucidate the VIV mechanisms of three side-by-side cylinders under varying spacing ratios (S/D) and reduced velocities (Ur) by FEA. This study aims to deeply understand their dynamic response characteristics by investigating the influence of S/D on VIV parameters (amplitude, frequency, and phase) and phenomena (vortex-shedding mode transitions, flow interference effects, and vibration mode shifts). At the same time, the VIV characteristics under different Ur are investigated, and the regulation effect of Ur on the key factors such as vibration amplitude, trajectory, and stability is revealed.
The subsequent sections are organized as follows: Section 2 details the computational setup and formulation, including flow parameters, boundary conditions, governing Navier–Stokes equations, Force Element Theory implementation, structural vibration equations, mesh update strategy, and grid independence verification. Section 3 presents and discusses the results, focusing on key findings. Finally, Section 4 summarizes the main conclusions.

2. Computational Setup and Formulation
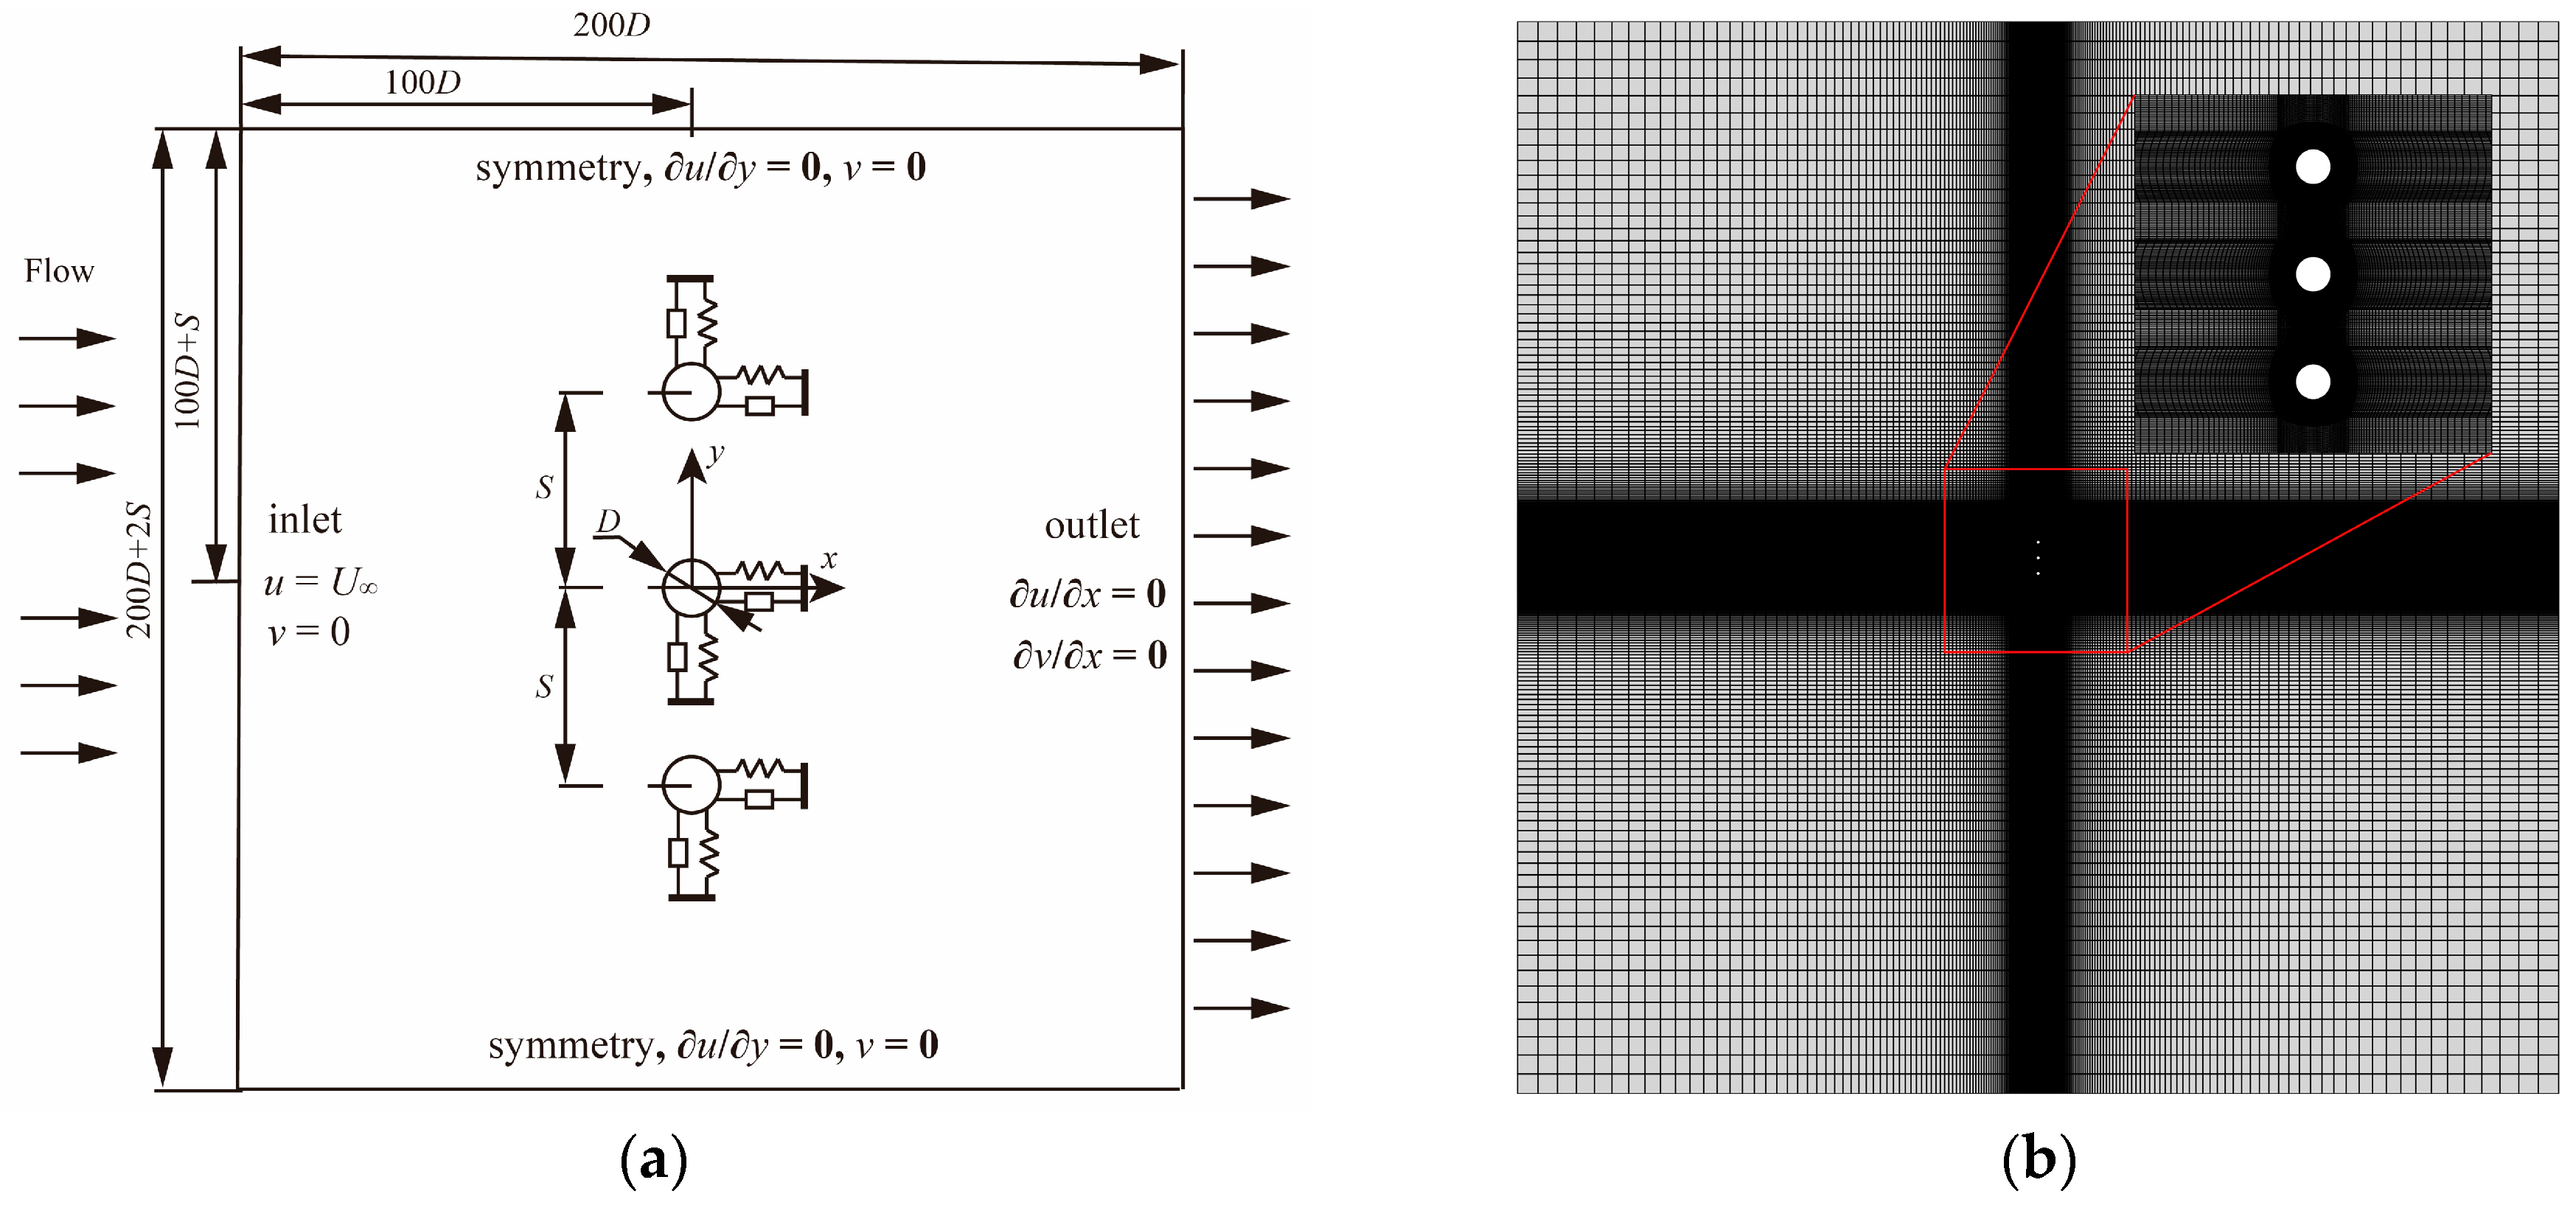
2.1. Physical Model

As illustrated in Figure 1a, the computational domain for the flow field in this study is set to be [−100D, 100D] × [−100DS, 100D + S]. The resulting blockage ratio is B = 0.005 (=D/H, where H is the transverse width of the computational domain), which can significantly mitigate the influence of blockage effects on the flow field results, ensuring computational accuracy (Chen et al. [18]). The inlet boundary condition is specified as a velocity inlet (u = U and v = 0), while the outlet is set as a zero-pressure outlet (∂u/∂x = 0 and ∂v/∂x = 0). The upper and lower boundaries employ symmetry conditions (∂u/∂y = 0 and v = 0). A no-slip condition is applied on the cylinder surfaces, and the fluid medium is water. Cylinders are numbered sequentially from C1 (top) to C3 (bottom). Cylinder C2 is positioned at the domain center, with C1 and C3 arranged symmetrically about the x-axis at equal spacing.
As shown in Figure 1b, the circumferential mesh around each cylinder is “C” type (Cui et al. [19]). To accurately resolve the hydrodynamic forces acting on the cylinders and capture the vortex shedding during VIV, a local refinement zone is implemented around each cylinder. The surface of each cylinder is discretized with 240 nodes. The dimensionless height of the first layer of grids adjacent to the cylinder surface is h* = h/D = 0.0025, where h denotes the height of the first layer of grids (Song et al. [13]).

2.2. Numerical Methods

2.2.1. Governing Equations

The two-dimensional (2D), laminar, incompressible uniform flow past a group of solid bodies is governed by the dimensionless Navier–Stokes equations and the continuity equation (Ali et al. [12]):
v t   +   v   ·   v   =   P   +   1 Re 2 v
  ·   v   = 0
where v denotes the dimensionless velocity vector, ∇ is the gradient operator, P = P*/(ρU2) represents the dimensionless pressure, dimensionless time t = τU/D, and Re = ρUD/μ is the Reynolds number. Where P* is the pressure, ρ is the fluid density, τ is the flow time, and μ is the dynamic viscosity.

2.2.2. Force Element Formula

As illustrated in Figure 2, a uniform viscous inflow U passes through N bodies, where SR denotes the far-field boundary and VR represents the fluid domain. Classical hydrodynamic force calculation is typically based on the Pressure Method (PM). Taking cylinder C1 as an example, the well-established formula for computing the hydrodynamic force coefficient is (Song et al. [13]):
C total 1   =   C P   +   C f   =   S 1 P   ( n   ·   i )   d A   +   1 R e S 1 n   ×   ω   ·   i   d A
here, Ctotal1 represents the total hydrodynamic force coefficient on cylinder C1, where Ctotal = Ftotal/(0.5ρU2D), Ftotal is the total hydrodynamic force, CP denotes the pressure component, and Cf denotes the friction component. i represents the unit vector, n is the inward-pointing unit normal vector on the body surface, and ω is the vorticity of the flow field.
The coupling between the unsteady wake and the motion of the cylinders can generate numerous phenomena, the underlying mechanism of which is rooted in complex vorticity dynamics (Bao et al. [3]). The Force Element Theory (FET) proposed by Chang [15] provides a vorticity-based perspective for determining hydrodynamic forces from the vorticity distribution in the flow field. Compared to PM, FET is highly beneficial for analyzing the fluid forces acting on the cylinders and decomposing the contributions of individual force elements.
The key development in FET lies in introducing an auxiliary potential function ϕ for each direction on the cylinder surface. ϕ decays rapidly away from the body, vanishes at infinity (ϕ = 0), and satisfies Laplace’s equation (∇2ϕ = 0) within VR. Combining Equations (1) and (2) with the boundary conditions for ϕ on the cylinders—specifically, n · ∇ϕ = –n · i on the surface of cylinder i and n · ∇ϕ = 0 on the surfaces of all other cylinders—yields the multi-body FET formulation for the pressure component CP of Equation (3) on cylinder i (=1, 2, 3…N):
C P , total   =   S 1   S N ϕ v t ·   n   d A   +   1 2 S 1   S N v 2 ϕ   ·   n   d A V R v ×   ω   ·   ϕ   d V   +   1 R e S 1   S N n ×   ω   ·   ϕ   d A
This study considers flow past N = 3 bodies with surfaces S1, S2, and S3. Focusing on the drag direction and taking the force coefficient on cylinder C1 as an example, Equation (3) can be simplified to
C d 1 = S 1 ϕ v t ·   n   d A + 1 2 S 1 v 2 ϕ   ·   n   d A V R v ×   ω   ·   ϕ   d V + 1 R e S 1 n ×   ω   ·   ϕ   + i   d A + S 2 ϕ v t ·   n   d A + 1 R e S 2 n ×   ω   ·   ϕ   d A + S 3 ϕ v t   ·   n   d A + 1 R e S 3 n ×   ω   ·   ϕ   d A                
which can be compactly expressed as
C d 1 = C d a 1 + C d u 1 + C d v 1   +   C d s 1   +   C d a 21   +   C d s 21   +   C d a 31   +   C d s 31
where Cda1 represents the drag component caused by the surface acceleration of cylinder C1; Cdu1 represents the drag component caused by the surface velocity of cylinder C1 (which is zero in this study due to symmetry effects); Cdv1 represents the drag component caused by the volume vorticity in the flow field acting on C1; Cds1 represents the drag component caused by the surface vorticity of cylinder C1; Cda21 and Cds21 represent the drag component of cylinder C1 caused by cylinder C2’s surface acceleration and surface vorticity, respectively; and Cda31 and Cds31 represent the drag component of cylinder C1 caused by C3’s surface acceleration and surface vorticity, respectively.
Similarly, for the lift direction, the force coefficient Cl1 on C1 is expressed as
C l 1 = C la 1 + C lu 1 + C lv 1 + C ls 1 + C la 21 +   C ls 21 +   C la 31 +   C ls 31

2.2.3. Vibration Governing Equations

As illustrated in Figure 1a, the vibration model of an elastically mounted cylinder can be simplified as a mass-spring-damper system. In this study, each cylinder is free to vibrate independently in both the transverse (cross-flow) and streamwise (in-line) directions. The governing equations for cylinder i are
m x ¨ i +   c x ˙ i +   k x i = F x i
m y ¨ i + c y ˙ i + k y i = F y i
where Fxi and Fyi represent the hydrodynamic forces acting on cylinder i in the drag (streamwise) and lift (transverse) directions, respectively. c denotes the damping coefficient, k denotes the spring stiffness coefficient, and m denotes the cylinder mass. The subscript i = 1, 2, and 3 corresponds to the top cylinder (C1), the middle cylinder (C2), and the bottom cylinder (C3).
This study utilizes the ANSYS Fluent platform 2021R1. The fluid-structure coupling is implemented through User-Defined Functions (UDFs). The hydrodynamic forces Fxi and Fyi, calculated using the Force Element Theory via Equations (6) and (7), are transferred into the structural vibration Equations (8) and (9) within the UDFs. The pressure-velocity coupling in the flow field is handled using the SIMPLEC algorithm. The structural response is solved numerically using the fourth-order Runge-Kutta method. Given the displacement y(tn) and velocity y ˙ (tn) at time-step number n, the displacement and velocity at step n + 1 are computed as follows:
y ˙ t n + 1   =   y ˙ t n   +   Δ t 6 ( K 1   +   2 K 2   +   2 K 3   +   K 4 )
y ( t n + 1 ) = y ( t n ) + y ˙ ( t n ) Δ t + Δ t 2 6 ( K 1 + K 2 + K 3 )
in which,
K 1 = F l ( t n ) m c m y ˙ ( t n ) k m y ( t n )
K 2 = F l ( t n ) m c m y ˙ t n + Δ t 2 K 1 k m y ( t n ) + Δ t 2 y ˙ ( t n )
K 3 = F l ( t n ) m c m y ˙ t n + Δ t 2 K 2 k m y ( t n ) + Δ t 2 y ˙ t n + Δ t 2 4 K 1
K 4 = F l ( t n ) m c m y ˙ t n + K 3 Δ t k m y ( t n ) + y ˙ t n Δ t + Δ t 2 2 K 2
where Δt is the time-step size, and K1K4 are transition functions of fourth-order Runge-Kutta.
The cylinder displacement data is transferred to the flow field mesh using dynamic mesh techniques. A diffusion-based smoothing method is employed to update the flow field mesh at each time step. This method propagates the displacement near the cylinders throughout the mesh domain, prioritizing the preservation of mesh quality around the cylinders and minimizing mesh deformation in their vicinity. The convergence criterion of iteration residuals for the flow field is set to 10−5.

2.3. Independence Verification

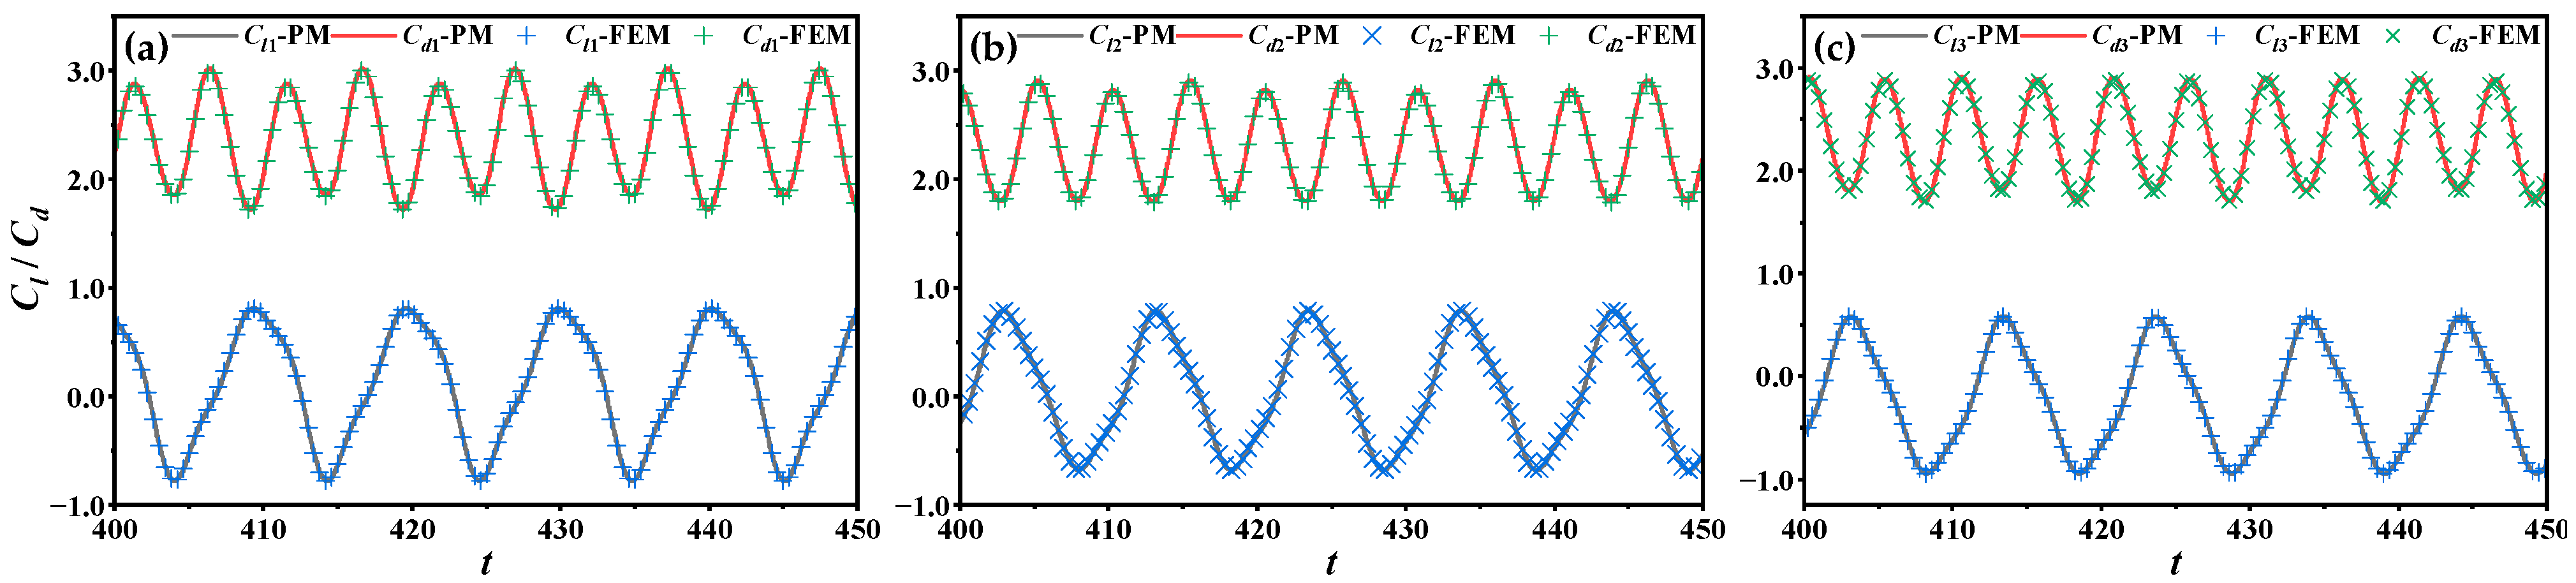
2.3.1. Method Validation

Prior to conducting numerical simulations, the VIV of an elastically mounted single cylinder was simulated to validate the effectiveness of the numerical method. Regarding the verification of the multi-body force element method (FEM) for VIV, our previous study (Song et al. [13]) had already validated the numerical approach of two side-by-side cylinders with two degrees of freedom, with comparisons made against the results from Chen et al. [18], demonstrating the feasibility of the program and methodology. The numerical model was also validated against the results from Kang [7] (using the immersed boundary (IB) method) and Ali et al. [12] for three side-by-side cylinders at Re = 100. The corresponding results are given in Table 1, achieving excellent agreement, where St represents the Strouhal number.
Simultaneously, as illustrated in Figure 3, a comparison of lift coefficients obtained from VIV simulations for three side-by-side cylinders at S/D = 4 and Ur = 5 was conducted between PM (ANSYS Fluent built-in solver) and the FEM (ANSYS Fluent UDFs solver), demonstrating that FEM provides reliable predictions for the VIV response of elastically mounted structures at low Re.

2.3.2. Grid and Time-Step Independence Verification

To ensure the accuracy and stability of the selected computational parameters, a grid and time-step independence test was conducted, as summarized in Table 2. The computational parameters were set as Re = 100, m* = m/mf = 10, S/D = 6, Ur = 5, and ζ = 0. Here, mf is the fluid mass of the same volume as the cylinder. Ay* = Ay/D represents the dimensionless cross-flow amplitude, where the vibration amplitude in the cross-flow direction is defined as Ay = (ymaxymin)/2, with ymax and ymin denoting the maximum and minimum displacements, respectively. Cl,rms denotes the root-mean-square lift coefficient:
C l , rms = 1 N i = 1 N C l 2
where N is the number of samples.
The simulations were performed on a Windows 10 platform equipped with dual Intel Xeon Gold 6226R 2.9 GHz CPUs and 512 GB of RAM. Each case utilized 6 cores. For the transient simulations using the solver (Fluent 2021 R1) and parallel strategy (MPI domain decomposition), the M3 and M4 meshes typically consumed 235 and 305 h, respectively. A significant increase in CPU time was observed when moving from M3 to M4. Comparisons of Cl,rms and dimensionless displacement Ay* across different mesh elements revealed that results from grid scheme M3 (162,500 elements) showed excellent agreement with those from the finer grid M4 (221,400 elements). The computational accuracy of M3 had reached appropriate convergence. Considering both computational efficiency and accuracy, grid scheme M3 was selected for this study. Second, temporal evolution comparisons of Cl,rms and Ay* using grid M3 demonstrated that results with the dimensionless time step Δt* = ΔtU/D = 0.0025 closely matched those obtained with the finer time step Δt* = 0.00125. The dimensionless time steps 0.0025 and 0.00125 consumed 235 and 576 h, respectively. The computational accuracy at Δt* = 0.0025 had achieved appropriate convergence. Consequently, the dimensionless time step Δt* = 0.0025 was ultimately adopted for this research.

3. Results and Discussions

This study employs the force element method to analyze the frequency response, hydrodynamic coefficients, wake characteristics, and motion trajectories of three side-by-side cylinders at Re = 100, m* = 10, S/D = 3–6, and Ur = 2–14, aiming to elucidate the effects of S/D and Ur on flow structures and dynamics.

3.1. Frequency and Amplitude Response Analysis

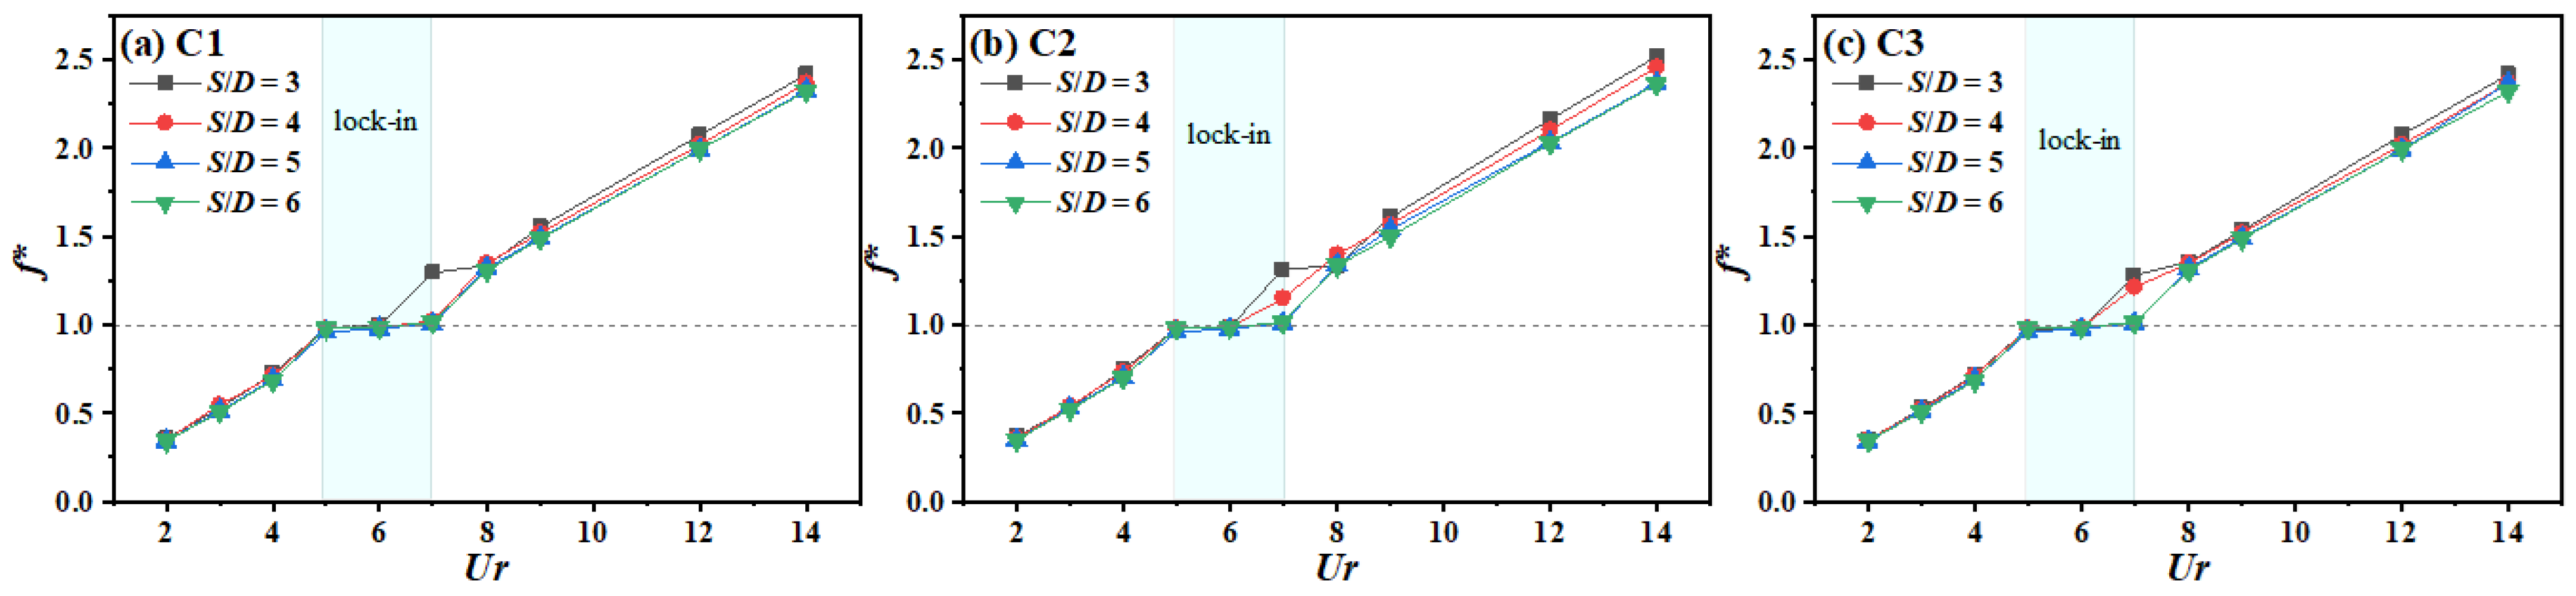
3.1.1. Frequency Response

Figure 4 illustrates the variation of the cylinder frequency ratio f* with Ur. At S/D = 3, the “lock-in” region occurs within Ur = 5–6, where the frequency ratios of cylinders C1, C2, and C3 satisfy f* = fs/fn ≈ 1 (fs is vortex-shedding frequency; fn is natural frequency). Notably, a “pseudo-lock-in” state emerges at S/D = 3 and Ur = 7–8, characterized by similar frequency ratios but transitional vibration amplitudes (see Section 3.1.2). At S/D = 4, the “lock-in” range for C1 spans Ur = 5–7, while for C2 and C3 it is Ur = 5–6. As S/D increases to 5 and 6, the “lock-in” region expands to Ur = 5–7 for all cylinders due to reduced inter-cylinder interference. After the “lock-in” region, C2 exhibits slightly higher f* than C1 and C3 at identical Ur.

3.1.2. Amplitude Response

Figure 5 shows the trends of dimensionless cross-flow amplitude Ay* and in-line amplitude Ax* versus Ur for S/D = 3–6. Based on amplitude and frequency, the vibration response splits into three branches: initial branch (IB), lower branch (LB), and desynchronization branch (DB) (Song et al. [13]). The contributions of force element components and their respective phases vary across different branches. On IB, the amplitudes are small, and the volume vorticity force (Clv) dominates, with all components contributing positively. On LB, the amplitudes increase, and the surface acceleration force (Cla) becomes the dominant factor; Clv shifts to an out-of-phase relationship. On DB, the amplitudes decay, and Clv once again dominates, while Cla transitions to an out-of-phase state (see Section 3.2 and Section 3.3).
At S/D = 3, both cross-flow and in-line vibration responses remain relatively small in IB (2 ≤ Ur < 5). As Ur increases into LB (5 ≤ Ur < 8), all cylinder amplitudes increase sharply, with peak Ax* and Ay* occurring at Ur = 5 for all three cylinders. Ay* of C2 is smaller than those of C1 and C3 due to stronger vibration interference from adjacent cylinders at closer spacing. This amplitude discrepancy gradually diminishes with increasing S/D. Ax* decreases sequentially from C1 to C3. At Ur = 7, the amplitudes of all cylinders reduce, though C1 maintains a slightly larger Ax* than C2 and C3. Upon transitioning to DB (8 ≤ Ur ≤ 14), amplitudes become comparable across cylinders except at Ur = 8 where C1 exhibits a larger cross-flow amplitude. The minimal spacing (S/D = 3) maximizes Ax* but minimizes Ay* due to intense cylinder interactions. For S/D = 4, on IB, amplitudes resemble those at S/D = 3. Within LB (“lock-in” region), Ay* peaks uniformly at Ur = 5 with near-identical magnitudes across cylinders. Ax* peaks at Ur = 5 for C1 but at Ur = 6 for C2 and C3. At Ur = 7, reduced interference from C1 and C3 causes a pronounced drop in Ay* of C2, while C1 and C3 maintain similar responses. At S/D = 5 and 6, all amplitudes peak at Ur = 5. S/D = 6 enhances Ay* while reducing inter-cylinder interactions. Conversely, Ax* diminishes with increasing S/D.
The streamwise amplitudes of C1 and C2 become largest when Ur = 5. When S/D ≤ 4, the streamwise amplitudes of C3 appear at Ur = 6. When S/D > 4, the streamwise amplitudes are the same as those of C1 and C2 at Ur = 5. Under the same Ur, in the in-line direction, the smaller the S/D, the greater the amplitudes in the in-line direction. In the transverse direction, the smaller the S/D, the lower the amplitudes in the transverse direction. This shows that in the parallel multi-cylinder system, the smaller the S/D, the greater the influence on the amplitudes of the cylinders, and the change of the in-line direction amplitudes is more sensitive. Also, it is noted that the amplitudes of the middle cylinder are lower than those of the top and bottom cylinders.

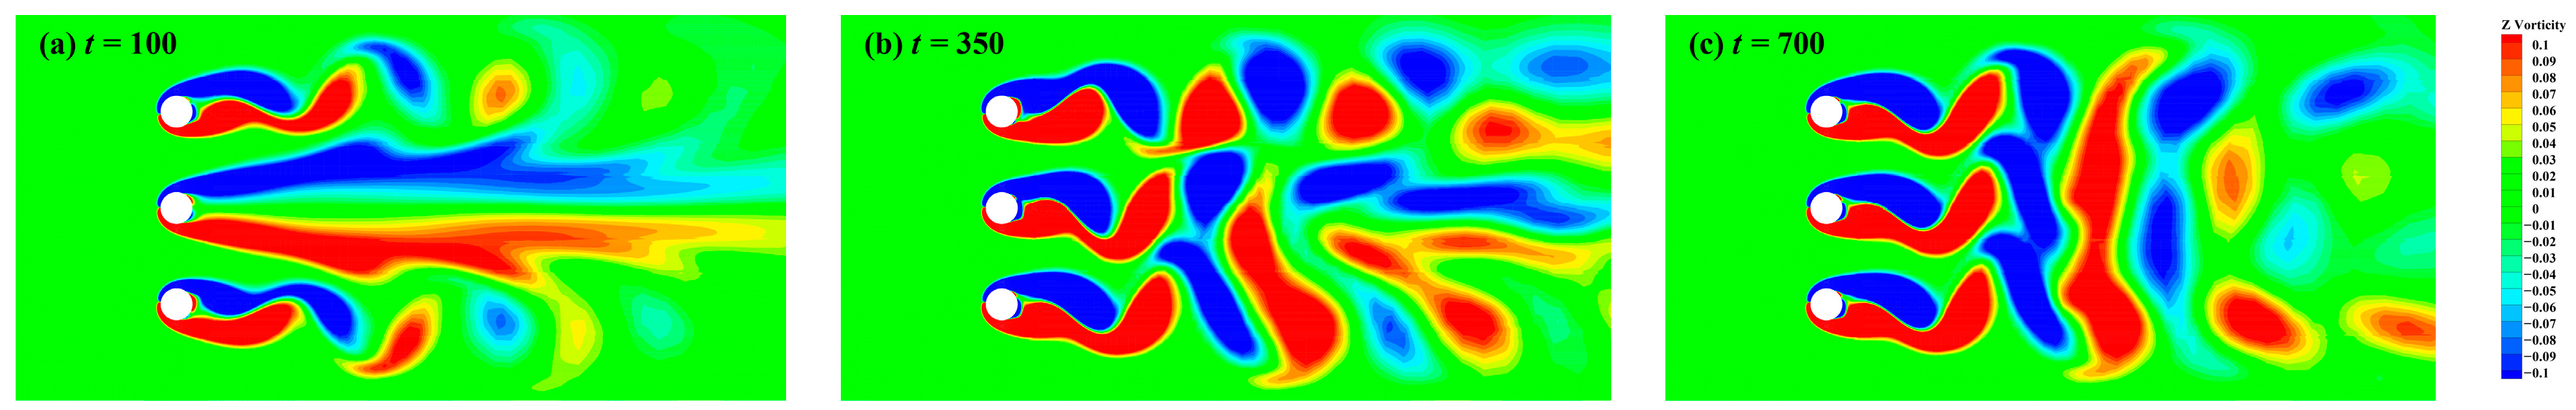
3.2. Wake Characteristic Analysis

The space ratio (S/D) significantly influences wake flow patterns (Thapa et al. [20]). Previous studies have extensively classified wake regimes for two side-by-side cylinders [21,22,23]. Chen et al. [24] identified six near-wake patterns across varying S/D. Kim and Durbin [25] experimentally observed that the direction of biased flow varies randomly over time in flip-flopping states at subcritical Re. While prior research neglected the vibration factor of cylinders at small S/D, this study examines wake patterns for three side-by-side cylinders under VIV at S/D = 3–6.

3.2.1. Steady-State Evolution Mode

Before discussing wake characteristics, three distinct steady-state evolution modes observed during VIV are defined: Tri-stage (I) (TS(I)), Bi-stage (BS), and Tri-stage (II) (TS(II)).
  • Tri-stage (I) (TS(I))
Figure 6a displays the time histories of lift and drag coefficients for three side-by-side cylinders at S/D = 3 and Ur = 2, revealing three distinct states. (a) Initial Steady State (Figure 7a): Cylinders C1 and C3 achieve stability with symmetric out-of-phase vortex shedding about the centerline, while C2 remains inactive without cross-flow vibration. The presence of C2 induces lateral migration of vortices behind C1 and C3, resembling two-cylinder behavior. (b) Middle Steady State (Figure 7b): The IS phase breaks down as the cross-flow amplitude of C2 grows and interacts with wakes from C1 and C3, forming an oscillatory modulated steady state. C2 and C3 start to vibrate with unstable wake patterns. (c) Final Steady State (Figure 7c): amplitudes stabilize to a new equilibrium. Notably, in the initial steady state, vortices behind C1 and C3 are out-of-phase synchronous; C2 develops a boundary layer which grows without independent shedding. In the middle steady state, vortices behind C1 and C2 are out-of-phase asynchronous; vortices behind C2 and C3 are in-phase asynchronous with biased asymmetric flow. In the final steady state, vortices behind all cylinders transition to in-phase asynchronous, converting from biased flow to symmetric flow. In the far flow field, three vortex streets coalesce into two asymmetric-strength ones.
  • Bi-Stage (BS)
Figure 6b shows time histories of lift and drag coefficients at S/D = 5 and Ur = 5, demonstrating two states: (a) Initial Steady State (Figure 8a): similar to TS(I) at S/D = 3, but increased spacing eliminates the migration of vortices behind C1 and C3 wakes, indicating weakened interference. (b) Final Steady State (Figure 8b): unlike S/D = 3, all cylinders develop independent 2S vortex-shedding modes. This stage occurs primarily within “lock-in” regions or at larger spacings.
  • Tri-Stage (II) (TS(II))
Figure 6c presents results at S/D = 5 and Ur = 7, featuring: (a) Initial Steady State (Figure 9a): analogous to Figure 8a. (b) Periodic Oscillation State (Figure 9b,c): Influenced by the in-line oscillation of C2, the hydrodynamic forces acting on cylinder C2 exhibit periodic amplification. Vorticity contours at t = 500 (Figure 9b) show out-of-phase asynchronous shedding between C1 and C2, transitioning to in-phase asynchronous at t = 538 (Figure 9c).
The three steady states under different S/D and Ur conditions are summarized in Table 3. At small S/D, it is mainly TS(I) and BS. When S/D increases to 4, it is mainly BS. The steady-state stage of TS(II) only occurs at S/D = 4 and 5, Ur = 7, which is a transition condition before leaving the “lock-in” region.

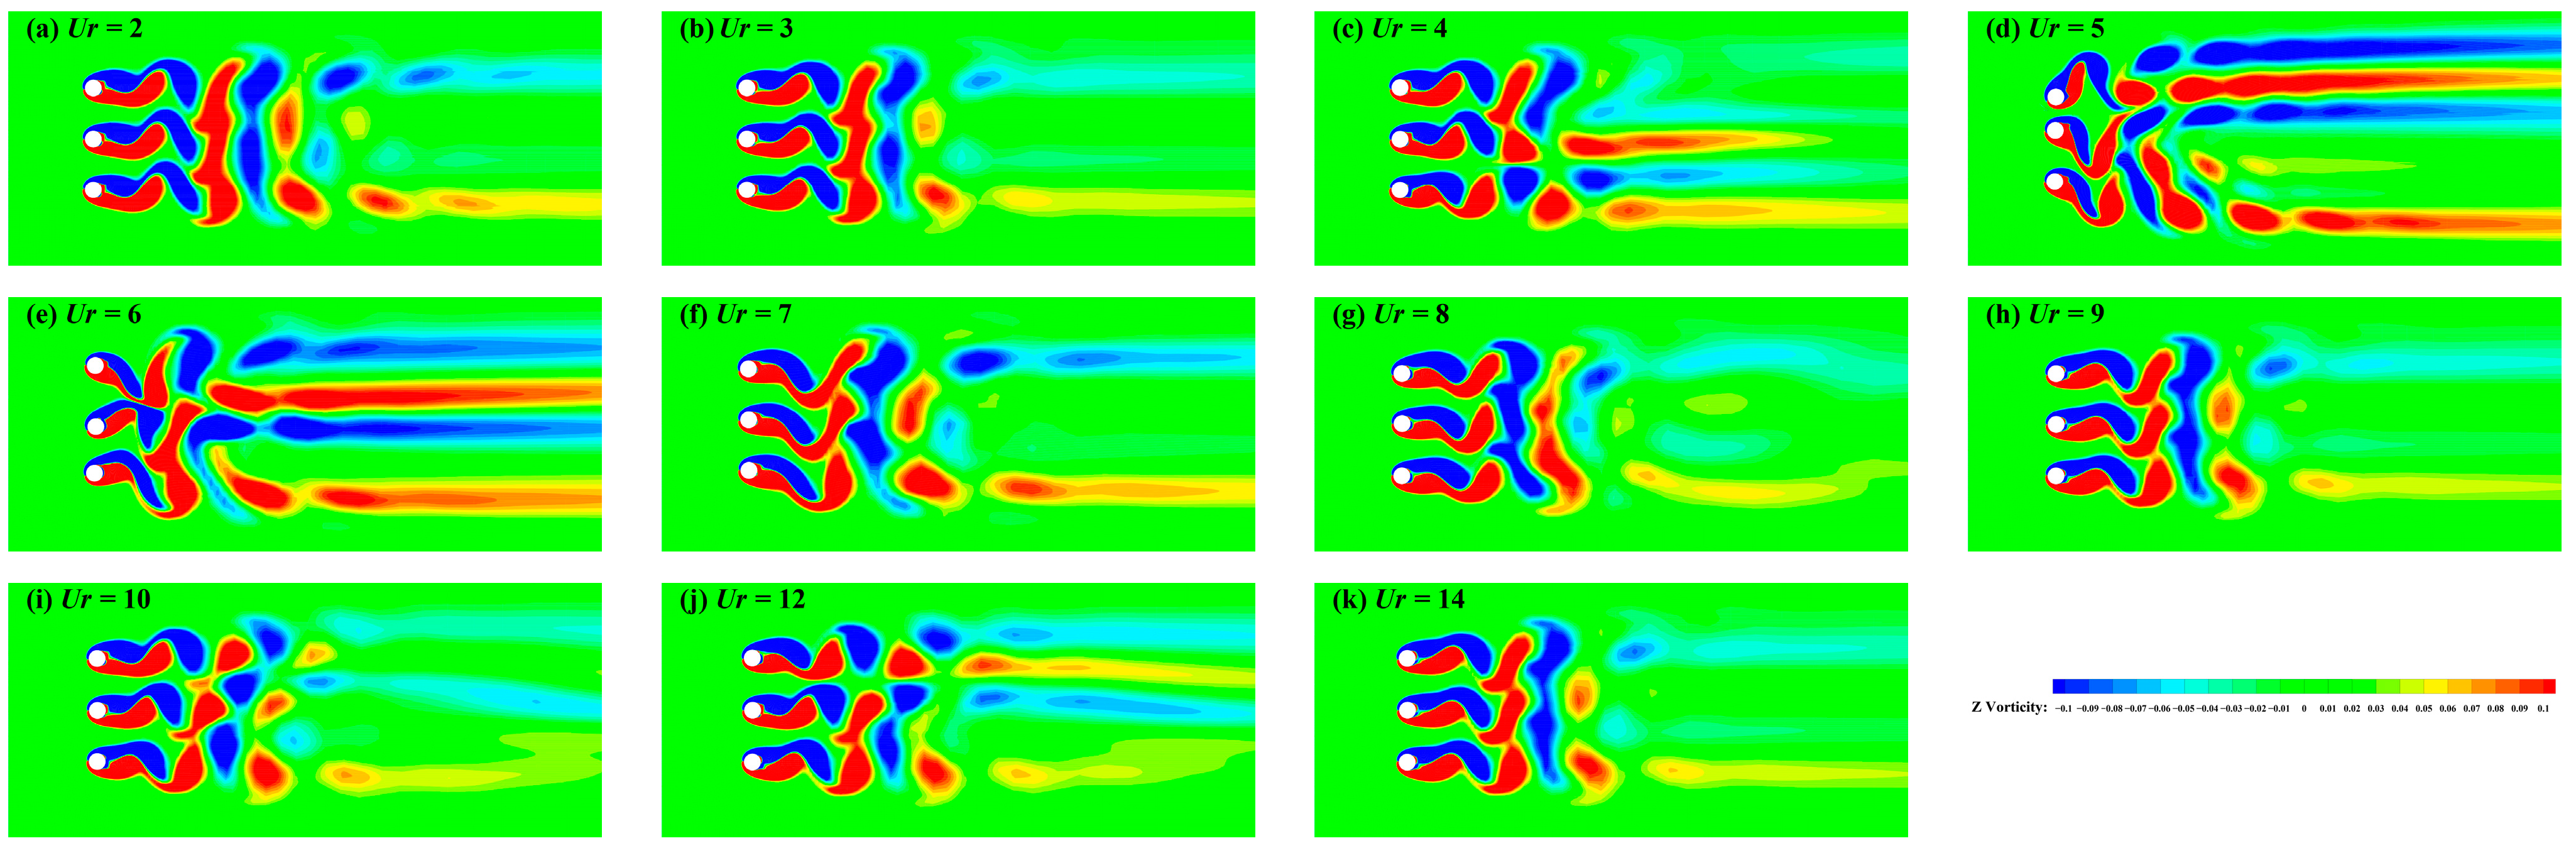
3.2.2. Wake Patterns at S/D = 3

For two side-by-side cylinders with sufficient gap spacing, two parallel vortex streets are observed in the wake, forming either an in-phase system (single large-scale wake) or an out-of-phase system (two distinct vortex streets) (Williamson [26]). For three side-by-side cylinders, the wake can be regarded as a composite structure. For the convenience of analysis, the phase relationship between the two cylinders is considered at each time. If the rotating direction of the vortex shedding from two distinct cylinders at the same time is the same, it is in-phase; otherwise it is out-of-phase. Based on this classification, synchronous/asynchronous modes are introduced, finally yielding four combinations: in-phase synchronous (IS), in-phase asynchronous (IA), out-of-phase synchronous (OS), and out-of-phase asynchronous (OA), where synchronous corresponds to shedding occurring simultaneously at the same instant.
Figure 10 shows vorticity contours for three side-by-side cylinders at S/D = 3 (the wake dissipates in two periods). At Ur = 2–3 (symmetric wake), alternating counter-rotating vortex pairs are shed (Figure 10a,b). Vortices from the central cylinder C2 merge with co-rotating vortices from its adjacent cylinders C1 or C3. This forms paired vortex streets with stronger outer vortices and weaker inner vortices downstream. The inner vortices dissipate rapidly due to lower energy. All cylinders exhibit in-phase synchronized shedding. At Ur = 4 (biased flow), at this time, the vortices of cylinders C1 and C2 (C1–C2) are in-phase, while the vortices of cylinders C2 and C3 (C2–C3) are out-of-phase. The vortices of cylinders C1 and C2 merge with each other, accelerating the dissipation of the vortices behind cylinders C1 and C2, while the vortices of cylinder C3 remain independent. The vortices detached from cylinder C2 are attracted by the reversed vortices of cylinder C1, causing the wake of C2 to be deflected outward. As a result, an asymmetric wake is observed downstream of the three cylinders. It is noteworthy that, at different time instances, this interaction of cylinder C2’s wake may randomly shift between the wakes of C1 and C3. At Ur = 5 (biased flow), strong vibrations induce asymmetric double-row vortex streets: one wide and one narrow (Figure 10c). As C1’s wake shifts upstream, the wakes behind C2 and C3 exhibit central wake merging, causing the wake behind C2 to retain only the upper negative ones and C3 to retain the lower positive ones. C1–C2 is out-of-phase synchronous and C2–C3 is in-phase asynchronous. At Ur = 6, symmetric double-row vortex streets form (Figure 10d). Vortices shed from C2 are compressed by adjacent wakes, merging with co-rotating vortices from C1 and C3 to create two widely spaced 2S-mode streets (C1–C2 out-of-phase; C2–C3 in-phase). At Ur = 7–9, after the “lock-in” region, weak vibrations restore in-phase synchronized shedding which resembles Ur = 2–3. At Ur = 10–12 (biased flow), the vortex-shedding modes between the three cylinders are asynchronous. The vortices from cylinder C2 are in-phase asynchronous with one adjacent cylinder and out-of-phase asynchronous with the other. C1 develops a narrower wake downstream, whereas C2 and C3 form wider wakes. At Ur = 14, reversion to in-phase shedding generates a single merged wide wake similar to Ur = 2.
In summary, at small spacing (S/D = 3), in-phase synchronized shedding between adjacent cylinders causes vortex merging, where counter-rotating vortices dissipate. Notably, when all three cylinders shed in-phase, adjacent vortex pairs merge, substantially weakening wake strength.

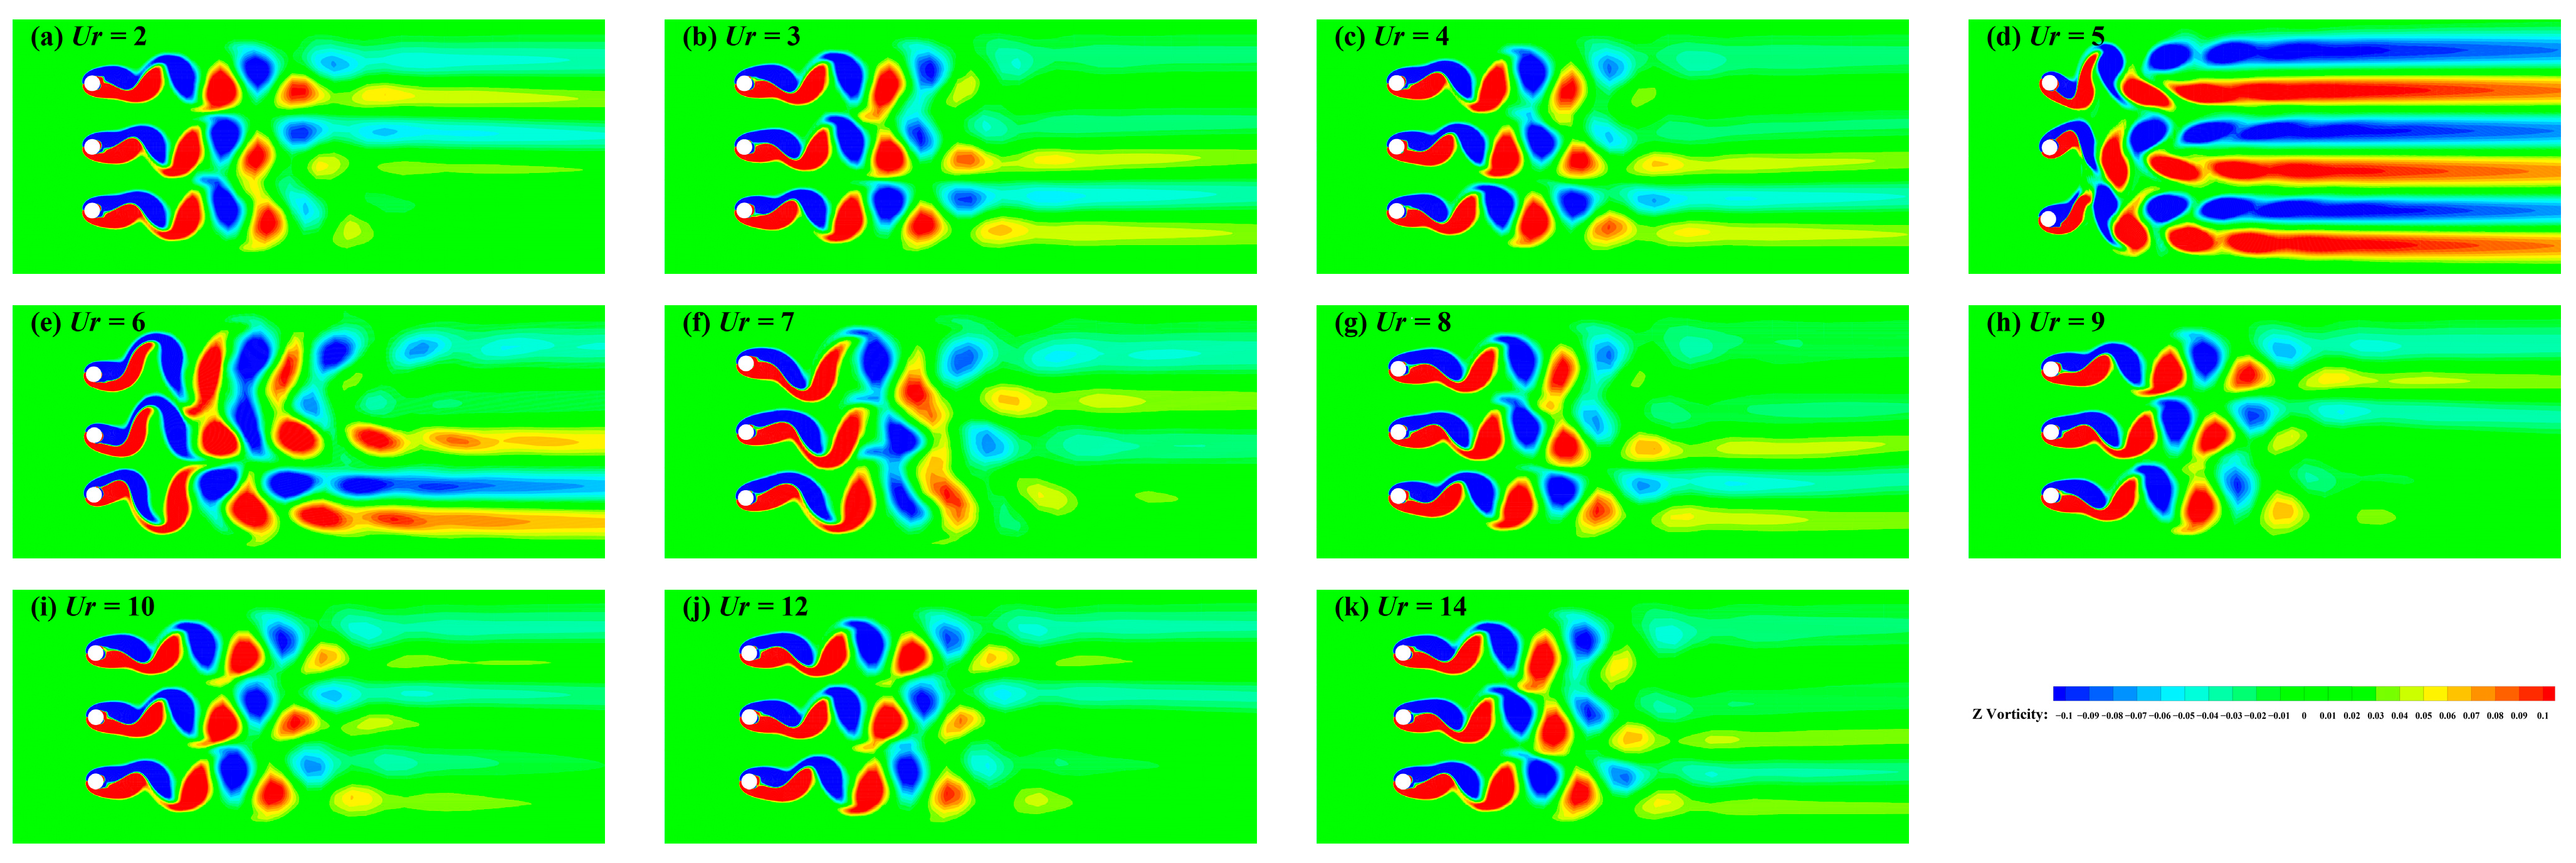
3.2.3. Wake Patterns at S/D = 4

Figure 11 displays the vorticity contours of the wake pattern at a cylinder spacing ratio of S/D = 4 (the wake dissipates in three periods). At Ur = 2–4 (biased flow), the initial vortex shedding from all three cylinders exhibits a 2S mode. At this stage, cylinder C2 randomly sheds vortices in-phase with C1 or C3, while out-of-phase with the other. The two in-phase cylinders form a pair of side-by-side vortex streets synchronously. When these co-rotating vortices approach each other, vortex merging occurs, accelerating dissipation and resulting in lower vortex strength compared to the narrow wake at the same instant. At Ur = 5 (symmetric wake), the amplitude response reaches its maximum. The flow field displays three symmetric vortex streets with relatively shorter vortex formation lengths and higher energy. All three cylinders generate elongated C(2S) mode vortices in their wakes. Here, cylinders C1 and C2 are out-of-phase, while C2 and C3 are in-phase. At Ur = 6 (biased flow), the wake of all three cylinders shows a 2S mode, presenting an asymmetric double-row vortex street. Cylinder C2 sheds vortices in-phase but asynchronously with C1, while shedding out-of-phase but synchronously with C3. The interaction between the co-rotating vortices from C2 and C1 strengthens their combined energy; however, it accelerates energy dissipation. Consequently, only one wide and one narrow asymmetric vortex street persist in the far wake downstream of the three cylinders. For Ur = 7–12, the phenomenon is identical to that observed on IB.

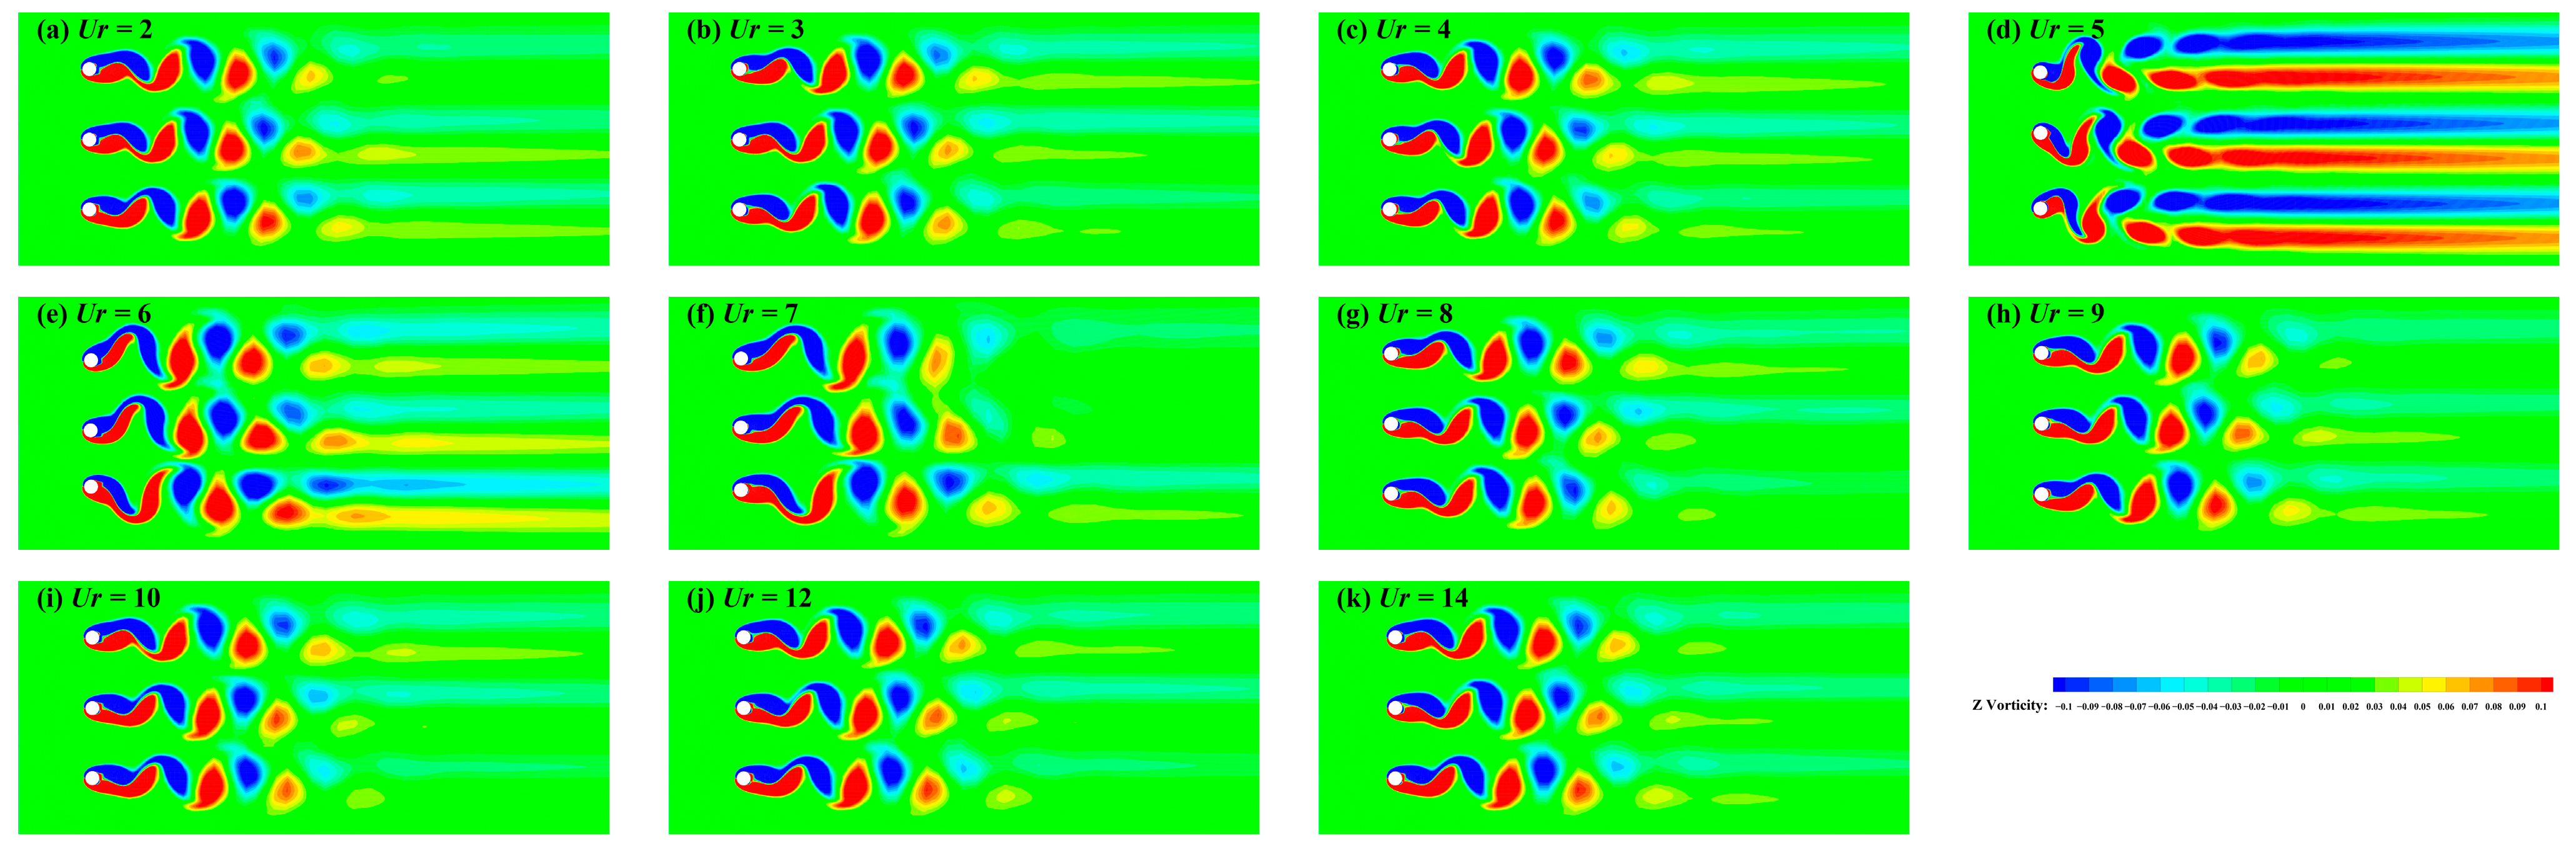
3.2.4. Wake Patterns at S/D = 5

As shown in Figure 12, at S/D = 5 (the wake dissipates in three periods), the inter-cylinder distance can be considered to reach a critical value where the mutual influence between cylinders diminishes significantly. Under this spacing ratio, the vortex-shedding modes of the three cylinders become fundamentally similar to those of a single cylinder, varying with Ur. However, vortex dissipation accelerates in the multi-cylinder system. Across all Ur, the vortex shed behind all three cylinders no longer remains synchronized. The middle cylinder C2 randomly sheds vortices in-phase and synchronously with C1 or C3, while out-of-phase and synchronously with the other. Outside the “lock-in” region, the vortex-shedding mode for each cylinder closely resembles that of a single vibrating cylinder, manifesting as three distinct “2S” mode wakes. Within the “lock-in” region, larger cylinder amplitudes and faster shedding frequencies cause a transition from “2S” mode to “C(2S)” mode in the wake of each cylinder. Before “lock-in”, at Ur = 2, C1 and C2 are in-phase and synchronous, while C2 and C3 are out-of-phase and synchronous. At Ur = 3 and 4, C2 and C3 transition to in-phase with a phase difference, while C1 and C2 remain out-of-phase and synchronous. For Ur = 5 to 7, C1 and C3 are out-of-phase synchronous, while C1 and C2 are in-phase asynchronous. As Ur > 7, within the desynchronization region, the wake of cylinder C2 randomly aligns in-phase with either C1 or C3, while out-of-phase with the other.

3.2.5. Wake Patterns at S/D = 6

As shown in Figure 13, at S/D = 6 (the wake dissipates in four periods), the vibration response branches and wake patterns for each cylinder become identical to those of a single cylinder. The vortex-shedding modes remain consistent, with each cylinder shedding independently. At this spacing ratio, the interactions between cylinders further decrease and become essentially negligible. This observation is further corroborated by the magnitude of lift and drag coefficients acting on the cylinder surfaces.

3.2.6. Wake Patterns Conclusions

Table 4 presents phase relationships of vortex shedding between the three side-by-side cylinders. Wake patterns are dominated by in-phase asynchronous (IA) and out-of-phase asynchronous (OA). At smaller spacings, in-phase asynchrony (IA) and in-phase synchronous (IS) prevail. As S/D increases, vortex shedding is primarily governed by in-phase synchronous (IS) and out-of-phase synchronous (OS).

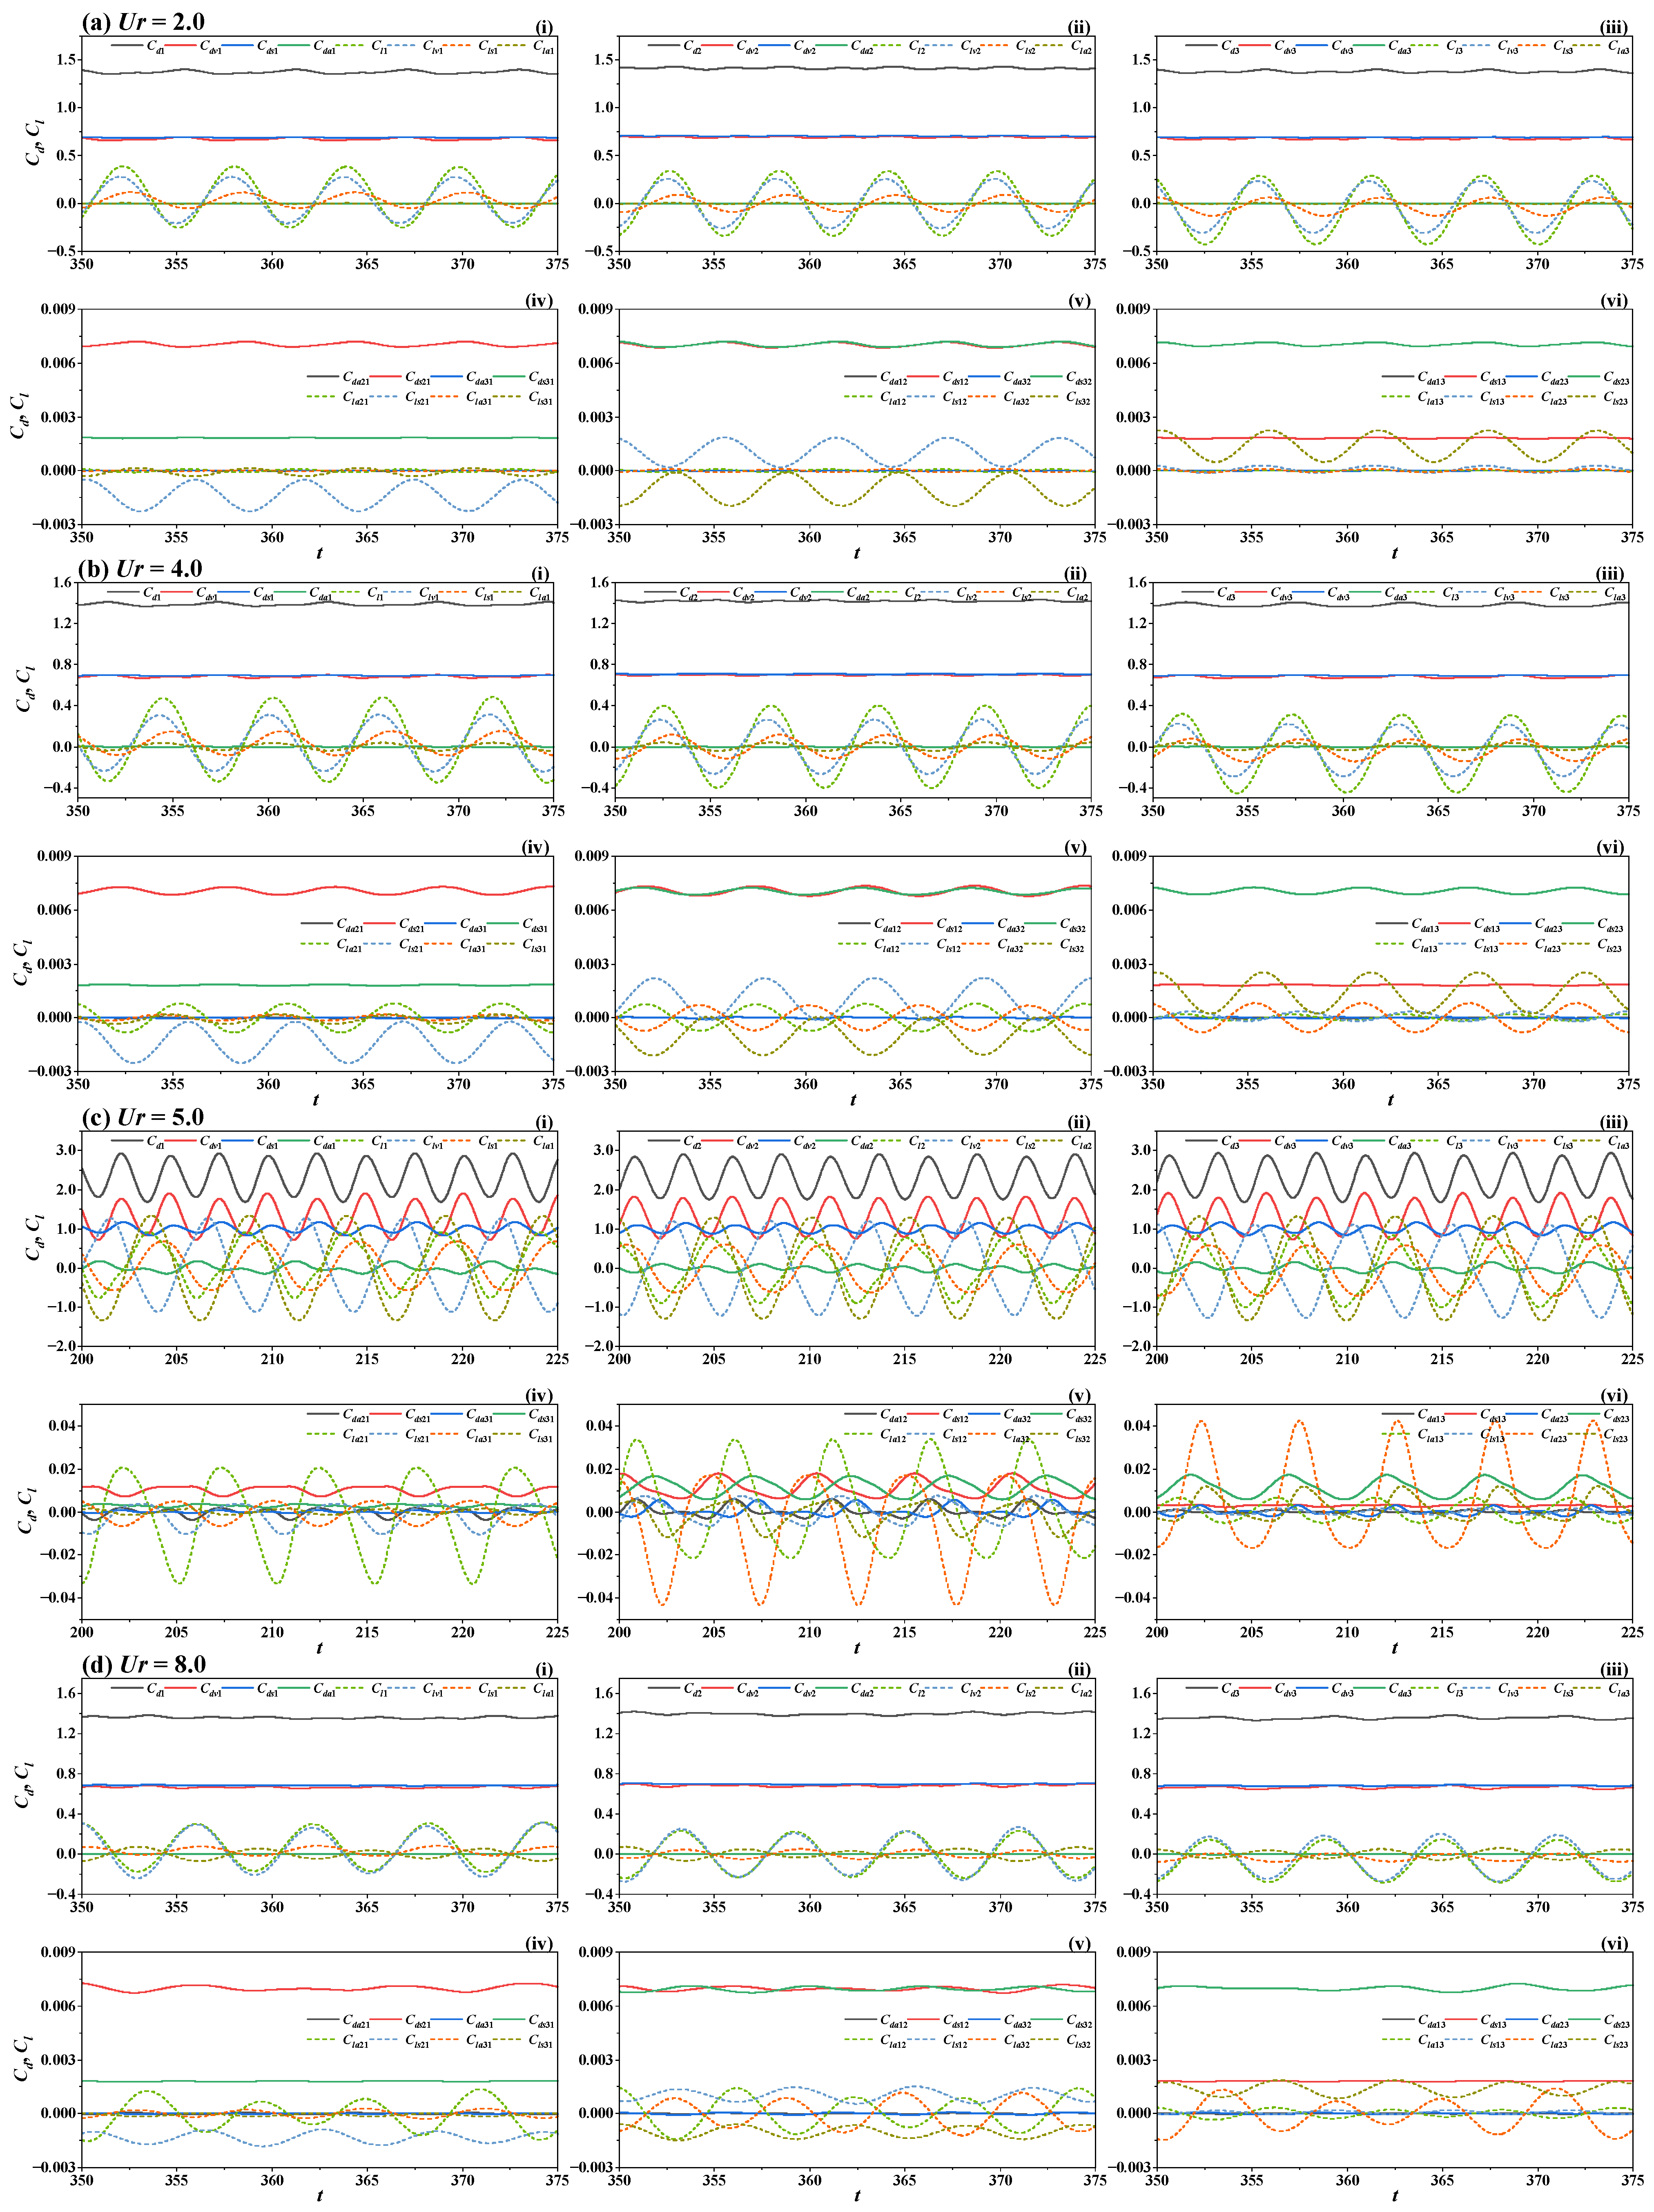
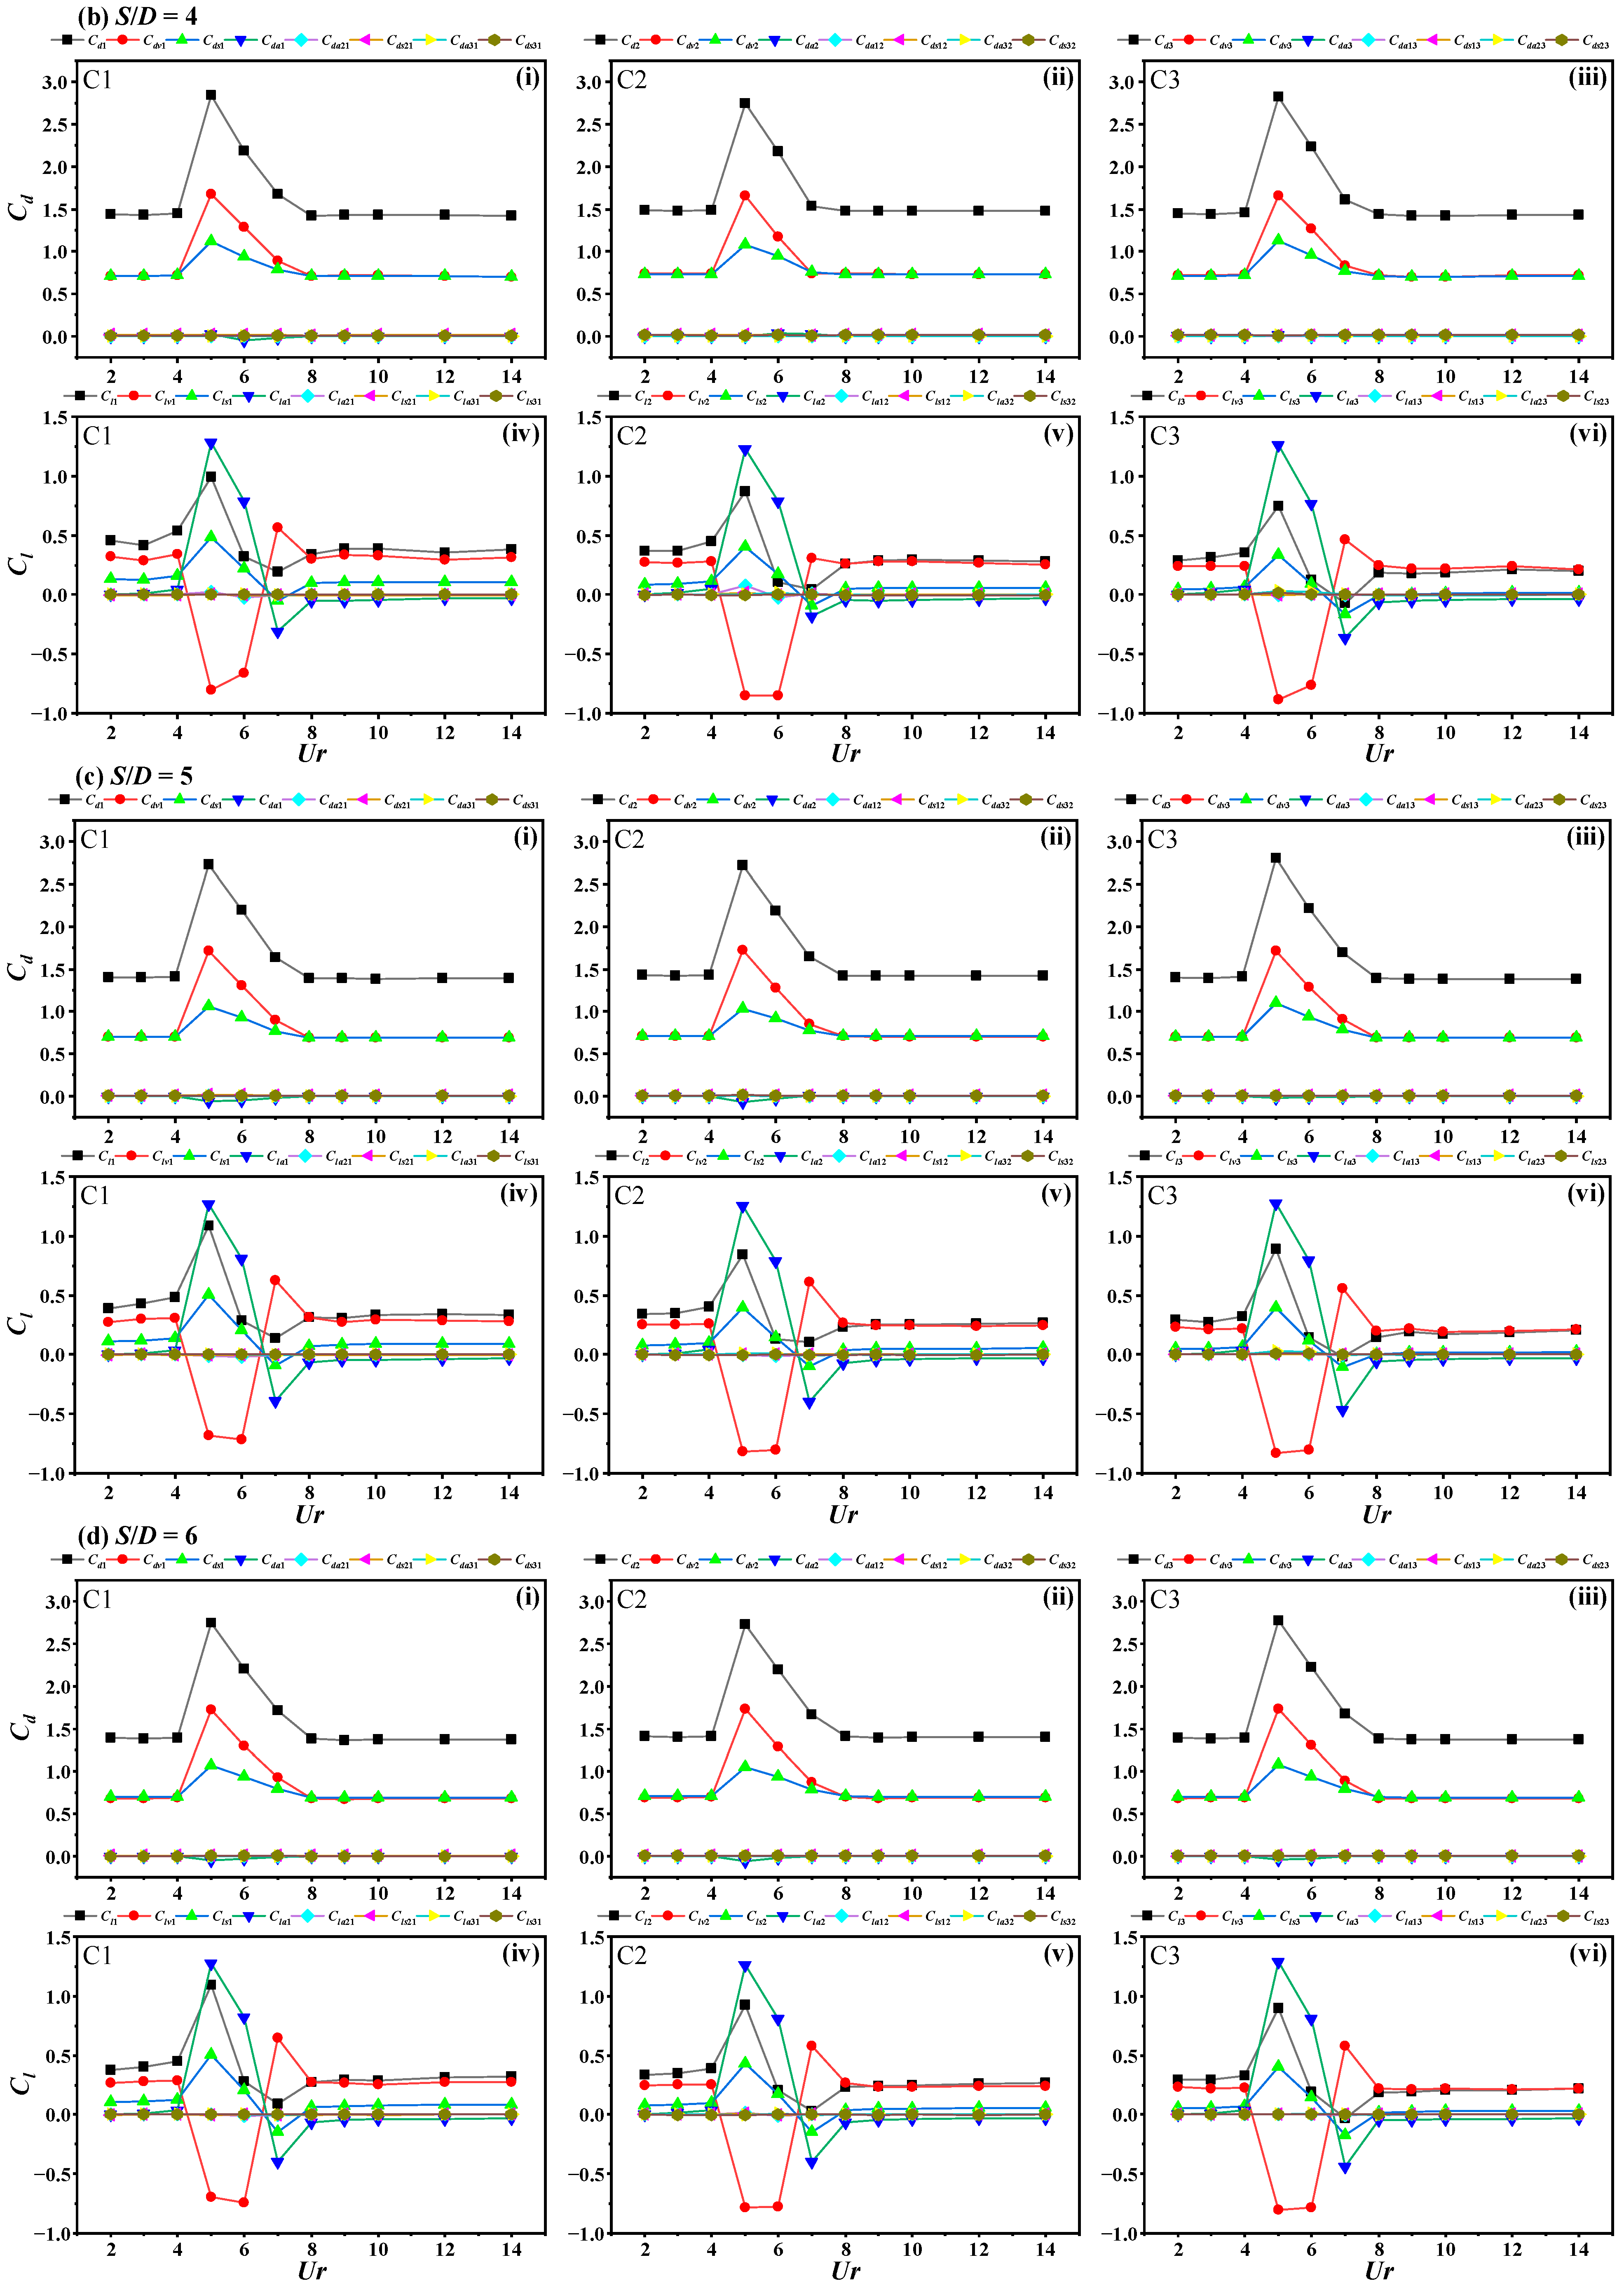
3.3. Hydrodynamic Coefficients Analysis

The hydrodynamic forces acting on a cylinder are significantly influenced by the vibration responses of nearby cylinders and the wake, with spacing being a major factor affecting both the wake structure and fluid forces [7,8].

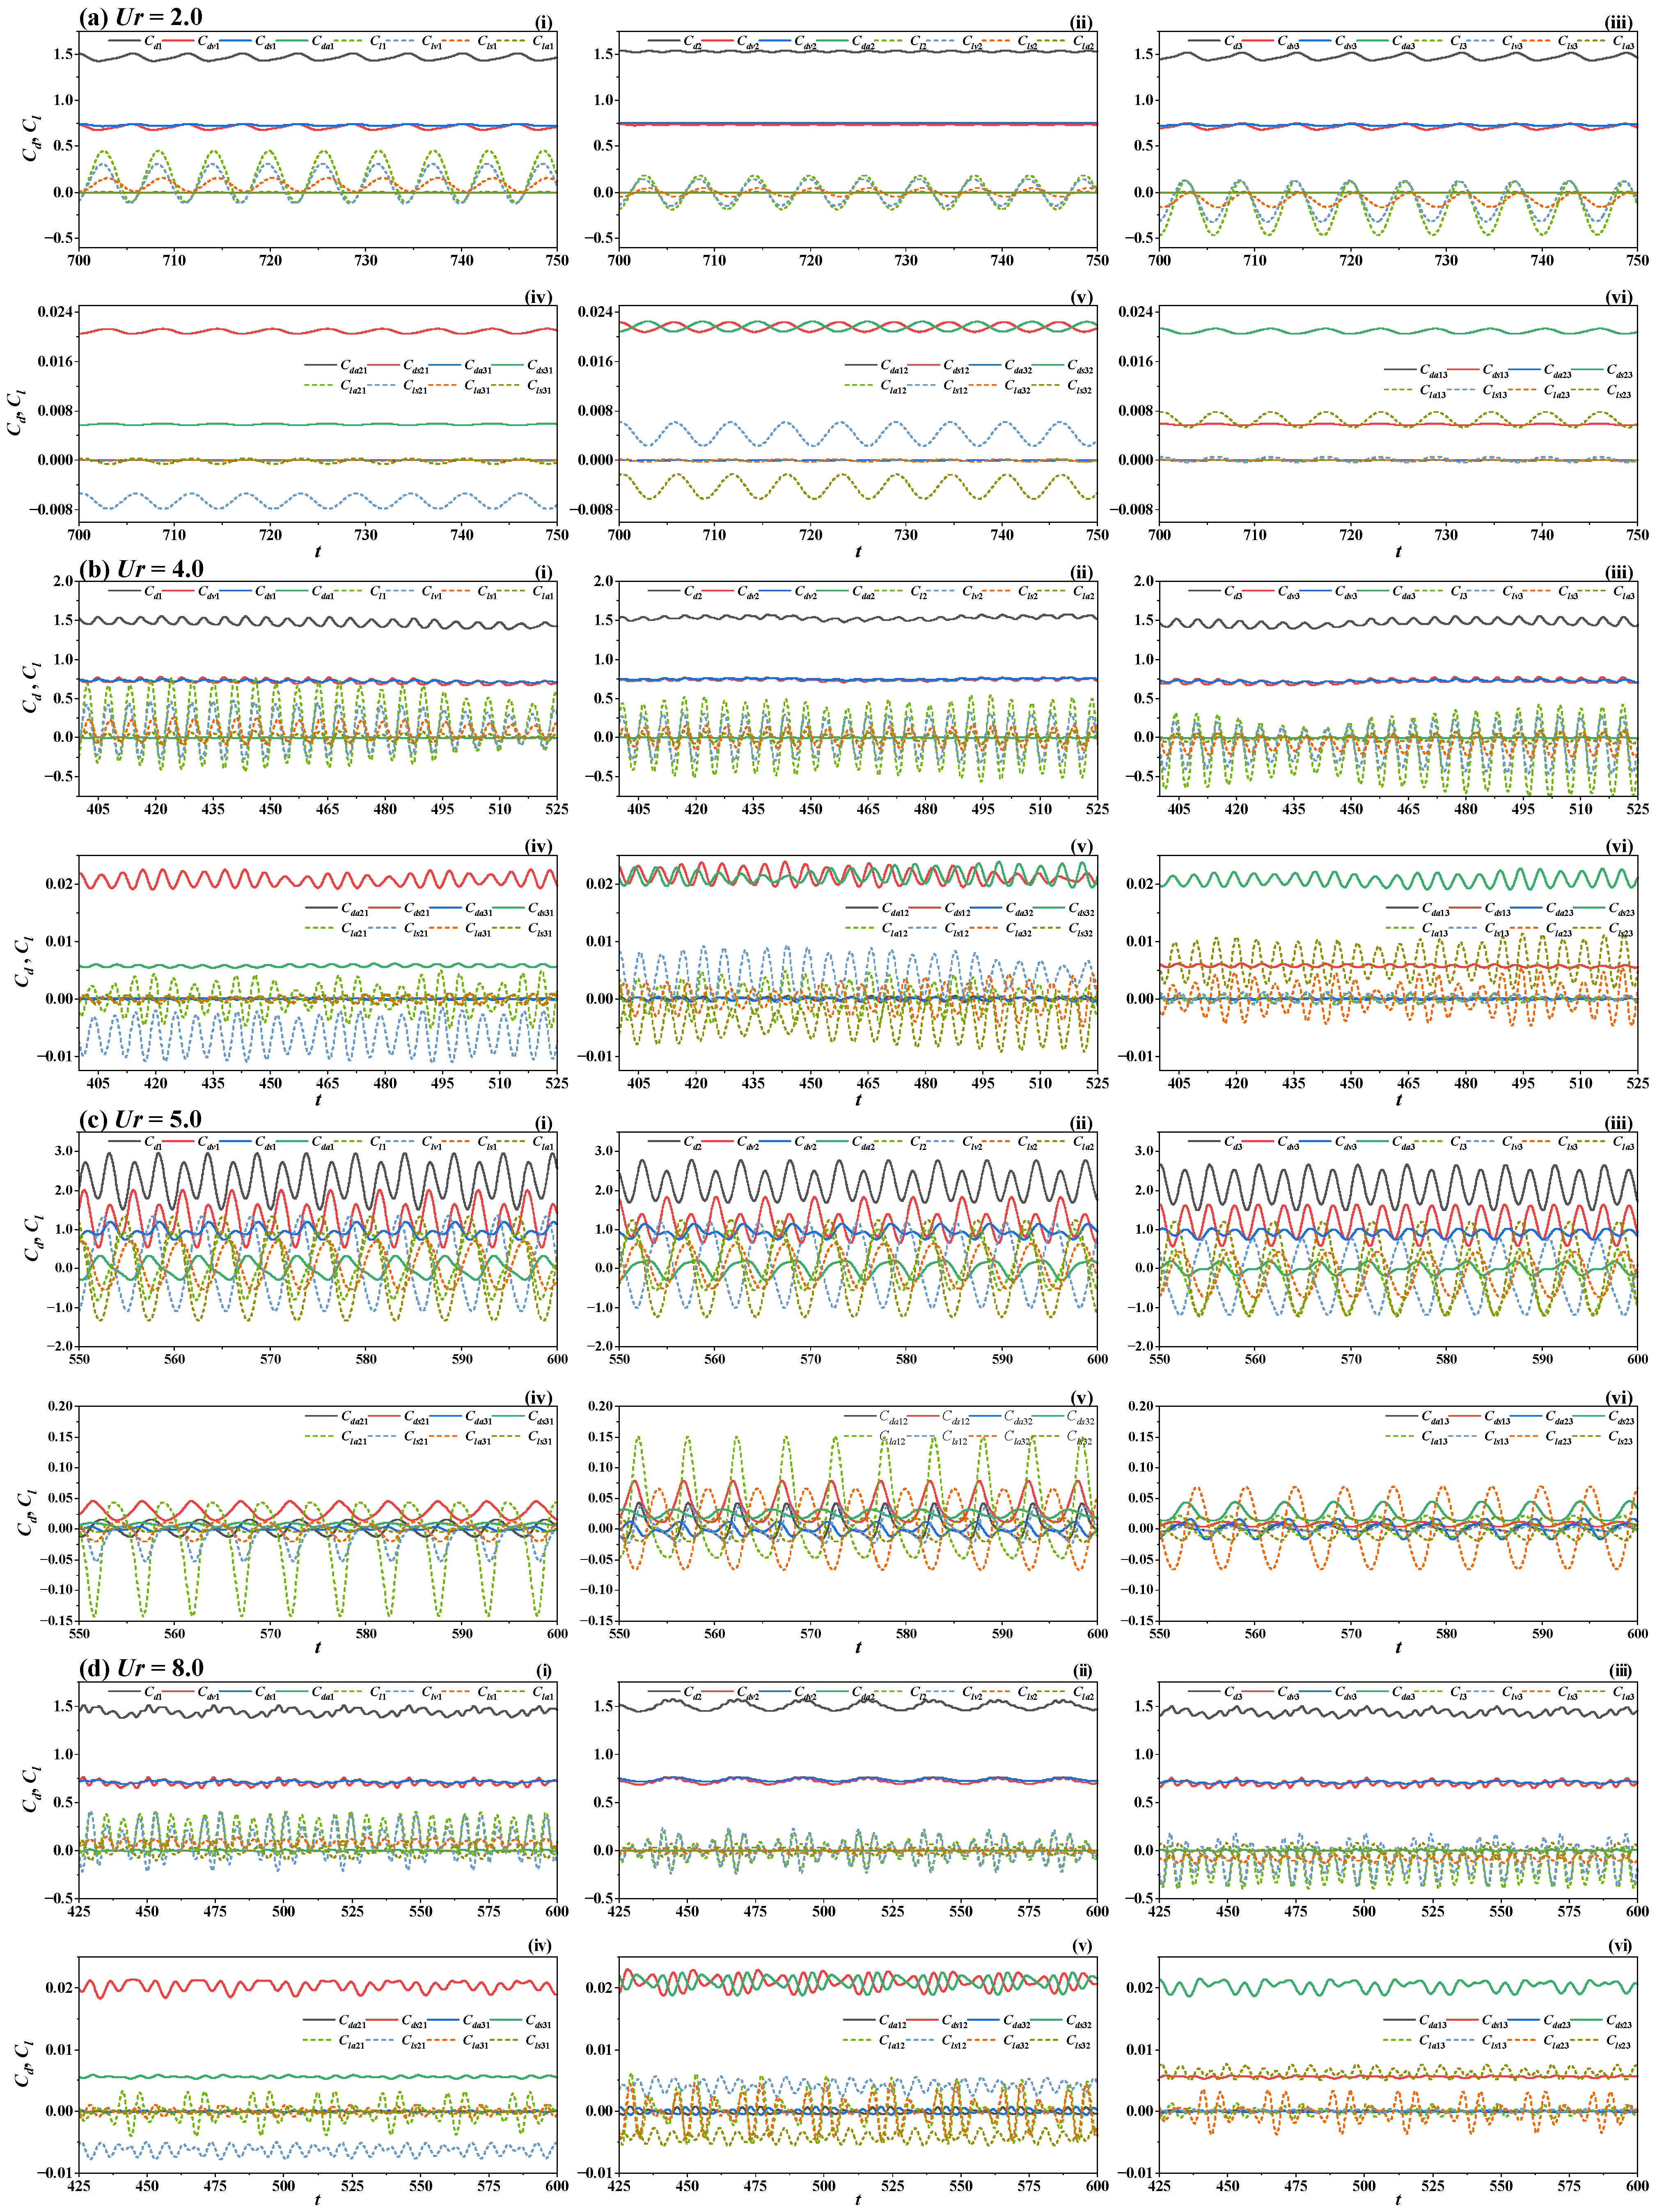
3.3.1. Hydrodynamic Analysis at S/D = 3

Figure 14 presents the time histories of hydrodynamic forces at S/D = 3 for different Ur. Subplots (i–iii) show the lift and drag coefficients and their components of cylinders C1, C2, and C3 themselves, respectively, while subplots (iv–vi) show the surface interaction force coefficients of the cylinders.
Within IB (Ur = 2, 3), the total lift coefficients Cl and drag coefficients Cd of the three cylinders, along with all their components, are in-phase. The cylinder vibration response is small, and the hydrodynamic forces are primarily provided by the volume vorticity force (Clv). The lift coefficients (Cls21, Cls31, Cls13, Cls23) and drag coefficients (Cds21, Cds31, Cds13, Cds23) of the surface vorticity interaction forces acting on cylinders C1 and C3 from other cylinders are in-phase. In contrast, the drag coefficients (Cds12, Cds32) of the surface vorticity interaction forces acting on the middle cylinder C2 are out-of-phase, while its lift coefficients (Cls12, Cls32) are in-phase. As the cylinders oscillate from the low-frequency region (below the natural frequency of vortex shedding) to the high-frequency region (above the natural frequency of vortex shedding), a transition region exists. Within this transition region, the wake pattern changes, and the phase difference between the lift force element components undergoes a sudden change. When Ur increases to 4 (the end of IB), the lift and drag coefficients of the three cylinders, along with their force components, exhibit “multi-frequency”, indicating complex mutual force interactions. The lift and drag coefficients of the surface vorticity forces acting on cylinders C1 and C3 from the other two cylinders show periodic variations. For cylinder C2, the drag coefficients (Cds12, Cds32) of the surface vorticity forces provided by C1 and C3 are in-phase and of similar magnitude, while the lift coefficients (Cls12, Cls32) are out-of-phase. It is noteworthy that, due to the weak vibration response, the surface acceleration force Cla (including the cylinder’s own acceleration and interaction forces between cylinders) is negligible.
When Ur ≥ 5, the vibration response enters the “lock-in” region (on LB). The cylinder vibration amplitude increases, and the amplitude of the cylinder surface acceleration force coefficient (Cla) rises significantly. At this stage, significant phase differences emerge among the total lift, drag, and their component coefficients for each cylinder. It is naturally expected that as two neighboring bodies come closer to each other, their mutual interaction becomes more significant. The effect evident from the force element analysis (e.g., Cla21 and Cla12, Cls21 and Cls12) is twofold: the kinematic velocity and vorticity fields between them are largely modified and the geometric factor ∇ϕ is modified and also intensified as the spacing is narrower. Bishop and Hassan [27] observed an important phenomenon: within the “lock-in” region, the phase difference between lift force and cross-flow response undergoes a “sudden jump” from an out-of-phase pattern to an in-phase pattern. Zdravkovich [28] analyzed flow fields using visualization techniques, finding that the phase difference between lift and cross-flow response is related to the vortex-shedding timing. During this stage, the phase between the total lift force Cl and the component Cla shifts from out-of-phase to in-phase, while the phase between Cl and the component Clv shifts from in-phase to out-of-phase. Concurrently, the primary force contribution (highest percentage) to the total lift Cl transitions from (Clv to Cla). On DB (7 ≤ Ur ≤ 14), the amplitudes of the hydrodynamic coefficients for the three cylinders decrease significantly. In the lift direction, the hydrodynamic force dominance reverts to the volume vorticity force component (Clv). The phase difference between the total cylinder lift Cl and the surface acceleration lift component (Cla) undergoes a “sudden jump” from an in-phase pattern to an out-of-phase pattern. Analysis of the phase jump from the force component perspective yielded results consistent with the phase difference jump observed between the lift phase and cross-flow response. At Ur = 7, immediately after exiting “lock-in”, the cylinder amplitude is small but the Cla amplitude remains relatively large. For Ur > 7, the amplitudes of Cla are generally smaller, but the mutual influence between cylinders is significant, leading to “modulation periods” in the force coefficients. Notably, at higher Ur values, although the surface acceleration force coefficients for each cylinder are small, their lift-direction vibration response remains substantial. At this stage, the cylinder is primarily influenced by the surface vortex acceleration forces from adjacent cylinders which are mainly in the lift direction.

3.3.2. Hydrodynamic Analysis at S/D = 4

Figure 15 shows the time histories of lift, drag, and their force components at S/D = 4. On IB (Ur < 4), the amplitudes of the cylinders’ own surface acceleration force coefficients (Cla1, Cla2, Cla3) are small, exerting minimal influence on lift coefficient variations. At this stage, the cylinders are primarily influenced by their own volume vorticity, surface vorticity force coefficients (Clvi, Clsi), and the surface vorticity interaction force (Clsij) provided by adjacent cylinders. Phase differences exist between these forces, leading to “multi-frequency components”. However, the variations in these “multi-frequency” curves are relatively smooth, and the cylinders exhibit unstable periodic motion. When Ur = 4, located at the end of IB, the amplitude of the Cla (both the cylinder’s own and those provided by other cylinders) increases significantly. The number of contributing forces influencing the lift coefficient Cl increases, with distinct phase differences between them, intensifying the “multi-frequency” phenomenon. The motion of cylinders becomes irregular.
Similar to S/D = 3, once the vibration response enters the “lock-in” region, the dominant contribution to lift between cylinders is provided by the Cla arising from interactions between adjacent cylinders. Furthermore, the contributions from the cylinder’s own acceleration (Clai, Cdai) and the surface acceleration interaction provided by other cylinders (Claij, Cdaij) increase markedly. In the drag direction, the contribution remains dominated by the surface vorticity lift force Cls from adjacent cylinders. This indicates that the amplitudes in the cross-flow and in-line direction are primarily related to the surface acceleration forces and surface vorticity forces acting on the cylinder, respectively. Larger surface acceleration forces correspond to larger cross-flow amplitudes, while larger surface vorticity forces correspond to larger in-line amplitudes. After the vibration response exits the “lock-in” region, the cylinder surface acceleration force coefficient Cla (including interaction forces from the cylinder itself and other cylinders) gradually decreases with increasing Ur. The “multi-frequency” phenomenon reappears, and the cylinder motion becomes irregular. That is to say, larger surface acceleration forces lead to more stable and more regular cylinder vibration. For Ur = 8–14, the lift and drag exhibit “multi-frequency”, and the cylinder motion trajectories appear relatively chaotic or unstable.

3.3.3. Hydrodynamic Analysis at S/D = 5

As shown in Figure 16, the influence of mutual interaction between cylinders gradually diminishes at larger spacing. The amplitudes of the interaction force coefficients between cylinders are significantly reduced compared to S/D = 3 and 4. At this spacing, the variations in the lift and drag coefficients of each cylinder across different branches gradually approach those of a single cylinder. The “multi-frequency” phenomenon in the time histories of lift, drag, and their force components caused by mutual influence weakens. Additionally, at S/D = 5, the end of the “lock-in” region shifts from Ur = 6 to Ur = 7. On LB, the amplitudes of the lift and drag for cylinders C1 and C3 increase relative to S/D = 4. The amplitudes of the lift and drag for cylinder C2 also increase, becoming similar to those of C1 and C3. The surface acceleration forces (Claij, Cdaij) and surface vorticity forces (Clsij, Cdsij) from adjacent cylinders increase, while surface interaction forces (Claij, Cdaij, Clsij, Cdsij) from more distant cylinders decrease.

3.3.4. Hydrodynamic Analysis at S/D = 6

When S/D increases to 6, the influence of surface interaction forces between cylinders weakens further. The phase and amplitude fluctuations of the lift, drag, and related force components with Ur become similar to those at S/D = 5 and are not repeated here.

3.3.5. Force Contribution Analysis

To facilitate observation of the variations in force components and their contributions to the total lift and drag under different S/D and Ur, Figure 17 plots the contributions of force components at the time of maximum lift and drag force for the three side-by-side cylinders. Subplots (i–iii) show the drag coefficients and their components for cylinders C1, C2, and C3, while subplots (iv–vi) show the lift coefficients and their components.
In the drag direction, the trends of force component variations are generally consistent across different S/D. Within the “lock-in” region, the contribution percentages of volume vorticity drag component Cdv and surface acceleration drag component Cda increase significantly. At the same Ur, as S/D increases, the volume vorticity drag component Cdv contribution slightly increases while the surface acceleration drag component Cda contribution slightly decreases.
In the lift direction, within the “lock-in” region, the contribution of the surface acceleration force Cla increases significantly, while the volume vorticity force Clv becomes out-of-phase and provides a negative contribution. Notably, at Ur = 7, the lift Cl3 of cylinder C3 is negative (the surface vorticity force Cls3 provides a larger contribution here). Simultaneously, Clv3 still contributes negatively. However, Clv1 and Clv2 contribute positively, while Cla1 and Cla2 make negative contributions, opposite to the result for cylinder C3. As the spacing increases, the amplitude of Cls3 and Cl gradually decreases. Conversely, for cylinder C1, as S/D increases, Clv1 and Cla1 gradually increase.

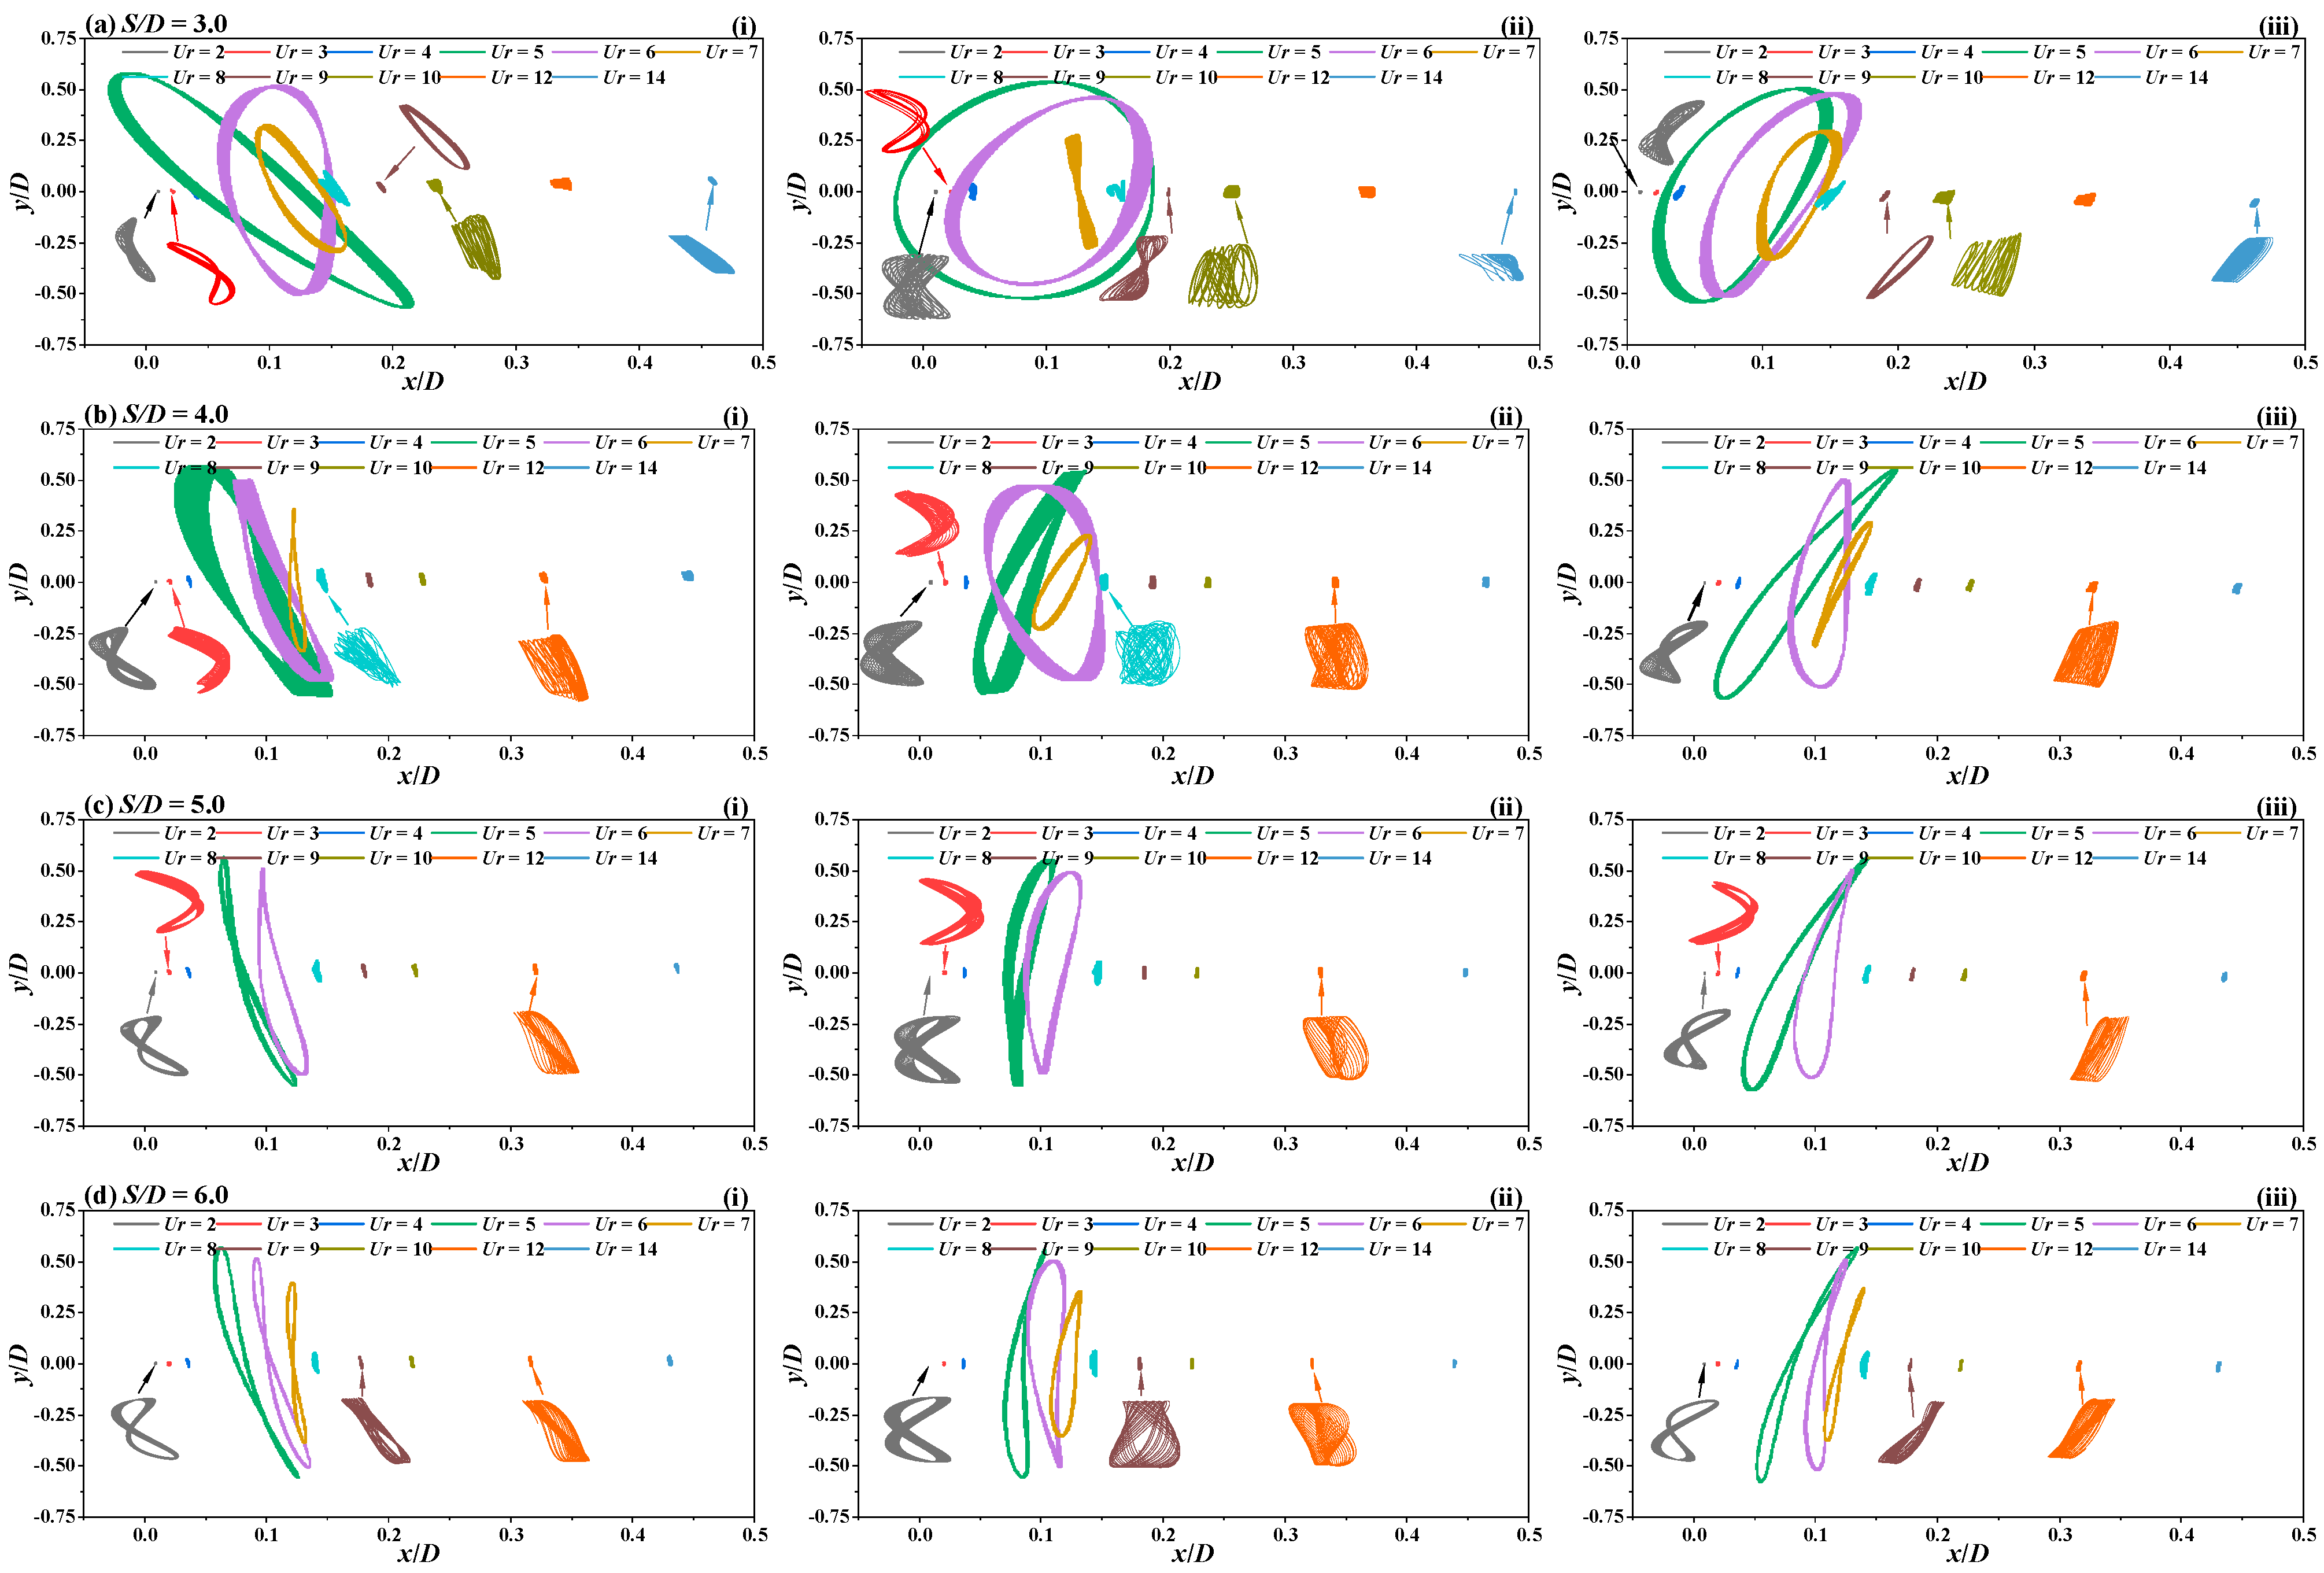
3.4. Motion Trajectory Analysis

3.4.1. Motion Trajectory Modes

Figure 18a displays the motion trajectories at different Ur for S/D = 3. At Ur = 2 (IB), the top and bottom cylinders (C1 and C3) exhibit mutually reversed, inclined “bounded figure-eight” trajectories. The middle cylinder C2 exhibits a centrally symmetric “multi-bounded figure-eight” trajectory. In this condition, the trajectories of C1 and C3 shift upwards and downwards, respectively, and their amplitudes are significantly larger than that of C2. Simultaneously, possibly influenced by C2, the cross-flow displacement of C1 and C3 adjacent to C2 is “compressed”. As shown in Figure 6a, the convergence time history at this stage is divided into three phases. The emergence of bounded trajectories is primarily due to a distinct “modulation period” observed in the surface acceleration force (Cla) during the “middle steady-state” stage (Bao et al. [3]). Over time, upon entering the final steady state, the trajectories gradually converge into a “figure-eight” shape. Concurrently, the instability of the in-line amplitude (periodic increase or decrease) also contributes to the formation of the “multi-bounded” trajectory pattern. At Ur = 3, the motion trajectories of all cylinders remain a “bounded figure-eight”. It is noteworthy that the direction of opening of the “figure-eight” is reversed compared to Ur = 2. This reversal is mainly caused by the phase difference between the in-line and cross-flow displacements. When they are in-phase, the “figure-eight” opens to the right; when they are out-of-phase, it opens to the left. At Ur = 4, which is within the transition phase, the system is in a “multi-frequency” transition state, as indicated in Figure 14b. Under these “multi-frequency” conditions, the motion trajectories of all three cylinders are irregular and “bounded”. Within the “lock-in” region (Ur = 5 and 6), the trajectories of the top and bottom cylinders (C1, C3) both exhibit a “teardrop” shape, while the middle cylinder (C2) exhibits an “elliptical” shape. In Figure 14c, the lift and drag coefficients within the “lock-in” region exhibit multi-frequency “modulation periods”. However, the cylinder trajectories do not appear highly disordered, and the force component Cla does not exhibit multi-frequency “modulation periods”, because it is directly related to the motion. With increasing Ur, at Ur = 7, the cross-flow amplitude decreases significantly. The trajectories of cylinders C1 and C3 become relatively regular “ellipses”, while C2 exhibits a “figure-eight” trajectory. At Ur = 8, the motion trajectories become distorted “figure-eight”. In Figure 14, the forces on all three cylinders exhibit multi-frequency “modulation periods” at this Ur. At Ur = 9, similar to Ur = 7, cylinders C1 and C3 exhibit relatively regular “elliptical” trajectories, while C2 exhibits a “figure-eight” trajectory. The difference is that the equilibrium positions of the trajectories for C1 and C3 shift at this stage. For Ur ≥ 10, the cylinder trajectories become relatively “irregular bounded teardrop”.
In Figure 18b, on IB (Ur = 2, 3, and 4), the cylinder trajectories exhibit regular “bounded figure-eight” patterns. At Ur = 4, near the end of IB and approaching the “lock-in” region, the trajectory of cylinder C2 changes into a “multi-1-shaped” pattern. At Ur = 5, entering the “lock-in” region, both the cross-flow and in-line vibration amplitudes increase substantially, and the cylinder trajectories become “teardrop”. At Ur = 6, the cross-flow amplitudes of all three cylinders decrease. The in-line amplitudes of C2 and C3 reach their maximum values, while the amplitude of C1 decreases. The trajectories of all three cylinders are “teardrop”. At Ur = 7, the trajectory of cylinder C2 transforms into a standard “ellipse”, while the trajectories of C1 and C3 gradually change into “figure-eight”. Compared to Ur = 6, the trajectory of cylinder C1 rotates clockwise. For Ur ≥ 8, all cylinder trajectories exhibit bounded motion. Before the “lock-in” region, the trajectories of C1 and C3 are axisymmetric, while the trajectory of C2 is centrosymmetric, exhibiting a “multi-bounded figure-eight” pattern. Within the “lock-in” region, the trajectories of the three cylinders differ but are all “teardrop”, and their in-line equilibrium positions coincide. Upon exiting the “lock-in” region and entering DB, the trajectories of C1 and C3 are generally axisymmetric. It is noteworthy that the trajectories of the top and bottom cylinders are not completely symmetric or identical at this stage, and the trajectory of the middle cylinder also exhibits a center asymmetry. This is primarily due to the influence of interaction forces between the cylinders. Furthermore, the trajectories consist mainly of bounded random motion. This is mainly because the acceleration forces experienced on DB are predominantly multi-frequency vibrations.
Figure 18c shows the case for S/D = 5. The behavior is fundamentally similar to S/D = 4. With increasing spacing, on IB (Ur = 2, 3, 4), the surface interaction forces between cylinders further decrease, and the “multi-figure-eight” trajectories gradually converge. The trajectories of C1 and C3 become symmetric. Within the “lock-in” region, there is a trend for the motion trajectories to transform from “teardrop” to “figure-eight”. Upon entering DB, the cylinder trajectories initially appear relatively disordered and gradually transform into a bounded “teardrop” and asymmetric “figure-eight”.
Figure 18d presents the motion trajectories for S/D = 6. On IB (Ur = 2, 3, 4), the “multi-figure-eight” trajectories further converge into a single “figure-eight”. After the “lock-in” region, at Ur = 5, the trajectories of all three cylinders are “figure-eight”. With the weakening of the vibration response amplitude, at Ur = 6 and 7, the trajectory of cylinder C2 is “teardrop”. At this stage, the ratio of the cross-flow to in-line vibration frequencies for C2 is close to 1. At Ur = 8 (on DB), all three cylinders exhibit irregular bounded motion. With increasing Ur, the trajectories of all three cylinders transform from “teardrop” to “figure-eight”.

3.4.2. Comprehensive Analysis of Motion Trajectories

Compared to our previous study on two side-by-side cylinders [13], three side-by-side cylinders predominantly exhibit “multi-bounded” motion, with fewer trajectories corresponding to single-frequency vibration. Compared to two cylinders, the mutual interference between the three cylinders is stronger, and the wake structures are more complex. Under many Ur, the vibration of cylinders transitions from the single frequency of each cylinder to multiple frequencies; additional secondary frequencies appear. This indirectly leads to instability in the cylinder vibration. As Ur increases, fx gradually decreases from approximately 0.12 to nearly 0.02, related to the reduction in fn. Recalling the definition of Ur (Ur = U/fnD), fnx is inversely proportional to Ur. However, the dominant frequency fy remains around 0.045 and does not vary with Ur. It is noteworthy that within the “lock-in” region, the frequencies fx and fy are essentially consistent. Outside the “lock-in” region, secondary frequencies emerge in in-line and cross-flow directions. This indicates that the motions in the two directions generate minor interference, which strengthens with decreasing spacing. Simultaneously, at smaller spacing, the vibration frequencies are predominantly multi-frequency; as the spacing increases, the multi-frequency motion gradually diminishes.
With increasing S/D, on IB, there is a trend for trajectories to transform from “bounded figure-eight” to “figure-eight”. Within the “lock-in” region (on LB), cylinder C1 undergoes a transition from “teardrop” to “figure-eight”. Cylinder C3 undergoes a transition from “ellipsoid” to “teardrop” to “figure-eight”. Cylinder C2 consistently exhibits a “teardrop” shape. As the spacing increases, the in-line displacement gradually decreases, and the trajectory transforms from a full “wide teardrop” to a “narrow teardrop” shape. On DB, increasing spacing causes the motion trajectory to transition from “bounded teardrop” to “bounded figure-eight”, becoming increasingly regular. However, within the S/D range of 3–6, the trajectories remain bounded. Concurrently, the trajectories of cylinders C1 and C3 gradually become centrosymmetric. This is primarily attributed to the weakening of surface interaction forces between the cylinders as the spacing increases. It is noteworthy that on DB, the in-line equilibrium positions differ for the three cylinders. The rearward shift in the equilibrium position of cylinder C2 is due to the enhancement of its drag strength caused by C1 and C3, as shown in Figure 14, Figure 15 and Figure 16. The hydrodynamic coefficients indicate that cylinder C2 experiences significant combined interaction forces from C1 and C3 (Cdv32, Cdv12), which are markedly greater than the interaction forces experienced by C1 (Cdv21, Cdv31) and by C3 (Cdv23, Cdv13).

4. Conclusions

This study employed force element analysis to investigate the vortex-induced vibration (VIV) responses of three side-by-side cylinders with two degrees of freedom at Re = 100, m* = 10, S/D = 3–6, and Ur = 2–14. The analysis of amplitude, vortex-shedding frequency, wake patterns, motion trajectories, and variations in lift/drag coefficients and force components is conducted. The main conclusions are as follows:
  • The excitation phenomenon of cylinders at different spacing ratios exhibits three vibration regions. A “pseudo-lock-in” phenomenon occurs at S/D = 3 and Ur = 7. As the spacing ratio increases, inter-cylinder interferences weaken, and the “lock-in” region broadens. On the initial branch (IB) and desynchronization region (DB), the amplitudes of cylinders are small. Cylinders are significantly influenced by contributions from the volume vorticity force and surface vorticity force in the flow field. When approaching the “lock-in” region (near Ur = 4), the surface acceleration force increases substantially, amplifying vibration amplitudes and significantly enhancing the interaction forces on the adjacent cylinders. Concurrently, phase differences (phase shifts) emerge among the lift and drag force components, accompanied by a “multi-frequency” phenomenon, leading to irregular and disordered motion trajectories. Within the “lock-in” region, cross-flow vibration responses intensify. The surface acceleration force and volume vorticity force dominate with comparable magnitudes but opposite phases. Inter-cylinder interactions are primarily governed by the surface acceleration forces of adjacent cylinders. Here, the “multi-frequency” behavior in lift/drag coefficients diminishes, exhibiting distinct periodic variations, and cylinder motion trajectories become stable and regular.
  • Compared to two side-by-side cylinders, the wake patterns of three side-by-side cylinders are mainly categorized into four types. Overall, wake patterns are dominated by in-phase asynchronous (IA) and out-of-phase asynchronous (OA). At smaller spacings, in-phase asynchronous (IA) and in-phase synchronous (IS) prevail. As the spacing ratio increases, vortex shedding is primarily governed by in-phase synchronous (IS) and out-of-phase synchronous (OS). At S/D = 3, mutual interference between cylinders’ wakes is intense, resulting in four distinct wake patterns across different Ur. When S/D increases to 4, inter-cylinder interference decreases, resembling the wake of a single cylinder undergoing VIV. For S/D > 4, wake patterns behind each cylinder match those of a single cylinder under VIV. Additionally, when adjacent cylinders exhibit in-phase synchronization (IS), their wakes tend to merge.
  • Unlike two side-by-side cylinders, the inclusion of a middle cylinder introduces complexity. The forces on the middle cylinder may randomly synchronize with one side cylinder or remain asynchronous with both. This results in more intricate surface interaction forces. Smaller spacing ratios amplify these forces, leading to time history curves of hydrodynamic forces dominated by multi-frequency oscillations. Three distinct stages emerge at smaller spacing ratios, while only two stages occur at larger spacing ratios.
  • At small spacing, when Ur is large, the proximity of cross-flow and in-line vibration frequencies results in elliptical motion trajectories. Near the “lock-in” region (transition region), trajectories become disordered due to a “multi-frequency” phenomenon. As S/D increases, the top and bottom cylinders exhibit “figure-eight” trajectories similar to a single cylinder. The middle cylinder, influenced by both upper and lower cylinders, predominantly displays “bounded figure-eight” or “bounded random” motion trajectories outside the “lock-in” region.

Author Contributions

Conceptualization, M.-T.S. and H.-L.X.; Data curation, S.-X.G.; Investigation, S.-X.G.; Methodology, C.-C.C.; Resources, M.-T.S. and C.-C.C.; Software, S.-X.G. and H.-L.X.; Supervision, M.-T.S., H.-L.X., J.-C.L. and C.-C.C.; Writing—original draft, S.-X.G. and M.-T.S.; Writing—review and editing, M.-T.S., S.-X.G., H.-L.X., J.-C.L. and C.-C.C. All authors have read and agreed to the published version of the manuscript.

Funding

This research was funded by the Guangxi Science and Technology Base and Special Talents through Grant No. guike AD21220101, and the National Council of Science and Technology (Taiwan) through Grant No. NSTC 113-2221-E-002-193-MY3 and No. NSTC 112-2221-E-002-002.

Data Availability Statement

The data presented in this study are available on request.

Conflicts of Interest

The authors declare no conflicts of interest.

References

  1. Sumner, D. Two circular cylinders in cross-flow: A review. J. Fluids Struct. 2010, 26, 849–899. [Google Scholar] [CrossRef]
  2. Zhao, M. Flow induced vibration of two rigidly coupled circular cylinders in tandem and side-by-side arrangements at a low Reynolds number of 150. Phys. Fluids 2013, 25, 123601. [Google Scholar] [CrossRef]
  3. Bao, Y.; Zhou, D.; Tu, J.H. Flow characteristics of two in-phase oscillating cylinders in side-by-side arrangement. Comput. Fluids 2013, 71, 124–145. [Google Scholar] [CrossRef]
  4. Chen, W.; Ji, C.; Xu, D. Vortex-induced vibrations of two side-by-side circular cylinders with two degrees of freedom in laminar cross-flow. Comput. Fluids 2019, 193, 104288. [Google Scholar] [CrossRef]
  5. Zhang, H.J.; Zhou, Y. Effect of unequal cylinder spacing on vortex streets behind three side-by-side cylinders. Phys. Fluids 2001, 13, 3675–3686. [Google Scholar] [CrossRef]
  6. Zhou, Y. Vortical structures behind three side-by-side cylinders. Exp. Fluids 2003, 34, 68–76. [Google Scholar] [CrossRef]
  7. Kang, S. Numerical study on laminar flow over three side-by-side cylinders. KSME Int. J. 2004, 18, 1869–1879. [Google Scholar] [CrossRef]
  8. Ul Islam, S.; Rahman, H.; Ying, Z.C.; Saha, S.C. Comparison of wake structures and force measurements behind three side-by-side cylinders. J. Braz. Soc. Mech. Sci. 2016, 38, 843–858. [Google Scholar] [CrossRef]
  9. Gao, Y.; Liu, C.; Zhao, M.; Wang, L.; Zhu, R. Experimental investigation on flow past two and three side-by-side inclined cylinders. J. Fluids Eng. 2020, 142, 011201. [Google Scholar] [CrossRef]
  10. Sooraj, P.; Khan, M.H.; Sharma, A.; Agrawal, A. Wake analysis and regimes for flow around three side-by-side cylinders. Exp. Therm. Fluid Sci. 2019, 104, 76–88. [Google Scholar] [CrossRef]
  11. More, B.S.; Dutta, S.; Gandhi, B.K. Flow around three side-by-side square cylinders and the effect of the cylinder oscillation. J. Fluids Eng. 2020, 142, 021303. [Google Scholar] [CrossRef]
  12. Ali, M.H.; Munir, A.; Zhao, M. Numerical investigation of flow across three co-rotating cylinders in side-by-side arrangement. Phys. Fluids 2023, 35, 113601. [Google Scholar] [CrossRef]
  13. Song, M.; Guo, S.; Xu, H.; Tao, W.; Lei, J.; Chang, C.C. Force Element Analysis in Vortex-Induced Vibrations of Side-by-Side Dual Cylinders: A Numerical Study. J. Mar. Sci. Eng. 2024, 12, 1529. [Google Scholar] [CrossRef]
  14. Chang, C.C.; Yang, S.H.; Chu, C.C. A many-body force decomposition with applications to flow about bluff bodies. J. Fluid Mech. 2008, 600, 95–104. [Google Scholar] [CrossRef]
  15. Chang, C.C. Potential flow and forces for incompressible viscous flow. Proc. R. Soc. A-Math. Phy. 1992, 437, 517–525. [Google Scholar]
  16. Hsieh, C.T.; Kung, C.F.; Chang, C.C.; Chu, C.C. Unsteady aerodynamics of dragonfly using a simple wing-wing model from the perspective of a force decomposition. J. Fluid Mech. 2010, 663, 233–252. [Google Scholar] [CrossRef]
  17. Luo, X.G.; Gao, A.K.; Lu, X.Y. Enhanced performance of a self-propelled flexible plate by a uniform shear flow and mechanism insight. Phys. Fluids 2023, 35, 021903. [Google Scholar] [CrossRef]
  18. Chen, W.; Ji, C.; Alam, M.M.; Williams, J.; Xu, D. Numerical simulations of flow past three circular cylinders in equilateral-triangular arrangements. J. Fluid Mech. 2020, 891, A14. [Google Scholar] [CrossRef]
  19. Cui, Z.; Zhao, M.; Teng, B. Vortex-induced vibration of two elastically coupled cylinders in side-by-side arrangement. J. Fluid Struct. 2014, 44, 270–291. [Google Scholar] [CrossRef]
  20. Thapa, J.; Zhao, M.; Cheng, L.; Zhou, T. Three-dimensional simulations of flow past two circular cylinders in side-by-side arrangements at right and oblique attacks. J. Fluid Struct. 2015, 55, 64–83. [Google Scholar] [CrossRef]
  21. Zdravkovich, M.M. Review of flow interference between two circular cylinders in various arrangements. J. Fluid Eng. 1977, 99, 618–633. [Google Scholar] [CrossRef]
  22. Zhou, Y.; Zhang, H.J.; Yiu, M.W. The turbulent wake of two side-by-side circular cylinders. J. Fluid Mech. 2002, 458, 303–332. [Google Scholar] [CrossRef]
  23. Alam, M.M.; Moriya, M.; Sakamoto, H. Aerodynamic characteristics of two side-by-side circular cylinders and application of wavelet analysis on the switching phenomenon. J. Fluid Struct. 2003, 18, 325–346. [Google Scholar] [CrossRef]
  24. Chen, W.; Ji, C.; Xu, W.; Liu, S.; Campbell, J. Response and wake patterns of two side-by-side elastically supported circular cylinders in uniform laminar cross-flow. J. Fluid Struct. 2015, 55, 218–236. [Google Scholar] [CrossRef]
  25. Kim, H.J.; Durbin, P.A. Investigation of the flow between a pair of circular cylinders in the flopping regime. J. Fluid Mech. 1988, 196, 431–448. [Google Scholar] [CrossRef]
  26. Williamson, C.H.K. Evolution of a single wake behind a pair of bluff-bodies. J. Fluid Mech. 1985, 159, 1–18. [Google Scholar] [CrossRef]
  27. Bishop, R.E.D.; Hassan, A.Y. The lift and drag forces on a circular cylinder in a flowing fluid. R. Soc. Lond. Proc. 1964, 277, 32–50. [Google Scholar]
  28. Zdravkovich, M.M. Modification of vortex shedding in the synchronization range. J. Fluid Eng. 1982, 104, 513–517. [Google Scholar] [CrossRef]
Figure 1. Flow field diagram of physical model and computational grid: (a) Flow field diagram of physical model; (b) Computational domain grid.
Jmse 13 01446 g001
Figure 2. Multi-cylinder flow field diagram.
Jmse 13 01446 g002
Figure 3. Comparison of the lift coefficient curves obtained by the pressure method (PM) and the force element method (FEM): (a) cylinder C1; (b) cylinder C2; (c) cylinder C3.
Jmse 13 01446 g003
Figure 4. Variation of the vibration frequency ratio f* with Ur: (a) cylinder C1; (b) cylinder C2; (c) cylinder C3.
Jmse 13 01446 g004
Figure 5. Variation of the displacement in the in-line direction (ac) and the cross-flow direction (df) with different S/D and Ur.
Jmse 13 01446 g005
Figure 6. The time history of lift and drag.
Jmse 13 01446 g006
Figure 7. Vorticity contours at different times at Ur = 2, S/D = 3.
Jmse 13 01446 g007
Figure 8. Vorticity contours at different times at Ur = 5, S/D = 5.
Jmse 13 01446 g008
Figure 9. Vorticity contours at different times at Ur = 7, S/D = 5.
Jmse 13 01446 g009
Figure 10. Vorticity contours of VIV at S/D = 3.
Jmse 13 01446 g010
Figure 11. Vorticity contours of VIV at S/D = 4.
Jmse 13 01446 g011
Figure 12. Vorticity contours of VIV at S/D = 5.
Jmse 13 01446 g012
Figure 13. Vorticity contours of VIV at S/D = 6.
Jmse 13 01446 g013
Figure 14. Time histories of the lift, drag, and force element components at S/D = 3: (a) Ur = 2; (b) Ur = 4; (c) Ur = 5; (d) Ur = 8; (i) cylinder C1; (ii) cylinder C2; (iii) cylinder C3; (iv) cylinder C1 caused by C2’s and C3’s surface; (v) cylinder C2 caused by C1’s and C3’s surface; (vi) cylinder C2 caused by C1’s and C2’s surface.
Jmse 13 01446 g014
Figure 15. Time histories of the lift, drag, and force element components at S/D = 4: (a) Ur = 2; (b) Ur = 5; (c) Ur = 8; (i) cylinder C1; (ii) cylinder C2; (iii) cylinder C3; (iv) cylinder C1 caused by C2’s and C3’s surface; (v) cylinder C2 caused by C1’s and C3’s surface; (vi) cylinder C2 caused by C1’s and C2’s surface.
Jmse 13 01446 g015
Figure 16. Time histories of the lift, drag, and force element components at S/D = 5: (a) Ur = 2; (b) Ur = 4; (c) Ur = 5; (d) Ur = 8; (i) cylinder C1; (ii) cylinder C2; (iii) cylinder C3; (iv) cylinder C1 caused by C2’s and C3’s surface; (v) cylinder C2 caused by C1’s and C3’s surface; (vi) cylinder C2 caused by C1’s and C2’s surface.
Jmse 13 01446 g016
Figure 17. The lift, drag, and force element components with Ur under different S/D: (a) S/D = 3; (b) S/D = 4; (c) S/D = 5; (d) S/D = 6; (i) drag of cylinder C1; (ii) drag of cylinder C2; (iii) drag of cylinder C3; (iv) lift of cylinder C1; (v) lift of cylinder C2; (vi) lift of cylinder C3.
Jmse 13 01446 g017aJmse 13 01446 g017b
Figure 18. Motion trajectories with Ur at different S/D: (a) S/D = 3; (b) S/D = 4; (c) S/D = 5; (d) S/D = 6; (i) cylinder C1; (ii) cylinder C2; (iii) cylinder C3.
Jmse 13 01446 g018
Table 1. Comparison of flow across three side-by-side cylinders for specified S/D = 4 at Re = 100.
St1St2St3 C - d1 C - d2 C - d3
Kang (2004) [7]0.1770.1830.1771.4791.5531.479
Ali et al. (2023) [12]0.1780.1840.1781.4811.5441.480
Present study0.1780.1840.1781.4801.5461.480
Table 2. Grid and time-step independence test at Re = 100, m* = 10, S/D = 6, Ur = 5, ζ = 0.
MeshElementt*Cl1,RMSCl2,RMSCl3,RMSAy1* Ay2* Ay3* Total Time
M160,0000.00250.66150.58320.66430.56730.55570.5691180 h
M2101,6000.00250.67480.58650.66610.56620.55700.5715203 h
M3162,5000.00250.67220.59770.66980.56960.55750.5707235 h
M4221,4000.00250.67520.60060.66990.56830.55670.5702305 h
M3162,5000.001250.66620.59770.66370.57180.55770.5704576 h
M3162,5000.0050.69440.60320.68050.56440.55520.5746151 h
Table 3. Steady-state modes at different S/D and Ur.
Ur23456789101214
S/D
3TS(I)TS(I)BSBSBSTS(I)TS(I)TS(I)BSBSTS(I)
4BSBSBSBSBSTS(II)BSBSBSBSBS
5BSBSBSBSBSTS(II)BSBSBSBSBS
6BSBSBSBSBSBSBSBSBSBSBS
Table 4. Wake patterns at different S/D and Ur.
Inter-Cylinder Ur23456789101214
S/D
C1–C23ISISISOAOAISISISOAOSIA
4OAIAIAOAIAOAIAOAOAIAIA
5OSOAOAIAIAIAOAIAOSIAIA
6ISOSOAOAISIAISOAIAOAIS
C2–C33ISISOSIAIAIAISIAOAIAIA
4IAOAOAOAOSIAOAIAOAOAOA
5ISIAIAOAOSOSIAOAISIAOA
6OSIAIAIAOSOAOSIAOAIAIS
C1–C33ISISOSOAOAIAISIAOSOAIA
4OAOSOAIAOAOAOSOSOAOSOS
5OSOSOSOSOAOAOSOSOSOSOS
6OSOAOSOSOSOSOSOSOSOSOA
Disclaimer/Publisher’s Note: The statements, opinions and data contained in all publications are solely those of the individual author(s) and contributor(s) and not of MDPI and/or the editor(s). MDPI and/or the editor(s) disclaim responsibility for any injury to people or property resulting from any ideas, methods, instructions or products referred to in the content.

