Article

Numerical Investigation of Inclination Effects on a Submerged Plate as Breakwater and Wave Energy Converter Under Realistic Sea State Waves

by
Vitor Eduardo Motta
1,
Gabrielle Ücker Thum
2,
Maycon da Silveira Paiva
3,
Rafael Adriano Alves Camargo Gonçalves
1,
Luiz Alberto Oliveira Rocha
1,2,3,
Elizaldo Domingues dos Santos
1,2,3,
Bianca Neves Machado
2,4 and
Liércio André Isoldi
1,2,3,*
1
School of Engineering, Federal University of Rio Grande (FURG), Itália Av., km 8, Rio Grande 96203-900, RS, Brazil
2
Graduate Program in Ocean Engineering, Federal University of Rio Grande (FURG), Itália Av., km 8, Rio Grande 96203-900, RS, Brazil
3
Graduate Program in Computational Modeling, Federal University of Rio Grande (FURG), Itália Av., km 8, Rio Grande 96203-900, RS, Brazil
4
Graduate Program in Applied Mathematics, Federal University of Rio Grande do Sul (UFRGS), RS 030, 11.700-km 92 Emboaba, Tramandaí 95590-000, RS, Brazil
*
Author to whom correspondence should be addressed.
J. Mar. Sci. Eng. 2025, 13(8), 1438; https://doi.org/10.3390/jmse13081438
Submission received: 15 June 2025 / Revised: 23 July 2025 / Accepted: 25 July 2025 / Published: 28 July 2025
(This article belongs to the Section Coastal Engineering)

Abstract

This study investigates the influence of inclination on a submerged plate (SP) device acting as both a breakwater (BW) and a wave energy converter (WEC) subjected to representative regular and realistic irregular waves of a sea state across 11 inclination angles. Numerical simulations were conducted using ANSYS Fluent. Regular waves were generated by Stokes’s second-order theory, while the WaveMIMO technique was employed to generate irregular waves. Using the volume of fluid (VOF) method to model the water–air interaction, both approaches generate waves by imposing their vertical and horizontal velocity components at the inlet of the wave flume. The SP’s performance as a BW was analyzed based on the upstream and downstream free surface elevations of the device; in turn, its performance as a WEC was determined through its axial velocity beneath the plate. The results indicate that performance varies between regular and irregular wave conditions, underscoring the importance of accurately characterizing the sea state at the intended installation site. These findings demonstrate that the inclination of the SP plays a critical role in balancing its dual functionality, with certain configurations enhancing WEC efficiency by over 50% while still offering relevant BW performance, even under realistic irregular sea conditions.

1. Introduction

The intensification of the climate-related phenomena has led to unprecedented global sea-level rise, primarily driven by thermal expansion of seawater and accelerated melting of land-based ice sheets and glaciers. This phenomenon poses severe threats to low-lying coastal zones, increasing the frequency and intensity of flooding events while exacerbating coastal erosion [1]. According to NASA’s recent analysis, 2024 experienced an unexpected amount of sea level rise, surpassing previous projections and highlighting the urgency for effective adaptation strategies to protect coastal infrastructure, ecosystems, and communities [2].
Other recent studies demonstrate that coastal regions globally may experience accelerated isolation risks and critical infrastructure disruption without rapid implementation of adaptive protection measures, particularly under high-emission scenarios [3,4]. The threats are quantified through economic damage assessments [3], while a framework for integrating such projections into practical adaptation planning is provided in [4].
Recent developments in coastal engineering continue to seek improvements and refinements of conventional breakwaters (BWs). For instance, rubble-mound and caisson-type structures continue to be widely used for coastal defense due to their robustness and ability to passively attenuate wave energy. Experimental and numerical studies of these structures have shown that design enhancements (such as the addition of submerged berms) can significantly improve wave energy dissipation, reduce wave run-up and overtopping, and increase structural resilience under elevated sea levels and storm surges, among other findings [5,6,7,8,9,10]. Moreover, investigations into pile-supported and perforated-plate breakwaters have addressed wave attenuation mechanisms, structural optimization, and performance under varying sea states through both experimental and numerical approaches [11,12,13,14,15,16,17,18]. In addition to these improvements, attention has turned to Bragg breakwaters that are periodic arrays of submerged or floating elements that exploit Bragg resonance to amplify wave reflection. Among other conclusions, the obtained results reveal that when the element spacing equals half the incident wavelength, reflection coefficients peak due to resonance effects [19,20,21,22,23,24,25,26,27].
In parallel, the global energy landscape is undergoing a profound transformation, driven by the imperative to transition away from fossil fuels. Renewable energy sources are essential to mitigate greenhouse gas emissions and meet growing energy demands. A record 510 GW of renewable energy capacity was added in 2023, marking the largest annual increase ever. The investment in clean energy has risen by around 40% since 2020, as reported by the IEA’s World Energy Outlook and Renewables 2023 reports, which also outline policy targets to triple global renewable capacity by 2030 [28].
It is well known that various renewable energy sources have been extensively researched in recent years. Of these, ocean wave energy stands out for offering important advantages (such as higher energy density, greater predictability, and reduced land use and visual impact) when compared with wind and solar technologies that are currently more mature and widely implemented [29,30]. Although a variety of technologies for converting wave energy into electricity have been proposed, they all remain in the testing or development stage, meaning that none are yet ready for large-scale deployment [31].
In the field of wave energy converters (WECs), recent numerical and experimental investigations have focused on enhancing overall energy conversion performance through the optimization of device design, control strategies, and system integration [32]. For example, it is possible to highlight studies regarding the following types of WEC: oscillating water column (OWC) [33,34,35,36], overtopping device [37,38,39,40], and point-absorbers [41,42,43,44].
In view of the above, the submerged plate (SP) emerges as a multifunctional device capable of addressing both coastal protection and energy challenges [45,46]. This fixed, typically horizontal structure is anchored to the seafloor and strategically positioned to interact with incident wave motion. By partially obstructing the horizontal flow beneath the wave crest, the SP attenuates wave energy, thereby offering coastal protection against erosion and flooding. Simultaneously, the oscillatory flow induced by wave action beneath the plate can be harnessed to drive hydraulic turbines, enabling the extraction of renewable energy. This dual functionality not only enhances the sustainability of coastal defense systems but also aligns with global efforts to integrate clean energy generation into existing maritime infrastructure [47,48].
Early experimental investigations on submerged solid blocks identified characteristic flow circulation patterns around these structures, laying the foundation for subsequent research on SP systems [45]. Initially developed exclusively as breakwater (BW) structures for coastal protection, the technology’s potential expanded when it was demonstrated that wave energy extraction could be achieved through integration of hydraulic turbines beneath the plate, thereby establishing its combined role as a coastal protection structure (as a BW) and a device for harvesting wave energy (as a WEC) [46].
More recently, it was investigated how monochromatic waves interact with surface-piercing inclined plates, emphasizing the occurrence of resonance, which leads to significant hydrodynamic loads. Employing the boundary element method (BEM) together with computational fluid dynamics (CFDs) simulations, the investigation demonstrated that the inclination of the plate plays a crucial role in determining excitation forces. Key findings include that: (i) wave forces generally scale with wave height, except during resonance events where they can diminish considerably; (ii) resonance effects dominate at low inclinations, whereas their influence weakens as the angle increases; and (iii) linear potential flow theory should be applied cautiously in energy capture estimates under resonant conditions [49].
Subsequently, an experimental investigation was carried out on submerged horizontal perforated plates under irregular wave conditions. This study found that wave dissipation effectiveness depends on submergence depth and plate porosity, with solid plates showing stronger attenuation for smaller depths. The results also revealed a correlation between flow velocity and transmission coefficient, offering guidance for optimizing perforated plate designs in coastal protection applications [50].
Another numerical investigation was performed using a real-scale computational modeling of a submerged horizontal plate (SHP) analyzed only as a WEC, in which the constructal design method was employed. The primary goal was to enhance the device’s energy conversion efficiency by optimizing its geometric configuration. The findings demonstrated that changes in geometry had a marked effect on the alternating flow patterns beneath the SHP. One particular configuration led to the highest axial flow velocity, showing a notable increase when compared to the configuration with the lowest performance. Likewise, the mass flow rate exhibited strong sensitivity to geometry, with the maximum value reaching nineteen times that of the minimum. This study concluded that the optimized SHP geometry resulted in a performance gain of at least 35% relative to the least efficient design considered [51].
After that, a CFD study was carried out on an SHP acting as a BW and WEC subjected to both regular representative and irregular realistic waves, based on 2014 sea state data from the coast of the city of Rio Grande, in Brazil’s southern region. Using the WaveMIMO methodology and finite volume method (FVM), five SHP lengths were evaluated. The results showed that the SHP reached maximum BW efficiency at 2.5Lp for the representative regular waves and 3Lp for the realistic irregular waves, and highest axial velocity as a WEC at 3Lp and 2Lp, respectively, for regular and irregular waves, with Lp being a reference length [47].
Recently, it was investigated the nonlinear hydroelastic responses of an SHP under focused wave conditions using a fully coupled CFD-CSM (computational solid mechanics) approach. By applying a phase-decomposition method, this study revealed significant nonlinear effects in the structural response, particularly related to plate rigidity. These findings highlight the importance of considering nonlinearity in the fatigue analysis and design of submerged wave-interacting structures [52].
Finally, a comparative numerical study on the SP efficiency was developed, considering its two functionalities (i.e., BW and WEC) under regular wave conditions, and considering 11 cases with different geometric configurations derived from variations in the upstream and downstream SP’s inclination angles. Using the horizontal SP configuration as a reference, improvements of 11.95% and 16.59% in efficiency were observed for the BW and WEC functions, respectively [48].
In this context, the present study builds upon previous work [48] that analyzed different inclinations of a SP in a full-scale wave channel only under regular wave conditions and advances the investigation by additionally considering the behavior of the SP under regular representative and irregular realistic waves of a real sea state that occurred in southern Brazil. Using the optimized SHP geometric configuration proposed by [51] as a baseline, 10 inclined SP geometric configurations are numerically evaluated to assess their hydrodynamic performance as both a BW and a WEC. The analysis includes a comparison of the effects of regular and irregular waves on downstream wave attenuation and on the axial water velocity beneath the structure, contributing to a more realistic and comprehensive understanding of how SP inclination influences its efficiency. To this end, a finite volume computational model was developed in ANSYS Fluent 2024 R2, consisting of a wave flume containing the SP and a numerical beach. The incident regular waves were generated using the second-order Stokes wave theory [53], and the incident irregular waves were generated using the WaveMIMO methodology [54]. Both wave approaches employ the volume of fluid (VOF) method [55] to handle the two-phase flow of water and air.
One can note that the present numerical investigation, which delves into the intricate influence of inclination on a SP device acting as a BW and WEC under representative regular and realistic irregular sea state waves, addresses a complex problem in ocean engineering. In this context, several recent studies are highly relevant due to their similar focus on advanced numerical modeling of challenging wave-structure interactions. Specifically, recent works [56,57,58,59] have utilized sophisticated CFD-based simulations, often employing viscous flow models like OpenFOAM, to analyze complex phenomena such as gap resonance, wave loads, and hydrodynamic forces on marine structures under various wave conditions. These studies, by tackling similar complexities in wave-structure interactions and leveraging advanced CFD techniques, provide valuable insights for the current research.

2. Materials and Methods

Eleven different SP configurations were analyzed in this study, following the same geometric definitions proposed in [48], where they were previously evaluated only under regular wave conditions. These include a horizontal reference case (SHP) and ten inclined variations distinguished by inclination angles (15° or 30°), rotation directions (clockwise or counterclockwise), inclination centers (central axis, far edges), and symmetry (full or half-plate). All cases are illustrated in Figure 1, highlighting that the color assigned to each SP case will be used in the graphs related to the corresponding hydrodynamic behavior, such as BWs and WECs, which will be presented later.
Since the primary goal is to evaluate the effect of different inclinations in the SP geometry on its hydrodynamic behavior, no turbine (responsible for the actual mechanical-to-electrical energy conversion) will be included. Moreover, to ensure comparability and consistent material usage, the SP surface area was kept constant across all configurations shown in Figure 1.
In addition, the SPs shown in Figure 1 are exposed to specific wave conditions: representative regular waves and realistic irregular waves, mirroring a sea state that occurred in 2018 off the coast of Rio Grande, Rio Grande do Sul, southern Brazil. This sea state was earlier considered in [60], having the predominant pairing of significant wave height (Hs) and mean period (Tm) defined by the bivariate histogram presented in Figure 2.

2.1. Mathematical and Numerical Models

The present study employs the Stokes wave theory of second order to generate the representative regular wave behavior, where its height is relatively small when compared with its length, and the trough and crest of the waves have the same amplitude. The wave’s horizontal and vertical components of velocity are defined, respectively, as [53]:
u = H 2 g k cosh k h + k z ω cosh k h cos k x ω t + 3 4 H 2 2 ω k cosh 2 k h + z sinh 4 k h cos 2 k x ω t ,
                              w = H 2 g k sinh k h + k z ω cosh k h sin k x ω t + 3 4 H 2 2 ω k sinh 2 k h + z sinh 4 k h sin 2 k x ω t ,
with u and w being the wave components (in m/s) related to x and z directions, respectively. The parameters g, h, t, x, and z represent the gravitational acceleration (m/s2), water depth (m), time (s), horizontal position (m), and vertical position (m) of a fluid particle relative to the free surface, respectively. The wave height is denoted by H, while ω and k correspond to the angular frequency (s−1) and wave number (m−1), respectively, and are defined as follows:
ω = 2 π T ,
k = 2 π λ ,
where T is the wave period (s) and λ is the wavelength (m). The representative regular waves were generated by applying the well-known methodology available in ANSYS Fluent, which applies Equations (1) and (2) as prescribed velocity boundary conditions at the wave flume inlet. To do so, based on Figure 2, it was assumed that H = Hs and T = Tm. This regular wave generation approach was already used in several previous works, for instance [48,51].
In turn, the realistic irregular waves were generated employing the WaveMIMO methodology [54]. Basically, the WaveMIMO methodology enables the numerical generation of waves by imposing discretized velocity components in the horizontal (u) and vertical (w) directions as prescribed velocity boundary conditions in the Fluent software. For this purpose, the Spec2Wave 1.2.1 software is employed to process sea state spectral data from the TOMAWAC model [61], generating a time series of free surface elevations by means of the inverse Fourier transform [62,63]. These free surface elevations can be represented as a finite combination of monochromatic wave components, each modeled according to Airy’s linear wave theory [64], and subsequently converted into the corresponding horizontal (u) and vertical (w) velocity components [54]. It is important to highlight that Spec2Wave can also be applied directly to free surface elevation data obtained from in situ measurements. Further details about this procedure can also be found in [60].
That said, the numerical simulations for both wave approaches were performed using the software Fluent, version 2024 R2. This commercial CFD package is based on the finite volume method (FVM), which allows for the numerical modeling of fluid flow and heat transfer in complex domains [65,66,67].
To deal with the water–air interaction, the volume of fluid (VOF) multiphase model was employed to track the interface between the two fluids [55]. In this model, each computational cell contains a volumetric fraction (α) of each phase (water and air), with the sum of the fractions in each cell equal to 1 [65]. Additionally, the simulated flow is assumed to be two-dimensional, isothermal, laminar, and incompressible. Accordingly, the governing equations for mass conservation, momentum, and volume fraction are defined as follows [66,67,68]:
ρ t + · ρ v = 0 ,
ρ v t + · ρ v v = p + · μ τ ¯ ¯ + ρ g + S ,
ρ α t + · ρ α v = 0 ,
with ρ being the density (kg/m3), v the velocity vector (m/s), p the pressure, μ the absolute viscosity coefficient (kg/m·s), τ ¯ ¯ the strain rate tensor (N/m2), and S the damping sink term (N/m3).
The continuity and momentum equations are applied to the fluid mixture; therefore, ρ and μ are expressed as mixture properties, given by the following [69]:
ρ = α w a t e r ρ w a t e r + α a i r ρ a i r ,
μ = α w a t e r μ w a t e r + α a i r μ a i r ,
Moreover, the reflection of waves at the end of the wave flume can be avoided in the computational model by using a technique known as a numerical beach. This approach works by dissipating the energy of the waves as they reach the downstream end of the channel. To achieve this, the damping sink term is incorporated into Equation (6), being defined as follows [70,71,72]:
S = C 1 ρ V + 1 2 C 2 ρ V V 1 z z f s z b z f s x x s z e z s 2 ,
with C1 (s−1) and C2 (m−1) being, respectively, the linear and quadratic damping coefficients, V the velocity in z direction (m/s), ρ the density (kg/m3), x (m) and z (m), respectively, the horizontal and vertical positions, zb (m) and zfs (m), respectively, the vertical positions of the bottom and free surface, and xs (m) and xe (m), respectively, the horizontal positions of the start and end of the numerical beach. As indicated by [73], C1 = 20 s−1 and C2 = 0 m−1 were adopted.
To maintain accurate control over the numerically simulated cases, specific numerical schemes were chosen based on prior research. The momentum equation was discretized using the first-order upwind scheme, while pressure discretization was performed using the pressure staggering option (PRESTO) method. The geo-reconstruct scheme was adopted for calculating the volumetric fraction, and the pressure–velocity coupling was handled using the pressure-implicit splitting of operators (PISO) algorithm. It should be emphasized that this computational setup has already been validated and properly employed in earlier studies, for instance, [47,48,51,60].
The computational domain used in this study combines recommendations from previous works. The wave flume dimensions and the wave characteristics (both representative regular and realistic irregular) were adopted from [60], who analyzed wave propagation in a full-scale numerical wave flume without any device installed. Meanwhile, the SHP geometry corresponds to the optimized configuration proposed by [51]. Additionally, a bathymetry was incorporated into the domain, as suggested in the approach by [74]. Table 1 provides the wave flume dimensions, in which Hc represents the channel height, and Lp, hp, ep, and Ap refer, respectively, to the length, height, thickness, and area of the plate used in Case 1 (as illustrated in Figure 1).
It is worth mentioning that the characteristics of the representative regular waves (Table 1) of the sea state were used as parameters for the construction of the wave flume (Figure 2). In agreement with [73], the numerical beach region spans a length of 2λ, which was found to be sufficient in their investigation to damp wave reflections and ensure accurate results.
As mentioned earlier, this study investigates not only the SHP (see Figure 1, Case 1) adopted as reference but also 10 additional configurations of the SP with varying inclinations (see Figure 1, Cases 2–11). In all cases, the wave channel dimensions and the SP area, as listed in Table 1, were maintained unchanged. The properties of the representative regular waves generated and propagated within the channel are summarized in Table 2 and represent Hs and Tm (see Figure 2).
Figure 3 provides a visual summary of the information presented in Table 1 and Table 2.
Figure 4 illustrates the boundary conditions applied in the numerical wave flume for all analyzed cases. A red-highlighted velocity inlet is located along the left boundary of the wave channel, rising from the bed to the free surface, representing a second-order Stokes wave generator, Equations (1) and (2), for regular waves and the subdivisions implemented in the WaveMIMO methodology [54,60], for irregular waves. The wall boundary condition was assigned to the bottom of the channel and around the SP (black segments), treating them as rigid surfaces. The top boundary of the domain was set as a pressure outlet (blue segment). Finally, the right end surface (green segment) is defined with a hydrostatic profile, enabling the use of the numerical beach.
Regarding the initial condition for the numerical simulations, the wave flume is considered at rest.

2.2. Mesh Generation in the Computational Domain

The computational domain comprises a 2D numerical wave flume, in which the SP is positioned at the central region. To perform the spatial discretization, mesh refinement techniques involving stretching and biasing were applied. Figure 5 presents a schematic illustration highlighting the distinct regions of the domain and the specific meshing strategy adopted for each region.
A stretched mesh approach, previously implemented by [75] and later analyzed by [60], was employed in the upstream and downstream sections of the domain (see Figure 5). A fixed number of vertical divisions was assigned in the inlet velocity region, comprising six zones: the region fully submerged in water (hH), four zones in the free surface region, where the water–air interface fluctuates (Hh to h + H), and the region above the free surface, containing only air (h + H). These regions were discretized with 60, 40, and 20 divisions, respectively. In the horizontal direction, a resolution of 50 divisions per λ was adopted. As a result, quadrilateral cells were generated within these regions.
In the plate region (central area in Figure 5), which is delimited by two vertical yellow lines positioned at a distance of 1.5Lp from each end of the SP, an irregular mesh composed of triangular computational cells was employed. This decision was required because of the geometric intricacies arising from the different inclined SP configurations (see Figure 1, Cases 2–11). Although triangular meshes are generally considered less accurate than structured quadrilateral ones, they provide greater flexibility for modeling complex geometries [76], which justifies their use in this region.
Additionally, the central area (see Figure 5) was partitioned into subdomains with uniform cell refinement, aiming to streamline the discretization process and maintain consistency in cell size. This approach standardizes the mesh generation procedure, ensuring that the prescribed refinement is applied evenly throughout the entire central domain.
It is important to highlight that the use of stretched meshes to generate regular as well as irregular waves is a well-established methodology. Accordingly, the guidelines provided by [60] were adopted. However, a mesh convergence study was deemed necessary to identify an appropriate irregular triangular mesh configuration for the central region.
This mesh convergence analysis aimed to ensure the reliability of the numerical results while optimizing computational efficiency. This study was based on Cases 1 and 11 (see Figure 1). Case 1 was selected because it serves as the baseline configuration used for comparison with all inclined cases; while Case 11 was selected due to its high degree of mesh distortion, making it a representative and conservative scenario for establishing mesh quality standards. Apart from that, it is worth mentioning that these mesh convergence tests were performed considering the incidence of the realistic irregular waves.
The mesh refinement in the central area followed the characteristic length recommendation provided by ANSYS Meshing, which uses the Autodyn methodology to determine a representative length scale based on the geometric features of the computational domain. This parameter automatically adjusts mesh density to ensure sufficient resolution in regions with complex geometries and/or curvature, such as the central area on the mesh of this study, and was used to calculate the characteristic time step used [77].
In this convergence study, five mesh configurations were tested. For each configuration, the time step was proportionally adjusted along with the mesh size to preserve numerical stability and accuracy. To quantitatively evaluate the influence of mesh refinement, the maximum absolute axial velocity (umax) at half the plate height (hp/2) below the SP was monitored, and relative differences between successive refinements were used to assess convergence.

2.3. Numerical Model Verifications

The SHP configuration (Case 1, see Figure 1) was employed to verify the numerical model against the irregular wave results obtained by Thum et al. [47]. To do so, the spatial and temporal discretization settings established in the preceding convergence analysis were applied. This verification was performed using irregular wave data from Rio Grande (2014), consistent with the conditions used in [47].
The parameters monitored to verify the numerical modeling were the free surface elevation (η) at the beginning of the wave channel (at x = 0 m) and η downstream of the SHP (at x = 116 m). A time step of 0.013 s was employed, totaling 23,077 steps and corresponding to 300 s of simulated time. The total processing time for the simulation was approximately 6 h.
To verify the irregular wave generation using the inlet data of [60], the wave channel was used without the SHP, and a probe was placed at the beginning of the channel (at x = 0 m). In this case, the irregular wave data were based on sea state conditions from Rio Grande in 2018, which were also used in the 11 inclined SHP cases analyzed in this study.
The comparison is performed qualitatively through graphical comparison between the curves generated in the present study and the reference results. Furthermore, a quantitative assessment is also performed, using the Mean Absolute Error (MAE) and Root Mean Square Error (RMSE) statistical indicators, respectively, given by [77]:
MAE = j = 1 n P S j R j j = 1 n R j ,
RMSE = 1 n j = 1 n P S j R j 2 ,
in which PS represents the value from the present study (specifically for Case 1), R denotes the reference values (presented by [47] or [60]), and n corresponds to the number of monitored data.

2.4. Results Analysis for Cases 1–11

To quantitatively analyze the results obtained for the Cases 2–11 featuring inclined SP geometries compared to the Case 1, SHP adopted as reference, the integrals of the magnitude of the upstream and downstream free surface elevation and the axial velocity beneath the SP were computed by means of the trapezoidal rule for each case [78]:
I = a b f ϕ d ϕ Δ t 2 f ϕ 0 + 2 j = 1 n 1 f ϕ j + f ϕ n ,
with I being the integral value (in m for η or in or m/s for u), Δt the time step (s) that is the width of the subintervals, and f ϕ 0 , f ϕ j , and f ϕ n the function value, respectively, at the lower limit (t = 0 s), at intermediate points (0 s < t < 300 s), and at the upper limit (t = 300 s) of the integral.
As in [48], to compare the performance of the studied configurations as BW devices, the ratio Iηd1/Iηdi, was employed, where Iηd1 corresponds to the integral result of Case 1 and Iηdi the other cases values (for 2 ≤ i ≤ 11). Similarly, for evaluating the efficiency as WEC devices, the ratio Iui/Iu1 was used, in which Iui refers to the integral values from Cases 2 to 11, and Iu1 corresponds to the reference Case 1. In both BW and WEC analyses, these dimensionless ratios compare the performance of the inclined SP configurations (Cases 2 to 11) to that of the SHP (Case 1), serving as the baseline in this study. Ratios greater than 1 indicate that the inclined SP performs better than the SHP, while ratios below 1 suggest reduced efficiency. Moreover, this approach also enables performance comparisons among the inclined SP cases themselves, where the highest and lowest dimensionless values identify the most and least efficient configurations, respectively.
Additionally, to better quantify the relative efficiency values as BW and to account not only for the Case 1 but also for the incident wave conditions of each configuration, a ratio between the upstream and downstream integrals was adopted for each case individually, Iηui/Iηdi, with Iηui being the integral of the magnitude of the upstream free surface elevation. This allows evaluating how much wave energy is attenuated throughout the domain, offering a complementary perspective on the performance of each configuration. Therefore, a ratio greater than unity indicates that the downstream waves are smaller than the upstream waves, i.e., the SP was effective as BW. Highlighting that this indicator was proposed as a simple metric to assess the effectiveness of the SP as a BW, based on the premise that a reduction in free surface elevation downstream reflects a corresponding attenuation of wave energy. While it does not explicitly isolate individual dissipation mechanisms, it captures their overall effect through the resulting wave profile, providing an integrated measure of the energy reduction before the waves reach the coastline.
Finally, still regarding the results related to the BW function, a third investigation was conducted. To directly assess the influence of the SP on the free surface elevation downstream, numerical simulations were carried out without the presence of the SP. The free surface elevation was monitored, both for representative regular waves and realistic irregular waves, in the same downstream region where it was monitored in the cases with the SP. This allowed for a comparative analysis based on the integral of the free surface elevation downstream (Iηdi) of each case relative to the integral free surface elevations downstream without the SP (IηwSP).
It is important to highlight that the BW function of the SP was assessed through a more comprehensive set of analyses than those conducted for its WEC function. This distinction is justified by the fact that the axial velocity beneath the device, which is the variable used to evaluate its performance as a WEC, can be considered more locally dependent and less influenced by external hydrodynamic factors, such as wave reflections or bathymetric variations. In contrast, the transmitted wave amplitude, used to assess BW efficiency, is strongly affected by both upstream wave reflections and downstream propagation conditions, requiring a broader investigation.

2.5. Scope and Limitations of the Proposed Approach

It is important to highlight that the present study focuses exclusively on the hydrodynamic behavior of the SP device, using a two-dimensional computational model. As such, practical implementation challenges, including structural loads, mooring systems, and the integration of energy conversion components, were not addressed. Furthermore, the numerical model adopts certain simplifications, such as the assumption of laminar flow and the use of a 2D domain. Despite that, for the global wave–structure interaction analysis presented here, the laminar model has proven to be a computationally efficient and sufficiently accurate alternative. Despite these constraints, the results provide valuable scientific insights into the dual functionality of the SP as both a BW and a WEC.

3. Results and Discussion

3.1. Results of the Mesh Convergence Test

Results obtained with different spatial discretizations for Cases 1 and 11 (see Figure 1) are presented in Table 3. In both cases, Mesh 3 yielded the lowest error and the shortest processing time. Consequently, a central mesh refinement of 0.09496 m per computational cell was adopted in all numerical simulations.
To enhance visualization, Figure 6 illustrates the data from Table 3, showing how the maximum axial velocity varies with the total number of computational cells for both cases. The selected mesh configuration (Mesh 3) is indicated in green for emphasis.

3.2. Numerical Modeling Verifications

The proposed numerical model was verified by comparing the present results with those obtained by [47,60], in which validated models were employed. Reference [47] validated their computational model using the experimental results presented in [79], who investigated the behavior of regular waves interacting with an SHP. A relative error of 7.73% was reported, based on a difference of −0.0088 m/s in the maximum axial velocity beneath the SHP. Similarly, Reference [60] using the WaveMIMO methodology, validated the generation and propagation of irregular waves against the experimental data presented by [80]. An average error of 6.12% was achieved when comparing the water-free surface elevation of irregular waves. One can understand that this adopted verification strategy allows the proposed computational model to be indirectly validated.
To do so, qualitative and quantitative comparisons are presented, respectively, in Figure 7 and Table 4, having as reference [47] or [60]. From the obtained results, it can be considered that the computational model for irregular wave generation adopted in this numerical investigation was adequately verified and indirectly validated. This definition was adopted because the curves generated in this study follow the same trend as those presented by [47,60] (see Figure 7), and the corresponding MAE and RMSE values (see Table 4) were low, indicating minimal deviation from these reference datasets.
Furthermore, based on Figure 7, Figure A1 of Appendix A presents in detail the differences between the results obtained in the present study in comparison to the references.
One can note that only verifications related to irregular waves were performed here. This is justified by the fact that the verification of the numerical model for regular waves was already thoroughly developed in [48] with the results of [51]. Moreover, in [51] as well as [47] performed a validation procedure with experimental results of [79] for the same computational model adopted here. Therefore, for the sake of brevity, those verification/validation results for regular waves are not presented again in this work.

3.3. Analysis of Cases 1–11 Under Representative Regular Wave Incidence

Firstly, Figure 8, Figure 9 and 
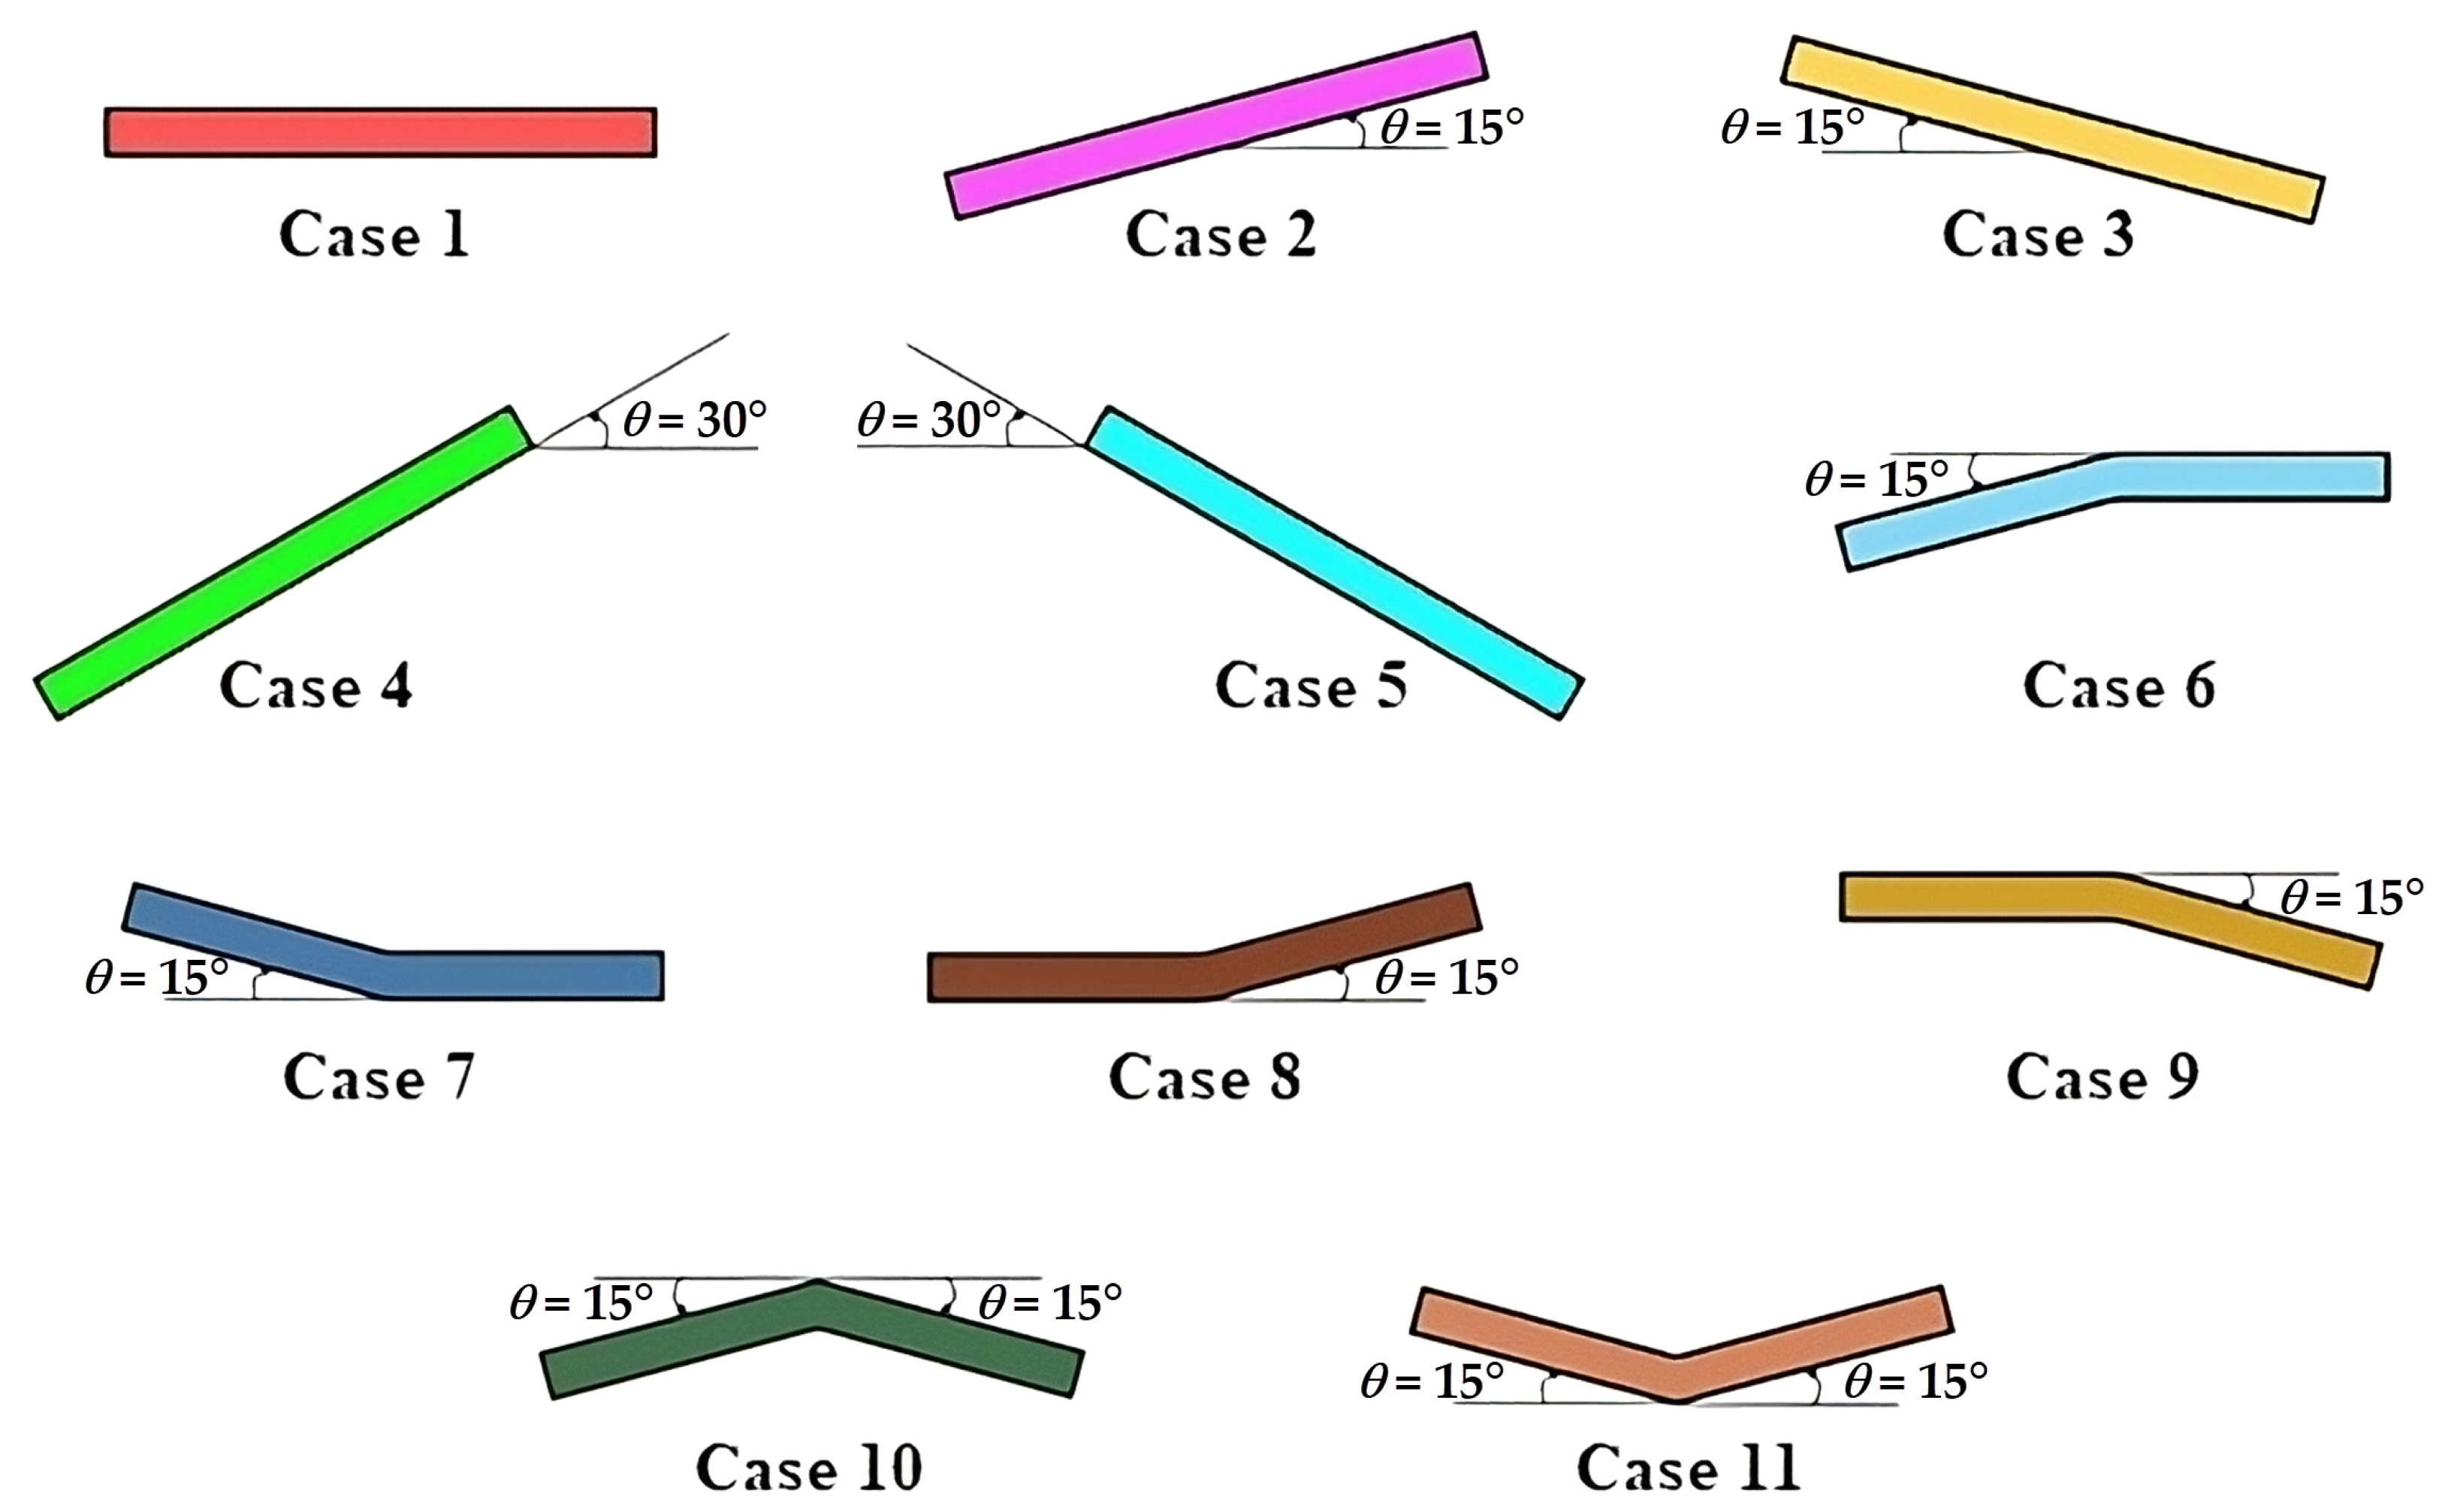
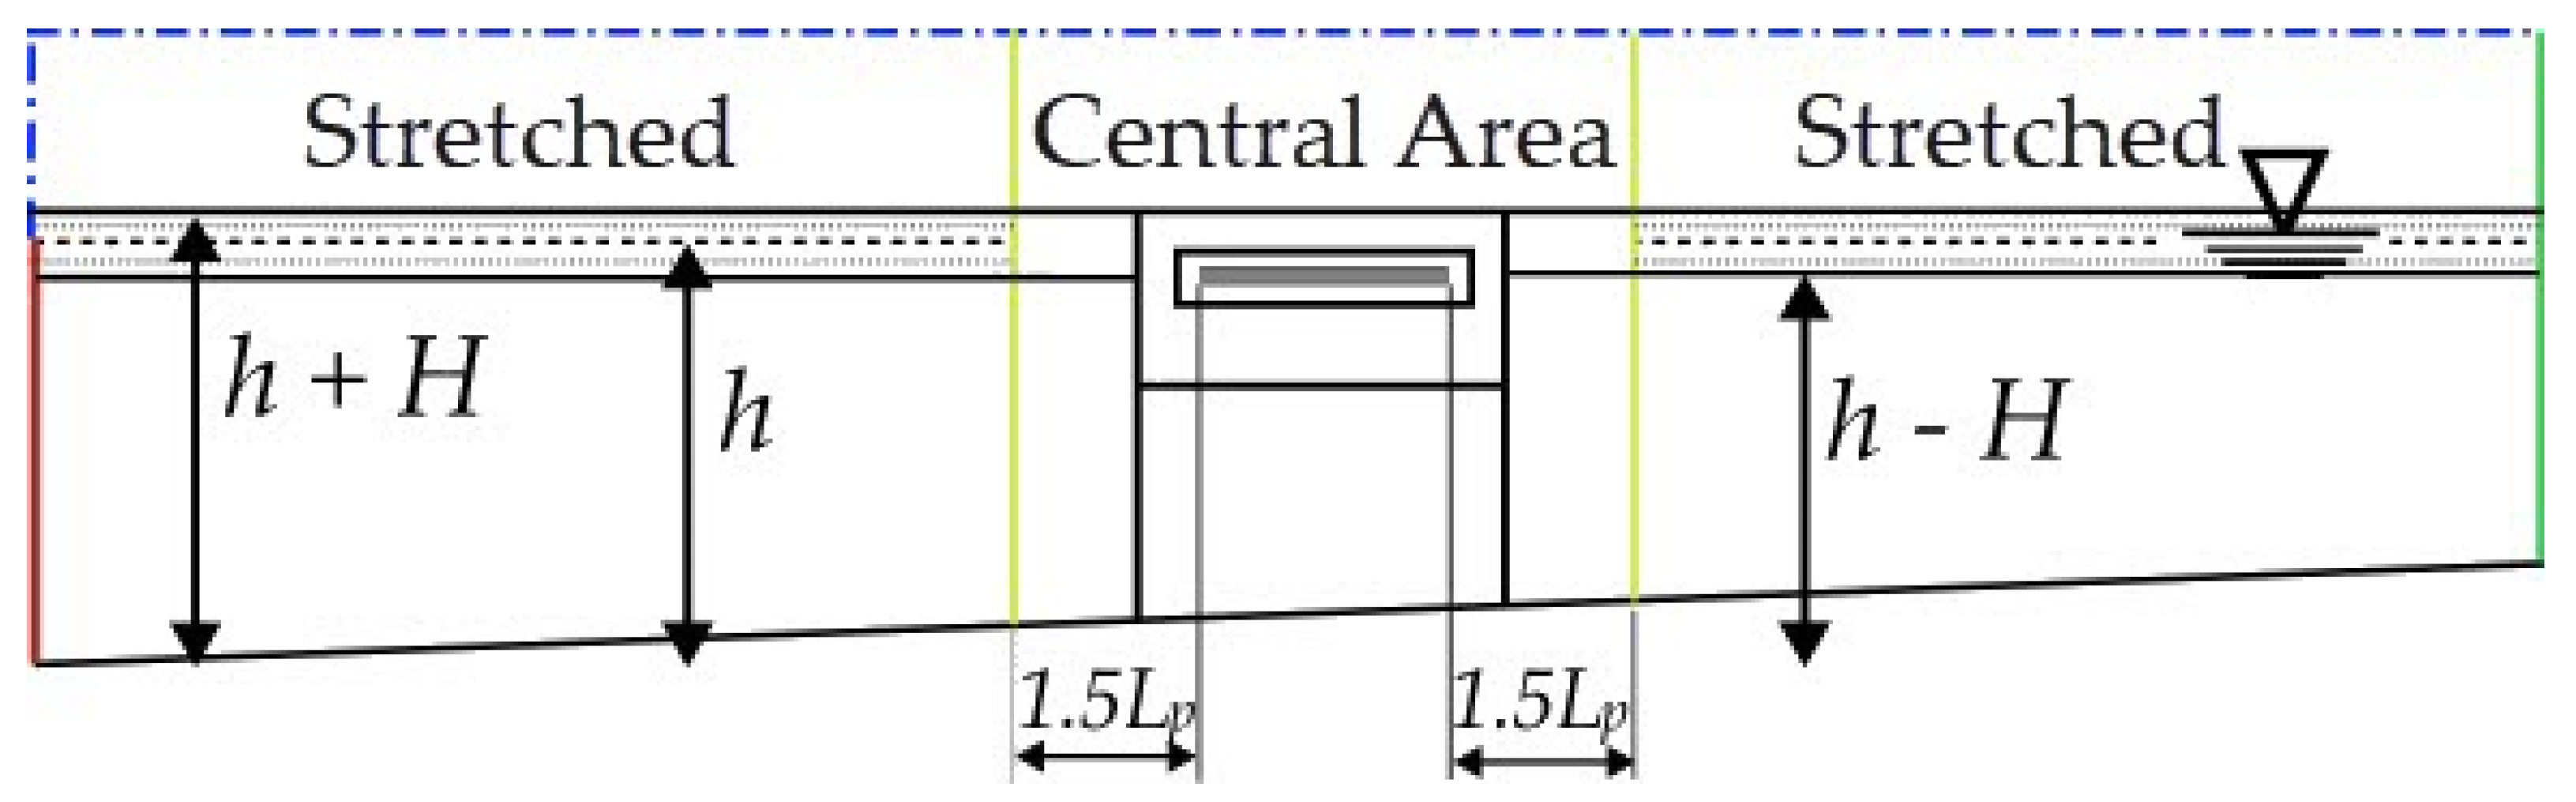
Figure 10 present the results for Cases 2 to 11, which feature inclined configurations of the SP (see Figure 1), as well as for Case 1 (see Figure 1), used as the reference case for comparison. These results correspond to simulations with the representative regular waves of the coastal region of the Rio Grande. To allow a direct comparison between each inclined geometry and the reference case, the results of Cases 2 to 11 are plotted together with Case 1.
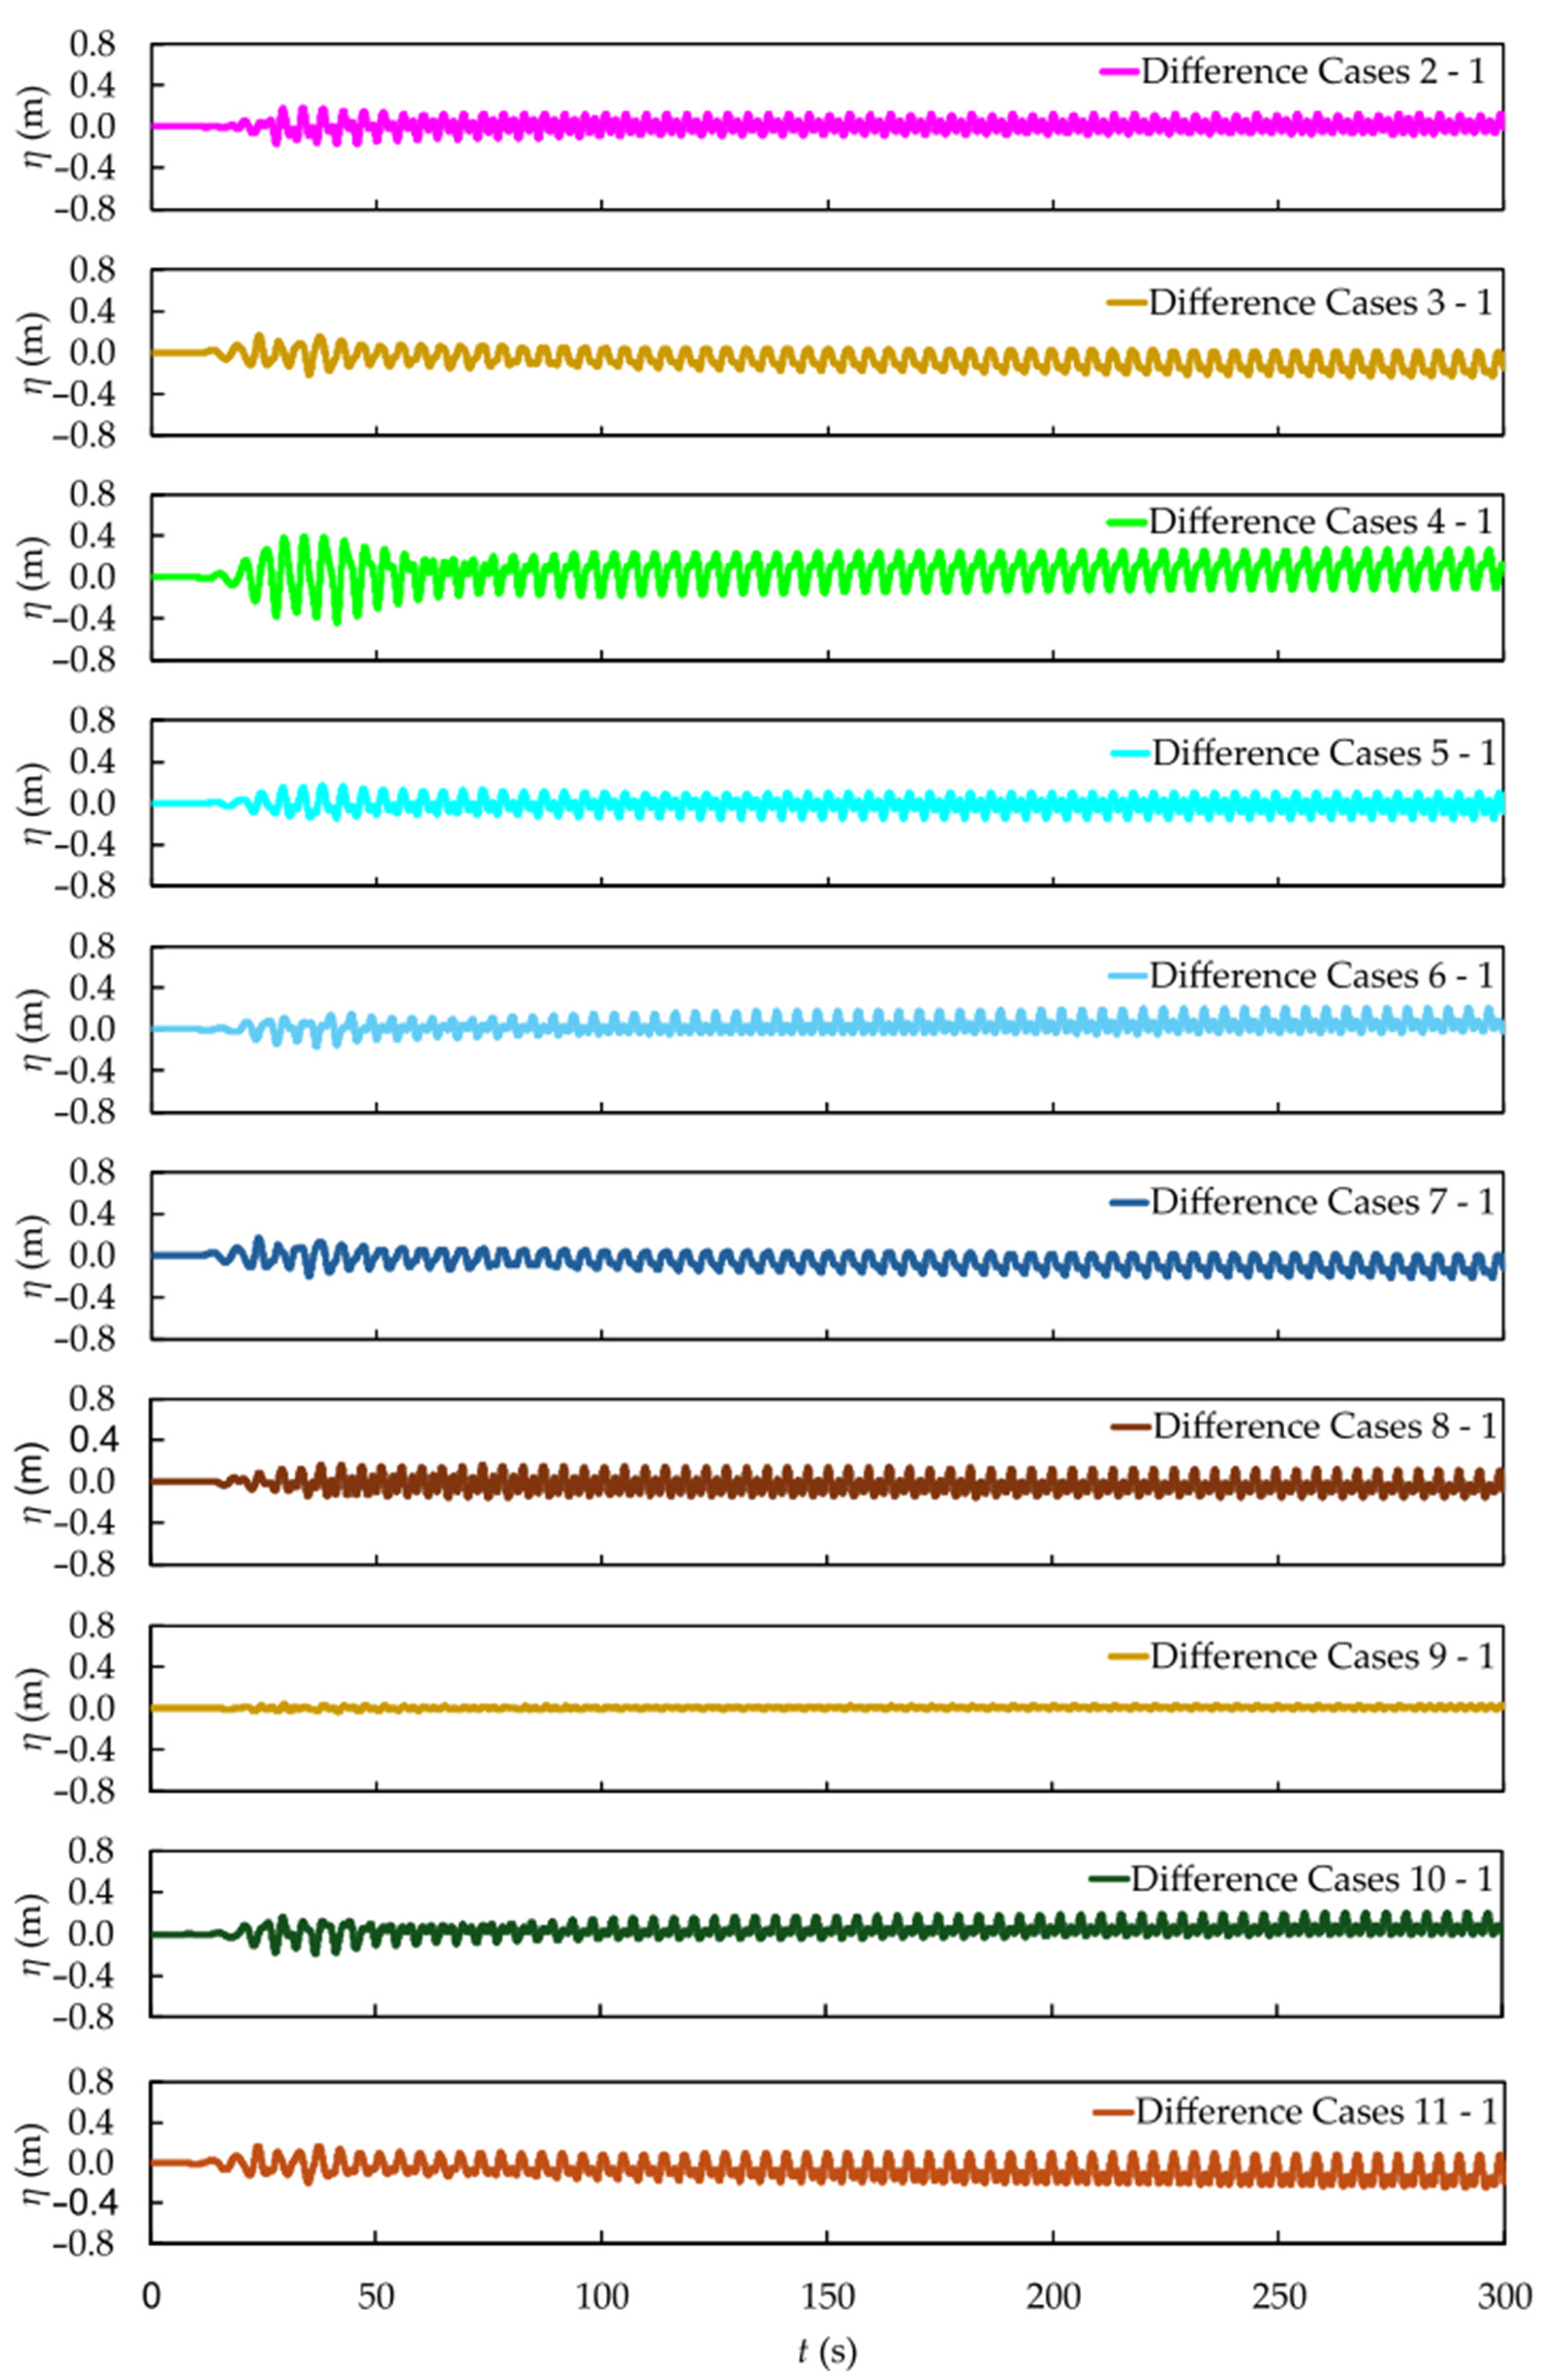
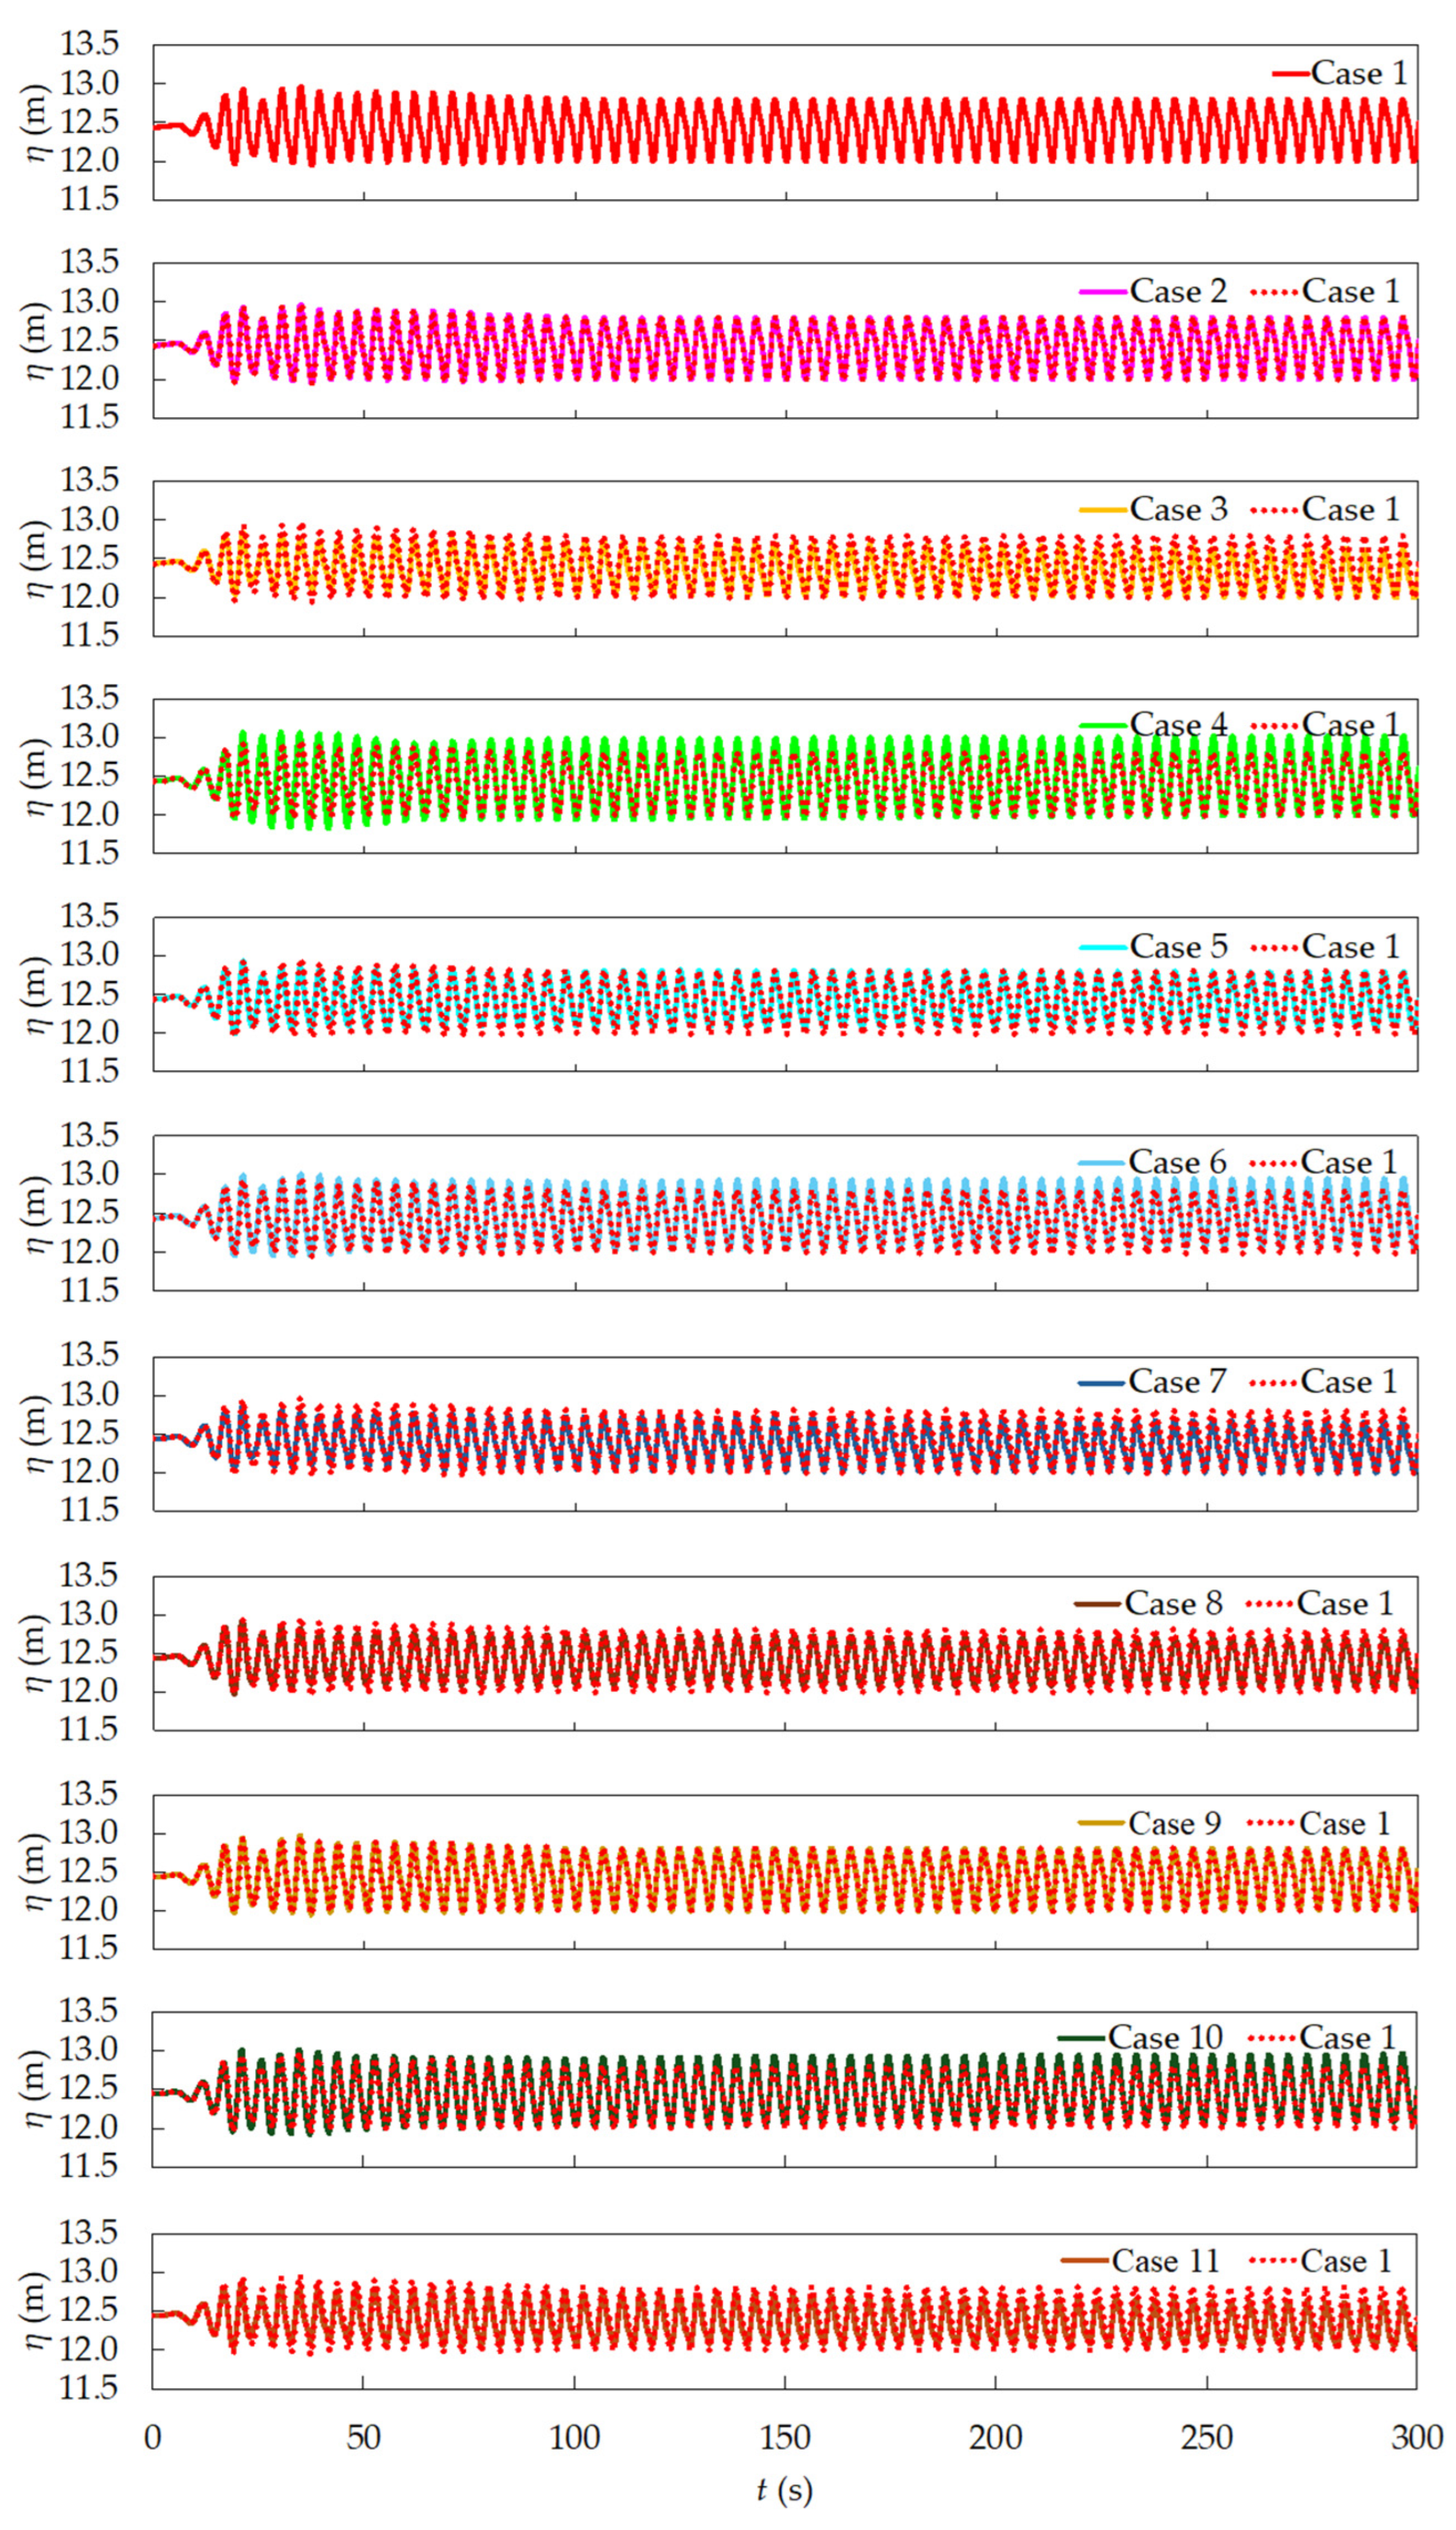
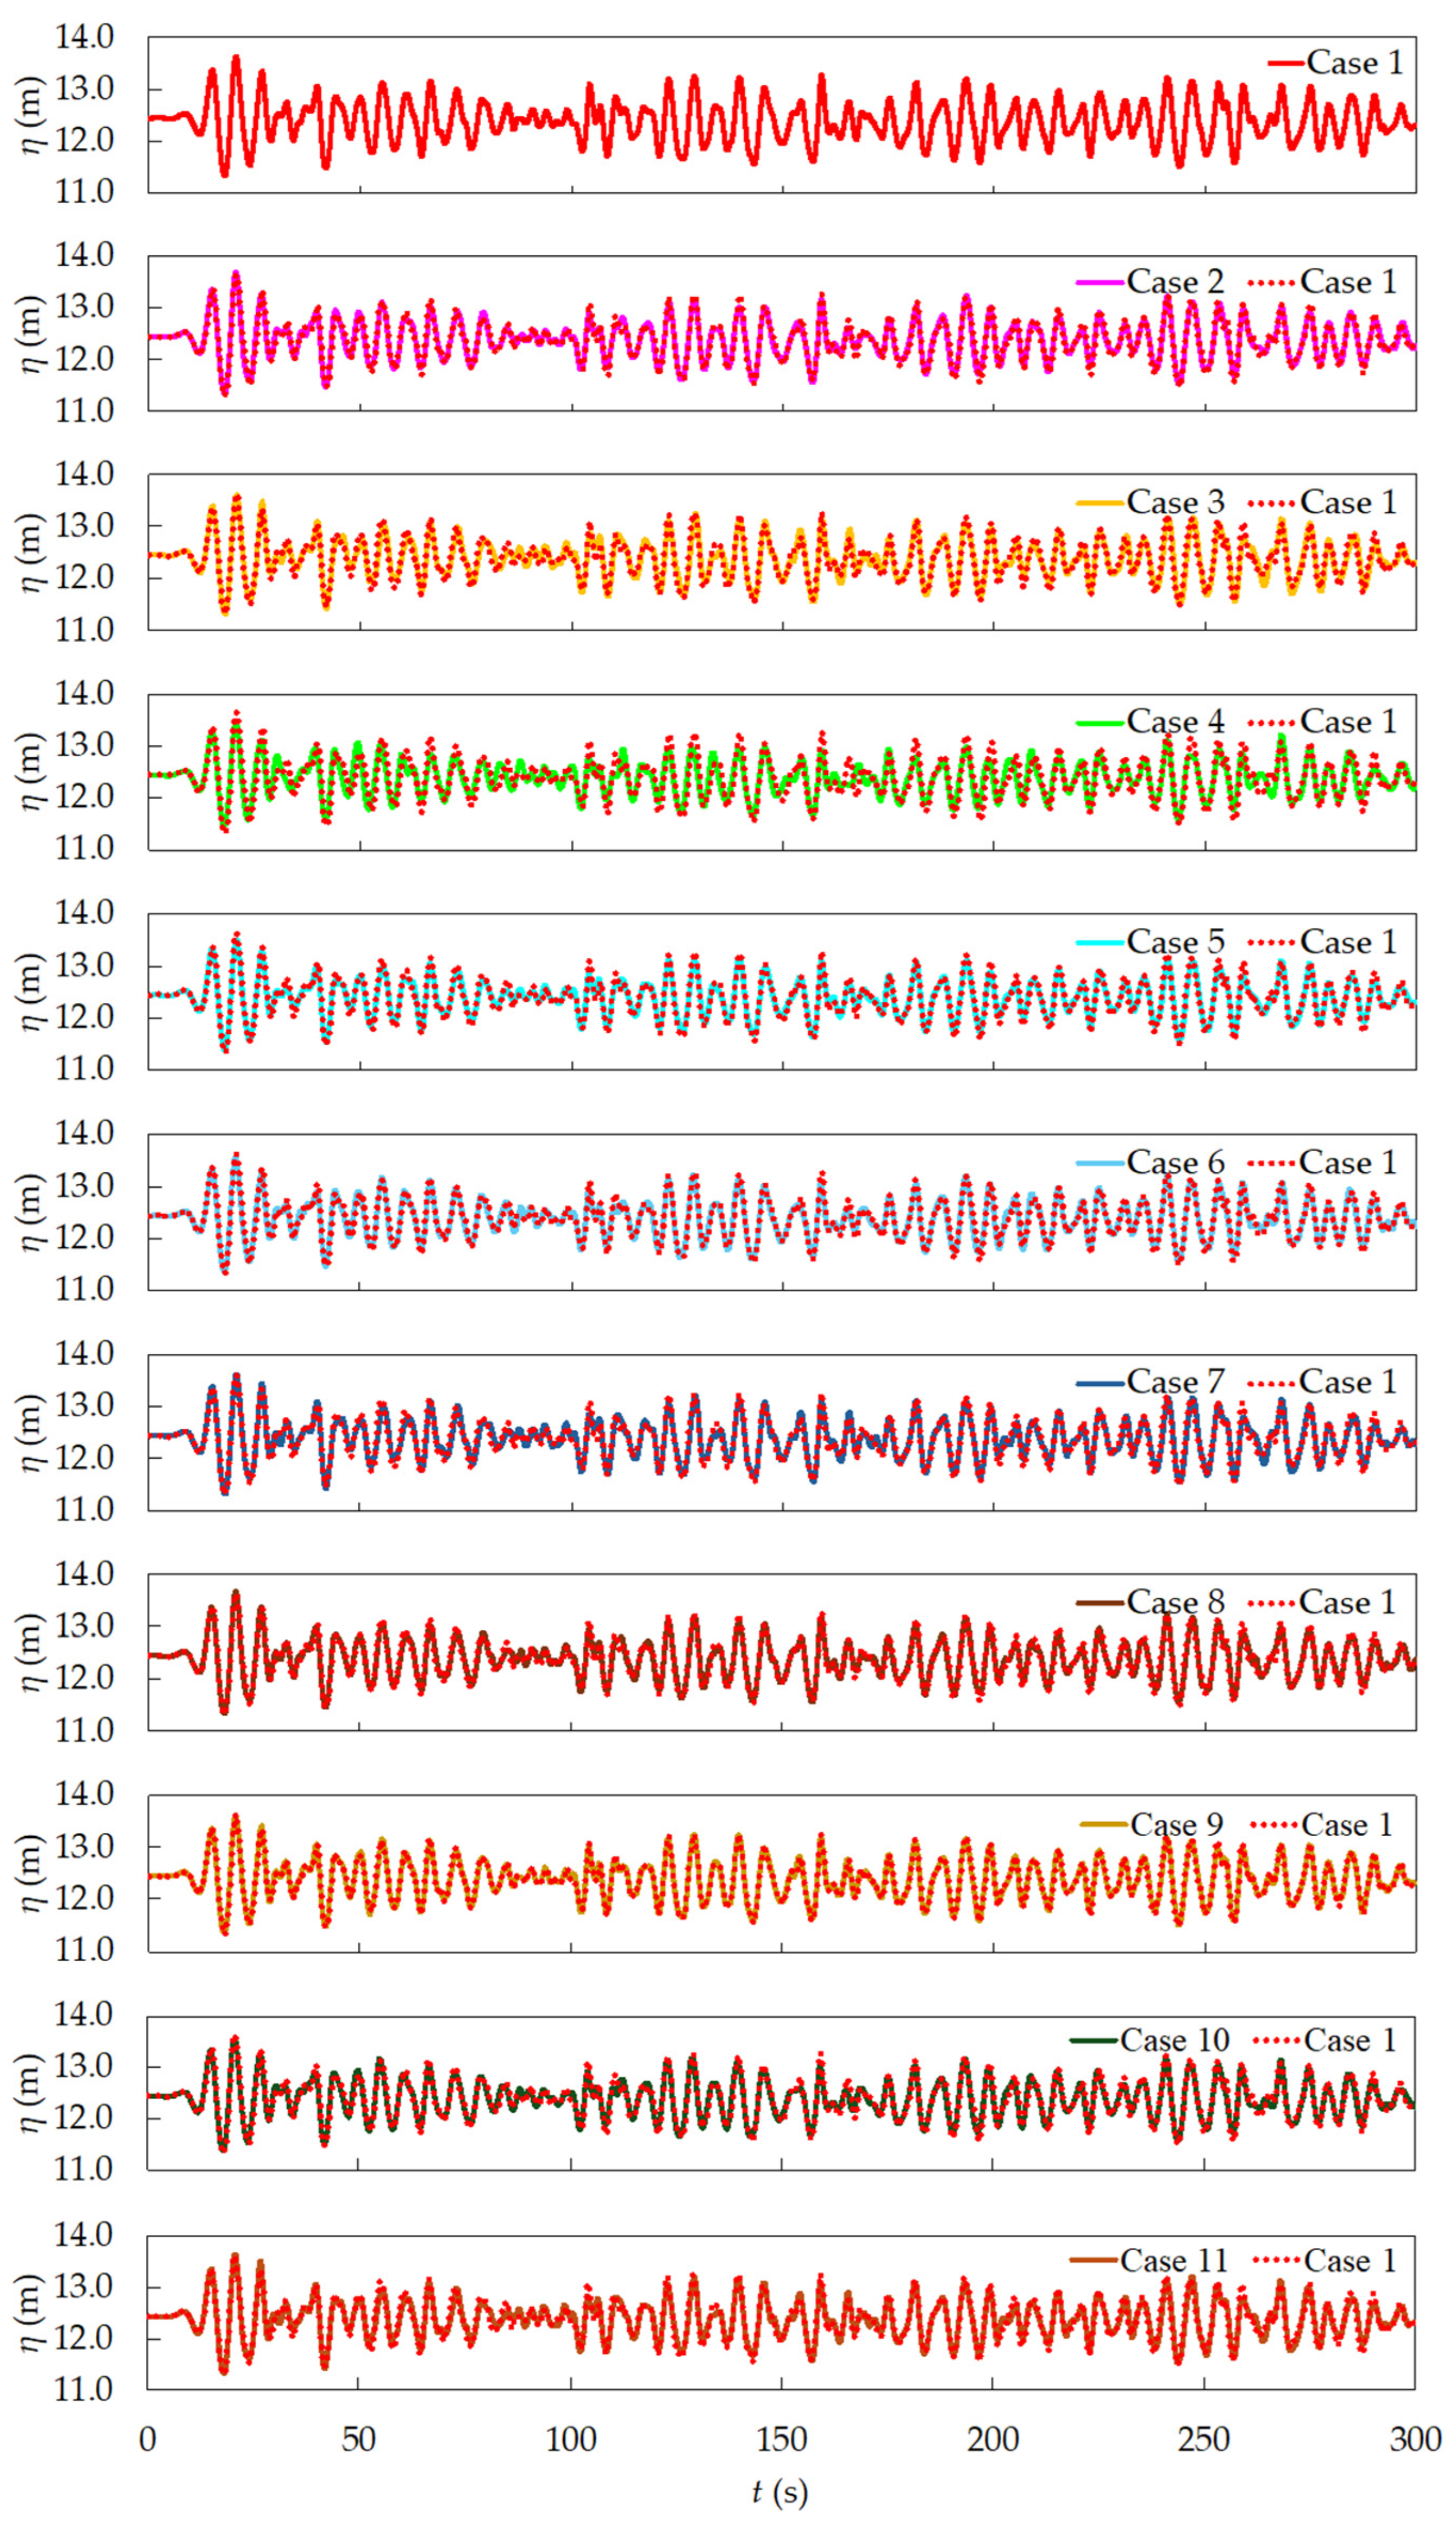
Moreover, from Figure 8, Figure 9 and Figure 10, the detailed difference curves were plotted and are presented in Figure A2, Figure A3 and Figure A4 of Appendix A, respectively.
In Figure 8, it can be observed that wave reflection on the plate affected the free surface elevation upstream. As the inclination varied, this reflection also changed, influencing the results. This effect is more pronounced here than in a previous study by [48], due to the different wave characteristics. In the present study, the waves are higher but have shorter wavelengths, which enhances the influence of the plate’s inclination in the upstream region. Cases 8 and 9 showed the smallest differences compared to Case 1, which is expected due to their specific geometry, where the flow from left to right still impacts the same section without inclination. However, this effect is not so relevant to the objectives of this work, which are to reduce the free surface elevation downstream (acting as a BW) and to increase the axial velocity beneath the SP (acting as a WEC).
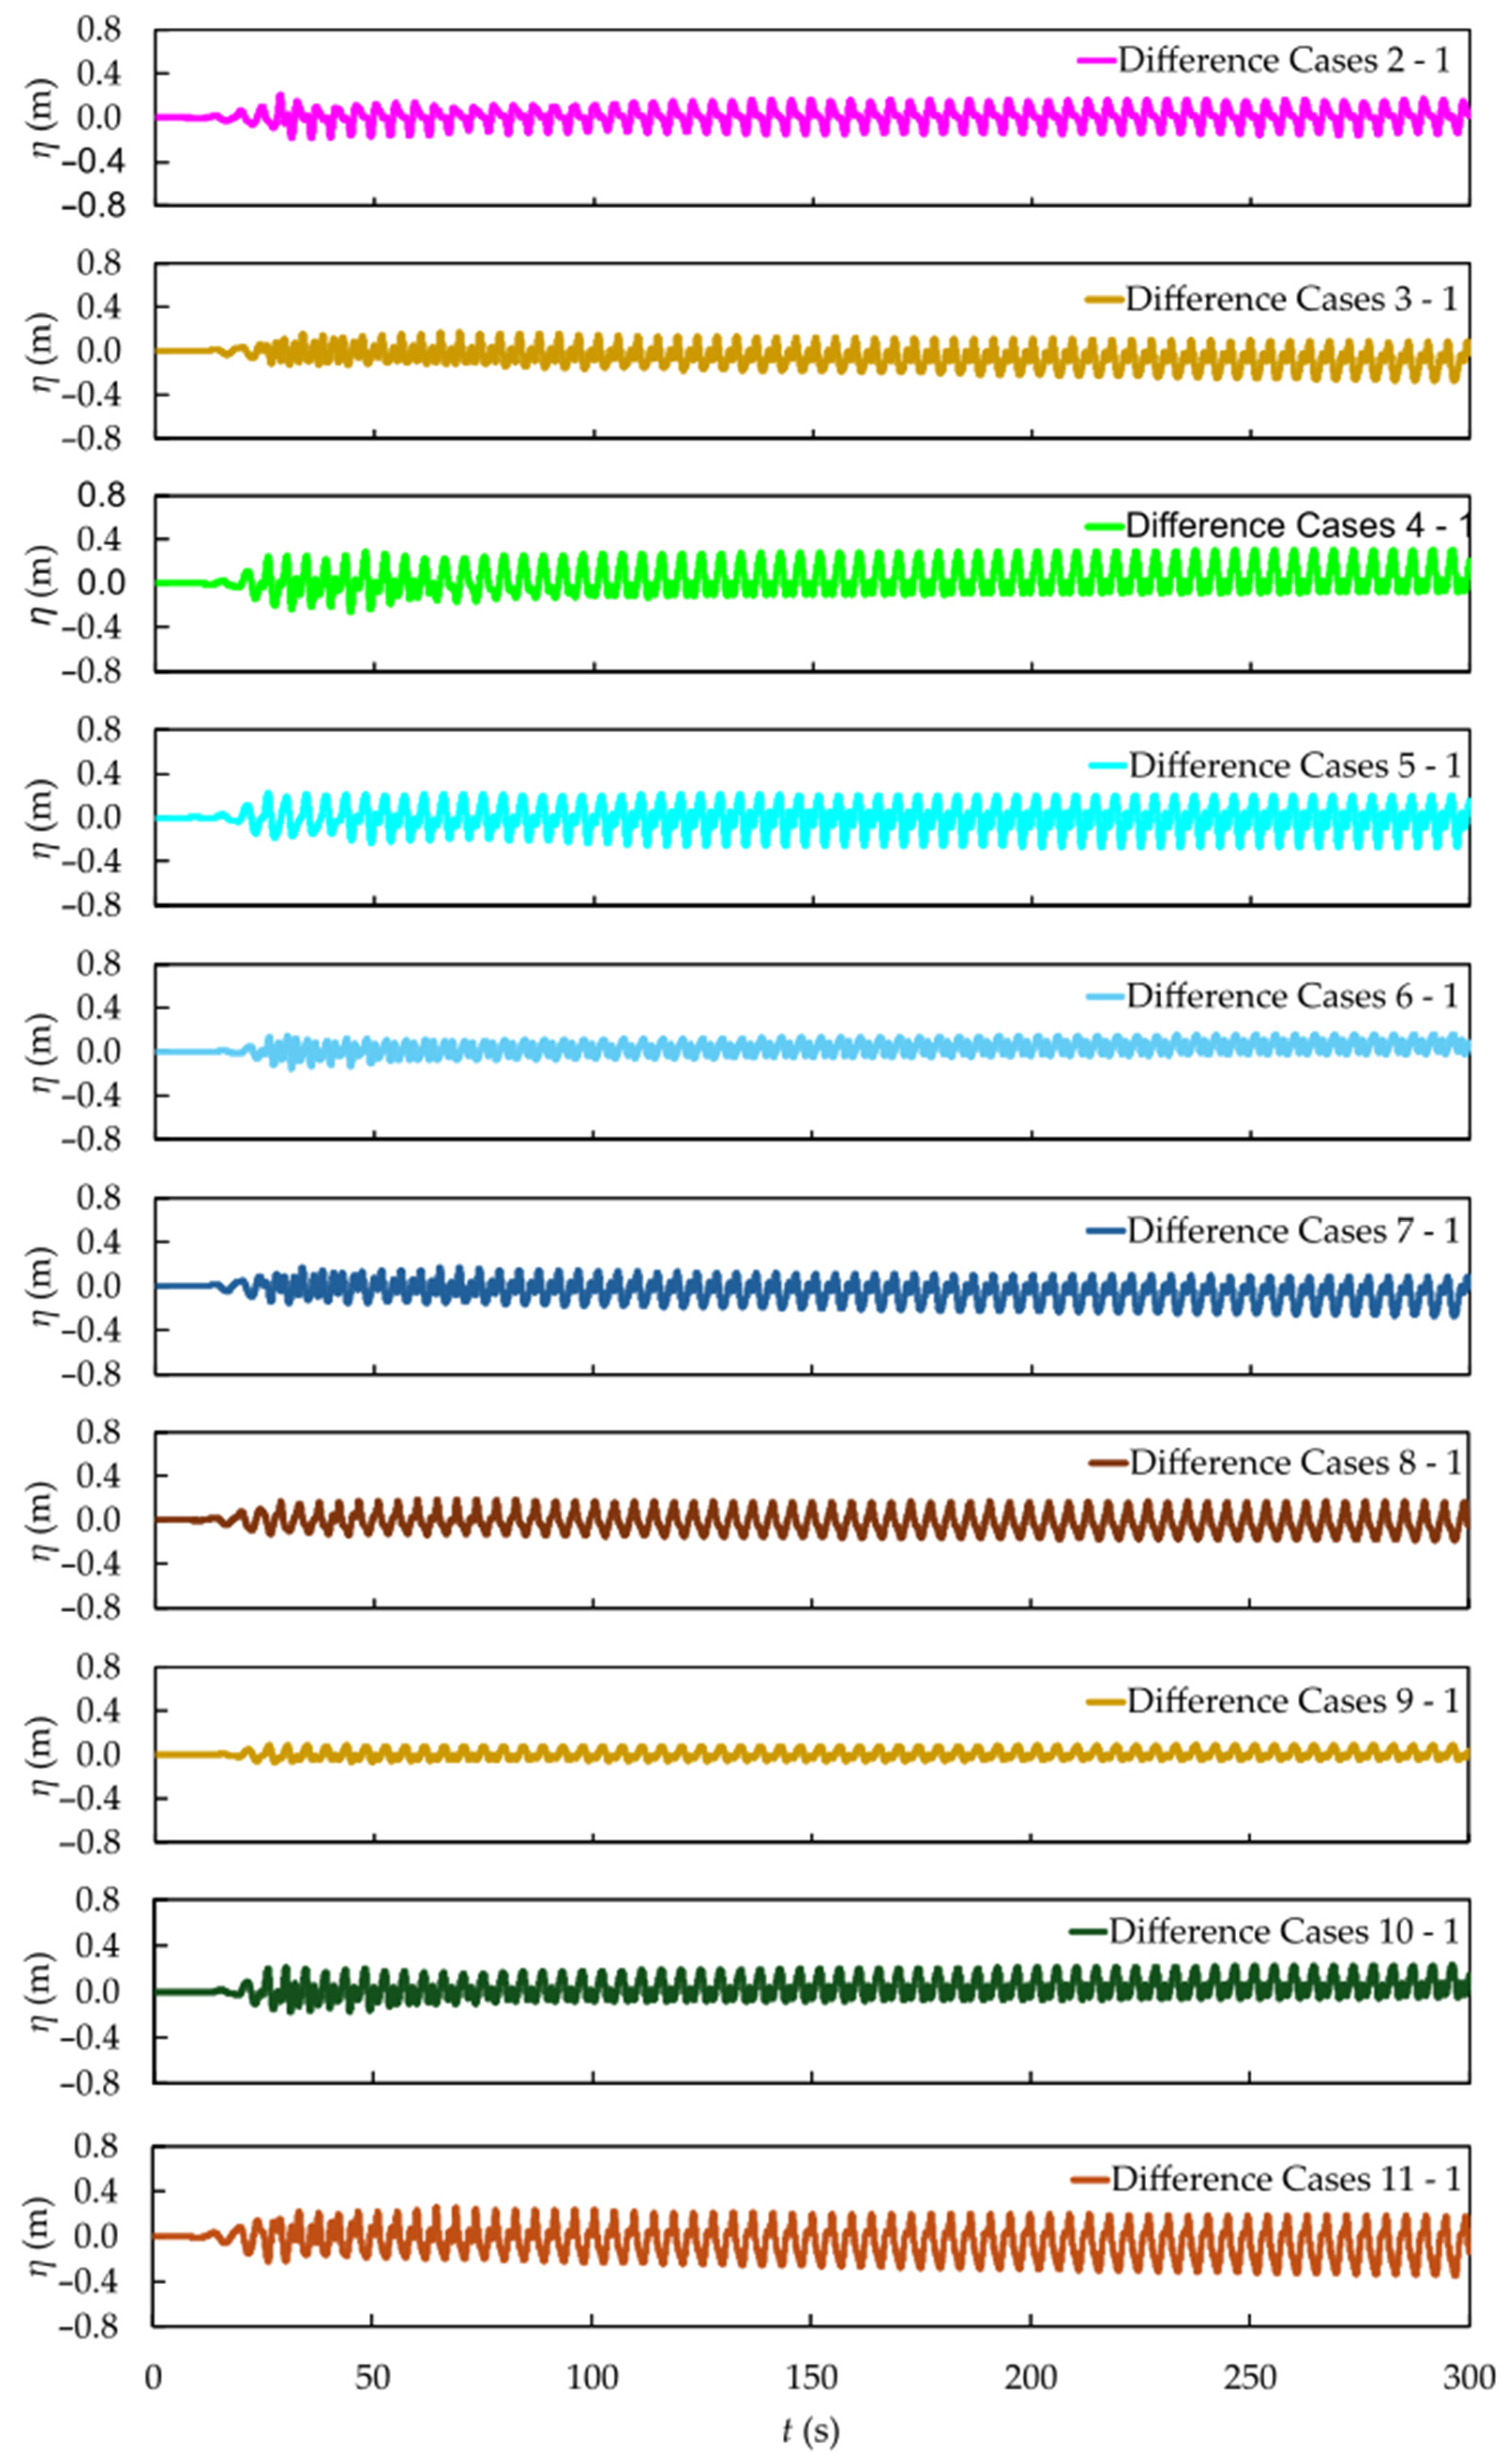
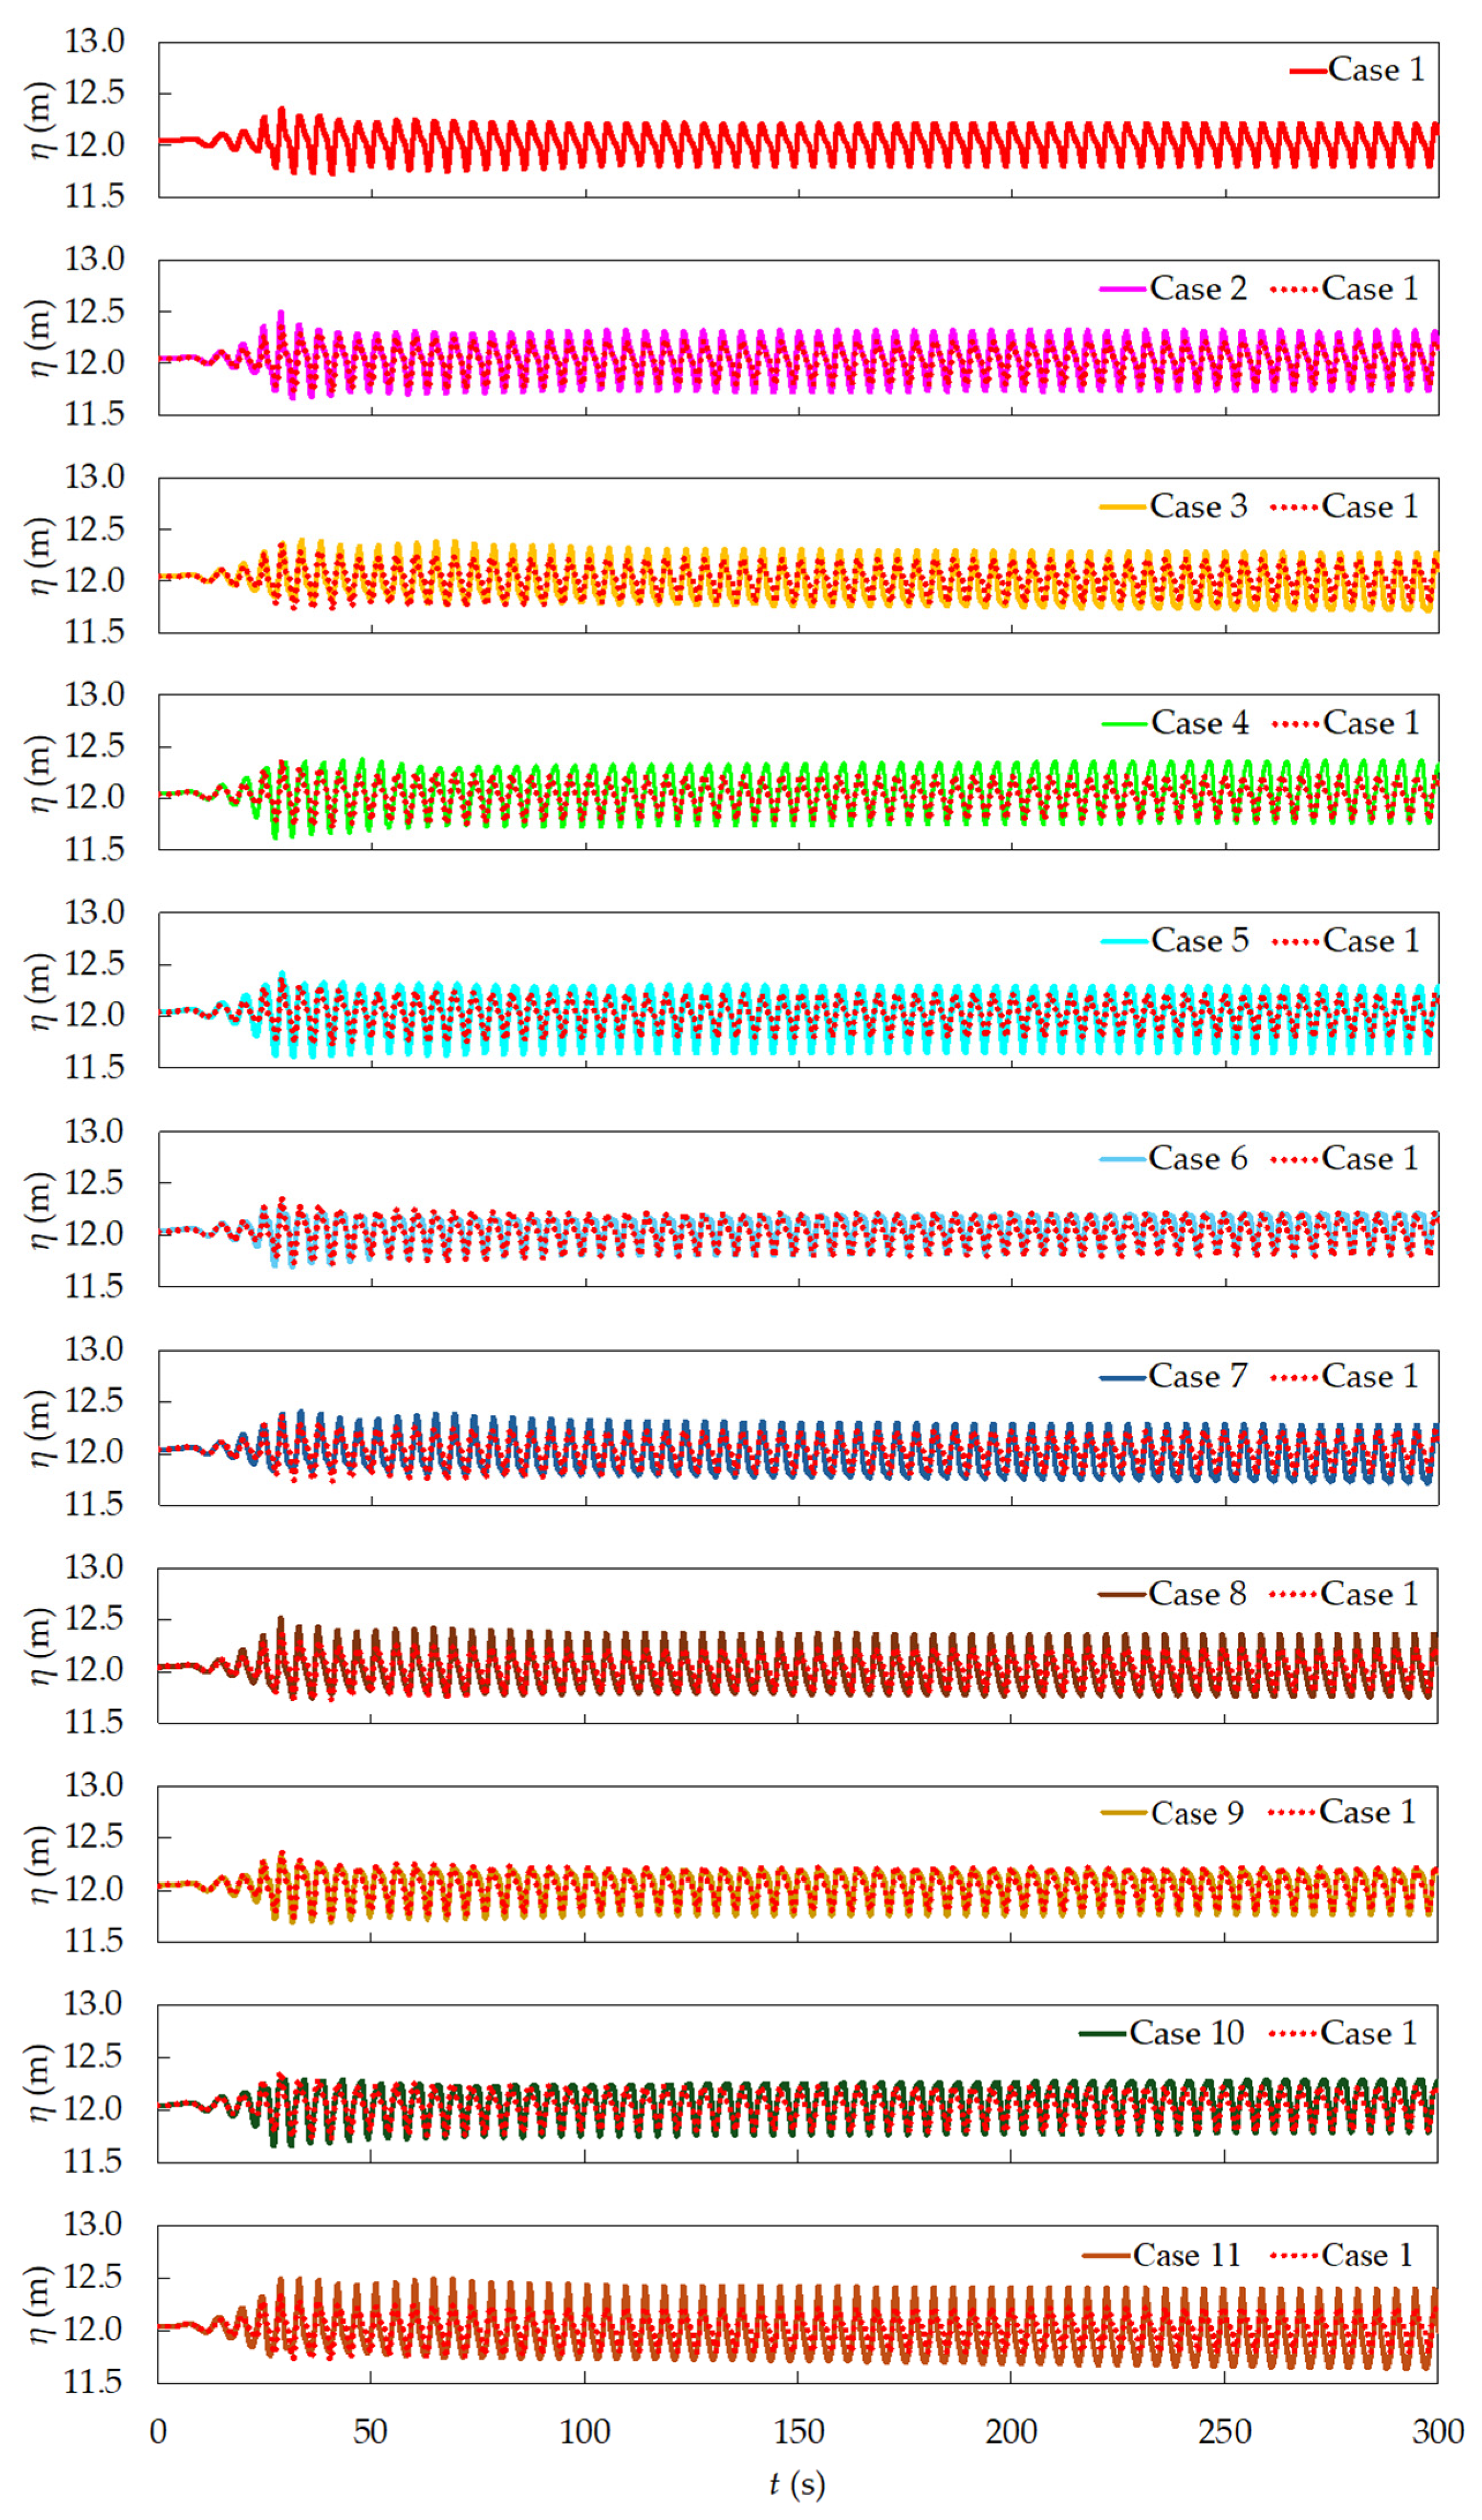
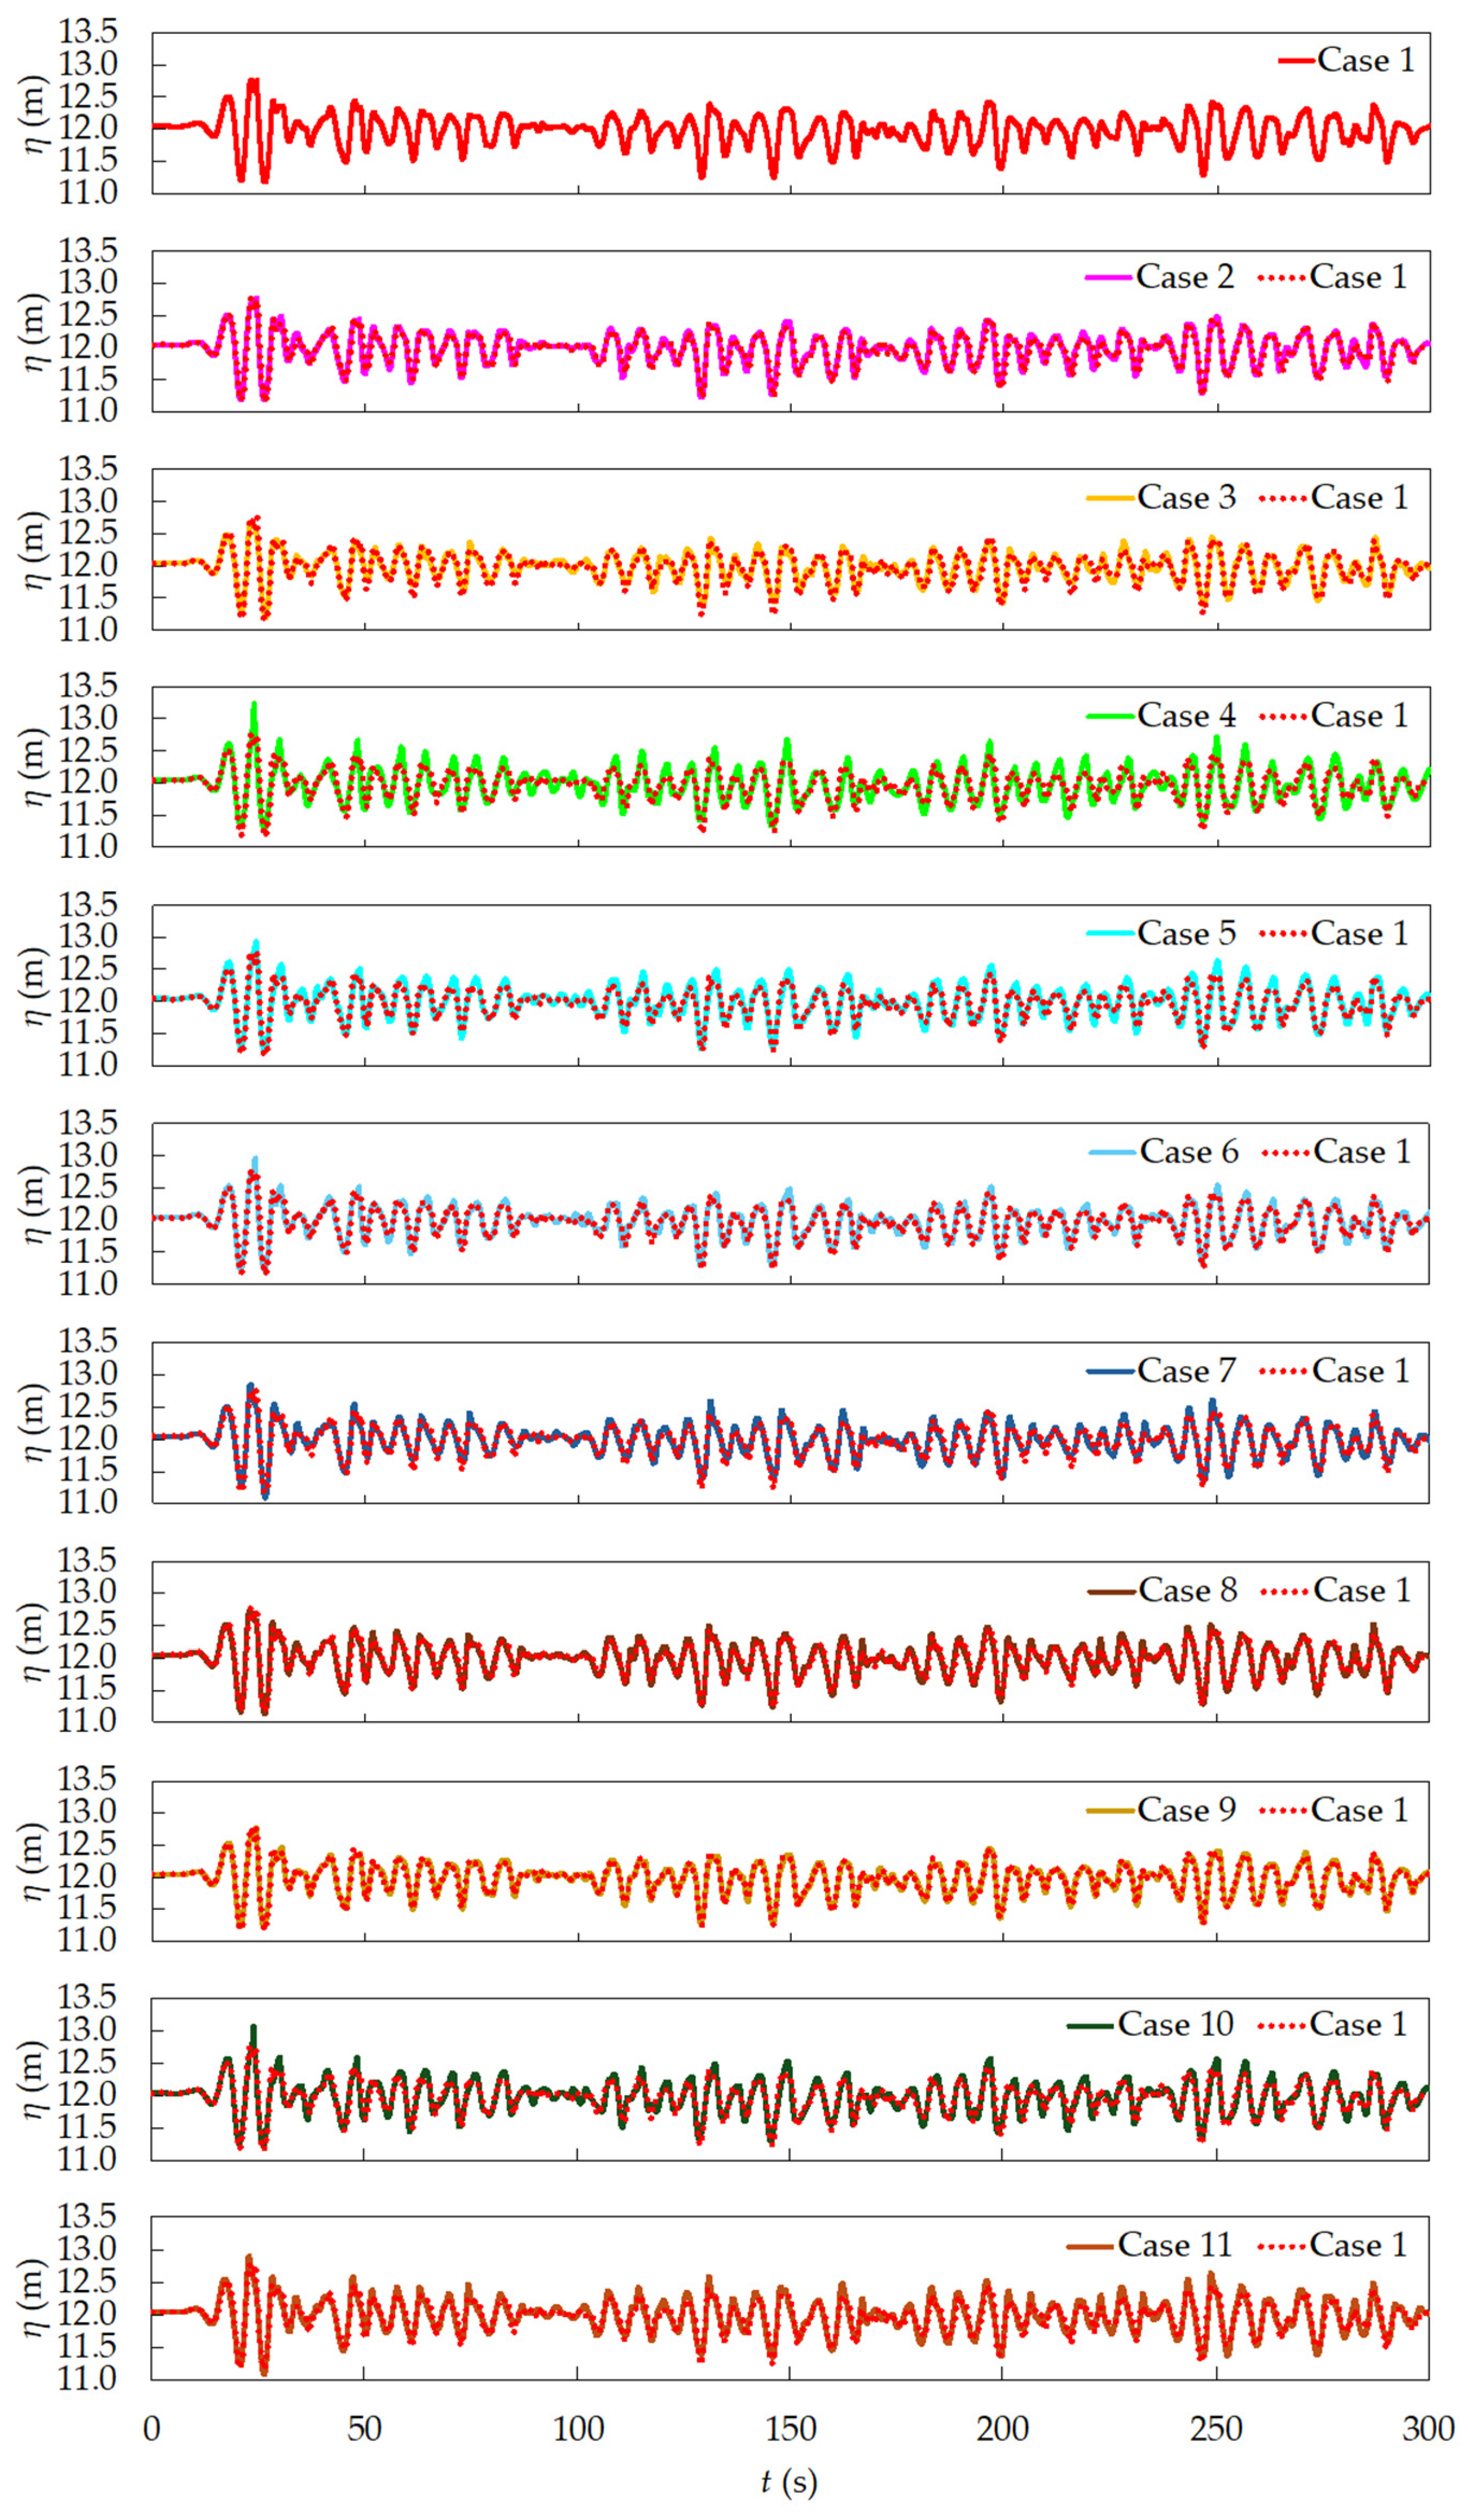
In Figure 9, it can be observed that the inclination of the plate negatively affected its performance as a BW, since Case 1 presents a lower wave amplitude compared to the inclined cases, especially Cases 5 and 11. This behavior also contrasts with the previous study of [48], in which a slight reduction in the free surface elevation was observed for some of these cases.
Still considering Figure 9, it is worth noting that the lower average recorded by the downstream probe (approximately 12 m, compared to around 12.5 m upstream) is due to the presence of the bathymetry, which causes the channel bed elevation to vary with position. Since the probe measures the distance from the bottom to the free surface, the recorded value also changes according to the longitudinal position in the channel.
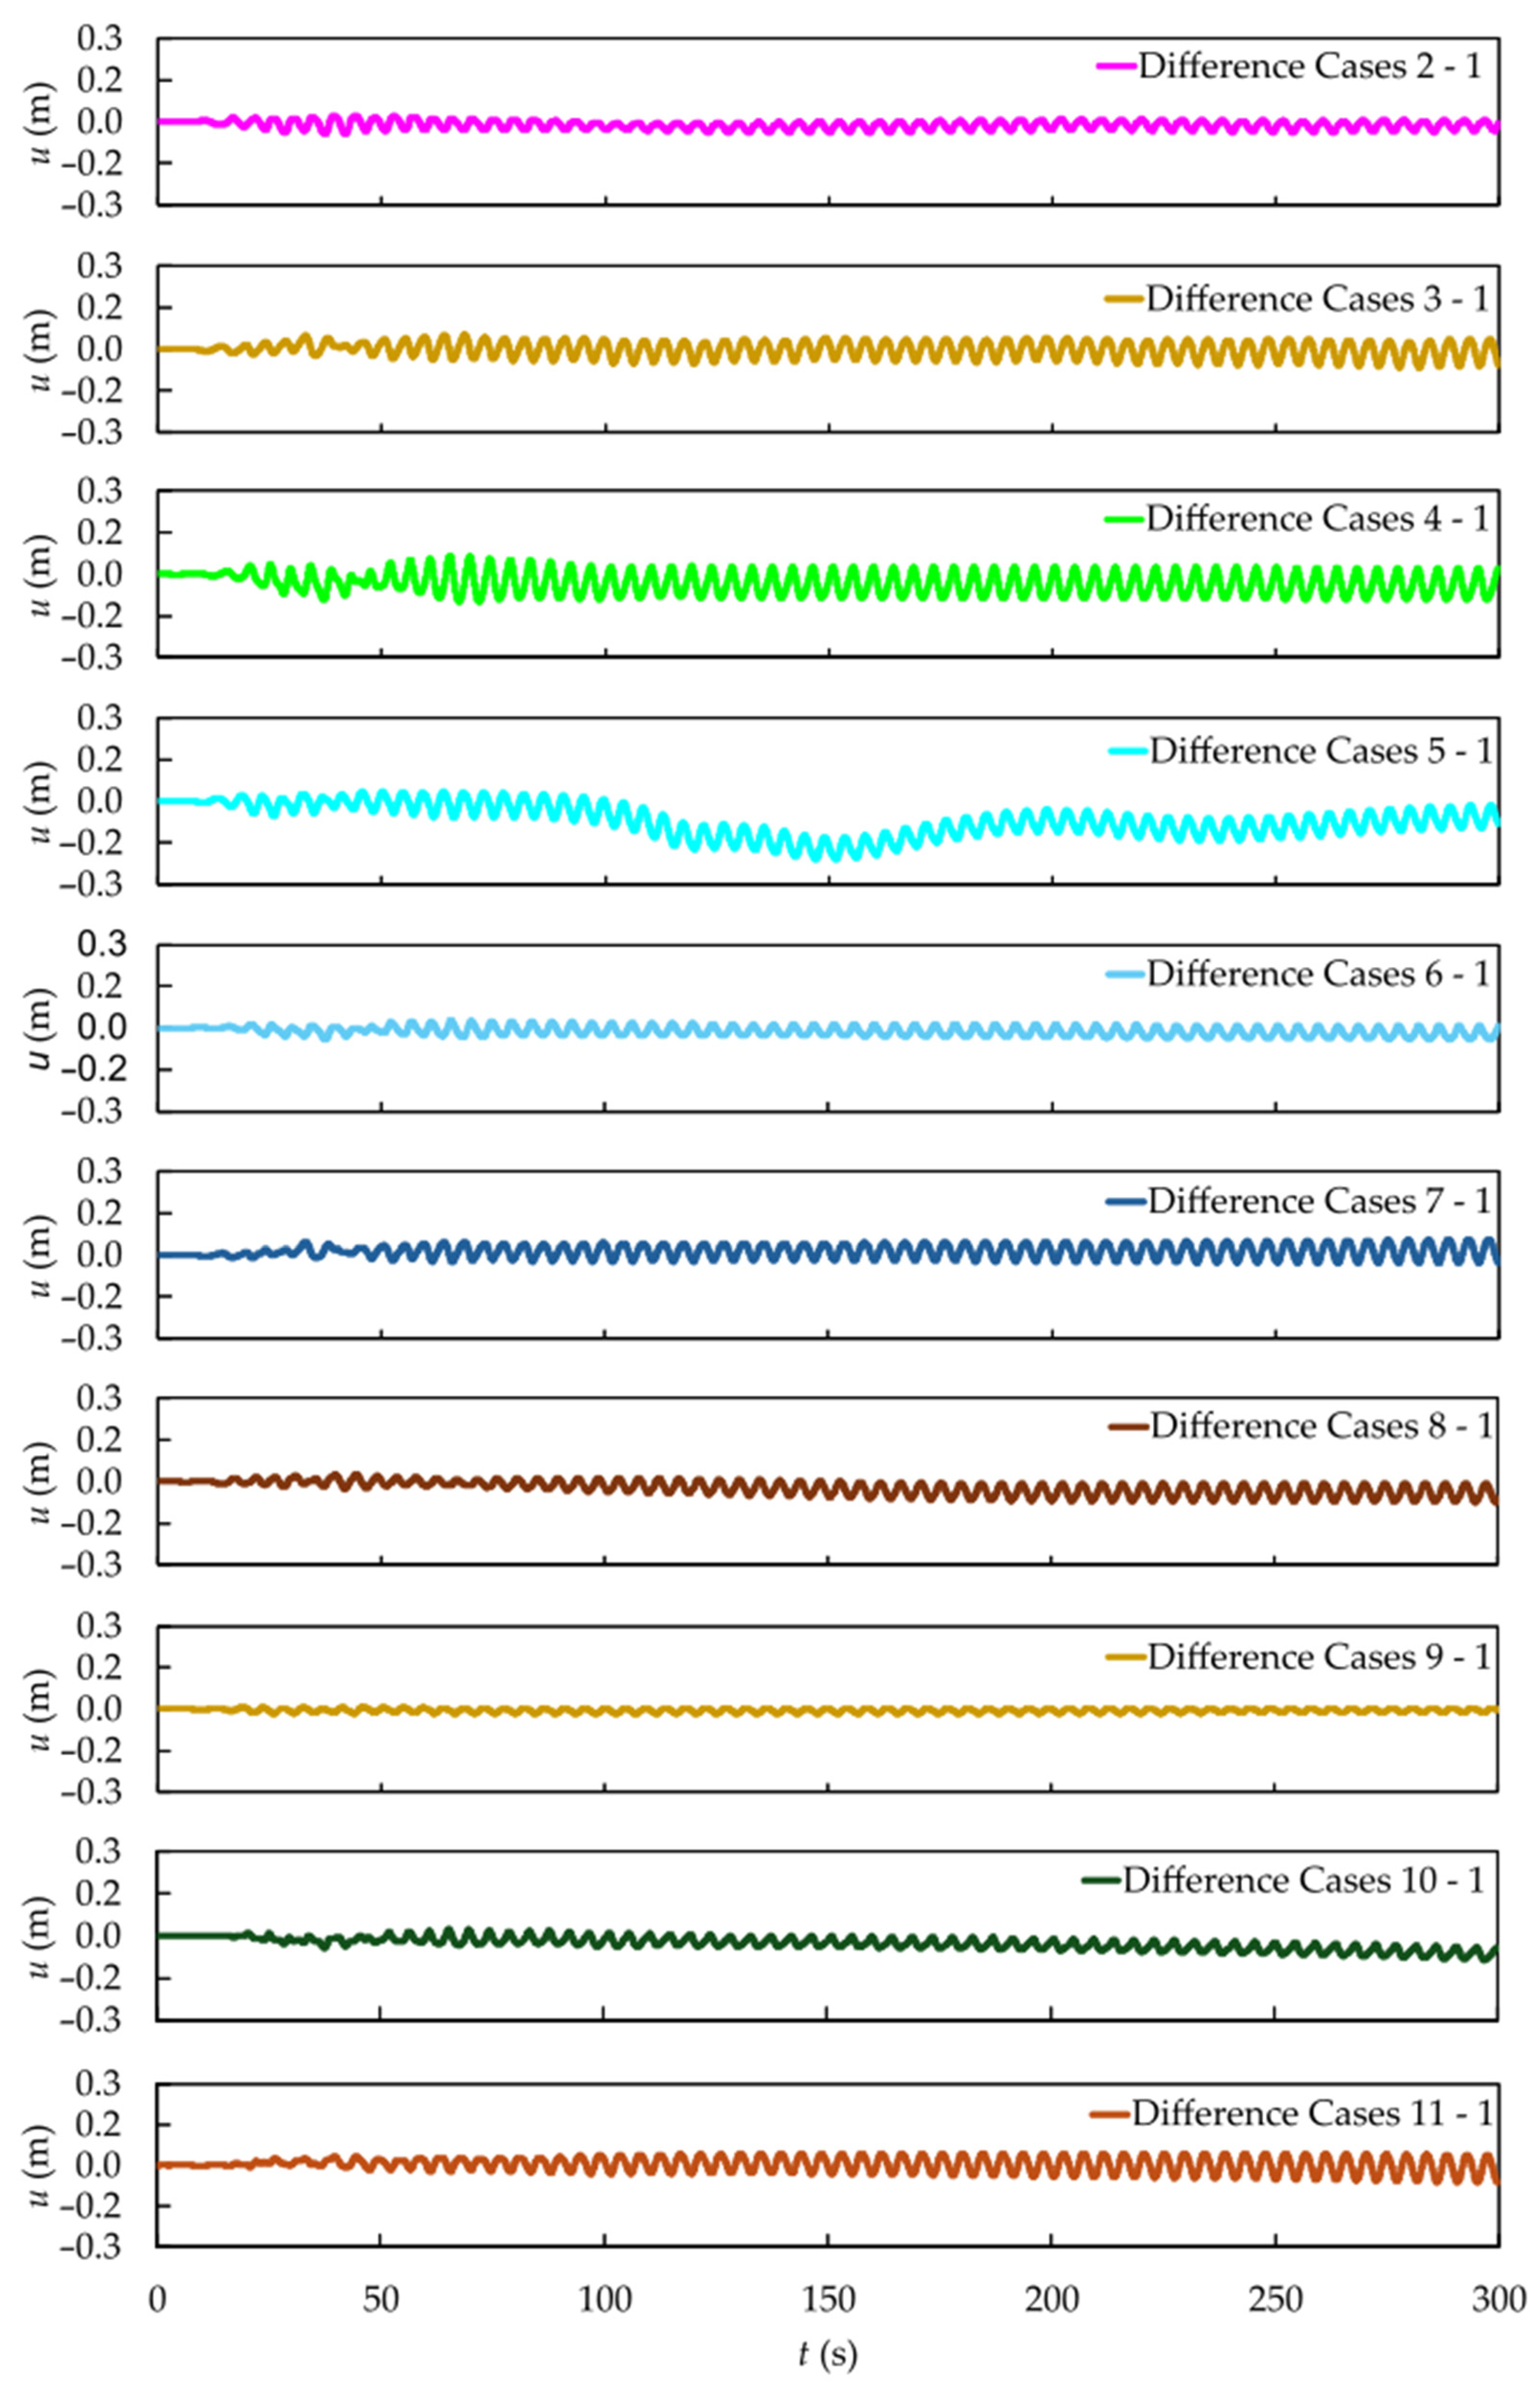
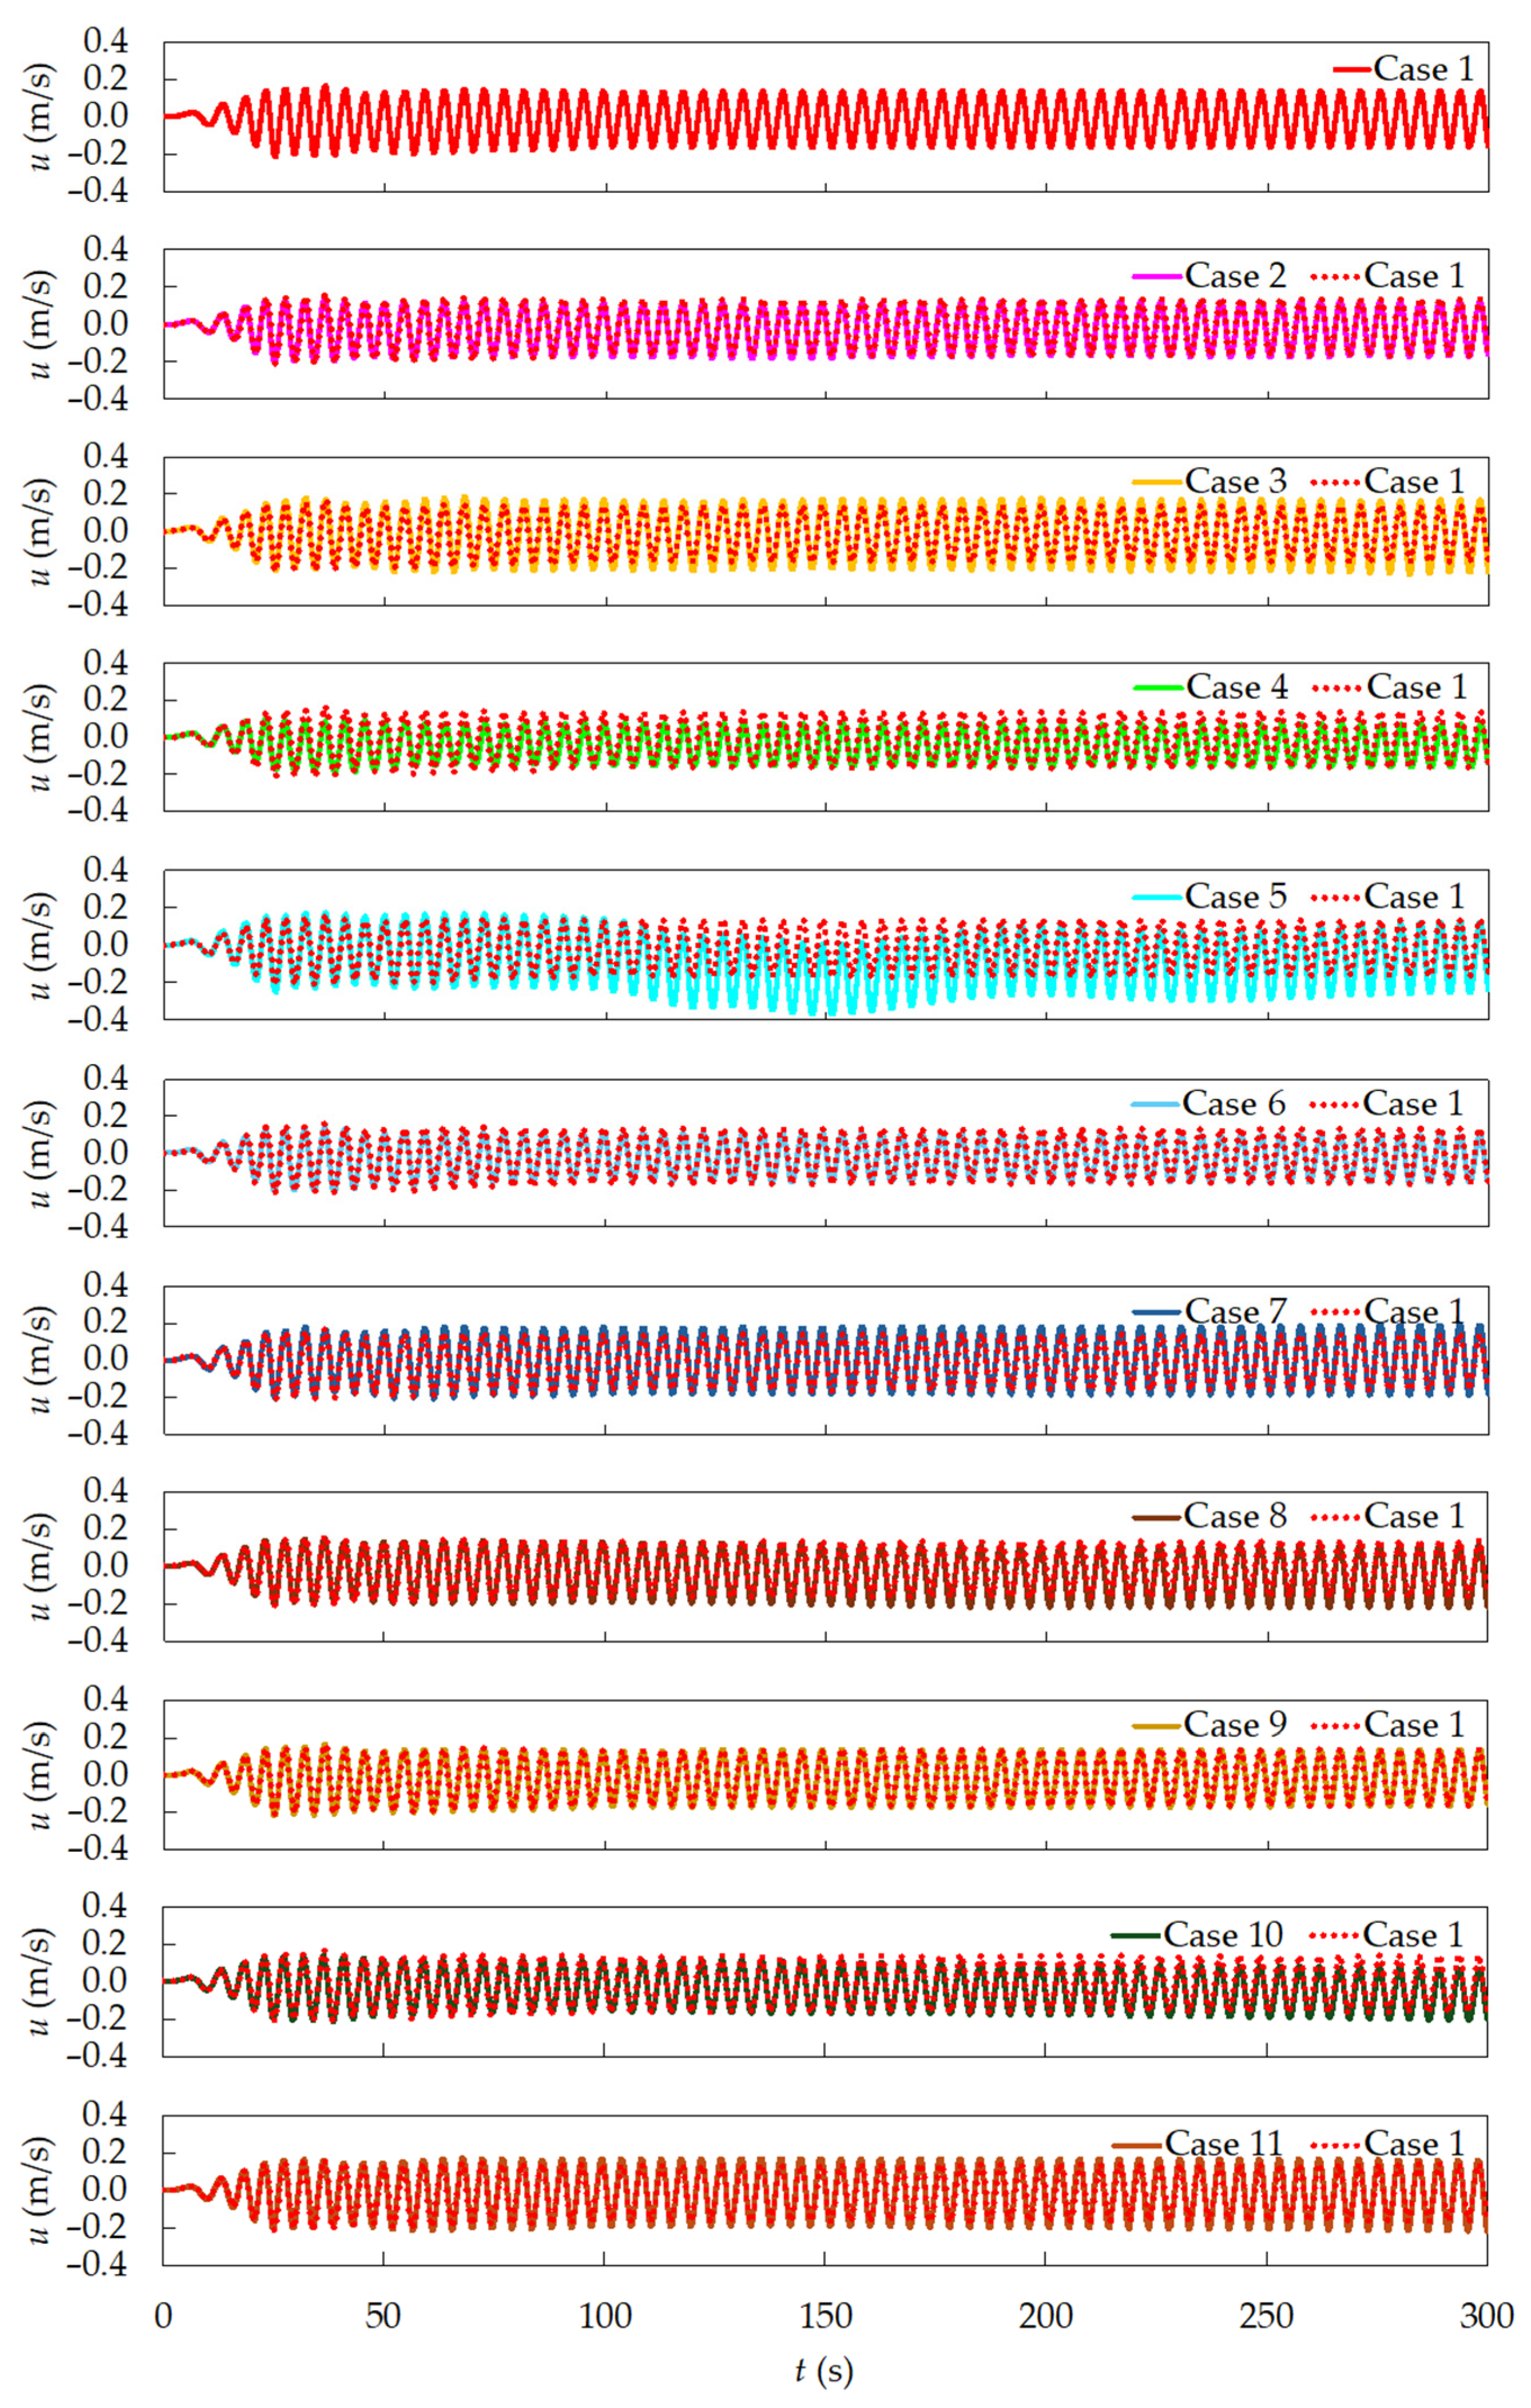
From 
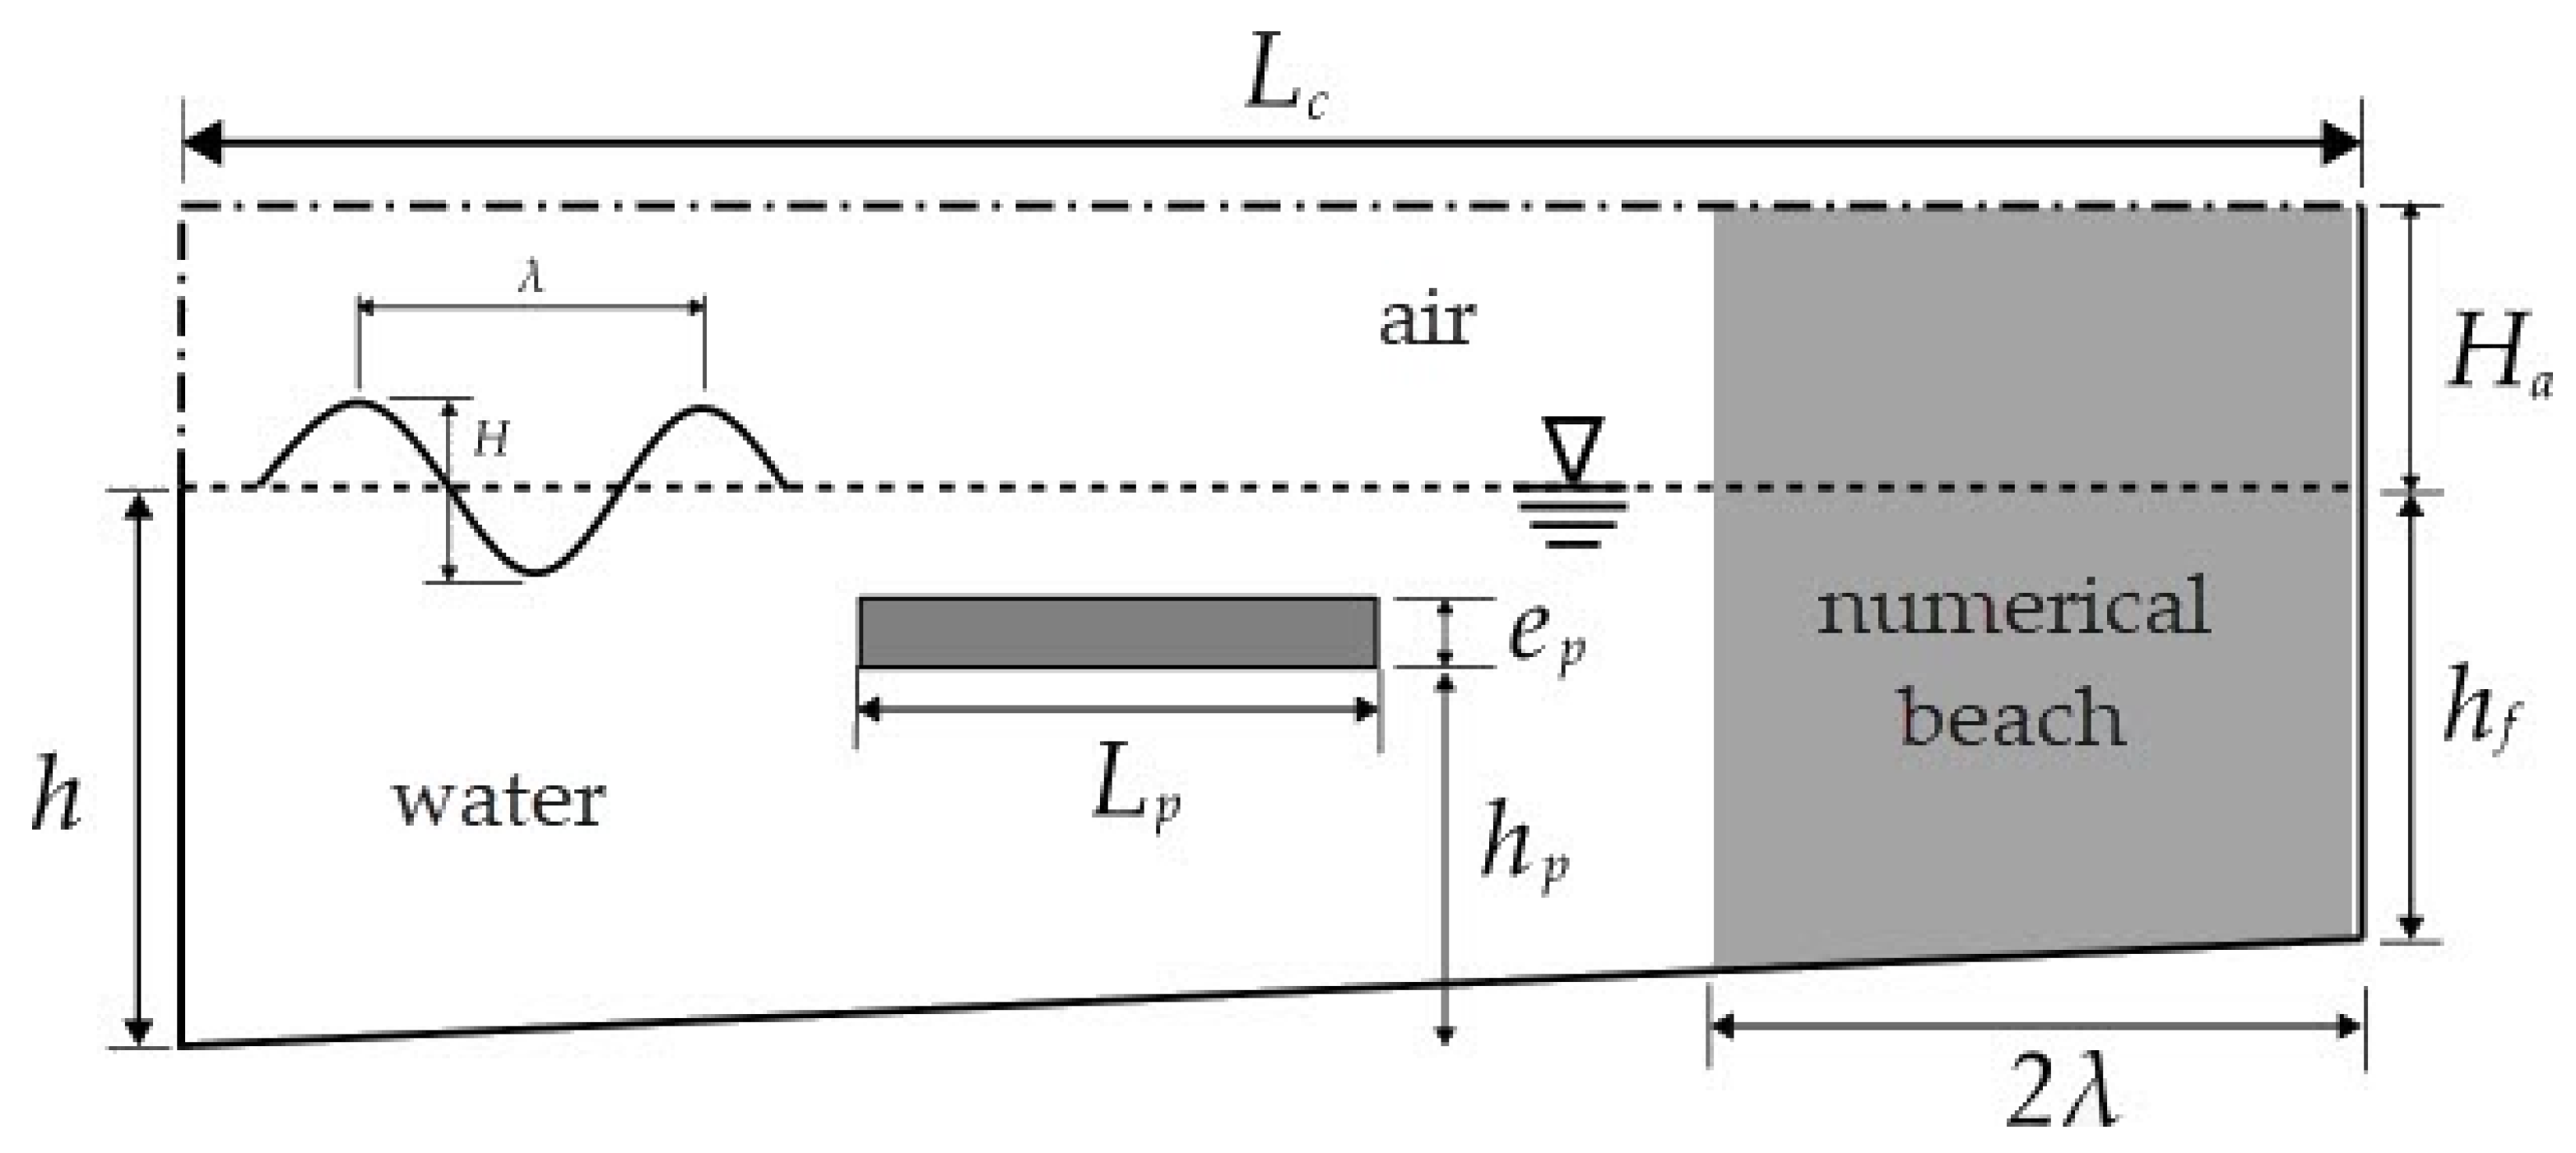
Figure 10, it is possible to observe a greater amplitude in the axial velocity of the inclined cases, primarily caused by the flow redirection due to the plate’s inclination from the region where the plate is inserted (hp) toward the zone of interest (hp/2), where the probe is placed.
Additionally, Case 5 (see Figure 10) exhibited an oscillation in its variation axis, with negative values occurring between 100 and 200 s. This behavior can be explained by the 30° clockwise inclination adopted for this geometric configuration, which tends to redirect part of the aforementioned flow toward a region downstream of the numerical probe 3.
Although Figure 8, Figure 9 and Figure 10 provide a good qualitative understanding of how the SP’s performance varies with inclination, this analysis still lacks clearer comparison parameters to better understand the influence of the plate’s geometric configurations on its hydrodynamic behavior, i.e., a quantitative evaluation. This justifies the use of a mathematical method proposed, see Equation (13), to obtain direct values that relate the efficiency of the investigated inclined cases to that of the reference case.
Therefore, a quantitative evaluation is fundamental for a more accurate assessment. Accordingly, Table 5 presents the integrals Iηd, Iηu, and Iu, calculated from the curves in Figure 8, Figure 9 and Figure 10. It also includes the ratios of these values, indicating how much more or less efficient each configuration was as a BW and as a WEC device, and how much energy the specific case has attenuated.
By using the integral ratios Iηd1/Iηdi in Table 5, the comparison of the results with Case 1 becomes simpler, more precise, and more direct. As it was already observed qualitatively, all inclined cases under regular wave conditions performed worse as BW devices compared to the reference, with ratios lower than 1. Case 11 shows 45.9% lower efficiency, and Case 5 shows 42.63% lower efficiency.
However, this relative efficiency does not take into account that the incident wave at the upstream probe (Iηui) had a greater magnitude. By analyzing the ratio Iηui/Iηdi, it becomes clear that the relative lower efficiency of the regular wave cases as BW devices does not necessarily indicate failure to perform this functionality, but rather that the incoming wave energy was higher. This ratio shows that, despite being less efficient than Case 1, all SP configurations under regular waves were still able to effectively reduce wave energy along the domain. Notably, Case 6 even achieved a slightly greater wave energy reduction than Case 1, highlighting its potential as an effective BW configuration under the tested conditions.
Apart from that, considering the ratios Iui/Iu1 in Table 5, several configurations (Cases 3, 5, 7, 8, 9, and 11) demonstrated relatively superior performance as WEC devices, with Case 3 achieving 23.16% higher efficiency and Case 5 reaching an increase of 41.48% compared to the horizontal SP reference. These findings quantitatively support the idea that plate inclination can enhance the WEC function, even though it compromises BW performance under the tested conditions.
Furthermore, a trend was observed in the results, where cases with clockwise inclination (Cases 3, 5, 7, 9, and 11) tend to exhibit superior performance as WEC devices. This behavior is directly influenced by the redirection of the flow passing by the plate toward the region where the probe is located, as previously mentioned.
After that, although the ratio Iηui/Iηdi yields a more direct value for evaluating each case’s efficiency as a BW, the variation in Iηui values indicates that the device’s presence is also affecting this upstream reference. Therefore, in order to perform a comparison using a reference unaffected by the SP’s presence, an additional case without the SP (Case wSP) was simulated, and the downstream probe was monitored for comparison as a BW.
The downstream integral with regular wave generation for the case without the plate (IηdwSP) was calculated, yielding a value of 77.7410 m·s. This value represents the area under the downstream probe curve without interference from the SP, allowing each case’s integral to be compared against it to assess the actual and direct impact of each SP configuration on the downstream probe. These results are presented in Table 6, where the expression (1 − Iηi/IηwSP)·100 indicates the percentage by which the downstream probe area was reduced due to the insertion of the SP, thus providing a direct measure of the device’s efficiency as a BW.
From the analysis of Table 6, it is possible to observe that Case 1 performed the best as a BW under regular wave conditions, reducing the area at the downstream probe by 58.84%. Nevertheless, all inclined cases contributed to the reduction in this area, with Case 6 achieving a 53.96% reduction and Case 9, a 51.94% reduction. It is also evident that Case 11 was indeed the least effective, with only a 23.92% reduction.
Finally, one can note that the results obtained in the present work due to the incidence of the representative regular waves are consistent with recent findings by [49], who investigated the hydrodynamic behavior of inclined plates under regular wave action. Their study revealed that resonance phenomena associated with fluid wedges above inclined plates induce significant hydrodynamic loads, particularly at low inclination angles, where Helmholtz-like resonance tends to occur. This mechanism helps explain the lower BW efficiency observed in some inclined configurations, as such resonance can amplify local surface elevations and reduce the damping effect of the plate. On the other hand, as the inclination increases, the interaction between the wave and the device geometry likely promotes flow acceleration and vortex shedding beneath the SP, increasing axial velocity fluctuations and favoring energy conversion. This trade-off aligns with the trends observed here, where WEC performance improves with inclination, while BW efficiency decreases. These findings emphasize the relevance of geometric features, such as inclination angle and rotation direction, in shaping wave–structure interactions through mechanisms like partial reflection, nonlinear flow separation, and flow redirection.

3.4. Analysis of Cases 1–11 Under Realistic Irregular Wave Incidence

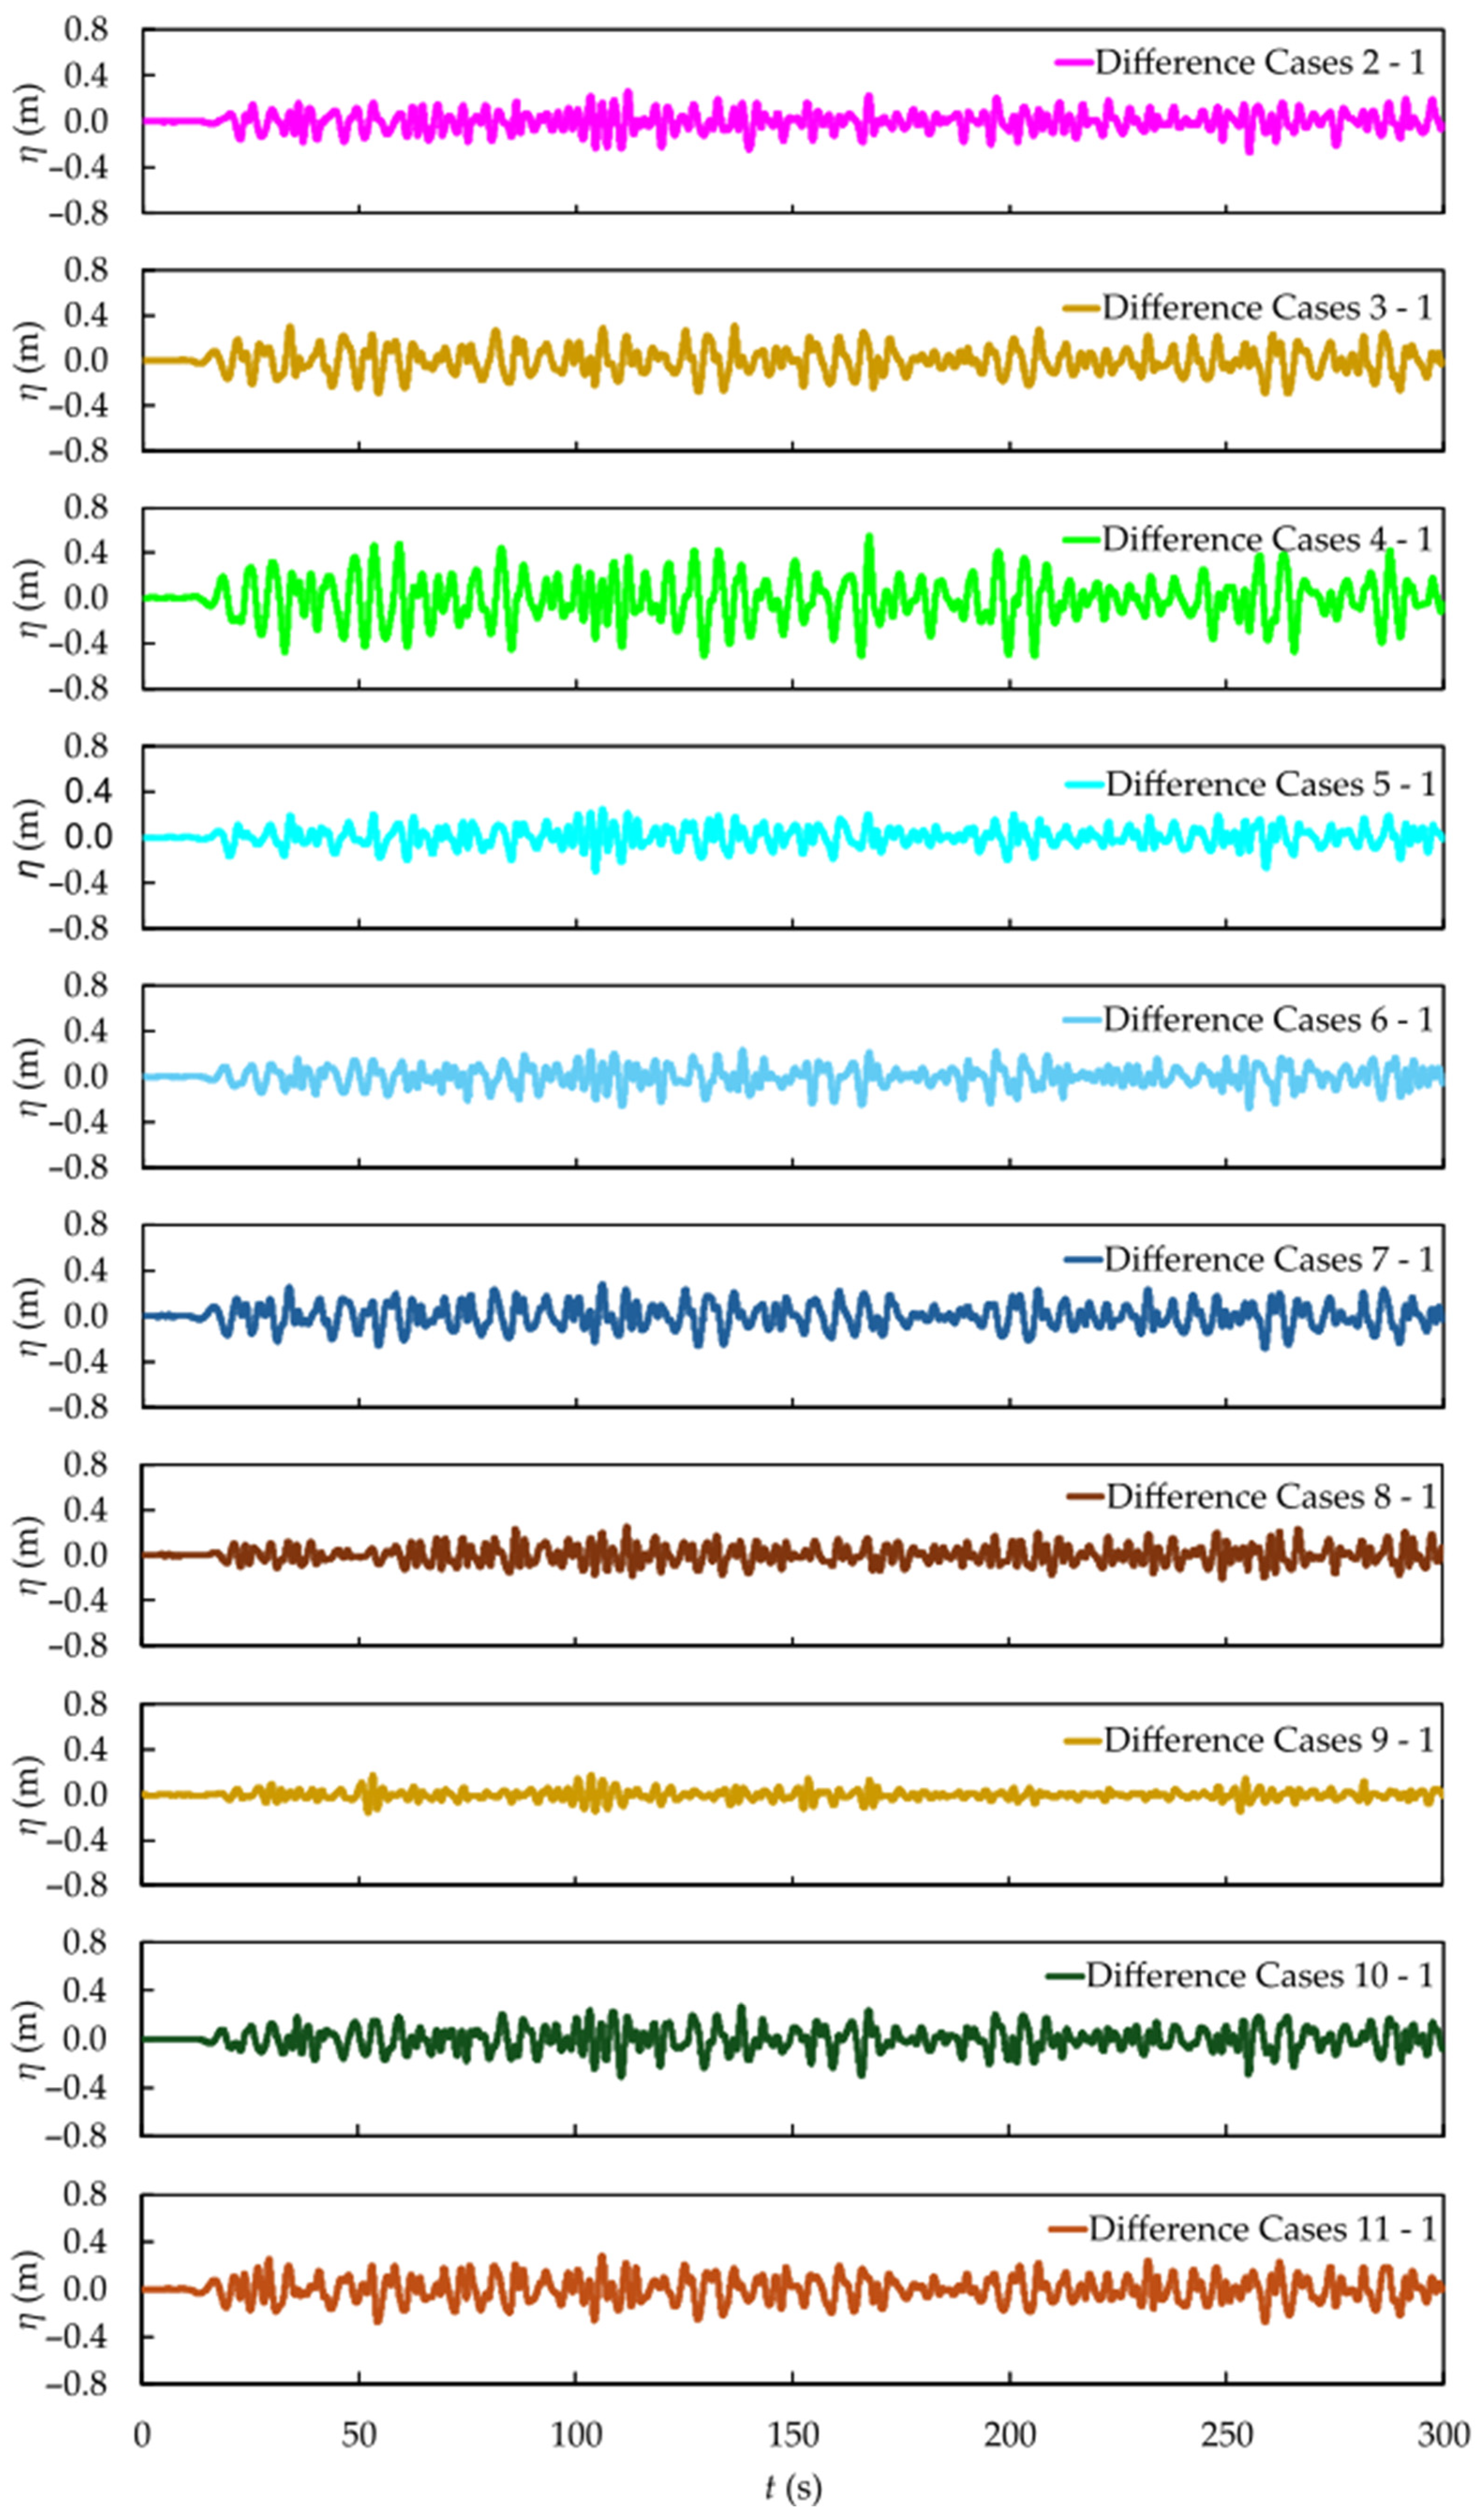
Following the same approach used for the representative regular wave results, Figure 11, Figure 12 and Figure 13 present the downstream free surface elevation of the SP, upstream free surface elevation of the SP, and axial water flow velocity beneath the SP, respectively, for Cases 2 to 11, with Case 1 used as the reference.
Additionally, the data from Figure 11, Figure 12 and Figure 13 enabled the detailed plotting of the difference curves, which are shown in Figure A5, Figure A6 and Figure A7 of Appendix A, respectively.
It is noticeable in Figure 11 that, similar to the regular waves, the inclinations in each case caused different wave reflections on the plate under the upstream probe. As mentioned in the previous section, these variations are not so significant for the main objective of this study. However, it is important to present the hydrodynamic behavior that occurred. Furthermore, the focus remains on assessing the effects of inclination on the downstream free surface elevation and axial velocity, which are directly related to the device’s performance as a BW and WEC.
Figure 12 indicates that although the realistic sea behavior makes qualitative comparison through the graphs more challenging, it is still possible to observe that the inclined cases remain relatively less efficient as BWs, showing higher free surface elevation amplitudes than the reference case (Case 1). This trend suggests that, in a general way, under the irregular wave conditions tested in this study and for the specific plate geometry analyzed, the inclined configurations tend to be less effective in attenuating wave energy in the downstream region when compared to the SHP reference case.
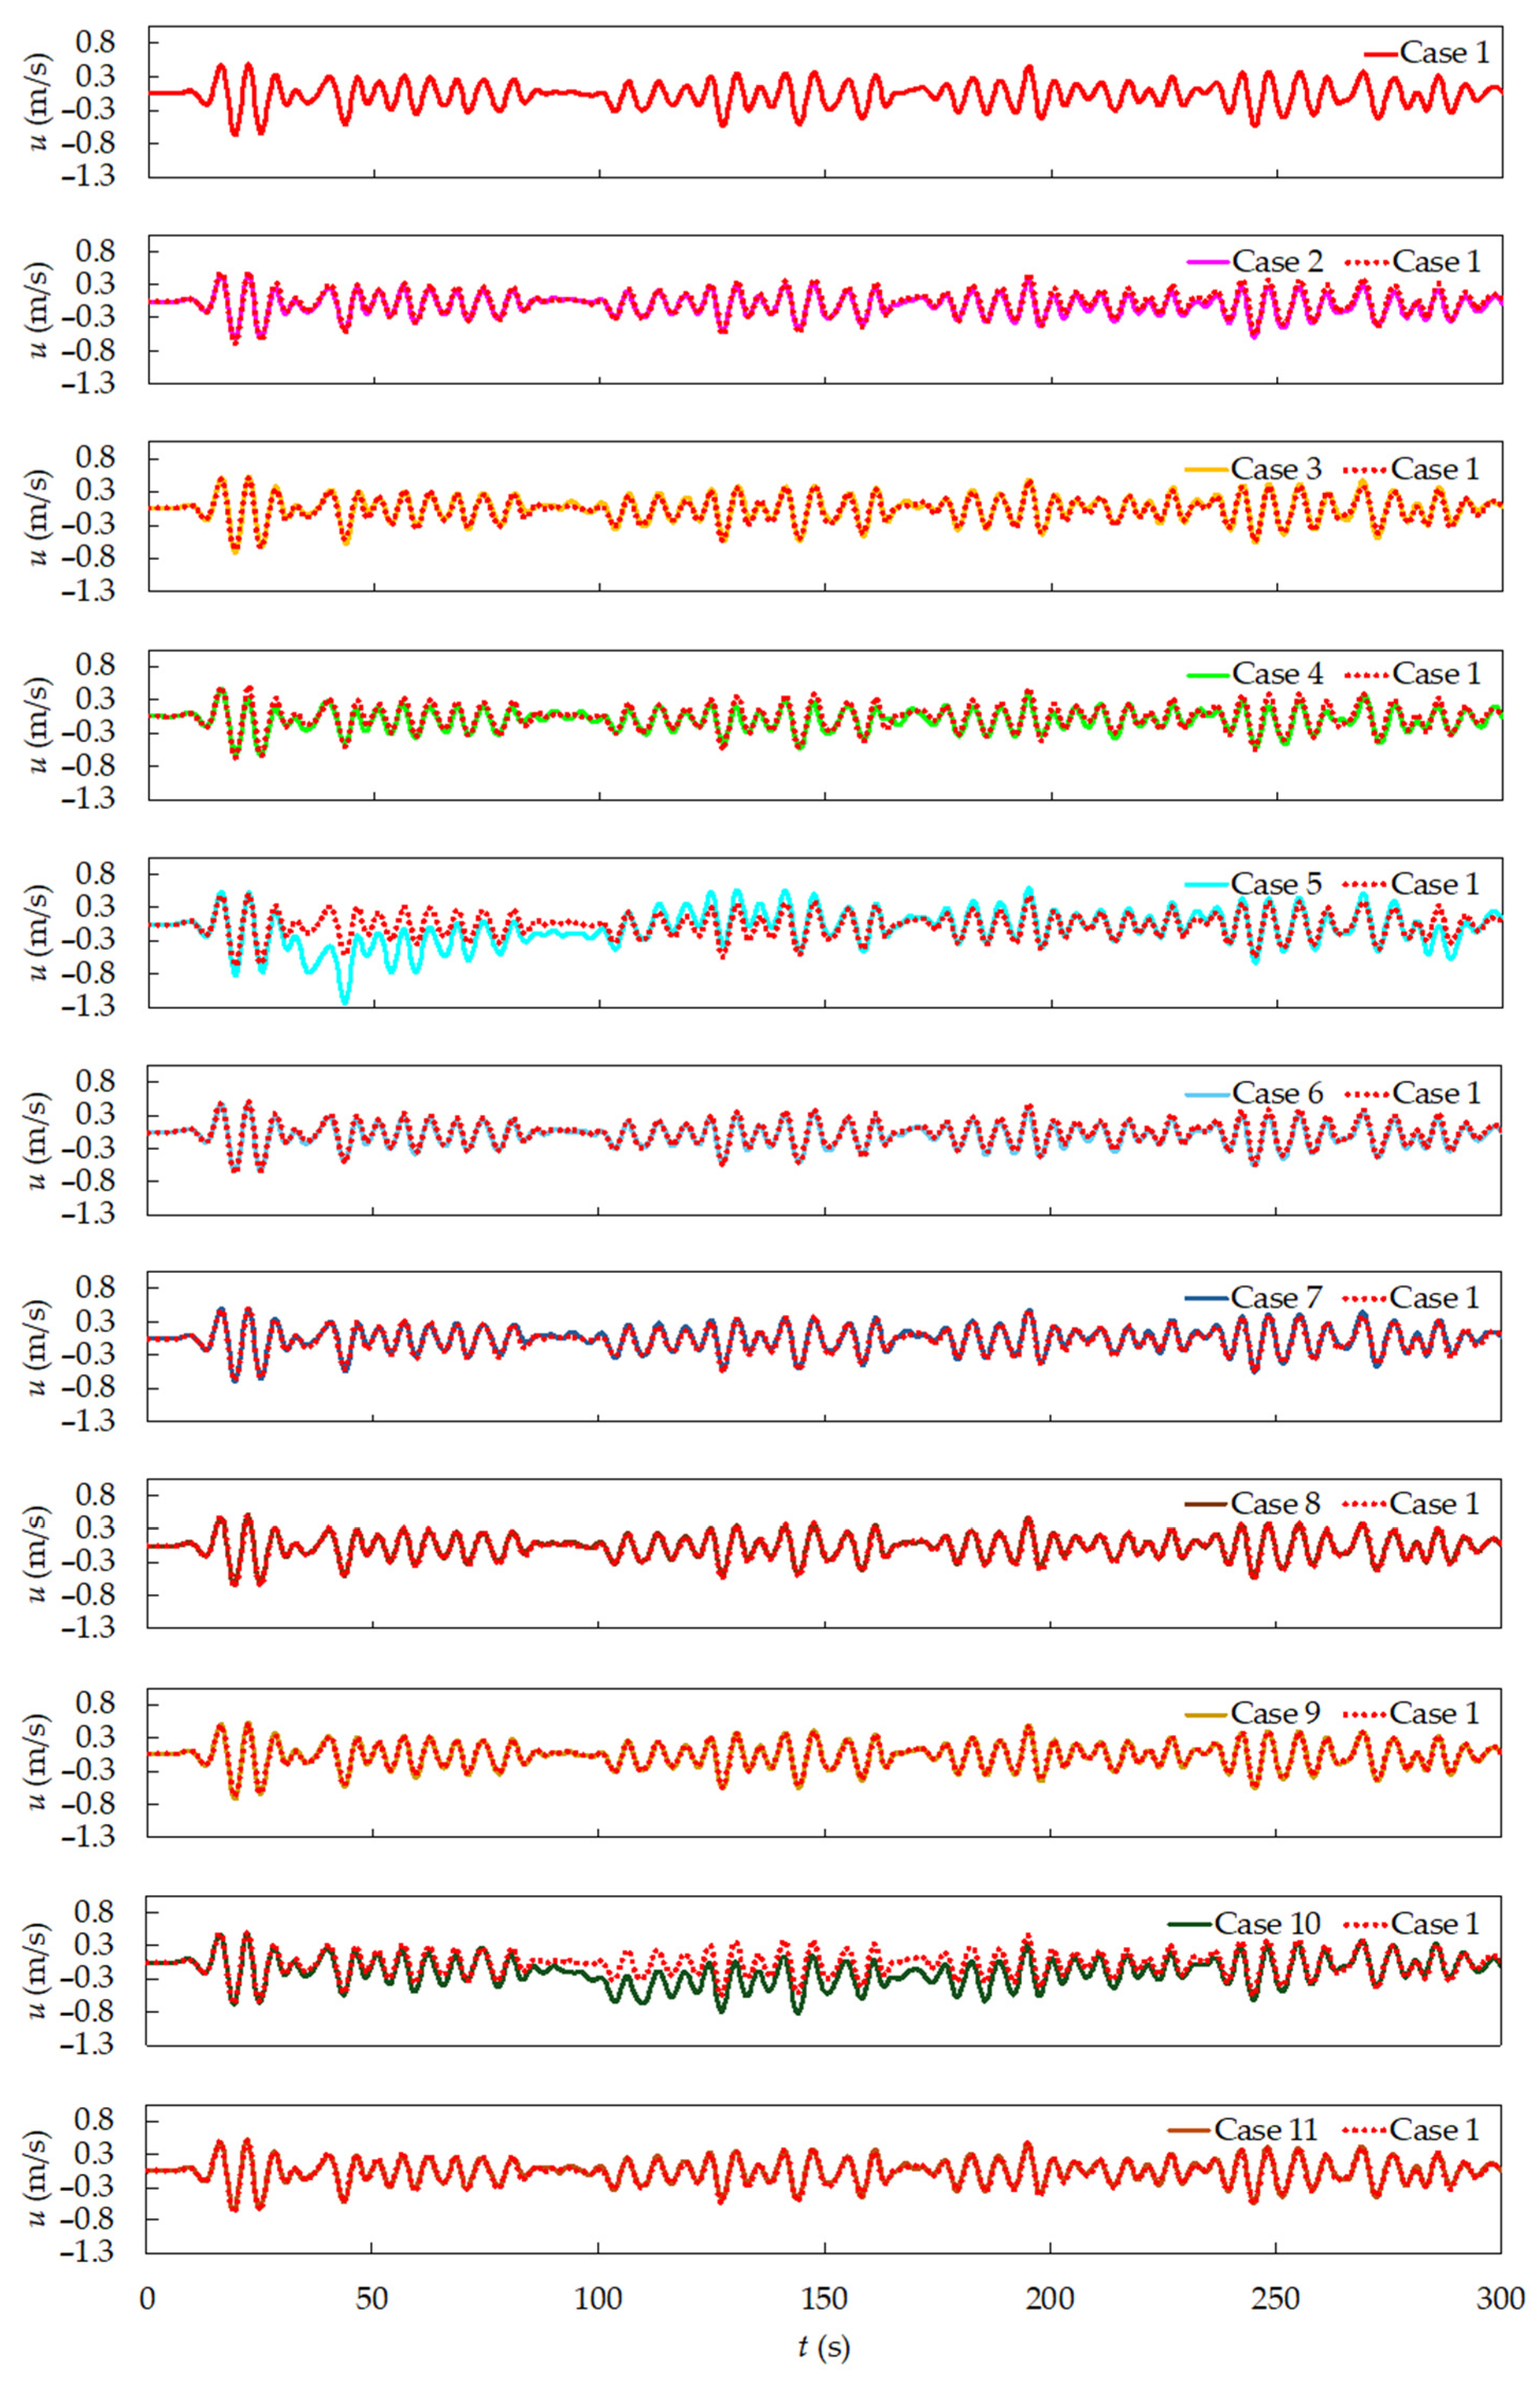
From Figure 13, some cases exhibit a clearer superiority as a WEC under irregular wave conditions, particularly Cases 5 and 10. However, several other cases also demonstrate improved performance compared to the reference, indicating that the inclination of the plate can enhance the device’s ability to extract the wave energy. This suggests that, when properly configured, the geometric modification of the SP not only influences the flow dynamics but can also significantly contribute to improving its performance as a WEC across different wave conditions.
Furthermore, the shift in the oscillation axis of axial velocity was also observed in the irregular wave generation study for Cases 5 and 10 (see Figure 13). In Case 5, this behavior occurred for the same reason previously mentioned when the representative regular waves were considered (see Figure 10), i.e., due to the clockwise inclination that redirects part of the flow. While in Case 10, the shift was mainly caused by the promotion of flow recirculation induced by the plate’s geometry (see Figure 1).
As performed in the analysis of the representative regular waves, a quantification of the magnitude of the surface elevation downstream and upstream of the SP and of the axial water flow velocity beneath the SP was performed in Table 6, allowing the comparison of inclined cases with the reference case and an estimate of wave attenuation considering the upstream and downstream irregular wave magnitudes.
Table 7 indicates by the ratios Iηd1/Iηdi that although most cases showed reduced relative efficiency as BW devices when inclined, Case 3 demonstrated a 5.13% higher efficiency than Case 1. This highlights the importance of understanding the realistic sea behavior in the region where the SP will be deployed. Under regular wave conditions, the same case showed a 36.24% lower efficiency as a BW (see Table 5) in comparison to Case 1, emphasizing the limitations of relying solely on idealized wave generation.
Considering also the incident waves measured at the upstream probe, from ratios Iηui/Iηdi from Table 7 it is evident that the inclined configurations are still capable of acting as effective breakwaters under irregular wave conditions, attenuating a significant portion of the incoming wave energy. Corroborating the previous analysis, Case 3 stands out with superior performance compared to the other cases.
Still taking into account Table 7 and analyzing Iui/Iu1, for WEC performance, the previously observed trend in the regular wave study (see Table 5) is reinforced: the cases with clockwise inclination (3, 5, 7, and 9) achieved higher relative efficiency. Among them, Case 5 stood out, showing 50.14% greater efficiency compared to Case 1, mainly due to the shift in the axis of velocity variation.
To identify whether this result was solely due to the shift in the velocity variation axis, Iu1 and Iu5 were recalculated by disregarding the simulation time before 120 s for both cases. The resulting values were 27.2121 m for Iu1 and 33.1134 m for Iu5, yielding an integral ratio of 1.2169. In other words, even after removing the time interval in which the axis shift occurred, Case 5 remains 21.69% relatively more efficient as a WEC.
Moreover, this study used an extra case without the SP was also carried out for the incidence of realistic irregular waves, applying the expression (1 − Iηdi/IηwSP)·100 to calculate the percentage reduction in the downstream area for each case. The calculated value for IηwSP in this scenario was 75.2588 m·s.
From the analysis of Table 8, it can be observed that Case 3 was the most effective, achieving a 30.84% reduction in the downstream area, while Case 4 was the least effective, with only a 13.84% reduction. Nevertheless, all cases led to a reduction in this area and hence can be considered effective as BWs.
Alongside the integrals Iηd, Iηu, and Iu obtained from probes 1, 2, and 3 (see Table 7 and Table 8), the ParaView (version 5.13.3) software was employed to visualize the velocity field through vector representation along the wave flume at 40.23 s, 43.61 s, and 249.77 s (Figure 14, Figure 15 and 
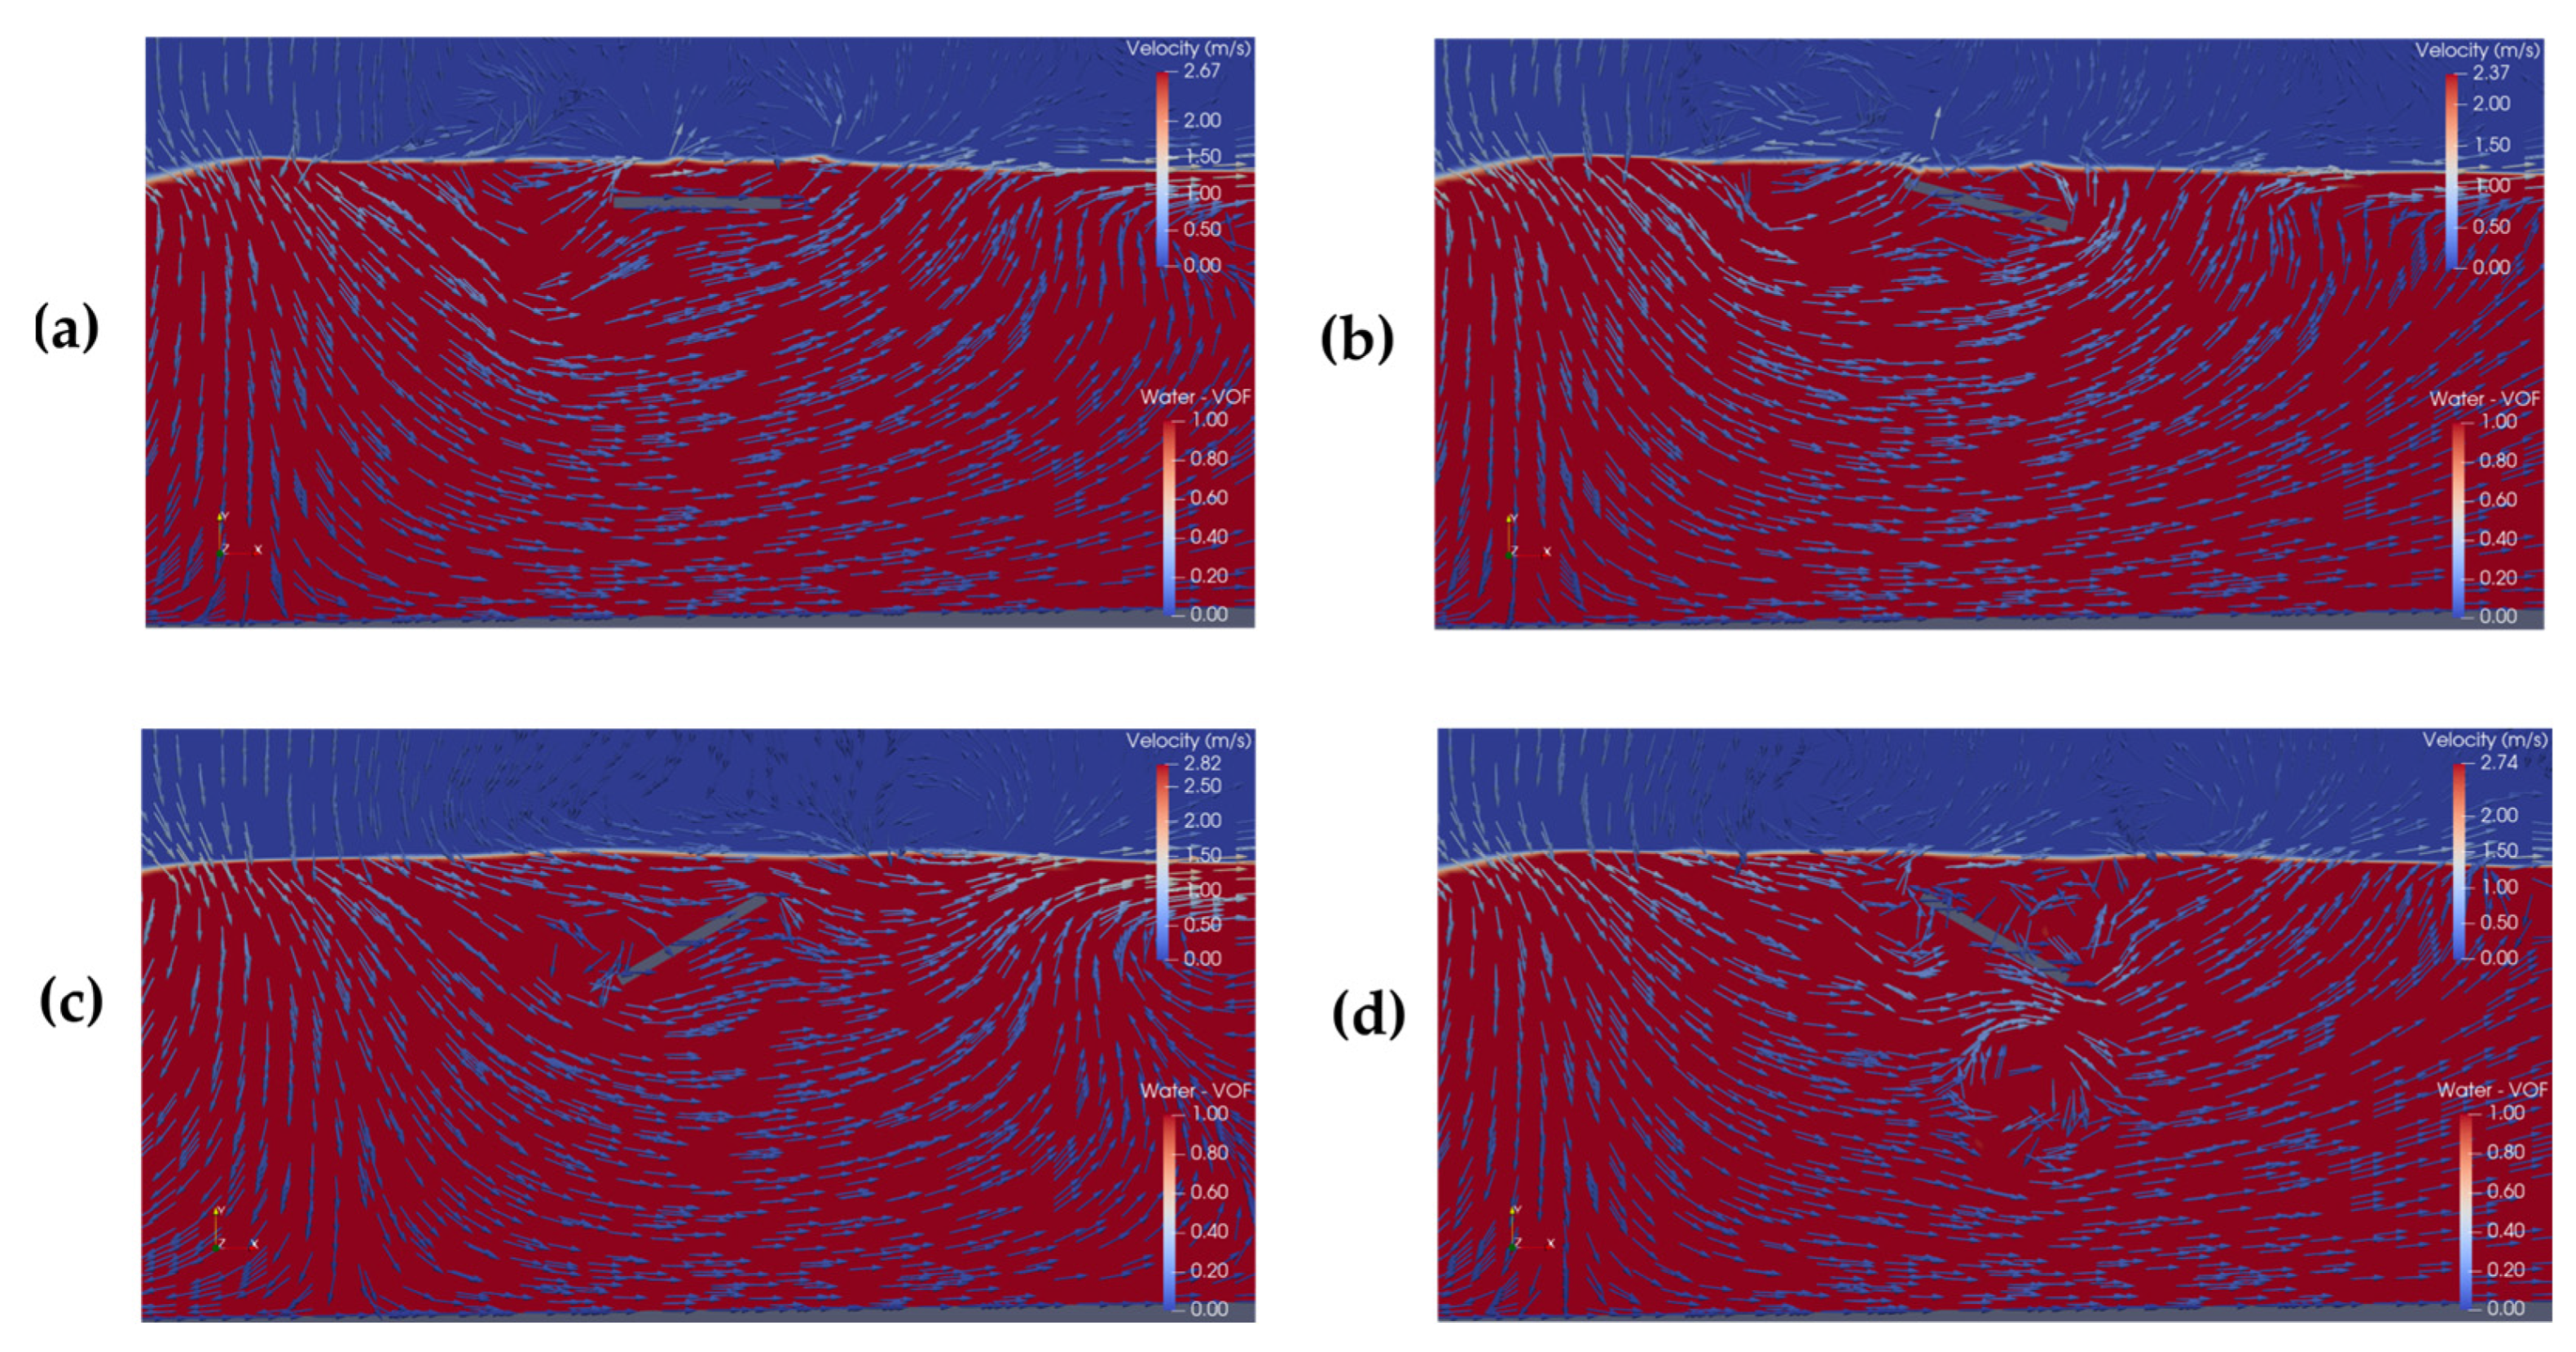
Figure 16, respectively), with red/blue indicating water/air phases. These specific time instants were selected to provide insight into the hydrodynamic behavior of each selected SP case throughout the numerical simulation. The analyzed cases include Case 1 (the SHP, adopted as reference), Case 3 (the one with the best BW), Case 4 (the one with the worst BW and WEC), and Case 5 (the one with the best WEC). The time 40.23 s was chosen because it corresponds to a wave crest in all cases, although Case 5 is still on the negative axis. The time 43.61 s was selected because it corresponds to the maximum axial velocity in Case 5, which is significantly higher than in the other cases, and all configurations are within a wave trough. Finally, the time 249.77 s was chosen to capture a transition from the positive to the negative axis, corresponding to the moment when the axial velocity crosses zero.
In Figure 14, a left-to-right flow is observed in all analyzed cases, which corresponds to a location closer to the wave crests in the simulation (see Figure 13). However, for Case 5, it is possible to understand the reason behind its negative axial velocity values at this same instant (see Figure 13). Due to the inclination of the SP (especially because the incident flow is deflected downward toward the region beneath the plate), a vortex forms near the probe location (hp/2). This vortex causes a downward shift in the axial velocity axis, resulting in the observed negative values that persisted over the time interval from 30 s to 115 s.
In contrast, part of the reason behind the low efficiency of Case 4 as a WEC can also be identified. The inclination of the SP in this case causes the incident flow to be deflected upward, directing it away from the probe region and reducing the interaction between the flow and the probe. Furthermore, this upward deflection of the flow also causes an increase in velocity at the free surface, which worsens the device’s performance as a BW.
Regarding the high efficiency of Case 3 as a BW, Figure 14 indicates that, although it shares the same flow deflection direction as Case 5, its plate is positioned higher in the domain. As a result, it was able to redirect part of the velocity present near the free surface downward, which effectively reduced the impact of the incident wave on the downstream probe, while also increasing the axial velocity at the probe located at hp/2.
Additionally, it was observed that Cases 4 and 5, being positioned lower in the computational domain compared to the other cases, exhibited less impact on wave attenuation due to their greater distance from the free surface.
As expected, no flow redirection phenomena are observed in Case 1. In this configuration, the hydrodynamic impact of the SP is primarily governed by the reflection and transmission of the incident waves by the flat plate. Since there is no inclination, the interaction with the flow occurs uniformly across the plate surface, without inducing significant vertical velocity components or vortex structures in the probe region.
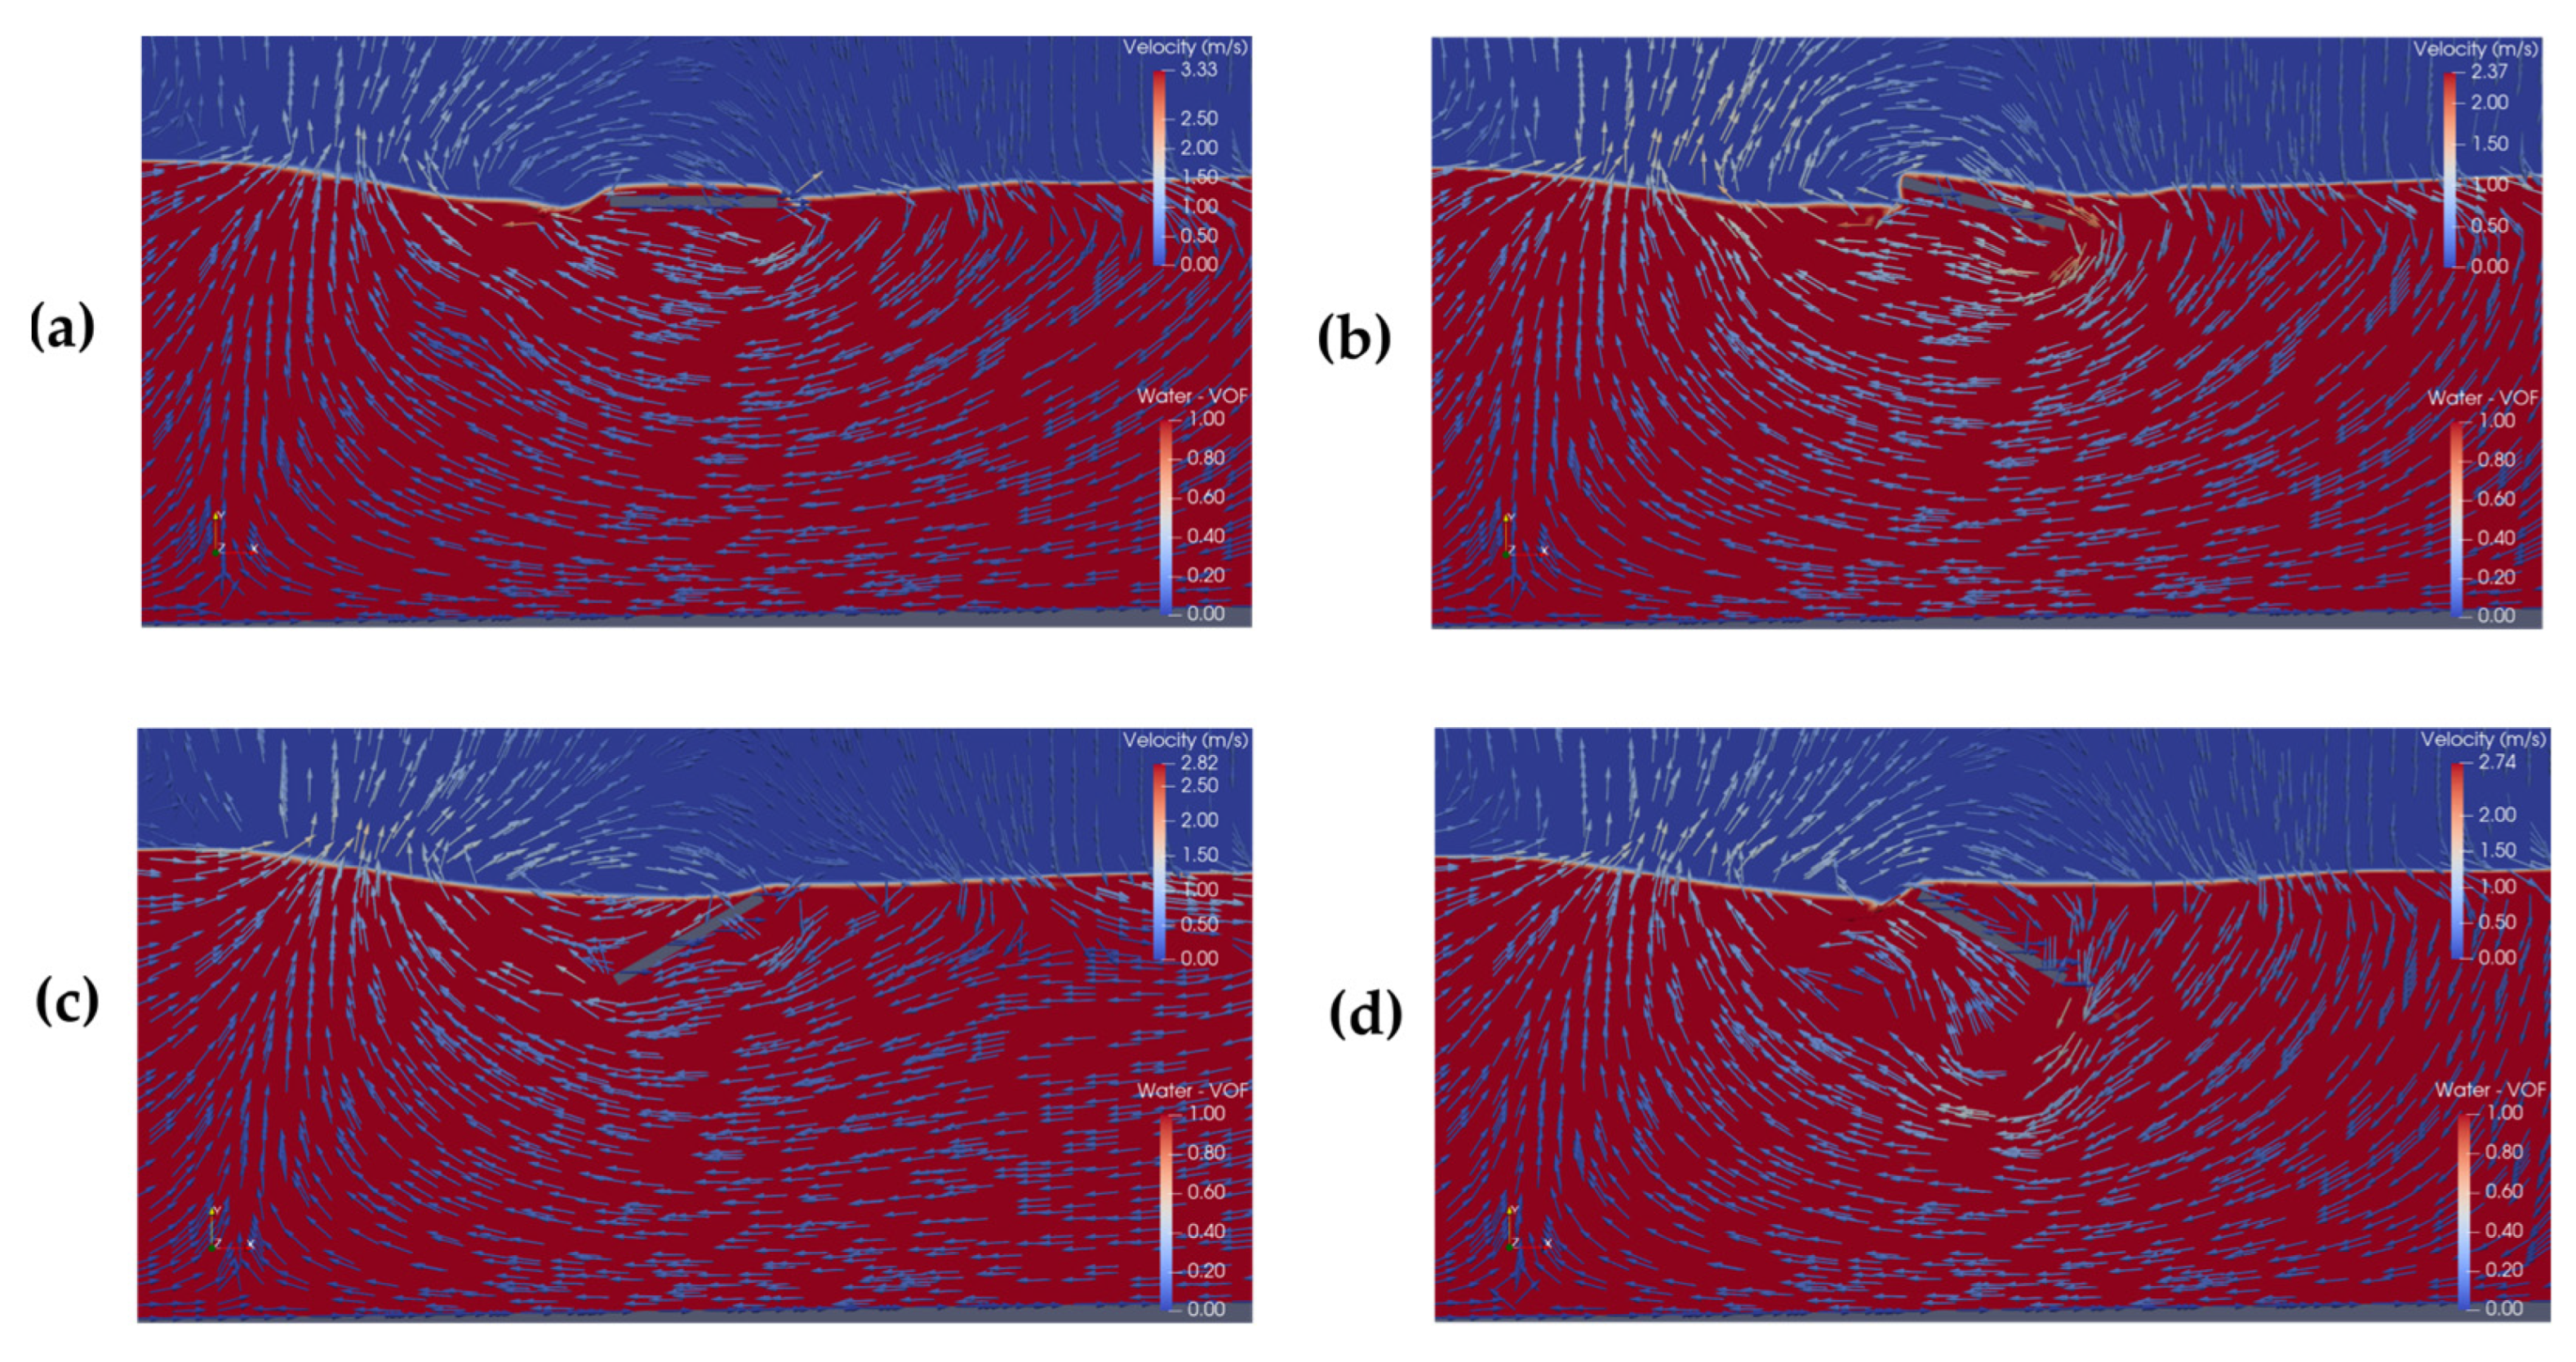
In Figure 15, the velocity field shows a right-to-left flow direction, corresponding to a moment closer to the wave troughs in the axial velocity plots (see Figure 13). In addition to the continued presence of the vortex beneath the SP, the superior performance of Case 5 as a WEC becomes even more evident. The velocity magnitude color scale highlights that the maximum velocity occurs precisely in the region where the probe is located, indicating that this configuration makes the most efficient use of the wave-induced flow in the channel.
In Case 4, although the flow direction at this instant would favor downward deflection beneath the SP, the flow is not redirected toward the probe region. Instead, it is diverted farther to the left within the channel. As a result, even though this geometric configuration has the potential to benefit from the negative direction of the axial velocity, such an effect is not observed. Consequently, Case 5 remains significantly more effective in terms of the WEC functionality of the SP.
The high efficiency of Case 3 as a BW is also more evident in Figure 15, with clear wave attenuation observed on the right side of the plate. Additionally, it presents a velocity field behavior very similar to that of Case 5, although with lower intensity, which can be attributed to its smaller clockwise inclination.
Furthermore, although greater wave attenuation for the cases at 43.61 s can be observed through the white line visualization in the free surface region (the water–air mixture zone), Case 4 is clearly the one causing the least impact on the incident waves interacting with the SP.
Case 1, which serves as the reference in this study, exhibits a favorable performance as a BW by attenuating the wave on both sides of the plate without reducing its resistance near the free surface, and without obstructing or disturbing the flow beneath the SP. As a result, it produces a reasonably well-distributed velocity field in the WEC probe region, although it does not stand out as one of the best-performing cases in terms of WEC efficiency.
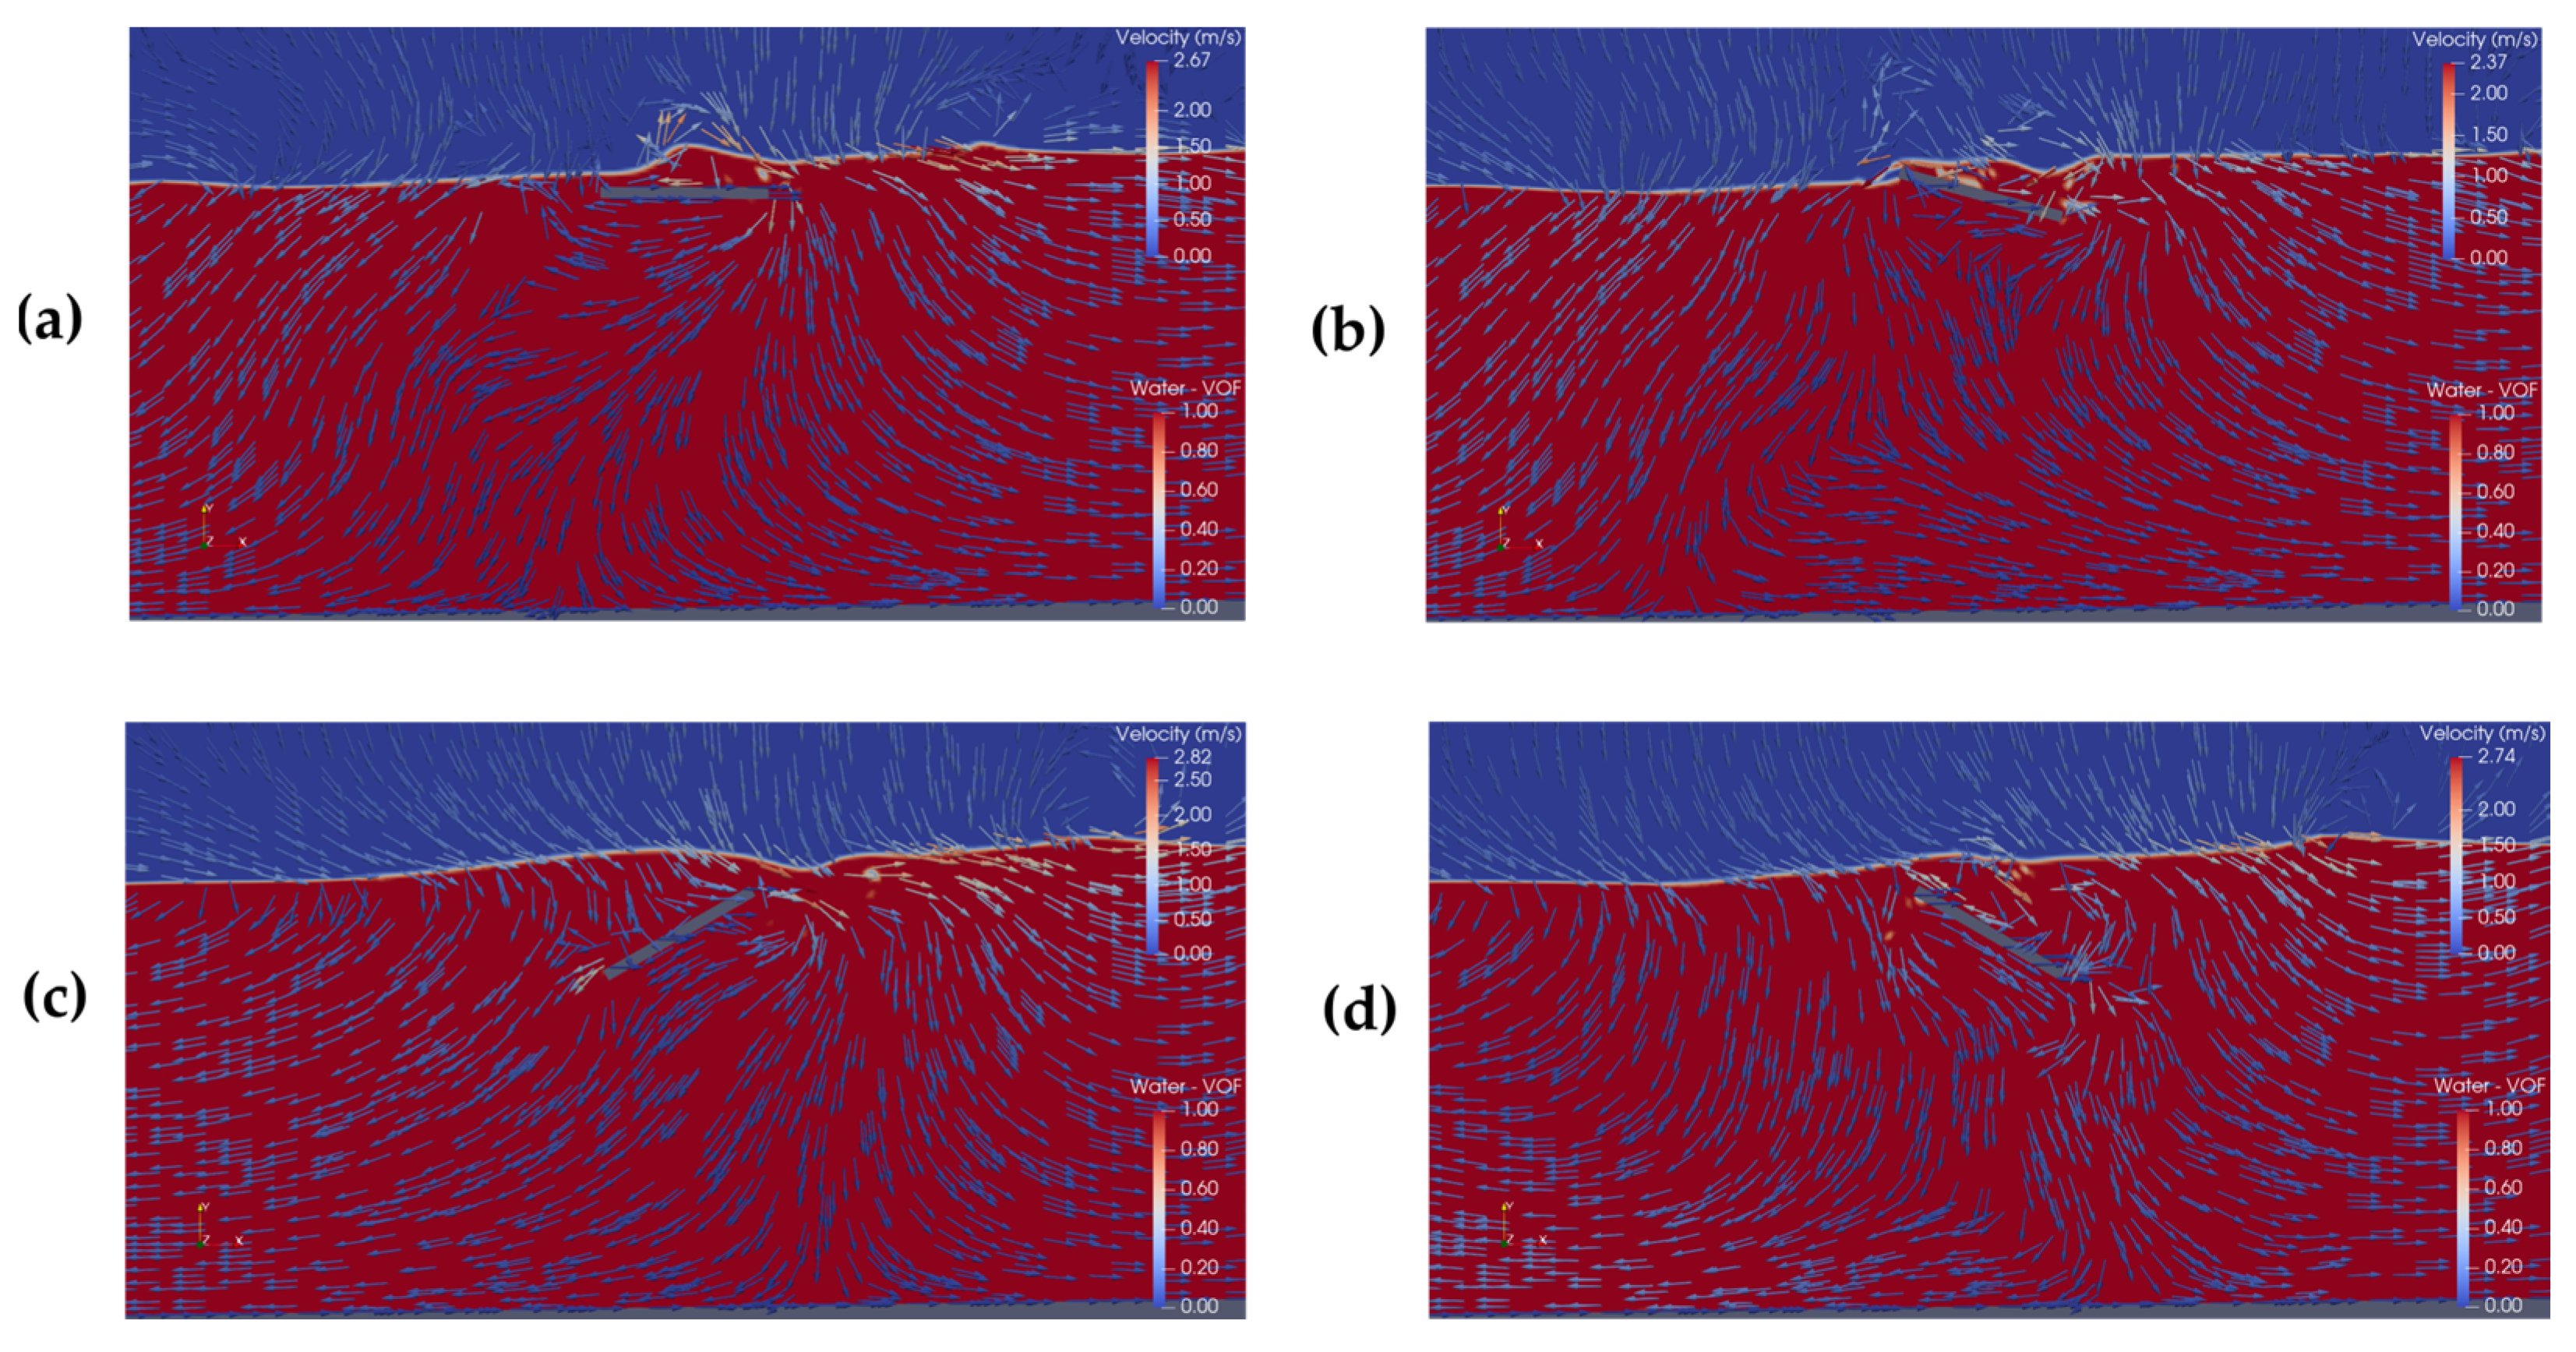
In Figure 16, the velocity field points downward, representing a transition period where axial velocity values in the SP region change from positive to negative. The velocity fields of the four analyzed cases exhibit similar behavior at this time, with the region above the SP showing zones of water–air mixing and higher velocities compared to other analyzed times. Additionally, the velocity measured at the WEC probe region is approximately 0 m/s at this time instant.
Apart from that, the greater effectiveness of Cases 1 and 3 as BWs becomes evident, as these cases show the strongest disturbances near the free surface. The waves undergo greater interaction with the plate, resulting in a higher proportion of energy dissipation.
Conversely, Cases 4 and 5, positioned lower in the computational domain, were unable to generate disturbances of comparable magnitude and therefore had less impact on the free surface, resulting in lower BW efficiency.

4. Conclusions

The results demonstrate that the geometric configuration of the SP, especially its inclination, significantly affects its hydrodynamic performance as both a BW and a WEC. Under representative regular wave conditions, inclined geometries tended to reduce BW efficiency compared to the reference case (SHP, Case 1), with reductions of up to 45.9%. However, several inclined configurations (notably Case 5) showed substantial gains as WECs, reaching improvements above 40%. Under realistic irregular waves, while most inclined cases still underperformed as BWs, exceptions like Case 3 achieved improved performance, highlighting the importance of considering realistic sea states.
Despite reduced BW efficiency in some cases, axial velocity magnitudes remained high beneath the SP, suggesting strong potential for energy harvesting. Additional analysis confirmed that all configurations were effective in attenuating wave energy to some extent. Moreover, a consistent trend was observed: clockwise-inclined plates performed better as WECs in both wave conditions.
In summary, the inclination of the SP is a critical design parameter. While certain inclinations may reduce its breakwater function, they can considerably enhance its energy conversion capability. The optimal configuration depends on the desired balance between wave attenuation and energy extraction.
Finally, this numerical study paves the way for further investigations. Future work could include the analysis of additional geometric parameters, such as plate length or thickness, and broader simulation conditions involving different sea states, longer wave records, or other locations. Such studies would contribute to a more complete understanding of how geometric and environmental factors influence the performance of the SP device. Moreover, future studies may also address aspects such as a more detailed energy-based analysis of the results, three-dimensional simulations, experimental validations, and assessments of structural and economic feasibility, including potential trade-offs between wave attenuation and energy extraction, as well as the environmental impacts associated with real-world applications.

Author Contributions

Conceptualization, V.E.M. and L.A.I.; methodology, V.E.M., G.Ü.T., M.d.S.P., E.D.d.S., B.N.M. and L.A.I.; software, V.E.M., G.Ü.T., M.d.S.P. and R.A.A.C.G.; validation, V.E.M., G.Ü.T. and M.d.S.P.; formal analysis, L.A.O.R., E.D.d.S., B.N.M. and L.A.I.; investigation, V.E.M., G.Ü.T., M.d.S.P., R.A.A.C.G., L.A.O.R., E.D.d.S., B.N.M. and L.A.I.; resources, L.A.O.R., E.D.d.S., B.N.M. and L.A.I.; data curation, V.E.M., G.Ü.T., M.d.S.P., R.A.A.C.G. and L.A.I.; writing—original draft preparation, V.E.M. and L.A.I.; writing—review and editing, V.E.M., R.A.A.C.G., L.A.O.R., E.D.d.S., B.N.M. and L.A.I.; visualization, R.A.A.C.G., L.A.O.R., E.D.d.S., B.N.M. and L.A.I.; supervision, E.D.d.S., B.N.M. and L.A.I.; project administration, L.A.O.R., E.D.d.S., B.N.M. and L.A.I.; funding acquisition, L.A.O.R., E.D.d.S., B.N.M. and L.A.I. All authors have read and agreed to the published version of the manuscript.

Funding

This work received financial support from multiple Brazilian institutions: the Coordination for the Improvement of Higher Education Personnel (CAPES), under Finance Code 001; the Research Support Foundation of the State of Rio Grande do Sul (FAPERGS), through project number 21/2551-0002231-0; and the National Council for Scientific and Technological Development (CNPq), via grants 125941/2024-2, 309648/2021-1, 307791/2019-0, 308396/2021-9, 440010/2019-5, and 440020/2019-0. Additional funding was provided by the Federal University of Rio Grande do Sul (UFRGS) through the PROPESQ/UFRGS 2019 call, under the Institutional Research Support Program for Newly Hired Faculty Members.

Data Availability Statement

The original contributions presented in this study are included in the article. Further inquiries can be directed to the corresponding author.

Acknowledgments

The authors acknowledge the financial support from CAPES, FAPERGS, CNPq, and UFRGS. The authors also acknowledge the artificial intelligence tools ChatGPT (version GPT-4o), Google Gemini (version 2.5 Flash), and Google Translator, for the linguistic refinement and grammatical correction of the English text within this manuscript.

Conflicts of Interest

The authors declare no conflicts of interest.

Abbreviations

The following abbreviations are used in this manuscript:
BEMBoundary element method
BWBreakwater
CFDComputational fluid dynamics
CSMComputational solid mechanics
FVMFinite volume method
MAEMean Absolute Error
RMSERoot Mean Square Error
SHPSubmerged horizontal plate
SPSubmerged slate
RDRelative difference
VOFVolume of fluid
WECWave energy converter
Nomenclature
ApPlate area (m2)
C1Linear damping coefficient (s−1)
C2Quadratic damping coefficient (m−1)
epPlate thickness (m)
f ( ϕ 0 ) Value of the function at the lower limit of the integral
f ( ϕ j ) Function values at intermediate points
f ( ϕ n ) Value of the function at the upper limit of the integral
gGravitational acceleration (m/s2)
hWater depth (m)
HWave height (m)
HcChannel height (m)
hfWater depth at the end of the channel (m)
hpPlate height (m)
HsSignificant wave height (m)
IIntegral of absolute value (m·s or m)
IuValue of the water flow axial velocity integral (m)
IηdValue of the water free surface elevation integral downstream of the SP (m·s)
IηuValue of the water free surface elevation integral upstream of the SP (m·s)
IηwSPValue of the water free surface elevation integral downstream without SP (m·s)
kWave number (m−1)
LcChannel length (m)
LpPlate length (m)
LpPlate length (m)
nNumber of monitored data
pPressure (N/m2)
RVerification reference values (m)
S Damping sink term (N/m3)
tTime (s)
τ ¯ ¯ Strain rate tensor (N/m2)
TWave period (s)
TmWave’s mean period (s)
uHorizontal velocity wave component (m/s)
umaxMaximum axial velocity (m/s)
VVelocity in z direction (m/s)
v Velocity vector (m/s)
wVertical velocity wave component (m/s)
xHorizontal position (m)
xeHorizontal position of the end of the numerical beach (m)
xsHorizontal position of the start of the numerical beach (m)
zVertical position (m)
zbVertical position of the bottom of the channel (m)
zfsVertical positions of the free surface (m)
αVolumetric fraction
ΔtTime step (s)
ηFree surface elevation (m)
λWave length (m)
μAbsolute viscosity coefficient (kg/m·s)
ρFluid density (kg/m3)
ωWave angular frequency (s−1)

Appendix A

Here, difference curves are shown in detail, comparing the results obtained in this study with those reported in the reference works for the verification procedure (Figure A1), as well as comparing the inclined SP cases with the horizontal SHP reference case in terms of free surface elevation (Figure A2, Figure A3, Figure A5 and Figure A6) and axial water velocity beneath the device (Figure A4 and Figure A7).
Figure A1. Differences in computational model’s verification: (a) η probe at 0 m [47]; (b) η probe at 116 m [47]; and (c) η probe at 0 m (without SHP) [60].
Jmse 13 01438 g0a1
Figure A2. Differences in the free surface elevation upstream of the SP under the incidence of the representative regular waves.
Jmse 13 01438 g0a2
Figure A3. Differences in the free surface elevation downstream of the SP under the incidence of the representative regular waves.
Jmse 13 01438 g0a3
Figure A4. Differences in the axial velocity below the SP under the incidence of representative regular waves.
Jmse 13 01438 g0a4
Figure A5. Difference in the free surface elevation upstream of the SP under the incidence of the realistic irregular waves.
Jmse 13 01438 g0a5
Figure A6. Differences in the free surface elevation downstream of the SP under the incidence of the realistic irregular waves.
Jmse 13 01438 g0a6
Figure A7. Differences in the axial velocity below the SP under the incidence of realistic irregular waves.
Jmse 13 01438 g0a7

References

  1. Intergovernmental Panel on Climate Change (IPCC). Sea Level Rise and Implications for Low-Lying Islands, Coasts and Communities. In The Ocean and Cryosphere in a Changing Climate: Special Report of the Intergovernmental Panel on Climate Change; Cambridge University Press: Cambridge, UK, 2022; pp. 321–446. [Google Scholar]
  2. NASA Analysis Shows Unexpected Amount of Sea Level Rise in 2024. Available online: https://sealevel.nasa.gov/news/282/nasa-analysis-shows-unexpected-amount-of-sea-level-rise-in-2024/ (accessed on 6 June 2025).
  3. Hinkel, J.; Lincke, D.; Vafeidis, A.T.; Perrette, M.; Nicholls, R.J.; Tol, R.S.J.; Marzeion, B.; Fettweis, X.; Ionescu, C.; Levermann, A. Levermann, Coastal flood damage and adaptation costs under 21st century sea-level rise. Proc. Natl. Acad. Sci. USA 2014, 111, 3292–3297. [Google Scholar] [CrossRef] [PubMed]
  4. Nicholls, R.J.; Hanson, S.E.; Lowe, J.A.; Slangen, A.B.A.; Wahl, T.; Hinkel, J.; Long, A.J. Integrating new sea-level scenarios into coastal risk and adaptation assessments: An ongoing process. WIREs Clim. Change 2021, 12, e706. [Google Scholar] [CrossRef]
  5. Iwamoto, T.; Nakase, H.; Nishiura, D.; Sakaguchi, H.; Miyamoto, J.; Tsurugasaki, K.; Kiyono, J. Application of SPH-DEM Coupled Method to Failure Simulation of a Caisson Type Composite Breakwater During a Tsunami. Soil Dyn. Earthq. Eng. 2019, 127, 105806. [Google Scholar] [CrossRef]
  6. Celli, D.; Pasquali, D.; Fischione, P.; Di Nucci, C.; Di Risio, M. Wave-Induced Dynamic Pressure under Rubble Mound Breakwaters with Submerged Berm: An Experimental and Numerical Study. Coastal Eng. 2021, 170, 104014. [Google Scholar] [CrossRef]
  7. Wang, X.-Y.; Liu, Y.; Lu, L. Three-Dimensional (3D) Semi-Analytical Solution of Wave-Induced Fluid Resonance in Narrow Gaps of Caisson-Type Breakwaters. Ocean Eng. 2022, 253, 111305. [Google Scholar] [CrossRef]
  8. Mata, M.I.; van Gent, M.R.A. Numerical Modelling of Wave Overtopping Discharges at Rubble Mound Breakwaters Using OpenFOAM®. Coastal Eng. 2023, 181, 104274. [Google Scholar] [CrossRef]
  9. Safa, E.; Mojtahedi, A.; Mohammadian, A.; Yaghin, M.A.L. Hydrodynamic Assessment of a New Nature-Based Armour Unit on Rubble Mound Breakwater for Coastal Protection. China Ocean Eng. 2024, 38, 439–452. [Google Scholar] [CrossRef]
  10. Tortumluoglu, M.I.; Yasir, Y.; Dogan, M.; Aksoy, A.O. Experimental Investigation of Equilibrium and Temporal Scour around the Round Head of the Rubble Mound Breakwater in Case of Breaking and Non-Breaking Waves. Ocean Eng. 2024, 312, 119285. [Google Scholar] [CrossRef]
  11. Ramnarayan, S.K.; Sundar, V.; Sannasiraj, S.A. Hydrodynamic Performance of Concave Front Pile-Supported Breakwaters Integrated with a Louver Wave Screen. Ocean Eng. 2022, 254, 111394. [Google Scholar] [CrossRef]
  12. Zhang, B.; Wang, X.-Y.; Zhao, Y.; Liu, Y.; Jin, H. Numerical Study of Wave Interactions with a New Pile-Supported Curtain Wall Breakwater. Ocean Eng. 2022, 265, 112431. [Google Scholar] [CrossRef]
  13. Dang, B.L.; Nguyen-Xuan, H.; Wahab, M.A. An effective approach for VARANS-VOF modelling interactions of wave and perforated breakwater using gradient boosting decision tree algorithm. Ocean Eng. 2023, 268, 113398. [Google Scholar] [CrossRef]
  14. Li, Z.; Wang, Z.; Liang, B.; Wang, X. Experimental Study on Hydrodynamic Performance and Structural Forces of Curved and Vertical Front Face Pile-Supported Permeable Breakwaters. Phys. Fluids 2024, 36, 117134. [Google Scholar] [CrossRef]
  15. Li, Z.; Liu, R.; Wang, Z.; Liang, B.; Xia, H.; Sun, X.; Wang, X.; Shi, L. Wave Forces and Dynamic Pressures on Pile-Supported Breakwaters with Inclined Perforated Plates under Regular Waves. Front. Mar. Sci. 2024, 11, 1499685. [Google Scholar] [CrossRef]
  16. Pan, X.; Wu, D.; Liang, B.; Wu, G. A Sectional Method to Estimate the Transmission Coefficients of a New Type Pile-Supported Permeable Breakwater. Phys. Fluids 2024, 36, 032127. [Google Scholar] [CrossRef]
  17. Vu, M.-T.; Pham, M.-Q.; Vu, Q.-H. Numerical Study on Hydrodynamic Characteristics of New Modified Pile-Supported Breakwater. Ocean Eng. 2024, 312, 119141. [Google Scholar] [CrossRef]
  18. He, S.; Liu, Y.; Li, H. Analytical and Experimental Research on Wave Scattering by an Open-Type Rectangular Breakwater with Horizontal Perforated Plates. J. Ocean Univ. China 2024, 23, 1185–1201. [Google Scholar] [CrossRef]
  19. Ni, Y.-L.; Teng, B. Bragg Resonant Reflection of Water Waves by a Bragg Breakwater with Porous Rectangular Bars on a Sloping Permeable Seabed. Ocean Eng. 2021, 235, 109333. [Google Scholar] [CrossRef]
  20. Ni, Y.-L.; Teng, B. Bragg Resonant Reflection of Water Waves by a Bragg Breakwater with Porous Trapezoidal Bars on a Sloping Permeable Seabed. Appl. Ocean Res. 2021, 114, 102770. [Google Scholar] [CrossRef]
  21. Ding, W.-W.; Yue, W.-Z.; Sheng, S.-W.; Wu, J.-P.; Zou, Z.-J. Numerical and Experimental Study on the Bragg Reflection of Water Waves by Multiple Vertical Thin Plates. J. Mar. Sci. Eng. 2022, 10, 1464. [Google Scholar] [CrossRef]
  22. Xu, W.; Chen, C.; Htet, M.H.; Sarkar, M.S.I.; Tao, A.; Wang, Z.; Fan, J.; Jiang, D. Experimental Investigation on Bragg Resonant Reflection of Waves by Porous Submerged Breakwaters on a Horizontal Seabed. Water 2022, 14, 2682. [Google Scholar] [CrossRef]
  23. Xie, J.-J. Long Wave Reflection by an Array of Submerged Trapezoidal Breakwaters on a Sloping Seabed. Ocean Eng. 2022, 252, 111138. [Google Scholar] [CrossRef]
  24. Wu, J.-P.; Luo, H.-Y.; Zou, Z.-J.; Chen, P.; Qi, J.-J.; Xu, X.-Y. Experimental Study on the Hydrodynamic Characteristics of a Bragg Breakwater with Triple Vertical Plates. IOP Conf. Ser. Mater. Sci. Eng. 2023, 1288, 012042. [Google Scholar] [CrossRef]
  25. Sharma, P.; Sarkar, B.; De, S. Oblique Wave Scattering by Single and Double Inverse T-Type Breakwaters. Ocean Eng. 2024, 303, 117804. [Google Scholar] [CrossRef]
  26. Tsai, C.-P.; Ko, C.-H.; Shih, H.-C.; Chen, Y.-H.; Chen, Y.-C. Comparative Study of Wave Height Transformation: Bragg Reflection versus Wave Breaking at Submerged Rectangular Breakwaters. Ocean Eng. 2024, 299, 117277. [Google Scholar] [CrossRef]
  27. Sarkar, B.; Sharma, P.; De, S.; Tsai, C.-C.; Hsu, T.-W. Flexural–Gravity Wave Interaction with Dual Inverse Π-Type Breakwaters. Ships Offshore Struct. 2025, in press. [Google Scholar] [CrossRef]
  28. International Energy Agency. Renewables 2023: Analysis and Forecast to 2028. International Energy Agency. 2023. Available online: https://www.iea.org/reports/renewables-2023 (accessed on 11 June 2025).
  29. Fairley, I.; Smith, H.C.M.; Robertson, B.; Abusara, M.; Masters, I. Spatio-Temporal Variation in Wave Power and Implications for Electricity Supply. Renew. Energy 2017, 114 Pt A, 154–165. [Google Scholar] [CrossRef]
  30. Melikoglu, M. Current Status and Future of Ocean Energy Sources: A Global Review. Ocean Eng. 2018, 148, 563–573. [Google Scholar] [CrossRef]
  31. Mwasilu, F.; Jung, J.-W. Potential for power generation from ocean wave renewable energy source: A comprehensive review on state-of-the-art technology and future prospects. IET Renew. Power Gener. 2019, 13, 363–375. [Google Scholar] [CrossRef]
  32. Farrok, O.; Farah, M.M.; Islam, M.R. Introduction to the Principles of Wave Energy Conversion. In Oceanic Wave Energy Conversion: Advancement of Electrical Generators; Springer Nature: Singapore, 2024; pp. 1–15. [Google Scholar] [CrossRef]
  33. Mandev, M.B.; Altunkaynak, A. Advanced Efficiency Improvement of a Sloping Wall Oscillating Water Column via a Novel Streamlined Chamber Design. Energy 2022, 259, 124927. [Google Scholar] [CrossRef]
  34. Medina Rodríguez, A.A.; Posada Vanegas, G.; Silva Casarín, R.; Mendoza Baldwin, E.G.; Vega Serratos, B.E.; Puc Cutz, F.E.; Mangas Che, E.A. Experimental Investigation of the Hydrodynamic Performance of Land-Fixed Nearshore and Onshore Oscillating Water Column Systems with a Thick Front Wall. Energies 2022, 15, 2364. [Google Scholar] [CrossRef]
  35. M.Abdulhasieb, H.; Vega-Valladares, A.; García-Díaz, M.; Pereiras, B.; Pérez, J.G. CFD-Based Optimization of an Axial Impulse Turbine for a Twin-Turbine Topology of an OWC Wave Energy Converter. J. Mar. Sci. Eng. 2025, 13, 487. [Google Scholar] [CrossRef]
  36. Lin, Y.; Hong, J.; Gao, S.; Pan, J.; Wei, M.; He, F. Experimental Investigation of Vortex-Induced Flow Field Dynamics in Oscillating Water Column Converters with Various Front Wall Drafts. Phys. Fluids 2025, 37, 065123. [Google Scholar] [CrossRef]
  37. An, S.-H.; Kim, G.-G.; Lee, J.-H. Optimal Design of the Overtopping Wave Energy Converter Based on Fluid–Structure Interaction Simulation. J. Coast. Res. 2024, 116, 578–582. [Google Scholar] [CrossRef]
  38. An, S.-H.; Lee, J.-H. Analysis of Overtopping Wave Energy Converters with Ramp Angle Variations Using Particle-Based Simulation. J. Adv. Mar. Eng. Technol. 2024, 48, 414–420. [Google Scholar] [CrossRef]
  39. Cao, D.; Zeng, H.; He, J.; Liang, H.; Yang, Z.; Ancha, V.R.; Chen, H. A Numerical Investigation of Irregular Wave Overtopping on a 2D Fixed Overtopping Wave Energy Converter. Eng. Appl. Comput. Fluid Mech. 2025, 19, 2446658. [Google Scholar] [CrossRef]
  40. Goulart, M.M.; Martins, J.C.; Gomes, A.P.; Puhl, E.; Rocha, L.A.O.; Isoldi, L.A.; Gomes, M.N.; dos Santos, E.D. Experimental and Numerical Analysis of the Geometry of a Laboratory-Scale Overtopping Wave Energy Converter Using Constructal Design. Renew. Energy 2024, 236, 121497. [Google Scholar] [CrossRef]
  41. Liang, H.; Qin, H.; Su, H.; Wen, Z.; Mu, L. Environmental-Sensing and Adaptive Optimization of Wave Energy Converter Based on Deep Reinforcement Learning and Computational Fluid Dynamics. Energy 2024, 297, 131254. [Google Scholar] [CrossRef]
  42. Manawadu, N.H.D.S.; Nissanka, I.D.; Karunasena, H.C.P. SPH-Based Numerical Modelling and Performance Analysis of a Heaving Point Absorber Type Wave Energy Converter with a Novel Buoy Geometry. Renew. Energy 2024, 228, 120595. [Google Scholar] [CrossRef]
  43. Zitti, G.; Brocchini, M. The Role of Size and Inertia on the Hydrodynamics of a Self-Reacting Heave Single Point Absorber Wave Energy Converter. Renew. Energy 2024, 229, 120686. [Google Scholar] [CrossRef]
  44. Arrosyid, W.A.; Waskito, K.T.; Yanuar; Nasruddin; Sholahudin; Geraldi, A.; Zhao, Y. Hydrodynamic Performance and Multi-Objective Optimization of Multi-Cylinder Floating Point Absorber Wave Energy Converter. Ocean Eng. 2025, 317, 120040. [Google Scholar] [CrossRef]
  45. Dick, T.M.; Brebner, A. Solid and Permeable Submerged Breakwaters. In Proceedings of the 11th Coastal Engineering Conference (ASCE 2), London, UK, 1 September 1968; ASCE: Reston, VA, USA, 1968; pp. 1141–1158. [Google Scholar]
  46. Graw, K.U. The Submerged Plate Wave Energy Converter: A New Type of Wave Energy Device. In Proceedings of the International Symposium on Ocean Energy Development (ODEC), Muroran, Japan, 26–27 August 1993. [Google Scholar]
  47. Thum, G.Ü.; Maciel, R.P.; Oleinik, P.H.; Rocha, L.A.O.; Santos, E.D.; Seibt, F.M.; Machado, B.N.; Isoldi, L.A. Numerical Analysis of the Submerged Horizontal Plate Device Subjected to Representative Regular and Realistic Irregular Waves of a Sea State. Fluids 2024, 9, 188. [Google Scholar] [CrossRef]
  48. Motta, V.E.; Thum, G.Ü.; Gonçalves, R.A.A.C.; Rocha, L.A.O.; dos Santos, E.D.; Machado, B.N.; Isoldi, L.A. Numerical Study of Inclined Geometric Configurations of a Submerged Plate-Type Device as Breakwater and Wave Energy Converter in a Full-Scale Wave Channel. J. Exp. Theor. Anal. 2025, 3, 3. [Google Scholar] [CrossRef]
  49. Cummins, C.P.; Scarlett, G.T.; Windt, C. Numerical analysis of wave-structure interaction of regular waves with surface-piercing inclined plates. J. Ocean. Eng. Mar. Energy 2022, 8, 99–115. [Google Scholar] [CrossRef]
  50. Zheng, Y.; Zhou, Y.; Jin, R.; Mu, Y.; He, M.; Zhao, L. Experimental Study on Submerged Horizontal Perforated Plates under Irregular Wave Conditions. Water 2023, 15, 3015. [Google Scholar] [CrossRef]
  51. Seibt, F.M.; Dos Santos, E.D.; Isoldi, L.A.; Rocha, L.A.O. Constructal Design on Full-Scale Numerical Model of a Submerged Horizontal Plate-Type Wave Energy Converter. Mar. Syst. Ocean Technol. 2023, 18, 1–13. [Google Scholar] [CrossRef]
  52. Ding, H.; Huang, L.; Zang, J. Nonlinear hydroelastic responses of a submerged horizontal plate under focused wave conditions: A cumulative fatigue perspective. Phys. Fluids 2025, 37, 017110. [Google Scholar] [CrossRef]
  53. Dean, R.G.; Dalrymple, R.A. Water Wave Mechanics for Engineers and Scientists. Adv. Ser. Ocean Eng. 1991, 2, 305. [Google Scholar]
  54. Machado, B.N.; Oleinik, P.H.; Kirinus, E.P.; Rocha, L.A.O.; Gomes, M.N.; Conde, J.M.P.; Isoldi, L.A. WaveMIMO Methodology: Numerical Wave Generation of a Realistic Sea State. J. Appl. Comput. Mech. 2021, 7, 2129–2148. [Google Scholar]
  55. Hirt, C.W.; Nichols, B.D. Volume of fluid (VOF) method for the dynamics of free boundaries. J. Comput. Phys. 1981, 39, 201–225. [Google Scholar] [CrossRef]
  56. Gao, J.; He, Z.; Zang, J.; Chen, Q.; Ding, H.; Wang, G. Topographic Effects on Wave Resonance in the Narrow Gap between Fixed Box and Vertical Wall. Ocean Eng. 2019, 180, 97–107. [Google Scholar] [CrossRef]
  57. Gong, S.; Gao, J.; Song, Z.; Shi, H.; Liu, Y. Hydrodynamics of Fluid Resonance in a Narrow Gap between Two Boxes with Different Breadths. Ocean Eng. 2024, 311 Pt 2, 118986. [Google Scholar] [CrossRef]
  58. Gong, S.; Gao, J.; Yan, M.; Song, Z.; Shi, H. Effects of Floater Motion on Wave Loads during Steady-State Gap Resonance Occurring between Two Non-Identical Boxes. Ocean Eng. 2025, 323, 120649. [Google Scholar] [CrossRef]
  59. Mi, C.; Gao, J.; Song, Z.; Liu, Y. Hydrodynamic Wave Forces on Two Side-by-Side Barges Subjected to Nonlinear Focused Wave Groups. Ocean Eng. 2025, 317, 120056. [Google Scholar] [CrossRef]
  60. Paiva, M.d.S.; Mocellin, A.P.G.; Oleinik, P.H.; dos Santos, E.D.; Rocha, L.A.O.; Isoldi, L.A.; Machado, B.N. Theoretical Recommendations and Validation for the Generation of Realistic Irregular Waves Through the WaveMIMO Methodology. Processes 2025, 13, 1395. [Google Scholar] [CrossRef]
  61. Benoit, M.; Marcos, F.; Becq, F. TOMAWAC: Software for Sea State Modelling on Unstructured Grids over Oceans and Coastal Seas (Release 6.1); EDF R&D: Paris, France, 2011. [Google Scholar]
  62. Oleinik, P.H.; Tavares, G.P.; Machado, B.N.; Isoldi, L.A. Transformation of Water Wave Spectra into Time Series of Surface Elevation. Earth 2021, 2, 997–1005. [Google Scholar] [CrossRef]
  63. Oleinik, P.H.; Maciel, R.P.; dos Santos, E.D.; Rocha, L.A.O.; Machado, B.N.; Isoldi, L.A. Numerical Method for the Characterization of Sea States Using Realistic Irregular Waves on Computational Fluid Dynamics Simulations for Application on Wave Energy Converters. Sustain. Energy Technol. Assess. 2025, 73, 104093. [Google Scholar] [CrossRef]
  64. McCormick, M.E. Ocean Engineering Mechanics: With Applications; Cambridge University Press: New York, NY, USA, 2010. [Google Scholar]
  65. ANSYS, Inc. Ansys Fluent Theory Guide; ANSYS, Inc.: Canonsburg, PA, USA, 2013. [Google Scholar]
  66. Patankar, S.V. Numerical Heat Transfer and Fluid Flow; McGraw-Hill: New York, NY, USA, 1980. [Google Scholar]
  67. Versteeg, H.K.; Malalasekera, W. An Introduction to Computational Fluid Dynamics—The Finite Volume Method; Pearson Education Limited: London, UK, 2007. [Google Scholar]
  68. Rafiee, A.; Dutykh, D.; Dias, F. Numerical Simulation of Wave Impact on a Rigid Wall Using a Two-phase Compressible SPH Method. Procedia IUTAM 2015, 18, 123–137. [Google Scholar] [CrossRef]
  69. Srinivasan, V.; Salazar, A.J.; Saito, K. Modeling the Disintegration of Modulated Liquid Jets Using Volume-of-Fluid (VOF) Methodology. Appl. Math. Model. 2011, 35, 3710–3730. [Google Scholar] [CrossRef]
  70. Zwart, P.; Godin, P.; Penrose, J.; Rhee, S. Ship Hull Simulations with a Coupled Solution Algorithm. In Proceedings of the 10th International Symposium on Practical Design of Ships and other Floating Structures, PRADS 2007, Houston, TX, USA, 30 September–5 October 2007; Volume 2, pp. 989–996. [Google Scholar]
  71. Park, J.-C.; Kim, M.-H.; Miyata, H. Fully non-linear free-surface simulations by a 3d viscous numerical wave tank. Int. J. Numer. Methods Fluids 1999, 29, 685–703. [Google Scholar] [CrossRef]
  72. Foyhirun, C.; Kositgittiwong, D.; Ekkawatpanit, C. Wave energy potential and simulation on the Andaman sea coast of Thailand. Sustainability 2020, 12, 3657. [Google Scholar] [CrossRef]
  73. Lisboa, R.C.; Teixeira, P.R.; Didier, E. Regular and irregular wave propagation analysis in a flume with numerical beach using a Navier-stokes based model. Defect. Diffus. Forum 2017, 372, 81–90. [Google Scholar] [CrossRef]
  74. Mocellin, A.P.G.; Maciel, R.P.; Oleinik, P.H.; dos Santos, E.D.; Rocha, L.A.O.; Ziebell, J.S.; Isoldi, L.A.; Machado, B.N. Geometrical Analysis of an Oscillating Water Column Converter Device Considering Realistic Irregular Wave Generation with Bathymetry. J. Exp. Theor. Anal. 2023, 1, 24–43. [Google Scholar] [CrossRef]
  75. Gomes, M.N.; Lorenzini, G.; Rocha, L.A.; dos Santos, E.D.; Isoldi, L.A. Constructal Design Applied to the Geometric Evaluation of an Oscillating Water Column Wave Energy Converter Considering Different Real Scale Wave Periods. J. Eng. Thermophys. 2018, 27, 173–190. [Google Scholar] [CrossRef]
  76. ANSYS, Inc. Meshing User’s Guide; ANSYS Help: Canonsburg, PA, USA, 2024. [Google Scholar]
  77. Botchkarev, A. Performance Metrics (Error Measures) in Machine Learning Regression, Forecasting and Prognostics: Properties and Typology. Interdiscip. J. Inf. Knowl. Manag. 2019, 14, 45–79. [Google Scholar]
  78. Chapra, S.C.; Canale, R.P. Numerical Methods for Engineers, 7th ed.; McGraw-Hill Education: New York, NY, USA, 2015. [Google Scholar]
  79. Orer, G.; Ozdamar, A. An Experimental Study on the Efficiency of the Submerged Plate Wave Energy Converter. Renew. Energy 2007, 32, 1317–1327. [Google Scholar] [CrossRef]
  80. Koutrouveli, T.I.; Di Lauro, E.; das Neves, L.; Calheiros-Cabral, T.; Rosa-Santos, P.; Taveira-Pinto, F. Proof of concept of a breakwater-integrated hybrid wave energy converter using a composite modelling approach. J. Mar. Sci. Eng. 2021, 9, 226. [Google Scholar] [CrossRef]
Figure 1. Geometric configurations of the investigated SPs.
Jmse 13 01438 g001
Figure 2. Bivariate histogram of the sea state off the coast of Rio Grande, 2018.
Jmse 13 01438 g002
Figure 3. Schematic illustration of the computational domain.
Jmse 13 01438 g003
Figure 4. Schematic representation of the computational domain with boundary conditions.
Jmse 13 01438 g004
Figure 5. Schematic illustration of the mesh type generated in the computational domain.
Jmse 13 01438 g005
Figure 6. Mesh convergence test results for Cases 1 and 11 with irregular wave generation.
Jmse 13 01438 g006
Figure 7. Results of computational model’s verification: (a) η probe at 0 m [47]; (b) η probe at 116 m [47]; and (c) η probe at 0 m (without SHP) [60].
Jmse 13 01438 g007
Figure 8. Results of the free surface elevation upstream of the SP under the incidence of the representative regular waves.
Jmse 13 01438 g008
Figure 9. Results of the free surface elevation downstream of the SP under the incidence of the representative regular waves.
Jmse 13 01438 g009
Figure 10. Results of the axial velocity below the SP under the incidence of representative regular waves.
Jmse 13 01438 g010
Figure 11. Results of the free surface elevation upstream of the SP under the incidence of the realistic irregular waves.
Jmse 13 01438 g011
Figure 12. Results of the free surface elevation downstream of the SP under the incidence of the realistic irregular waves.
Jmse 13 01438 g012
Figure 13. Results of the axial velocity below the SP under the incidence of realistic irregular waves.
Jmse 13 01438 g013
Figure 14. Velocity field distributions at 40.23 s for cases: (a) 1; (b) 3; (c) 4; (d) 5.
Jmse 13 01438 g014
Figure 15. Velocity field distributions at 43.61 s for cases: (a) 1; (b) 3; (c) 4; (d) 5.
Jmse 13 01438 g015
Figure 16. Velocity field distributions at 249.77 s for cases: (a) 1; (b) 3; (c) 4; (d) 5.
Jmse 13 01438 g016
Table 1. Dimensions of the numerical wave flume and the SHP (Case 1).
Lc (m)Hc (m)hp (m)ep (m)Lp (m)Ap (m2)
171.060018.2944012.334400.320004.653001.48896
Table 2. Regular wave characteristics [60].
T (s)λ (m)H (m)h (m)hf (m)
4.50031.501.14013.2910.54
Table 3. Mesh convergence test results for Cases 1 and 11.
MeshCell Size (m)Total of VolumesCharacteristic Time Step (s)Processing Timeumax (m/s)RD 1 (%)
Case 110.1424456,1310.008026.5 h0.62233683-
20.1187067,7220.013020 h0.622447210.017736
30.0949681,0680.022513.5 h0.662400070.007575
40.04748210,1180.009060 h0.622339320.009761
50.03561379,8380.007590 h0.621335470.161300
Case 1110.1424456,0210.008027 h0.59792405-
20.1187068,0590.013019 h0.597437900.081306
30.0949681,0500.022514 h0.597337480.016808
40.04748193,6190.009072 h0.597659100.053842
50.03561324,2730.007590 h0.596219940.240799
1 RD is the absolute relative difference between two consecutive values.
Table 4. Values of MAE and RMSE for the computational model verification.
ProbeMAERMSE
η at 0 m [47]0.0425 m0.0537 m
η at 116 m [47]0.0337 m0.0413 m
η Probe at 0 m [60]0.0693 m0.0871 m
Table 5. Comparison of Iηdi, Iηui, and Iui for the SP under the incidence of the representative regular waves.
CaseIηdi (m⋅s)Iηui (m⋅s)Iui (m)Iηd1/IηdiIηui/IηdiIui/Iu1
131.996470.309427.709212.19741
244.654068.333026.85230.71651.53030.9691
350.180958.481034.12770.63761.16541.2316
453.058695.757623.17440.60301.80470.8364
555.767866.177439.20180.57371.18671.4148
635.792779.573424.43870.89392.22320.8812
750.563359.901832.86970.63281.16451.1862
848.822660.377230.15630.65541.23671.0883
937.360970.711028.72420.85641.89261.0366
1044.668980.120826.89360.71631.79370.9706
1159.142359.204733.01430.54101.00101.1915
Table 6. Comparison of IηdwSP and Iηdi for the SP under the incidence of the representative regular waves.
CaseIηdi (m⋅s)(1 − Iηi/IηwSP)·100 (%)
131.996458.84
244.654042.56
350.180935.45
453.058631.75
555.767828.26
635.792753.96
750.563334.96
848.822637.20
937.360951.94
1044.668942.54
1159.142323.92
Table 7. Comparison of Iηdi, Iηui, and Iui for the SP under the incidence of the realistic irregular waves.
CaseIηdi (m⋅s)Iηui (m⋅s)Iui (m)Iηd1/IηdiIηui/IηdiIui/Iu1
154.716794.762043.165111.73191
257.844889.767840.28780.94591.55190.9333
352.047591.157945.47791.05131.75141.0536
464.843481.777839.94150.84381.26120.9253
563.462983.986864.80680.86221.32341.5014
657.607591.169541.55120.94981.58260.9626
756.673589.319343.78820.96551.57601.0144
859.140590.477941.41330.92521.52990.9594
955.707294.173345.54280.98221.69051.0551
1061.685989.452159.97310.88701.45011.3894
1162.437287.390542.78390.87631.39970.9912
Table 8. Comparison of IηdwSP and Iηdi for the SP under the incidence of the realistic irregular waves.
CaseIηdi (m⋅s)(1 − Iηdi/IηwSP)·100 (%)
154.716727.2952
257.844823.1389
352.047530.8420
464.843413.8394
563.462915.6738
657.607523.4542
756.673524.6952
859.140521.4172
955.707225.9791
1061.685918.0350
1162.437217.0368
Disclaimer/Publisher’s Note: The statements, opinions and data contained in all publications are solely those of the individual author(s) and contributor(s) and not of MDPI and/or the editor(s). MDPI and/or the editor(s) disclaim responsibility for any injury to people or property resulting from any ideas, methods, instructions or products referred to in the content.

