Abstract
The International Maritime Organization (IMO) has set a goal to reach net-zero greenhouse gas emissions from international shipping by or around 2050. The ship energy efficiency framework has played a positive role over the past decade in improving carbon intensity and reducing greenhouse gas emissions by employing the technical and operational energy efficiency metrics as effective appraisal tools. To quantify the ship energy efficiency performance and review the existing energy efficiency framework, this paper analyzed the data for the reporting year of 2023 extracted from the European Union (EU) monitoring, reporting, and verification (MRV) system, and investigated the operational profiles and energy efficiency for the ships calling at EU ports. The results show that the data accumulated in the EU MRV system could provide powerful support for conducting ship energy efficiency appraisals, which could facilitate the formulation of decarbonization policies for global shipping and management decisions for stakeholders. However, data quality, ship operational energy efficiency metrics, and co-existence with the IMO data collection system (DCS) remain issues to be addressed. With the improvement of IMO DCS system and the implementation of IMO Net-Zero Framework, harmonizing the two systems and avoiding duplicated regulation of shipping emissions at the EU and global levels are urgent.
1. Introduction
1.1. Background
Shipping is an indispensable and important part of the global industrial and supply chains, making significant contributions to economic and social development [1]. Although it has higher energy efficiency and lower emissions per transport work compared to other modes of transport, such as aviation, highways, and railways, the air pollutants and greenhouse gas (GHG) emissions generated by the shipping sector cannot be ignored [2]. According to the Fourth Greenhouse Gas Study 2020 of the International Maritime Organization (IMO) [3], the proportion of carbon dioxide (CO2) emissions from shipping to global anthropogenic emissions has increased from 2.76% in 2012 to 2.89% in 2018; considering global economic growth, population expansion, trade and energy demand, if effective control measures are not taken, the shipping CO2 emissions are expected to reach 90% to 130% of 2008 levels by 2050. At the same time, mitigating GHG emissions and actively addressing climate change have become a universal consensus in various industries around the world. In this context, on 15 July 2011, the Marine Environment Protection Committee (MEPC) of IMO adopted Resolution MEPC.203 (62), introducing a new chapter in Annex VI of the International Convention for the Prevention of Pollution from Ships (MARPOL) called “Chapter 4 Regulation on Energy Efficiency for Ships” [4]. It adopted two mandatory regulations, the Energy Efficiency Design Index (EEDI) and the Ship Energy Efficiency Management Plan (SEEMP). On 28 October 2016, the IMO adopted Resolution MEPC.278(70) to establish the Data Collection System (DCS) for fuel oil consumption of ships [5]. Furthermore, on 17 June 2021, the IMO adopted Resolution MEPC.328 (76) [6], introducing other two mandatory measures in Chapter 4 of MARPOL Annex VI, the Energy Efficiency Existing Ship Index (EEXI), and the annual operational Carbon Intensity Indicator (CII), which entered into force on 1 January 2023. Since then, the IMO has established a mandatory regulatory framework to improve ship energy efficiency and reduce GHG emissions from shipping. Soon afterwards, the IMO adopted Resolution MEPC.377(80) on 7 July 2023 [7] and updated its strategy on the reduction of GHG emissions from ships. Furthermore, the draft Regulations on the IMO Net-Zero Framework was adopted on 11 April 2025 [8] to accelerate GHG emissions from international shipping to reach net zero.
Given the slow pace of IMO’s emission reduction decisions and policies, the European Union (EU) has decided to take unilateral actions and develop its own regulatory framework to monitor and reduce CO2 emissions from ships. On 19 May 2015, the EU officially released Regulation (EU) 2015/757 on the monitoring, reporting and verification of CO2 emissions from maritime transport [9], establishing a mechanism for ships with a gross tonnage above 5000 and navigating within EU waters or entering or leaving ports of EU/European Economic Area (EEA) member states, and requiring monitoring, reporting and verification (MRV) their annual fuel consumption, CO2 emissions, and transport work, commonly known as the EU MRV mechanism, which came into effect on 1 January 2018. Furthermore, the EU officially released Regulation (EU) 2023/957 [10] and Regulation (EU) 2023/1805 [11] in 2023, revising Regulation (EU) 2015/757 and including maritime transport activities into the EU Emissions Trading System (EU ETS), and introducing the FuelEU Maritime mechanism, respectively, further strengthening the fundamental support role of the EU MRV mechanism.
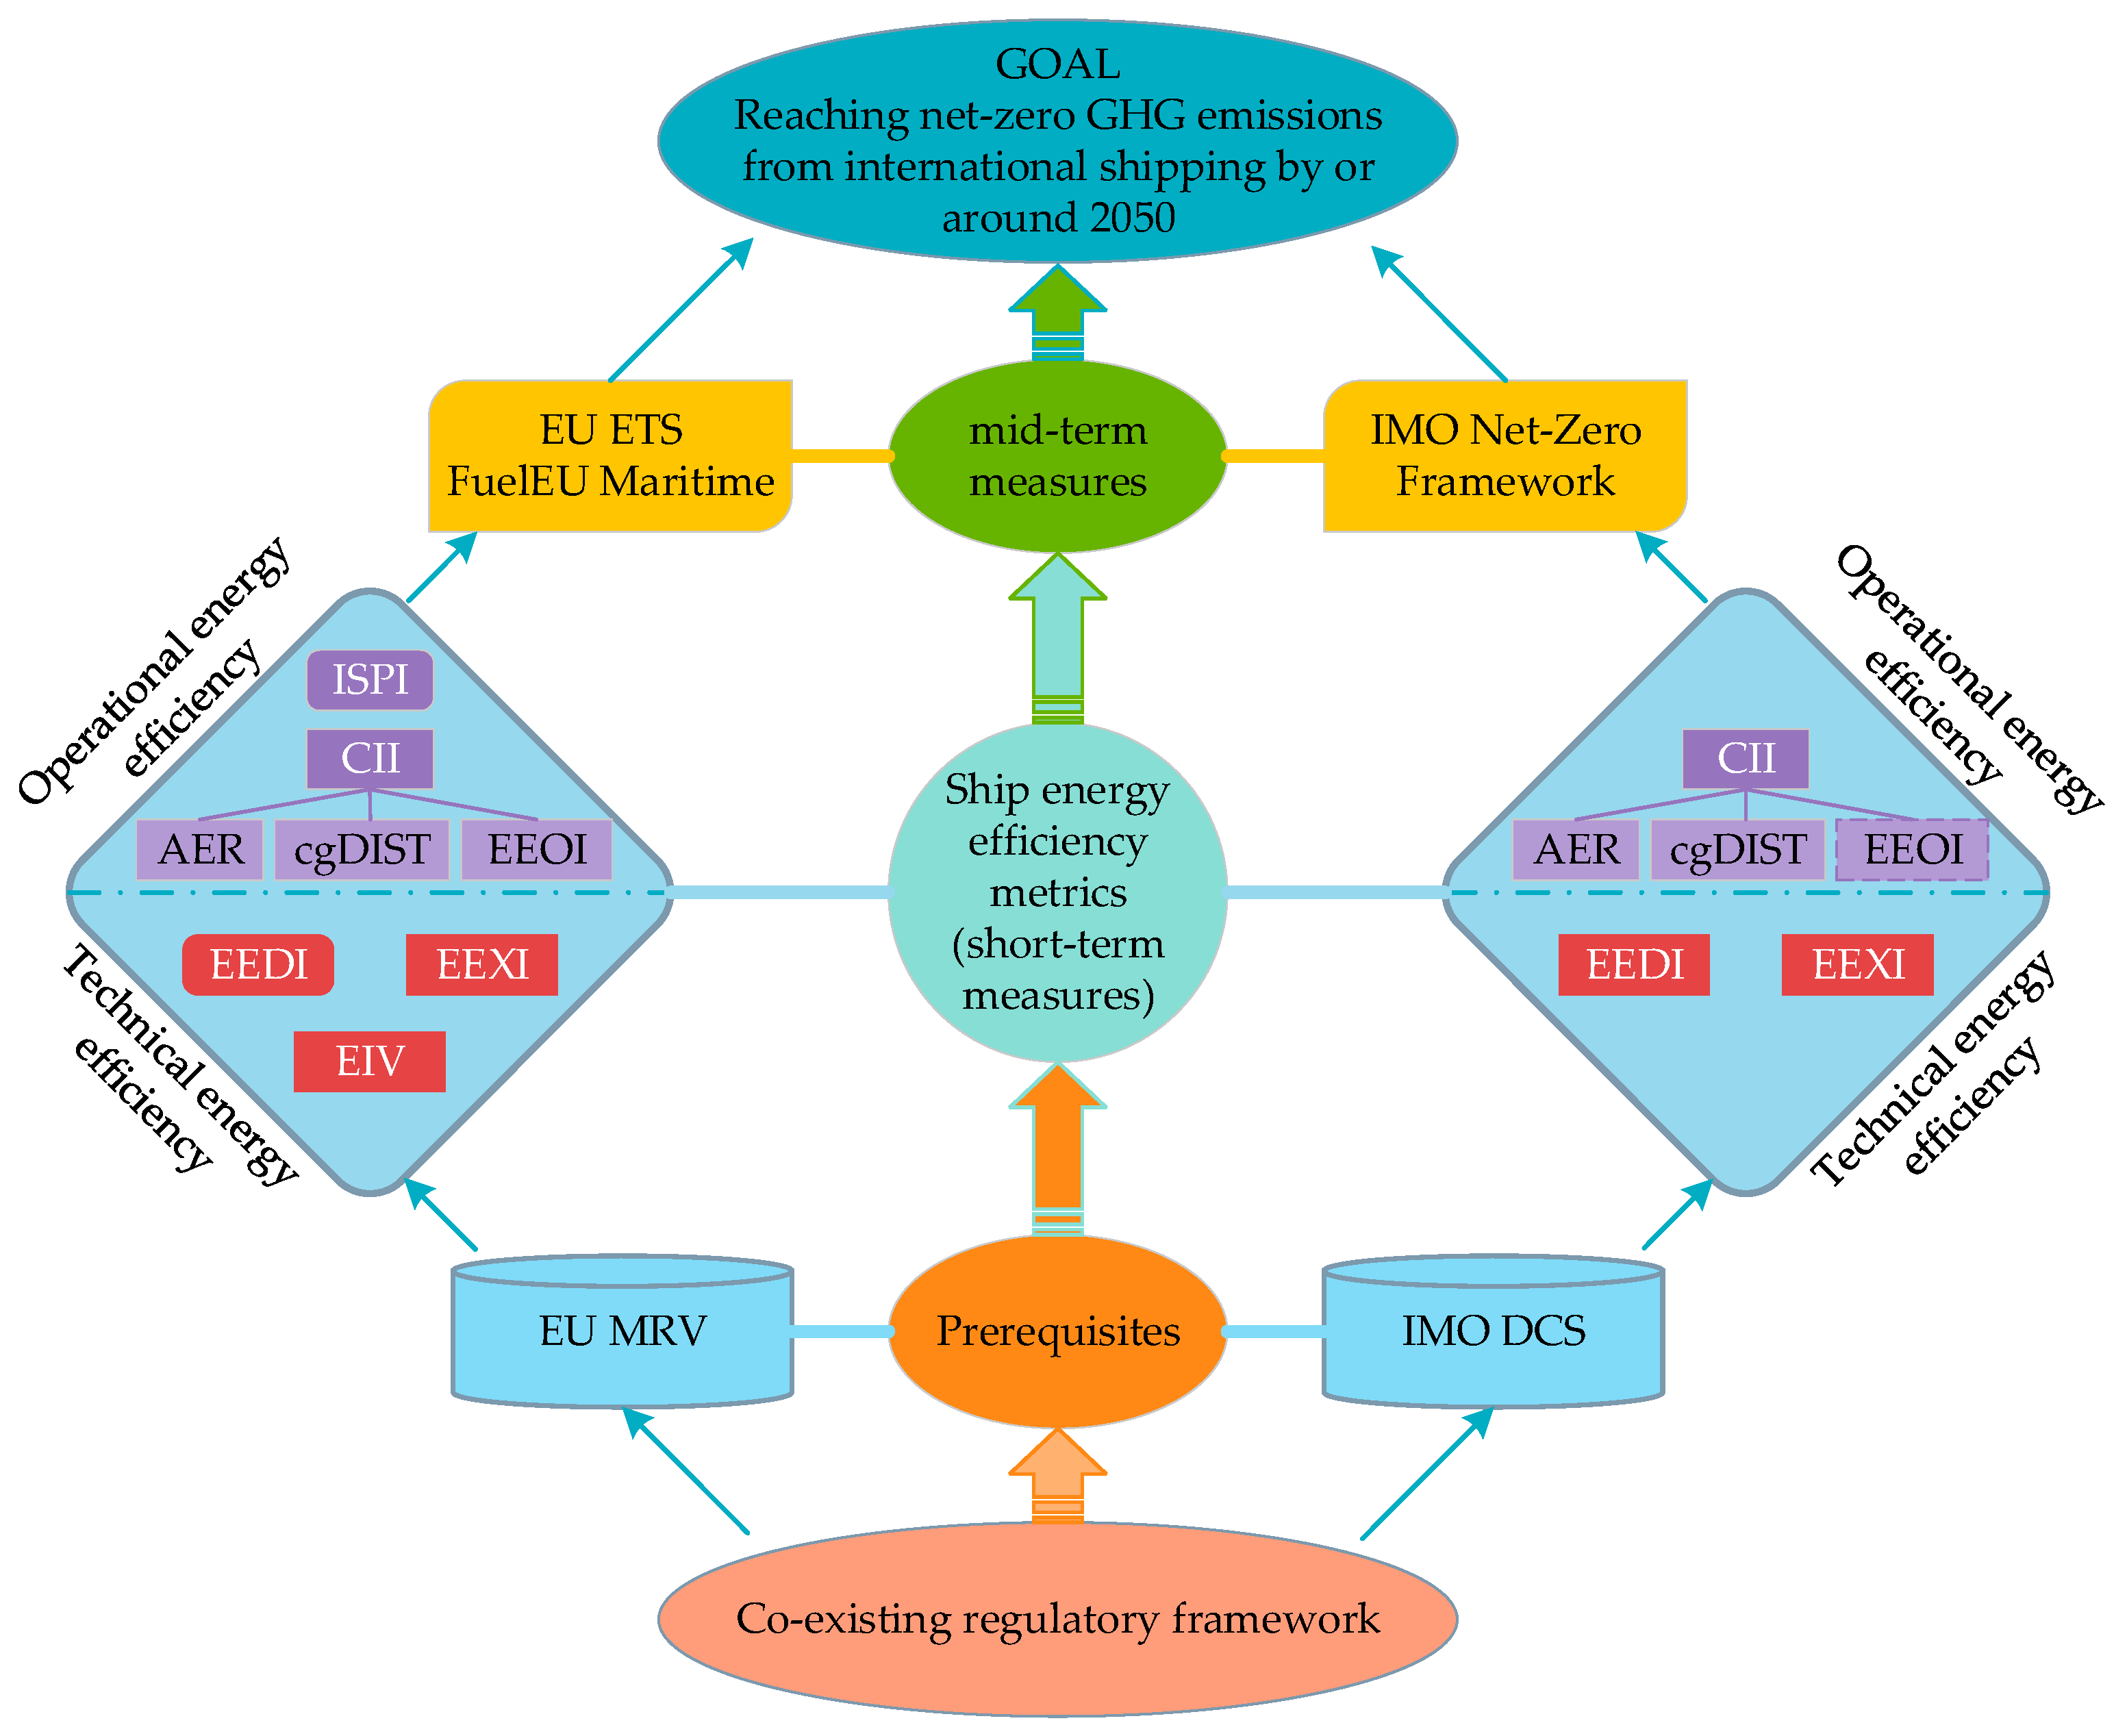
Up to now, a co-existing regulatory framework for shipping emissions has gradually formed, as shown in Figure 1, consisting of the IMO regulations at a global level and the EU regulations at a regional level. Adequate data reported and collected could provide support for appraisals of ship energy efficiency performance, formulating emission reduction policies, and selecting technological paths. In particular, the EU MRV mechanism has been functional since 1 January 2018, with six years of data available as of May 2025 [12]. The accessibility, transparency, and completeness of EU MRV data have demonstrated greater potential in data analysis and utilization for the formulation of decarbonization policies for global shipping and management decisions of stakeholders.
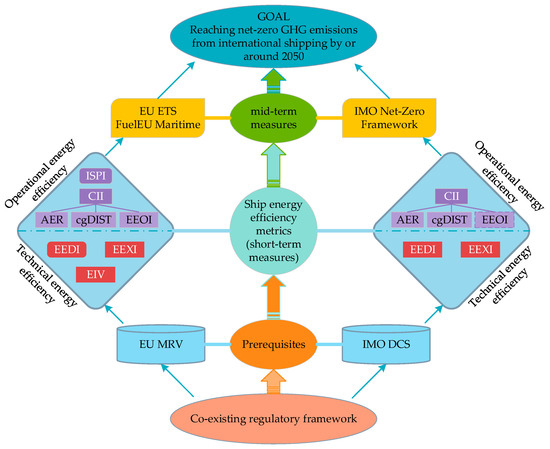
Figure 1.
Regulatory framework of GHG emissions from shipping.
1.2. Literature Review
The existing investigations on the EU MRV mainly included analysis of the data reported and optimization of the mechanism. Yan et al. [13] analysed and compared the EU MRV dataset from 2018 to 2019 from a quantitative perspective. The results show that ship energy efficiency has been enhanced. Furthermore, Luo et al. [14] conducted characteristic analysis and trend analysis of ship energy efficiency and emissions based on the EU MRV data collected from 2018 to 2021. Christodoulou et al. [15] analyzed the fuel types used, fuel consumption, and CO2 emissions of ships operating within the EU/EEA by utilizing the EU MRV database, to provide significant input to maritime stakeholders and policy-makers. To clarify the trends that have been formed over the years 2018 to 2022, Barka-Patargia [16] analyzed the data from the EU MRV database. Panagakos et al. [17] collected the EU MRV data for the first reporting year of 2018 made by a fleet of dry bulk carriers, and some energy efficiency indices, such as Energy Efficiency Operational Indicator (EEOI), Annual Efficiency Ratio (AER), Energy Efficiency per Service Hour (EESH), and Individual Ship Performance Indicator (ISPI), which are calculated on an annual basis and at voyage level. Mannarini et al. [18] utilized the data from three other databases to enhance the EU MRV dataset, and conducted energy efficiency evaluation on ro–ro passenger ships. Georgiev and Garbatov [19] analysed the operational characteristics of container vessels performing regular short sea voyages in the Black Sea, based on the data from the EU MRV and two other databases. Garbatov et al. [20] conducted ship propulsion system retrofitting analysis, based on the historical data for ships operating in the Black Sea from the EU MRV database, to identify the most appropriate retrofitting solution. Christodoulou et al. [21] assessed the direct economic impact on the maritime sector from its inclusion in the EU ETS based on the EU MRV data for the estimation of CO2 emissions. Heindl [22] investigated the administrative transaction costs of EU MRV on different types and sizes of shipping companies, which revealed the existence of economies of scale. A similar study in the case of Sweden was conducted, which confirmed that a CO2 tax yields lower transaction costs than emissions trading [23]. Some other studies focusing on review and optimization of the EU MRV mechanism were mainly derived from ice-class ships and sailing through ice areas [24,25].
When talking about the EU MRV mechanism, which is not an isolated mechanism, the ship energy efficiency metrics and the measures for improving energy efficiency are inevitably involved. Energy efficiency improvement is an eternal value pursuit in the shipping industry [26,27], especially with the implementation of IMO energy efficiency regulations. There is a large amount of research on improving energy efficiency through technologies, operations, and market mechanisms [28,29,30,31]. Nevertheless, this article is not intended to provide a comprehensive review and comment in this area, but only focuses on the research of the ship energy efficiency framework and energy efficiency metrics, especially in the field of operational CII.
What are the applicable ship energy efficiency framework? Poulsen et al. [32] investigated the influence of commercial and nautical factors on ship energy efficiency and found that commercial decisions depending on dynamic market conditions matter more than nautical decisions for energy efficiency. Bullock et al. [33] criticized that the 2023 IMO Strategy on Reduction of GHG Emissions from Ships dominantly focuses on fuels and longer-term targets, which will hinder the progress towards meeting the IMO’s 2030 and 2040 goals, due to the long time for deployment of green fuels and replacement of the existing fleets. Adamowicz [34] criticized that the two mechanisms of the EU MRV and the IMO DCS result in the fragmentation of GHG emission regulation, and discussed the co-existence of these two mechanisms in terms of financial penalties and other types of sanctions in case of non-compliance. What are the optimal ship energy efficiency metrics? Bayraktar et al. [35] conducted a scientometric analysis on the energy efficiency metrics, including EEDI, EEXI, EEOI, and CII, and identified the more frequently used metrics in the literature. Kanberoğlu and Kökkülünk [36] analyzed and compared the operational energy efficiency values of five bulk carriers, aiming to guide the shipping companies about energy efficiency and environmental management to comply with the EU MRV and IMO DCS regulations. Vasilev et al. [37] evaluated the EEDI, EEXI, and CII of tanker fleets by differentiating ships by size and type. The results showed that the EEDI, EEXI, and CII regulations have significantly improved energy efficiency, but the challenge remains in terms of compliance.
A large amount of research has been conducted with the goal of CII compliance to improve energy efficiency [38,39]. The applications of cold ironing, engine power limitation, and the usage of LNG or methanol as alternative fuels are the common measures [40,41]. But it is also questionable whether the CII is a reasonable indicator. Regarding the several CII options available for selection, Wang et al. [42] proved it a paradox by deducing from several simple examples in theory, i.e., the compliance of CII may increase carbon emissions of some ships in some situations. Therefore, more elaborate models and much more real data are required to develop more applicable CII metrics. The same research findings are also concluded by Rauca et al. [43], who investigated the 1-year calendar routes of four vessels and found that the CII ratings are highly dependent on idle and laden voyages. Braidotti et al. [44] found that the CII may lead to misleading results when applied to cruise ships, since the hoteling load of a cruise ship is comparable to propulsion power. Kim et al. [45] investigated the major causes of low CII ratings for ships and proposed technical and operational measures to support shipping companies in satisfying the increasingly stringent CII regulations. Sardar et al. [46] highlighted that accurate CII calculations depend on properly collecting, organizing, and evaluating data, and continuously evolving calculation methodology, emphasizing the incorporation of correction factors and exclusions.
1.3. Research Objectives
Whether the existing studies focused on statistical analysis of the EU MRV publication of information, or energy efficiency evaluation, optimization of technical solutions, and regulatory policy formulation based on the EU MRV data reported, or optimization of ship energy efficiency framework and metrics, there is a lack of presentation on the current energy efficiency performance of the world fleet, a lack of questioning on the applicability of energy efficiency metrics, a lack of evaluation on the rationality of the energy efficiency framework, and a lack of review on the future direction of regulatory policies. For these reasons, this article was conducted based on the following questions:
- (1)
- Based solely on analysis of data from the EU MRV database, what are the shortcomings of the current EU MRV mechanism? Are the data accuracy and completeness enough? Has this mechanism brought a significant administrative and economic burden?
- (2)
- Should more precise monitoring methods, such as direct CO2 emissions measurement, become one of the focuses of energy efficiency regulation and the direction for MRV mechanism improvement? Especially when the well-to-wake GHG fuel intensity and uses of zero/net-zero fuels become one of the major issues under the IMO Net-Zero Framework, is it necessary to invest more administrative resources and capital in accurate tank-to-wake emissions monitoring?
- (3)
- What are the technical and operational energy efficiency performance of the global fleet? How about the energy efficiency improvement achieved and future potential? Are the reference baseline and reduction factors for energy efficiency metrics reasonable and feasible? Is there a better energy efficiency metric?
- (4)
- With the entry into force and implementation of the IMO Net-Zero Framework, there would be two mechanisms on ship energy efficiency, the regulatory framework including EEDI, EEXI, SEEMP, DCS, CII, and IMO Net-Zero Framework at IMO level, and the regulatory framework including EU MRV, EU ETS, and FuelEU Maritime at EU level. Will this situation weaken Europe’s industrial and market competitiveness? Is it necessary, and how can it be effectively harmonized to avoid fragmented and duplicated regulation on shipping GHG emissions?
These questions are raised to the shipping industry under the current situation, and it does not mean that all answers and solutions can be found through the research in this article. However, this article still strives to analyze the existing EU MRV data in order to gain valuable insights and stimulate discussion. The maritime community is expected to work together to find the most feasible solutions, achieving the 2050 net zero emissions target as soon as possible [7], and ensuring the high-quality and sustainable development of the shipping industry.
After the Introduction, Section 2 presents the data source and methodology process. Statistical and regression analysis results on the ship operational profiles, the monitoring methods of CO2 emissions, the ship technical energy efficiency, the annual average CO2 emissions per distance, the attained annual operational CII, and the attained EEOI are discussed in Section 3. In Section 4, some comments and implications in terms of the data quality, the monitoring methods, the technical and operational energy efficiency of ships as well as their metrics, and the necessity of co-existence of the EU and IMO regulations on shipping emissions, are presented. Finally, conclusions are presented in Section 5.
2. Materials and Methods
2.1. Energy Efficiency Metrics
As presented in Figure 1, there are mainly two categories of metrics for evaluating ship energy efficiency: Ship technical energy efficiency metrics, including EEDI, EEXI, and Estimated Index Value (EIV); ship operational energy efficiency metrics, including CII, ISPI, etc. Furthermore, CII could be expressed as AER, cgDIST, and EEOI, etc. Each metric has its definition, scope of application, applicable ship types, calculation formulas, and limit requirements, which could be referred to relevant IMO documents, such as reference [6], and will not be elaborated here.
2.2. Data Sources
According to Article 21 of Regulation (EU) 2015/757, the European Commission shall make publicly available the MRV information on CO2 emissions reported by 30 June each year [9]. As of the end of 2024, the EU has released its annual MRV publication of information for the six years of 2018–2023, which are publicly available on the THETIS-MRV website of the European Maritime Safety Agency (EMSA) [47]. The annual information covers data items such as ship name, IMO identification number, ship type, ship technical energy efficiency, annual fuel consumption and CO2 emissions, annual average operational energy efficiency, and other annual monitoring results. Meanwhile, due to potential errors and omissions, the annual MRV information is constantly being updated.
Regarding ship technical energy efficiency, the MRV publication of information has three forms of technical energy efficiency indices: EEDI, EEXI, and EIV. According to the MARPOL Annex VI, EEDI applies to new ships or existing ships that have undergone significant modifications; EEXI is applicable to existing ships and can also be applied to new ships. The so-called new ships, ship types, and sizes applicable to EEDI and EEXI are specifically defined in the MARPOL Annex VI. EIV is different from EEDI and EEXI. It is an estimated value of ship technical energy efficiency, not a statutory indicator, and is applicable to ships that cannot report EEDI or EEXI. Its value is usually higher than the actual energy efficiency indicators. According to the EU MRV mechanism, ships should report their technical efficiency (EEDI, EEXI, or EIV, where applicable).
Although verified and practiced for many years, the annual MRV publication of information on the ship technical energy efficiency is still quite confusing, with reporting of EEDI, EEXI, or EIV for both new and existing ships. When there are no major modifications to the ship, its technical energy efficiency should be constant, and reporting as EIV from 2023 onwards for some ships is non-compliant. But based on the annual MRV publication of information from 2018 to 2023, the same ship may be reported as EEDI, EEXI, or EIV in different years; even if the report is for the same indicator, there may be variations in its values. Given the above situation, this article only conducts statistical analysis on the 2023 publication of information. On the one hand, this is because the 2023 publication of information is the latest, and it can be assumed that based on years of practice, its information reported is relatively complete and accurate; on the other hand, Resolution MEPC.328 (76) regarding EEXI and CII has been implemented from 1 January 2023. Under the constraints of mandatory IMO regulations, it can also be considered that the data for the reporting year of 2023 are relatively complete and accurate than ever.
2.3. Research Method
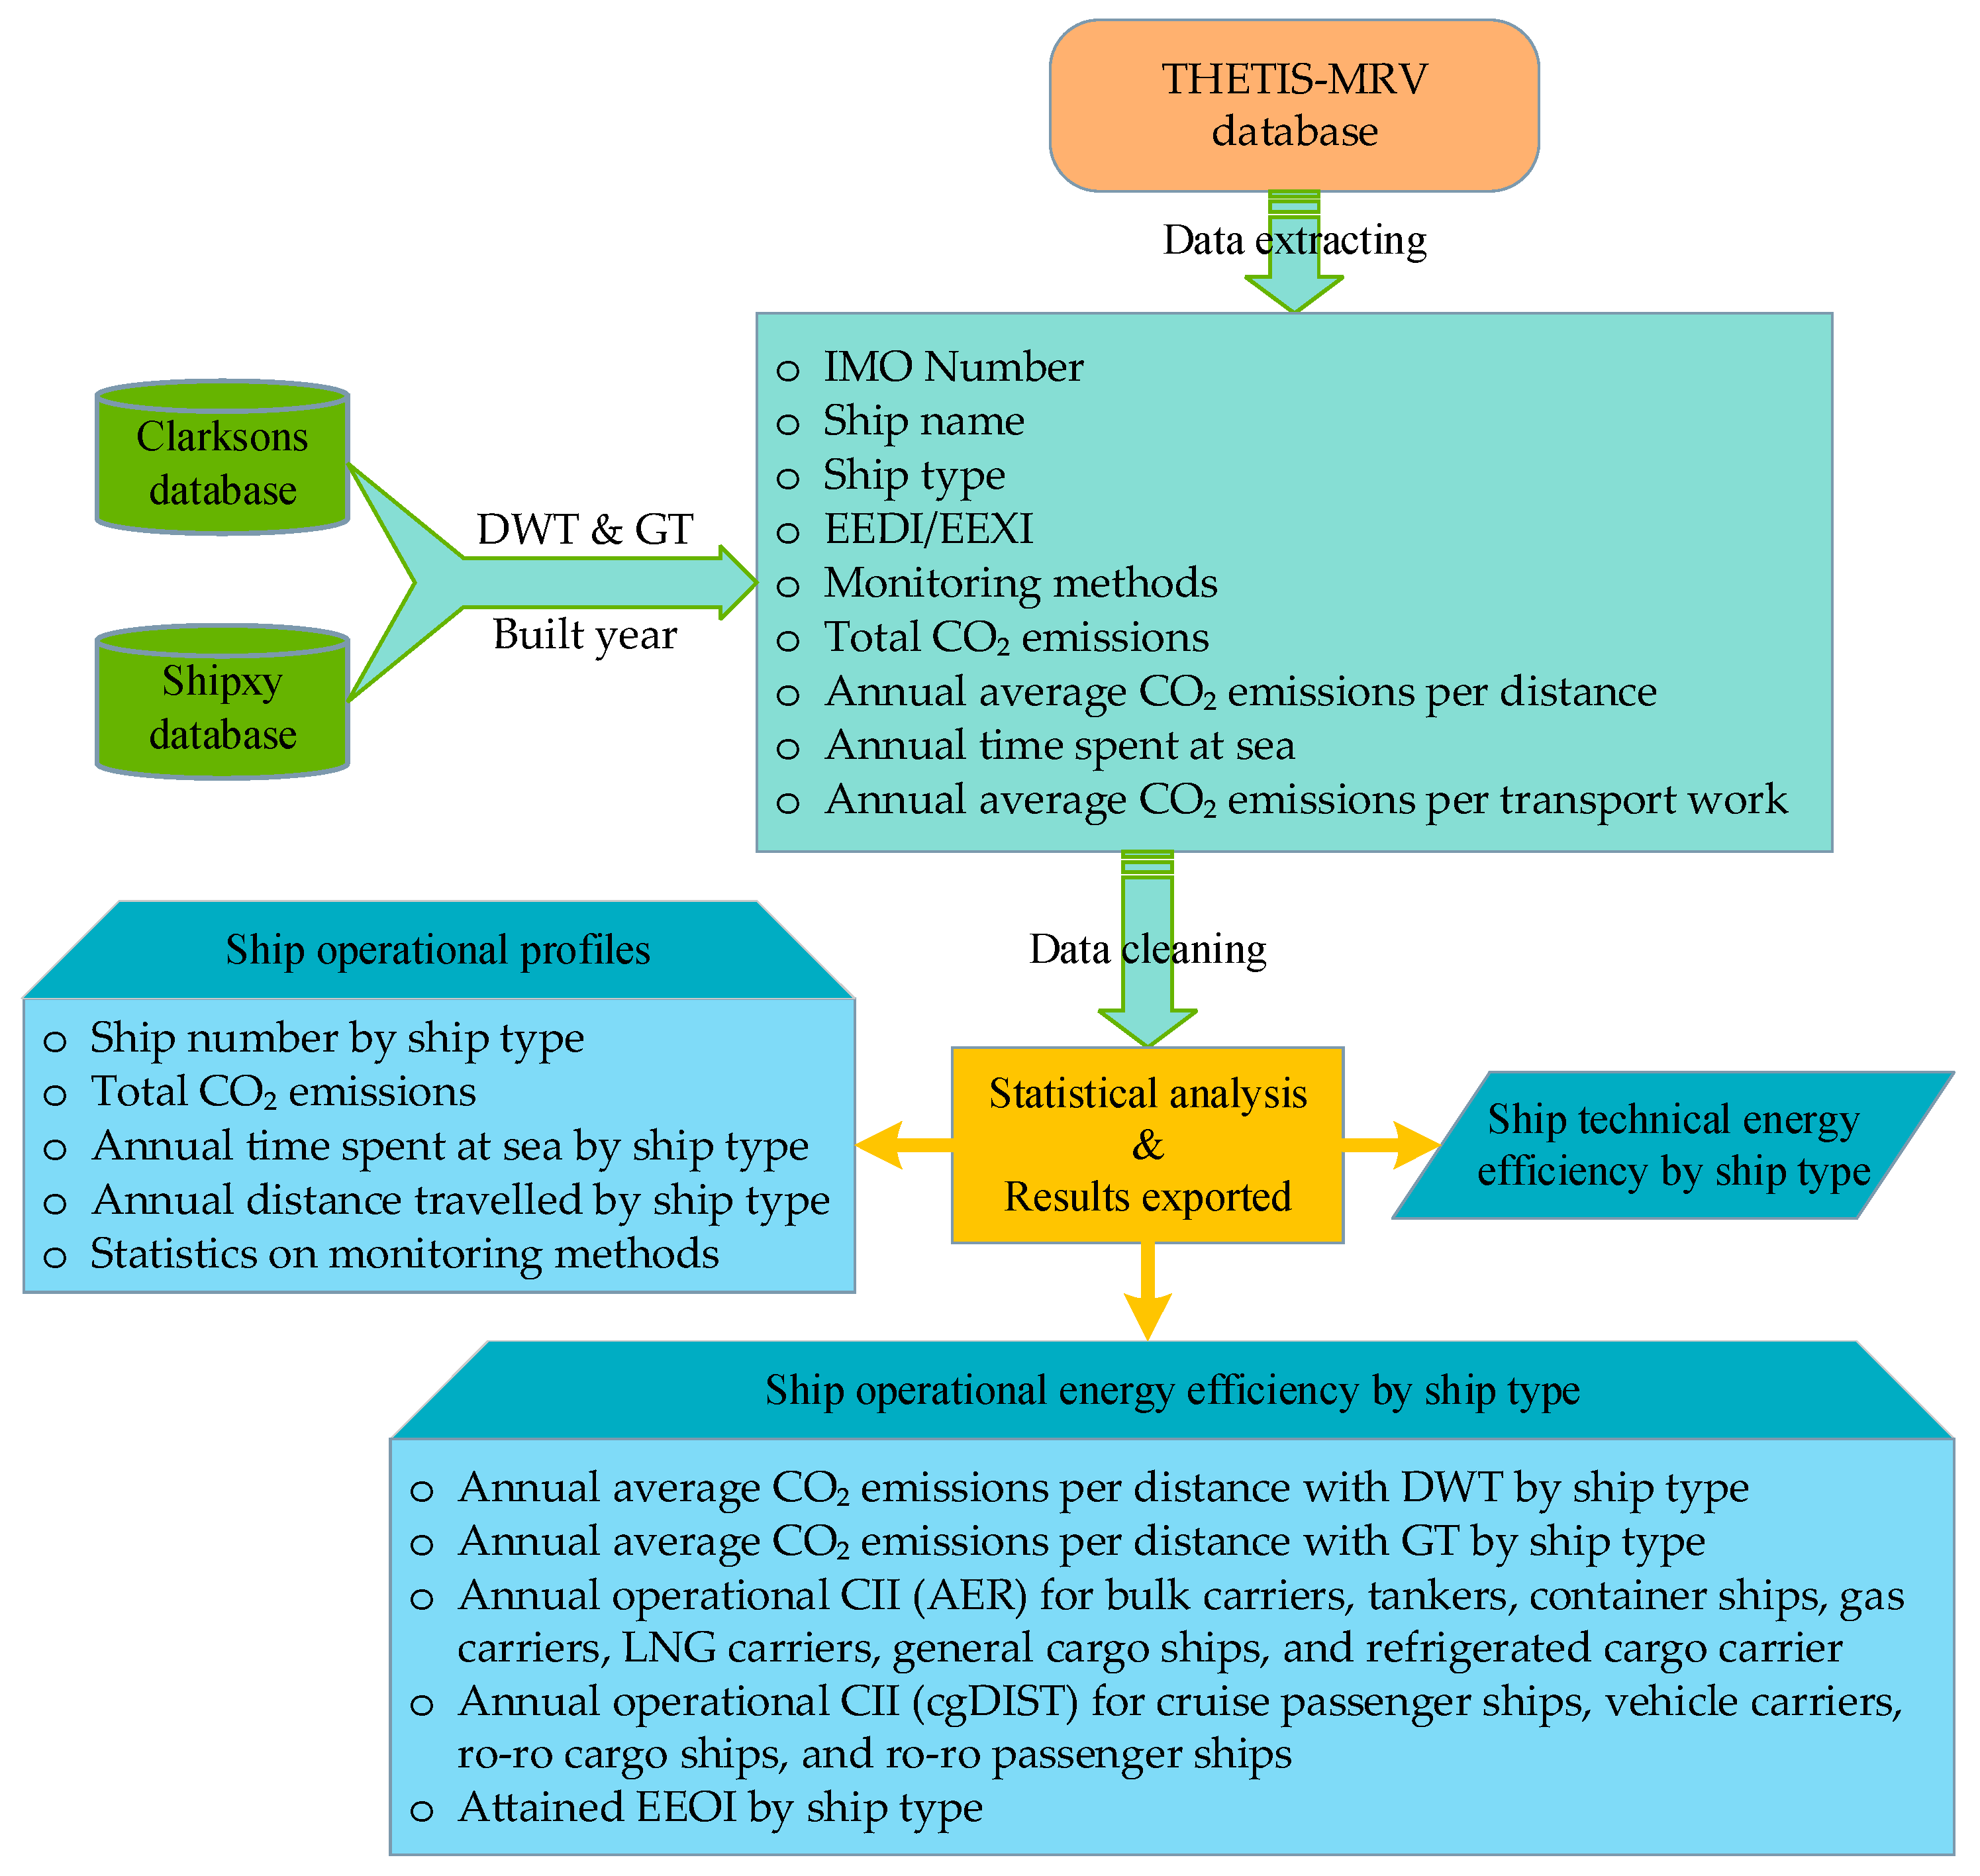
The annual MRV publication of information does not include information on ship tonnage and built year. To analyse the energy efficiency characteristics of ships by ship type, tonnage, and built year, the processing method used in this article is: The ship energy efficiency is derived from the downloadable spreadsheet in THETIS-MRV website [47]; according to the IMO identification number in the THETIS-MRV spreadsheet, the tonnage and built year information of ships are retrieved through the Clarksons Shipping Intelligence Network [48]; for the lack of a small amount of individual ship data in the Clarksons database, relevant information can be supplemented by querying the archive module of the Shipxy database developed by Elane [49]. The THETIS-MRV spreadsheet is the 45th edition of the publication of information for the reporting year of 2023, which includes data for 12,802 ships. After excluding key field items such as null values, zero values, and non-numeric values that are not applicable, further analysis also revealed significant anomalies in individual data. However, the outliers for different ship types and evaluation metrics are different, which cannot be handled by a unified standard, so they were manually removed based on specific standards as mentioned in Section 3.2 and Section 3.3 in feature analysis. The methodology process is illustrated in Figure 2.
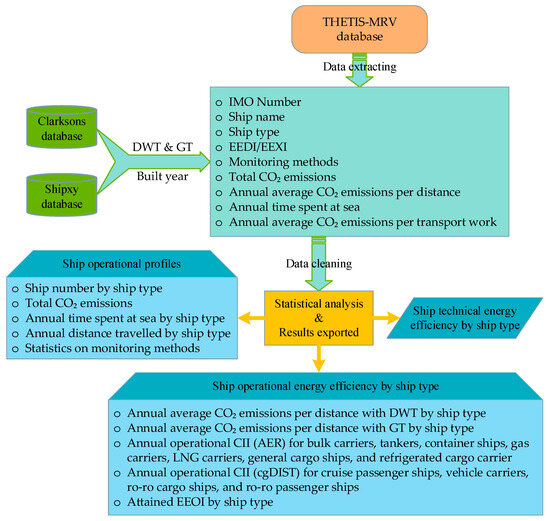
Figure 2.
Methodology process.
2.4. Uncertainty Analysis
Errors and omissions may occur in various stages, such as data monitoring, reporting, verifying, pre-processing, and analysing, which can affect the accuracy and completeness of the analysed samples. A qualitative analysis of uncertainty identified the potential sources of error:
- (1)
- Although the data reported by shipping companies has been checked and verified by verifiers, and the THETIS-MRV system is constantly updating the data, significant errors and omissions still exist when summarizing and analysing these data. Therefore, it cannot be ruled out that there may be errors in the sample data used for statistical analysis in this article.
- (2)
- During the pre-processing of annual data, it was found that some individual data were significantly abnormal or unreasonable, so some data were manually removed. Although they only accounted for a very small proportion of the total analysed data, it cannot be ruled out that some errors may be introduced.
- (3)
- According to the tonnage and built year of the vessel, there are clear requirements for the reporting of technical energy efficiency as EEDI, EEXI, or EIV. There are differences in the calculation methods and applicable objects of EEDI, EEXI, and EIV, but currently, the use of technical energy efficiency metrics in the EU MRV system is still relatively chaotic, which may lead to errors in the classification and statistics of this article.
- (4)
- The sample size of statistical analysis for some ship types is relatively small, and there are some combinations of ship types, resulting in certain deviations in the statistical results obtained from regression analysis.
3. Results
3.1. Basic Information of Ships Related to EU Ports
The European Commission published annual reports, based on the annual MRV reported aggregated data, to provide basic information for ships related to EU Ports and analyse the changes over the years [12]. Further supplements and in-depth analysis will be conducted here based on the research objectives of this article.
3.1.1. Ship Types and Number
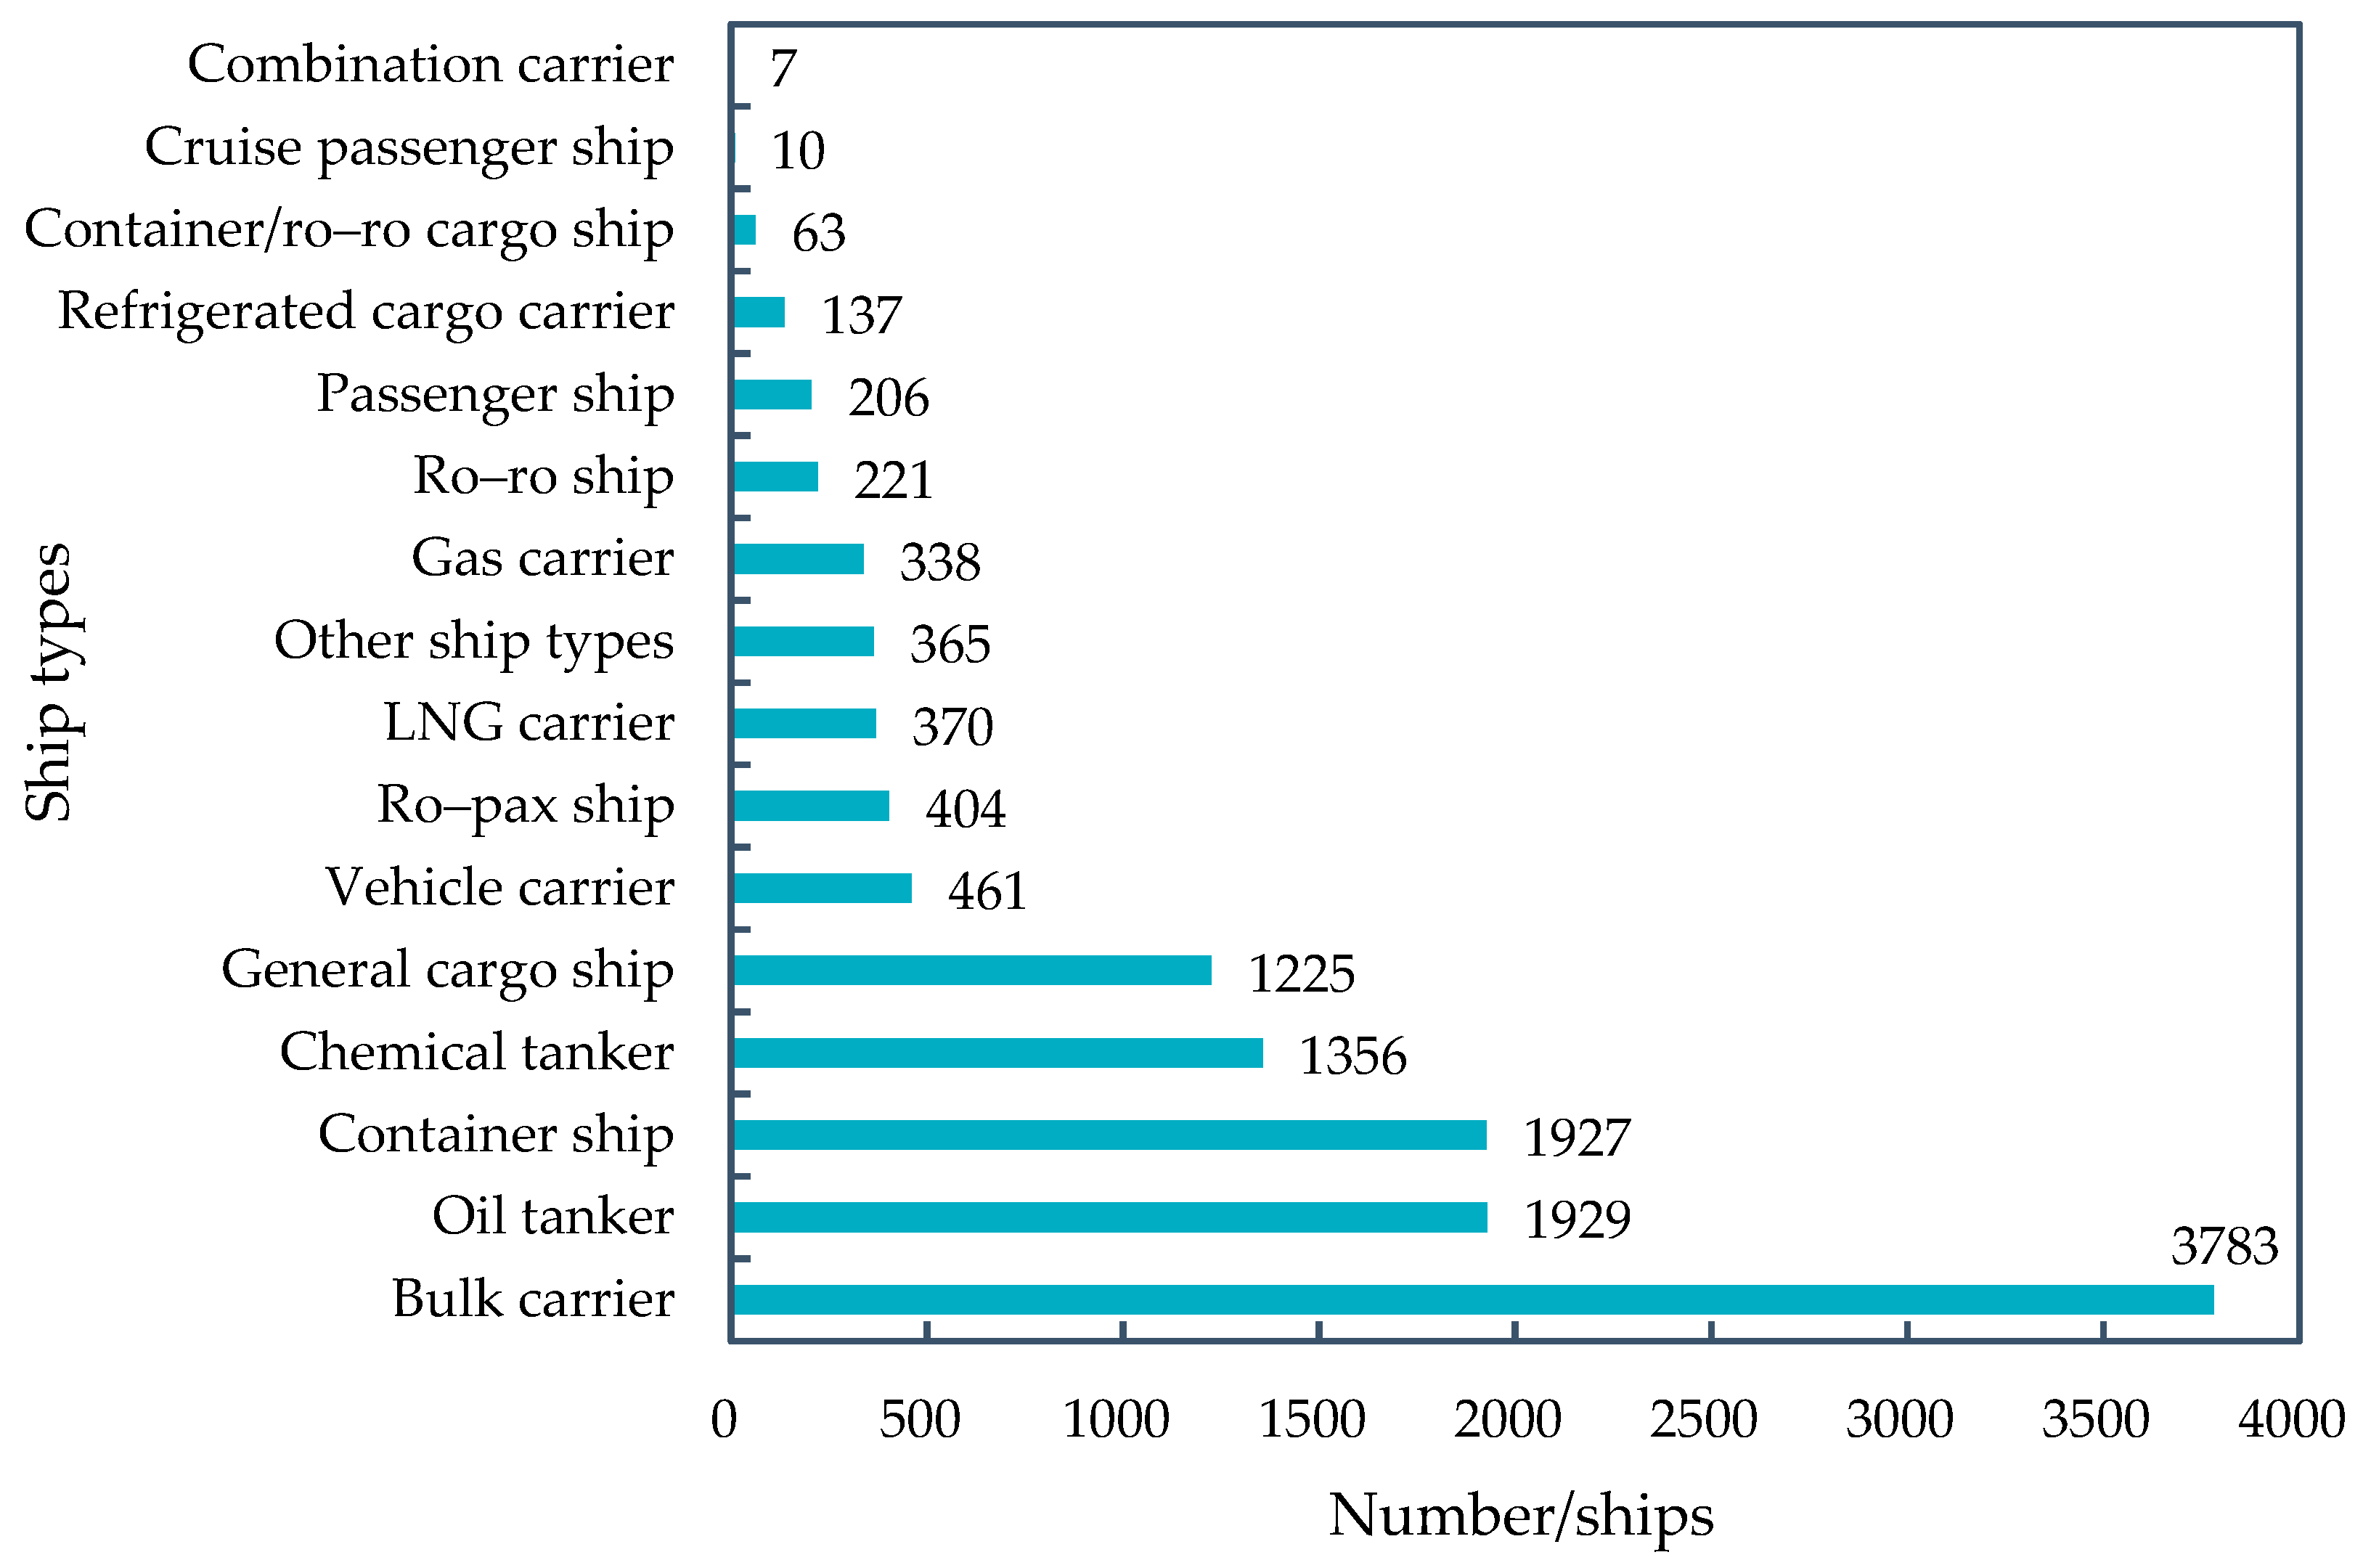
Using the 12,802 reported ships as analysis samples, the number of different ship types is shown in Figure 3. The 2023 MRV publication of information includes 16 ship types. In terms of the number of ships, the main ship types include bulk carriers, oil tankers, container ships, chemical tankers, and general cargo ships, accounting for a total of 79.8% of the total number of ships. Referring to the MARPOL Annex VI on the categories of ship types by the attained EEDI, EEXI and CII, the reported ship types are grouped into 11 categories: bulk carrier; tanker, including chemical tankers, oil tankers, and combination carriers (only seven ships); container ship; gas carrier, including LPG, ethylene and other gas ships other than LNG; LNG carrier; general cargo ship, including general cargo ships and other ship types; refrigerated cargo carrier; cruise passenger ships, including passenger ships and cruise passenger ships; ro–pax ship; ro–ro cargo ship, including ro–ro ships, and container/ro–ro cargo ships; and vehicle carrier.
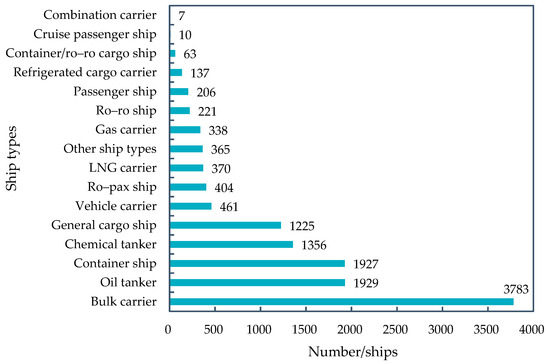
Figure 3.
Types and quantities of ships related to EU ports in 2023.
3.1.2. Statistical Analysis on Ship Operational Profiles
According to the spreadsheet of the 2023 MRV publication of information, there are 12,802 ships with a gross tonnage of 5000 and above under the regulation of the EU MRV. The total deadweight tonnage (DWT) is 755.3 million DWT, and the total gross tonnage (GT) is 558.9 million GT. In 2023, the total fuel consumption of ships related to the EU MRV is 41.4 million tons, and the total CO2 emissions are 128.3 million tons. Among them, CO2 emissions which occurred within EU ports at berth, CO2 emissions from all voyages between EU ports, CO2 emissions from all voyages which departed from EU ports, and CO2 emissions from all voyages to EU ports are 8.3, 35.8, 40.5, and 43.7 million tons.
As a comparison, according to the 2023 Report of fuel oil consumption data submitted to the IMO Ship Fuel Oil Consumption Database in the the Global Integrated Shipping Information System (GISIS) [50], 28,620 ships out of a potential 35,143 ships globally with gross tonnage of 5000 and above, which were estimated to fall under the scope of Regulation 27 of MARPOL Annex VI, submitted data to the IMO GISIS. The comparison of data from the EU MRV and IMO DCS in 2023 is shown in Table 1. The number and gross tonnage of ships related to the EU MRV accounts for 44.7% and 43%, but their fuel consumption and CO2 emissions account for 19.6%, which probably attributes to shorter distance travelled and time spent at sea for the monitored fleet by the EU MRV than the global fleet; meanwhile, as discussed later, distance travelled and time spent at sea for voyages outside the scope of the EU MRV regulation are not monitored.

Table 1.
Comparison of data from EU MRV and IMO DCS in 2023.
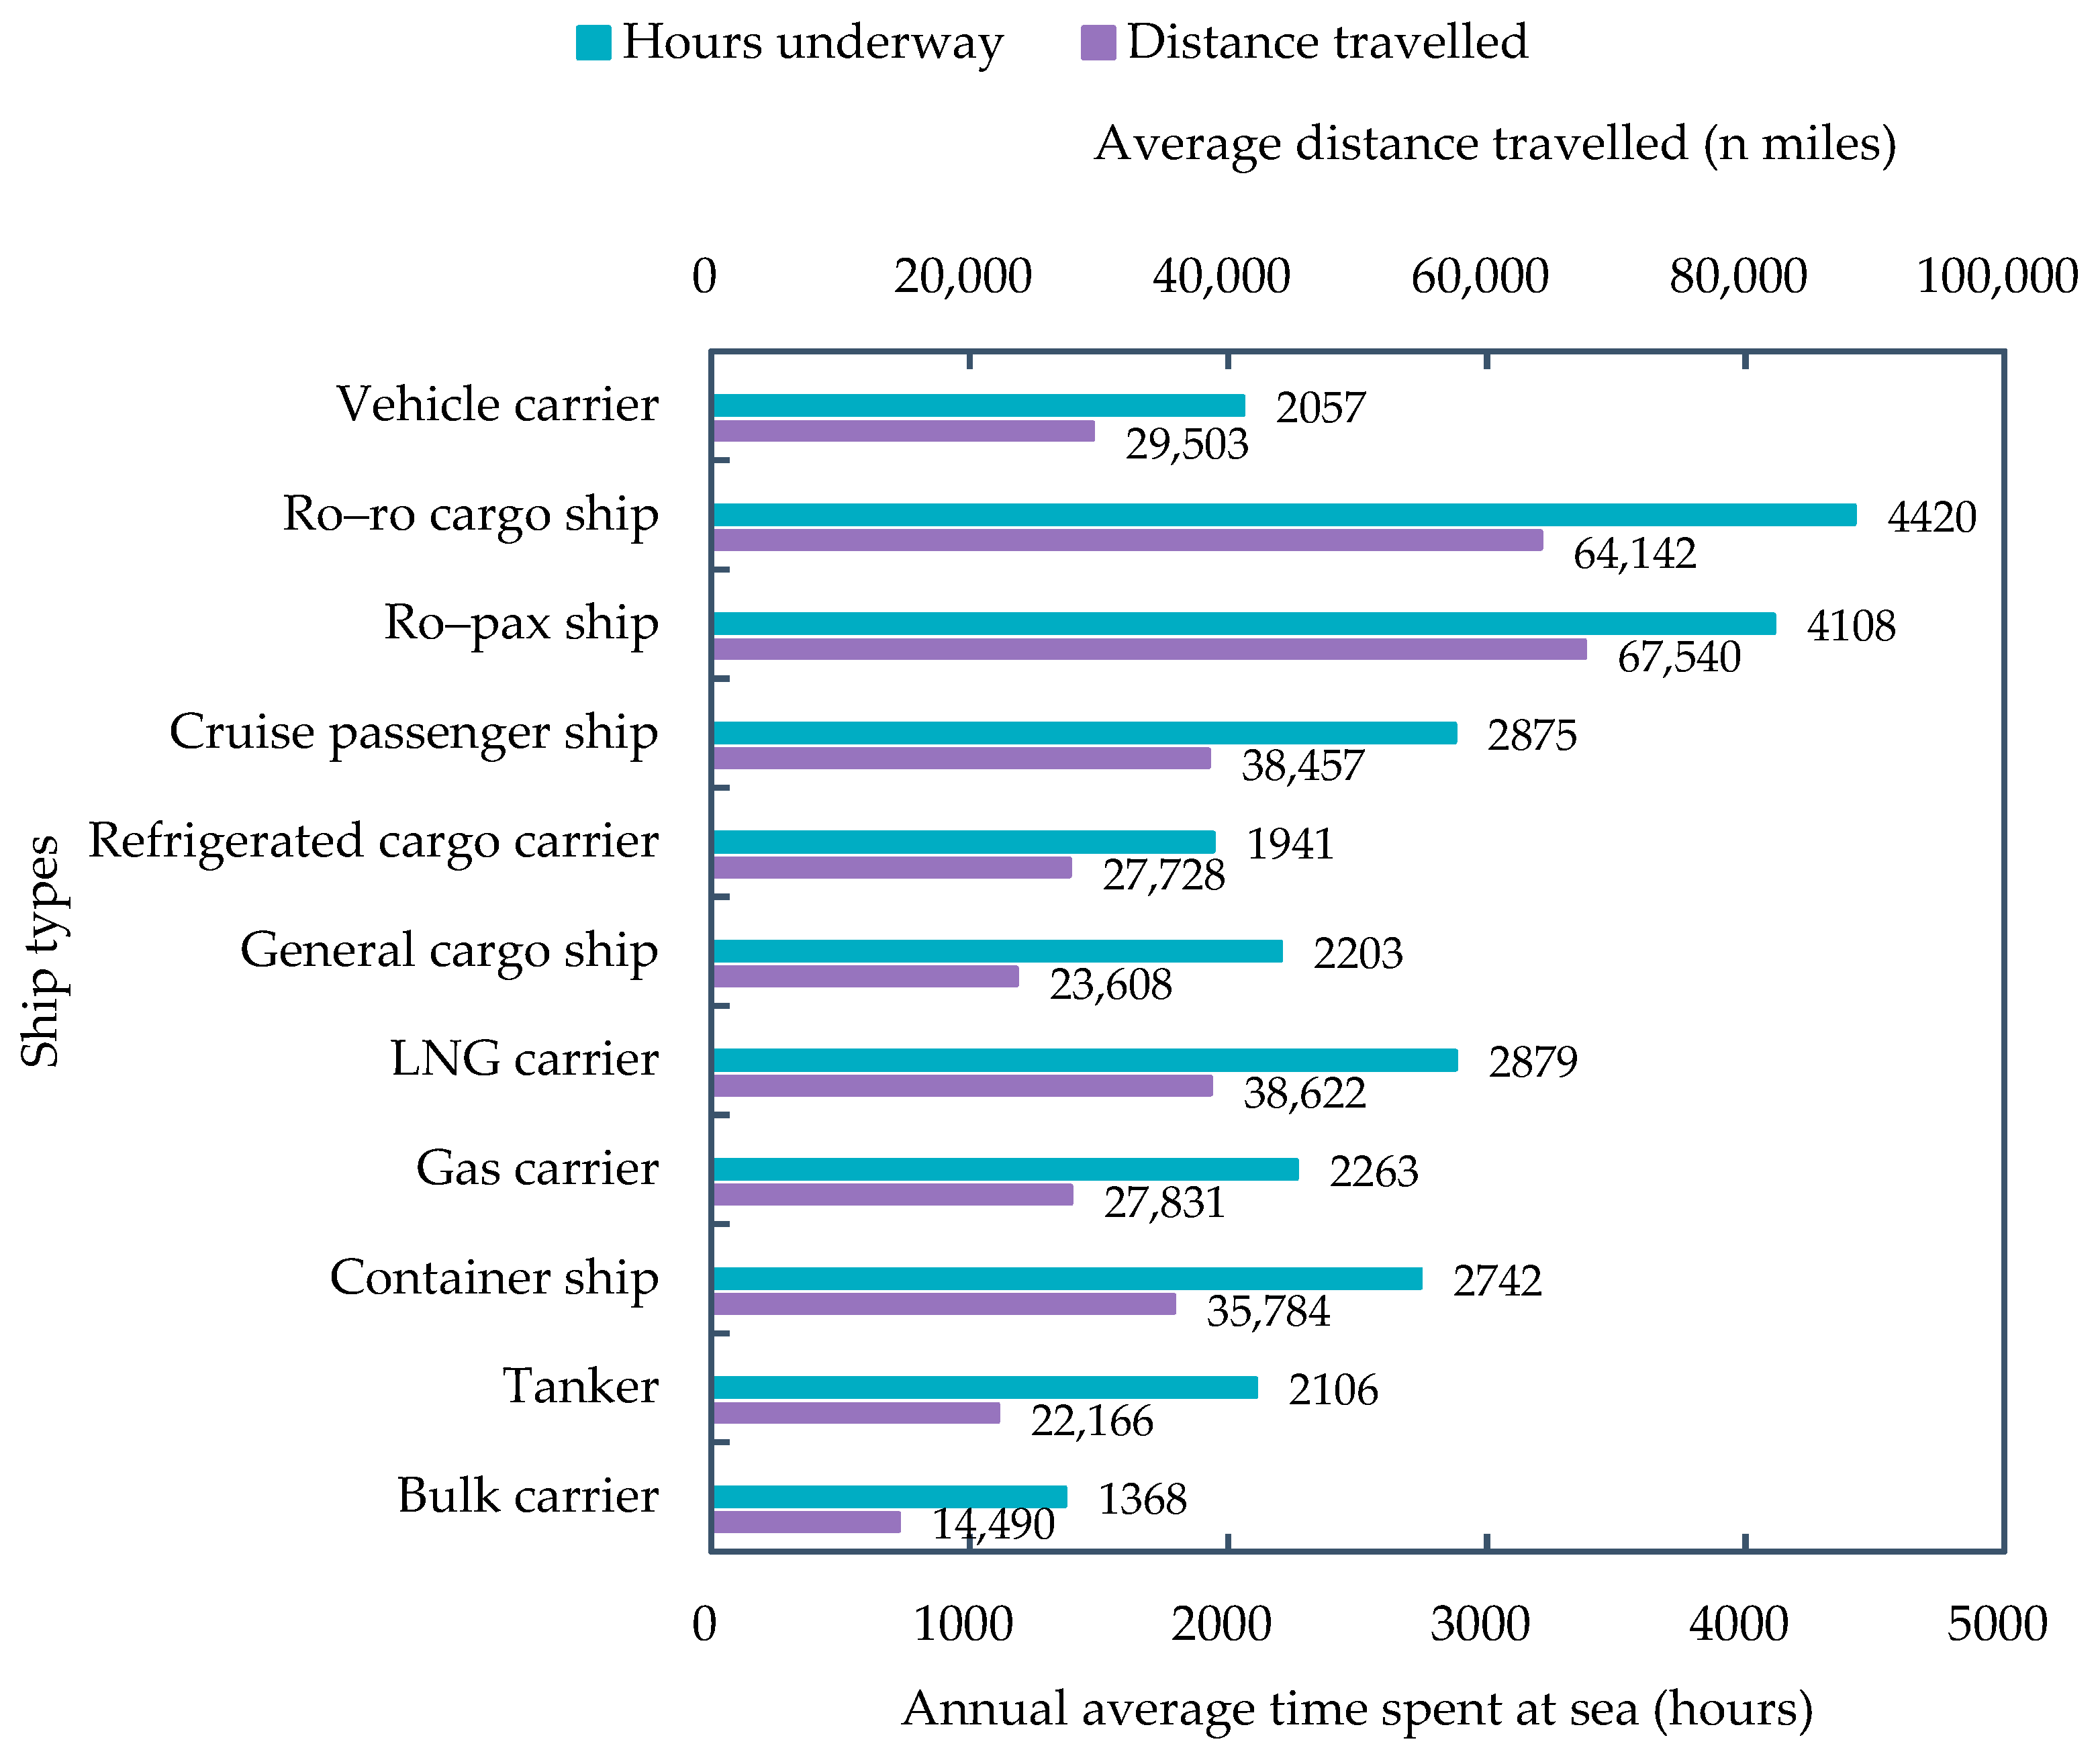
The time that ships spent at sea and the distance that ships travelled within the scope of the EU MRV during a reporting year can be different depending on ship types, due to their different operational profiles. However, for a certain type of ship, there is no statistical pattern between hours underway or distance travelled and the size of ships. That is to say, regardless of the tonnage of a certain type of ship, the distribution of time spent at sea and distance travelled is broad. Nonetheless, the operational profiles of different ship types could be shown by the average time spent at sea and the average distance travelled. Statistically averaged annual hours underway and distance travelled by ship type for ships within the scope of the EU MRV in 2023 are shown in Figure 4.
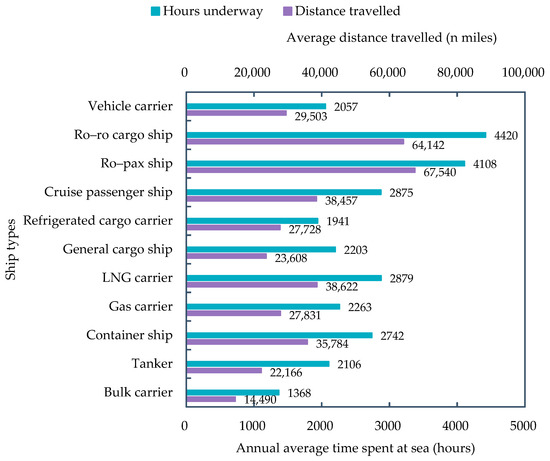
Figure 4.
Annual time spent at sea and distance travelled by ship type.
According to Article 9 of Regulation (EU) 2015/757, data monitoring and reporting are on a per-voyage basis; even though there is a monitoring on an annual basis (in accordance with Article 10), the values are determined by aggregation of the respective per-voyage data. That is to say, only the time spent at sea and distances travelled on voyages within/approaching to/departing from EU/EEA ports are monitored and reported under the EU MRV mechanism, while voyage data unrelated to the EU MRV regulation is not monitored. Ro–ro cargo and ro–ro passenger ships have a higher average time at sea, since these ship types often sail according to a regular route and totally within the EU waters or starting from/ending to an EU port; bulk carriers, refrigerated cargo carriers and tankers have a lower average time at sea, since these ship types are often operating world-wide without a fixed route, often outside the EU waters, and only part of their time at sea is reported in EU MRV. In terms of distance travelled, there are similar conclusions: Ship types with a regular route have a higher average distance travelled, such as ro–ro cargo and ro–ro passenger ships with average distance travelled above 60,000 nautical miles; while ship types are often engaged in tramp trade or operating world-wide have a lower average distance travelled, such as bulk carriers, tankers and general cargo ships. As a result, bulk carriers have the lowest average time spent at sea and average distance travelled, which are only 1368 h and 14,490 nautical miles in 2023. Therefore, the time spent at sea and distances travelled for ships reported within the scope of the EU MRV cannot represent the operational profiles of the global fleet.
3.1.3. Monitoring Methods for CO2 Emissions
Regulation (EU) 2015/757 or its amendments have recommended four methods for determining CO2 emissions: Method A, Bunker Fuel Delivery Notes (BDN) and periodic stocktakes of fuel tanks; method B, bunker fuel tank monitoring onboard; method C, flow meters for applicable combustion processes; method D, direct CO2 emissions measurement. As per the 2023 MRV publication of information, the statistical results of the monitoring method used for ships under the jurisdiction of the EU MRV regulation are shown in Figure 5.
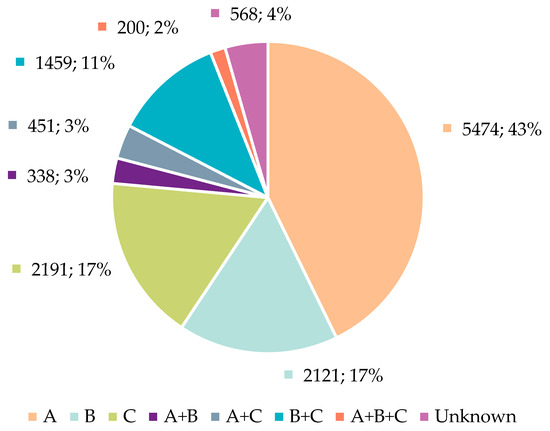
Figure 5.
Methods for monitoring CO2 emissions.
There are 5474, 2121, and 2191 ships using single method A, B, or C to monitor CO2 emissions, accounting for 43%, 17%, and 17%, respectively; there are 2448 ships using a combination of two or three methods to monitor CO2 emissions, accounting for 19%; the monitoring methods for 568 ships are unknown; and currently, no method D is directly reported. Whether it is a single method or a part of a combination of methods, method A is the most commonly used. In fact, method A is used onboard 10,775 ships, accounting for over 84%. Direct CO2 emissions measurement was frequently discussed in the international maritime community. But it does not seem like a reasonable choice, considering the factors such as data accuracy, measurement system reliability, and capital costs. Furthermore, when the well-to-wake GHG fuel intensity (GFI) becomes one of the major issues under the IMO Net-Zero Framework [8], it is meaningless to simply consider high-precision measurements at the end use, i.e., tank-to-wake emissions, and well-to-tank emissions and sustainability themes/aspects should also be considered from the perspective of fuel lifecycle emissions. In this context, it is not recommended for the international maritime industry to invest more time and resources in discussing the issues of direct CO2 emissions measurement.
3.2. Ship Technical Energy Efficiency
The energy efficiency of ships can be measured in terms of technical or operational energy efficiency and by means of various metrics. Technical energy efficiency metrics aim at measuring the energy consumption/emissions of a ship, depending on its design, whereas operational efficiency metrics also account for how a ship is operated. For all the metrics in this section, the lower the value, the higher the efficiency of the ship. The year 2023 represents the sixth reporting year of the EU MRV system. Meanwhile, the EEXI and CII under the IMO regulatory framework are required to report as of 1 January 2023. Thus, a substantial amount of data on reporting ships has become available, allowing for an assessment of the evolution of both the technical and operational energy efficiency of the monitored fleet, and also the robustness of the reported data.
However, there are still a large number of new ships (3171 ships) with gross tonnage of 5000 and above reported as EIV, but it cannot be ruled out that their actual technical energy efficiency values may be calculated based on the attained EEDI/EEXI. Excluding null values, zero values, EIV, and Not Applicable, there are 9290 ships that reported EEDI or EEXI values. Then six extreme outliers were manually removed, and the EEDI and EEXI values of 9284 ships were used for fitting by ship type. Using the 9284 selected ships as analysis samples, the regression analysis of ship technical energy efficiency was conducted based on the 11 ship types. The results are shown in Figure 6.
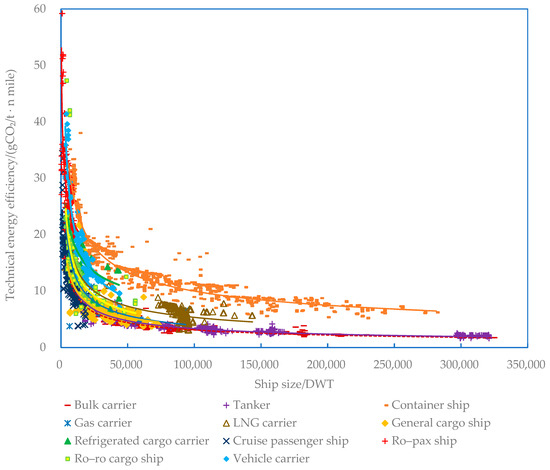
Figure 6.
Technical energy efficiency characteristics of ships related to EU ports.
In Figure 6, the ship deadweight tonnage is taken as the horizontal axis, and the ship technical energy efficiency is taken as the vertical axis. For a certain type of ship, the fitting relationship between technical energy efficiency and the ship’s deadweight tonnage could generally be expressed as a power function:
where Y represents the technical energy efficiency, i.e., EEDI or EEXI, gCO2/(t · n mile); X is the deadweight tonnage, DWT; a and c are the coefficients.
When conducting regression analysis, the technical energy efficiency of ships was not distinguished between EEDI and EEXI, but rather merged together for processing. The relevant parameters obtained from regression analysis are shown in Table 2.
Table 2.
Statistical analysis of technical energy efficiency and the fitting results.
As reflected by the fitted curves, there is a trend of decreased technical energy efficiency metrics, i.e., increased energy efficiency performance, as the ship tonnage increases, which is a reflection of the effect of scale in terms of technical energy efficiency; bulk carriers and tankers have the best energy efficiency performance, and have approximately overlapping fitting curves; container ships and refrigerated cargo ships have relatively poor energy efficiency performance, with the former attributed to their higher design speed, while the latter may be attributed to energy consumption caused by the refrigeration of their cargo. The technical energy efficiency and deadweight tonnage of bulk carriers, tankers, container ships, and gas carriers have a good fit, and the established technical energy efficiency expression formulas have high credibility; however, the correlations between the technical energy efficiency of refrigerated cargo ships, ro–pax ships, and ro–ro cargo ships are relatively weak. The expression of ship technical energy efficiency obtained here is not perfect for some ship types, but it can still serve as an effective reference for research on ship fuel consumption, exhaust emissions, and trend analysis of ship technical energy efficiency.
3.3. Ship Operational Energy Efficiency
3.3.1. Annual Average CO2 Emissions per Distance
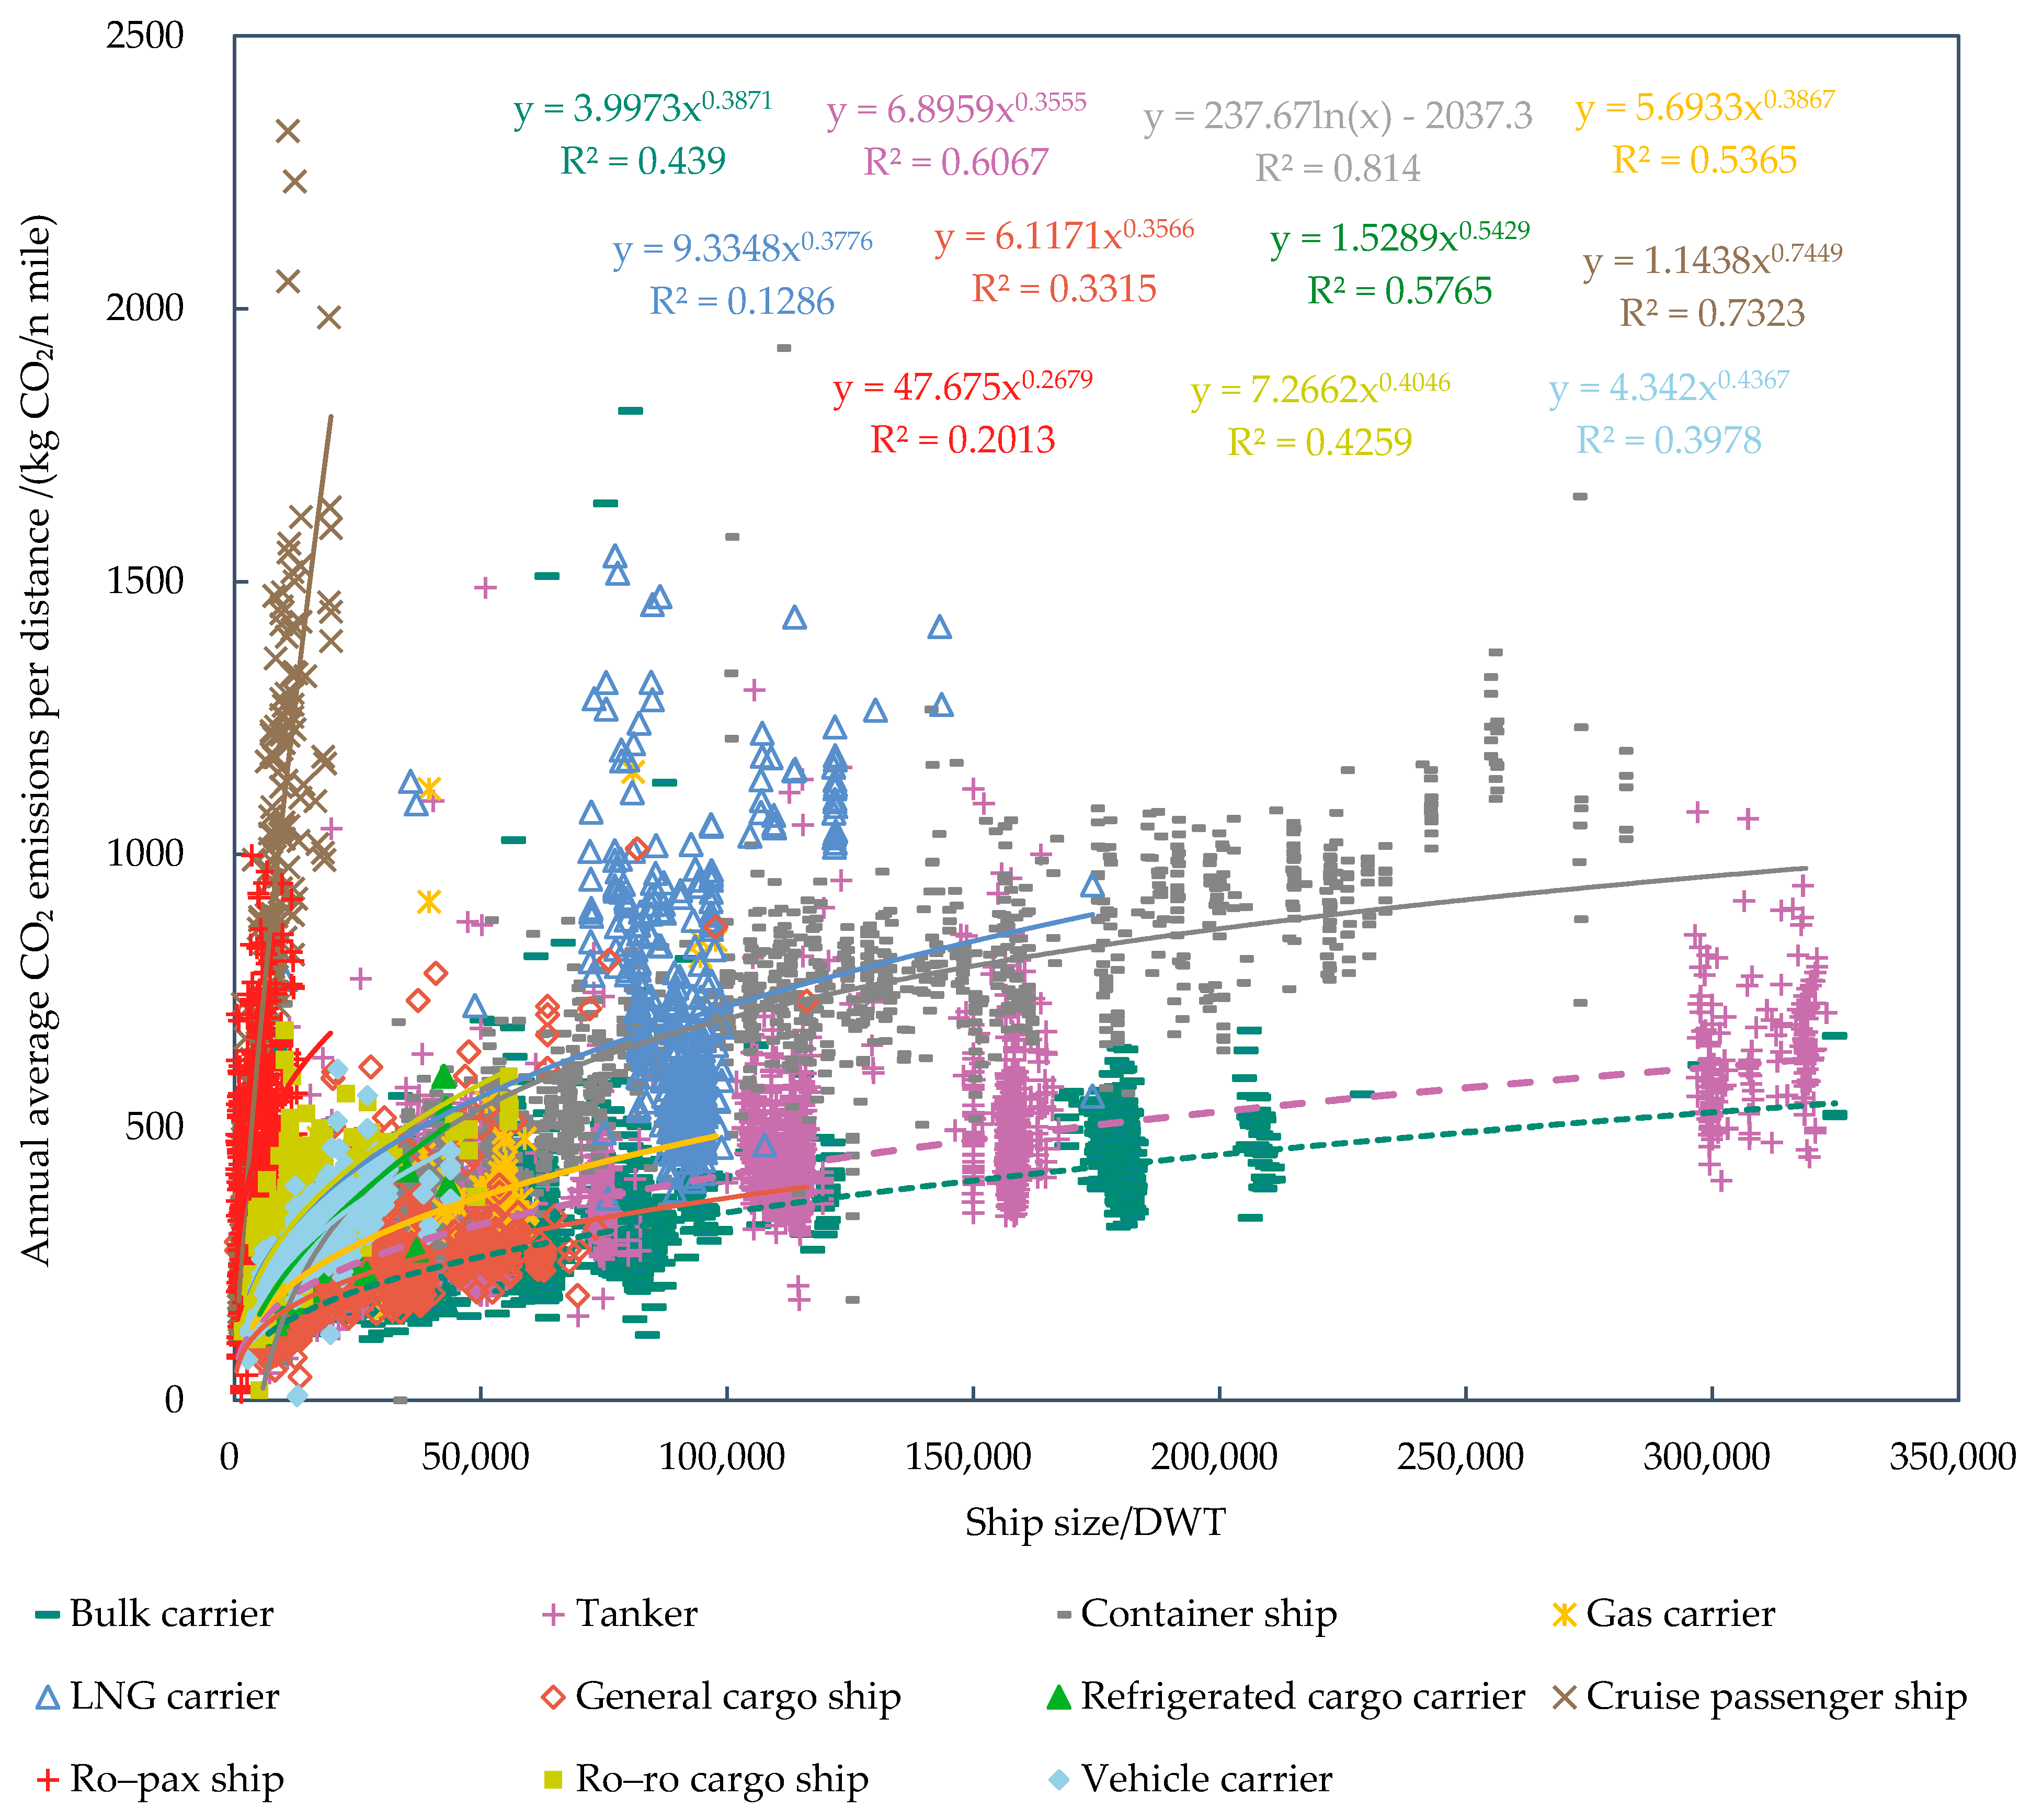
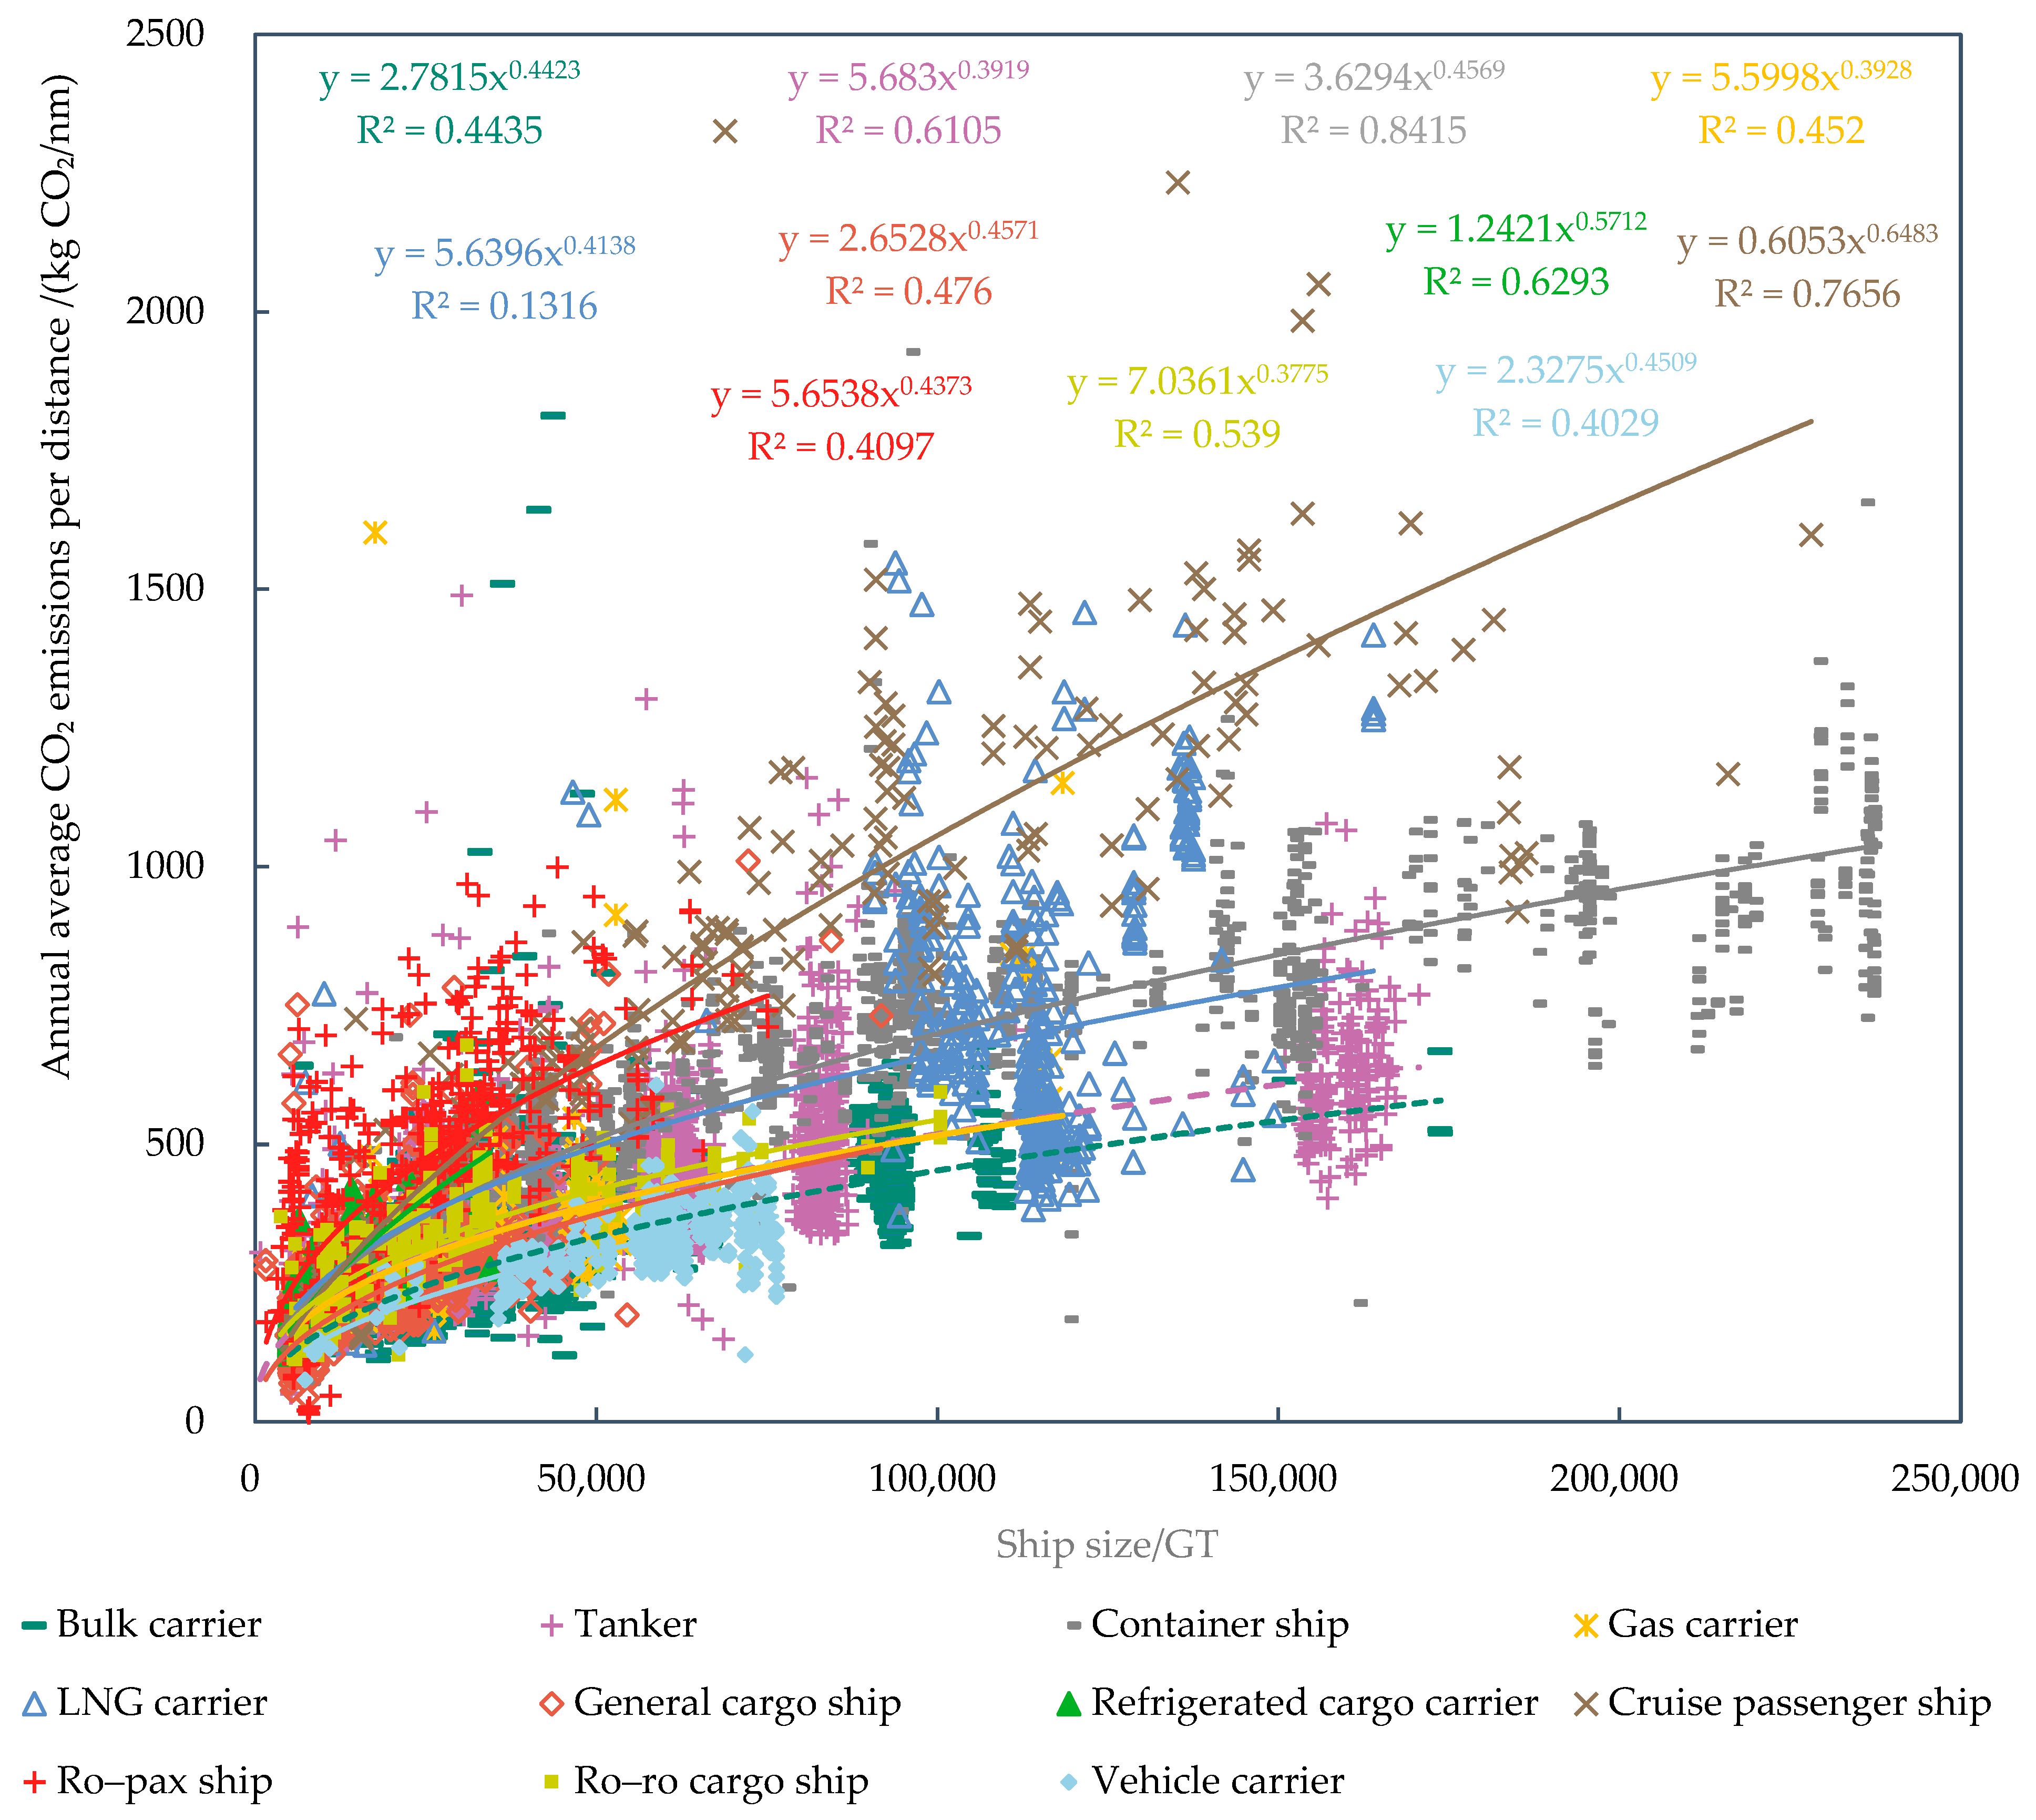
Annual average CO2 emissions per distance, using the distance travelled as a proxy for transport work and once expressed as ISPI, is a mandatory indicator stipulated by the EU MRV. Annual average CO2 emissions per distance for various ship types are shown in Figure 7 and Figure 8. For each type of ship, the annual average CO2 emissions per distance increase with the size of the ship. However, the data is relatively scattered and cannot be quantitatively expressed through fitting the relationship between annual average CO2 emissions per distance and ship size. Taking the annual average CO2 emissions per distance of 12,802 ships as samples and without considering the type of ship, the correlation between annual average CO2 emissions per distance and ship gross tonnage could be expressed as a whole in a general equation: ISPI = 2.7682 × GT0.4604 (R2 = 0.6107); or ISPI = 0.0042 × GT + 184.44 (R2 = 0.6205). However, there is no high-quality fitting relationship between annual average CO2 emissions per distance and ship deadweight tonnage.

Figure 7.
Correlations between annual average CO2 emissions per distance and ship deadweight tonnage by ship type.
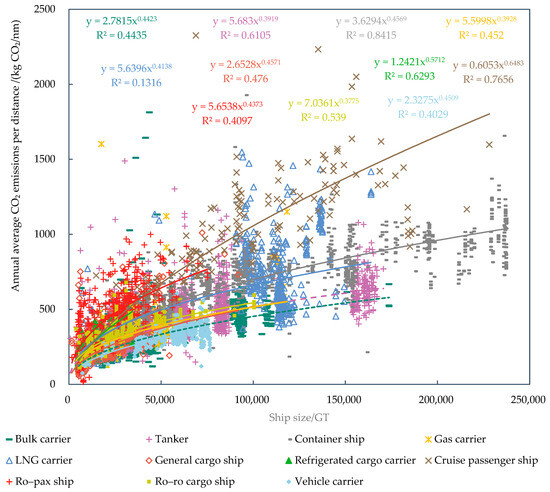
Figure 8.
Correlations between annual average CO2 emissions per distance and ship gross tonnage by ship type.
Considering the relationships between annual average CO2 emissions per distance and ship deadweight tonnage, as shown in Figure 7, annual average CO2 emissions per distance for bulk carriers, tankers, general cargo ships and gas carriers are relatively low; while they are relatively high for cruise passenger ships and ro–pax ships; container ships, LNG carriers, refrigerated cargo carriers, ro–ro cargo ships and vehicle carriers stay in the middle. Considering the relationships between annual average CO2 emissions per distance and ship gross tonnage, as shown in Figure 8, annual average CO2 emissions per distance for different ship types have the similar pattern, i.e., bulk carriers, tankers, general cargo ships and gas carriers have relatively high energy efficiency, while cruise passenger ships and ro–pax ships have relatively low energy efficiency.
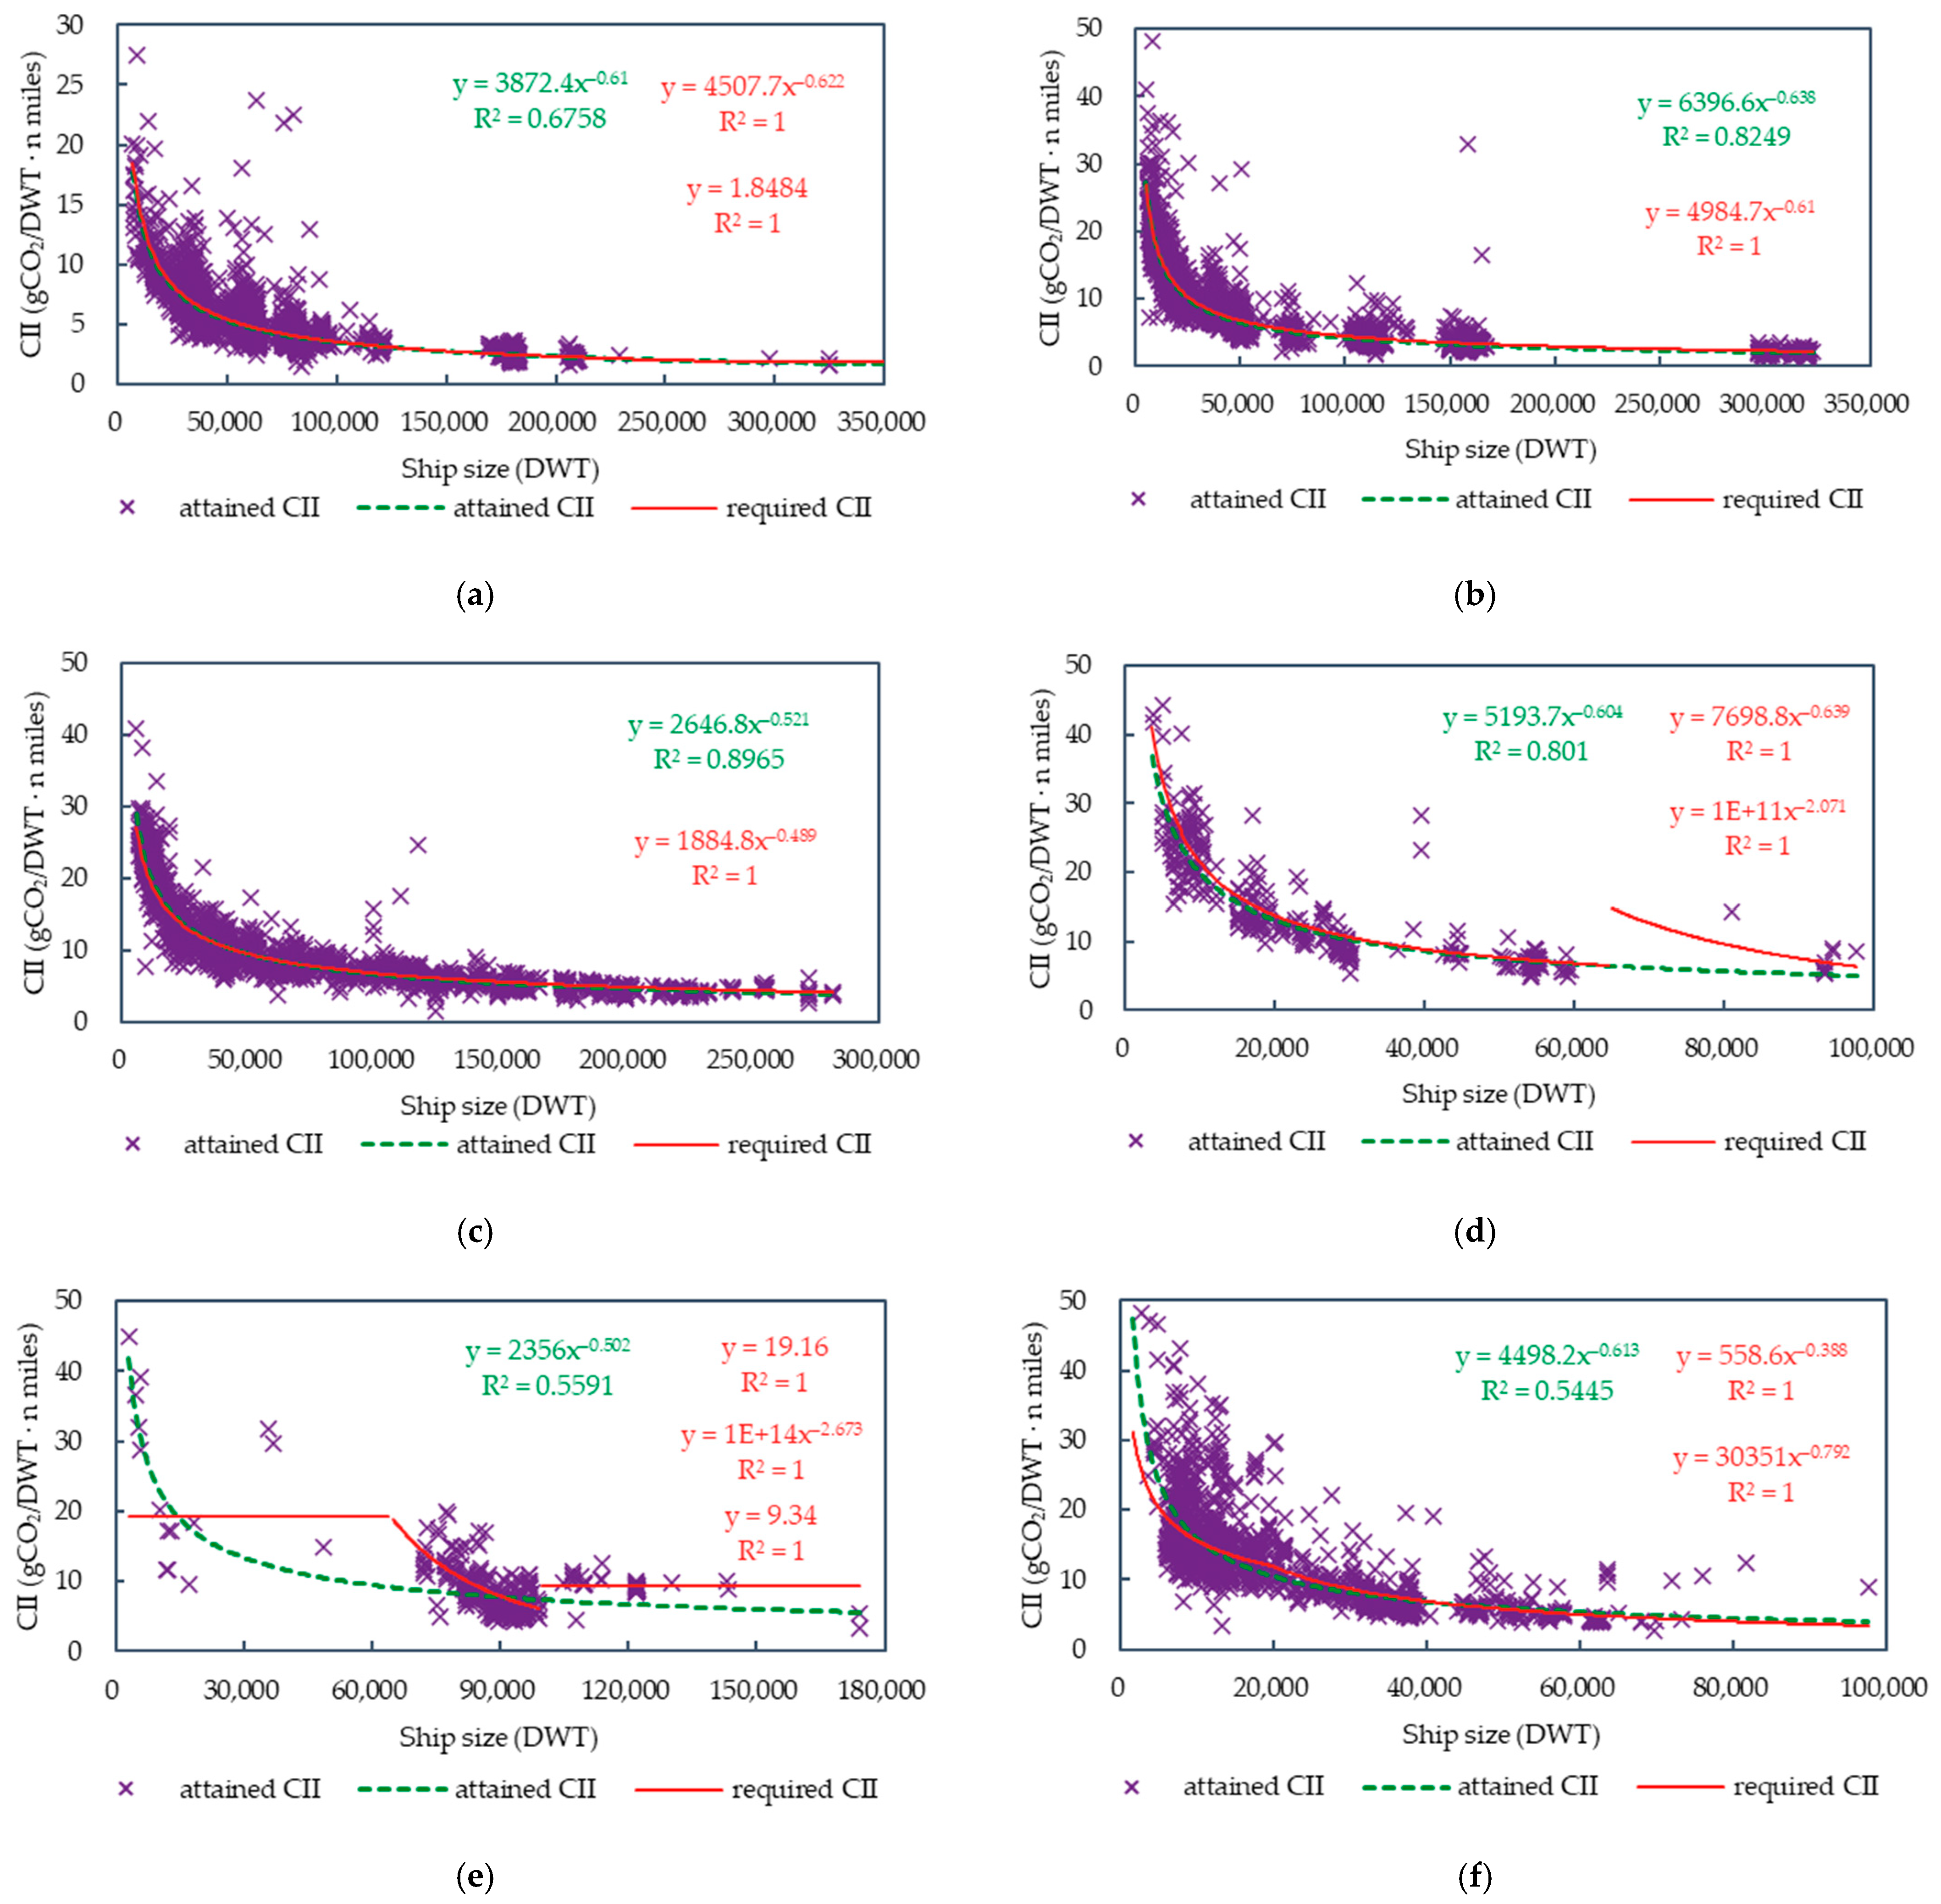
3.3.2. Annual Operational Carbon Intensity Indicators
Technical energy efficiency metrics aim at measuring the energy consumption/emissions of a ship, depending on its design, whereas operational efficiency metrics also account for how a ship is operated. MARPOL Annex VI uses the annual operational CII to quantify the CO2 emissions per transport work. Regarding transport work, which is defined as the product of a ship’s capacity and the distance travelled in a given calendar year, there are different forms of expression, depending on the availability of data [51]. When the amount of cargo carried and the number of passengers could be obtained, which will substitute for the ship’s capacity, then the CII could be expressed as EEOI. When the amount of cargo carried and number of passengers are unavailable, deadweight tonnage should be used as the ship’s capacity for bulk carriers, tankers, container ships, gas carriers, LNG carriers, general cargo ships, refrigerated cargo carriers, and combination carriers; then the CII is expressed as AER; and gross tonnage should be used as the ship’s capacity for cruise passenger ships, vehicle carriers, ro–ro cargo ships, and ro–ro passenger ships, then the CII is expressed as cgDIST. The MRV publication of information includes annual average CO2 emissions per distance, combining with the ship’s DWT or GT, then the CII values expressed as AER or cgDIST can be obtained. Based on the above analysis, the operational energy efficiency expressed in CII by ship type was displayed by means of a graphical analysis and regression analysis, as shown in Figure 9. Average annual carbon intensity as per ship type was listed in the IMO DCS annual report for the reporting of 2023 [50]. As a reference, they are presented here. AERs for bulk carrier, tanker, combination carrier, containership, gas carrier, LNG carrier, general cargo ship, others, refrigerated cargo carrier, and passenger ship are 3.45, 3.88, 4.39, 7.31, 8.11, 8.50, 9.34, 25.58, 20.01, and 97.26 gCO2/DWT · n miles; cgDISTs for cruise passenger ship, ro–ro passenger ship, ro–ro cargo ship, and vehicle carrier are 10.66, 17.31, 10.91, and 5.69 gCO2/GT · n miles. However, the correlations between AER and DWT or between cgDIST and GT derived from this article have more potential for further academic research or policy making.
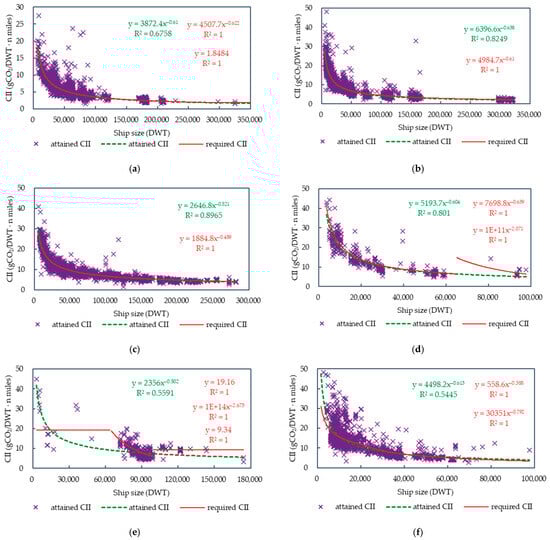
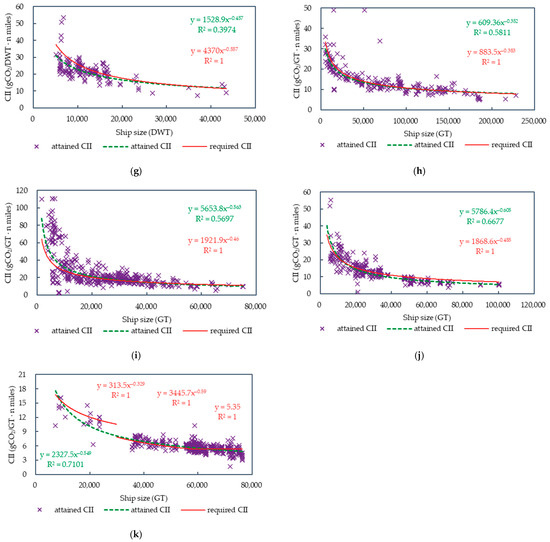
Figure 9.
Statistical analysis of CII in 2023 by ship type. (a) Bulk carrier. Three samples with CII above 50 gCO2/DWT · n miles out of 3659 were manually excluded. (b) Tanker. Six samples with CII above 50 gCO2/DWT · n miles out of 3284 were manually excluded. (c) Container ship. Two samples with CII above 50 gCO2/DWT · n miles and three samples with CII below 1 gCO2/DWT · n miles out of 1922 were manually excluded. (d) Gas carrier. Three samples with CII above 50 gCO2/DWT · n miles out of 338 were manually excluded. (e) LNG carrier. Seven samples with CII above 50 gCO2/DWT · n miles out of 369 were manually excluded. (f) General cargo ship. Ten samples with CII above 50 gCO2/DWT · n miles out of 1534 were manually excluded. (g) Refrigerated cargo carrier. 137 samples were all included. (h) Cruise passenger ship. One sample with CII = 22,033.11 gCO2/GT · n miles out of 216 were manually excluded. (i) Ro–pax ship. Three samples with CII above 130 gCO2/GT · n miles out of 401 were manually excluded. (j) Ro–ro cargo ship. One sample with CII = 99.29 gCO2/GT · n miles out of 284 were manually excluded. (k) Vehicle carrier. Two samples with CII below 1 gCO2/GT · n miles out of 460 were manually excluded.
According to Resolution MEPC.338(76) on CII Reduction Factors Guidelines (G3) [52], the reduction factor (Z%) for the CII in 2023 is 5%, relative to the 2019 reference line value (RLV) [53]. As a comparison, the required annual operational CII, which is calculated by taking into account the RLV values and reduction factor (Z% = 5%), was displayed in Figure 9 as well. For different ship types, some data for the calculation of the operational energy efficiency are manually excluded based on different standards, but this does not mean that these excluded data are incorrect, nor does it mean that all retained data are correct, just for better graphical display.
The operational energy efficiency data of different ship types have been fitted using power functions, but due to the relatively discrete distribution of these data, not all fitting formulas have a high coefficient of determination. In Figure 9, for different ship types, the fitting curves of attained CII values (green lines) are generally lower than the required CII values in 2023 (red lines). That is to say, for ships within the scope of EU MRV regulation, they are in compliance with the IMO requirements in general. On the whole, the operational energy efficiency of ships related to EU ports is improving gradually, and roughly speaking, there has been at least 5% improvement since 2019, but with an annual operational energy efficiency improvement of less than 2%. However, the fitting curves of attained CII are statistically averaged results. Whether a specific ship is compliant depends on its rating, while this article did not rate these ships based on the IMO framework of the operational energy efficiency performance rating [54]. In addition, the MEPC 83 session has adopted the amendments to the Resolution MEPC.338(76) on CII reduction factors guidelines, where a reduction factor of 21.5% in 2030 compared to 2019 is required [8], with an annual operational energy efficiency improvement of 2.18%. However, the effectiveness of energy efficiency improvement has been proven to gradually weaken [55,56], which means traditional energy efficiency measures are insufficient to achieve carbon intensity reduction targets, and innovative energy efficiency measures, such as wind-assisted propulsion, onboard carbon capture and storage, and alternative marine fuels, are required.
In Figure 9, the ship deadweight tonnage or gross tonnage is taken as the horizontal axis, and the attained annual operational CII is taken as the vertical axis. For a certain type of ship, the fitting relationship between attained annual operational CII and the ship’s capacity could be expressed as a power function:
where Attained CII represents the attained annual operational CII, i.e., AER or cgDIST, gCO2/(DWT · n mile) or gCO2/(GT · n mile); Capacity is the capacity, DWT or GT; a and c are the coefficients. The relevant parameters obtained from regression analysis are shown in Table 3.
Table 3.
Statistical analysis of attained annual operational CII and the fitting results.
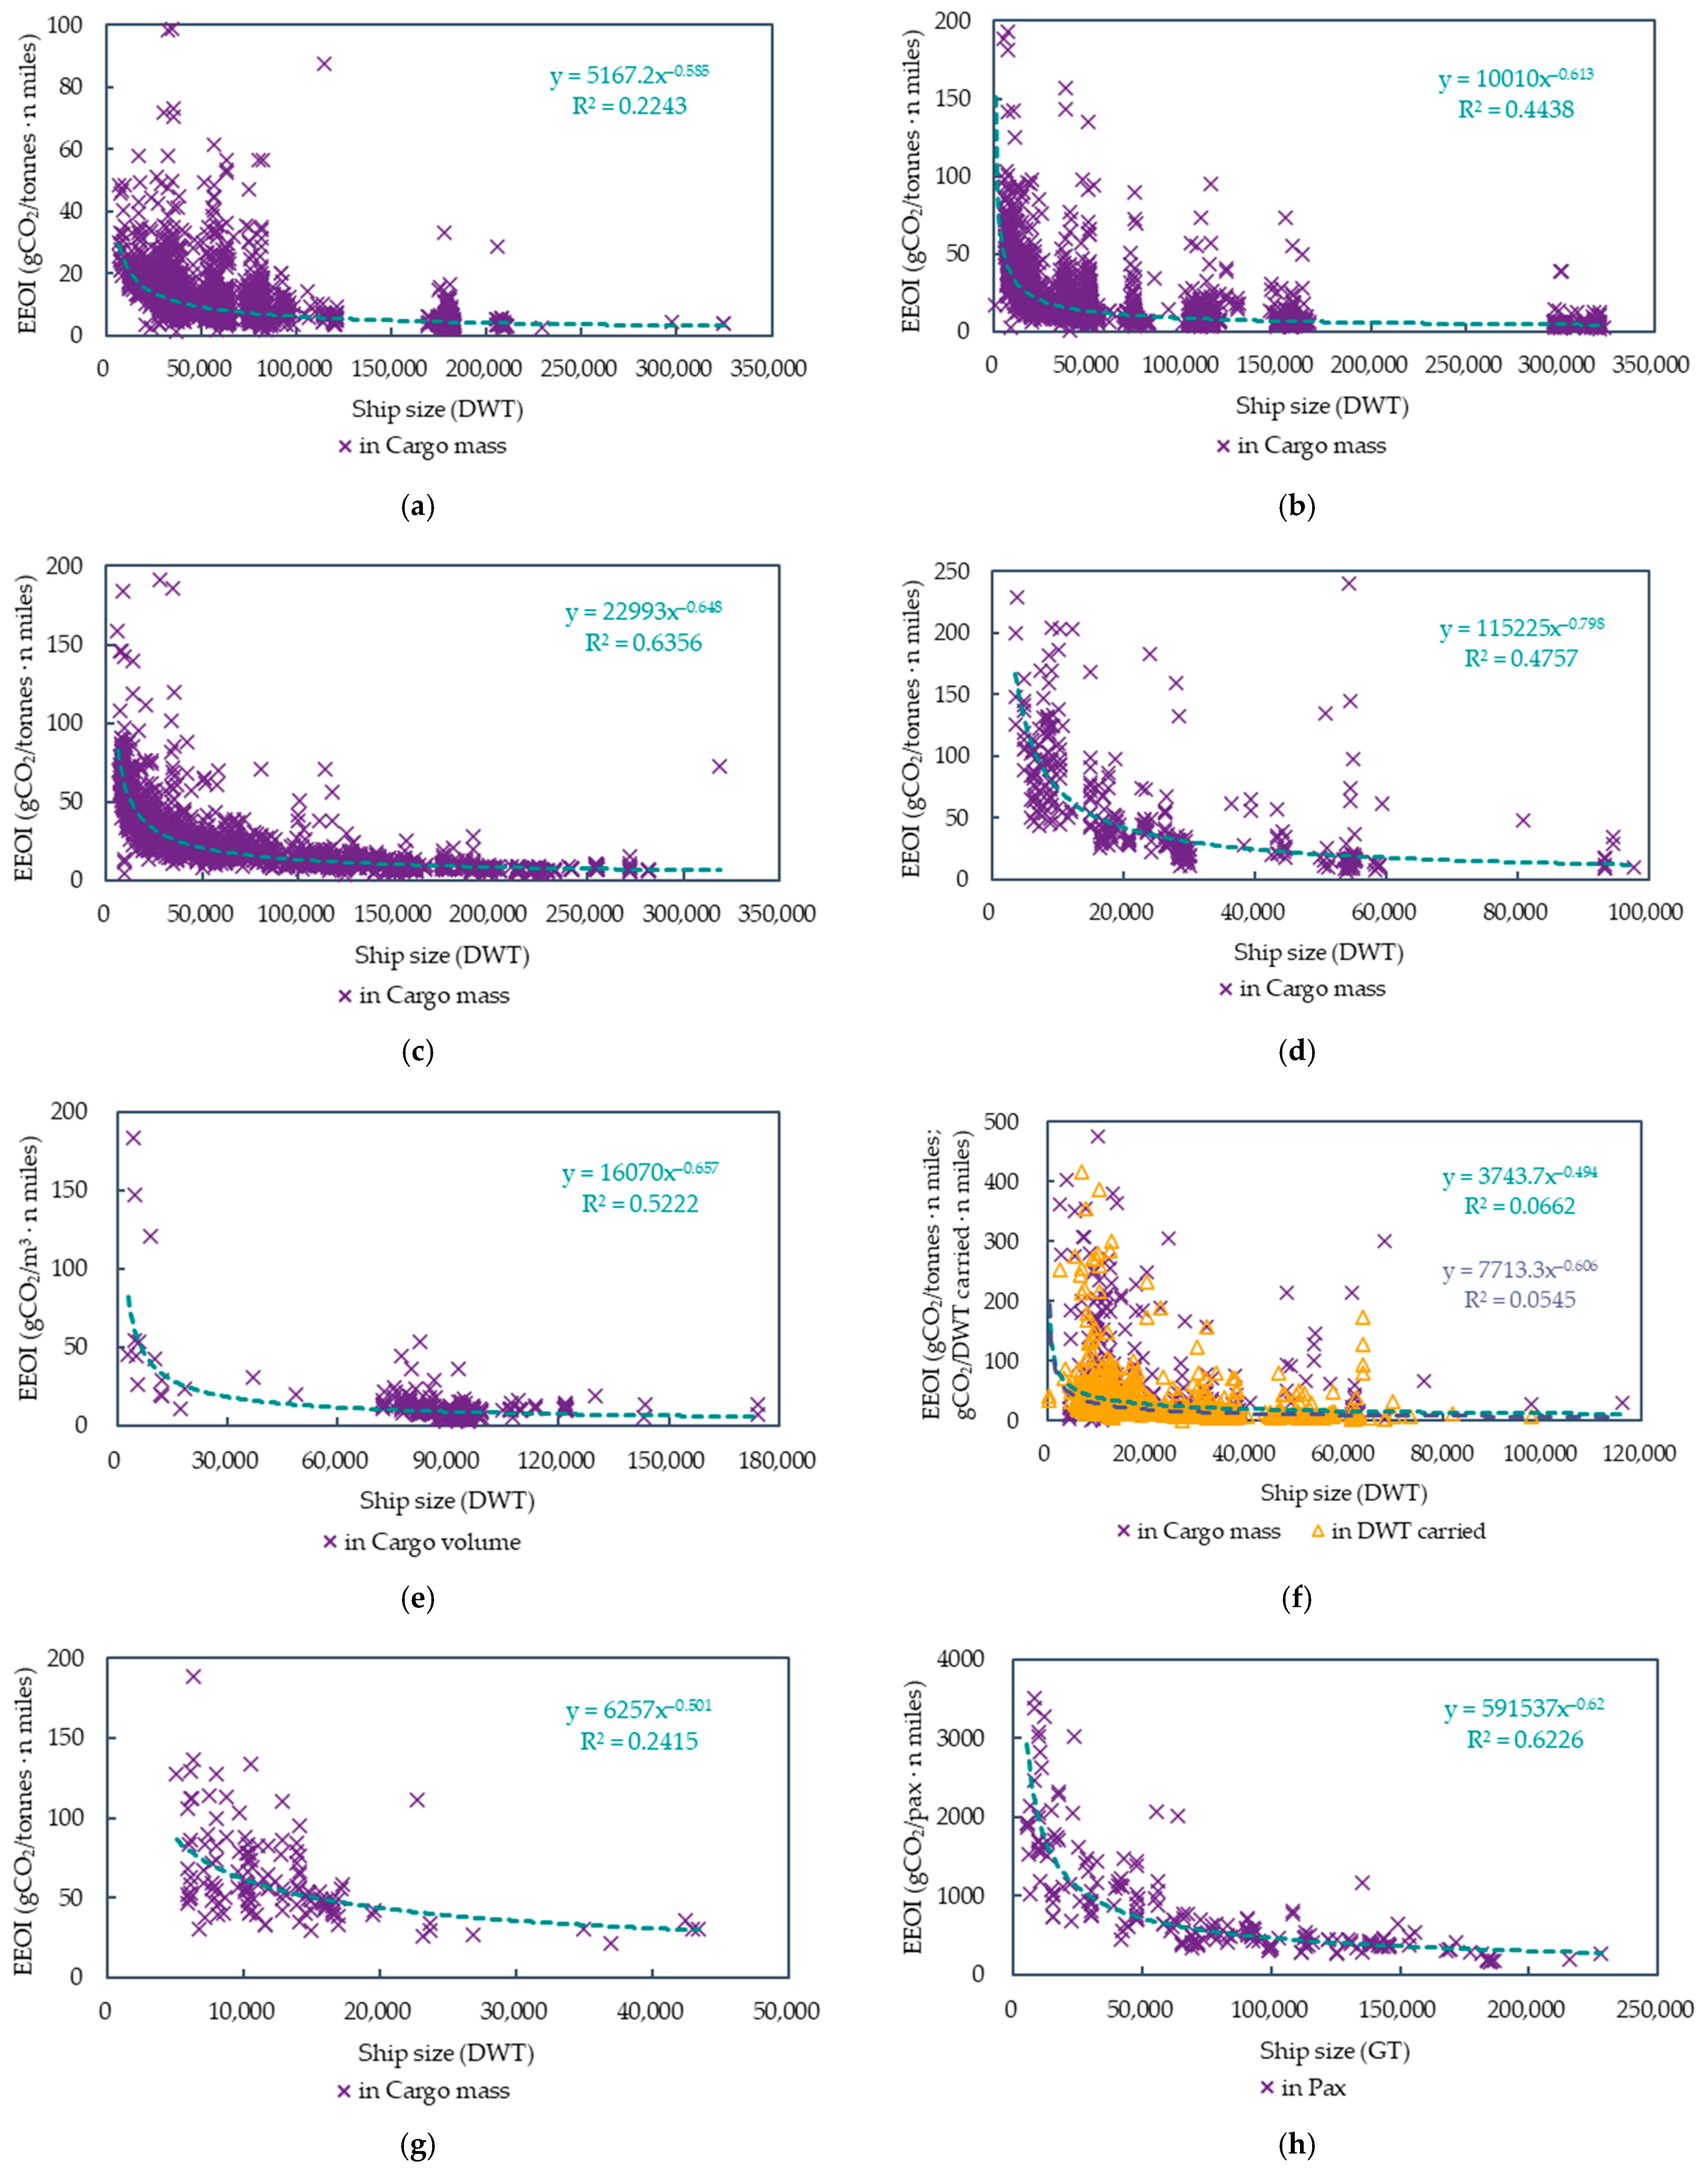
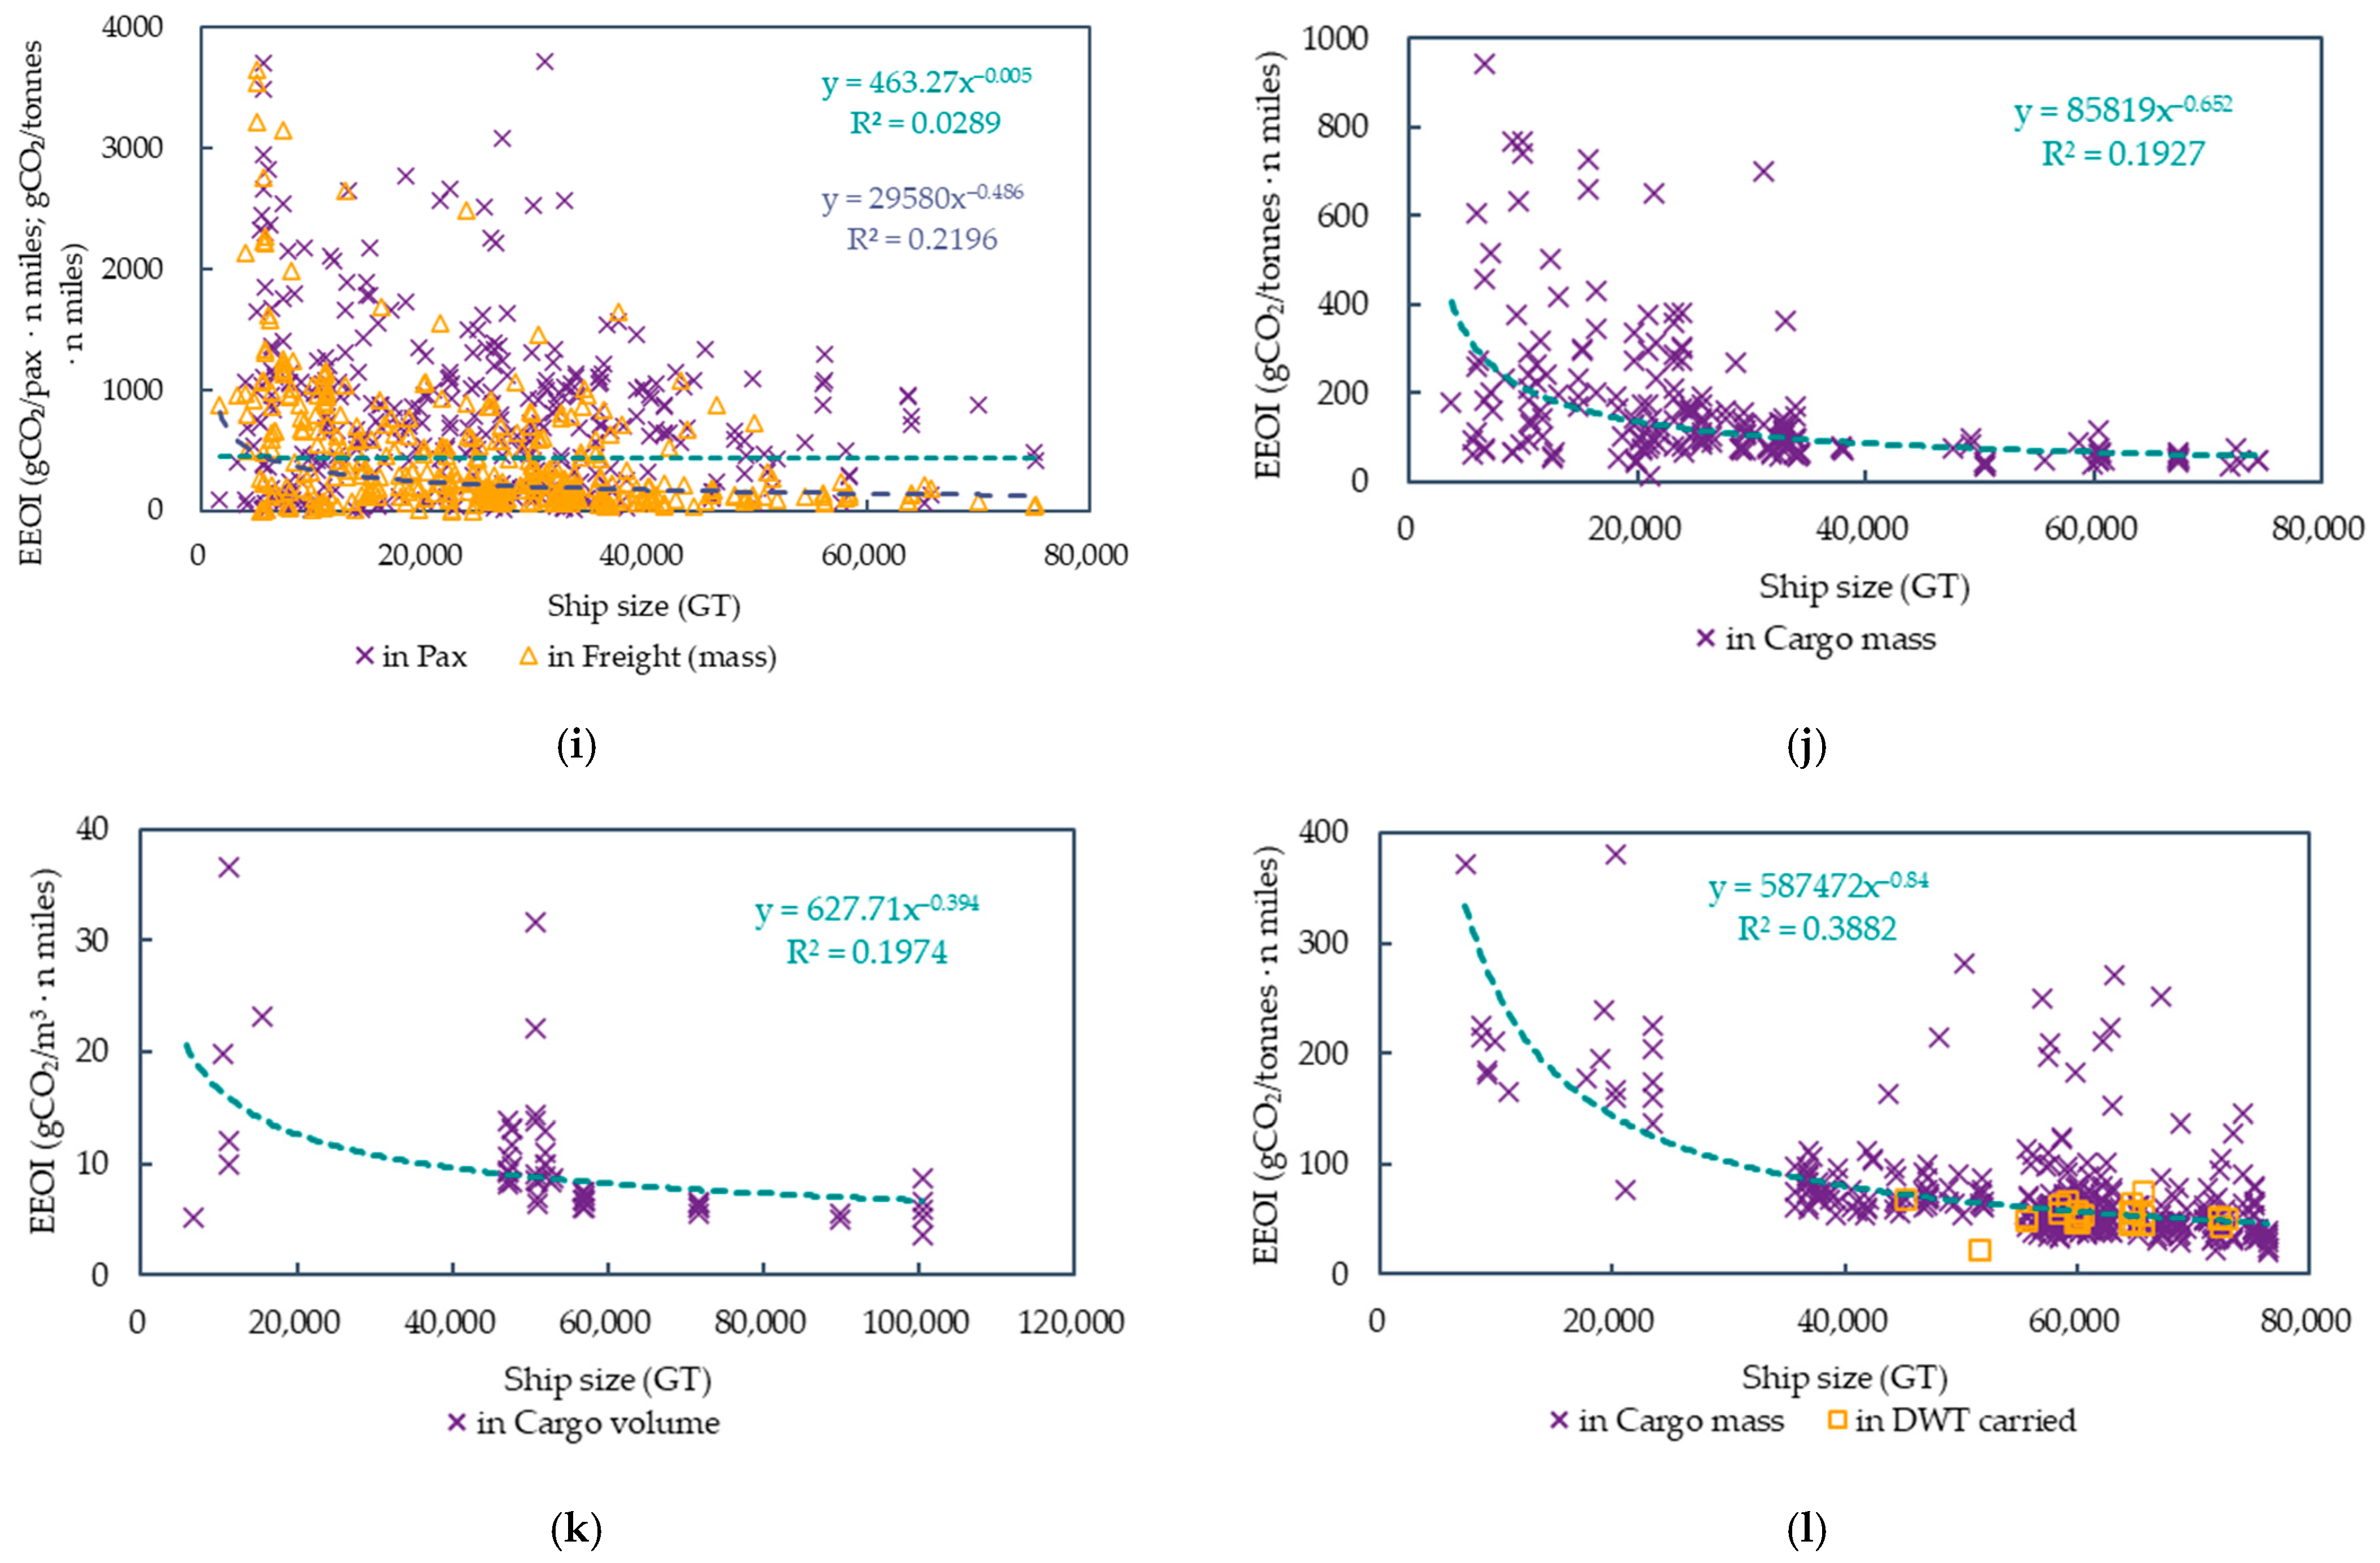
3.3.3. Energy Efficiency Operational Indicator (EEOI)
Under the IMO framework, the amount of cargo carried and the number of passengers are currently not mandatory to report, so EEOI is just a metric for voluntary use. However, Regulation (EU) 2016/1927 has indicated the templates for monitoring plans pursuant to Regulation (EU) 2015/757 on monitoring, reporting, and verification of CO2 emissions from maritime transport. Transport work is expressed as the product of distance travelled times the amount of cargo carried over the period. Meanwhile, the amount of cargo carried and/or the number of passengers under the EU regulations are mandatory to report, but they are different depending on the ship types. An overview of the metrics applied under the EU MRV to the different ship types is shown in Table 4.
Table 4.
Requirements for cargo/passengers reported by ship type.
The 2023 MRV publication of information includes annual average CO2 emissions per transport work (mass), annual average CO2 emissions per transport work (volume), annual average CO2 emissions per transport work (DWT carried), annual average CO2 emissions per transport work (pax) and annual average CO2 emissions per transport work (freight), which are applicable for different ship types as listed in Table 4. Furthermore, the operational energy efficiency expressed in EEOI by ship type was displayed by means of a graphical analysis and regression analysis as well, as shown in Figure 10. Similarly, some operational energy efficiency data are manually excluded based on different standards for different ship types, but this does not mean that these excluded data are incorrect, nor does it mean that all retained data are correct, just for better graphical display. The operational energy efficiency data of different ship types have been fitted using power functions, but due to the relatively discrete distribution of these data, the resulting fitting formulas probably have no substantive significance and are mainly used for display.
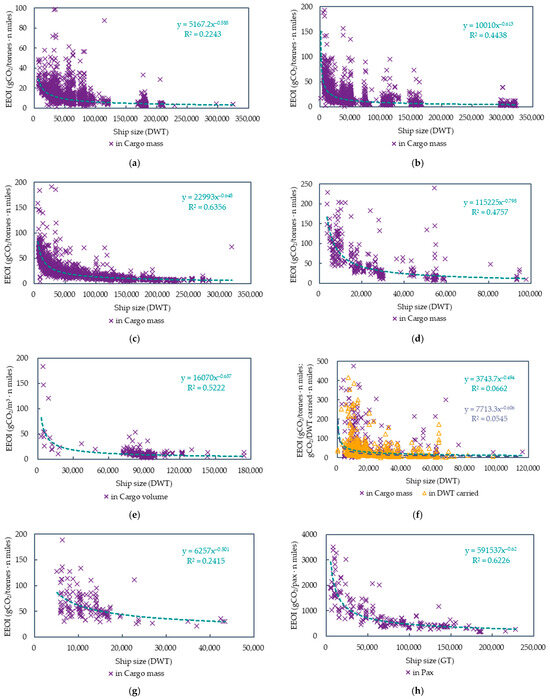
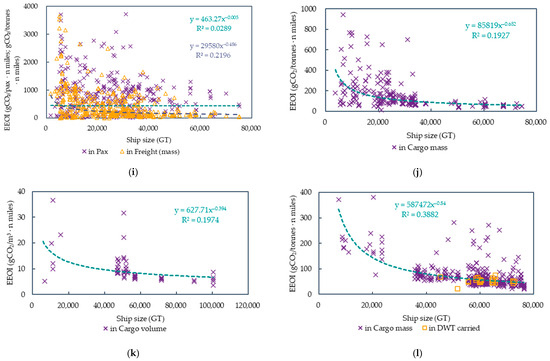
Figure 10.
Statistical analysis of EEOI by ship type. (a) Bulk carrier. Fifty samples with EEOI above 100 gCO2/tonnes · n miles out of 3573 were manually excluded. (b) Tanker. Nineteen samples with EEOI above 200 gCO2/tonnes · n miles and eight samples with EEOI below 1 gCO2/tonnes · n miles out of 3161 were manually excluded. (c) Container ship. Eight samples with EEOI above 1000 gCO2/tonnes · n miles and two samples with EEOI below 1 gCO2/tonnes · n miles out of 1920 were manually excluded. (d) Gas carrier. Ten samples with EEOI above 300 gCO2/tonnes · n miles out of 334 were manually excluded. (e) LNG carrier. Nine samples with EEOI above 300 gCO2/m3 · n miles out of 358 were manually excluded. (f) General cargo ship. Thirteen samples with EEOI above 500 gCO2/tonnes · n miles out of 510 and four samples with EEOI above 500 gCO2/DWT carried · n miles out of 1297 were manually excluded. (g) Refrigerated cargo carrier. Four samples with EEOI above 200 gCO2/tonnes · n miles out of 137 were manually excluded. (h) Cruise passenger ship. Ten samples with EEOI above 4000 gCO2/pax · n miles out of 214 were manually excluded. (i) Ro–pax ship. Nine samples with EEOI above 4000 gCO2/pax · n miles and five samples with EEOI below 1 gCO2/pax · n miles out of 394 were manually excluded; meanwhile, six samples with EEOI above 4000 gCO2/tonnes · n miles and five samples with EEOI below 1 gCO2/tonnes · n miles out of 387 were manually excluded. (j) Ro–ro cargo ship. Container/ro–ro cargo ships are not included; four samples with EEOI above 1000 gCO2/tonnes · n miles out of 220 were manually excluded. (k) Container/ro–ro cargo ships. One sample with EEOI above 100 gCO2/m3 · n miles out of 57 was manually excluded. (l) Vehicle carrier. seven samples with EEOI above 400 gCO2/tonnes · n miles and three samples with EEOI below 10 gCO2/tonnes · n miles out of 425 were manually excluded.
The fitting formulas for operational energy efficiency expressed in EEOI generally have a relatively low coefficient of determination, indicating that the model has weak interpretability for the data. That is because the EEOI is defined as the ratio of the mass of CO2 emitted per unit of transport work. Nevertheless, the transport work is expressed as the product of the amount of cargo carried and distance travelled in a given calendar year. In the EU MRV system, the amount of cargo carried is reported as required by mass of the cargo transported, volume of the cargo transported, deadweight carried, number of passengers and/or mass of the freight transported for different ship types, which varies according to the actual cargo carried and is highly influenced by the actual loading of vessels and ship operational profiles, such as the payload utilisation, the speed of a ship, and the voyage conditions (wind, waves etc.). Undoubtedly, EEOI is the most scientifically significant metric to indicate ship operational energy efficiency. However, due to concerns about the commercial sensitivity of cargo data, some member states opposed the monitoring and reporting of this data in the IMO DCS system a couple of years ago, which led to the failure of EEOI as a mandatory indicator. But in terms of the practice from the EU MRV system, the monitoring and reporting of the amount of cargo carried does not make much sense for setting a reference baseline.
4. Discussion
Based on the aforementioned analysis and results, the following comments and implications have been proposed.
4.1. Regarding the Data Quality
In the EU MRV database, there are three types of metrics for ship technical energy efficiency: EEDI, EEXI, and EIV. However, there are differences in the calculation methods and applicable objects of these three metrics. Currently, the use of technical energy efficiency metrics in the EU MRV system is still relatively chaotic. In addition, there are 12 categories of average energy efficiency, among which six items are for annual average fuel consumption and another six items are for annual average CO2 emissions, depending on ship type. Although checked and verified, there are still a certain proportion of cases like null values, zero values, non-numeric values, significant outliers, etc. Furthermore, there may also be non-standard selection of vessel types, for example, LNG carriers may be reported as gas carriers; combination carriers are reported and regulated as a separated ship type, even if the number is only seven; ships such as multi-purpose vessels and heavy lift vessels probably need to be separated from general cargo ships or other ship types in order to have their own applicable EEDI, EEXI, and CII reference baselines, etc. Therefore, there is still significant room for improvement in the data quality and standardization of reporting and verification for the EU MRV mechanism.
4.2. Regarding the Monitoring Methods
Ships using single method, including BDN, bunker fuel tank monitoring onboard and flow meters, accounted for 43%, 17%, and 17%, respectively; ships using a combination of two or three methods to monitor CO2 emissions, accounted for 19%; considering single and combination methods, ships using BDN accounted for over 84%; no case of direct CO2 emissions measurement is reported. Currently, the IMO has adopted guidance on inclusion of data on transport work and enhanced granularity in the IMO DCS system by Resolution MEPC.385(81), total fuel oil consumption by fuel oil type per consumer type (including main engine, auxiliary engine, oil-fired boiler and others) and fuel oil consumption while the ship is not under way by fuel oil type per consumer type are required to be monitored and reported. In this context, the applicability of BDN and bunker fuel tank monitoring onboard methods faces challenges. Flow meters for applicable combustion processes and direct CO2 emissions measurement will be promoted. But this is probably not an economically viable and reasonable choice for the maritime industry. Although direct CO2 emissions measurement was frequently discussed in the international maritime community, it does not seem like a reasonable choice, considering the factors such as data accuracy, measurement system reliability, and capital costs; the same concerns apply to the method of flow meters for applicable combustion processes. Especially when the lifecycle GHG fuel intensity becomes one of the major issues under the IMO Net-Zero Framework, it is meaningless to simply consider high-precision measurements at the end use.
4.3. Regarding the Technical Energy Efficiency of Ships and Its Metrics
Regression analysis was conducted on ships with the technical energy efficiency reported as EEDI and EEXI. A power function was employed to express the correlation between the ship’s technical energy efficiency and deadweight tonnage. Good fitting relationships have been shown, especially for bulk carriers, tankers, container ships, and gas carriers. Bulk carriers and tankers have the best energy efficiency performance, and have approximately overlapping fitting curves for technical energy efficiency and deadweight tonnage, while container ships and refrigerated cargo ships have relatively poor energy efficiency performance. The policies on ship technical energy efficiency undoubtedly have a positive significance in promoting energy conservation and emission reduction of the world fleet, but whether stricter requirements for ship technical energy efficiency should be formulated, or whether more time and economic costs should be invested to further optimize the calculation method of technical energy efficiency for specific ship types, remains to be discussed. It is recommended that the international maritime industry make greater efforts to promote the elimination of old ships, as well as the use of zero or near-zero GHG emission technologies, fuels, and/or energy.
4.4. Regarding the Operational Energy Efficiency of Ships and Its Metrics
The annual average CO2 emissions per distance for bulk carriers, tankers, general cargo ships, and gas carriers are relatively low, while they are relatively high for cruise passenger ships and ro–pax ships, which means the former group has better operational energy efficiency. Investigating the correlations between the annual average CO2 emissions per distance and the size of the ship, the annual average CO2 emissions per distance have a better fitting relationship with gross tonnage than with deadweight tonnage. As for the attained annual operational CII, its correlations with deadweight tonnage or gross tonnage can be expressed by power functions. For different ship types, the statistically averaged attained annual operational CII complies with the IMO requirements. However, considering that the effectiveness of energy efficiency improvement has been proven to gradually weaken while the MEPC 83 session has required a CII reduction factor of 21.5% in 2030 compared to 2019, innovative energy efficiency measures, such as wind-assisted propulsion, onboard carbon capture and storage, and alternative marine fuels, are urgent to be invested and applied. As for the operational energy efficiency expressed in EEOI, it is difficult to obtain a good-fitting curve and accordingly set reference baselines, since the EEOI metrics are highly dependent on the actual payload utilization and operational profiles of a ship. Therefore, in the IMO DCS system, it does not make much sense for the monitoring and reporting of the amount of cargo carried. It is highly likely that EEOI will not ultimately become a mandatory energy efficiency metric. However, the CII metrics are not perfect either.
4.5. Regarding the Necessity of Co-Existence of the EU and IMO Regulations on Shipping Emissions
An effective monitoring, reporting, and verification system is the prerequisite for formulating emission reduction policies and selecting technological paths, particularly for carbon tax, GHG fund, carbon emissions trading, and other market-based mechanisms. Due to the slow progress of the emission reduction policies under the IMO framework, the EU has decided to take unilateral actions and officially released Regulation (EU) 2015/757 on the monitoring, reporting and verification of CO2 emissions from maritime transport in 2015. On this basis, given having played positive role of the EU ETS in making Europe the climate-neutral continent and intended to promote the IMO to take actions as soon as possible, the EU officially released Regulation (EU) 2023/957 on inclusion of maritime transport activities in the EU ETS and Regulation (EU) 2023/1805 on the use of renewable and low-carbon fuels in maritime transport in 2023, which were put into effect since 1 January 2024 and 1 January 2025, respectively. However, the IMO DCS and IMO Ship Fuel Consumption Database have been established, and the data granularity has been enhanced gradually. On this basis, the MEPC 83 session has approved the draft Regulations on the IMO Net-Zero Framework to set mandatory marine fuel standard and GHG emissions pricing for shipping on 11 April 2025, which formulate stricter compliance requirements and economic elements and will be formally adopted in October 2025 before entry into force in 2027. At that time, the EU MRV, EU ETS, and FuelEU maritime regulations would complete their mission for serving as a model for the implementation of a global system and facilitating the development of international rules within the IMO. Consequently, the EU should think about abolishing these regulations to avoid the fragmentation of shipping GHG emission regulation, and to avoid duplicated regulation of GHG emissions from maritime transport at the EU as well as the global level, or amending the applicable objects to ships outside the scope of the IMO regulations. Therefore, provisions on review, such as Article 22 International cooperation of Regulation (EU) 2015/757, applicable to Regulation (EU) 2023/957 as well, and Article 30 Reports and review of Regulation (EU) 2023/1805, should be initiated as soon as possible.
5. Conclusions
Based on the EU MRV data for the reporting year of 2023, further enhanced by data of deadweight tonnage, gross tonnage, and built year from Clarksons database or Shipxy database for individual ships, a statistical analysis was conducted on the ship types and number, the ship operational profiles, and the monitoring methods for CO2 emissions. Meanwhile, a regression analysis was conducted on the ship technical energy efficiency and the ship operational energy efficiency for 11 ship types, including bulk carrier, tanker, container ship, gas carrier, LNG carrier, general cargo ship, refrigerated cargo carrier, cruise passenger ships, ro–pax ship, ro–ro cargo ship, and vehicle carrier, which refer to the ship types relating to the IMO EEDI, EEXI, and CII regulations. Some conclusions have been identified to respond to the research objectives of this article and tentatively answer the questions raised earlier in this article.
- (1)
- The EU MRV database provides powerful support for conducting ship operational profile analysis and ship energy efficiency appraisals, due to its accessibility, transparency, and completeness, which could facilitate the formulation of decarbonization policies for global shipping and management decisions for stakeholders. However, even after more than six years of operation, errors and omissions in the process of monitoring, reporting, and verification are still a problem, and there is still room for improvement in data accuracy and completeness. This also indirectly reflects the insufficient input of resources and manpower in the operation of the mechanism, or the need for technical training for crew members, company management personnel, and verification personnel. But on the other hand, with the establishment of IMO DCS mechanism and the implementation of IMO Net-Zero Framework, the EU MRV, EU ETS, and FuelEU maritime regulations could be closed since they have finished their mission for serving as a model for a global system, and also to avoid fragmented and duplicated regulation on shipping GHG emissions.
- (2)
- Ships using BDN methods for determining CO2 emissions accounted for over 84%, considering single and combination methods, while no cases with direct CO2 emissions measurement, which means a simple and cheap method is practical. In this sense, the maritime sector’s pursuit of enhanced granularity in the IMO DCS system is not an industry-friendly choice. Furthermore, when the well-to-wake GHG fuel intensity becomes one of the major issues under the IMO Net-Zero Framework, high-precision measurements at the end use do not significantly benefit the implementation of ship energy efficiency regulations, except for increasing the investment and management costs of ships.
- (3)
- The correlations of technical and operational energy efficiency performance with deadweight tonnage or gross tonnage are fitted by power functions. In fact, with the update of the fleet, the ship’s technical and operational energy efficiency is gradually improving, although it has not been comprehensively demonstrated or deeply discussed in this article. However, the effectiveness of energy efficiency measures was proven to decrease on a temporal scale by several studies. Therefore, stricter requirements for ship energy efficiency should probably be achieved by promoting the elimination of old ships, as well as the use of zero or near-zero GHG emission technologies, fuels, and/or energy. Meanwhile, novel energy efficiency metrics need to be developed with the implementation of the IMO Net-Zero Framework.
The shortcomings of this study are objectively present, and future research on this topic is also necessary. Ships calling at EU ports do not fully reflect the characteristics and operational profiles of the global fleet. Therefore, the limitation of sample size may accordingly result in a deviation between the quantitative results of ship energy efficiency obtained in this study and those of the global fleet. In addition, this study analysed the data for the reporting year of 2023 only, so the temporal feature of the ship operational profile and energy efficiency is not fully presented. Therefore, further research and analysis based on the EU MRV data and the IMO DCS data over the years can be expected to draw more valuable results.
Author Contributions
Conceptualization, H.X. and S.C.; data curation, H.X. and S.C.; formal analysis, R.M. and K.W.; funding acquisition, H.X., S.C., and K.W.; investigation, H.X. and S.C.; methodology, H.X. and K.W.; project administration, H.X. and K.W.; resources, H.X.; software, R.M.; supervision, H.X.; validation, R.M. and K.W.; visualization, H.X. and S.C.; writing—original draft, H.X. and S.C.; writing—review and editing, H.X. and K.W. All authors have read and agreed to the published version of the manuscript.
Funding
This work was funded by the National Key R&D Program of China, grant number 2022YFB4300804; the High-Tech Ship Research Project of the Ministry of Industry and Information Technology, grant number CBZ03N23-01; the National Natural Science Foundation of China, grant number 52271305; and the Fundamental Research Funds for the Central Universities, grant number 3132023525.
Data Availability Statement
The original contributions presented in this study are included in the article. Further inquiries can be directed to the corresponding author.
Conflicts of Interest
The authors declare no conflicts of interest.
Abbreviations
The following abbreviations are used in this manuscript:
| AER | annual efficiency ratio |
| BDN | bunker fuel delivery notes |
| CII | carbon intensity indicator |
| CO2 | carbon dioxide |
| DCS | data collection system for fuel oil consumption of ships |
| DWT | deadweight tonnage |
| EEA | European Economic Area |
| EEDI | Energy Efficiency Design Index |
| EEOI | energy efficiency operational indicator |
| EESH | energy efficiency per service hour |
| EEXI | Energy Efficiency Existing Ship Index |
| EIV | estimated index value |
| EMSA | European Maritime Safety Agency |
| EU | European Union |
| EU ETS | European Union Emissions Trading System |
| GHG | greenhouse gas |
| GISIS | Global Integrated Shipping Information System |
| GT | gross tonnage |
| IMO | International Maritime Organization |
| ISPI | individual ship performance indicator |
| LNG | liquefied natural gas |
| LPG | liquefied petroleum gas |
| m3 | cubic meter |
| MARPOL | International Convention for the Prevention of Pollution from Ships |
| MEPC | Marine Environment Protection Committee |
| MRV | monitoring, reporting, and verification |
| RLV | reference line value |
| Ro–pax | roll-on/roll-off passenger |
| Ro–ro | roll-on/roll-off |
| SEEMP | ship energy efficiency management plan |
References
- UNCTAD. Review of Maritime Transport 2024. Available online: https://unctad.org/publication/review-maritime-transport-2024 (accessed on 16 June 2025).
- Xing, H.; Spence, S.; Chen, H. A comprehensive review on countermeasures for CO2 emissions from ships. Renew. Sustain. Energy Rev. 2020, 134, 110222. [Google Scholar] [CrossRef]
- IMO. Fourth IMO GHG Study 2020. Available online: https://www.imo.org/en/ourwork/Environment/Pages/Fourth-IMO-Greenhouse-Gas-Study-2020.aspx (accessed on 16 June 2025).
- IMO. Inclusion of Regulations on Energy Efficiency for Ships in MARPOL Annex VI. Resolution MEPC.203(62), Adopted on 15 July 2011. Available online: https://wwwcdn.imo.org/localresources/en/KnowledgeCentre/IndexofIMOResolutions/MEPCDocuments/MEPC.203(62).pdf (accessed on 16 June 2025).
- IMO. Data Collection System for Fuel Oil Consumption of Ships. RESOLUTION MEPC.278(70), Adopted on 28 October 2016. Available online: https://wwwcdn.imo.org/localresources/en/KnowledgeCentre/IndexofIMOResolutions/MEPCDocuments/MEPC.278(70).pdf (accessed on 16 June 2025).
- IMO. 2021 Revised MARPOL Annex VI. Resolution MEPC.328(76), Adopted on 17 June 2021. Available online: https://wwwcdn.imo.org/localresources/en/KnowledgeCentre/IndexofIMOResolutions/MEPCDocuments/MEPC.328(76).pdf (accessed on 16 June 2025).
- IMO. 2023 IMO Strategy on Reduction of GHG Emissions from Ships. Resolution MEPC.377(80), Adopted on 7 July 2023. Available online: https://www.imo.org/en/OurWork/Environment/Pages/2023-IMO-Strategy-on-Reduction-of-GHG-Emissions-from-Ships.aspx (accessed on 16 June 2025).
- IMO. IMO Approves Net-Zero Regulations for Global Shipping. Available online: https://www.imo.org/en/MediaCentre/PressBriefings/pages/IMO-approves-netzero-regulations.aspx (accessed on 16 June 2025).
- EU. Regulation (EU) 2015/757 of the European Parliament and of the Council of 29 April 2015 on the Monitoring, Reporting and Verification of Carbon Dioxide Emissions from Maritime Transport, and Amending Directive 2009/16/EC. Off. J. Eur. Union 2015, L123, 55–76. [Google Scholar]
- EU. Regulation (EU) 2023/957 of the European Parliament and of the Council of 10 May 2023 amending Regulation (EU) 2015/757 in order to provide for the inclusion of maritime transport activities in the EU Emissions Trading System and for the monitoring, reporting and verification of emissions of additional greenhouse gases and emissions from additional ship types. Off. J. Eur. Union 2023, L130, 105–114. [Google Scholar]
- EU. Regulation (EU) 2023/1805 of the European Parliament and of the Council of 13 September 2023 on the use of renewable and low-carbon fuels in maritime transport, and amending Directive 2009/16/EC. Off. J. Eur. Union 2023, L234, 48–100. [Google Scholar]
- European Commission. 2024 Report from the European Commission on CO2 Emissions from Maritime Transport. SWD(2025) 38 Final, Brussels, 12 February 2025. Available online: https://climate.ec.europa.eu/document/download/5e189025-62b3-40f1-bbee-3d633d03b643_en?filename=swd_2025_38_en.pdf (accessed on 16 June 2025).
- Yan, R.; Mo, H.; Wang, S.; Yang, D. Analysis and Prediction of Ship Energy Efficiency Based on the MRV System. Marit. Policy Manag. 2023, 50, 117–139. [Google Scholar] [CrossRef]
- Luo, X.; Yan, R.; Wang, S. After five years’ application of the European Union monitoring, reporting and verification (MRV) mechanism: Review and prospectives. J. Clean. Prod. 2024, 434, 140006. [Google Scholar] [CrossRef]
- Christodoulou, A.; Cullinane, K. Potential alternative fuel pathways for compliance with the ‘FuelEU Maritime Initiative’. Transp. Res. Part D Transp. Environ. 2022, 112, 103492. [Google Scholar] [CrossRef]
- Barka-Patargia, D. Reducing CO2 Emissions from Shipping—An Analysis of the Data Reported Under the EU MRV Regulation (2018–2022). University of Piraeus (Greece), 2025. Available online: https://www.pqdtcn.com/thesisDetails/954B01D24AA7BC625870A44D23B860F3 (accessed on 16 June 2025).
- Panagakos, G.; de Sousa Pessôa, T.; Dessypris, N.; Barfod, M.B.; Psaraftis, H.N. Monitoring the Carbon Footprint of Dry Bulk Shipping in the EU: An Early Assessment of the MRV Regulation. Sustainability 2019, 11, 5133. [Google Scholar] [CrossRef]
- Mannarini, G.; Carelli, L.; Salhi, A. EU-MRV: An analysis of 2018’s Ro-Pax CO2 data. In Proceedings of the 21st IEEE International Conference on Mobile Data Management (MDM), Versailles, France, 30 June–3 July 2020; pp. 287–292. [Google Scholar]
- Georgiev, P.; Garbatov, Y. Carbon emissions statistical analysis for container shipping in the Black Sea. Proc. Inst. Mech. Eng. Part M J. Eng. Marit. Environ. 2024, 238, 395–405. [Google Scholar] [CrossRef]
- Garbatov, Y.; Georgiev, P.; Yalamov, D. Risk-based retrofitting analysis employing the carbon intensity indicator. Ocean Eng. 2023, 289, 116283. [Google Scholar] [CrossRef]
- Christodoulou, A.; Dalaklis, D.; Ölçer, A.I.; Masodzadeh, P.G. Inclusion of Shipping in the EU-ETS: Assessing the Direct Costs for the Maritime Sector Using the MRV Data. Energies 2021, 14, 3915. [Google Scholar] [CrossRef]
- Heindl, P. The Impact of Administrative Transaction Costs in the EU Emissions Trading System. Clim. Policy 2015, 17, 314–329. [Google Scholar] [CrossRef]
- Coria, J.; Jaraite, J. Transaction Costs of Upstream Versus Downstream Pricing of CO2 Emissions. Environ. Resour. Econ. 2019, 72, 965–1001. [Google Scholar] [CrossRef]
- Heikkilä, M.; Grönholm, T.; Majamäki, E.; Jalkanen, J.P. Effect of ice class to vessel fuel consumption based on real-life MRV data. Transp. Policy 2024, 148, 168–180. [Google Scholar] [CrossRef]
- Tran, T.T.; Browne, T.; Veitch, B.; Musharraf, M.; Peters, D. Route optimization for vessels in ice: Investigating operational implications of the carbon intensity indicator regulation. Mar. Policy 2023, 158, 105858. [Google Scholar] [CrossRef]
- Barreiro, J.; Zaragoza, S.; Diaz-Casas, V. Review of ship energy efficiency. Ocean Eng. 2022, 257, 111594. [Google Scholar] [CrossRef]
- Ma, R.; Zhao, Q.; Wang, K.; Cao, J.; Yang, C.; Hu, Z.; Huang, L. Energy efficiency improvement technologies for ship in operation: A comprehensive review. Ocean Eng. 2025, 331, 121258. [Google Scholar] [CrossRef]
- Jimenez, V.J.; Kim, H.; Munim, Z.H. A review of ship energy efficiency research and directions towards emission reduction in the maritime industry. J. Clean. Prod. 2022, 366, 132888. [Google Scholar] [CrossRef]
- Tadros, M.; Ventura, M.; Guedes Soares, C. Review of current regulations, available technologies, and future trends in the green shipping industry. Ocean Eng. 2023, 280, 114670. [Google Scholar] [CrossRef]
- Wang, K.; Wang, Y.; Liang, H.; Jing, Z.; Cong, L.; Ma, R.; Huang, L. Ship energy efficiency optimization considering the influences of multiple complex navigational environments: A review. Mar. Pollut. Bull. 2025, 216, 117976. [Google Scholar] [CrossRef]
- Sardar, A.; Anantharaman, M.; Rabiul Islam, T.M.; Garaniya, V. Data collection framework for enhanced carbon intensity indicator (CII) in the oil tankers. Can. J. Chem. Eng. 2025, 103, 170–187. [Google Scholar] [CrossRef]
- Poulsen, R.T.; Viktorelius, M.; Varvne, H.; Rasmussen, H.B.; von Knorring, H. Energy efficiency in ship operations—Exploring voyage decisions and decision-makers. Transp. Res. Part D Transp. Environ. 2022, 102, 103120. [Google Scholar] [CrossRef]
- Bullock, S.; Larkin, A.; Köhler, J. Beyond fuel: The case for a wider perspective on shipping and climate change. Clim. Policy 2025, 1–9. [Google Scholar] [CrossRef]
- Adamowicz, M. Decarbonisation of maritime transport—European Union measures as an inspiration for global solutions? Mar. Policy 2022, 145, 105085. [Google Scholar] [CrossRef]
- Bayraktar, M.; Mollaoglu, M.; Yuksel, O. Scientometric Analysis of Energy Efficiency Indicators in Maritime Transportation: A Systematic State-of-the-Art Review and Implications. Sustainability 2025, 17, 3612. [Google Scholar] [CrossRef]
- Kanberoğlu, B.; Kökkülünk, G. Assessment of CO2 emissions for a bulk carrier fleet. J. Clean. Prod. 2021, 283, 124590. [Google Scholar] [CrossRef]
- Vasilev, M.; Kalajdžić, M.; Momčilović, N. On energy efficiency of tankers: EEDI, EEXI and CII. Ocean Eng. 2025, 317, 120028. [Google Scholar] [CrossRef]
- Yuan, Q.; Wang, S.; Peng, J. Operational efficiency optimization method for ship fleet to comply with the carbon intensity indicator (CII) regulation. Ocean Eng. 2023, 286, 115487. [Google Scholar] [CrossRef]
- Cheng, L.; Xu, L.; Bai, X. Cargo selection, route planning, and speed optimization in tramp shipping under carbon intensity indicator (CII) regulations. Transp. Res. Part E Logist. Transp. Rev. 2025, 194, 103948. [Google Scholar] [CrossRef]
- Xing, H.; Stuart, C.; Spence, S.; Chen, H. Alternative fuel options for low carbon maritime transportation: Pathways to 2050. J. Clean. Prod. 2021, 297, 126651. [Google Scholar] [CrossRef]
- Bayraktar, M.; Yuksel, O. A scenario-based assessment of the energy efficiency existing ship index (EEXI) and carbon intensity indicator (CII) regulations. Ocean Eng. 2023, 278, 114295. [Google Scholar] [CrossRef]
- Wang, S.; Psaraftis, H.N.; Qi, J. Paradox of international maritime organization’s carbon intensity indicator. Commun. Transp. Res. 2021, 1, 100005. [Google Scholar] [CrossRef]
- Rauca, L.; Batrinca, G. Impact of Carbon Intensity Indicator on the Vessels’ Operation and Analysis of Onboard Operational Measures. Sustainability 2023, 15, 11387. [Google Scholar] [CrossRef]
- Braidotti, L.; Bertagna, S.; Rappoccio, R.; Utzeri, S.; Bucci, V.; Marinò, A. On the inconsistency and revision of Carbon Intensity Indicator for cruise ships. Transp. Res. Part D Transp. Environ. 2023, 118, 103662. [Google Scholar] [CrossRef]
- Kim, M.; Lee, J.-Y.; An, S.; Hwang, D.-J. Proposals on Effective Implementation of the Carbon Intensity Indication of Ships. J. Mar. Sci. Eng. 2024, 12, 1906. [Google Scholar] [CrossRef]
- Sardar, A.; Islam, R.; Anantharaman, M.; Garaniya, V. Advancements and obstacles in improving the energy efficiency of maritime vessels: A systematic review. Mar. Pollut. Bull. 2025, 214, 117688. [Google Scholar] [CrossRef]
- EMSA. CO2 Emission Report. Available online: https://mrv.emsa.europa.eu/#public/emission-report (accessed on 16 June 2025).
- Clarkson Research. Shipping Intelligence Network. Available online: https://www.clarksons.net.cn/n/#/portal (accessed on 11 April 2025).
- Elane. Ship Archives. Available online: https://www.shipxy.com/IHS (accessed on 11 April 2025).
- IMO. Report of Fuel Oil Consumption Data Submitted to the IMO Ship Fuel Oil Consumption Database in GISIS (Reporting Year: 2023). MEPC 82/6/38 Noted by the Secretariat, 26 July 2024. Available online: https://docs.imo.org/ (accessed on 16 June 2025).
- IMO. 2022 Guidelines on Operational Carbon Intensity Indicators and the Calculation Methods (CII Guidelines, G1). Resolution MEPC.352(78), Adopted on 10 June 2022. Available online: https://wwwcdn.imo.org/localresources/en/KnowledgeCentre/IndexofIMOResolutions/MEPCDocuments/MEPC.352(78).pdf (accessed on 16 June 2025).
- IMO. 2021 Guidelines on the Operational Carbon Intensity Reduction Factors Relative to Reference Lines (CII Reduction Factor Guidelines, G3). Resolution MEPC.338(76), Adopted on 17 June 2021. Available online: https://wwwcdn.imo.org/localresources/en/KnowledgeCentre/IndexofIMOResolutions/MEPCDocuments/MEPC.338(76).pdf (accessed on 16 June 2025).
- IMO. 2022 Guidelines on the Reference Lines for Use with Operational Carbon Intensity Indicators (CII Reference Lines Guidelines, G2). Resolution MEPC.353(78), Adopted on 10 June 2022. Available online: https://wwwcdn.imo.org/localresources/en/KnowledgeCentre/IndexofIMOResolutions/MEPCDocuments/MEPC.353(78).pdf (accessed on 16 June 2025).
- IMO. 2022 Guidelines on the Operational Carbon Intensity Rating of Ships (CII Rating Guidelines, G4). Resolution MEPC.354(78), adopted on 10 June 2022. Available online: https://wwwcdn.imo.org/localresources/en/KnowledgeCentre/IndexofIMOResolutions/MEPCDocuments/MEPC.354(78).pdf (accessed on 16 June 2025).
- Sou, W.S.; Goh, T.; Lee, X.N.; Ng, S.H.; Chai, K.H. Reducing the carbon intensity of international shipping—The impact of energy efficiency measures. Energy Policy 2022, 170, 113239. [Google Scholar] [CrossRef]
- Schroer, M.; Panagakos, G.; Barfod, M.B. An evidence-based assessment of IMO’s short-term measures for decarbonizing container shipping. J. Clean. Prod. 2022, 363, 132441. [Google Scholar] [CrossRef]


Disclaimer/Publisher’s Note: The statements, opinions and data contained in all publications are solely those of the individual author(s) and contributor(s) and not of MDPI and/or the editor(s). MDPI and/or the editor(s) disclaim responsibility for any injury to people or property resulting from any ideas, methods, instructions or products referred to in the content. |
© 2025 by the authors. Licensee MDPI, Basel, Switzerland. This article is an open access article distributed under the terms and conditions of the Creative Commons Attribution (CC BY) license (https://creativecommons.org/licenses/by/4.0/).