Abstract
To improve environmental sustainability and operational safety in maritime industries, the development of efficient methods for removing biofouling from submerged surfaces is critical. This study investigates the erosion mechanisms of cavitation jets as a non-contact, high-efficiency method for detaching marine organisms, including bacteria and larvae, from ship hulls and underwater infrastructure. Through erosion experiments on coated specimens, variations in jet morphology, and flow visualization using the Schlieren method, we examined how factors such as jet incident angle and nozzle configuration influence removal performance. The results reveal that erosion occurs not only at the direct jet impact zone but also in regions where cavitation bubbles exhibit intense motion, driven by pressure fluctuations and shock waves. Notably, single-hole jets with longer potential cores produced more concentrated erosion, while multi-jet interference enhanced bubble activity. These findings underscore the importance of understanding bubble distribution dynamics in the flow field and provide insight into optimizing cavitation jet configurations to expand the effective cleaning area while minimizing material damage. This study contributes to advancing biofouling removal technologies that promote safer and more sustainable maritime operations.
1. Introduction
In the field of maritime science, the establishment of technologies to remove marine organisms from offshore structures is one of the most important issues, not only for reducing the fuel consumption of ships and the resulting GHG emissions but also for improving the efficiency and safety of the maintenance of cooling water intake pipes and drainage pipes at power plants and other facilities [1,2]. There are several measures that can be taken to prevent marine organisms from adhering, including antifouling paints [3,4] and physical removal methods, such as scouring by divers (scraping off adhering organisms with tools) and sandblasting when the vessel is docked [5,6,7]. The physical removal method involves the risk of accidentally damaging the paint on the hull surface, as well as damage to the health of the workers and the environment due to waste disposal and dust generated during operation [8,9]. In addition, cleaning work by divers is always hazardous and time-consuming due to manual labor, so improvements are needed in terms of safety and economy. In recent years, underwater drones and other underwater robots have been increasingly used for safety management [10]. In such cases, cavitation jets are beginning to be used to remove attached organisms [11,12].
Cavitation jets have a structure in which a group of microbubbles covers the water flow in the center, and a potential core region exists near the nozzle outlet where the velocity does not decay. This region extends from the nozzle outlet to a length of about six to seven times the nozzle diameter and gradually decreases and disappears as the surrounding mixing region develops [13]. The pressure difference causes a contraction motion of the injected microbubbles, generating underwater shock waves and micro-water jets upon collapse. Especially near the wall surface, the bubbles collapse at the interface and generate a strong water jet directed toward the surface, which contributes to surface erosion. In addition, the intense bubble dynamics produce hydroxyl (OH) radicals, which have been shown to exert bactericidal effects and facilitate the removal of surface-adhered organisms, highlighting the dual potential of cavitation jets for mechanical cleaning and biochemical disinfection [14,15].
Although this study focuses on experimental investigations, recent computational studies have significantly contributed to understanding cavitation dynamics. For example, Roohi et al. [16] conducted three-dimensional CFD simulations of cavitating flow behind a disk, emphasizing the influence of turbulence and mass transfer models on cavity structure and collapse behavior. Such numerical studies provide a valuable theoretical context for interpreting experimental observations and optimizing nozzle design in future work.
It is known that attached organisms such as barnacles, which have conventionally been scraped off over time by divers, are relatively easily detached from the structure by this cavitation jet. On the other hand, knowledge on the effects of cavitation jets on marine bacteria and hull-attached microorganisms is limited, and the area stripped by cavitation jets is currently limited to a short distance from the nozzle outlet, so there is a need to expand the area to be stripped and improve the efficiency of the stripping operation [17]. To improve the efficiency of cleaning work by cavitation jets, it is necessary to clarify the reason why attached organisms are stripped by cavitation jets and to find a way to expand the effective removal area, accelerate the removal speed, and improve the efficiency of the work by pursuing the principle. In this study, we focus on the erosion effect of cavitation jets with the aim of establishing techniques for removing and preventing the attachment of organisms to the bottom of ships in order to contribute to the preservation of the marine environment. To clarify this effect, we experimentally investigate the difference in the erosion effect depending on the angle of incidence of the jet to the specimen and the jetting configuration. In addition, the position of the shock wave generation is observed by using a composite image by superimposing images using visualization data by the Schlieren method, and the mechanism of erosion and effective removal conditions of solid wall adhesion is investigated.
2. Methodology
2.1. Experiment
Figure 1 and Figure 2 show a schematic diagram of the experimental apparatus used in this study. A stainless-steel nozzle with a 2 mm thick orifice plate at the tip was installed vertically upward from the bottom center of the acrylic tank. The nozzle was connected to a three-stage plunger-type high-pressure pump with discharge pressures of 8 MPa (AJP-1700VGQ, Ryobi Limited, Japan) and 15 MPa (MF1513P, Flutech Co., Ltd., Japan), measured for the 1 mm orifice diameter. The water pressure and flow rate were controlled by a three-stage plunger-type high-pressure pump (AJP-1700VGQ for 8 MPa and MF1513P for 15 MPa). The discharge pressure was regulated using the pump’s built-in pressure control mechanism. All experiments were conducted after confirming that the system had reached a stable operating condition for at least 30 s. In this experiment, water-based acrylic paint (Water-based spray, Atom House Paints Co., Ltd, Japan) was used as the adhered particulate material. The central axis of the jet was the z-axis, and the inclined wall surface was fixed at several inclination angles with respect to the z-axis. In both experiments, the specimens were exposed to the cavitation jet for 10 min.
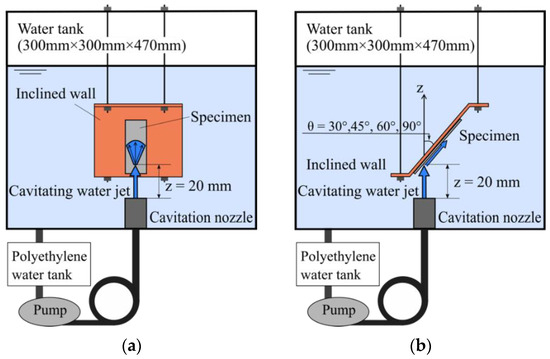
Figure 1.
Experimental setting for an erosion test: (a) front view; (b) side view.
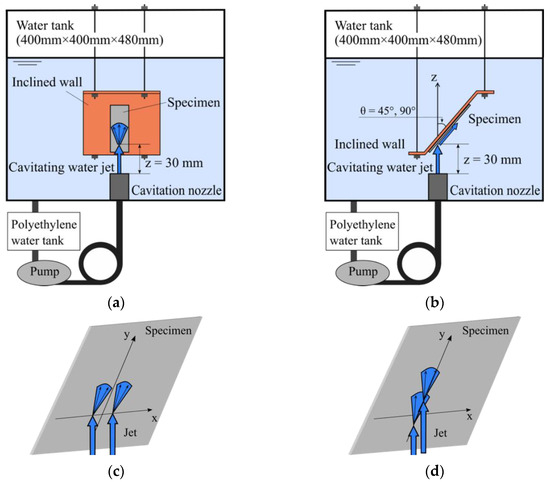
Figure 2.
Experimental setting for an erosion test: (a) front view; (b) side view; (c) jet injection manner 1 to an installed specimen; (d) jet injection manner 2 to an installed specimen.
First, the difference in the erosion effect of different angles of incidence of the cavitation jets was investigated using the apparatus shown in Figure 1. The distance from the nozzle to the specimen was 20 mm, and the pump discharge pressure was 8 MPa. A stainless-steel plate was installed on the inclined wall at inclination angles = 30°, 45°, and 60°, and an acrylic plate was installed at = 90°. The specimens were PMMA plates (75 × 25 mm2) that had been sprayed with a single layer of acrylic paint and allowed to dry at room temperature (approximately 20 °C) for more than one hour, following the manufacturer’s recommended drying time. The hole diameter of the orifice plate was 1.00 mm.
The apparatus shown in Figure 2 was used to investigate the difference in the erosive effect of different cavitation jet morphologies. The distance from the nozzle to the specimen was 30 mm, and the pump discharge pressure was 15 MPa. A stainless-steel plate was placed on the inclined wall at an inclination angle = 45° and an acrylic plate at = 90°. The specimens were aluminum plates (A1050, 40 × 50 mm2). At each inclination angle θ, the experiments were performed using the four orifice shapes shown in Table 1 and were repeated three times to ensure reproducibility. The flow rates were measured as 3.6 L/min at a discharge pressure of 8 MPa and 6.66 L/min at 15 MPa. Based on these measurements, the outlet velocities, Reynolds numbers, and cavitation numbers at the orifice exit were calculated. The resulting values are summarized in Table 1. The geometry of the nozzles used is shown in Figure 3. In a two-orifice two-hole orifice (Table 1 Type No. 3) with an inclination angle of = 45°, the two jets flowed parallel on the specimen (Figure 2c), and when the two jets were incidentally impinging on the specimen, the mainstream direction of the jet on the specimen was the y direction and the direction perpendicular to y was the x direction (Figure 2c). In addition, the case where the two jets collide with the specimen on y is shown (Figure 2d).

Table 1.
Calculated exit velocities, Reynolds numbers, and cavitation numbers for various orifice diameters and discharge pressures considering pressure loss.
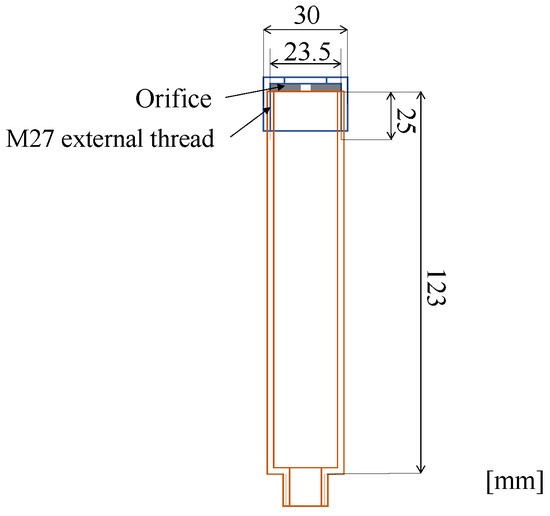
Figure 3.
Schematic diagram of the cavitation nozzle design.
2.2. Visualization Method
To investigate the generation of shock waves in the jet, visualization observations were carried out. Figure 4 shows a schematic diagram of the optical system used for the visualization observations. Images were taken by the Schlieren method using a laser source (CAVILUX Smart, Cavitar Ltd., Finland) and a high-speed camera (MEMORICAM ACS-1, nac IMAGE TECHNOLOGY, Japan) at 100,000 fps with an exposure time of 10 ns.
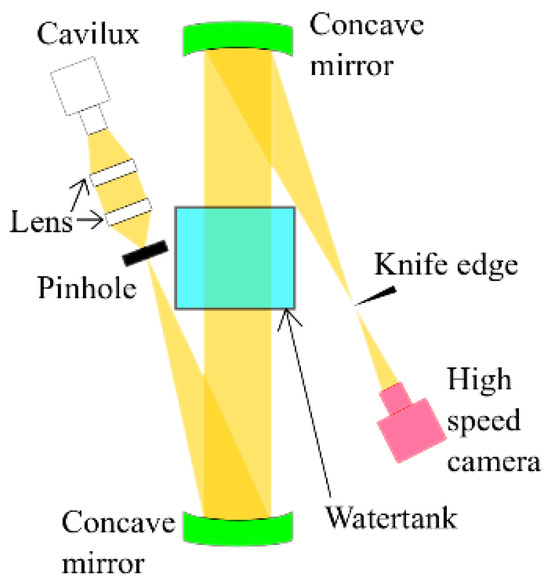
Figure 4.
Schematic of optical arrangement.
2.3. Image Analysis
In order to evaluate the difference in the erosion effect due to the difference in the angle of incidence of the cavitation jets, image processing was performed. As shown in Figure 5, the center of the jet on the specimen surface is the origin, the direction of the jet along the surface is the y-axis, and the direction perpendicular to the y-axis is the x-axis. At θ = 30°, 45°, and 60°, the rectangular area in the first quadrant (x × y = 4.8 mm × 20.4 mm) and the rectangular area in the fourth quadrant (x × y = 4.8 mm × 6 mm) of the x-y coordinates are the inspection areas, and at θ = 90°, the rectangular area in the first quadrant (x × y = 1.6 mm × 20.4 mm) and the rectangular area in the fourth quadrant (x × y = 1.6 mm × 6 mm) were the inspection areas. The inspection area was further divided into a micro-area of Δx × Δy = 1.6 mm ×1.2 mm, and the micro-area was magnified using a digital microscope (VH-5500, KEYENCE Corporation, Japan). As shown in Figure 6, the images before and after the experiment were binarized, and the erosion area ratio of the specimen surface was calculated as an index of the erosion effect using the following equation:
where N0 is the total number of pixels in the inspection area, N1 is the number of brightness 0 pixels before the experiment, and N2 is the number of brightness 0 pixels after the experiment.
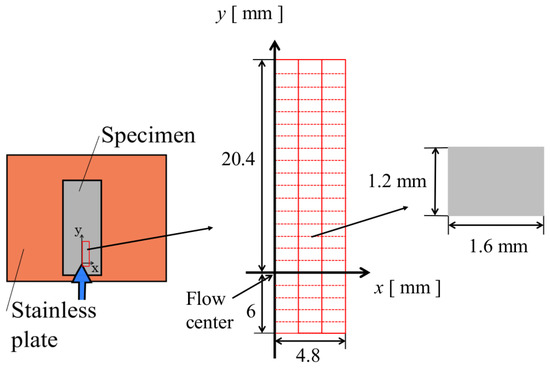
Figure 5.
Schematic of observation region.
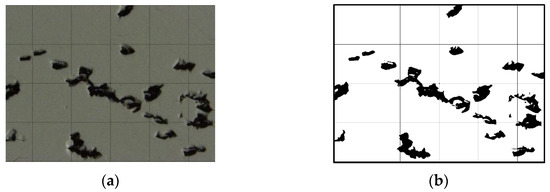
Figure 6.
Observation of erosion by cavitation jet: (a) original image; (b) binarizing image.
3. Results and Discussion
3.1. Visualization and Analysis of Cavitation Jet-Induced Shock Waves and Erosion Distributions Under Varying Inclination Angles
Figure 7a–d show Schlieren composite images obtained during 2 msec at θ = 30°, 45°, 60°, and 90°, respectively. The oblique black shadow in the figure is the stainless-steel plate, and the shadow of the jet can also be observed along the z-axis. At θ = 30°, 45°, and 60°, the thickness of the jet on the stainless-steel plate is thinnest near the jet impact point, and the thickness increases as the jet flows diagonally upward to the right. The bright arc-shaped lines are the shock wave surfaces generated by the cavitation bubbles. Since shock waves are generated during the collapse process of cavitation bubbles, it can be predicted that the micro-water jet effect and OH radical generation effect associated with bubble collapse can be obtained at the center position of the shock wave generation. It can also be seen that as the inclination angle increases, the ripples of the shock wave are aligned and approach concentric circles. In other words, the larger the inclination angle, the narrower the range in which cavitation bubbles are generated, and the smaller the inclination angle, the wider the range in which cavitation bubbles are generated.

Figure 7.
Composite image for 2 msec obtained by Schlieren method: (a) θ = 30°; (b) θ = 45°; (c) θ = 60°; (d) θ = 90°.
In Figure 7d, a large number of shock wave surfaces can be observed behind the wall surface where the jets are impinging, whereas they are hardly observed in Figure 7a–c. The wall material used in these experiments was acrylic in Figure 7d, while that used in Figure 7a–c was stainless-steel plates. The impact impedance of each material is about 44 × 106 Ns/m3 for the stainless-steel material and 3.3 × 10⁶ Ns/m3 for the acrylic material, while that of water is about 1.5 × 10⁶ Ns/m3. Therefore, since the order of impact impedance of the acrylic material and water is equal and their values are closer than those of the stainless-steel material, the shock waves are almost reflected by the stainless-steel wall in Figure 7a–c, while the acrylic material in Figure 7d is considered to transmit the shock waves.
Figure 8a–d show the distribution of the area fraction of erosion in the y direction for three different values of x for θ = 30°, 45°, 60°, and 90°, respectively. Figure 9 is an enlarged version of the graph between y = 5 and 20 mm in Figure 8. Around the origin, the area is about 3.5% at θ = 30°, about 80% at θ = 45°, about 90% at θ = 60°, and about 90% at θ = 90°. At θ = 90°, about 35% erosion occurred. Since the erosion that occurred near the origin is mostly caused by the water hammer effect due to the direct impact of the jet, the effect of microjets generated by the bubbling motion cannot be clarified. But after y = 8 mm at θ = 30° and 45°, the erosion at θ = 60° and around y = 6 mm at 90° might be caused by shock waves and microjets generated by bubble motion because the jet flows along the wall surface and the water hammer effect is small. In addition, the erosion area tends to change in a negative direction as the angle increases from θ = 30° to 45° to 60°. The bubbles flowing to the left of the central axis of the jet were stationary in this experiment and the number density of bubbles increased, as seen in the shadow of the bubble cloud in Figure 7. The extent of erosion outside of the origin area was y = 10 to 20 mm at θ = 30°, y = 8 to 12 mm at θ = 45°, and y = 5 to 6 mm at θ = 60°, and the difference was y = 5–6 mm. The smaller the inclination angle, the smaller the water hammer effect of the jet impacting the specimen, and the weaker the ambient pressure fluctuation that causes bubble motion; in addition, the faster the flow velocity past the specimen surface, the more bubbles that started to move were swept downstream. The bubbles that initiated the motion were swept further downstream. At θ = 90°, the water hammer action is maximum, and the bubble motion is considered to occur violently in a short time. In addition, since the jet diffuses concentrically around the origin, the number density of bubbles decreases, and the erosive effect is concentrated near the origin where the jet impacts, and it is easily expected that there is almost no effect in the region outside the center. It is easily predicted that the erosion effect is concentrated in the vicinity of the origin where the jets collide, with almost no effect in areas outside the center.
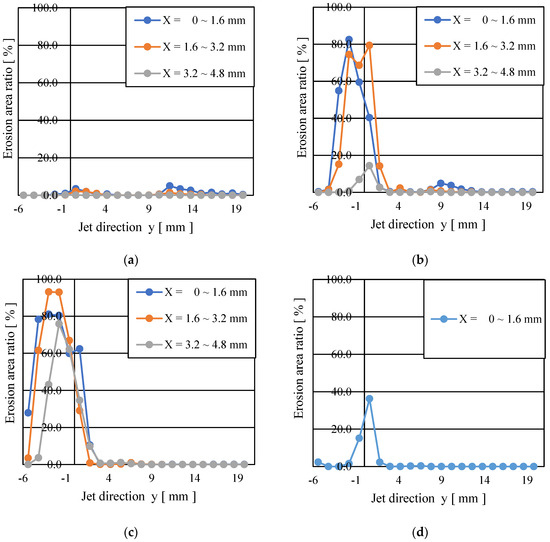
Figure 8.
Comparison of erosion area ratio obtained by cavitating jets with different incident angles: (a) θ = 30°; (b) θ = 45°; (c) θ = 60°; (d) θ = 90°.
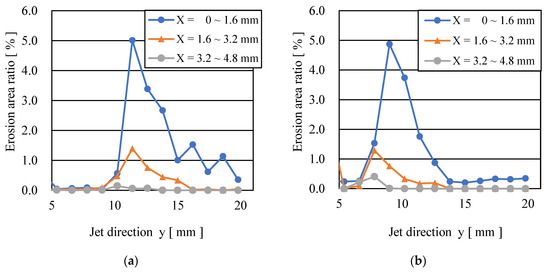
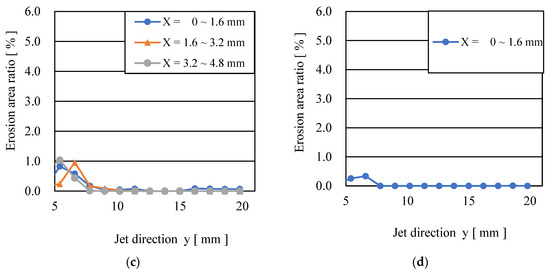
Figure 9.
Comparison of erosion area ratio obtained by cavitating jets with different incident angles between y = 5 and 20 mm: (a) θ = 30°; (b) θ = 45°; (c) θ = 60°; (d) θ = 90°.
3.2. Erosion Effects of Different Incident Angles of Cavitation Jets
Figure 10 shows a Schlieren composite image obtained during 2 ms under the condition θ = 45°. The oblique black shadow in the figure is the stainless-steel plate, and the shadow of the jet can also be seen along the z-axis. The bright arc-shaped line is the shock wave surface generated by the cavitation bubble. Many small shock waves can also be observed around the cavitation jet near the nozzle outlet, and they can be observed on the right obliquely up from the point where the jet impacts the inclined wall surface: for one hole (D = 1.00 mm), one hole (D = 1.31 mm), two holes (jet injection manner 1 in Figure 2c), two holes (jet injection manner 2 in Figure 2d), and three holes, clear shock waves were captured in the range of 43 mm, 51 mm, 30 mm, 27 mm, and 34 mm, respectively.

Figure 11 shows the Schlieren composite image obtained during 2 ms under θ = 90°. Compared to θ = 45°, the jet after wall impact was found to be thicker. On the wall, shock waves were observed within 21 mm, 30 mm, 13 mm, and 16 mm radially from the jet impact point at one hole (D = 1.00 mm), one hole (D = 1.31 mm), two holes, and three holes, respectively.

Figure 11.
Composite image for 2 ms obtained by Schlieren method for θ = 90°: (a) Type No. 1; (b) Type No. 2; (c) Type No. 3; (d) Type No. 4.
As in Figure 7d, many shock wave surfaces behind the wall surface where the jet impacted are thought to have passed through the acrylic wall material.
Figure 12 shows the results of erosion experiments at each orifice under the condition of θ = 45°. The flow direction of the jet is from bottom to top. The right image is a binarized version of the left image to clarify the extent of erosion. In each condition, Area I is the area where the main stream of the jet stream directly impacted the specimen. In particular, in Figure 12a, the specimen was scraped into a concave shape, and in Figure 12b, a through-hole was formed in the aluminum plate. Erosion occurred in Area II, which is the upstream region including the jet impact area. The erosion area was 8.4 mm long and 14.7 mm wide in Figure 12a, 9.6 mm long and 14.1 mm wide in Figure 12b, 8.3 mm long and 16.5 wide in Figure 12c, 8.1 mm long and 12.3 mm wide in Figure 12d, and 7.3 mm long and 10.9 mm wide in Figure 12e. In Figure 12c,d, the effect of erosion in the two-hole orifice is significantly enhanced due to the direct interference of the jet in Figure 12d. The erosion in Area III extends to the left and right after the jet impact, and there is a region where no erosion occurs until the jets flow 3.6 mm in Figure 12a, 4.4 mm in Figure 12b, 4.4 mm in Figure 12c, and 5.9 mm in Figure 12d. In Figure 12e, no clear erosion occurred in the region downstream of the impact zone.
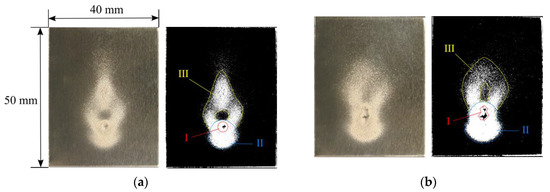
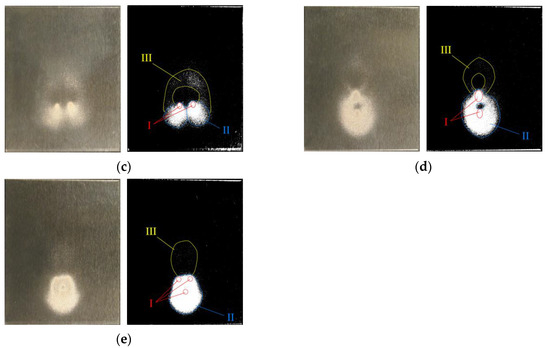
Figure 13 shows the experimental results of erosion at each orifice under the condition θ = 90°. Area I in Figure 13a is the area where the main flow of the jet directly impacted the orifice and produced a circular erosion with a diameter of 3.8 mm. In Area II, no erosion occurred within 1.8 mm radially from Area I. In Area III, erosion occurred again within a maximum radial distance of 16.5 mm from Area I. In Figure 13b, Area I was directly impacted by the main jet stream, and elliptical erosion with a long diameter of 4.6 mm and a short diameter of 3.0 mm occurred. Area II was slightly eroded. In Figure 13c, Area I was directly impacted by the main jet stream, and circular erosion with a diameter of 1.2 mm was observed. The erosion in Area II was not clearly visible. On the other hand, in Area III, erosion occurred up to 8.1 mm away from Area I. Area I in Figure 13d, where the two jets directly collided, exhibited circular erosion with a diameter of 1.2 mm. The erosion in Area II did not clearly appear. In Area III, an elliptical ring of erosion occurred up to 8.4 mm from Area IV, suggesting that the two jets interfered, resulting in more severe erosion than in Area II. In Area IV, three jets interfered with each other, suggesting that the erosion was more severe than in Area III.
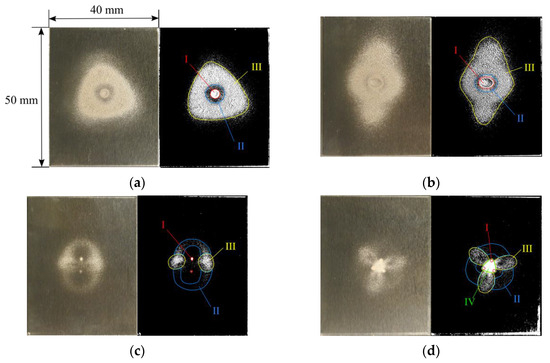
Figure 13.
Image of erosion test for θ = 90°: (a) Type No. 1; (b) Type No. 2; (c) Type No. 3; (d) Type No. 4.
In each condition, the erosion in the area where the main jets directly collided with each other was caused by the water hammer action of the jets, while the erosion in the area far from the collision zone was caused by the water hammer action of the micro-water jets generated on the aluminum plate surface. As shown in Figure 13c,d for the multiple-hole orifice, when there are multiple jet outlets, the jets interfere with each other and the bubble motion of the microbubbles is promoted, which may have caused the different erosion.
In this experiment, the single-hole orifice showed higher erosion than the multiple-hole orifice for both the θ = 45° and 90° conditions. The single-hole orifice had a longer potential core, which may have resulted in more active bubble motion in the more downstream region of the orifice.
In the one-hole condition, the reason for the existence of a region of almost no erosion in the downstream direction after the jet impact is that, the bubble motion is most active at the outer edge of the jet, and as shown in Figure 14, when the jet impacts a wall, there is an area between the strong water hammer of the jet and the outer edge of the jet. At θ = 45°, in the region upstream of the jet impact area, the shadow of the bubble cloud in Figure 9 indicates that the bubbles flowing upstream from the jet impact area were stationary in this experiment, and the increase in the bubble number density is thought to have resulted in more active bubble motion and uniform erosion.
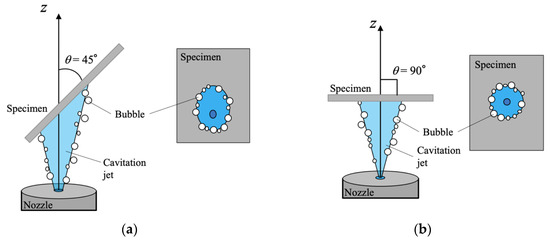
Figure 14.
Schematic of jet injection to the wall: (a) θ = 45°; (b) θ = 90°.
3.3. Summary
From the viewpoint of ship bottom cleaning, it is necessary to limit damage to the metal of the hull. Therefore, rather than using the direct water hammer action of the water jet from the nozzle, the use of the micro-water jet erosion action generated by promoting the activation of bubble motion by cavitation bubble motion and the interference of the jet stream is more suitable for ship bottom cleaning. Therefore, the characteristics of the cavitation jets targeted in this study can be summarized as follows.
The single-hole orifice has a longer potential core and higher flow rate than the multiple-hole orifice, and thus has a stronger water hammer action at the center of the jet that can scrape the aluminum plate. However, the smaller cross-sectional area of each orifice in the multiple-hole orifice reduced the flow rate and suppressed the direct water hammer effect.
In Figure 12b,d,e, in Area III, which is the downstream region, erosion occurred more clearly in the single-hole orifice than in the multiple-hole orifice at θ = 45°, while the same degree of erosion occurred in the upstream region, Area II, in Figure 12b,d,e. The interference between the jets in the multi-hole orifices and the visualization observations suggest that the bubbles were localized upstream of the orifice, which activated the bubble motion, resulting in the same degree of erosion in the upper region in the single-hole orifice and multi-hole orifice.
By realizing control using the characteristics of the cavitation jet described above, it is expected that an appropriate method for removing ship bottom deposits will be proposed.
4. Conclusions
In this study, we focused on the erosion effect of cavitation jets with the aim of establishing techniques for removing and preventing the attachment of organisms to the bottom of ships in order to contribute to the preservation of the marine environment. In addition, the position of the shock wave generation was observed by using a composite image by superimposing images using visualization data obtained by the Schlieren method, and the mechanism of erosion and effective removal conditions for solid wall deposits were examined.
The erosion mechanism of cavitation jets was elucidated through erosion experiments on painted surfaces, erosion experiments on the difference of jet forms, and visualization observations. As a result, the effect of shock waves and micro-jets could not be clarified because of the strong water hammer effect in the erosion at the point where the jets impacted. The results of the visual observation of the cavitation jets indicate that shock waves are generated on the sloping wall surface. In the erosion experiment on the painted surface, the area of erosion varied depending on the angle of incidence, and the smaller the angle of incidence, the more the erosion spread downstream. This is due to the effect of the difference in the strength of the water hammer action of the cavitation jet impacting the specimen on the cavitation bubble motion and the relationship between the strength of the cavitation bubble motion and the decay time, as well as to the variation in the bubble number density distribution due to the difference in the flow velocity at the specimen surface. In the erosion experiments on the difference in jetting morphology, more severe erosion occurred in the single-hole orifice condition than in the multiple-hole orifice condition. The single-hole orifice has a longer potential core region, which generates shock waves in the downstream region. In multiple holes, the bubble motion may be activated by the interference of the jet streams.
The above results indicate that erosion occurs not only in areas where jets act directly but also in flow fields where cavitation bubbles move violently, suggesting that it is important to understand the distribution of bubbles in the flow field in order to determine the area where erosion occurs. Since the generation of erosion is caused by water hammer action, the frequency of micro-water jets generated during the collapse of microbubbles is a key factor. Microbubble motion depends on the pressure fluctuations to which the bubbles are exposed immediately after their generation. However, it was confirmed that not only the pressure fluctuations in the flow field after passing through the nozzle but also the pressure action of the shock wave generated during bubble collapse induces bubble motion, resulting in a chain of collapse motions. Therefore, the state of bubble distribution in the flow field is important, and differences in necrotic action are thought to occur depending on the number density of bubbles. In nozzles that generate multiple cavitation jets, interference between the jets also promotes bubble motion. Since the area where erosion occurs is the area where the water hammer acts, it can be regarded as an effective area for removing deposits from the wall surface. Therefore, it is necessary to pay attention to the distribution of bubbles in the flow field caused by the cavitation jets, and the size of the potential core of the jets can be used as a guide to determine the area where the removal of deposits is effective. When multiple jets interfere with each other, attention should be paid to the formation of high number density regions of bubble distribution in the flow field. The possibility of applying the control of bubble distribution according to the form of cavitation jets and adjusting the exposure time of the jets to minimize damage to the bottom material of the vessel and to remove cypris larvae and seaweed attached to the surface was demonstrated.
Author Contributions
Methodology, J.K. and A.A.; Investigation, J.K.; Writing—original draft, J.K.; Writing—review & editing, J.K. and A.A.; Supervision, A.A. All authors have read and agreed to the published version of the manuscript.
Funding
Part of this research was supported by JSPS Grant-in-Aid for Scientific Research 23H01623.
Institutional Review Board Statement
Not applicable.
Informed Consent Statement
Not applicable.
Data Availability Statement
The datasets generated and analyzed during this study are available from the corresponding author upon reasonable request.
Acknowledgments
The visualization experiments were supported by Tetsuji Kuwabara of NAC Image Technology, Inc. and Tomoyuki Shimokawa. We would like to express our gratitude to them.
Conflicts of Interest
The authors declare no conflict of interest.
References
- MEPC. Guidelines for the Control and Management of Ships’ Biofouling to Minimize the Transfer of Invasive Aquatic Species. 2011. Available online: https://wwwcdn.imo.org/localresources/en/KnowledgeCentre/IndexofIMOResolutions/MEPCDocuments/MEPC.207(62).pdf (accessed on 21 July 2025).
- Adland, R.; Cariou, P.; Jia, H.; Wolff, F.-C. The energy efficiency effects of periodic ship hull cleaning. J. Clean. Prod. 2018, 178, 1–13. [Google Scholar] [CrossRef]
- Li, L.; Hong, H.; Cao, J.; Yang, Y. Progress in marine antifouling coatings: Current status and prospects. Coatings 2023, 13, 1893. [Google Scholar] [CrossRef]
- Liu, D.; Shu, H.; Zhou, J.; Bai, X.; Cao, P. Research Progress on New Environmentally Friendly Antifouling Coatings in Marine Settings: A Review. Biomimetics 2023, 8, 200. [Google Scholar] [CrossRef] [PubMed]
- Echt, A.; Dunn, K.H.; Mickelsen, R.L. Automated Abrasive Blasting Equipment for Use on Steel Structures. Appl. Occup. Environ. Hyg. 2000, 15, 713–720. [Google Scholar] [CrossRef] [PubMed]
- Chambers, L.D.; Stokes, K.R.; Walsh, F.C.; Wood, R.J. Modern Approaches to Marine Antifouling Coatings. Surf. Coat. Technol. 2006, 201, 3642–3652. [Google Scholar] [CrossRef]
- Morrisey, D.; Woods, C. In-Water Cleaning Technologies: Review of Information; Ministry for Primary Industries, Manatū Ahu Matua: Wellington, New Zealand, 2015. [Google Scholar]
- Soon, Z.Y.; Jung, J.-H.; Loh, A.; Yoon, C.; Shin, D.; Kim, M. Seawater Contamination Associated with In-Water Cleaning of Ship Hulls and the Potential Risk to the Marine Environment. Mar. Pollut. Bull. 2021, 171, 112694. [Google Scholar] [CrossRef] [PubMed]
- Shin, D.; Choi, Y.; Soon, Z.Y.; Kim, M.; Jang, M.C.; Seo, J.Y.; Shin, K.; Jung, J.H. Chemical hazard of robotic hull in-water cleaning discharge on coastal embryonic fish. Ecotoxicol. Environ. Saf. 2023, 253, 114653. [Google Scholar] [CrossRef] [PubMed]
- Le, A.V.; Kyaw, P.T.; Veerajagadheswar, P.; Muthugala, M.A.V.J.; Elara, M.R.; Kumar, M.; Khanh Nhan, N.H. Reinforcement learning-based optimal complete water-blasting for autonomous ship hull corrosion cleaning system. Ocean Eng. 2021, 220, 108477. [Google Scholar] [CrossRef]
- Zhong, X.; Dong, J.; Liu, M.; Meng, R.; Li, S.; Pan, X. Experimental Study on Ship Fouling Cleaning by Ultrasonic-Enhanced Submerged Cavitation Jet: A Preliminary Study. Ocean Eng. 2022, 258, 111844. [Google Scholar] [CrossRef]
- Koue, J.; Onishi, S.; Abe, A. Behavior Analysis of Cavitation Jets for Effective Removal of Organisms Attached to Offshore Structures. Int. J. Offshore Polar Eng. 2024, 34, 67–74. [Google Scholar] [CrossRef]
- Livingood, J.N.B.; Hrycak, P. Impingement Heat Transfer from Turbulent Air Jets to Flat Plates: A Literature Survey. NASA-TM-X-2778. 1973. Available online: https://ntrs.nasa.gov/citations/19730016200 (accessed on 21 July 2025).
- Wang, J.; Abe, A.; Koita, T.; Sun, M.; Wang, Y.; Huang, C. Study of sterilization effects on marine Vibrio sp. using interaction of cavitation with shock wave in a narrow water chamber. J. Appl. Phys. 2018, 124, 213301. [Google Scholar] [CrossRef]
- Koue, J.; Abe, A. Generation and behavior of underwater shock waves and microbubbles produced by metal plate discharge. In Proceedings of the 34th International Symposium on Shock Waves (ISSW34), Daegu, Republic of Korea, 16–21 July 2023. [Google Scholar]
- Roohi, E.; Pendar, M.R.; Rahimi, A. Simulation of three-dimensional cavitation behind a disk using various turbulence and mass transfer models. Appl. Math. Model. 2016, 40, 542–564. [Google Scholar] [CrossRef]
- Guha, A.; Barron, R.M.; Balachandar, R. An Experimental and Numerical Study of Water Jet Cleaning Process. J. Mater. Process. Technol. 2011, 211, 610–618. [Google Scholar] [CrossRef]
Disclaimer/Publisher’s Note: The statements, opinions and data contained in all publications are solely those of the individual author(s) and contributor(s) and not of MDPI and/or the editor(s). MDPI and/or the editor(s) disclaim responsibility for any injury to people or property resulting from any ideas, methods, instructions or products referred to in the content. |
© 2025 by the authors. Licensee MDPI, Basel, Switzerland. This article is an open access article distributed under the terms and conditions of the Creative Commons Attribution (CC BY) license (https://creativecommons.org/licenses/by/4.0/).