Abstract
Helical piles are widely used in geotechnical engineering, and their rapid installation and service reliability have attracted significant interest from the offshore wind industry. These piles are frequently subjected to cyclic loading in complex marine environments. Although the cyclic bearing behavior of helical piles has been studied, most research has focused on soil properties and loading conditions, with a limited systematic analysis of plate parameters. Moreover, the selection of plate parameters is not explicitly defined. As a crucial preliminary step in the capacity calculation, it is vital for the design of helical piles. To address this gap, the present study combines physical modeling tests and finite element simulations to systematically evaluate the influence of plate parameters on their cyclic bearing behavior. The parameters investigated include the plate depth, the plate diameter, plate spacing, and the number of plates. The results indicate that, under the same embedment conditions, cumulative displacement increases with the plate depth, with a critical embedment depth ratio of Hcr/D = 6 under cyclic loading conditions, but decreases with the number of plates. Axial stiffness increases with the plate depth, diameter, and number of plates, with an increase ranging from 0.5 to 3.0. However, the normalized axial stiffness decreases with these parameters, reaching a minimum value of 1.63. The plate spacing has a minimal influence on cyclic bearing behavior. Additionally, this study examines the evolution of displacement and stiffness parameters over repeated cycles in numerical simulations, as well as the post-cyclic pullout capacity of the helical pile foundation, which varies between −5% and +12%.
1. Introduction
Compared to traditional pile foundations, helical piles have seen significant development due to their numerous advantages, including their lightweight design, rapid installation, cost-effectiveness, short construction periods, immediate load-bearing capacity, and high pullout resistance [,]. As a result, they are widely used in geotechnical applications requiring pullout resistance, such as transmission tower foundations, test countermeasure systems, pipeline buoyancy control, and marine engineering []. Furthermore, helical piles are an environmentally friendly solution for marine foundations, as torque-driven installation reduces pollution, noise, and vibration during construction, thereby minimizing the impact on marine ecosystems []. Recently, helical piles have been proposed as a foundation solution for offshore wind turbines [,,], attracting considerable research attention regarding their vertical load-bearing capacity [,,]. However, these structures are frequently subjected to cyclic loads from wind and waves [,,], which are not currently addressed in existing design codes for helical piles []. Therefore, the reliability of bearing capacity calculations based solely on monotonic loading remains uncertain [].
Several researchers have conducted extensive studies on the cyclic bearing behavior of helical piles through physical modeling tests, numerical simulations, and field experiments.
In terms of physical modeling tests, Clemence et al. [] investigated the cyclic bearing behavior of helical piles in medium-dense sand. Their study examined the effects of the Qmean and Qcyclic on the cumulative displacement and bearing capacity, confirming that cyclic loading negatively affects the pullout capacity of helical piles. Newgard et al. [] performed physical modeling tests to examine the cyclic response of shallowly embedded helical piles in medium-dense sand. When subjected to cyclic loading near the ultimate capacity, the piles exhibited a rapid increase in cumulative displacement. Hao et al. [,] carried out small-scale physical modeling tests to evaluate the effects of the H, Qcyclic, f, and sand compactness on the cyclic behavior. The results showed a significant increase in cumulative displacement during the first 50 cycles. The axial stiffness increased rapidly and nonlinearly during the first 10 cycles. The post-cyclic pullout capacity varied between −15% and +10%. At f = 1 Hz, soil resonance was observed, resulting in damage. Schiavon et al. [] conducted three sets of cyclic loading physical modeling tests on helical piles using a centrifuge. The results indicated that a gap formed beneath the helical plate under cyclic loading. Additionally, cyclic loading reduced the frictional resistance between the pile and the surrounding soil. Consequently, the pullout bearing capacity was primarily provided by the helical plate, contributing approximately 90% of the total pullout capacity.
In terms of numerical simulations, Lee et al. [] observed that the displacement during the first loading cycle was relatively large, whereas the displacement in subsequent cycles was significantly smaller. The cyclic bearing behavior of helical piles could be categorized into three response types: stable, sub-stable, and unstable. In the stable response type, the cumulative displacement was minimal and tended to stabilize, and cyclic loading might even enhance the bearing capacity [,]. Huang et al. [] conducted numerical simulations to investigate the cyclic pullout behavior of helical piles with varying embedment depth ratios and diameter ratios in clay soil. The study examined the effects of the Qmean and Qcyclic on cumulative displacement, and a series of Qmean—Qcyclic interaction diagrams were developed.
In terms of field experiments, Cerato et al. [,] conducted field load tests on helical piles in soils containing quay formations. The results indicated that higher values of Qcyclic significantly reduced the pullout bearing capacity of the helical pile and that the Qcyclic had a greater influence on the pile’s dynamic response than the Qmax. Schiavon et al. [] performed field tests to evaluate the cyclic bearing behavior of helical piles. The results showed that the impact of cyclic loading on post-cyclic pullout capacity was not clearly evident across all tests. Additionally, the initial stiffness was significantly affected by the soil disturbance caused by the installation process.
In summary, the existing research has primarily focused on the cyclic bearing behavior of helical piles under varying cyclic loading parameters—Qmean, Qcyclic, Nf, and f—and different soil conditions, including the soil particle size, moisture content, and varying relative densities. However, studies examining the influence of plate parameters—including the plate depth H, the plate diameter D, plate spacing S, and the number of plates N—are relatively limited and lack a systematic analysis. Therefore, this paper aims to comprehensively investigate the influence of plate parameters on the cyclic bearing behavior of helical pile foundations by combining physical modeling tests and the finite element method (FEM).
2. Materials and Methods
2.1. Physical Modeling Tests
The helical pile structure is shown in Figure 1. In the small-scale physical modeling tests, the plate diameter ranges from 30 mm to 80 mm, with a scale ratio of 1:15 compared to the actual engineering size. The critical embedment depth of helical piles in sandy soil typically ranges from 5D to 8D [,,]. In practice, the number of plates is usually one to three, while the spacing between plates is approximately 3D. Accordingly, the design dimensions of single-plate helical piles used in the physical modeling tests are provided in Table 1. In line with relevant code specifications [], the ratios d/D = 1/5 and p/D = 1/4 are adopted.
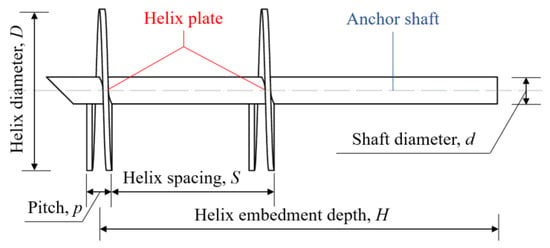
Figure 1.
Typical configuration of helical pile.

Table 1.
Design of helical piles in physical modeling tests.
This study focuses on investigating the influence of plate parameters on the cyclic bearing behavior of helical piles. The cyclic load versus time curve [,] is presented in Figure 2. Typically, cyclic loading is applied after the installation of the helical pile. The process begins with the application of a preload, represented by the average cyclic load Qmean, to simulate the historical loading experienced by the pile. This is followed by the application of cyclic loading, where Qcyclic denotes the load amplitude, Qmax represents the maximum load, and Qmin denotes the minimum load. Finally, a monotonic pullout test is performed. The key influencing parameters include Qmean, Qcyclic, the number of loading cycles Nf, and the loading frequency f. Considering that the safety factor under static load conditions is typically greater than or equal to 2, and that this study focuses on plate parameters while excluding extreme conditions, the cyclic load amplitude is relatively small, with the wave cyclic period generally ranging from 8 to 10 s. Therefore, the cyclic loading parameters are defined as follows: Qmean/Qu = 0.4, Qcyclic/Qu = 0.1, Nf = 100, and f = 0.1 Hz. Each pile configuration is subjected to both monotonic loading (M) and cyclic loading (C). The purpose of monotonic loading is to determine the ultimate bearing capacity, Qu.
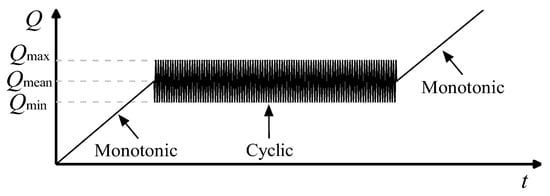
Figure 2.
Predefined cyclic loading protocol.
Sakai et al. [] conducted pullout physical modeling tests on helical piles using a cylindrical sandbox with a diameter of 4D, placing the helical plate directly on the bottom surface of the box. This setup did not produce significant boundary effects. Additionally, Shi et al. [,] performed physical modeling tests in a rectangular box with a width of 12D, where the bottom of the plate was positioned 1.5D above the base of the box. Their results confirmed that the tests were not influenced by boundary effects, as the maximum extension of the soil’s shear strain field beneath the plate was less than 1D. Based on these findings, a rectangular sandbox with dimensions of 1200 × 1000 × 1000 mm (length × width × depth) is used in the present study, as shown in Figure 3. The width of the box is 12.5 times the maximum plate diameter (D = 80 mm), and the distance between the bottom of the plate and the bottom of the sandbox exceeds 3D.
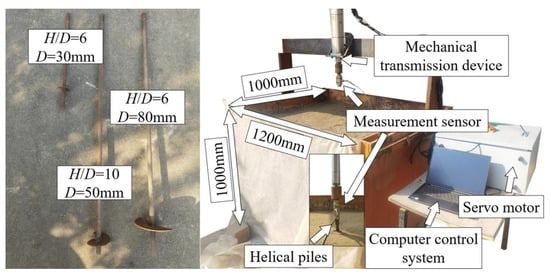
Figure 3.
Helical piles, sandbox, and loading devices.
The tests are conducted using an electric servo loading system (Aoxun Automation Equipment Co., Ltd., Nanjing, China) comprising four main components: a computer control system, a servo motor, a mechanical transmission device, and a measurement sensor. The primary functions of the computer control system include selecting the loading mode and acquiring displacement and load data. The mechanical transmission device is rigidly connected to the helical pile foundation, and its displacement can be considered equivalent to that of the foundation. The sandbox is filled with 800 mm of silty sand, sourced from the seabed of Tongzhou Bay in Nantong, using a layered compaction method. The determined soil weight is compacted to the specified height to ensure uniform compaction and meet the required specifications.
The geotechnical tests conducted included particle size analysis, relative compactness testing, and triaxial testing. The properties of the silty sand are given in Table 2.

Table 2.
Properties of silty sand.
2.2. Finite Element Numerical Simulation
2.2.1. Model Construction and Material Selection
Numerical simulations were performed using the Coupled Eulerian–Lagrangian (CEL) approach in the finite element software []. Owing to the symmetry of the soil, helical pile, and loading conditions, a half-model was adopted for the analysis. For the selection of soil boundaries, similar numerical models were referenced for the boundary setup [,,], and boundary effect calculations were conducted. When the horizontal extent of the soil domain was set to 10D, and the model thickness was defined as 2H, it was assumed that the numerical model would experience negligible boundary effects.
Additionally, an empty Eulerian domain of sufficient height was reserved above the soil model to accommodate soil movement during the pullout process, allowing the displaced soil to flow upward into this region, as illustrated in Figure 4. The friction coefficient between the rigid helical pile and the surrounding soil was set to 0.3. A reference point (RP1) was defined at the center of the top surface of the helical pile, and a coupling constraint was applied between RP1 and the top surface of the pile shaft.
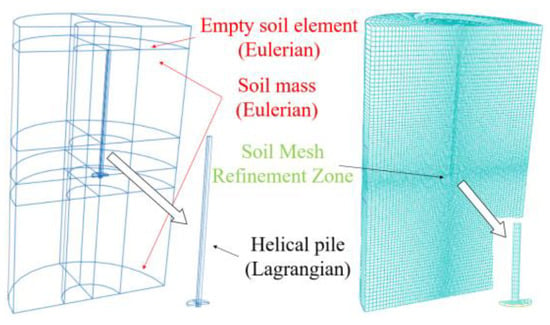
Figure 4.
Finite element model of helical piles and soil.
Boundary conditions were specified such that the bottom surface was fixed in the vertical direction, while the side surfaces were constrained in the horizontal direction. A three-dimensional eight-node linear reduced integration hexahedral element mesh was used for discretization [,]. The helical pile was meshed using C3D8R elements, and the soil domain was discretized with EC3D8R elements. Mesh refinement was employed around the plate region to enhance computational accuracy. The CEL results are influenced by mesh size to some extent, so a parameter analysis was conducted to check and determine the most suitable size for the Eulerian mesh. It was found that Δb/D = 0.125 provided the best results, where Δb represents the smallest edge length of the soil mesh.
The foundation soil is classified as Nantong silty sand, with the relevant geotechnical investigation data summarized in Table 3. The silty sand exhibits a compactness ranging from slightly dense to medium dense. Due to local interlocking between soil particles, the material exhibits slight shear dilation, resulting in a minor increase in both the internal friction angle and dilation angle until the peak value is reached. As strain continues to increase, the soil experiences strain softening, and both the internal friction angle and dilation angle gradually decrease to the critical value. In reality, the internal friction angle and dilation angle change nonlinearly with strain, but for simplicity, their variation is described in three linear stages [,,]. The soil behavior is modeled using the Modified Mohr–Coulomb (MMC) plasticity model [], as illustrated in Figure 5.

Table 3.
Geotechnical survey data of silty sand in Nantong City.
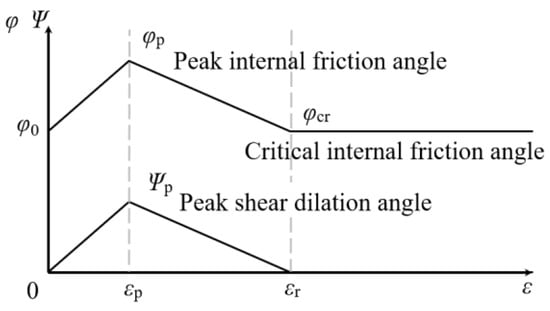
Figure 5.
Soil constitutive model of MMC.
According to Table 3, representative values were selected for the soil parameters: density ρ = 1949 kg/m3, peak internal friction angle φp = 25°, and cohesion c = 0. Based on the MMC model [,], the plastic strain values were set as εp = 0.02 and εr = 0.2. Due to the presence of fine particles in the silty sand, voids between larger grains tend to be filled during shearing, resulting in a dilatancy angle Ψ that is approximately zero. Referring to the values proposed by Hao et al. [,] and the formula from Bolten [], the critical internal friction angle φcr was taken as 24°, which is slightly lower than the peak value. Additionally, based on the findings of Lv et al. [], Hsu et al. [], and the Engineering Geology Handbook [], the elastic modulus of the soil was set to E = 17 MPa, and Poisson’s ratio was ν = 0.3. For the steel used in the helical pile foundation, the material parameters were defined as follows: ρ = 7850 kg/m3, E = 210 GPa, and ν = 0.25.
2.2.2. The Validation of the Finite Element Model
The numerical model was validated using both field test data and the physical modeling test condition TH10S2. Axial stiffness, defined as shown in Figure 6, refers to the loading stiffness within a loading–unloading cycle. The normalized axial stiffness is expressed as βk = kN/k1. When the pullout bearing capacity is the same, the vertical displacement difference between the field test and numerical simulation is approximately 1 mm, and the curve overall trends are consistent, as shown in Figure 7. Figure 8a,b present comparison curves between the physical modeling tests and numerical simulations. In Figure 8a, the curves from the numerical simulation and the physical modeling tests exhibit a high degree of overlap. The trends are consistent, and both the ultimate bearing capacity and ultimate displacement show good agreement. In Figure 8b, kN/k1 from the physical modeling tests increases nonlinearly and rapidly during the first 10 cycles then remains nearly constant over the subsequent 10 cycles. In contrast, the finite element simulation results exhibit a continuously nonlinear increase over all 20 cycles, with a slower growth rate during the second half. This discrepancy may be attributed to the idealized nature of the soil model in the simulation, which allows for a smoother development of normalized stiffness. A fitting analysis was performed on the data from the first 20 cycles to predict the subsequent changes in parameters. The results from the numerical simulation are slightly higher than those from the physical modeling tests, with an error of less than 1%. This indicates that the simulation approach employed is both reasonable and reliable for investigating the cyclic bearing behavior of helical pile foundations.
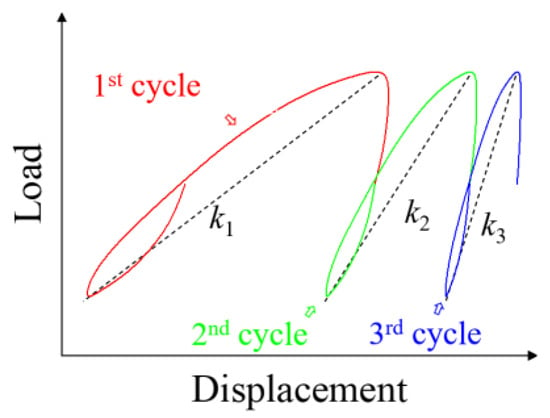
Figure 6.
Definition of axial stiffness.
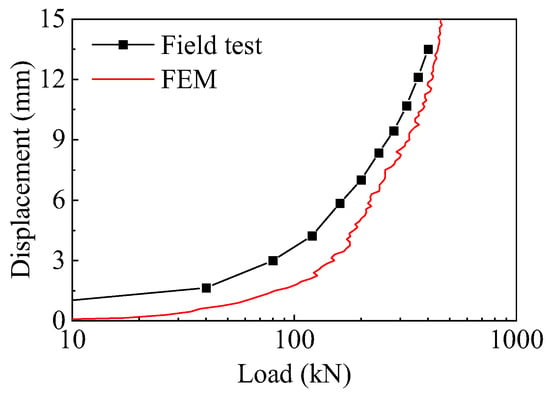
Figure 7.
Comparison between FEM and field test.
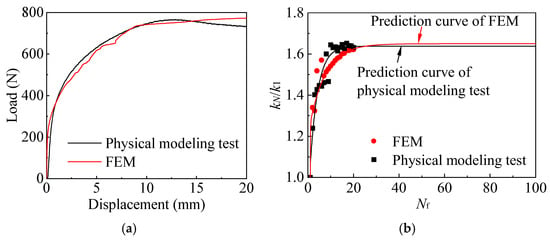
Figure 8.
Comparison between FEM and physical modeling test: (a) load–displacement curve and (b) kN/k1–Nf curve.
2.2.3. Simulation Conditions in FEM
To more accurately capture the cyclic pullout bearing behavior of helical piles, a full-scale model was employed in the numerical simulations, with plate diameters ranging from 500 mm to 1200 mm. Building upon the physical modeling tests, the range of values for plate depth, number of plates, and plate spacing was extended, as presented in Table 4. The cyclic loading parameters are kept constant with Qmean/Qu = 0.4, Qcyclic/Qu = 0.1, and f = 0.1 Hz. However, this section focuses on further analysis of the number of loading cycles. According to the French pile foundation code [], an equivalent number of cycles Neq = 100 was recommended for simulating typhoon-induced cyclic loading. Lu [], referencing the large-magnitude cyclic loading conditions proposed by Abadie [], adopted 12 cycles to represent typhoon loading. Moreover, finite element simulations with Nf = 100 may require up to 50 million incremental steps, making high-cycle simulations computationally intensive. For instance, Lee et al. [] used a similar finite element approach to investigate wave-induced cyclic loading on helical piles, but limited the number of cycles to just 10. These findings highlight the considerable challenges of modeling high-cycle loading conditions numerically. Consequently, this study includes a detailed analysis of the parameter Nf.

Table 4.
Design of helical piles and loading conditions in numerical simulations.
3. Results
3.1. Results from Physical Modeling Tests
Figure 9 illustrates the failure process of the soil surface under both shallow and deep embedment conditions. During loading, SH4 exhibited prominent surface cracks, approximately 1 cm wide, along with considerable soil bulging. In contrast, SH10 displayed only minor surface cracks during loading, without any noticeable soil bulging.
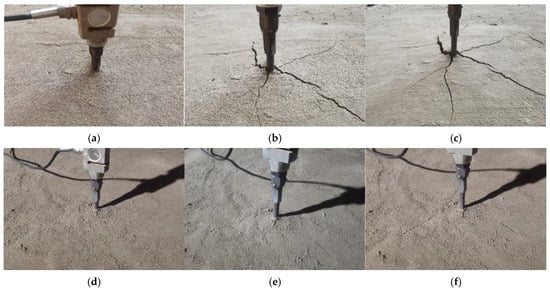
Figure 9.
Surface failure process of silty sand: (a–c) SH4 and (d–f) SH10.
Figure 10 illustrates the variation in the displacement and stiffness of single-plate helical piles with different embedment depths and diameters under cyclic loading. In this context, uN denotes the cumulative displacement, while uaN represents the rate of the cumulative displacement growth, where uaN = uN − uN−1.
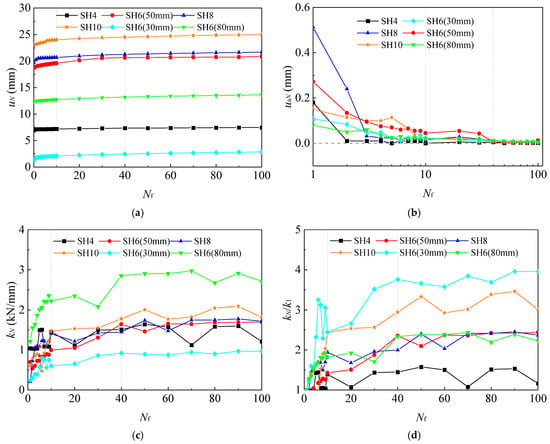
Figure 10.
Cyclic response curves of different H/D and D: (a) uN–Nf curves; (b) uaN–logNf curves; (c) kN–Nf curves; and (d) kN/k1–Nf curves.
As shown in Figure 10a,b, it can be observed that uN increases rapidly during the first 10 cycles. Between 10 and 40 cycles, uN continues to increase but at a slower rate. After 40 cycles, uaN gradually stabilizes and approaches zero, indicating that the helical pile has entered a stable cyclic response state. A clear positive correlation is observed between uN and the embedment depth H. In contrast, the relationship between uN and D is less pronounced. Figure 10c,d show that kN increases rapidly in the first 10 cycles, continues to grow slowly between 10 and 40 cycles, and becomes nearly constant in the final 60 cycles—a trend similar to that of uN. This further suggests that the helical piles reach a near-linear response state after 60 loading cycles. In addition, both kN and kN/k1 exhibit a positive correlation with the embedment depth H. For different plate diameters (D = 30, 50, and 80 mm), the kN values are 0.98 kN/mm, 1.98 kN/mm, and 2.71 kN/mm, respectively, while the kN/k1 values are 3.96, 2.84, and 2.22. These results indicate a strong positive correlation between D and kN and a significant negative correlation between D and kN/k1.
Figure 11 illustrates the variation in the displacement and stiffness of multi-plate helical piles with different plate spacings and numbers of plates under cyclic loading. Both uN and kN tend to stabilize around the 40th loading cycle. Except for DH10S2, which shows a higher uN compared to DH10S3 and DH10S4, the differences in uN, kN, and kN/k1 among various plate spacings are minimal and do not exhibit a clear trend. With respect to the number of plates, although N = 3 results in a lower uN compared to N = 2, the axial stiffness at the 100th loading cycle (k100) is higher at 2.70 kN/mm, while the k100/k1 is lower at 1.7.
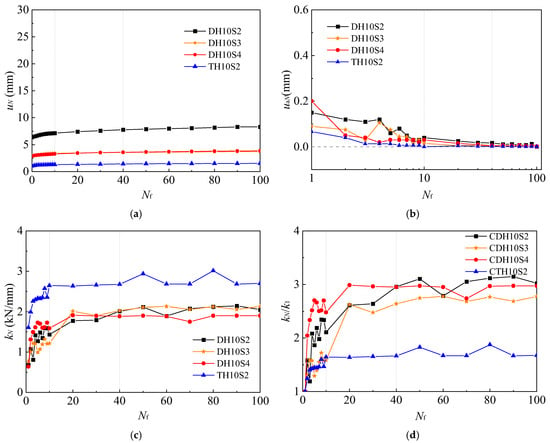
Figure 11.
Cyclic response curves of different S/D and N: (a) uN–Nf curves; (b) uaN–logNf curves; (c) kN–Nf curves; and (d) kN/k1–Nf curves.
This study faces common challenges typically encountered in small-scale 1 g physical modeling tests in geotechnical engineering: (1) the stress levels in the soil during testing are lower than those under real-world conditions; (2) issues related to scaling laws; and (3) the influence of the ratio between the soil particle size and helical pile dimensions. Due to these limitations, the quantitative results obtained from the tests may not fully reflect the actual bearing behavior of helical piles.
3.2. Results from Numerical Simulations
Figure 12 presents a comparison of the cyclic response at different numbers of loading cycles. In Figure 12a, during the initial stage of cyclic loading (the first 20 cycles), the cumulative displacement increases rapidly, with u20 exceeding 95% of u100, marking the rapid response phase. From the 20th to the 50th cycle, the accumulation slows significantly, resulting in only minor increases in displacement—this phase is referred to as the slow accumulation stage. Between the 50th and 100th cycles, uN shows almost no further increase, and the displacement curves for the 50th and 100th cycles nearly overlap, indicating an elastic deformation state. In Figure 12b, kN increases rapidly and nonlinearly during the first 20 cycles and then tends to stabilize over the subsequent 80 cycles. Specifically, k1 is approximately 12 kN/mm, while k20, k50, and k100 are 28.9 kN/mm, 29.8 kN/mm, and 30.2 kN/mm, respectively. Correspondingly, the values of βk are 2.41, 2.48, and 2.52.
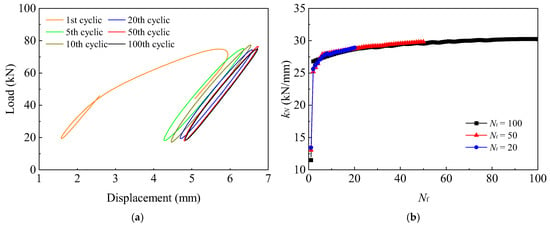
Figure 12.
Comparison of different Nf: (a) cyclic hysteresis curve and (b) kN–Nf curves.
Figure 13 illustrates the displacement and stiffness for different H/D ratios. As the number of cycles increases, the hysteresis loops gradually shift to the right, reflecting the cumulative loading effect on the surrounding soil, which results in an increase in the foundation displacement. For both cases where H/D < 6 and H/D > 6, both exhibit a positive correlation between uN, kN, kN/k1, and the H/D. However, a sharp drop occurs near H/D = 6, which may be associated with a change in the failure mechanism of the helical piles during pullout. In monotonic loading studies, numerous researchers [,,] have reported that as H/D increases, the failure mechanism transitions from shallow embedment to deep embedment. This observation led to the proposal of a critical embedment depth ratio, Hcr/D, with H/D = 6 falling within the reasonable range for this transition.
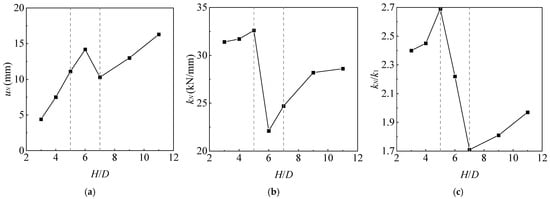
Figure 13.
Displacement and stiffness for different H/D: (a) uN-H/D curve; (b) kN–H/D curve; and (c) kN/k1–H/D curve.
In the study of factors affecting the plate diameter, two scenarios are considered: one with a constant H/D ratio (D = 500 mm, 810 mm, 900 mm, 1000 mm) and another with a constant H (D = 600 mm, 900 mm, 1200 mm). Furthermore, both uN and kN are positively correlated with D, while kN/k1 is negatively correlated with D, regardless of whether H/D or H is held constant, as shown in Figure 14. This trend is more pronounced when H is kept constant.
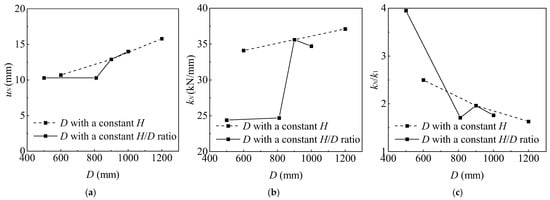
Figure 14.
Displacement and stiffness for different D: (a) uN-D curve; (b) kN–D curve; and (c) kN/k1–D curve.
Figure 15 and Figure 16 display the cyclic response curves of multi-plate helical piles. No clear pattern is observed for kN and kN/k1, except that uN is positively correlated with S/D. Moreover, as the N increases, uN decreases, kN increases, and kN/k1 decreases, which is consistent with the experimental observations.
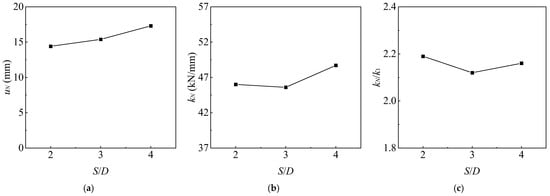
Figure 15.
Displacement and stiffness for different S/D: (a) uN-S/D curve; (b) kN–S/D curve; and (c) kN/k1–S/D curve.
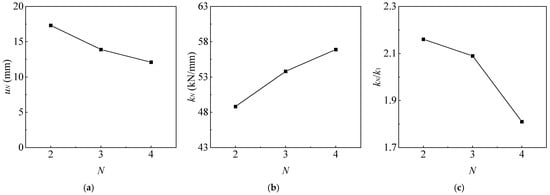
Figure 16.
Displacement and stiffness for different N: (a) uN-N curve; (b) kN–N curve; and (c) kN/k1–N curve.
4. Discussion
4.1. The Variation in the Soil Around Plates with the Number of Cycles
Figure 17 and Figure 18 show the soil stress and plastic strain contour maps corresponding to Nf = 0, 20, 50, and 100 under the same load at the end of cyclic loading. The soil stress and strain refer to the vertical compressive stress S33 and vertical compressive plastic strain PE33. In the stress contour maps, the minimum value represents the maximum compressive stress. During the pullout process of the plate from the foundation, the overlying soil is compressed, forming a concentrated stress zone within a certain height above the plate. The maximum compressive stress increases with the number of load cycles, although the rate of increase gradually decreases. The maximum stress values for Nf = 50 and 100 are approximately the same. Moreover, compared to monotonic loading, the plastic strain zones for Nf = 20, 50, and 100 are similar and significantly larger than that of Nf = 0. This indicates that the “pile–soil” system exhibits a relatively rapid cyclic response during the early stages of cyclic loading, which warrants investigation.
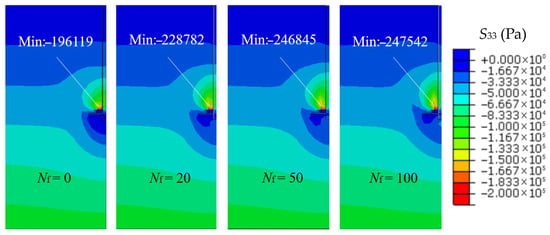
Figure 17.
Contour maps of stress with different numbers of cycles.
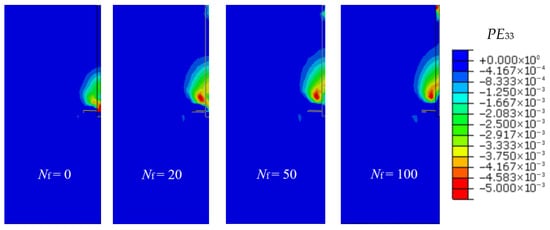
Figure 18.
Contour maps of strain with different numbers of cycles.
4.2. The Effect of Plate Parameters on the Soil Around Plates
4.2.1. Effect of Plate Depth
Figure 19 and Figure 20 present the stress and strain contour maps under the 20th cyclic Qmax loading condition at different H/D ratios. Under cyclic loading, the soil surrounding the plate undergoes repeated shearing. At the same embedment depth condition (H/D ≤ 5 and H/D ≥ 7), as H/D increases, the magnitude of the cyclic loading becomes larger, the surrounding soil imposes stronger lateral constraints, and the interaction force between the plate and the soil intensifies. This leads to the stress concentration and increased strain. In other words, higher H/D ratios are associated with greater uN and kN. However, from H/D = 6 to H/D = 7, the maximum compressive stress decreases from 378 kPa to 228 kPa, and correspondingly the soil strain is reduced. This phenomenon supports the transition of the plate from the shallow to deep embedment.
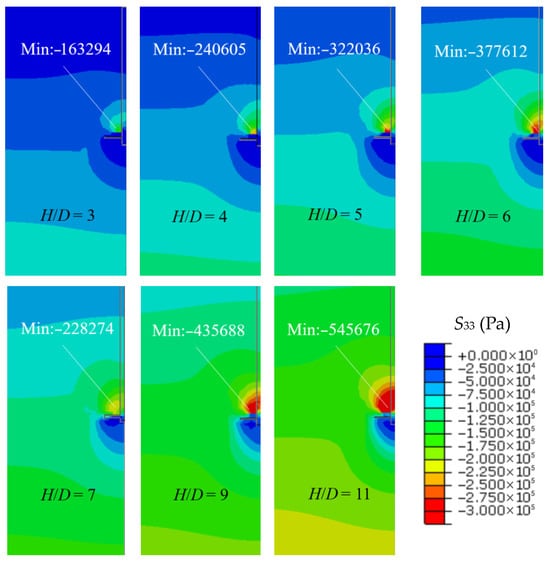
Figure 19.
Contour maps of stress under the 20th cyclic Qmax loading condition for different H/D.
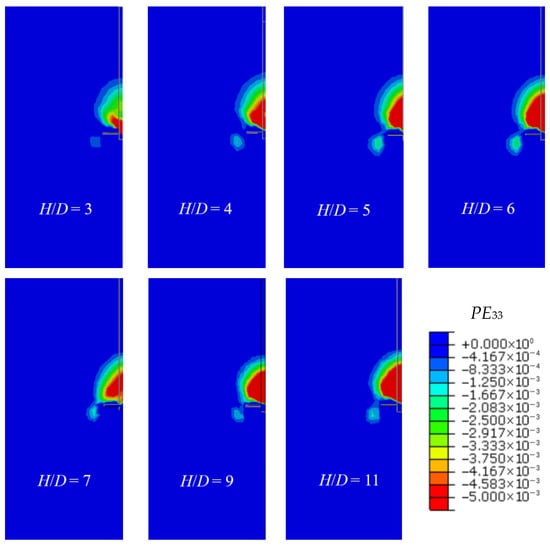
Figure 20.
Contour maps of strain under the 20th cyclic Qmax loading condition for different H/D.
4.2.2. Effect of Plate Diameter
During the upward pulling of the plate, a larger diameter (D) creates a wider disturbance zone in the surrounding soil, forming a more extensive “pile–soil” interaction system. Consequently, the surrounding soil bears a greater portion of the load, leading to a higher kN. In contrast, for small-diameter plates, the disturbance zone is limited, and soil particles are rearranged and concentrated closer to the plate, resulting in a lower kN. This pattern is particularly evident when H remains constant, as shown in Figure 21 and Figure 22.
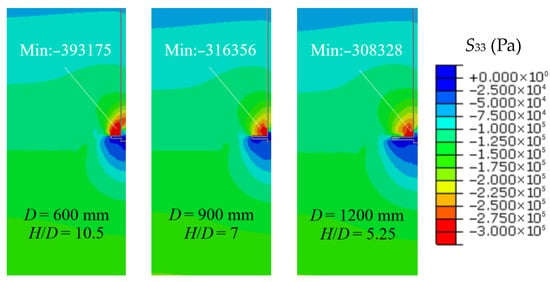
Figure 21.
Contour maps of stress under the 20th cyclic Qmax loading condition for different D.
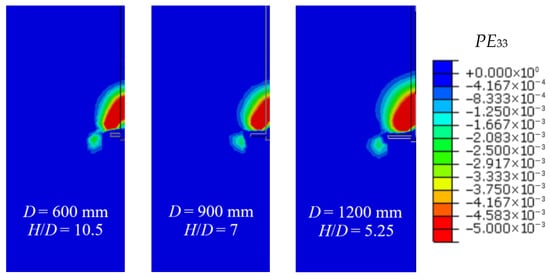
Figure 22.
Contour maps of strain under the 20th cyclic Qmax loading condition for different D.
4.2.3. The Effect of the Number of Plates
Figure 23 and Figure 24 illustrate the stress and strain contour maps under the 20th cycle Qmax loading conditions for different numbers of plates (N). In multi-plate helical piles (N = 2, 3, 4), the applied load is distributed among the plates. The soil stress is highest above the bottom plate and lowest above the top plate. Due to the load-sharing effect, each plate bears a portion of the load. As the number of plates increases, more surrounding soil enters a plastic strain state, thereby expanding the effective “pile–soil” interaction system, reducing the overall soil deformation and decreasing the load carried by each individual plate. This ultimately results in lowering the soil stress above each plate.
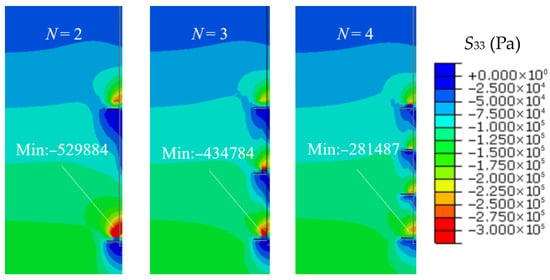
Figure 23.
Contour maps of stress under the 20th cyclic Qmax loading condition for different N.
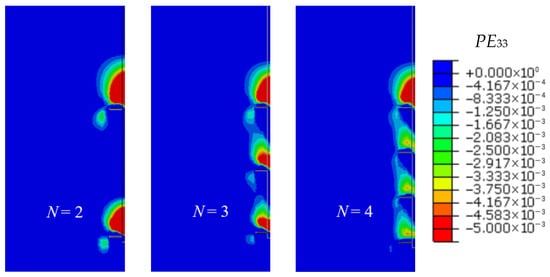
Figure 24.
Contour maps of strain under the 20th cyclic Qmax loading condition for different N.
4.3. Sensitivity Analysis and Explanation of Plate Parameters
For offshore helical pile foundations, both the bearing capacity and displacement are critical parameters in engineering applications. To analyze the sensitivity of plate parameters, a relationship curve between the bearing capacity and cumulative displacement is established, as shown in Figure 25. Under cyclic loading conditions, the curves corresponding to the plate depth and the number of plates display steeper slopes, while those for the plate diameter and spacing exhibit gentler slopes. This is because, although plate spacing has a limited influence on cumulative displacement, it also contributes only marginally to the bearing capacity. In contrast, the plate diameter has a significant impact on both the cumulative displacement and bearing capacity.
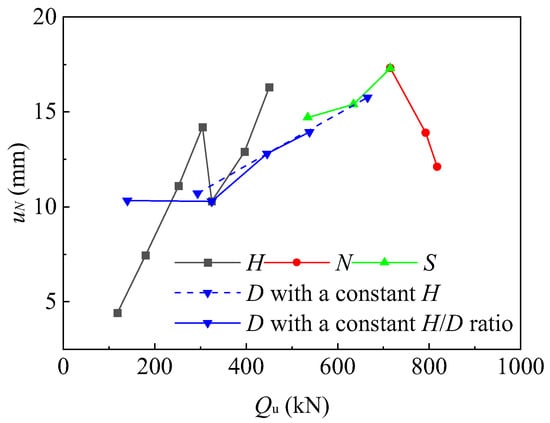
Figure 25.
Sensitivity analysis of plate parameters.
Additionally, as shown in Figure 25, cumulative displacement generally increases with the rising ultimate bearing capacity. However, a decreasing trend is observed at the critical embedment depth ratio and with an increasing number of plates. As shown in Figure 13, when the embedment depth ratio (H/D) transitions from five to six, the cumulative displacement increases while the axial stiffness decreases. In contrast, when H/D transitions from six to seven, the cumulative displacement decreases and the axial stiffness increases. According to previous studies [,,], when the helical pile is shallowly embedded (H/D ≤ 5), the slip surface reaches the ground surface, as illustrated in Figure 26a. When deeply embedded (H/D ≥ 7), the slip surface is confined within the soil, as shown in Figure 26c. During the transitional phase, the failure surface is depicted in Figure 26b. As the helical pile transitions from shallow to transitional embedment, its bearing mechanism changes. The “pile–soil” bearing system contracts, the axial stiffness decreases, and the load increases, resulting in increased cumulative displacement. Conversely, as the pile transitions from transitional to deep embedment, the soil stress level increases and the axial stiffness rises. In this case, the increase in the axial stiffness outweighs the increase in the load, leading to a reduction in cumulative displacement. Furthermore, as the number of plates increases, the extent of the “pile–soil” bearing system expands and the axial stiffness improves. Similarly, the increase in the axial stiffness surpasses that of the load, resulting in reduced cumulative displacement.
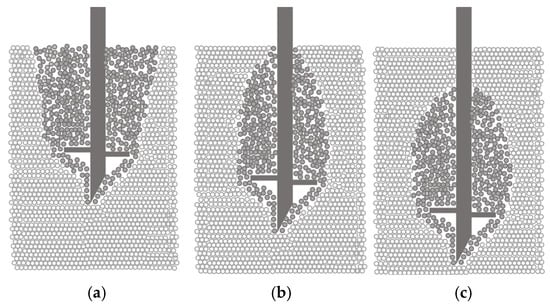
Figure 26.
Flow of soil particles: (a) shallow embedment; (b) transitional state; and (c) deep embedment.
Therefore, in the design of helical piles, if the effect of cyclic loading is to be considered, the helical plates should be deeply embedded, and the number of plates should be appropriately increased.
4.4. Post-Cyclic Pullout Capacity
The pullout capacity of helical piles is largely unaffected by cyclic loading, with the range of changes in the pullout capacity after cycling being from −5% to 12%. Taking different H/D ratios as examples in the numerical simulations, the Qu for H/D = 3, 5, 7, 9, and 11 are 118 kN, 270 kN, 353 kN, 433 kN, and 493 kN, respectively. The corresponding post-cyclic monotonic ultimate bearing capacities (Qc) are 119 kN, 272 kN, 356 kN, 438 kN, and 496 kN, respectively. The ratios of the cyclic to monotonic capacity, βcyc = Qc/Qu, are 1.008, 1.007, 1.009, 1.012, and 1.006, respectively, indicating that while the ultimate bearing capacity after cyclic loading slightly increases, it remains essentially unchanged.
From the perspective of the hysteresis curve, as shown in Figure 27, the response of the helical pile foundation under cyclic loading resembles the compression–rebound–recompression curve observed during unloading and reloading after an initial pressure pi is applied in a one-dimensional soil consolidation test. In the cyclic jacking of a helical pile, the soil above the plate is compressed, while in laboratory tests, the soil below is subjected to loading. The resulting stress–strain responses can be interpreted as hysteresis loops for a single cycle. In the laboratory, soil deformation consists of both recoverable elastic deformation and irrecoverable residual deformation. When the applied pressure exceeds pi, the recompression curve continues seamlessly from the compression curve, as though no unloading–reloading occurred. This aligns with the observed phenomenon that cyclic loading has a negligible impact on the subsequent pullout capacity of helical piles.
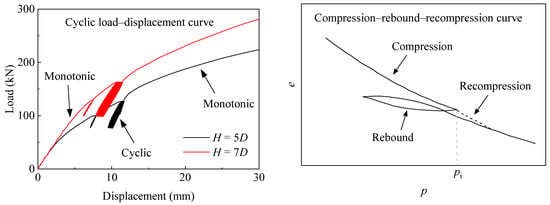
Figure 27.
Comparison of hysteresis curve.
From the perspective of stress and strain distributions, Figure 28 and Figure 29 present the 50 mm soil stress and strain contour maps before and after cyclic loading, respectively. The maximum compressive stress, the shape of the “stress bubble”, and the extent of the strain zones are nearly identical in both cases, further confirming that cyclic loading has a minimal influence on the post-cyclic pullout capacity of helical piles.
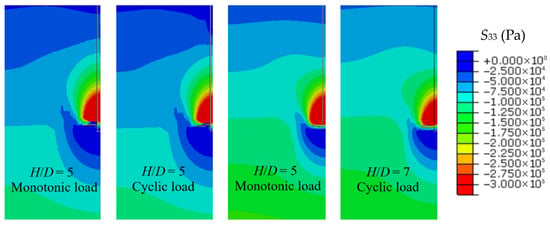
Figure 28.
Contour maps of stress at 50 mm before and after cyclic loading.
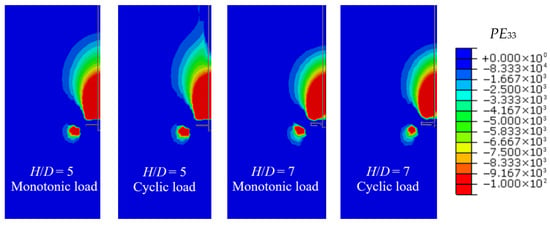
Figure 29.
Contour maps of strain at 50 mm before and after cyclic loading.
In summary, it can be concluded that cyclic loading has a minimal effect on the post-cyclic pullout capacity of the helical pile. However, the variation in the post-cyclic pullout capacity observed in the physical modeling tests is larger than that in the numerical simulations. This discrepancy arises because ensuring completely consistent test conditions across the various physical modeling tests is challenging. Among the physical modeling tests, the plate depth has the greatest influence on the post-cyclic pullout capacity, with a bearing capacity variation ranging from −4% to 12%. In contrast, the most influential parameter in the numerical simulations is the plate diameter, with a bearing capacity variation ranging from −1.4% to 2.7%.
5. Conclusions
Geotechnical tests were conducted on Nantong silty sand to determine its physical and mechanical properties, and a verification of the numerical model was performed. A combined approach involving physical modeling tests and numerical simulations was employed to investigate the influence of plate parameters on the cyclic loading behavior of helical piles, with a focus on the cumulative displacement and axial stiffness. Additionally, analyses were carried out on the soil stress and strain behavior, parameter sensitivity, and variations in the post-cyclic pullout capacity.
It is worth noting that the physical modeling tests in this study were conducted using small-scale models under 1 g conditions, which may not fully represent the behavior of full-scale helical piles in practical applications. According to the detailed discussion of scale effects in sand by Chen et al. [], and the comparison between Hao’s small-scale 1 g numerical simulations [] and 20 g centrifuge tests [], it is evident that the extent of the soil failure around the plate varies and that both the ultimate bearing capacity and failure displacement differ. Nevertheless, the embedment condition of the helical plates can generally be categorized into two types—shallow and deep embedment—and the failure mechanisms remain consistent under the same embedment condition. Moreover, both the ultimate pullout bearing capacity and the failure displacement increase with an increase in the embedment depth ratio. Floravante [] conducted centrifuge tests on piles in sand, examining circular piles with varying ratios of the pile diameter (B) to the characteristic sand particle size (d50). These tests revealed that when this ratio exceeds a critical threshold, the scaling effect of soil particles becomes negligible. A critical ratio of 40–50 was deemed appropriate, and the ratio adopted in this study meets this requirement.
Therefore, on one hand, general conclusions can be drawn from the physical modeling tests. On the other hand, these tests offer valuable visual insights into failure behavior, enable the observation of soil particle movement, and assist in interpreting the results. The quantitative conclusions presented in this study are primarily derived from full-scale numerical simulations. Based on the above analysis and discussion, the following conclusions can be drawn:
(1) In the numerical simulations, u20 and k20 at the 20th cycle exceed 95% of those observed at the 100th cycle. Additionally, the strain distributions after cyclic loading are similar across different cycle counts but show differences compared to those under monotonic loading conditions.
(2) Under cyclic loading, the embedment state of the helical plate is divided into shallow and deep embedment states. The critical embedment depth ratio is Hcr/D = 6. Within the same embedment state, the stress concentration and strain accumulation increase with higher H/D ratios, leading to a greater uN and a higher kN.
(3) Increasing the plate diameter or the number of plates enhances the coverage of the “pile–soil” bearing system, thereby improving its cyclic axial stiffness. In this study, the axial stiffness increases by a factor ranging from 0.5 to 3.0.
(4) Within the scope of this study, both the results from the physical modeling tests and numerical simulations indicate that the plate spacing has a minimal impact on the cyclic bearing behavior of the helical piles.
(5) The deep embedding of the plate and an increased number of plates can effectively reduce cumulative displacement. In offshore engineering, it is recommended that helical plates be deeply embedded and the number of plates be appropriately increased.
(6) The load–displacement curve of the helical pile under cyclic loading resembles the compression–rebound–recompression pattern commonly observed in soil behavior. Cyclic loading has a minimal impact on the subsequent pullout capacity of the helical pile, with variations ranging from −5% to +12%.
Author Contributions
Conceptualization, F.G. and X.Z.; Methodology, W.D.; Software, F.G. and X.Z.; Validation, K.S.; Resources, X.W.; Data curation, F.G. and X.W.; Writing—original draft, W.D. and F.G.; Writing—review and editing, F.G. and W.D.; Supervision, K.S.; Funding acquisition, X.Z. All authors have read and agreed to the published version of the manuscript.
Funding
This research was funded by the National Natural Science Foundation of China, grant number 52378329.
Data Availability Statement
The original contributions presented in this study are included in the article. Further inquiries can be directed to the corresponding author.
Conflicts of Interest
Author Kanmin Shen was employed by the company Huadong Engineering Co., Ltd. The remaining authors declare that the research was conducted in the absence of any commercial or financial relationships that could be construed as a potential conflict of interest.
References
- Alexander, M. On sub-marine foundations; particularly the screw-pile and moorings. J. Franklin Inst. 1848, 45, 393–396. [Google Scholar] [CrossRef]
- Zhang, P.; Xiong, L.; Le, C.; Dong, H.; Ding, H. Comparison analysis of the bearing capacity of rock-socketed piles and sand piles for offshore wind turbines. J. Southeast Univ. 2023, 39, 384–392. [Google Scholar] [CrossRef]
- Cong, X.; Li, Z.; An, Z.; Liu, J.; Han, Y. Bearing performance of a helical pile for offshore photovoltaic under horizontal cyclic loading. J. Mar. Sci. Eng. 2024, 12, 1826. [Google Scholar] [CrossRef]
- Ullah, S.; Hu, Y.; O’Loughlin, C. A green foundation for offshore wind energy–helical piles. In Proceedings of the World Engineers Convention (WEC2019), Melbourne, Australia, 20–22 November 2019. [Google Scholar]
- Mohammad, E.; Abolfazl, E. Experimental study on performance and enhanced methods of helical piles using frustum confining vessel in anzali sand. Ocean Eng. 2025, 324, 120624. [Google Scholar] [CrossRef]
- Byrne, B.W.; Houlsby, G.T. Helical piles: An innovative foundation design option for offshore wind turbines. Philos. T. R. Soc. A 2015, 373, 20140081. [Google Scholar] [CrossRef] [PubMed]
- Zhou, S.; Zhou, M.; Tian, Y.; Zhang, X. Effects of strain rate and strain softening on the installation of helical pile in soft clay. Ocean Eng. 2023, 285, 115370. [Google Scholar] [CrossRef]
- Wang, L.; Chen, H.; Tian, Y. The Influence of the shaft on the uplift capacity of single-plate helical pile in clay. J. Mar. Sci. Eng. 2023, 11, 955. [Google Scholar] [CrossRef]
- Lin, Y.; Xiao, J.; Le, C.; Zhang, P.; Chen, Q.; Ding, H. Bearing characteristics of helical pile foundations for offshore wind turbines in sandy soil. J. Mar. Sci. Eng. 2022, 10, 889. [Google Scholar] [CrossRef]
- Ammar, A.; Mais, M. Innovations in offshore wind: Reviewing current status and future prospects with a parametric analysis of helical pile performance for anchoring mooring lines. J. Mar. Sci. Eng. 2024, 12, 1040. [Google Scholar] [CrossRef]
- Wang, Y. Study on Cyclic Bearing Characteristics of Suction Caisson Foundation with Local Scour. Master’s Thesis, Southeast University, Nanjing, China, 2024. [Google Scholar]
- Liu, Y.; Xu, P.; Liu, X.; Ma, S.; Huang, Z. Weakening characteristics of pile group foundations in clayey soil under vertical cyclic loading: Experimental and numerical investigation. Ocean Eng. 2024, 313, 119317. [Google Scholar] [CrossRef]
- Wang, L.; Zhang, T.; Cheng, X.; Xu, W.; Shen, Z.; Rui, S.; Tian, Y. Numerical investigation on the suction caisson response considering seabed trenches and cyclic loading. Ocean Eng. 2025, 315, 119839. [Google Scholar] [CrossRef]
- DL/T 5219–2023; Power Industry Standards of the People’s Republic of China. Code for Design of Foundation of Overhead Transmission Line. China Planning Press: Beijing, China, 2023.
- Masatoshi, W.; Kohji, T.; Sakae, M.; Masamichi, S. Effects of cyclic vertical loading on bearing and pullout capacities of piles with continuous helix wing. Soils Found. 2017, 57, 141–153. [Google Scholar] [CrossRef]
- Clemence, S.P.; Smithling, A.P. Dynamic uplift capacity of helical anchors in sand. Civ. Eng. Pract. Des. Eng. 1983, 2, 88–93. [Google Scholar] [CrossRef]
- Newgard, J.; Schneider, J.; Thompson, D. Cyclic response of shallow helical anchors in a medium dense sand. In Frontiers in Offshore Geotechnics III; CRC Press: Boca Raton, FL, USA, 2015; pp. 913–918. [Google Scholar] [CrossRef]
- Hao, D.; Che, J.; Chen, R.; Zhang, X.; Yuan, C.; Chen, X. Experimental investigation on behavior of single-helix anchor in sand subjected to uplift cyclic loading. J. Mar. Sci. Eng. 2022, 10, 1338. [Google Scholar] [CrossRef]
- Hao, D.; Chen, R.; Yuan, C.; Kong, G.; Shi, D. Centrifugal model tests on cyclic uplift performance of wished-in-place helical anchors in dense sand. Chin. J. Rock Mech. Eng. 2021, 40, 2896–2904. [Google Scholar] [CrossRef]
- Schiavon, J.A.; Tsuha, C.H.C.; Thorel, L. Cyclic and post-cyclic monotonic response of a single-helix anchor in sand. Geotech. Lett. 2017, 7, 11–17. [Google Scholar] [CrossRef]
- Lee, J.; Kwon, O.; Kim, I.; Kim, G.; Lee, J. Cyclic pullout behavior of helical anchors for offshore floating structures under inclined loading condition. Appl. Ocean Res. 2019, 92, 101937. [Google Scholar] [CrossRef]
- Tsuha, C.H.C.; Foray, P.Y.; Jardine, R.J.; Yang, Z.X.; Silva, M.; Rimoy, S. Behaviour of displacement piles in sand under cyclic axial loading. Soils Found. 2012, 52, 393–410. [Google Scholar] [CrossRef]
- Jardine, R.J.; Standing, J.R. Field axial cyclic loading experiments on piles driven in sand. Soils Found. 2012, 52, 723–736. [Google Scholar] [CrossRef]
- Huang, Y.; Zong, Z.; Wang, P.; Lai, Y. Experimental and numerical investigation of cyclic behavior in single-helix anchors embedded in clay under vertical uplift loading. Comput. Geotech. 2025, 183, 107199. [Google Scholar] [CrossRef]
- Cerato, A.B.; Victor, R. Effects of long-term dynamic loading and fluctuating water table on helical anchor performance for small wind tower foundations. J. Perform Constr. Fac. 2009, 23, 251–261. [Google Scholar] [CrossRef]
- Buhler, R.; Cerato, A.B. Design of dynamically wind-loaded helical piers for small wind turbines. J. Perform Constr. Fac. 2010, 24, 417–426. [Google Scholar] [CrossRef]
- Schiavon, J.A.; Cavalcanti Tsuha, C.H.C.; Thorel, L. Monotonic, cyclic and post-cyclic performances of single-helix anchor in residual soil of sandstone. J. Rock. Mech Geotech. 2019, 11, 824–836. [Google Scholar] [CrossRef]
- Zhang, C. Bearing Characteristics of Helical Anchor Foundation in Sand. Master’s Thesis, Southeast University, Nanjing, China, 2019. [Google Scholar]
- Mohsen, S.; Shojaee, N.M. Displacement field around an uplifting innovated plate anchor. Acta Geodyn. Geomater. 2020, 17, 119–132. [Google Scholar] [CrossRef]
- Salehzadeh, H.; Nuri, H.; Rafsanjani, A.A.H. Failure mechanism of helical anchors in sand by centrifuge modeling and PIV. Int. J. Geomech. 2022, 22, 04022111. [Google Scholar] [CrossRef]
- Q/GDW 10584–2022; Enterprise Standard of State Grid Corporation of China. Code for Design of Helical Anchor Foundation of Overhead Transmission Line. State Grid. Xin Yuan Company Limited: Beijing, China, 2022.
- Hesham, M.; Abdelghany, Y. Helical screw piles (HSP) capacity for axial cyclic loadings in cohesive soils. In Proceedings of the 4th International Conference on Earthquake Geotechnical Engineering, Thessaloniki, Greece, 25–28 June 2007. [Google Scholar]
- Schiavon, J.A.; Tsuha, C.H.C.; Thorel, L. Centrifuge modelling of a helical anchor under different cyclic loading conditions in sand. Int. J. Phys. Model. Geo. 2018, 19, 72–88. [Google Scholar] [CrossRef]
- Sakai, T.; Tanaka, T. Experimental and numerical study of uplift behavior of shallow circular anchor in two-layered sand. J. Geotech. Geoenviron. Eng. 2007, 133, 469–477. [Google Scholar] [CrossRef]
- Shi, D.; Mao, Y.; Yang, Y.; Yuan, Y.; Hao, D. Experimental study on the deformation characteristics of soils around uplift circular plate anchors using digital image correlation technology. Rock Soil Mech. 2020, 41, 3201–3213. [Google Scholar] [CrossRef]
- Shi, D.; Yu, K.; Mao, Y.; Yang, Y.; Hao, D.; Hu, W. Experimental study on the uplift behavior and soil deformation characteristics of the double-blade screw anchor in loose sand. Rock Soil Mech. 2022, 43, 3059–3072. [Google Scholar] [CrossRef]
- Qiu, G.; Henke, S.; Grabe, J. Application of a Coupled Eulerian—Lagrangian approach on geomechanical problems involving large deformations. Comput. Geotech. 2011, 38, 30–39. [Google Scholar] [CrossRef]
- Chen, R.; Fu, S.; Hao, D.; Shi, D. Scale effects of uplift capacity of circular anchors in dense sand. Chin. J. Geotech. Eng. 2019, 41, 78–85. [Google Scholar] [CrossRef]
- Gong, F. Study on The Pullout Bearing Characteristics of Helical Anchor in Sandy Soil Under Cyclic Loading. Master’s Thesis, Southeast University, Nanjing, China, 2025. [Google Scholar]
- Hao, D.; Yuan, C.; Chen, R.; Zhang, X.; Shi, D.; Kong, G. Numerical analysis of the uplift bearing mechanism of shallow buried circular or spiral anchor plates in sandy soil. Adv. Eng. Sci. 2022, 54, 101–111. [Google Scholar] [CrossRef]
- Fu, S. The Uplift Capacity of Helical Anchors in Sand. Master’s Thesis, Northeast Dianli University, Jilin, China, 2016. [Google Scholar]
- Hao, D.; Wang, D.; O’Loughlin, C.D.; Gaudin, C. Tensile monotonic capacity of helical anchors in sand: Interaction between helices. Can. Geotech. J. 2019, 56, 1534–1543. [Google Scholar] [CrossRef]
- Bolton, M.D. The strength and dilatancy of sands. Géotechnique 1986, 36, 65–78. [Google Scholar] [CrossRef]
- Lv, X.; Zhou, Y.; Li, F. Centrifuge model test and numerical simulation of stability of excavation face of shield tunnel in silty sand. Rock Soil Mech. 2016, 37, 3324–3328. [Google Scholar] [CrossRef]
- Hsu, S.T.; Liao, H.J. Uplift behaviour of cylindrical anchors in sand. Can. Geotech. J. 1998, 34, 70–80. [Google Scholar] [CrossRef]
- Zheng, J.; Hua, J. Geological Engineering Handbook, 5th ed.; China Architecture: Beijing, China, 2018; pp. 151–184. [Google Scholar]
- Puech, A.; Garnier, J. Design of Piles Under Cyclic Loading: Solcyp Recommendations, 1st ed.; ISTE Ltd.: London, UK, 2017; pp. 101–122. [Google Scholar]
- Lu, Z. The Effect of Typhoon on the Long-Term Deformation of Monopile Foundation for Offshore Wind Turbines. Master’s Thesis, Shanghai Jiao Tong University, Shanghai, China, 2020. [Google Scholar]
- Abadie, C. Cyclic Lateral Loading of Monopile Foundations in Cohesionless Soils. Ph.D. Thesis, University of Oxford, Oxford, UK, 2015. [Google Scholar]
- Hu, W.; Lin, Z.; Wang, H.; Zhao, P.; Hao, D.; Gong, J. Method for calculating the uplift capacity of a circular anchor plate at arbitrary depth in sand. Ocean Eng. 2023, 286, 115441. [Google Scholar] [CrossRef]
- Floravante, V. On the shaft friction modeling of non-displacement piles in sand. Soils Found 2002, 42, 23–33. [Google Scholar] [CrossRef] [PubMed]
Disclaimer/Publisher’s Note: The statements, opinions and data contained in all publications are solely those of the individual author(s) and contributor(s) and not of MDPI and/or the editor(s). MDPI and/or the editor(s) disclaim responsibility for any injury to people or property resulting from any ideas, methods, instructions or products referred to in the content. |
© 2025 by the authors. Licensee MDPI, Basel, Switzerland. This article is an open access article distributed under the terms and conditions of the Creative Commons Attribution (CC BY) license (https://creativecommons.org/licenses/by/4.0/).